Article

Full-Field Deformation and Crack Development Evolution of Red Sandstone under Impact and Chemical Erosion

1
State Key Laboratory for Geomechanics & Deep Underground Engineering, China University of Mining & Technology, Xuzhou 221116, China
2
College of Mining Engineering and Geology, Xinjiang Institute of Engineering, Urumqi 830091, China
*
Author to whom correspondence should be addressed.
Minerals 2022, 12(8), 1038; https://doi.org/10.3390/min12081038
Submission received: 28 July 2022 / Revised: 5 August 2022 / Accepted: 16 August 2022 / Published: 18 August 2022
(This article belongs to the Special Issue Failure Characteristics of Deep Rocks)

Abstract

:
Coal mine reuse involves complex environments such as chemical erosion and dynamic perturbation. Therefore, the effect of chemical erosion on the dynamic behavior of the red sandstone was studied by split Hopkinson pressure bar (SHPB) tests under the strain rates of 70~125 s−1. The full-field deformation of the sample was then recorded through high-speed 3D digital image correlation (3D-DIC) technique. The dynamic deformation characteristics, especially the lateral strain, were extracted by averaging the lateral strain field by pixels. Also, the fracture behavior was investigated based on the evolution of strain localization in the strain field. The results indicated that the deformation field evolution of the sample is controlled by the chemical erosion effect and the loading strain rate. The chemical erosion lowers the stress threshold for strain localization and accelerates its expansion rate, which is closely related to the dynamic strength degradation of the sample. In contrast, the loading strain rate increases the dynamic strength but advances the occurrence of strain localization and shortens the time to the peak stress. The normalized stress thresholds for the initiation and development of cracks inside the sample under dynamic loading are reduced by chemical erosion, with the two thresholds dropping to 10%~30% and 20%~70% of the peak stress, respectively. The minimum thresholds for the initiation and development of cracks inside the red sandstone under dynamic loading are 11% and 24% of the peak stress, respectively.

1. Introduction

As part of the global effort to reduce carbon dioxide emissions, out-of-life coal mines, especially deep ones, are valuable resources for potential clean energy storage and carbon sequestration [1,2]. However, the utilization of these mines inevitably involves consideration of complex geological environments as well as various loading effects. For example, an abandoned mine was reconstructed as an underground pumped storage hydropower plant [3]. In this case, the impact loading effects on the dynamic behavior of the surrounding rocks should be evaluated [4]. Meanwhile, the presence of low valence iron or manganese ions significantly lowers the pH of the mine water as a result of aeration [5]. Acid mine water not only erodes the equipment, but also affects the stability of the surrounding rock, which affects the operating efficiency and safety of the whole system. Therefore, research on the dynamic mechanical behavior of rock in complicated environments plays an important role in repurposing out-of-life mines.
Numerous studies have been carried out to reveal the deformation and failure characteristics of rocks in chemical environments, and have yielded many helpful results [6,7,8,9,10]. The most important factors affecting the mechanical properties of rocks are the pH and the duration of immersion in solutions [8]. The chemical composition, ion concentration, and acidity of the solution also have a significant effect on the rock failure [6]. Acidic solutions, in comparison to alkaline solutions, aggravate the degradation of rock microstructure by dissolving minerals [9,11]. Consequently, the dissolution kinetics of rock minerals is also a key factor affecting their damaged properties [12]. However, dynamic loading is more sensitive to microstructural changes in rocks than quasi-static loading [10,13]. For example, the strength loss of rocks subjected to chemical erosion is greater under dynamic loading than under static loading [14]. In addition, chemical erosion reduces the dynamic elastic modulus and fracture toughness of rocks [15]. The differences in dynamic properties are mainly due to the changes in microstructure and mineral elements caused by chemical erosion [16]. These studies are essential for understanding the mechanical properties of rocks under chemical erosion. However, unlike static loading, it is not possible to directly evaluate sample deformation and fracturing evolution under impact loading using the strain gauges, acoustic emissions (AE) or CT methods [17].
In order to understand the dynamic behavior and fracture process of rocks, it is necessary to closely monitor the deformation and evolution of the strain field [18,19]. Meanwhile, the strain localization evolution is crucial for predicting the structural decay of the rock [20]. Recently, with the progress of computer technology, the digital image correlation (DIC) technique has been developed and successfully applied to rock mechanics [21,22,23,24,25,26,27]. The DIC method is done by tracing the regional changes in gray-scale features between two successive images before and after deformation [28]. Some studies have found that the fracture behavior of rocks under static loading is closely related to the strain field development by the DIC method [29]. For example, Li et al. [21] analyzed the deformation and fracture process of marble using the 2D-DIC method, and found that strain localization affects the development of cracks; Tang et al. [30] investigated the effect of confining pressure on the progressive fracture behavior of the rock using the 3D-DIC system, and concluded that strain localization develops rapidly in the post-peak due to the crack propagation. In addition, several studies have used the DIC method to investigate the behavior of rock materials under impact loading. Sharafisafa et al. [31] explored the dynamic fracture patterns of rock-like materials under impact loading using the 3D-DIC method; Xing et al. [20] employed the 3D-DIC technique in impact tests and discovered strain recovery in the post-peak phase. These efforts demonstrated that the DIC method is suitable for studying the deformation and failure of rocks under impact loading. Although the DIC method has been used to analyze rock deformation and fracture processes, little research has focused on impact loading conditions, particularly chemical erosion.
Therefore, in this study, a series of dynamic tests were performed on sandstone samples with chemical erosion. The effects of chemical erosion on deformation characteristics and fracture behavior were also investigated using the high-speed 3D-DIC technique. Finally, the stress thresholds for crack development in the sample under the influence of chemical decay and loading strain rate were studied. This study can be a reference for the use of abandoned mines under complex geological conditions.

2. Material and Methods

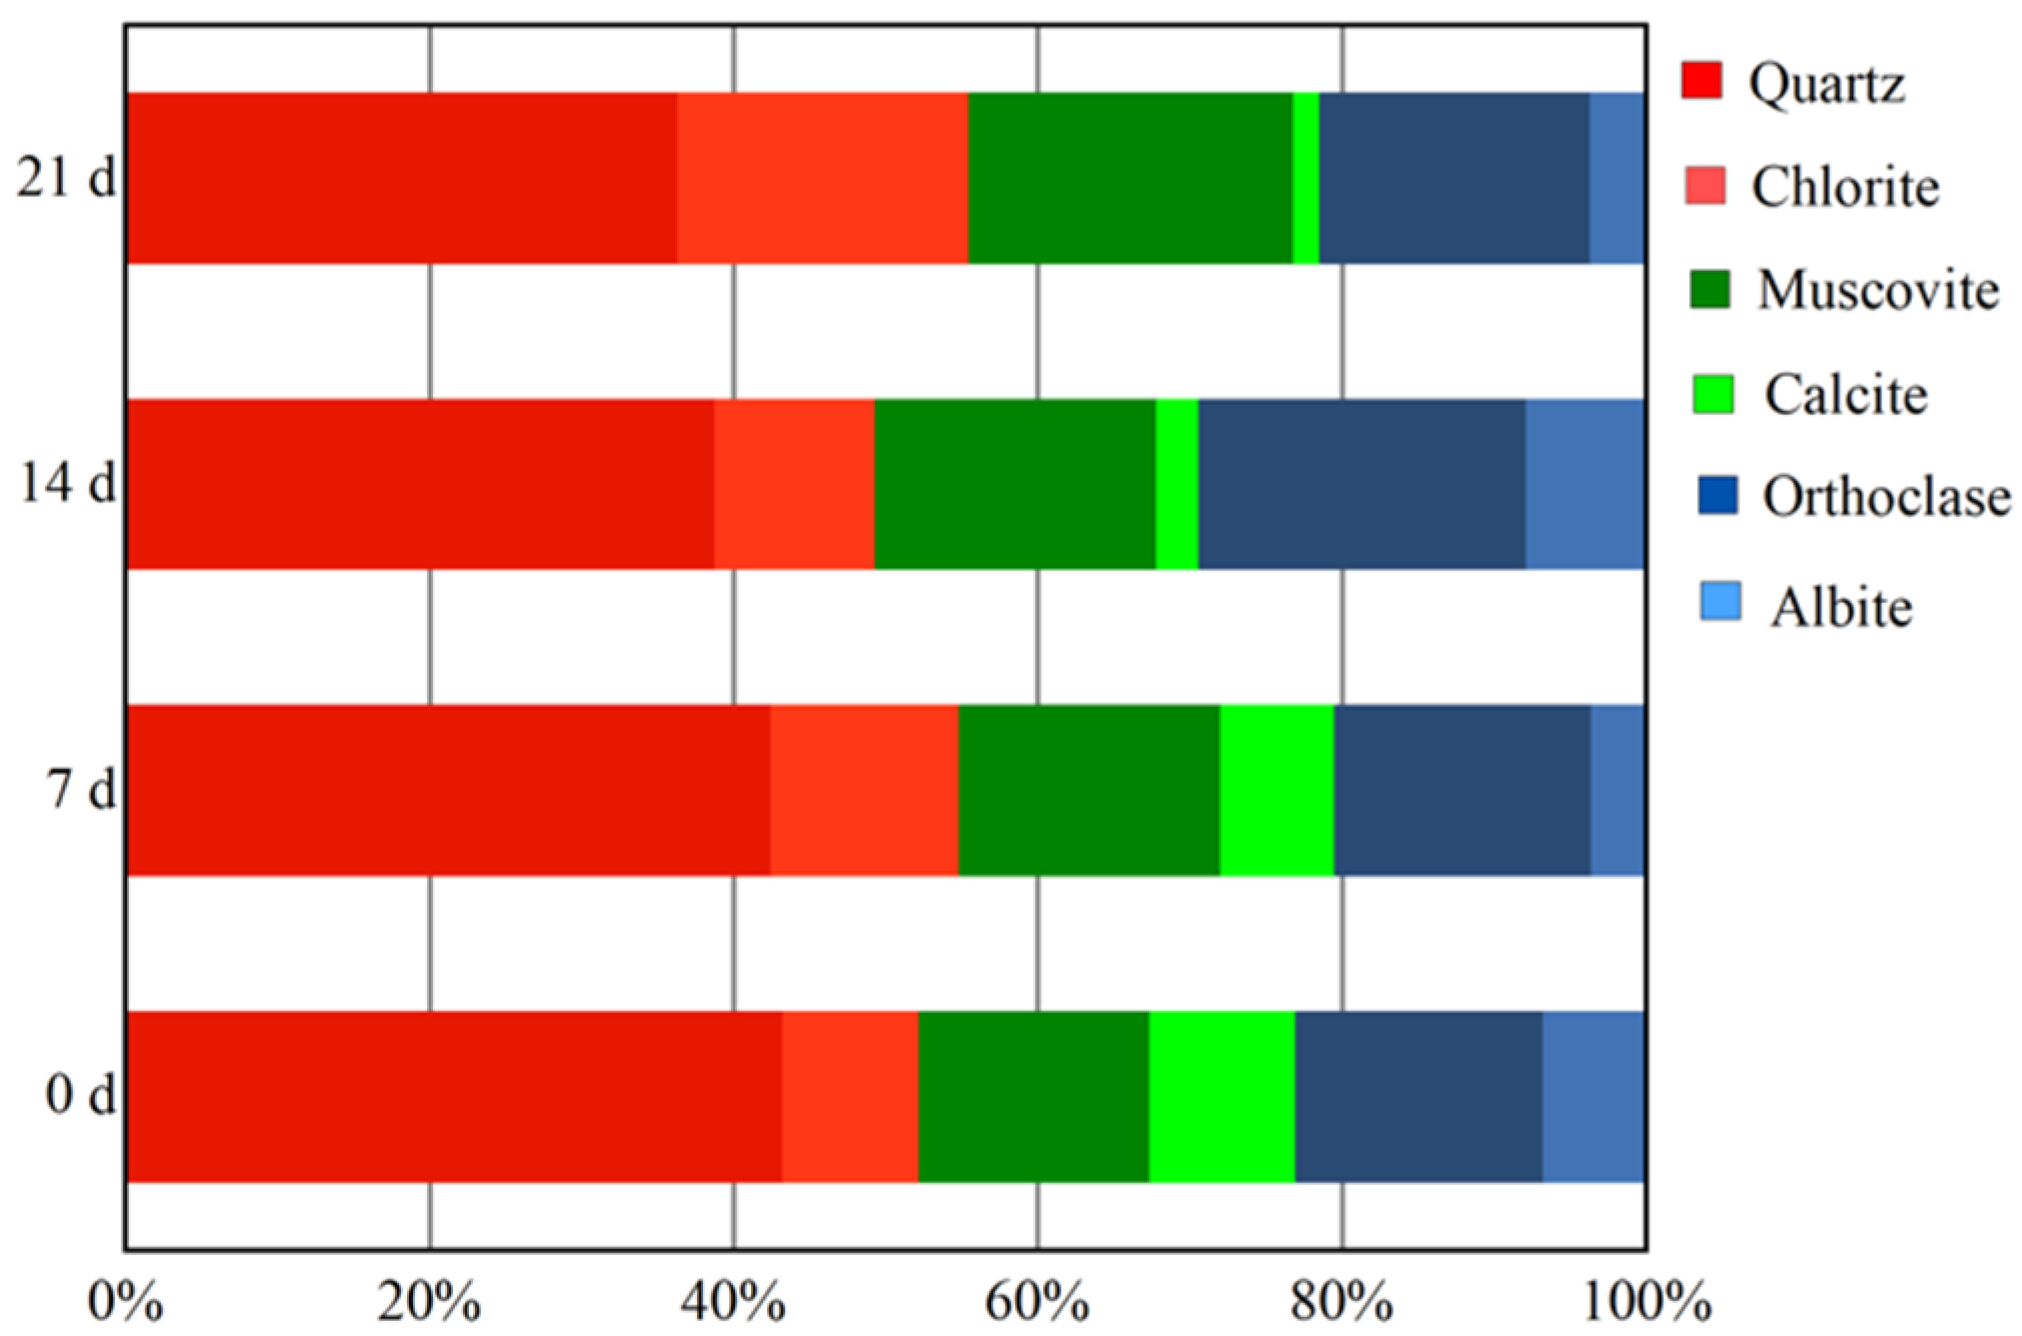
2.1. Materials and Sample Preparation

The red sandstone used in this study was obtained from a coal mine in Shandong, China. According to the ISRM recommendations, the rock blocks were processed into standard samples with a diameter of 50 mm and an aspect ratio of 1. All samples were taken from the same rock block and sampled in the same direction. Then the P-wave velocity of the samples was measured, and those with similar velocities were selected for further testing. Finally, a total of 60 samples were selected and divided into four subgroups, numbered D1 to D4, for impact testing. Five samples with a length and diameter of 50 × 100 mm were selected for physical and mechanical tests, with the results listed in Table 1. In addition, X-ray diffraction (XRD) tests were performed to determine the mineral composition of the sample. The results revealed that the sandstone is mainly composed of quartz, orthoclase, chlorite, and muscovite, with minor amounts of calcite and albite (Figure 1).
In order to simulate the erosion process induced by underground mine water, an acidic solution with a pH of 3 was configured by means of hydrochloric acid, sodium chloride, potassium bisulfate, and pure water [4]. Four groups of the sample were immersed in the solution for 0 (D1), 7 (D2), 14 (D3), and 21 (D4) days, respectively. The chemical solution was changed every 7 days to accelerate the erosion rate. After all samples were immersed, they were dried and then subjected to impact loading. In this test, there were three samples for each loading strain rate and erosion condition, so a total of 60 samples were prepared for the five loading strain rates. As shown in Figure 2, XRD tests were also performed on the soaked samples.

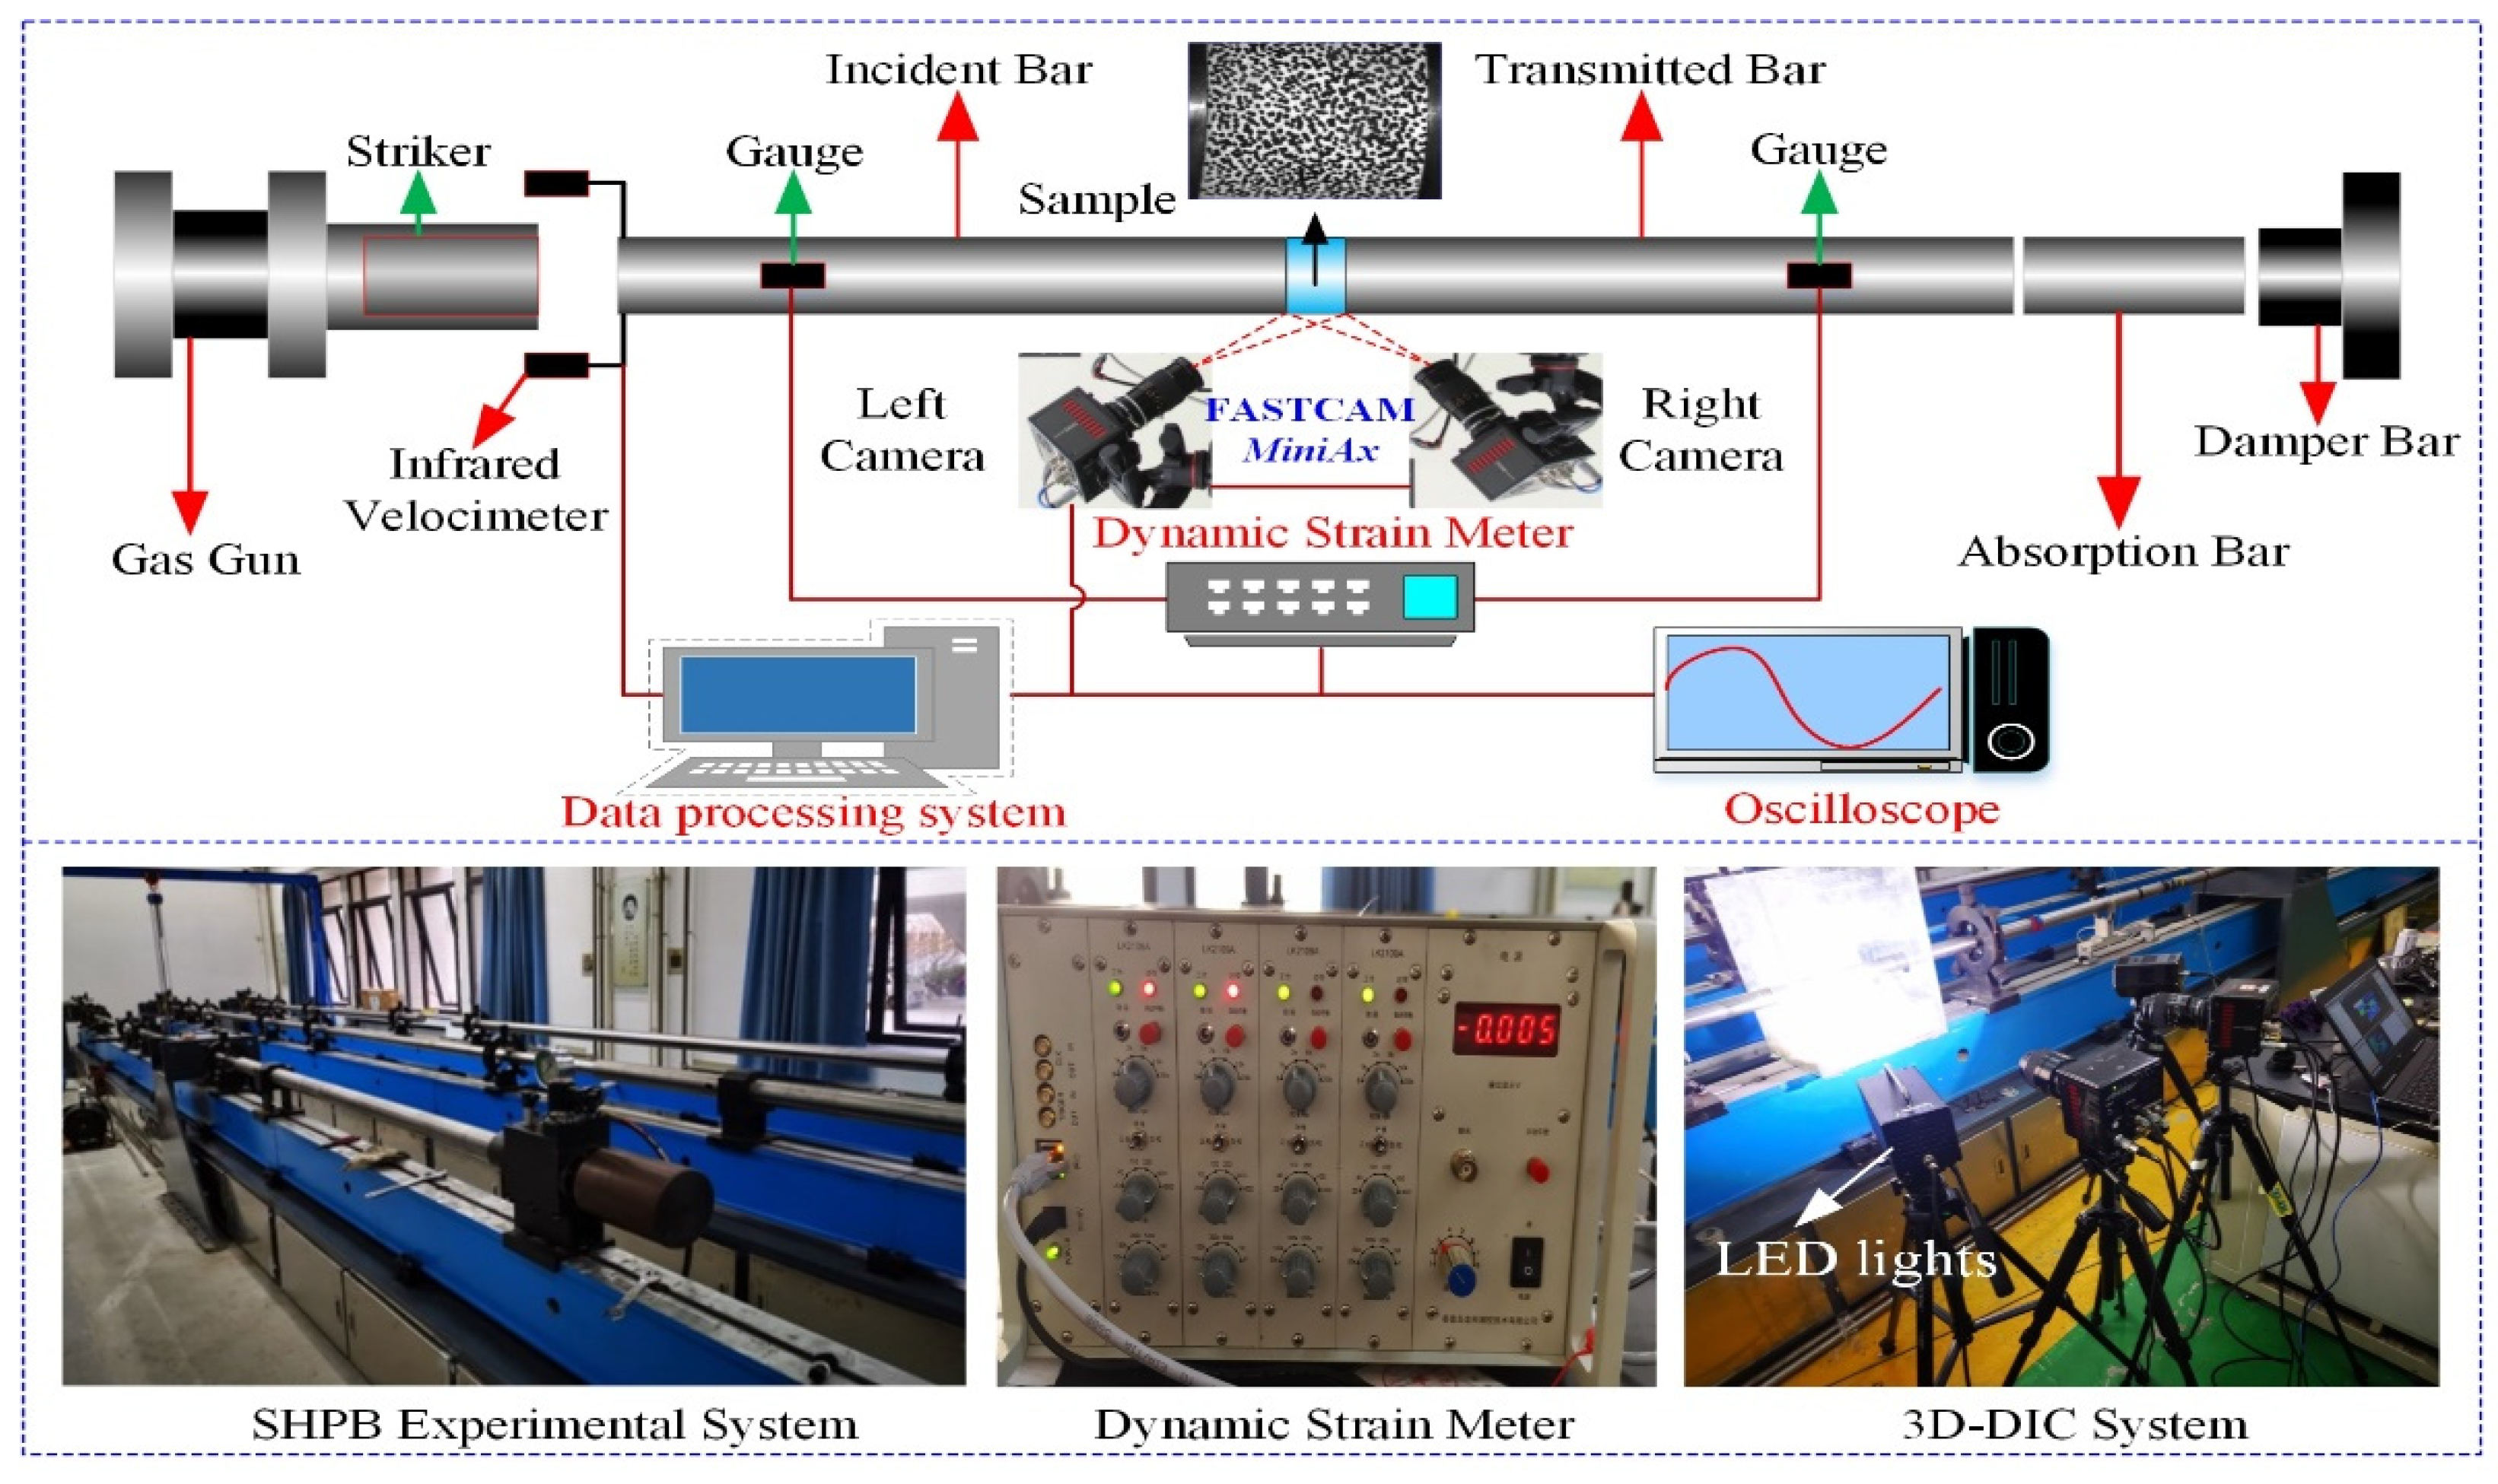
2.2. Experimental System

As shown in Figure 3, the dynamic impact tests were performed using a SHPB system, which consists of a gas gun, a cylindrical striker, an incident bar, a transmitted bar, and an absorption bar. In the experimental system, the bars and the striker are made of high-strength Cr40 alloy steel with diameter, P-wave velocity, yield strength and elastic modulus of 50 mm, 5400 m/s, 800 MPa and 208 GPa, respectively. To reduce the effect of friction between the bar and the sample on the experimental results, molybdenum disulfide was adopted as a lubricant [13]. Also, a round rubber pad with a diameter of 15 mm and a thickness of 2 mm was chosen as the pulse shaper [32]. When the high-pressure gas drives the cylindrical striker against the incident bar, a compressive stress wave is generated. A portion of the compressive wave can propagate through the sample to the transmitted bar. At this time, strain signals are generated in the bar, and can be measured by strain gauges on the incident and transmitted bars. Based on the one-dimensional stress wave propagation theory and the stress equilibrium assumption [33], the three-wave analysis method was used in this work to calculate the load and displacement of the samples. Therefore, the dynamic loads P(t), strain rate ε ˙ ( t ) and strain ε ( t ) were calculated by Equations (1)–(3) [32].
P 1 ( t )   = A r E 0 ε I ( t ) + ε R ( t ) ,   P 2 ( t )   = A r E 0 ε T ( t )
ε ˙ ( t ) = C 0 L [ ε I ( t ) ε R ( t ) ε T ( t ) ]
ε ( t ) = 0 t ε ˙ ( t ) d t = 2 C s L 0 t ε R ( t ) d t
where Ar is the ratio of the cross-sectional area of the bar to the sample; E0, Cs, and L are the elastic modulus of the bar, the P-wave velocity, and the length of the sample, respectively; ε I ( t ) , ε R ( t ) , and ε T ( t ) refer to the incident, reflected, and transmitted strain, respectively. In addition, the striker impact velocity was tested by a laser measurement system.
In addition, a 3D-DIC system was employed to capture the dynamic fracture process, full-field displacement, and strain evolution of the sample. The 3D-DIC system mainly consists of two high-speed complementary metal-oxide semiconductors (CMOS) cameras, two light-emitting diodes (LED), a set of camera tripods, and a computer for images acquisition. As presented in Figure 3, two 75 W LEDs provided about 15,000 lumens of illumination to improve image quality. Two high-speed CMOS cameras (FastCam AX200 developed by Photron Corporation, Tokyo, Japan) were selected in this work. The resolution was set to 256 × 256 pixels with a frame rate of 100,000 fps.
Before testing, the surface of the sample was first sprayed with matte white paint as the base color. Then, random spots were created with matte black paint, which finally formed a typical scatter pattern, as shown in Figure 3. The quality of the scatter pattern is an important carrier of deformation information on the sample surface and has a significant effect on the accuracy and reliability of the measurement results [28]. In general, a good scatter pattern should have the characteristics of randomness, isotropy, and high contrast, i.e., the pattern should have no directional deviation, and show only black and white. During the test, the camera window covers 60 × 60 mm2, and the region of interest in the target view is about 48 × 34 mm2. So, the pixel size is 0.234 mm corresponding to the physical size of the sample. The accuracy of 3D-DIC is controlled to 5% of the pixel [20], which is about 11.7 µm, corresponding to 0.0234% of the engineering strain, thus meeting the accuracy requirements. In addition, the influence of rock fragments and human factors on the camera position during the experiment should be considered.

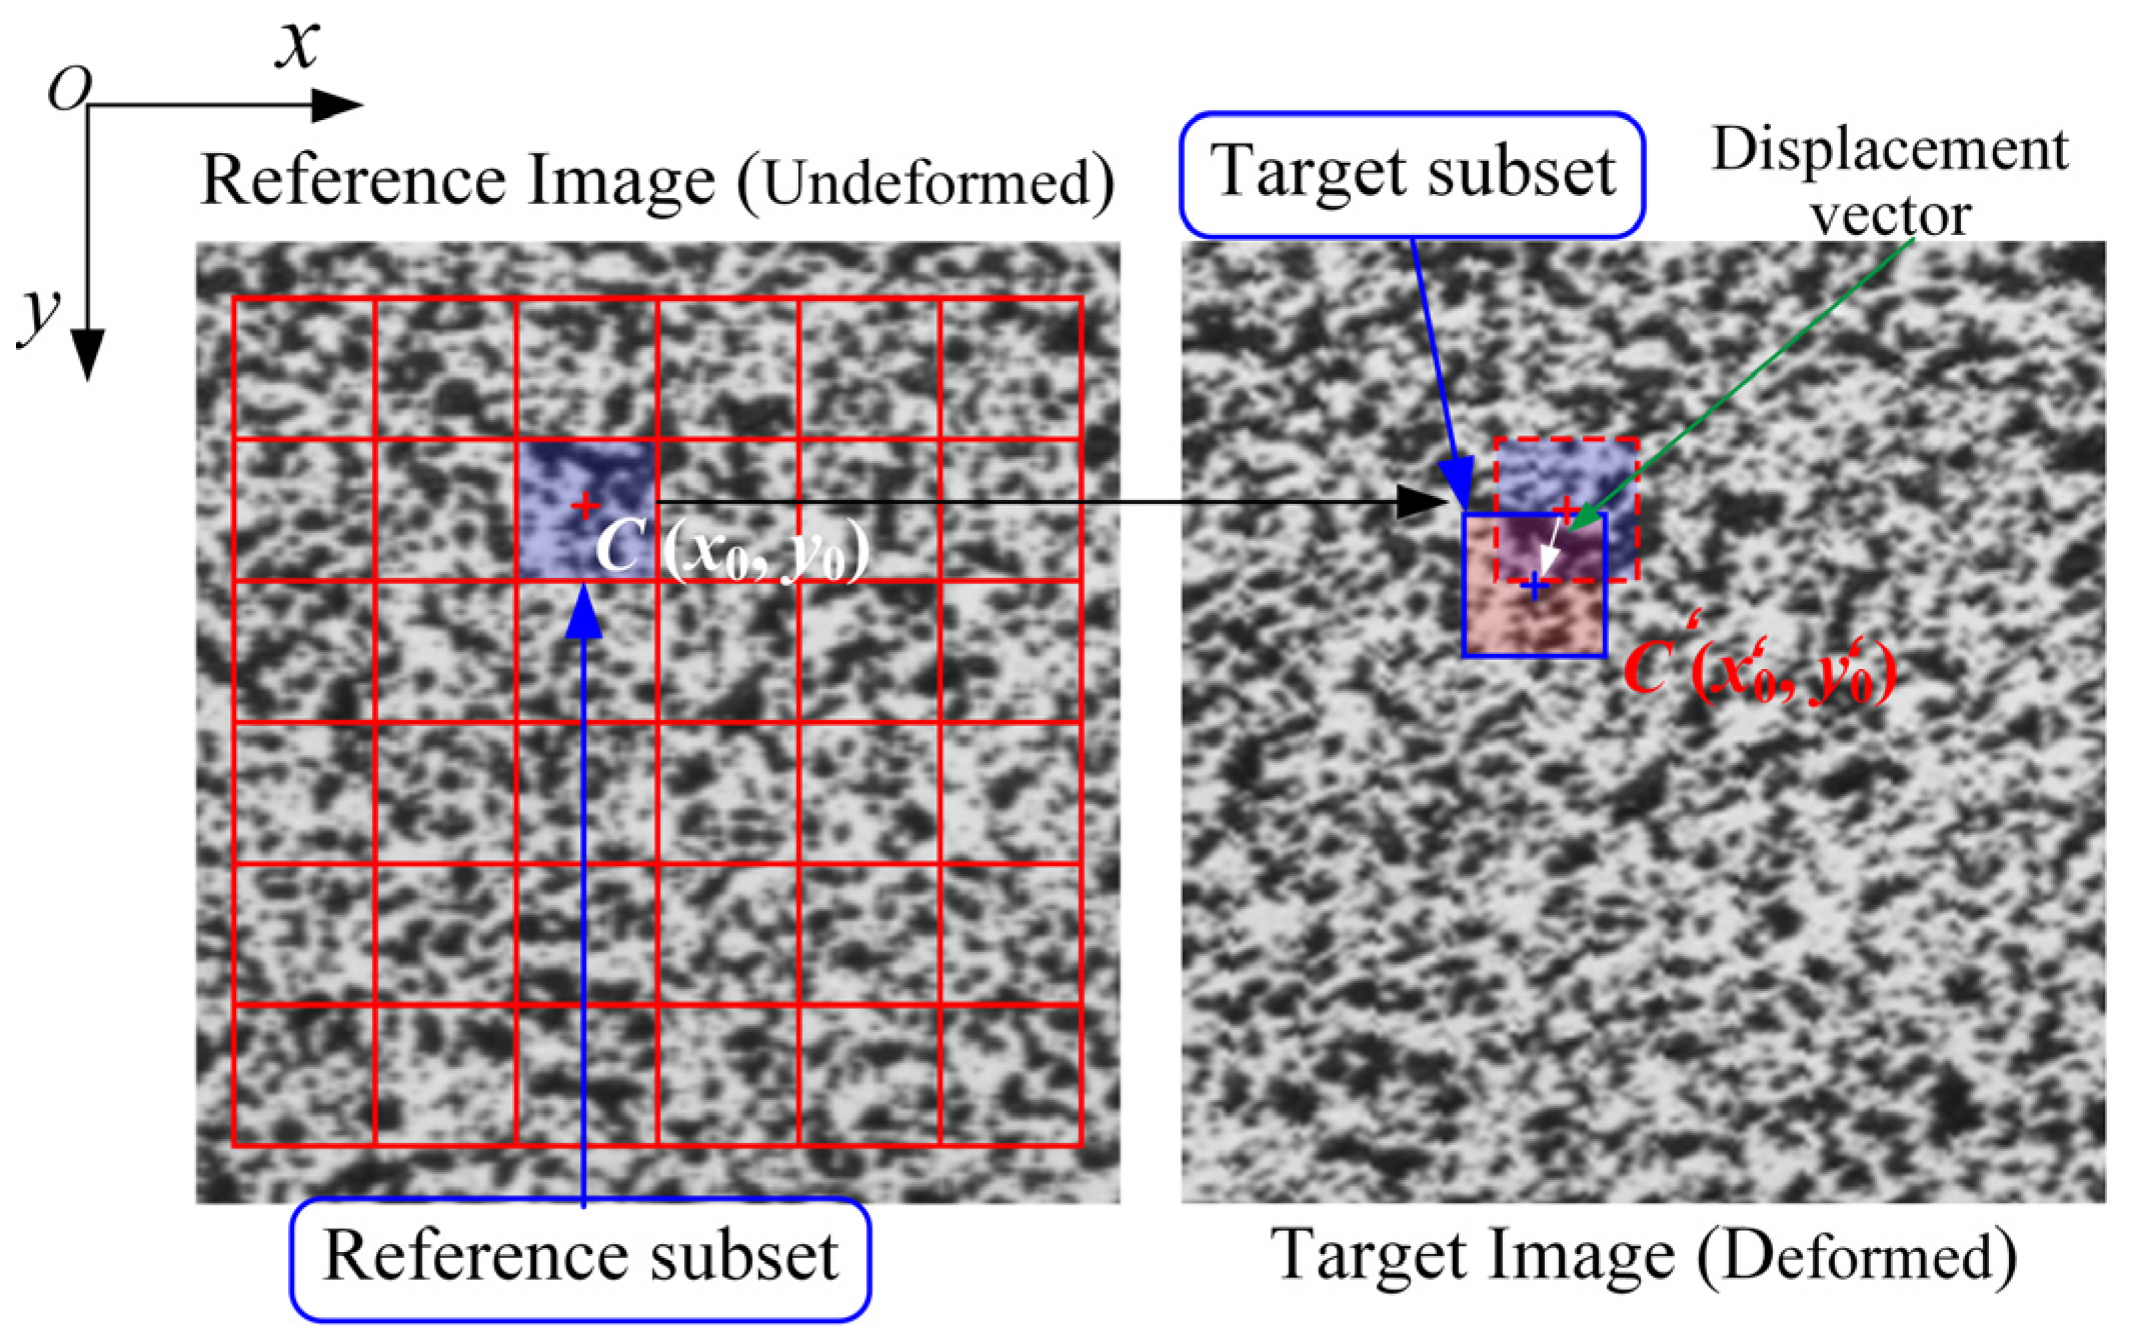
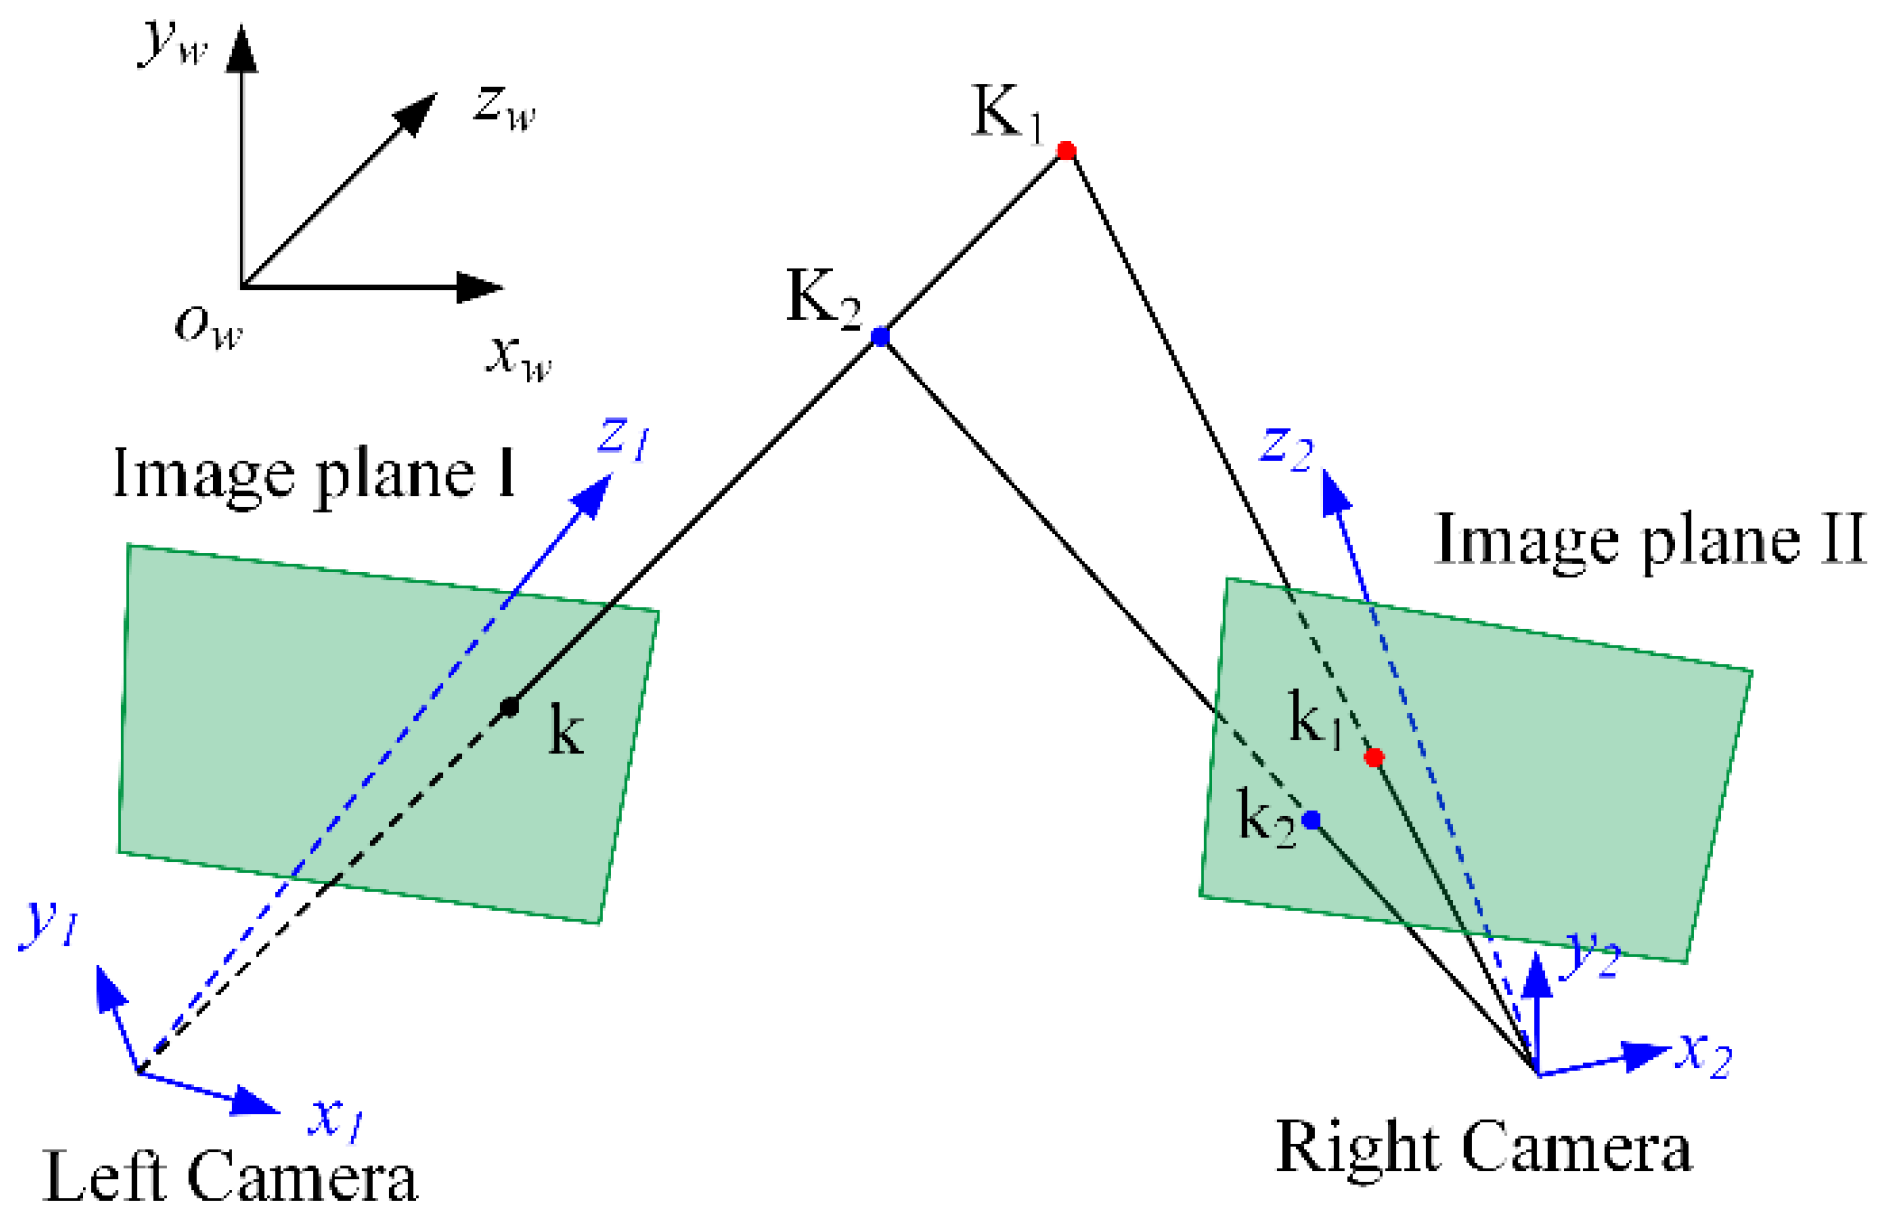
2.3. 3D-DIC Basic Principles

The DIC method can be divided into 2D-DIC and 3D-DIC. 2D-DIC measurement has some errors due to the influence of out-of-plane deformations [28]. At the same time, 2D-DIC is not suitable for curved surfaces. For instance, the measurement error for the deformation of a cylindrical sample is about 21% [20]. Therefore, the 3D-DIC method was developed to overcome the limitations of the 2D-DIC method. The 3D-DIC method uses binocular stereo vision technology to determine the actual 3D position of each point on the object by capturing the images from different angles with two cameras simultaneously [34]. As illustrated in Figure 4, two 3D spatial points K1 and K2 are projected as a single image point k on the plane I in the same projection ray (single camera), indicating an infinite number of 3D points corresponding to point k on the camera. Conversely, both planes can determine the unique point K1 in space from the projection points (k, k1). Similarly, the projection point (k, k2) corresponds to the unique point K2 in space. If the camera is calibrated, the exact spatial coordinates of the target points K1 and K2 can be obtained by triangulation.
Another important component of the 3D-DIC method is digital image correlation [23]. High-speed cameras take a series of photographs during the testing, with the undeformed image as the reference image and the distorted image as the target image. As shown in Figure 5, the images are divided into small subsets of windows, also called regions of interest (ROI). In the reference image, a subset of (2m + 1) × (2m + 1) pixels with center C was selected. Then a subset with the maximum similarity to this reference subset was found in the target image. To evaluate the intensity similarity between the reference subset and the target subset, the zero-mean normalized sum-of-squares difference (ZNSD) criterion was usually used to search and determine the position of the corresponding target subset [28]. As a result, the centers C and C0 can be considered the corresponding points. Once the displacement vector of the centers (white arrow) was determined, the pixel points in the deformation subset can be obtained from the reference subset of pixel points by first- or second-order shape functions.
In addition to the temporal alignment described above, the stereo alignment of the images, i.e., the calibration of the coordinates and transformation matrices of the two cameras in space, is an important part of the 3D-DIC alignment process. For this purpose, the stereo alignment of the images can be performed using either the polar linear constraint method or the iterative least squares method [34], which provides a 3D marker of the object surface at each stage.

3. Experimental Results and Analysis

In this work, the dynamic changes in the deformation and strain fields of the sample were evaluated using two high-speed CMOS cameras and 3D-DIC software. In addition, the dynamic fracture process of the sandstone samples was investigated.

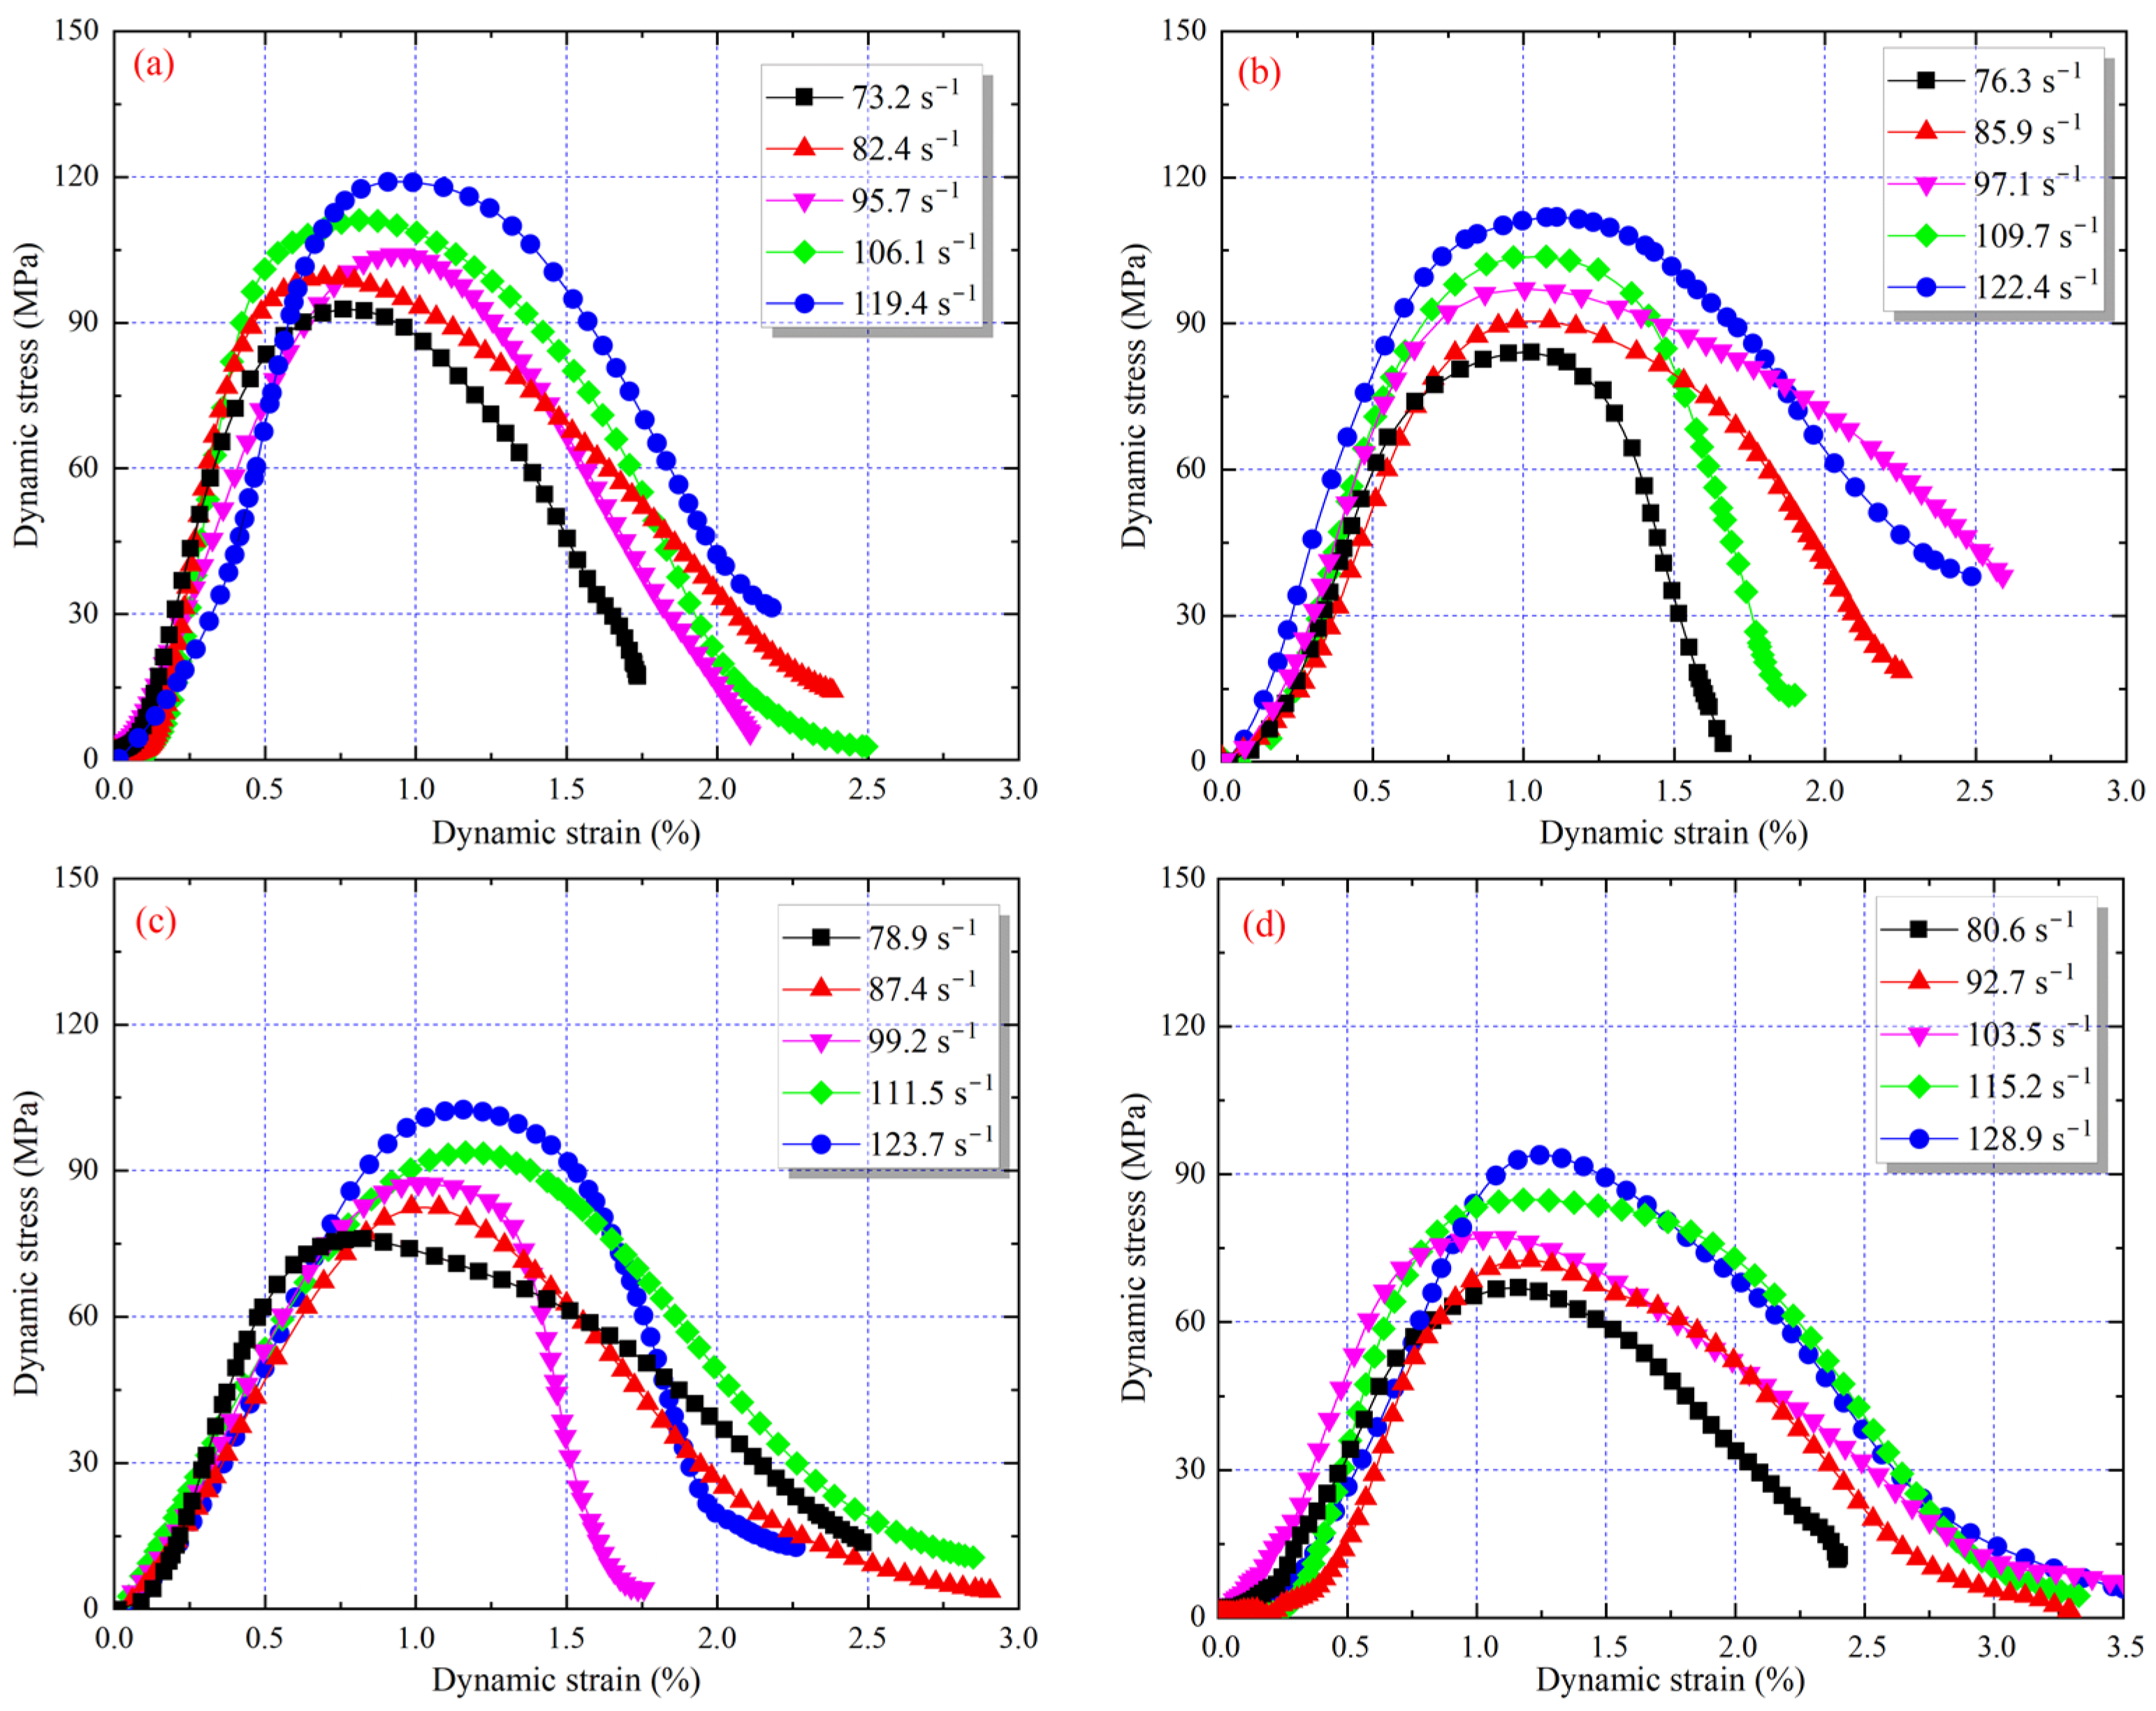
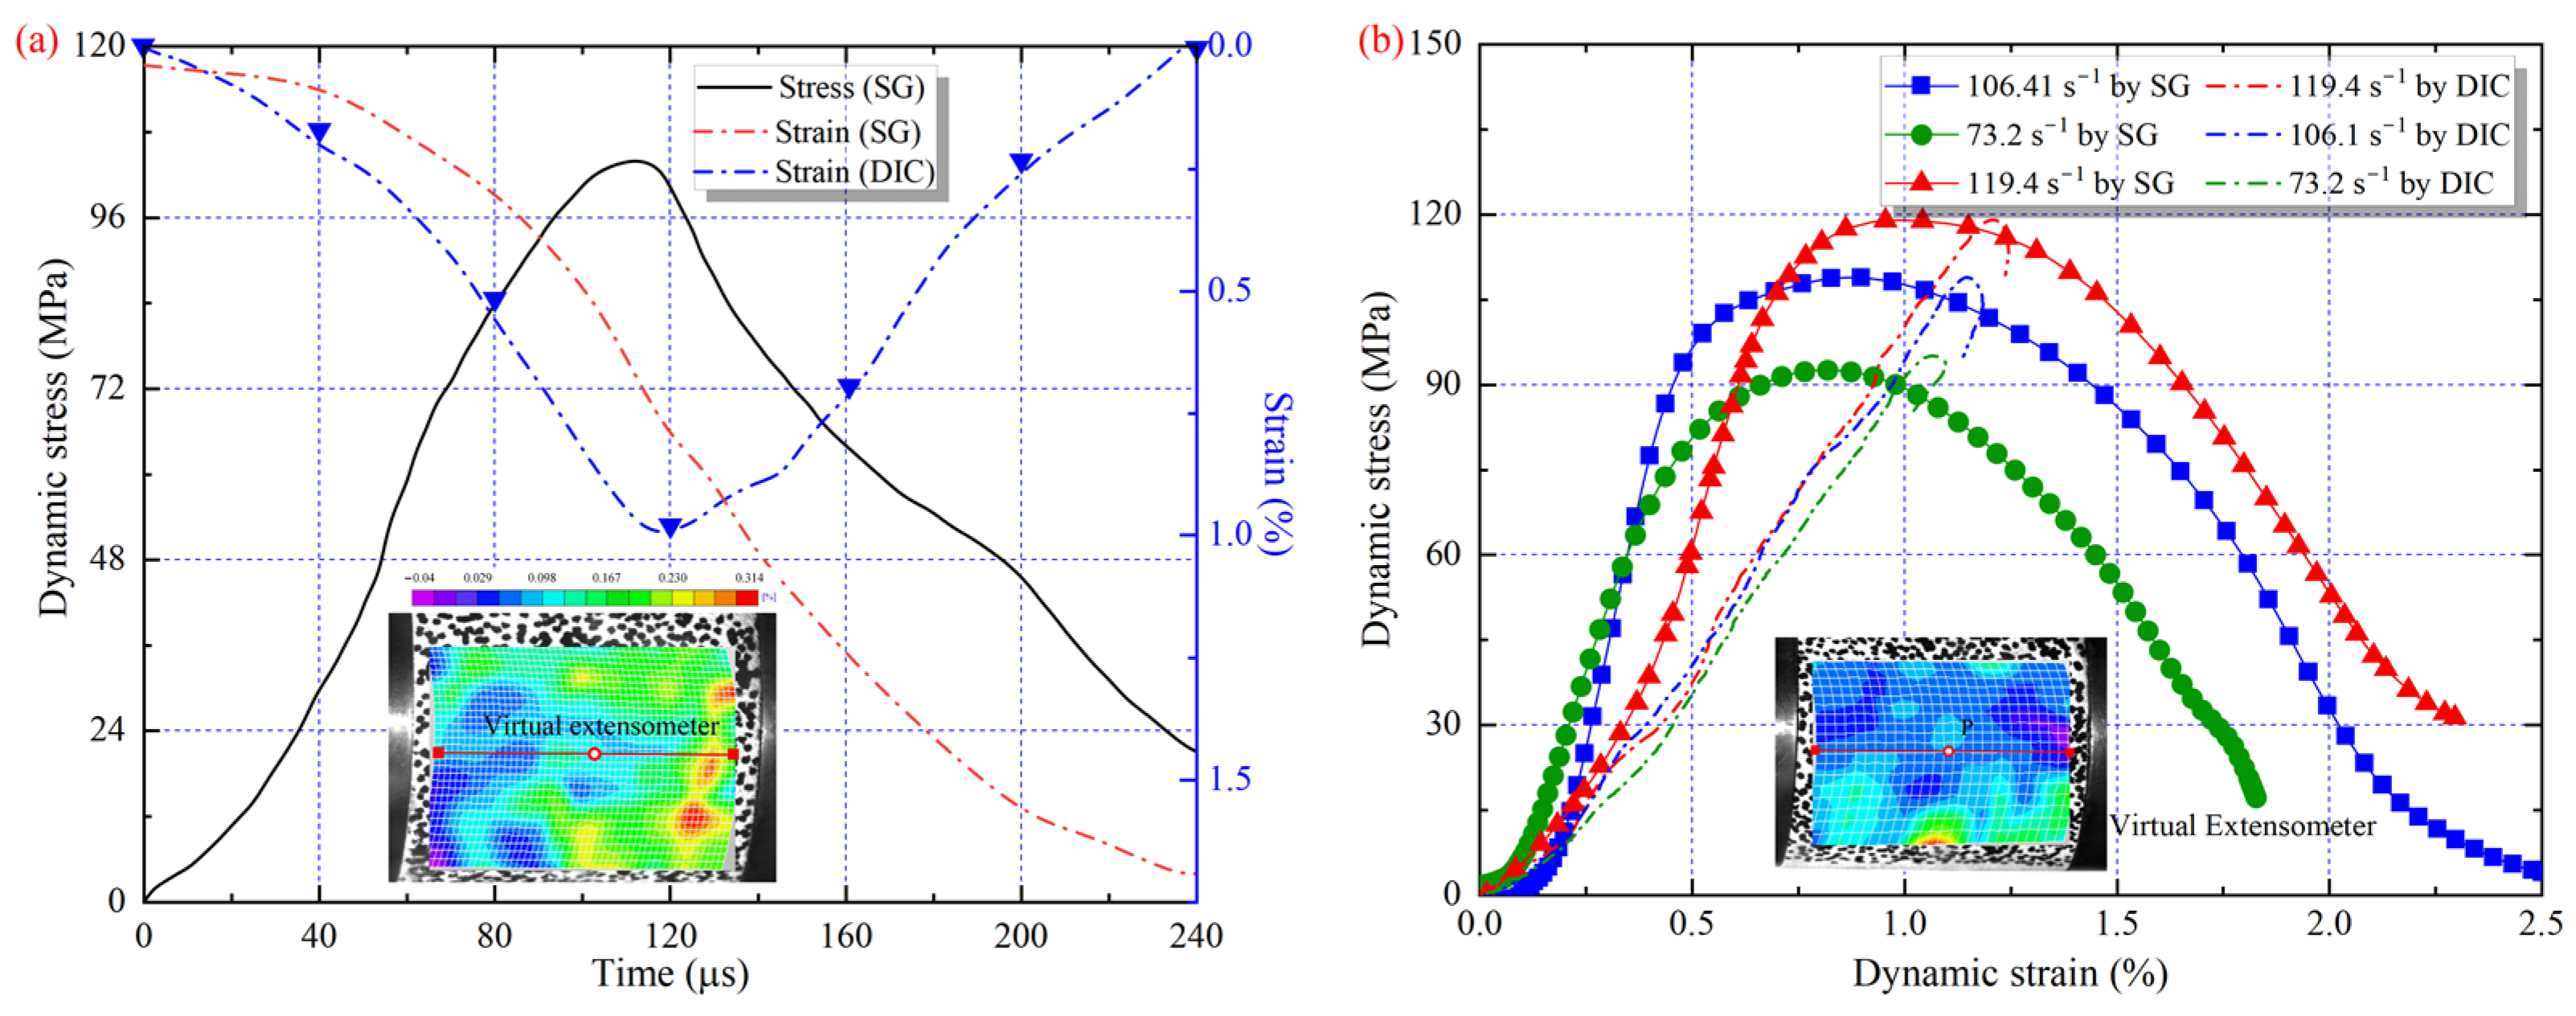
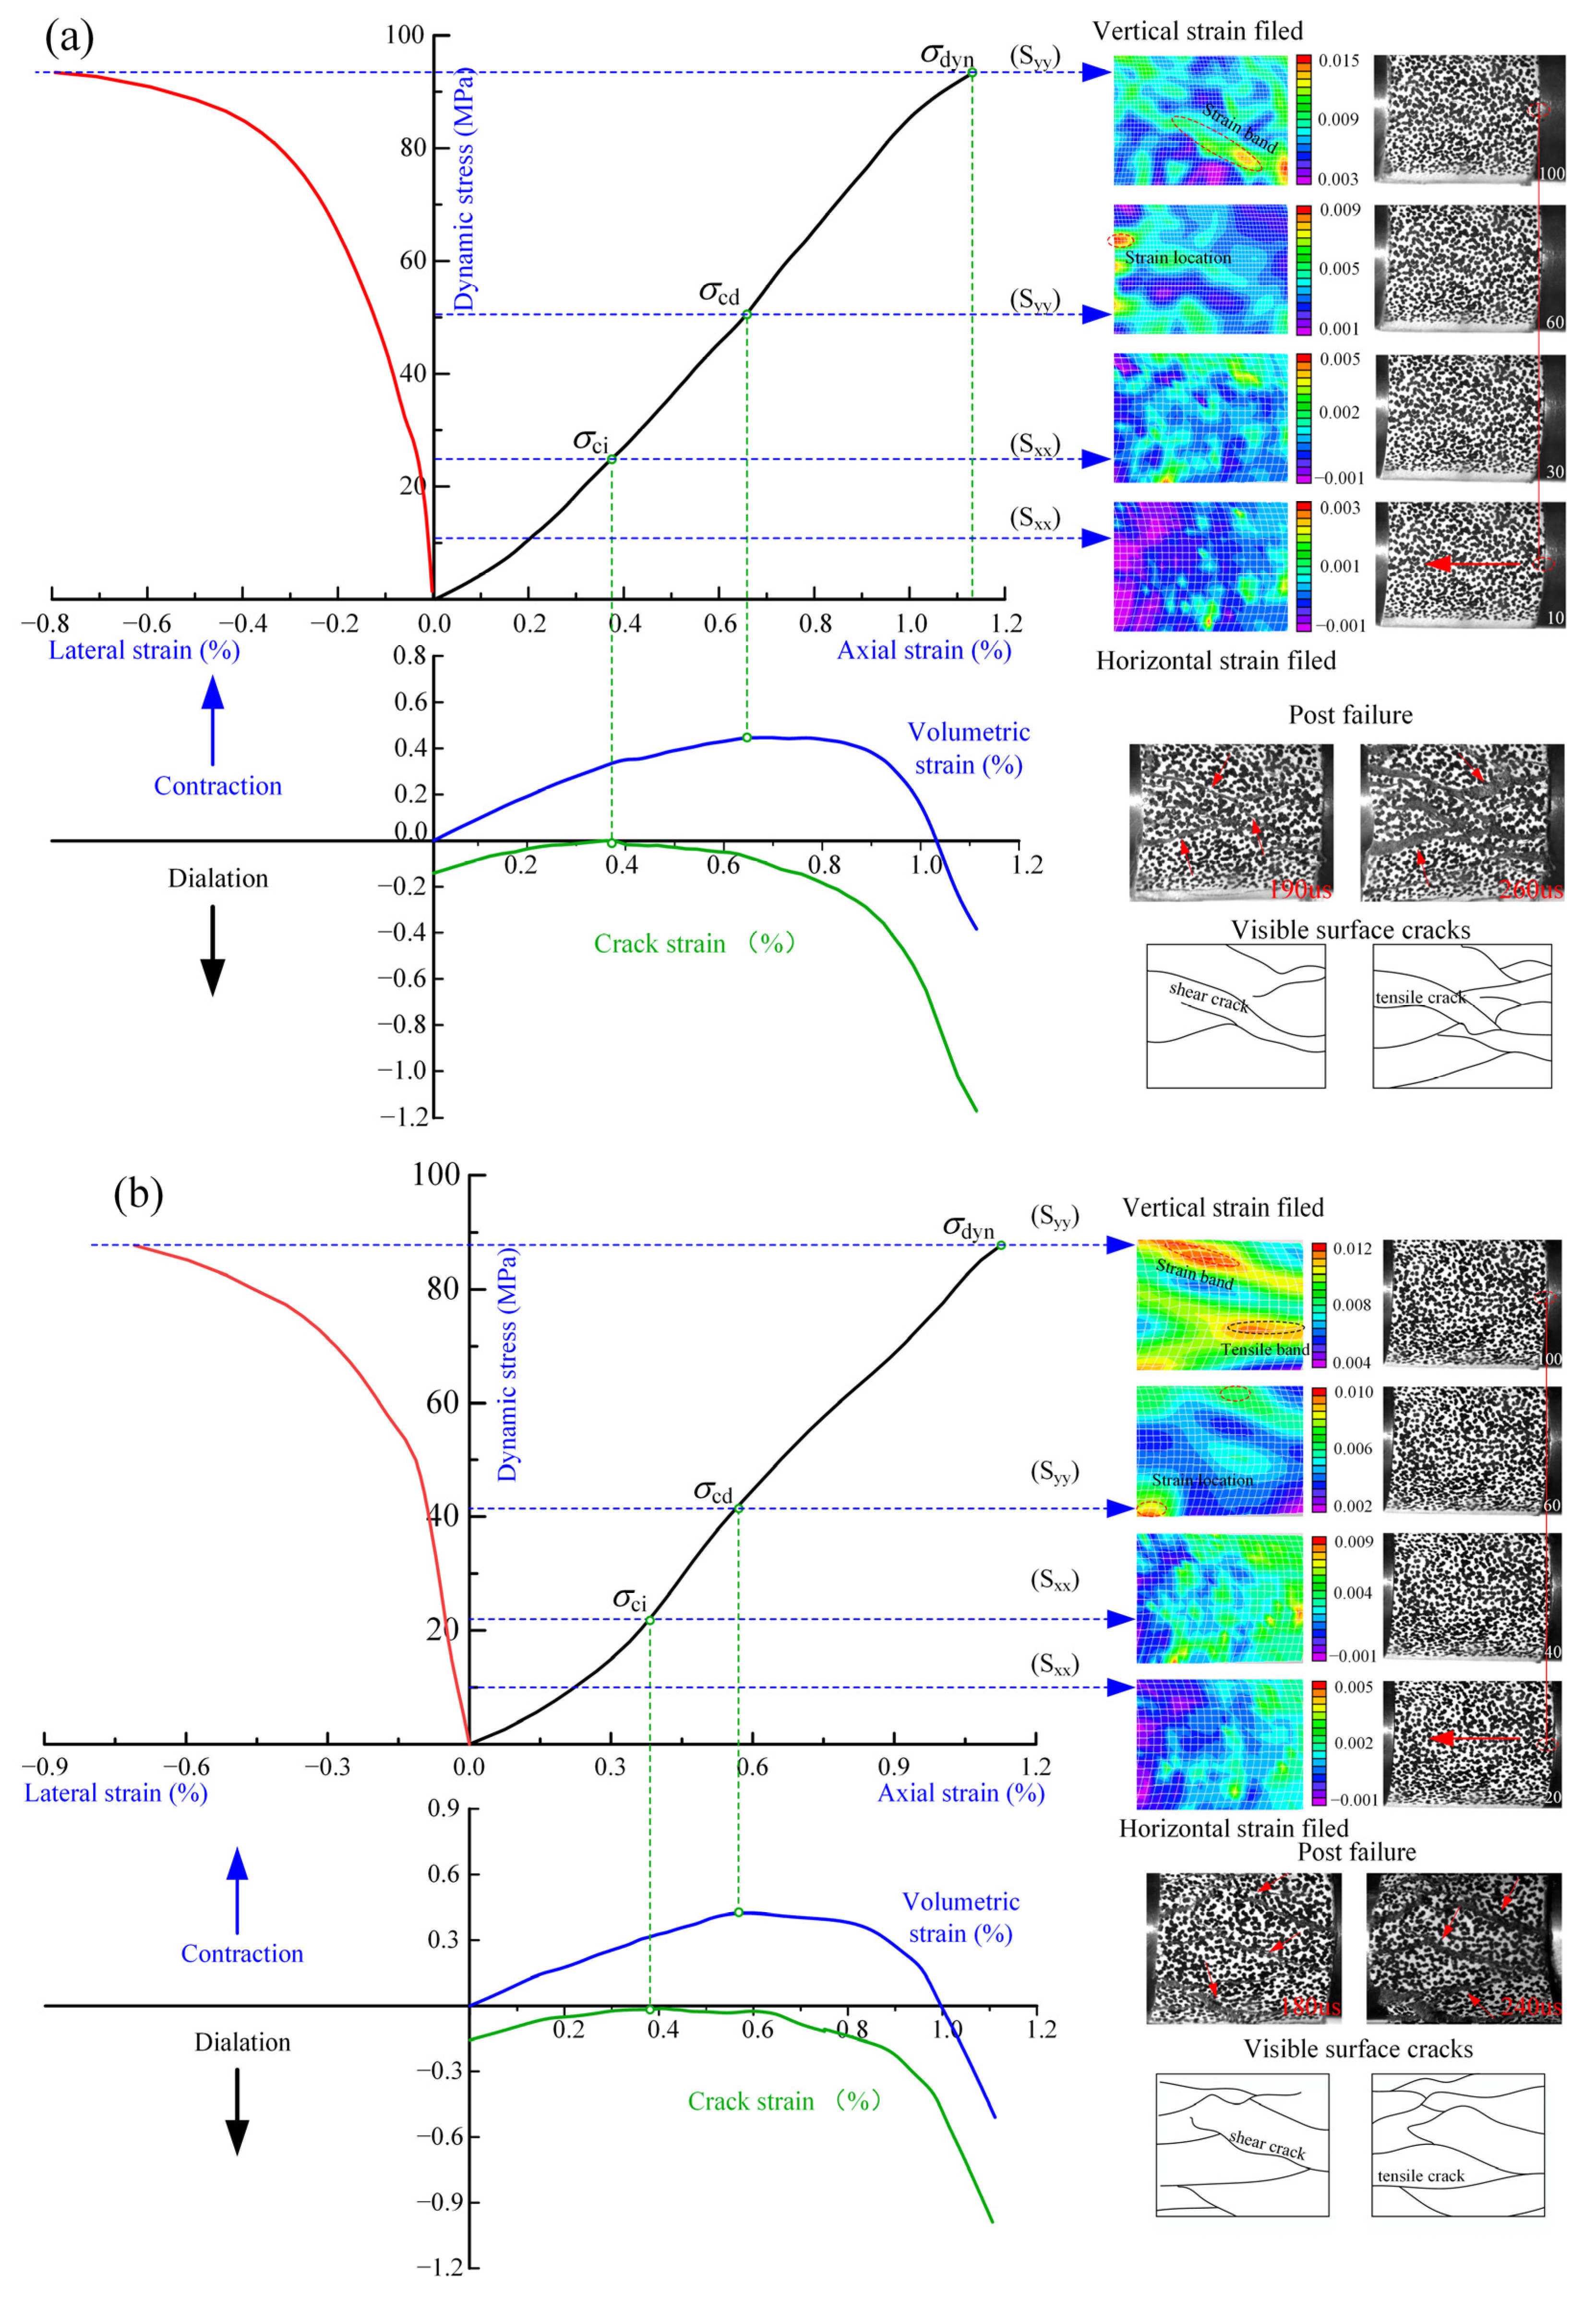
3.1. Dynamic Stress-Strain Behavior

The stress-strain curves calculated using Equations (1)–(3) are presented in Figure 6. It can be seen that the dynamic strength decreases with increasing erosion time, while gradually increases with the strain rate. At a loading strain rate of about 120 s−1, the dynamic strength of the sample decreased by 21.2% from 119.1 to 93.9 MPa with increasing immersion time from 0 to 21 days. However, when the loading strain rate was increased from 75 to 125 s−1, the dynamic strength of the sample (14 d) increased from 75.9 to 102.5 MPa, which is about 35%. The reaction of the H ions in the solution with the minerals of the sample leads to structural degeneration, resulting in a loss of dynamic strength. As erosion increases, the stress-strain curves also exhibited a typical early compression phase. This effect was caused by dissolved minerals such as calcite in acidic liquids (Figure 2). It is worth noting that the stress-strain curves were calculated from the strain gauge signals and do not reveal the dynamic damage process of the samples. Therefore, to study the dynamic damage process of the sample, it is necessary to obtain the evolution characteristics of the strain and displacement fields during the dynamic loading.

3.2. Displacement and Strain Field Characteristics

The variations of the stress-strain curves are the external reflection of the erosion damage. The stress-strain curves obtained from Equations (1)–(3), however, cannot reflect the actual deformation process of the sample. Therefore, the deformation process of the sample was recorded by the high-speed 3D-DIC method, where ROI corresponds to a resolution of 145 × 209 pixels. Figure 7 shows the strain field of the 3D-DIC compared with the images from the CMOS cameras. It can be seen that the strain characteristics during loading are closely related to the crack development on the surface of the sample. Consequently, the 3D-DIC approach is able to collect credible data on the surface deformation of the sample during dynamic loading.

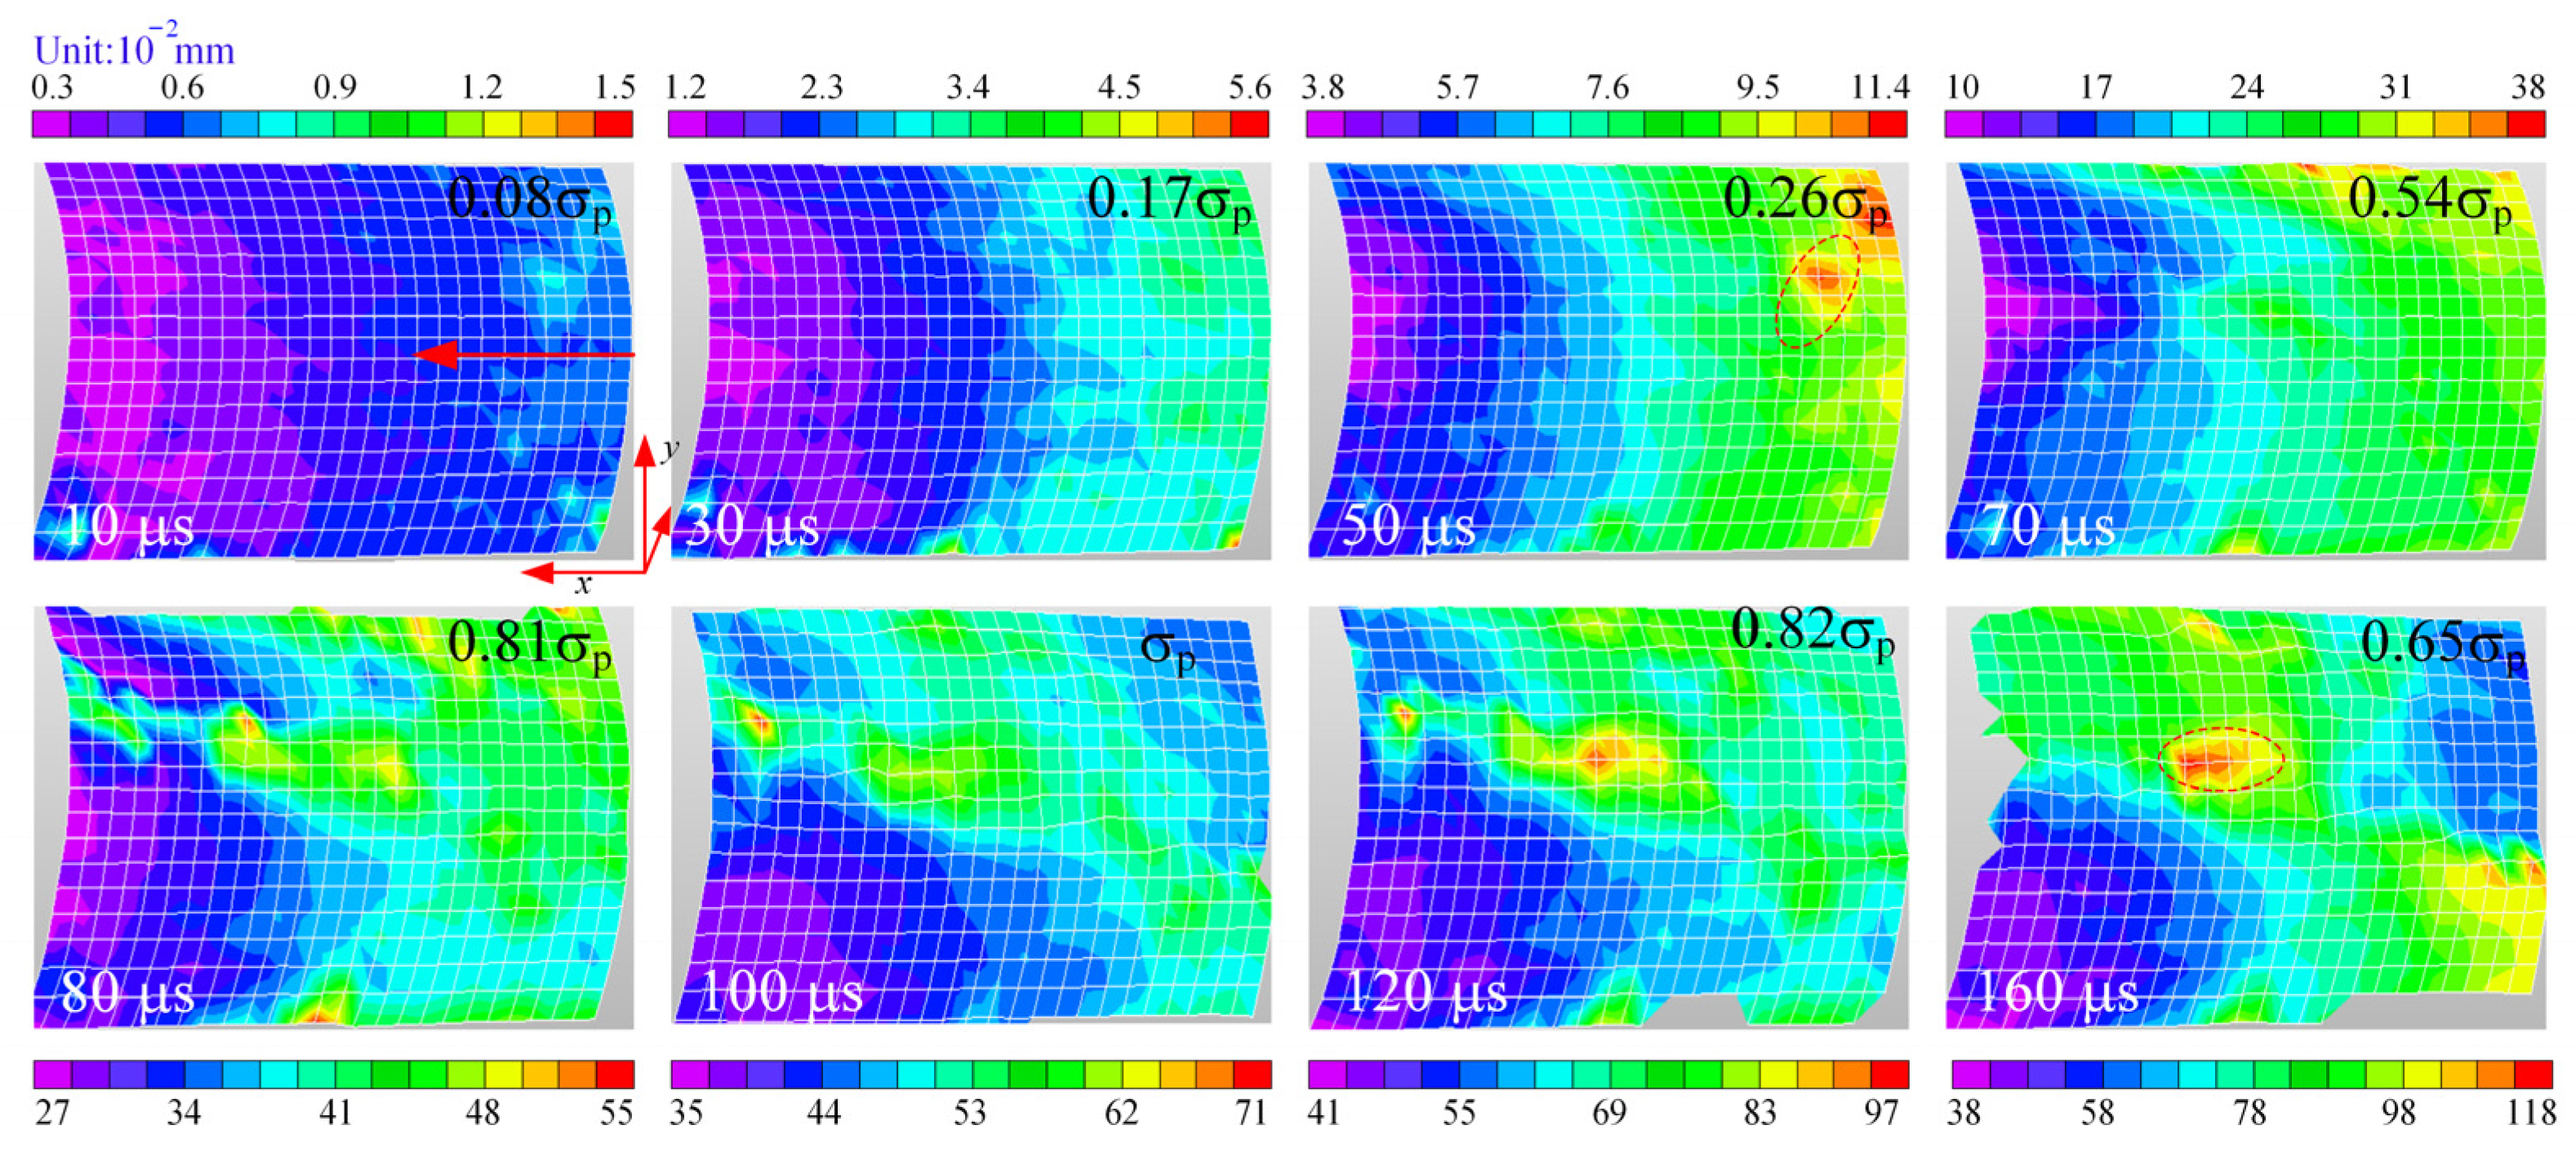
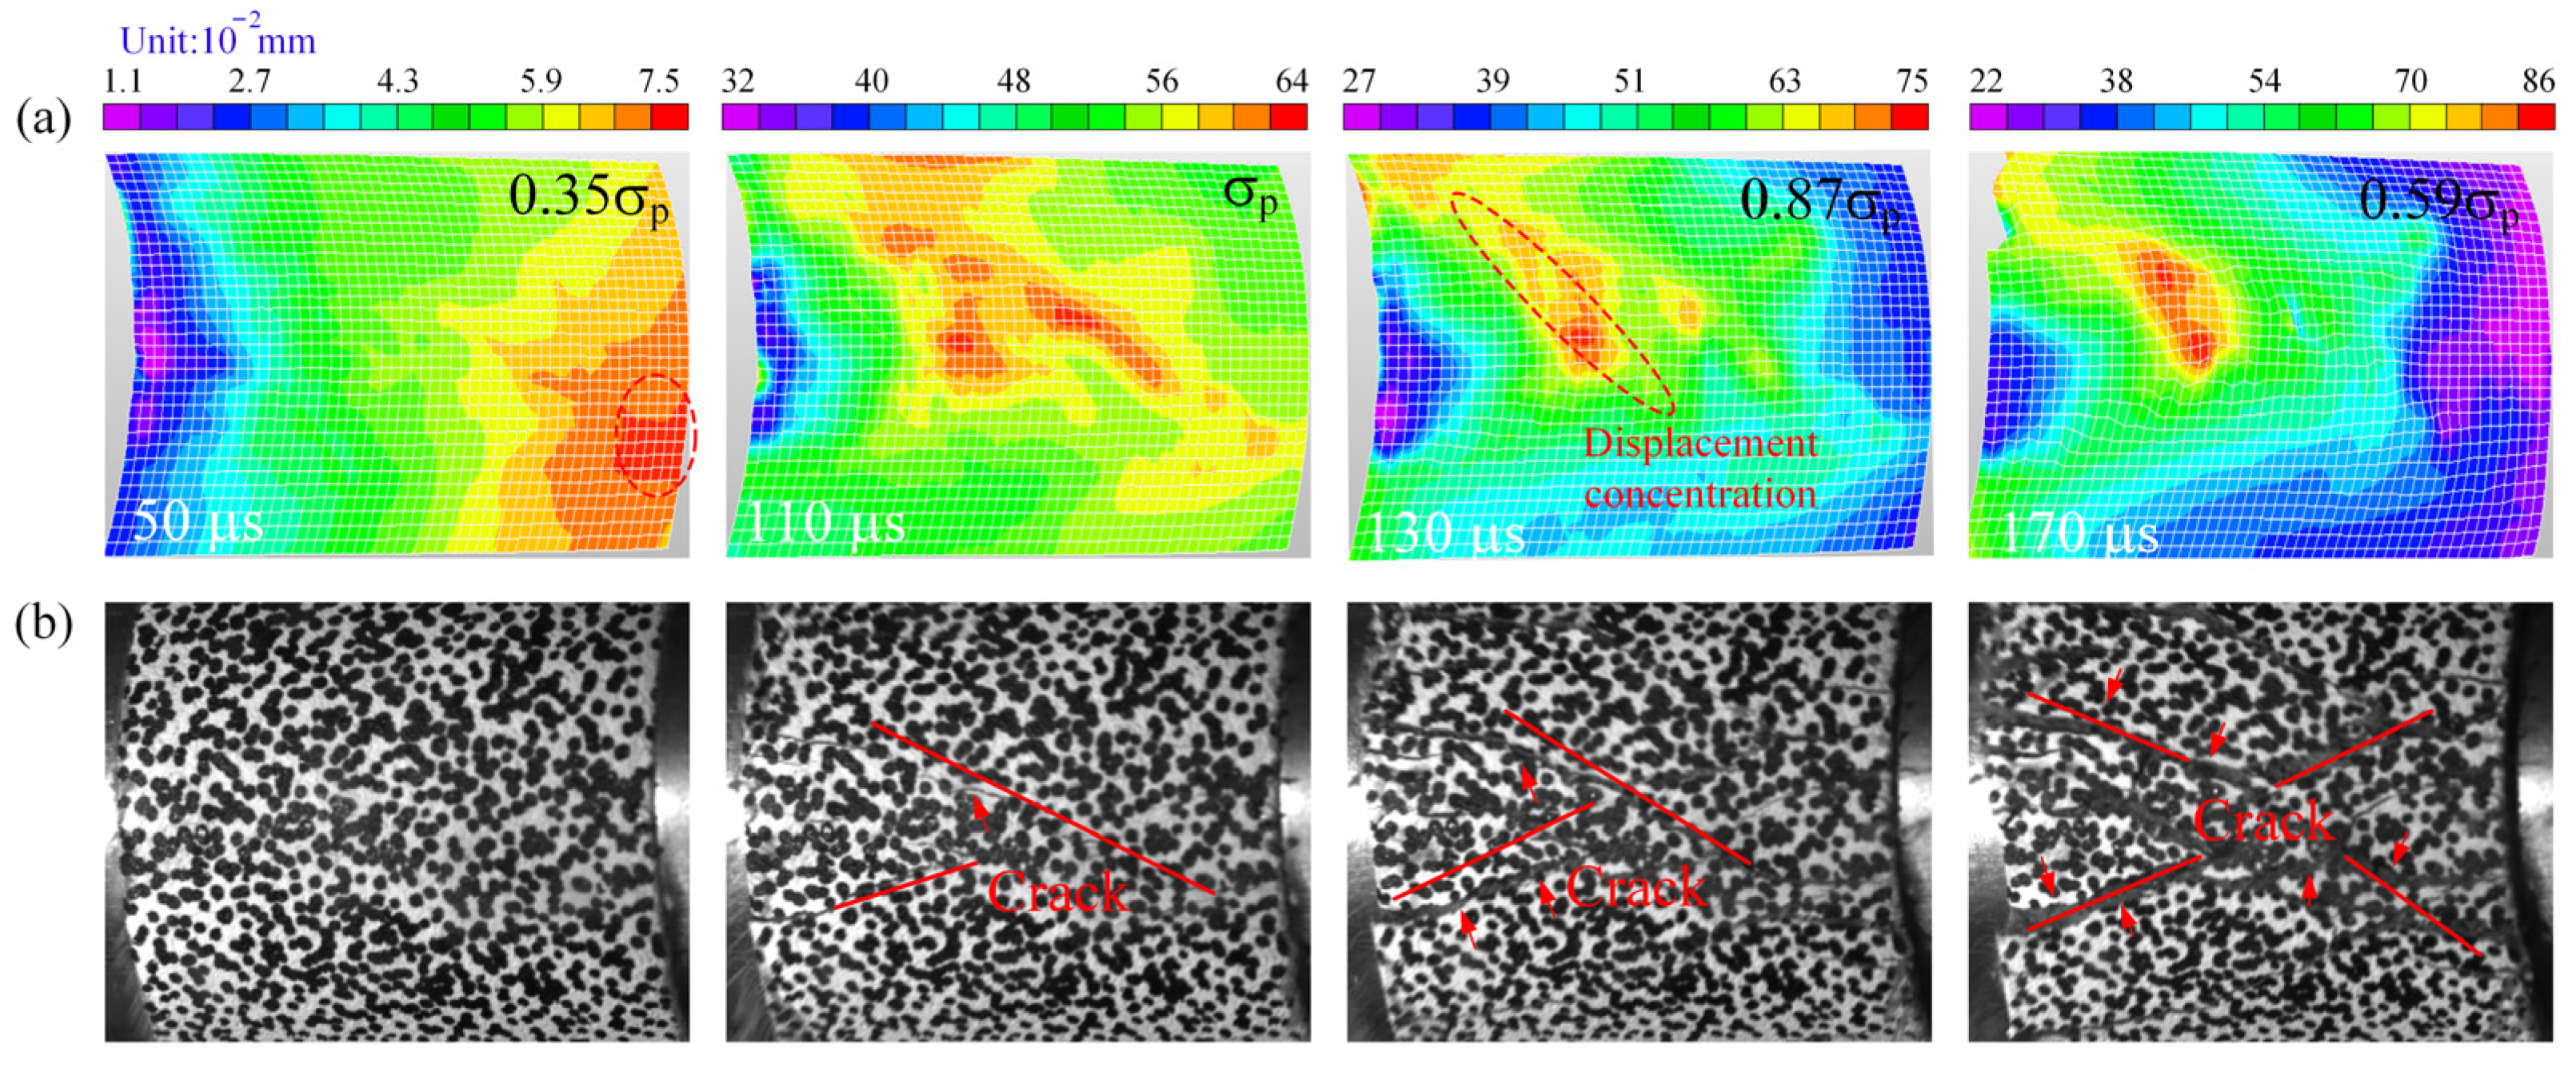
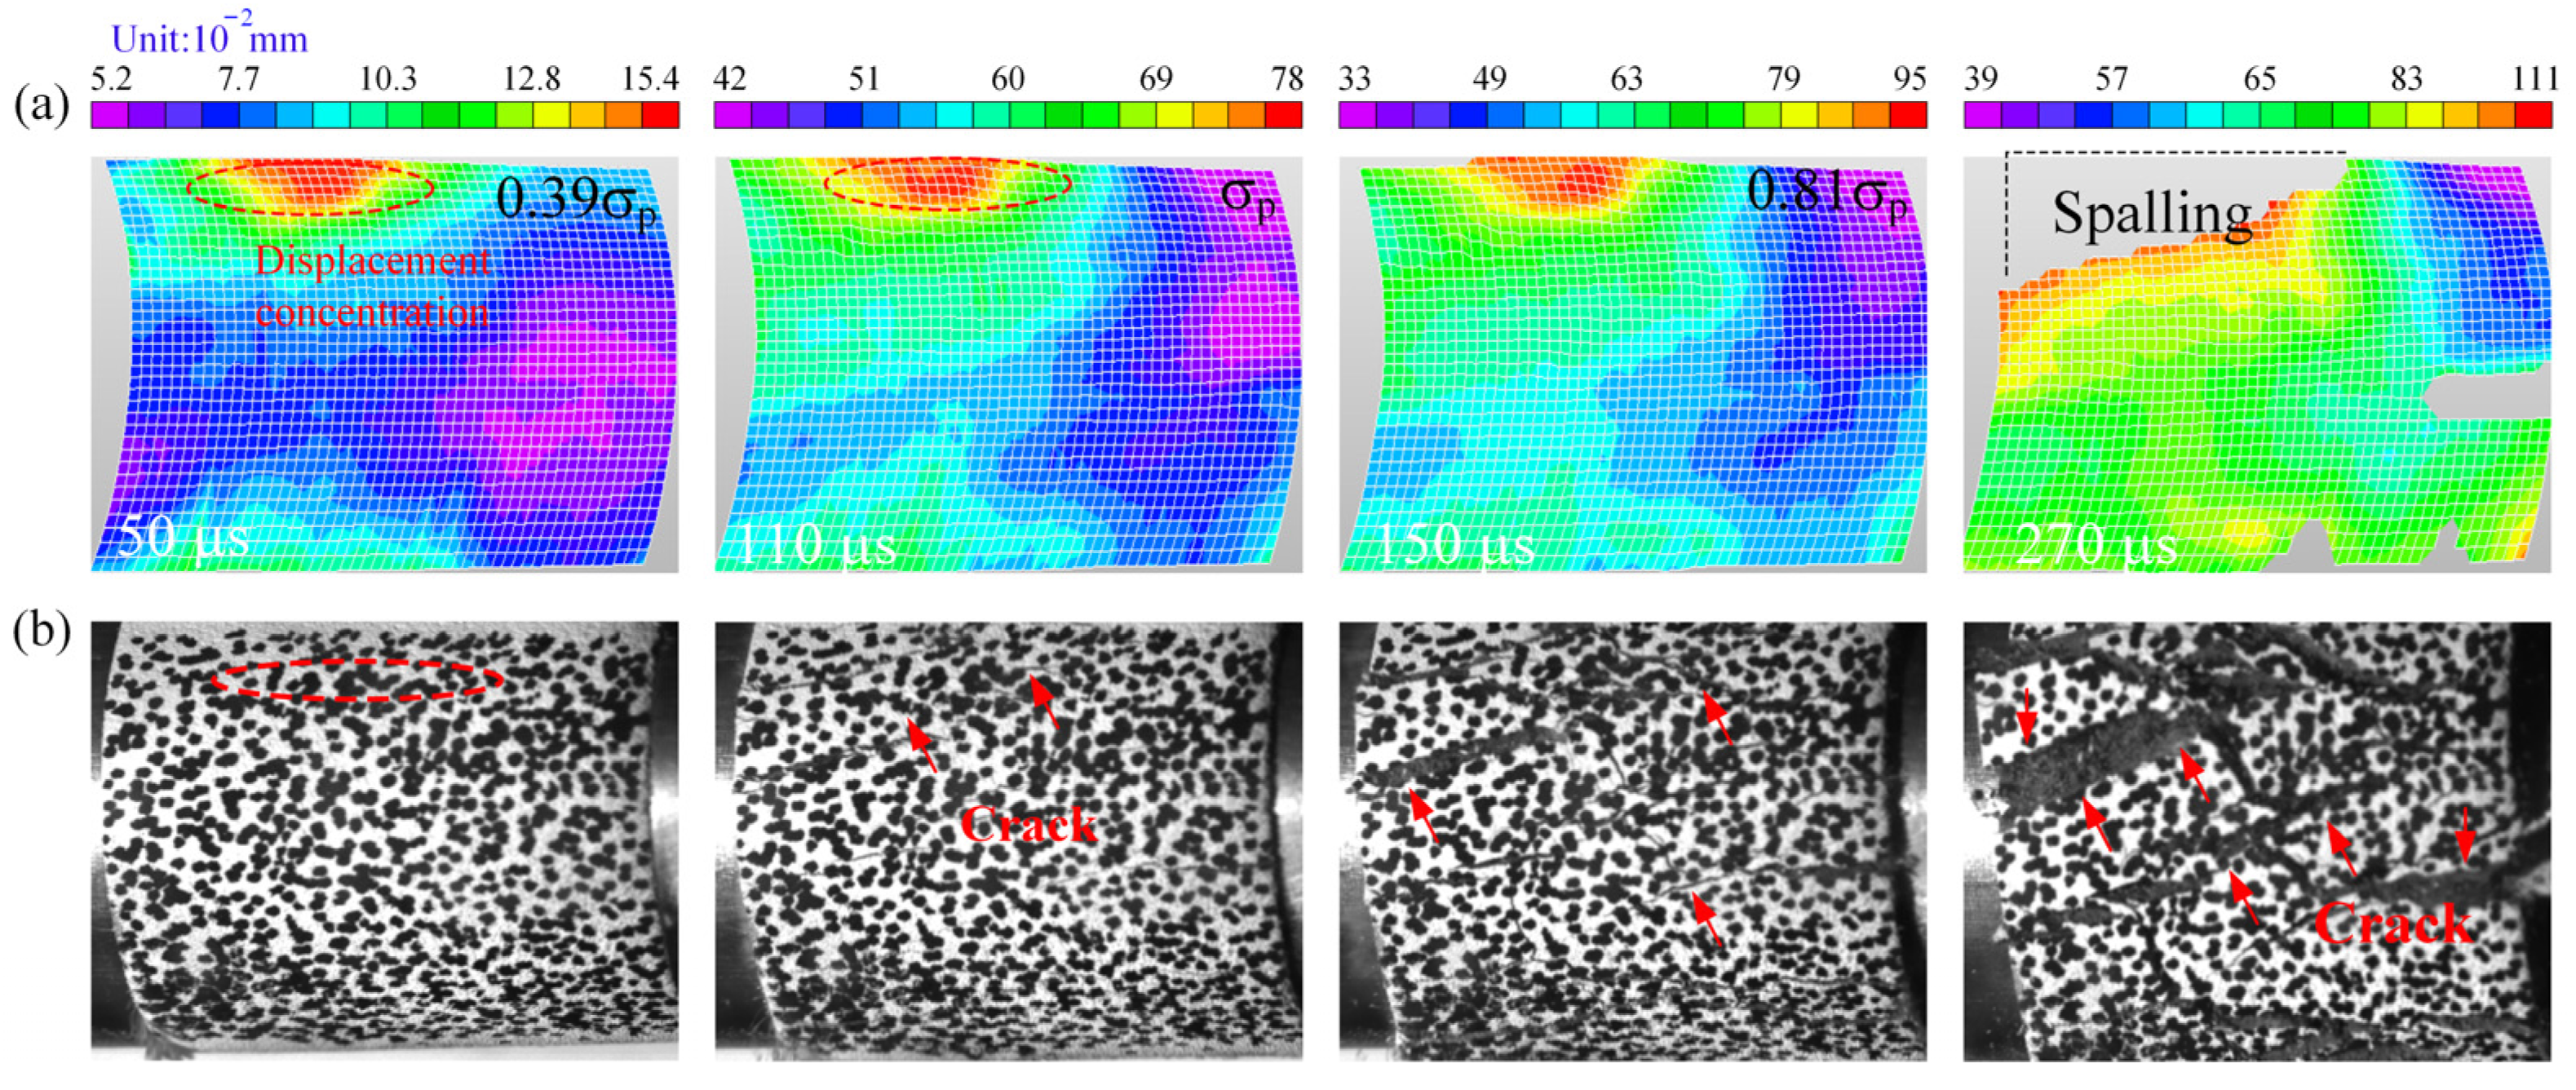
3.2.1. Evolution of the Displacement Field

To obtain the variation relationship of the displacement field with loading, eight representative stages were selected for the sample. By identifying the initial strain field on the surface, the strain measured by 3D-DIC, and the stress recorded by the strain gauges were synchronized to match the stress and displacement images. The evolution of the displacement field with the loading (120 s−1) under erosion for 21 d was shown in Figure 8. Due to the limited frame rate of the high-speed cameras, only one image was captured at 10 µs intervals. Figure 8 shows an obvious compressive deformation field (compression in DIC is positive) on the right side of the sample upon contact with the striker. As the loading increases, the deformation field gradually shifts to the left side, indicating that the compressive stress wave propagates in the x-direction. At t = 50 µs, the displacement concentration phenomenon appears in the upper right corner of the sample. This is due to the horizontal expansion deformation originating from both edges. Then, the horizontal deformation on both sides of the sample gradually expanded toward the center. Therefore, when the stress reached its peak, a pronounced shear displacement zone was formed in the center region of the sample. When the strain rate decreased to 93 s−1 (Figure 9), the time to peak stress increased to 110 µs, indicating that the time to peak stress is negatively correlated with the strain rate. When the stress increased to 35% of the peak stress, the displacement concentration appeared at the position of the lower right corner of the sample. As the loading time increased, the displacement concentration gradually developed toward the center. After the peak stress, the displacement concentration gradually expanded, and visible shear cracks appeared on the surface. In general, the higher the strain rate, the lower the stress threshold of displacement concentration and the shorter the time required to reach the peak stress.
In addition, Figure 10 shows the evolution of the displacement field for the eroded 7 d sample with a strain rate of 122 s−1. Compared to the 21 d eroded samples, the occurrence of the edge displacement concentration is 52% of the peak stress, indicating that chemical erosion lowered the stress threshold for the occurrence of the displacement concentration in the sample. The reaction of H ions with calcite in the sandstone sample is the main reason for the phenomenon described above. After the peak stress, visible cracks appeared on the sample surface, similar to other erosion samples. In other words, visible microcracks hardly appear on the surface of the sample before it reaches the peak. In addition, the time required for the sample to reach the peak stress depends on the erosion effect and loading conditions, and therefore does not exhibit a clear pattern. When a large deformation occurs on the surface of the sample, it leads to a spalling of the scatter points and thus to the appearance of defects in the displacement field.

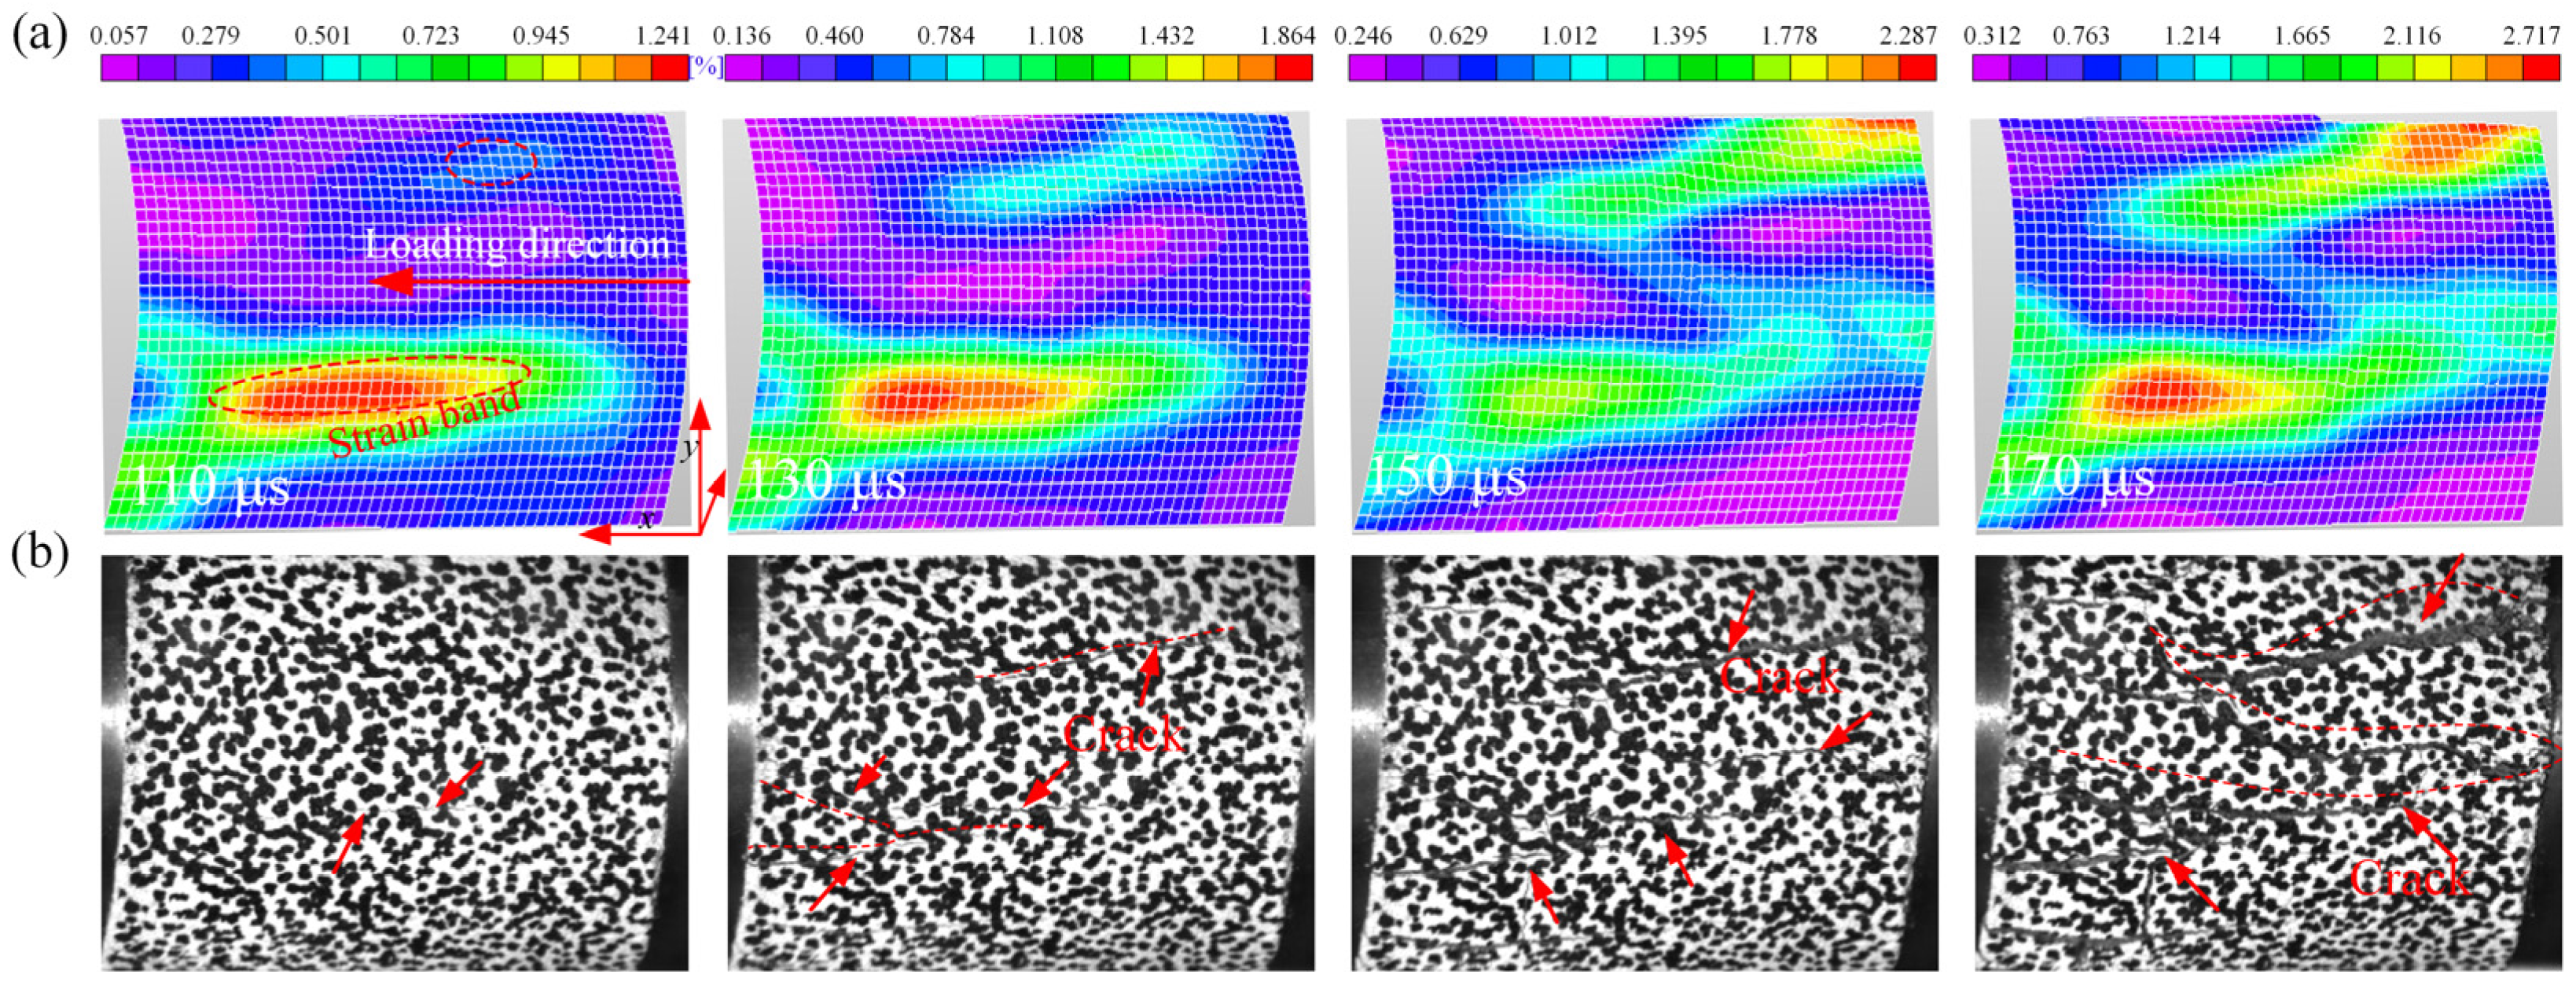
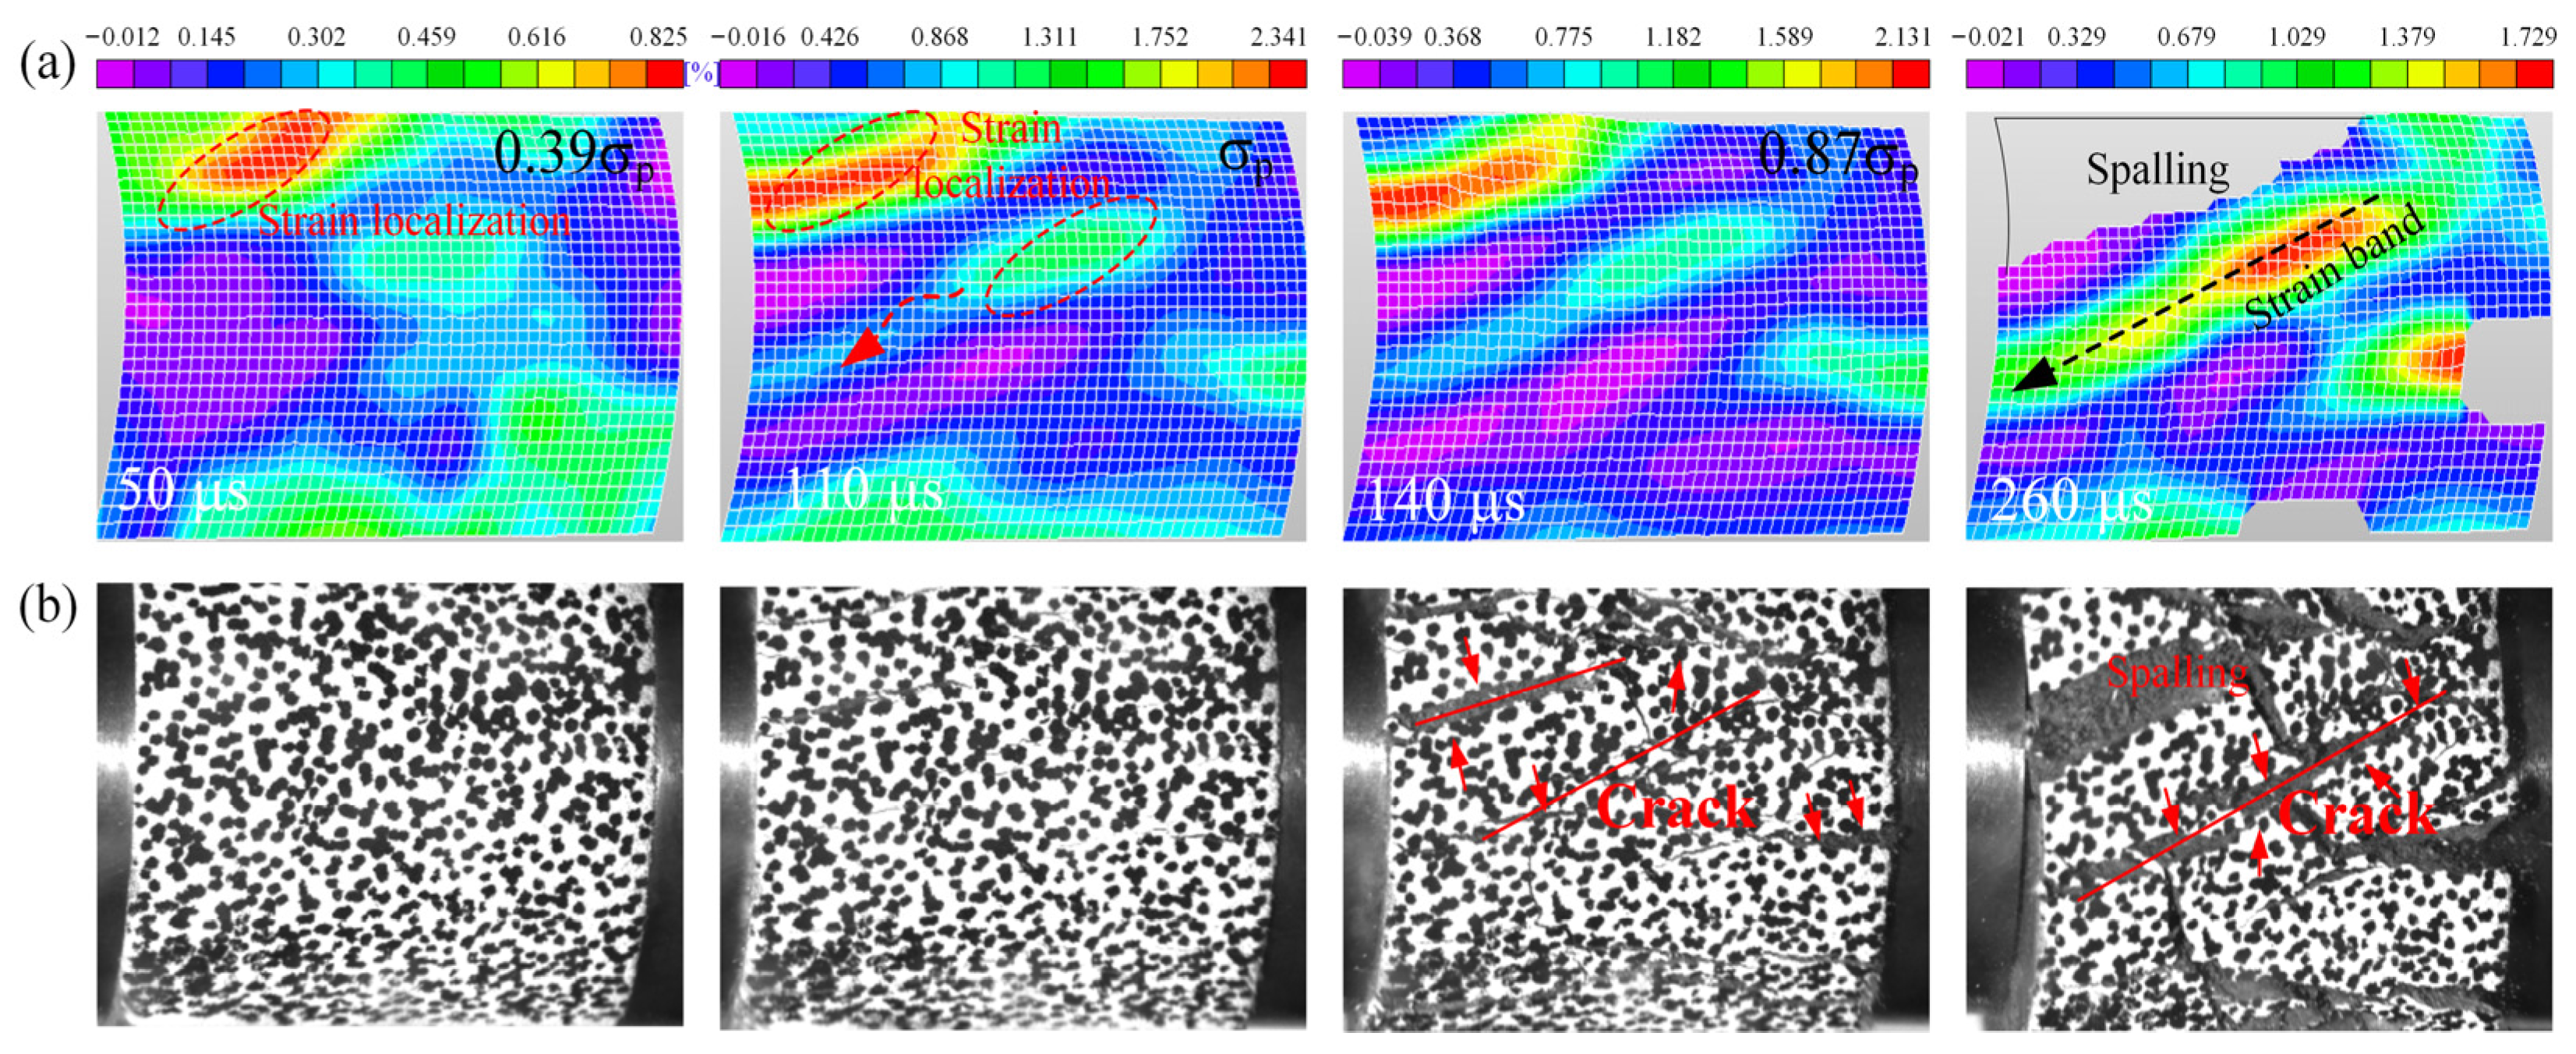
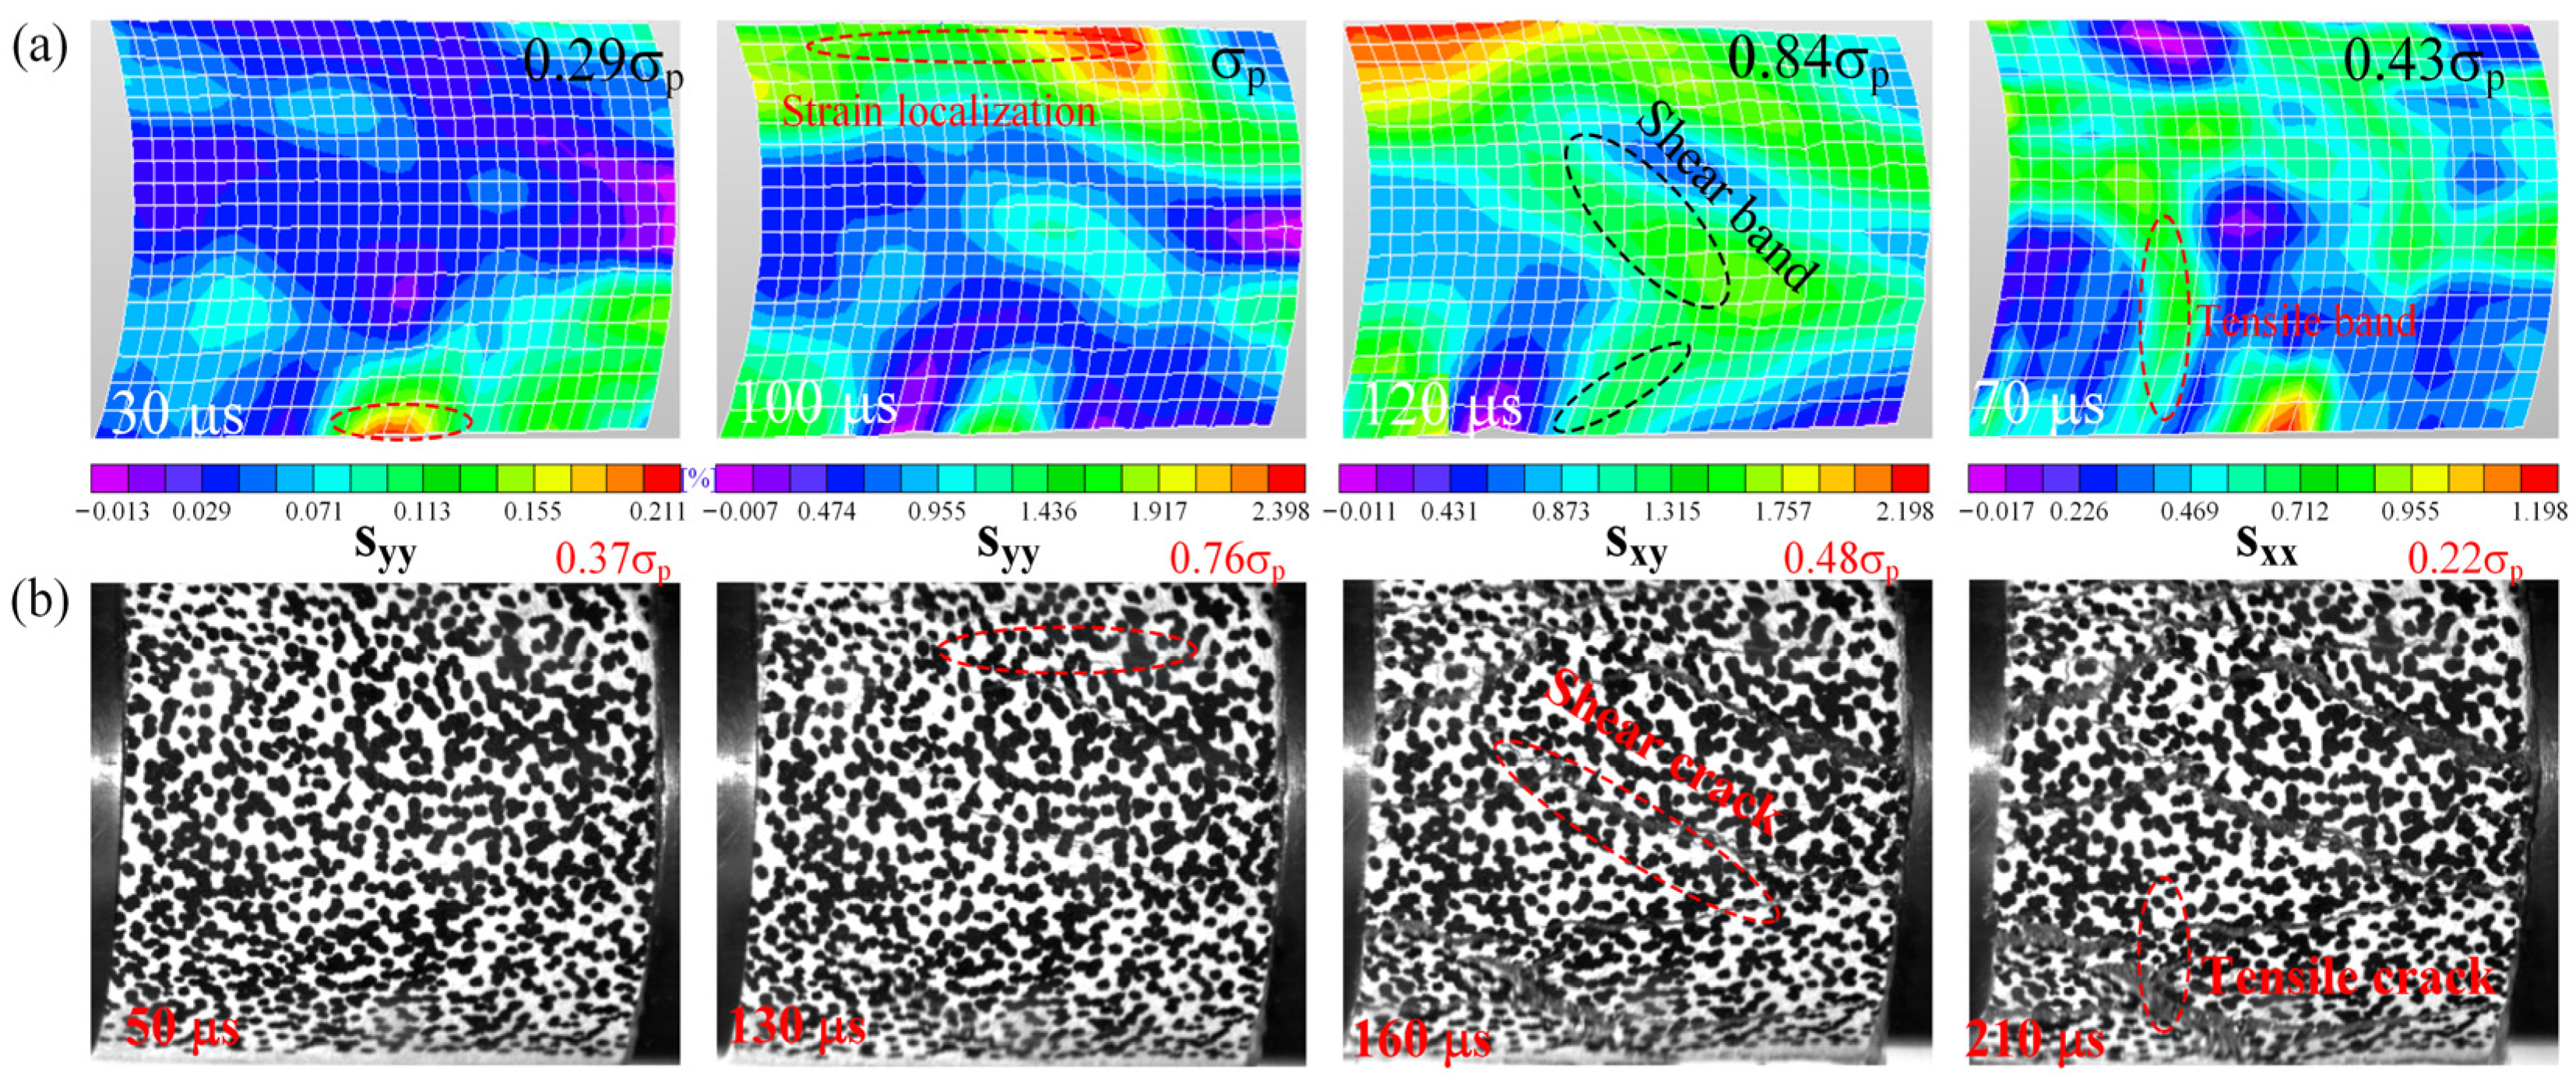
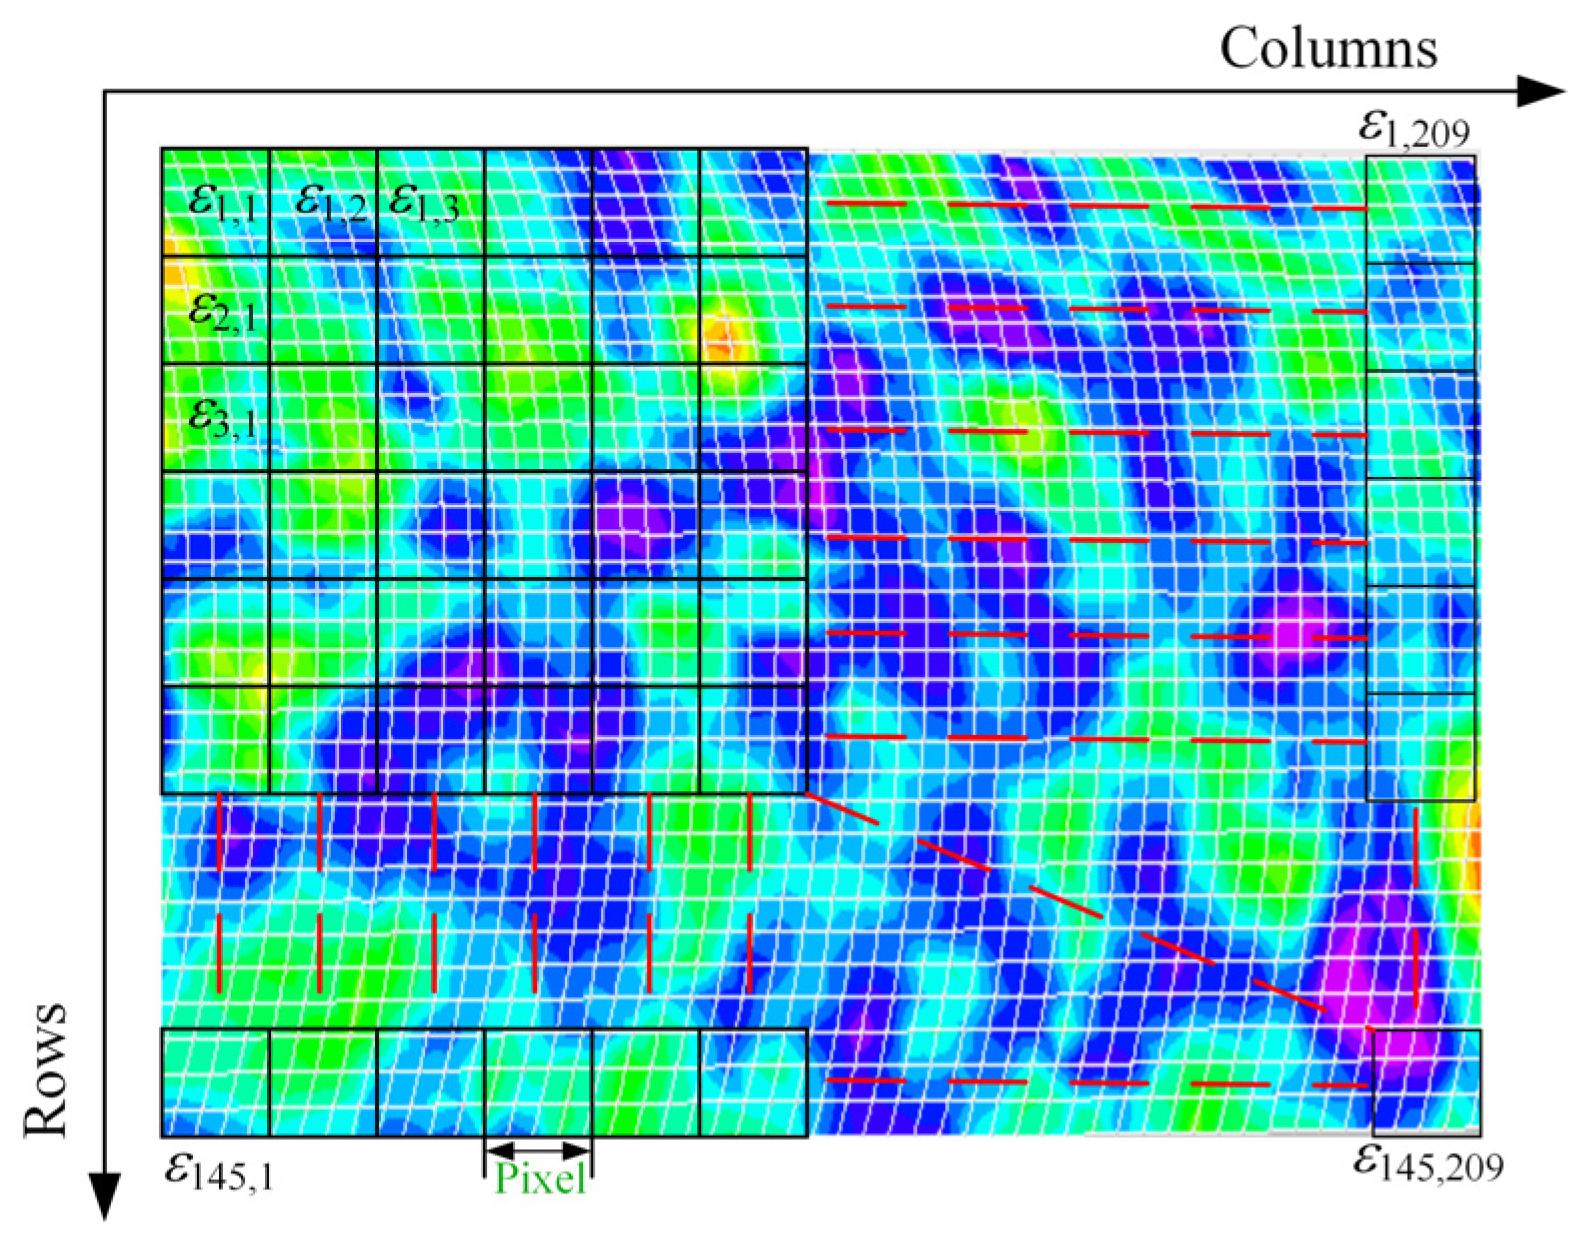
3.2.2. Evolution of the Strain Field

Chemical erosion caused by acid mine water significantly affects the surface displacement field (Figure 8, Figure 9 and Figure 10). Unlike the displacement field, the strain field can provide the process of strain localization distribution developing with the loading time [18], and thus reflect the time-domain characteristics of cracking from the side. Therefore, the strain field of the sample was determined by the 3D-DIC method. Figure 11 shows the evolution of the strain field of the sample (7 d) with a strain rate of 120 s−1. It is obvious that chemical erosion has a significant effect on the strain localization process. The strain localization first appeared at 50 µs in the horizontal strain field of the sample when the loading stress was 39% of the peak stress. As the stress increased, more horizontal strain localization generated from the top and bottom edges and then expanded toward the center of the sample. When the peak stress was reached, shear strain localization formed at the surface due to the different stiffness inside the sample. The strain localization gradually penetrates into the surface and forms a larger shear strain band as the loading increases. After reaching the peak stress, the surface strain band continues to develop and coalesce. This is attributed to the continued release of elastic energy stored during compression. In addition, the development of the shear strain band is also an external manifestation of the increased rate of strength degradation. Moreover, the local strain decreased after cracks appeared on the surface of the sample in Figure 11, a phenomenon that is difficult to observe in dynamic stress-strain curves. Meanwhile, the decrease in local strain during the unloading stage indicated that the red sandstone belongs to the class II rock under dynamic impact conditions, i.e., the post-peak strain decreases, and the fracture extension is not stable. Hence, the strains determined by the DIC method, and the strain gauges differ from each other. The main reason for this discrepancy is that the strains measured by DIC and strain gauges come from two different data sources [20].
In addition, Figure 12 presents the strain fields at 120 s−1 in the y-direction (Syy), x-direction (Sxx), and xy-direction (Sxy) on the surface of the sample eroded for 21 days. The stress threshold for strain localization decreased from 39% to 28% of the peak stress compared to the non-eroded samples, while strain localization developed earlier at the horizontal edges due to radial expansion. After that, the horizontal strain localization occurs from both sides of the ROI and gradually moves to the center during loading. Then, a shear strain band appeared on the surface at 120 µs and connected the previous horizontal strain bands. Not until 130 µs did horizontal cracks appear in the horizontal strain field; in other words, the surface was cracked at the post-stress peak stage. However, as can be seen in Figure 6, there is a phase of crack development before the peak characterized by a slow decrease in elastic modulus, suggesting that the cracks initially develop inside the rock. When the stress drops to 48% of the peak stress, visible shear cracks appear at 160 µs in the ROI. In contrast, at t = 170 µs, a vertical strain band appears at ROI and transitions into a tensile crack at 230 us. In fact, the tensile wave generated by the reflection at the interface is the cause of this spalling crack [17]. Thus, with increasing chemical corrosion, the crack development on the sample surface was more intense, which can be attributed to the deterioration of the internal structural strength.
In summary, the 3D-DIC method is able to present well the displacement and strain information on the surface of the sample during impact. Under all corrosion conditions, the horizontal strain localization first appears at the edge of the sample in the y-direction of the strain field before the peak stress, and then the strain band gradually expands toward the center. After the peak stress, shear strain bands appear on the surface of the sample and gradually lead to shear cracks on the surface. The weaker the chemical erosion, the higher the stress threshold required for strain localization; the higher the strain rate, the lower the stress threshold required for strain localization and the shorter the time to peak stress.

3.3. Difference between DIC and Strain Gauges

Figure 13 shows the stress and strain results obtained with the 3D-DIC and strain gauges. Compared to the results from the strain gauges on the bar, the strain in the DIC initially increases faster and more, but once the peak stress is reached, the strain from the DIC gradually begins to decrease (Figure 13a). The data sources between the DIC and the strain gauges are responsible for the fundamental difference. The stress measured by strain gauges is based on strain rates to calculate the time integral, which makes two assumptions, namely, the one-dimensional propagation of stress waves and the homogeneity assumption [17]. These assumptions ignore the inertial and interfacial friction effects of the bar, resulting in low theoretically calculated axial strains. Therefore, the dynamic modulus measured with strain gauges is larger than the actual one. In addition, it cannot be neglected that the DIC measurement is the surface strain. Figure 13b shows the stress-strain curves derived from DIC and strain gauges, where the stresses are all derived from the strain gauge results. Based on the brittle damage characteristics of the rock, the DIC results produce a type II strain, while the strain gauge results are type I strain. Moreover, the results measured with strain gauges show that both elastic modulus and peak strain increase with increasing strain rate. However, the stress-strain curves from the DIC method show that the elastic modulus of the rock is almost independent of the strain rate, while the peak strain shows an increasing trend with the strain rate. The elastic modulus determined by the 3D-DIC method is approximately 12.49 GPa in Figure 13b. Clearly, proper strain measurement is important to evaluate the deformation behavior and quantify the change in stress threshold during fracture development of the rock.

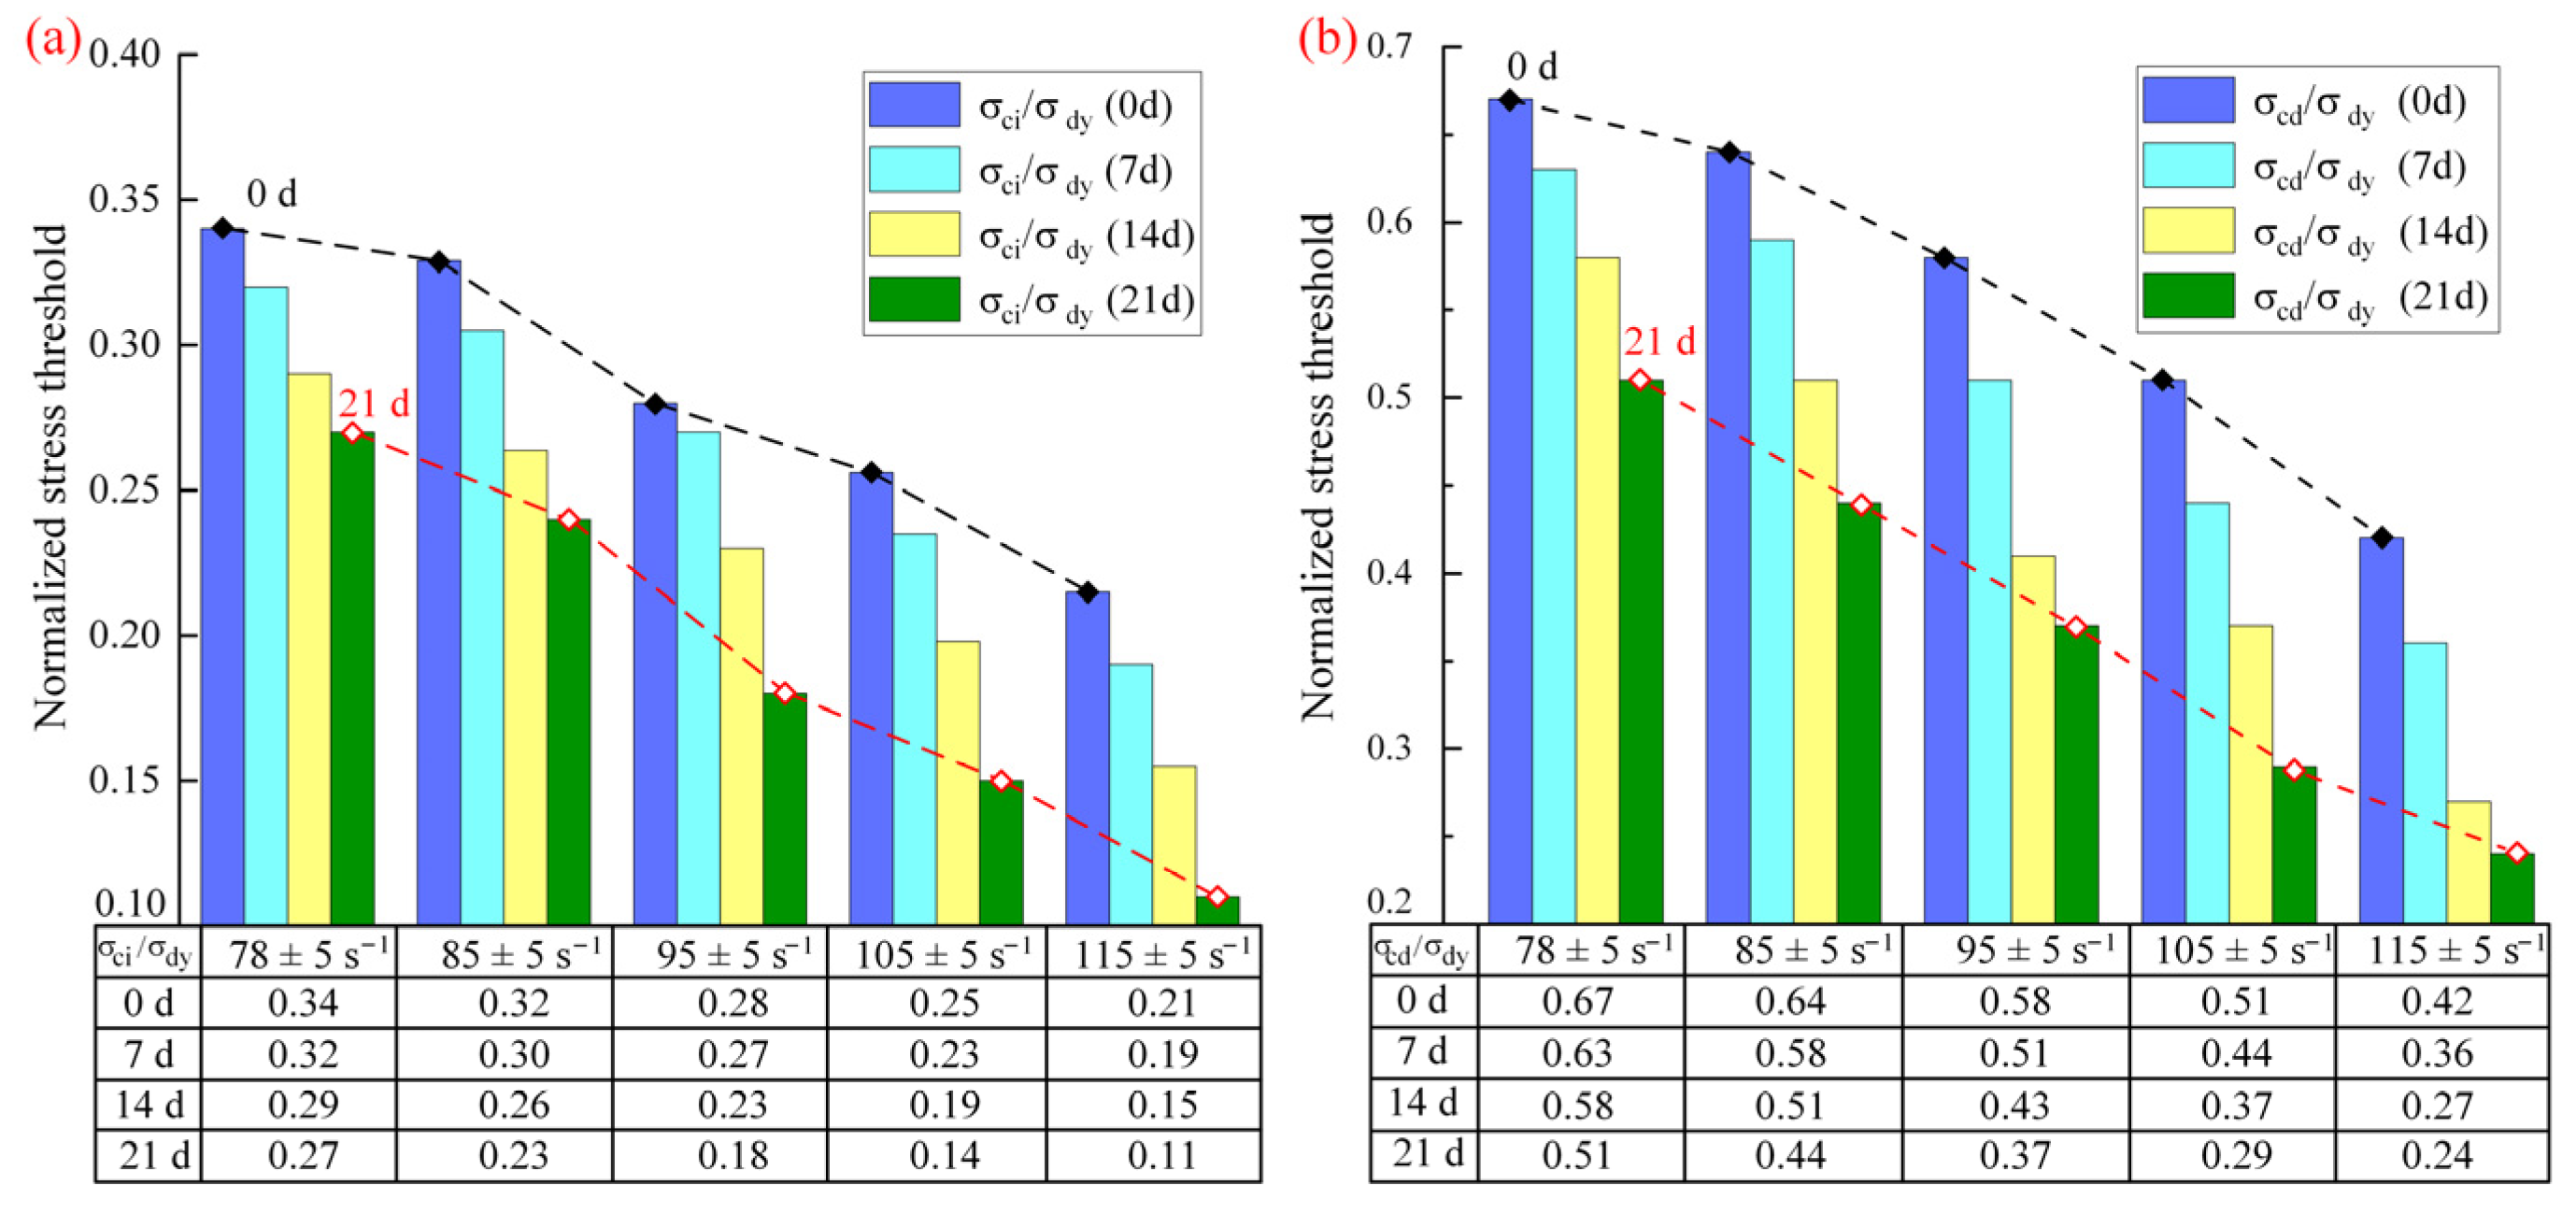
3.4. Stress Thresholds for Cracks Development

The initiation and progression of cracks induced by stress are the fundamental causes of rock failure, so identifying the stages of crack development is critical to preventing rock engineering disasters. However, measuring or determining the stress threshold for crack development is difficult because the transverse strain cannot be measured with strain gauges during impact tests. Therefore, a high-speed 3D-DIC method was used in this experiment to characterize the stress thresholds of cracks development in sandstone under different strain rates and erosion conditions. As shown in Equation (4), the volumetric strain of the sample under uniaxial compression is the sum of the axial, lateral, and radial strains, with the lateral strain equal to the radial strain. Alternatively, the volumetric strain may consist of two components, the elastic volumetric strain and the volumetric strain due to crack propagation (crack strain) [35], mathematically described by Equation (5). The elastic volumetric strain can be determined from the elastic modulus, Poisson’s ratio, and dynamic axial stress using Equation (6). The crack strain during dynamic compression is then given by Equation (7).
ε v = ε 1 + ε 2 + ε 3 = ε 1 + 2 ε 3
ε v = ε v e + ε v c
ε v e = ( 1 2 ν ) σ dy / E
ε v c = ε v ε v e
where ε 1 , ε 2 and ε 3 are axial, lateral and radial strains, respectively; ε v , ε v e and ε v c refer to volumetric strain, elastic volumetric strain and crack strain, respectively; v, E and σdy are Poisson’s ratio, dynamic elastic modulus and dynamic stress, respectively. As can be seen in Equation (6), to determine the elastic volumetric strain, the dynamic elastic modulus and Poisson’s ratio must first be determined. Xing et al. [20] defined the dynamic modulus by the ratio of stress and strain in the elastic stage using the 3D-DIC method. The 3D-DIC results in this study showed that the dynamic elastic modulus did not vary with increasing loading strain rate. The dynamic elastic modulus of the sample with different erosion is shown in Table 2. In addition, the dynamic Poisson’s ratio in the elastic phase can be determined from Equation (8) [17]:
ν = 1 2 r v 2 2 r v 2 1
with rv the ratio of P-wave and S-wave velocities. The variation of Poisson’s ratio with erosion was calculated as displayed in Figure 14, and it was found that v does not vary significantly with erosion. This result is similar to the results from Liu et al. [10]. In this test, the dynamic Poisson’s ratio was taken to be about 0.21.
Furthermore, the axial strain ( ε 1 ) and lateral strain ( ε 3 ) of the sample were extracted in the axial (Sxx) and lateral (Syy) strain fields. As illustrated in Figure 15, the strain of each pixel in the axial and radial strain fields was extracted in the ROI. As a result, the axial and lateral strains during impact can be obtained according to Equation (9) [35].
ε 1 = ( r = 1 145 c = 1 209 ε 1 ( r , c ) ) / ( 145 × 209 )   ( S xx ) ε 3 = ( r = 1 145 c = 1 209 ε 3 ( r , c ) ) / ( 145 × 209 )   ( S yy )
The stress threshold diagrams for crack development in samples under different conditions are shown in Figure 16. Similar to the static test results, there are four main stages of crack development in the sample under dynamic loading, namely the crack closure (I), stable crack development (II), unstable crack development (III), and peak stress (IV). The crack closure stage corresponds to the gradual reduction of the crack strain to zero, during which the stress wave undergoes its first propagation. The corresponding point on the stress-strain curve is also the stress threshold for stable crack development (σci). However, as soon as the crack strain increases to zero, it immediately starts to fall into the stable crack development stage, which means that there is no stable stage of elastic deformation in the dynamic impact process. Liang et al. [36] predicted this phenomenon by increasing the strain rate in the static tests; Xing et al. [17] observed and proved to this phenomenon. Nevertheless, it is undeniable that this phase still exhibits a strong linear variation of elastic modulus and a relatively slow crack development rate. Moreover, in the stage (II), there was no strain localization on the surface of the sample, let alone a crack. When strain localization occurs on the surface, it corresponds to the unstable crack development stage (III). At this stage, the tensile strain localization is initially generated from the edge in the SXX strain field. Therefore, the occurrence of strain localization is an indication that stable crack development has accumulated to a high degree. When the stress reaches its peak, a shear strain band appears on the surface of the sample; moreover, obvious shear cracks appear on the sample in the failure phase after the peak. In addition, the stress threshold for stable/unstable crack development varied with the increase of erosion. Hence, the normalized stress thresholds for different conditions were summarized, as shown in Figure 17.
As can be seen in Figure 17, the normalized stress thresholds for the development of stable/unstable cracks in sandstone decrease with increasing strain rate. Previous studies have shown that the stress thresholds for the development of stable cracks under static loading are generally in the range of 30% to 50% of the peak stress, while the stress threshold for unstable cracks is in the range of 70% to 80%. However, in this study, these two thresholds drop to 10%–30% and 20%–70% of the peak stress under dynamic loading, respectively. In other words, the dynamic loading increases the strength of the sample but decreases the thresholds for the development of stable/unstable cracks, which is a significant difference from the static loading. Moreover, the normalized stress threshold for stable crack development decreased with increasing erosion at the approximate strain rate. At an approximate strain rate of 75 s−1, the stress threshold for stable cracks development was 31.5 MPa and the normalized stress threshold was 0.34 for the uneroded sample. In comparison, the stress threshold for stable cracks development decreased by 33.1% to 22.1 MPa and the normalized stress threshold decreased by 14% to 0.29 for the sample eroded for 14 d. Similarly, the stress threshold for the development of unstable cracks also exhibited the same trend. The chemical reaction of some mineral components with the acidic solution (e.g., Equation (10)) is the main responsible for the above phenomena. In addition, the difference between the stress thresholds for the development of stable/unstable cracks reflects the capacity of the quasi-elastic phase, obviously, the quasi-elastic phase continues to decrease with increasing erosion. The quasi-elastic phase also decreases with increasing strain rate. Thus, the sensitivity of the dynamic behavior of the sandstone to strain rate increases with chemical erosion. The microstructural changes in sandstone caused by chemical erosion are the essential reasons for variations in the loading response.
SiO 2 + 2 H 2 O H 4 SiO 4 CaCO 3 + 2 H + Ca 2 + + H 2 O + CO 2 Fe 2 O 3 + 6 H + 2 Fe 3 + + 3 H 2 O KAlSi 3 O 8 + 4 H + + 4 H 2 O K + + Al 3 + + 3 H 4 SiO 4 NaAlSi 3 O 8 + 4 H + + 4 H 2 O Na + + Al 3 + + 3 H 4 SiO 4

4. Discussions

Mine water at depth is often acidic due to the coal-associated minerals, such as reduced iron or manganese, come into contact with water and oxygen [37]. When coal mines are converted for other purposes, such as the construction of pumped storage plants [3], underground reservoirs [38], etc., they are inevitably affected by impact loading. The effects of impact loading on the mechanical response of rock have already been studied in detail, focusing on dynamic strength [32], modulus [10] and deformation [13]. However, little has been reported on the evolution of the overall deformation process during impact testing. In particular, for rocks subjected to chemical erosion, the effect of impact on the full-field evolution of rock fracture has not been well studied.
In this study, the evolution of the deformation and strain fields of the red sandstone under impact loading and chemical erosion conditions was revealed using the high-speed 3D DIC technique, and the variation of stress thresholds for the development of cracks was analyzed. At approximate loading strain rates, the degree of structural deterioration of the sandstone determines the development of strain localization at the surface, which in turn affects the fracture process of the rock. The longer the chemical erosion continues, the earlier the strain is localized at the surface of the sandstone and the lower the stress threshold for crack development. At the same time, the increase in strain rate leads to an increase in the strength of the sample, but the concentration of strain bands occurs earlier on the surface. It is worth mentioning that it is difficult to reveal the volumetric strain around the whole rock with two high-speed CMOS cameras [18]. In order to fully identify the dynamic fracture process of the rock, it is necessary to understand the evolution and distribution mechanism of crack development inside the rock. Currently, some techniques such as CT, AE, and digital volume correlation (DVC) are able to measure the internal deformation field [20,34]. However, these techniques are not yet mature enough for use in SHPB testing.

5. Conclusions

In this study, SHPB tests were performed on the red sandstone with different erosion effects, and full-field deformation was measured using the high-speed 3D-DIC method. The stress thresholds for the development of cracks in the sample under dynamic loading were investigated. The main conclusions are as follows:
  • The evolution of the displacement and strain fields of the red sandstone was affected by chemical erosion and impact loading. The higher the loading rate, the greater the dynamic strength, while the stress threshold for strain localization was lower and the time to reach the stress peak was shorter. Moreover, chemical erosion accelerated the strain localization process and lowered the stress threshold for the occurrence of strain localization. Similarly, the stress threshold for displacement localization on the sample surface decreased with increasing erosion.
  • Under the influence of the erosion effect, the horizontal strain localization first occurred at the edge of the sample in the y-direction of the strain field, and then the strain localization gradually extended toward the center of the sample before reaching the peak stress. In the unloading phase, shear strain bands began to appear on the sample, and shear cracks gradually formed on the surface. No visible cracks appeared on the surface of the sample until the peak stress was reached.
  • Normalized stress thresholds for stable/unstable crack development were both lowered by chemical erosion. After an erosion period of 21 d, the stress threshold for the development of stable crack in the sample decreased from 0.34 to 0.27. In addition, the strain rate accelerated the gestation and development of cracks in the rock. Compared to the static test, the two thresholds for crack development decreased to 10–30% and 20–70% of the peak stress, respectively.

Author Contributions

Methodology, J.X. and H.P.; investigation, Z.S.; resources, J.X.; data curation, J.X. and Z.S.; writing—original draft preparation, J.X. and Z.S.; writing—review and editing, J.X. and H.P.; visualization, J.X. and Z.S.; supervision, H.P. All authors have read and agreed to the published version of the manuscript.

Funding

This research was funded by the National Natural Science Foundation of China (No. 51974296, No. 52061135111).

Data Availability Statement

Data available on request due to privacy restrictions.

Conflicts of Interest

The authors declare no conflict of interest.

References

  1. Pu, H.; Xu, J. Research Status and Progress of Geothermal Energy Development and Utilization from Closed/Abandoned Coal Mines. J. China Coal Soc. 2022, 47, 2243–2269. [Google Scholar]
  2. Menéndez, J.; Fernández-Oro, J.M.; Galdo, M.; Loredo, J. Transient simulation of underground pumped storage hydropower plants operating in pumping mode. Energies 2020, 13, 1781. [Google Scholar] [CrossRef]
  3. Menéndez, J.; Fernández-Oro, J.M.; Loredo, J. Economic feasibility of underground pumped storage hydropower plants providing ancillary services. Appl. Sci. 2020, 10, 3947. [Google Scholar] [CrossRef]
  4. Zhang, C.; Wang, F.; Bai, Q. Underground space utilization of coalmines in China: A review of underground water reservoir construction. Tunn. Undergr. Space Technol. 2021, 107, 103657. [Google Scholar] [CrossRef]
  5. Farr, G.; Sadasivam, S.; Watson, I.A.; Thomas, H.R.; Tucker, D. Low enthalpy heat recovery potential from coal mine discharges in the South Wales Coalfield. Int. J. Coal Geol. 2016, 164, 92–103. [Google Scholar] [CrossRef]
  6. Ma, T.; Ding, W.X.; Wang, H.Y.; Chen, G.X.; Chen, H.J.; Yan, Y.Y. Dissolution characteristics and mechanical properties of limestone with different mineral composition contents eroded by acid chemical solution. Chin. J. Geotech. Eng. 2021, 43, 1550–1557. [Google Scholar]
  7. Lin, Y.; Zhou, K.; Gao, R.; Li, J.; Zhang, J. Influence of chemical corrosion on pore structure and mechanical properties of sandstone. Geofluids 2019, 2019, 24–30. [Google Scholar] [CrossRef]
  8. Li, H.; Zhong, Z.; Liu, X.; Sheng, Y.; Yang, D. Micro-damage evolution and macro-mechanical property degradation of limestone due to chemical effects. Int. J. Rock Mech. Min. Sci. 2018, 110, 257–265. [Google Scholar] [CrossRef]
  9. Feng, X.; Chen, S.; Li, S. Effects of water chemistry on microcracking and compressive strength of granite. Int. J. Rock Mech. Min. Sci. 2001, 38, 557–568. [Google Scholar] [CrossRef]
  10. Yongsheng, L.; Liu, W.; Dong, X. Dynamic mechanical properties and constitutive model of rock under chemical corrosion. J. Yangtze River Sci. Res. Inst. 2015, 32, 72–75. [Google Scholar]
  11. Han, T.; Shi, J.; Chen, Y.; Li, Z.; Li, C. Laboratory Investigation on the Mechanical Properties of Sandstone Immersed in Different Chemical Corrosion under Freeze-thaw Cycles. Acta Mech. Solida Sin. 2017, 38, 503–520. [Google Scholar]
  12. Ding, W.X.; Chen, J.P.; Xu, T.; Chen, H.J.; Wang, H.Y. Mechanical and chemical characteristics of limestone during chemical erosion. Rock Soil Mech. 2015, 36, 1825–1830. [Google Scholar]
  13. Xu, J.; Pu, H.; Sha, Z. Mechanical behavior and decay model of the sandstone in Urumqi under coupling of freeze–thaw and dynamic loading. Bull. Eng. Geol. Environ. 2021, 80, 2963–2978. [Google Scholar] [CrossRef]
  14. Li, G.; Yu, L.; Su, H.; Jing, H.; Zhang, T. Dynamic properties of corroded limestone based on SHPB. Chin. J. Rock Mech. Eng. 2018, 37, 2075–2085. [Google Scholar]
  15. Yu, L.; Zhang, Z.; Wu, J.; Liu, R.; Qin, H.; Fan, P. Experimental study on the dynamic fracture mechanical properties of limestone after chemical corrosion. Theor. Appl. Fract. Mech. 2020, 108, 102620. [Google Scholar] [CrossRef]
  16. Miao, S.; Cai, M.; Guo, Q.; Wang, P.; Liang, M. Damage effects and mechanisms in granite treated with acidic chemical solutions. Int. J. Rock Mech. Min. Sci. 2016, 88, 77–86. [Google Scholar] [CrossRef]
  17. Xing, H.Z.; Zhang, Q.B.; Zhao, J. Stress Thresholds of Crack Development and Poisson’s Ratio of Rock Material at High Strain Rate. Rock Mech. Rock Eng. 2018, 51, 945–951. [Google Scholar] [CrossRef]
  18. Wang, Y.; Zhu, C.; Zhang, B.; Hou, Z. Full-Field Deformation Characteristics of Anisotropic Marble under Compression Revealed by 3D Digital Image Correlation. Lithosphere 2021, 2021, 1098235. [Google Scholar] [CrossRef]
  19. Wang, Y.; Yang, H.; Zhu, C.; Gao, S. On the Fracture Evolution and Instability of Pyrite-Filled Marble Exposed to Freeze-Thaw-Compression Loads. Lithosphere 2021, 2021, 7599916. [Google Scholar] [CrossRef]
  20. Xing, H.Z.; Zhang, Q.B.; Ruan, D.; Dehkhoda, S.; Lu, G.X.; Zhao, J. Full-field measurement and fracture characterisations of rocks under dynamic loads using high-speed three-dimensional digital image correlation. Int. J. Impact Eng. 2018, 113, 61–72. [Google Scholar] [CrossRef]
  21. Li, D.; Zhu, Q.; Zhou, Z.; Li, X.; Ranjith, P.G. Fracture analysis of marble specimens with a hole under uniaxial compression by digital image correlation. Eng. Fract. Mech. 2017, 183, 109–124. [Google Scholar] [CrossRef]
  22. Zhou, X.P.; Wang, Y.T.; Zhang, J.Z.; Liu, F.N. Fracturing Behavior Study of Three-Flawed Specimens by Uniaxial Compression and 3D Digital Image Correlation: Sensitivity to Brittleness. Rock Mech. Rock Eng. 2019, 52, 691–718. [Google Scholar] [CrossRef]
  23. Solav, D.; Moerman, K.M.; Jaeger, A.M.; Genovese, K.; Herr, H.M. MultiDIC: An open-source toolbox for multi-view 3D digital image correlation. IEEE Access 2018, 6, 30520–30535. [Google Scholar] [CrossRef]
  24. Golewski, G.L. Measurement of fracture mechanics parameters of concrete containing fly ash thanks to use of Digital Image Correlation (DIC) method. Meas. J. Int. Meas. Confed. 2019, 135, 96–105. [Google Scholar] [CrossRef]
  25. Munoz, H.; Taheri, A. Specimen aspect ratio and progressive field strain development of sandstone under uniaxial compression by three-dimensional digital image correlation. J. Rock Mech. Geotech. Eng. 2017, 9, 599–610. [Google Scholar] [CrossRef]
  26. Chen, C.; Xu, J.; Okubo, S.; Peng, S. Damage evolution of tuff under cyclic tension–compression loading based on 3D digital image correlation. Eng. Geol. 2020, 275, 105736. [Google Scholar] [CrossRef]
  27. Munoz, H.; Taheri, A.; Chanda, E.K. Pre-Peak and Post-Peak Rock Strain Characteristics During Uniaxial Compression by 3D Digital Image Correlation. Rock Mech. Rock Eng. 2016, 49, 2541–2554. [Google Scholar] [CrossRef]
  28. Zhao, J.; Sang, Y.; Duan, F. The state of the art of two-dimensional digital image correlation computational method. Eng. Rep. 2019, 1, e12038. [Google Scholar] [CrossRef]
  29. Zhu, Q.; Li, D.; Han, Z.; Li, X.; Zhou, Z. Mechanical properties and fracture evolution of sandstone specimens containing different inclusions under uniaxial compression. Int. J. Rock Mech. Min. Sci. 2019, 115, 33–47. [Google Scholar] [CrossRef]
  30. Tang, Y.; Okubo, S.; Xu, J.; Peng, S. Experimental Study on Damage Behavior of Rock in Compression–Tension Cycle Test Using 3D Digital Image Correlation. Rock Mech. Rock Eng. 2019, 52, 1387–1394. [Google Scholar] [CrossRef]
  31. Sharafisafa, M.; Shen, L. Experimental Investigation of Dynamic Fracture Patterns of 3D Printed Rock-like Material Under Impact with Digital Image Correlation. Rock Mech. Rock Eng. 2020, 53, 3589–3607. [Google Scholar] [CrossRef]
  32. Xu, J.; Pu, H.; Sha, Z. Experimental Study on the Effect of Brittleness on the Dynamic Mechanical Behaviors of the Coal Measures Sandstone. Adv. Civ. Eng. 2021, 2021, 6679333. [Google Scholar] [CrossRef]
  33. Li, X. Rock Dynamic Fundamentals and Applications; Li, X., Ed.; Science Press: Beijing, China, 2014; ISBN 987-7-03-040425-1. [Google Scholar]
  34. Xing, H.Z.; Zhang, Q.B.; Braithwaite, C.H.; Pan, B.; Zhao, J. High-Speed Photography and Digital Optical Measurement Techniques for Geomaterials: Fundamentals and Applications. Rock Mech. Rock Eng. 2017, 50, 1611–1659. [Google Scholar] [CrossRef]
  35. Xing, H.; Wang, M.; Fan, P.; Wang, D. Grain-size effect on dynamic behavior of sandstone based on high-speed 3D-DIC technique. Explos. Shock Waves 2021, 41, 43–54. [Google Scholar]
  36. Liang, C.; Li, X.; Wang, S.; Li, S.; He, J.; Ma, C. Experimental investigations on rate-dependent stress-strain characteristics and energy mechanism of rock under uniaixal compression. Chin. J. Rock Mech. Eng. 2012, 31, 1830–1838. [Google Scholar]
  37. Pu, H.; Bian, Z.; Zhang, J.; Xu, J. Research on a reuse mode of geothermal resources in abandoned coal mines. J. China Coal Soc. 2021, 46, 677–687. [Google Scholar]
  38. Zhang, K.; Gao, J.; Jiang, B.; Han, J.; Chen, M. Experimental study on the mechanism of water-rock interaction in the coal mine underground reservoir. J. China Coal Soc. 2019, 44, 3760–3772. [Google Scholar]
Figure 1. XRD result for the red sandstone.
Minerals 12 01038 g001
Figure 2. Variation of sample components under the chemical erosion effect.
Minerals 12 01038 g002
Figure 3. SHPB and 3D-DIC systems.
Minerals 12 01038 g003
Figure 4. Principle of the binocular stereo vision in 3D-DIC method.
Minerals 12 01038 g004
Figure 5. Schematic diagram of the original subset and the corresponding deformation subset.
Minerals 12 01038 g005
Figure 6. Dynamic stress-strain curves with various immersion time as measured by strain gauges: (a) 0 d; (b) 7 d; (c) 14 d; (d) 21 d.
Minerals 12 01038 g006
Figure 7. Strain filed by DIC (a) and the corresponding CMOS cameras images (b).
Minerals 12 01038 g007
Figure 8. Displacement field evolution of the sample (21 d) at a strain rate of 128 s−1.
Minerals 12 01038 g008
Figure 9. Displacement field evolution of the sample (21 d) at a strain rate of 92 s−1. (a) DIC images; (b) CMOS cameras images.
Minerals 12 01038 g009
Figure 10. Displacement field evolution of the sample (7 d) at a strain rate of 119 s−1. (a) DIC images; (b) CMOS cameras images.
Minerals 12 01038 g010
Figure 11. Strain field evolution of the sample (7 d) at a strain rate of 120 s−1. (a) DIC images; (b) CMOS cameras images.
Minerals 12 01038 g011
Figure 12. Strain field evolution (21 d) at a strain rate of 120 s−1. (a) DIC image; (b) CMOS cameras images; Sxx, Syy and Sxy refer to the strain fields in x, y and xy directions, respectively.
Minerals 12 01038 g012
Figure 13. Results from strain gauges and 3D-DIC. (a) Stress and strain (b) Stress-strain curve.
Minerals 12 01038 g013
Figure 14. Variation of the wave velocity and the Poisson’s ratio of the sample with corrosion.
Minerals 12 01038 g014
Figure 15. Schematic diagram of axial and radial strain based on pixel points.
Minerals 12 01038 g015
Figure 16. Pre-peak stress strain curves and stress thresholds for crack development with corresponding strain field. (a) 7d at 97.1 s−1; (b) 14d at 99.2 s−1.
Minerals 12 01038 g016
Figure 17. The stress thresholds for the development of stable (a) and unstable (b) cracks in samples under impact loading.
Minerals 12 01038 g017
Table 1. Static physical and mechanical parameters of the red sandstone.
Vs/(m/s)Vp (m/s)ρd/(g·cm−3)ρsat/(g·cm−3)Es/(GPa)σs/(MPa)
1247.22218.62.422.499.3563.5
Notes: VP, P-wave velocity; VS, S-wave velocity; ρd, dry density; ρsat, saturation density; Es, elastic modulus; σs, static peak strength.
Table 2. Dynamic elastic modulus Ed by DIC and static elastic modulus Es of the sample.
Method0 d7 d14 d21 d
Ed (3D-DIC)12.49 GPa11.52 GPa10.58 GPa9.32 GPa
Es (Static)9.35 GPa9.03 GPa8.63 GPa8.04 GPa
Publisher’s Note: MDPI stays neutral with regard to jurisdictional claims in published maps and institutional affiliations.

