Article

Investigation of the Deformation Failure Occurring When Extracting Minerals via Underground Mining: A Case Study

1
State Key Laboratory of Geomechanics and Geotechnical Engineering, Institute of Rock and Soil Mechanics, Chinese Academy of Sciences, Wuhan 430071, China
2
University of Chinese Academy of Sciences, Beijing 100049, China
*
Author to whom correspondence should be addressed.
Minerals 2022, 12(8), 1025; https://doi.org/10.3390/min12081025
Submission received: 29 June 2022 / Revised: 7 August 2022 / Accepted: 9 August 2022 / Published: 15 August 2022
(This article belongs to the Special Issue Failure Characteristics of Deep Rocks)

Abstract

:
Metal mines mined using the sublevel caving method often exhibit various environmental problems on the ground surface. This can affect the safety of the production process in the mining area. A numerical model using Universal Distinct Element Code has been established to investigate deformation failure giving rise to this underground mining. The calculations are combined with in-situ monitoring data collected over a period of 10 years. The results indicate that the strata movement in the footwall can be divided into two stages: an arch caving development stage and post arch caving development stage. Mining disturbance is the main cause of caving in the arch caving development stage. The overlying strata experience ‘caving–stability–caving’, leading to the formation of an ‘arch-shaped’ caving pattern. In the post arch caving development stage, flexural-toppling deformation occurs in the strata in the direction of the collapse pit due to the tectonic stress present and high dip angles of the discontinuities. Through-going failure surface has been analyzed by studying the plastic state and displacement of elements. The formation of through-going failure surface is related to the flexural-toppling deformation and stress concentration caused by mining activities. Based on the different failure mechanisms, an efficient partition has been proposed such that the footwall can be divided into a stable zone, flexural-toppling failure zone, compression and slipping-toppling failure zone, and shear-slipping failure zone. The results are a useful reference when applied to the Chengchao Iron Mine and other similar metal mines.

1. Introduction

Mineral resources are important for the continued development of society. Naturally, therefore, as development becomes more rapid, demand for mineral resources also increases rapidly. As a result, mining activity is gradually moving to deeper depths below ground. The caving method is widely adopted in many metal mines due to its high efficiency and relatively low operating costs [1,2,3]. Notable examples include the Kiirunavaara Iron Mine in Kiruna City, Norrbotten Province, Sweden, Chengchao Iron Mine in Ezhou City, Hubei Province, China, and Jinshandian Iron Mine in Huangshi City, Hubei Province, China. Compared to metal mines mined using the filling method, sublevel caving leads to the large-scale collapse of the strata overlying the mine. This can lead to unexpected disasters resulting from the formation of collapse pits and cracks and damage to buildings and facilities on the ground surface [4,5]. Due to the lack of research on stress–strain behavior when extracting minerals by underground mining, a large amount of surface subsidence was observed at the Kiirunavaara mine in Sweden. The surface disturbance was so significant that it affected parts of Kiruna city [6,7]. Another representative example is the Verkhnekamsk mine in Perm, Russia. Due to errors at the design stage and in the production process, two mines were destroyed and flooded, and the destruction affected the city limits [8]. In other words, the sublevel caving method can lead to serious environmental and safety problems.
Numerous scholars have conducted research on the movement of strata due to coal mining activity, and some important results have been accomplished [9,10,11,12,13,14,15]. However, metal ores tend to be located in areas with complex geological conditions. This makes the problem of strata movement around metal mines more complicated; the research is still in the exploratory stage. Scholars have tried to address the problem using a variety of research methods, e.g., theoretical analysis, in situ monitoring, and numerical simulation. In terms of theoretical analysis, Hoek [16] used a theoretical approach to model the progressive failure (break angle) of the hanging wall in the Grangesberg Iron Mine in Bergslagen, Sweden. Based on this work, Brown et al. [17] and Lupo [18,19] made further attempts to provide an improved theoretical model. Baryakh et al. proposed a series of methods to evaluate subsidence and fracture due to underground mining [20,21,22]. Although such theoretical models are based on clear physical concepts (and are easy to use), a large number of idealized assumptions are made during their derivation. Unfortunately, some of these may be inconsistent with the complex geological conditions found in the field. In terms of in situ monitoring, photographic methods (using, for example, unmanned aerial vehicles), interferometric synthetic aperture radar, and global positioning systems (GPSs) have been used by many scholars to measure the deformation of the ground surface [23,24,25]. Although in situ monitoring is often limited by external conditions, it does reflect the most realistic assessment of the ground surface displacement occurring. In terms of numerical simulations, Sitharam et al. [26] used the concept of representative elementary volume in fast lagrangian analysis of continua (FLAC) to study the deformation and stress characteristics in the Kiirunavaara Iron Mine in Kiruna, Sweden. Rybak et al. explored the change in the stress–strain behavior and the possibility of development of deformation changes with numerical simulation using FLAC3D software (5.01 version, ITASCA Consulting Group, Minneapolis, MN, USA) [27]. Villegas et al. [28] used particle flow code (PFC) to study the effect of rock caving on the stability of the hanging wall. Hamdi et al. [29] used the finite–discrete element method (FDEM) to study the influences of the persistence and spacing of the discontinuities on the deformation of the ground surface of the hanging wall. Yu et al. show that natural and human-made geodynamic events associated with mining operations reflect the global geodynamic processes [30]. Senz, E. and Menéndez-Pidal, I. et al. also studied topics related to that described herein [31,32].
Most scholars focus on the hanging wall because the strata movement there is more extensive than that in the footwall. The Chengchao Iron Mine is a metal mine which is mined using the sublevel caving method. Moreover, we have been monitoring this iron mine for over 10 years. Our results show that, in this mine, the extent of the failure in the footwall is more serious than that in the hanging wall. Various scholars have utilized qualitative and limit equilibrium methods to analyze this phenomenon, but the mechanism responsible for the extensive damage in the footwall is still not fully understood [33,34,35]. Considering that many significant buildings and facilities are located in the footwall of the mining area, it is imperative that the deformation and failure mechanism should be studied further.
According to the aforementioned analysis, it can be noted that the deformation failure occurring when extracting minerals via underground mining is a very topical issue. Therefore, the purpose of this study was to investigate the strata movement and failure mechanism in the footwall of the Chengchao Iron Mine, and to achieve this, it was necessary to address the following tasks: the geological conditions in the Chengchao Iron Mine were analyzed and a reasonable two-dimensional (2D) numerical model was established using Universal Distinct Element Code (UDEC) and the model was then used to simulate the complete orebody-mining procedure. The results of the numerical simulations were then combined with the in situ monitoring data to investigate stratal movement in the footwall from multiple perspectives. As a result, the stratal movement was divided into two different stages. The formation of through-going failure surface was related to the flexural-toppling deformation and stress concentration caused by mining activities. The footwall was subsequently divided into different zones according to the different failure mechanisms occurring. The results obtained should serve as a useful guide to the deformation occurring in the Chengchao Iron Mine and other similar metal mines.

2. Engineering Situation

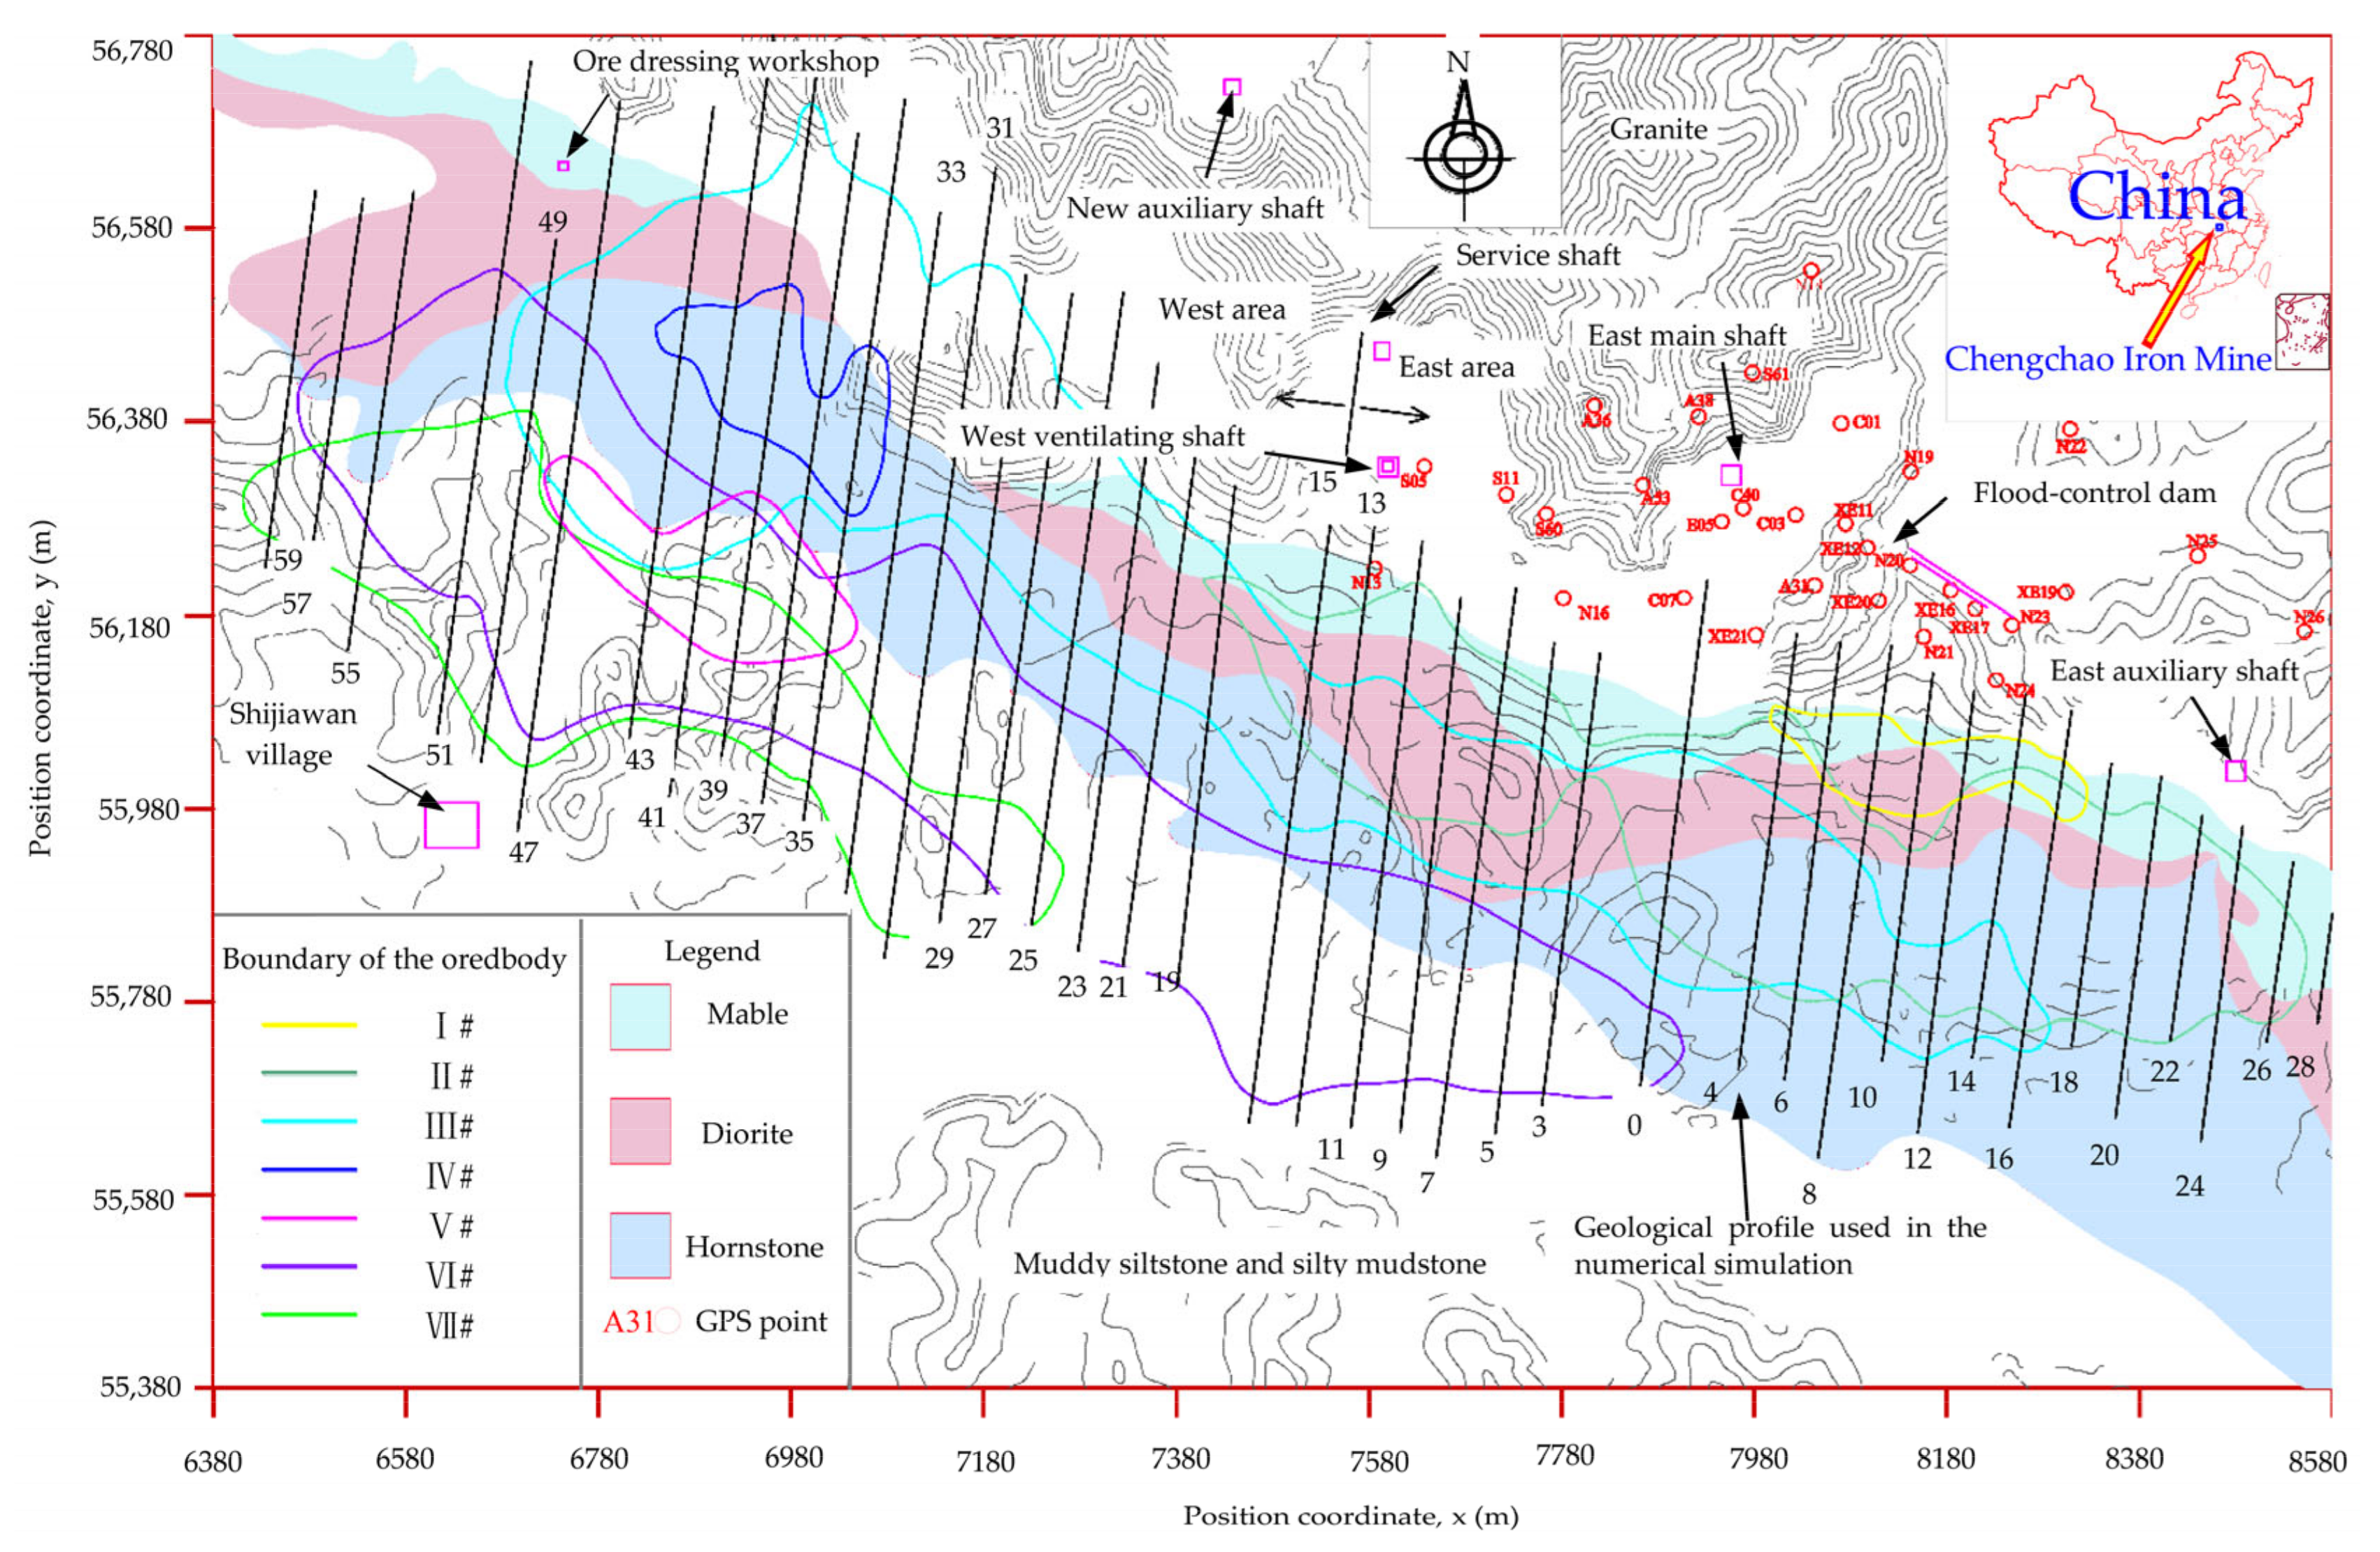
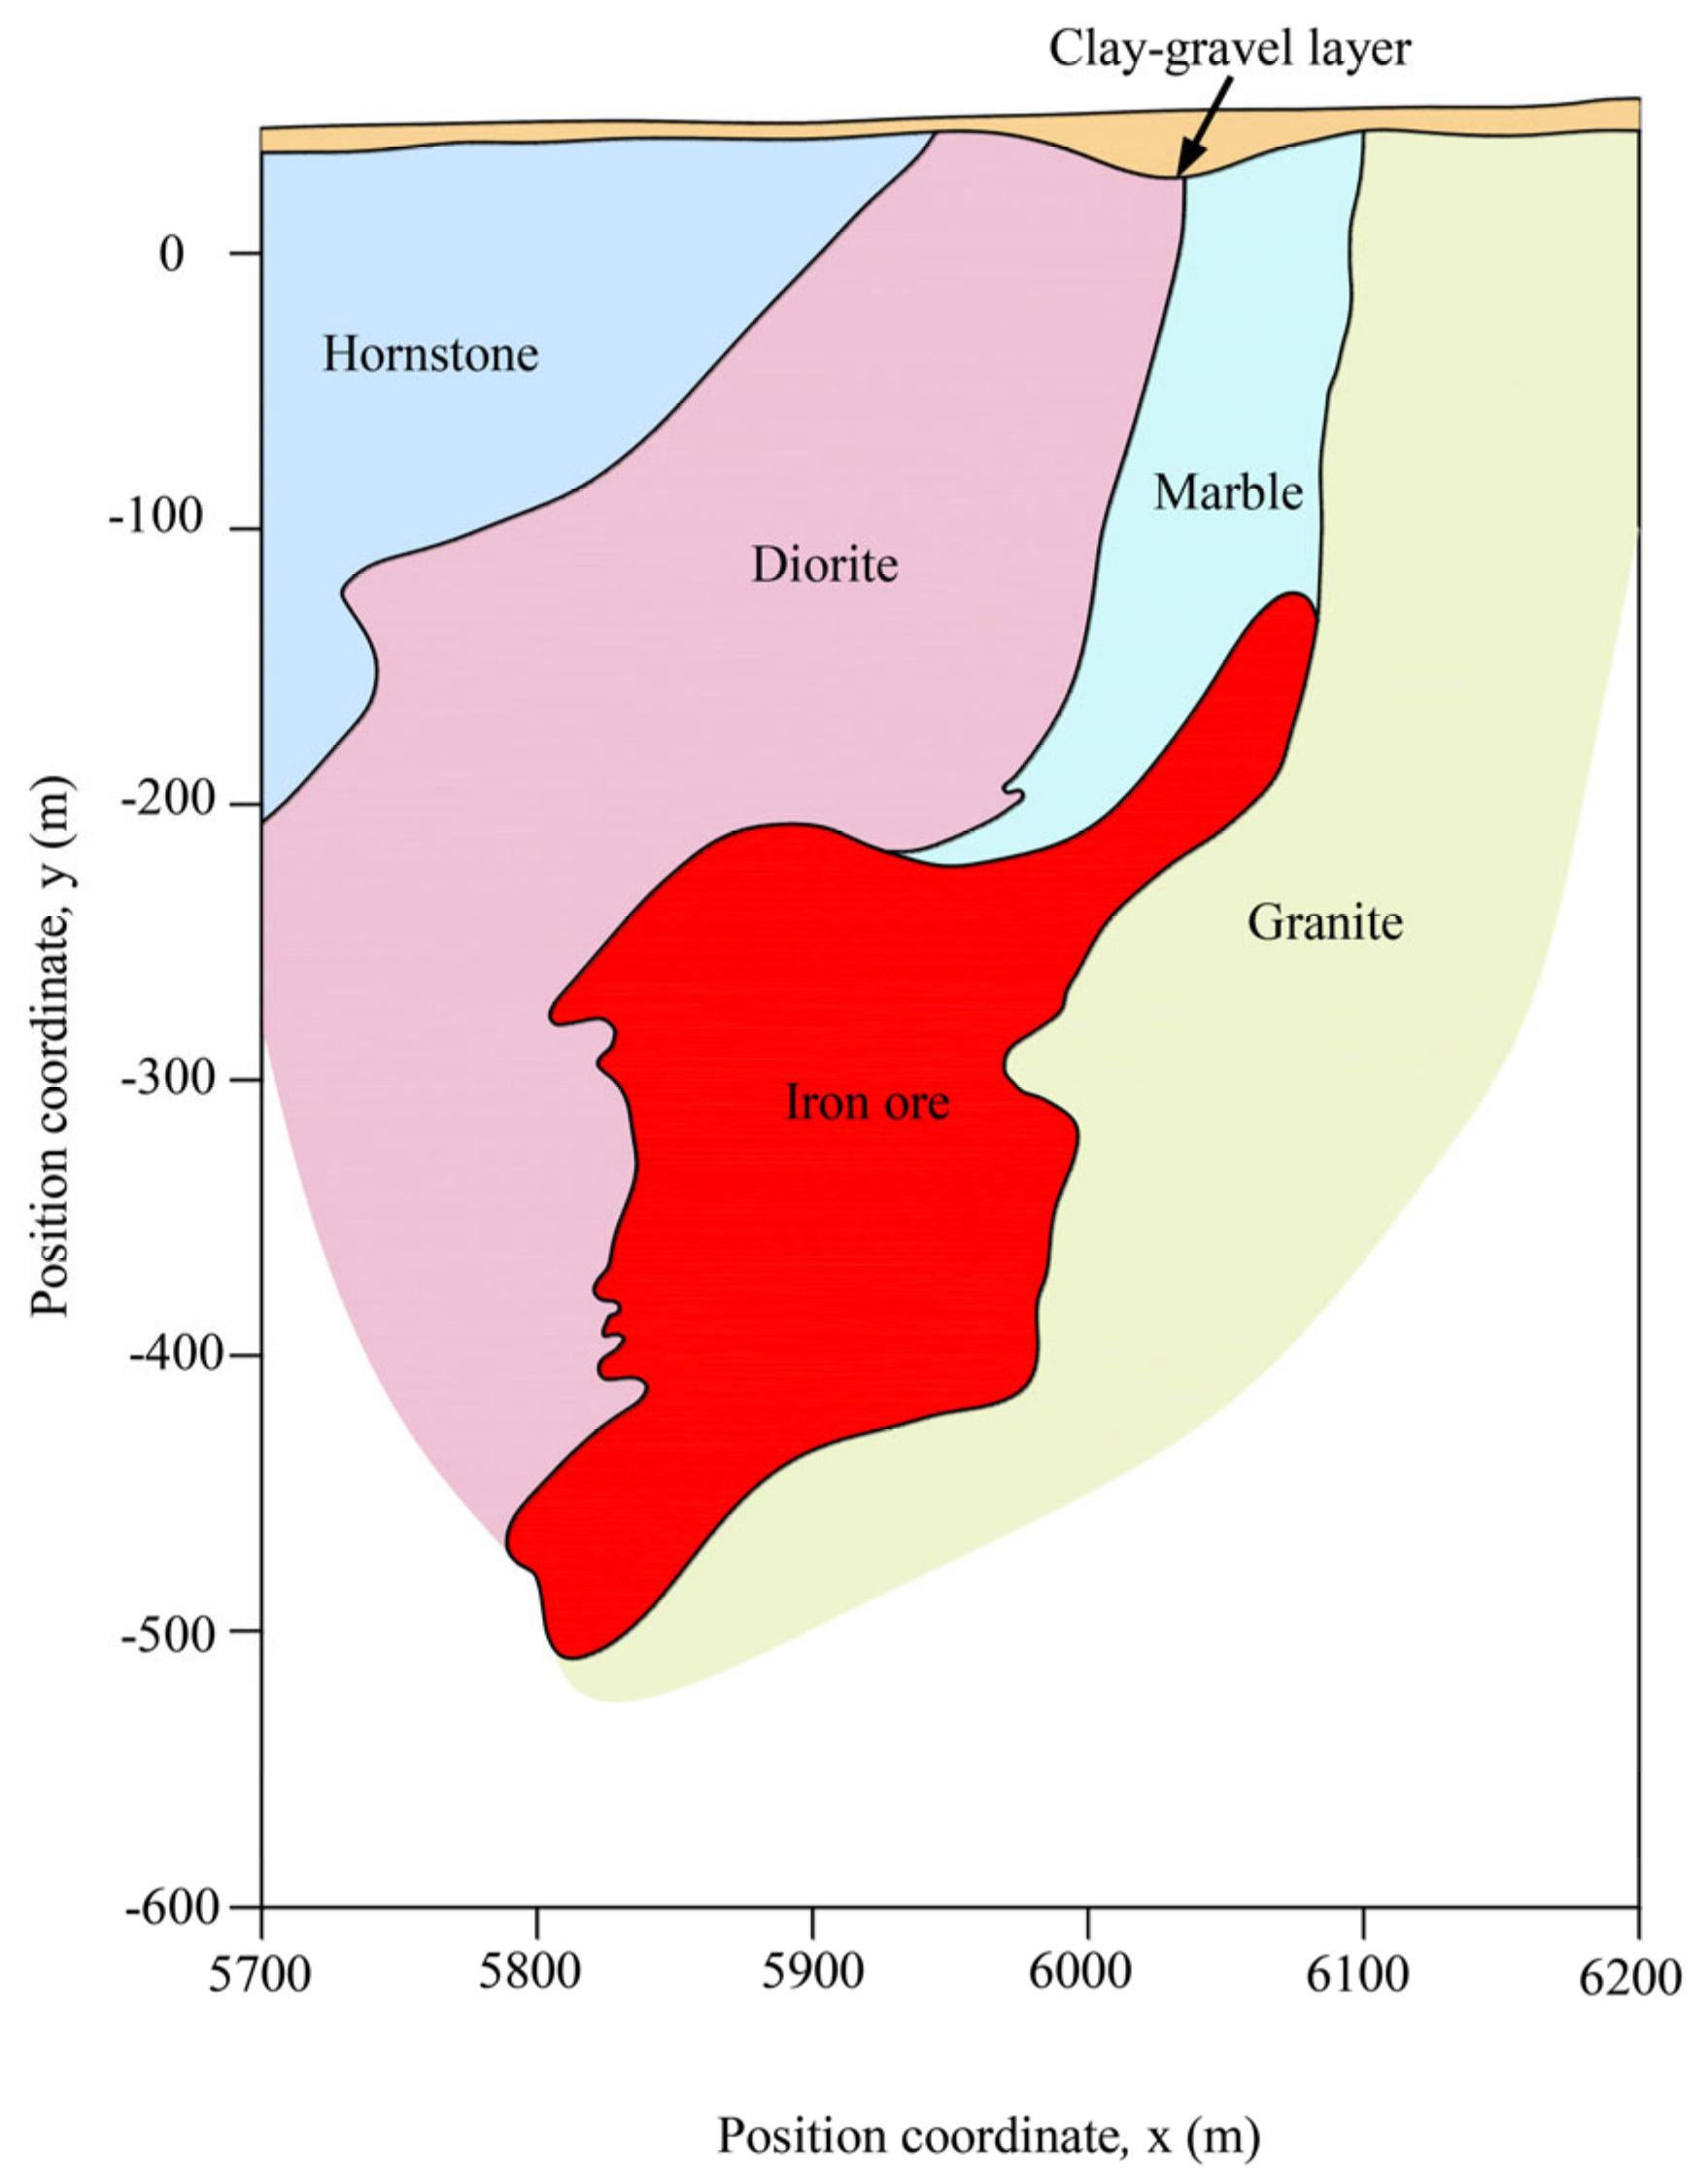
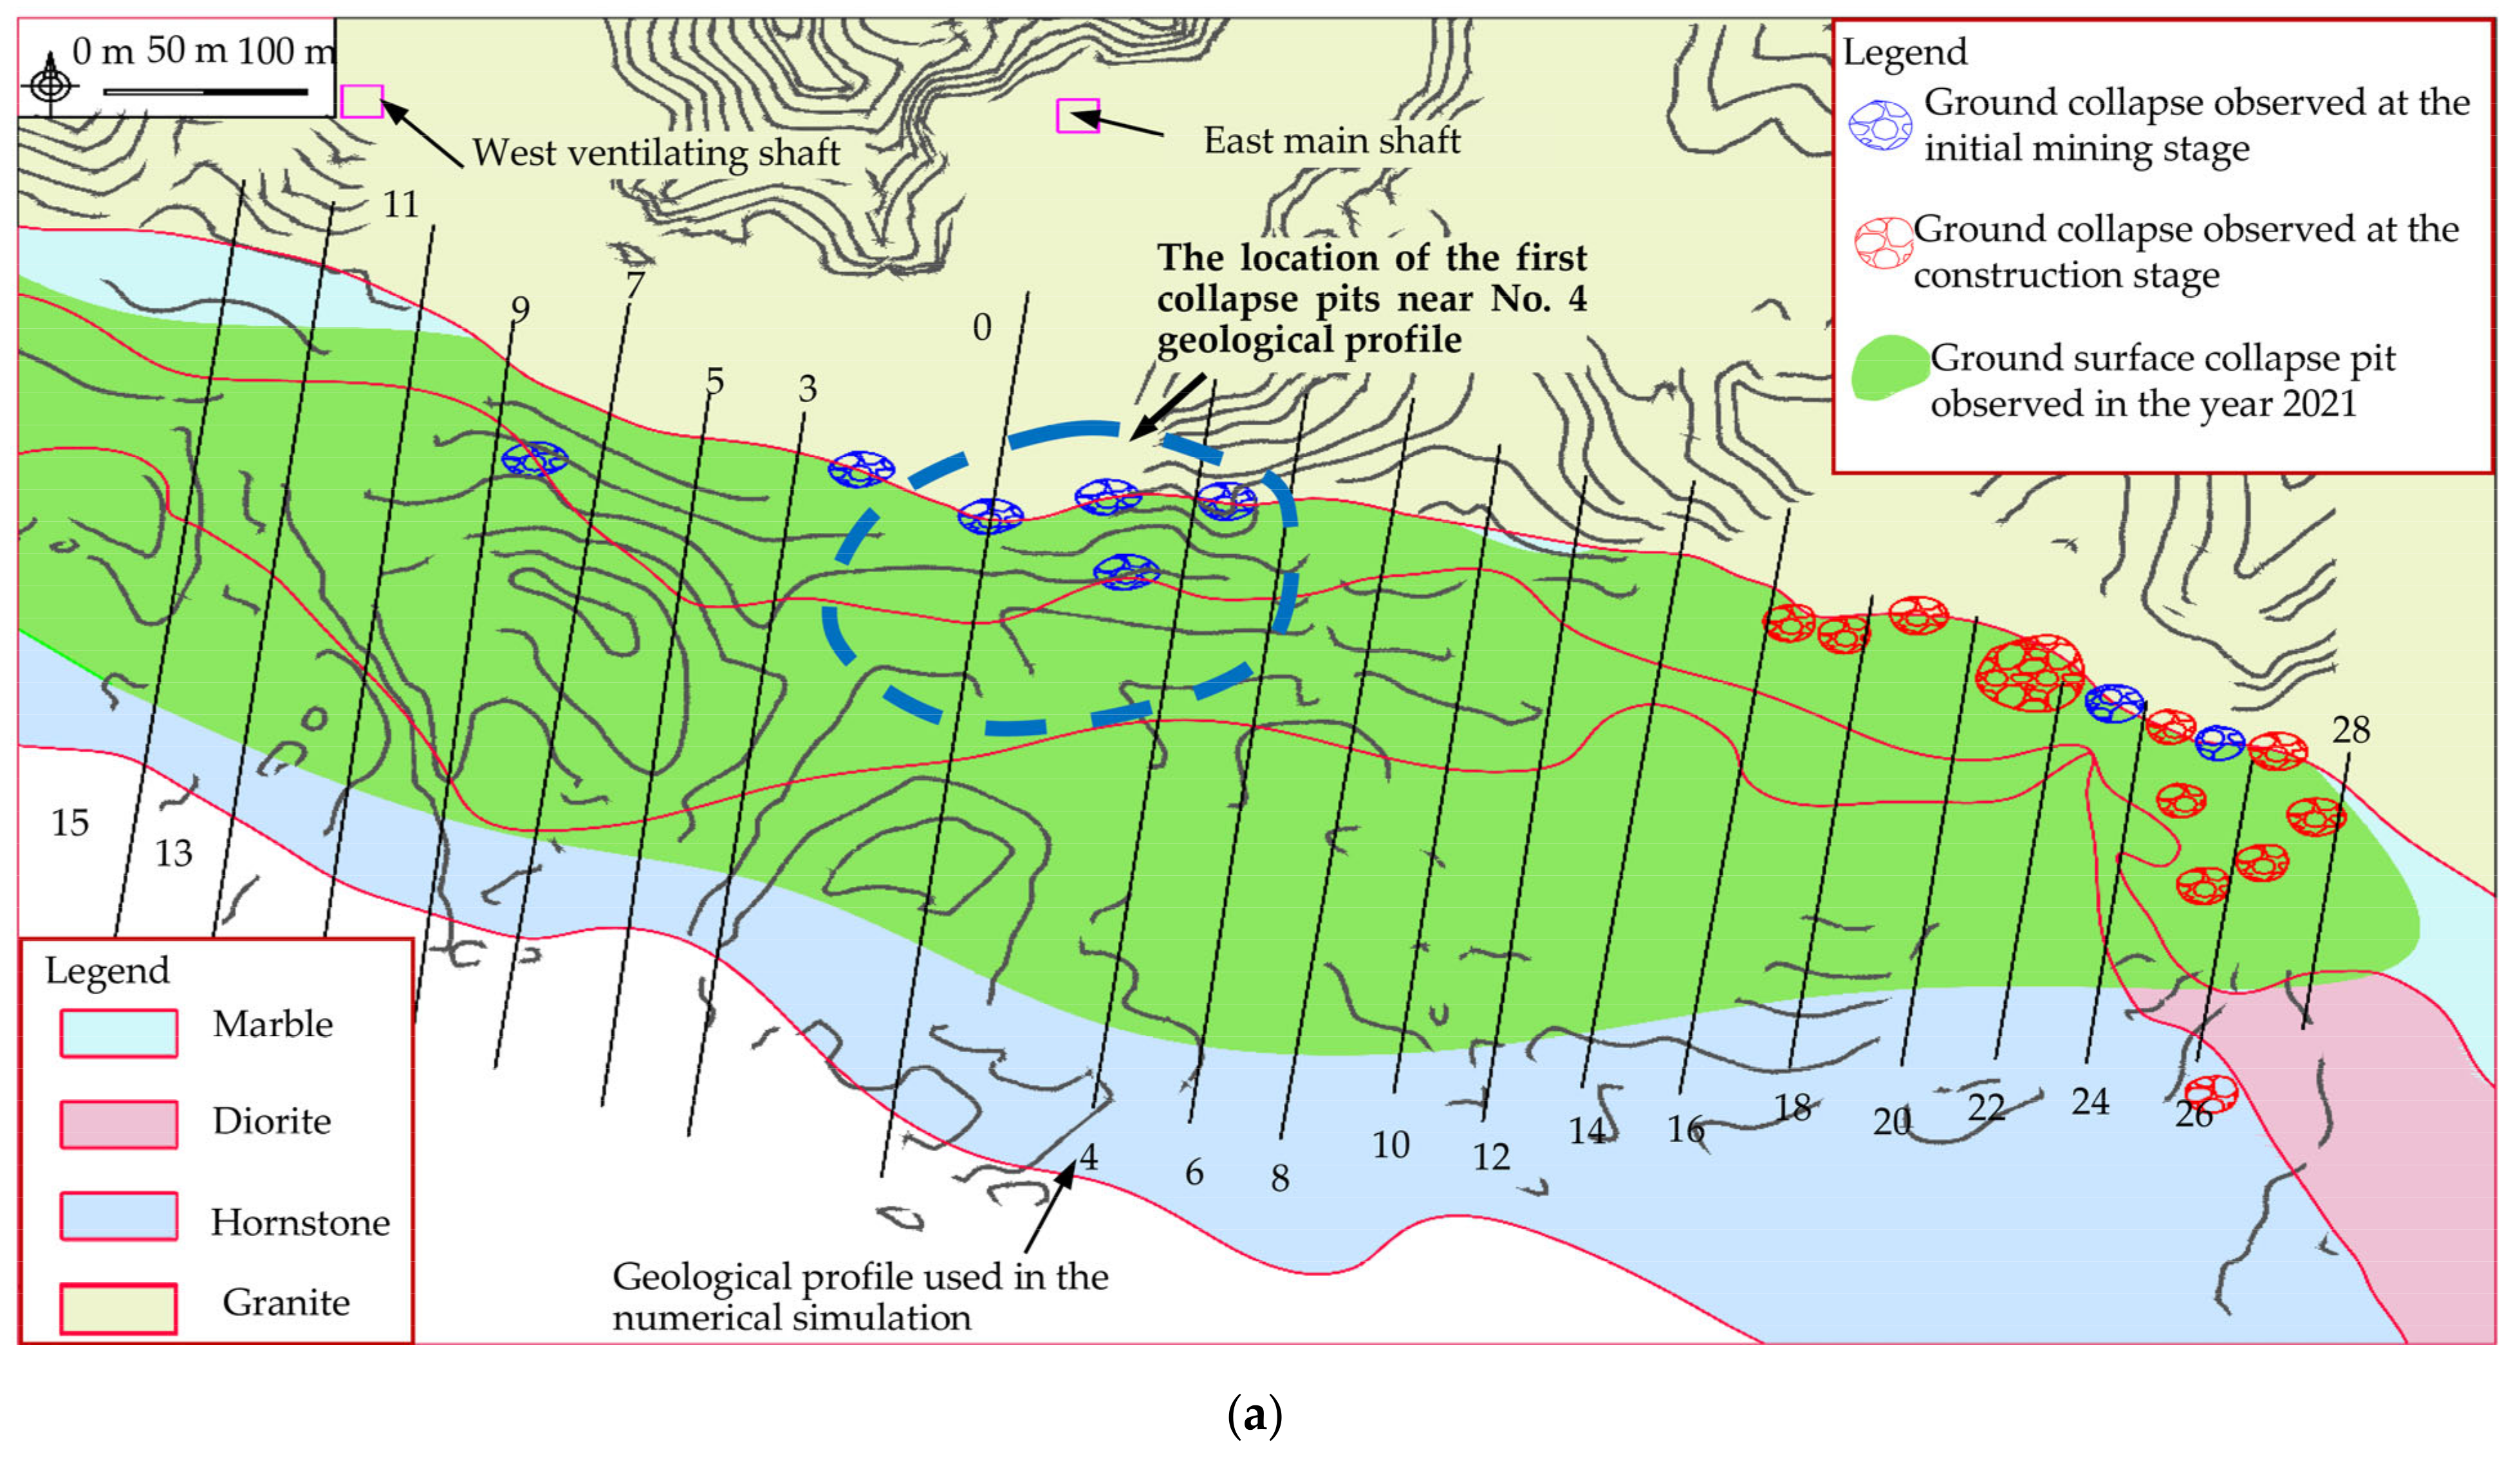
2.1. Engineering Geology

The Chengchao Iron Mine is located in Ezhou in Hubei Province, China. The mining area is about 2300 m long in the east–west direction and 800 m wide in the north–south direction. The mine produces about 2.8 million tons of ore per year, making it the third largest underground metal mine in China (after the Jingtieshan Iron Mine in Jiayuguan City, Gansu Province, China and Meishan Iron Mine in Nanjing City, Jiangsu Province, China).
Many scholars have discussed the engineering geological conditions in the Chengchao Iron Mine region in detail [36,37]. Therefore, in this section, only some of the most important issues of relevance to the numerical simulations are briefly discussed. The mining area can be divided into eastern and western areas by exploration line no. 15 (Figure 1). In the eastern area, line no. 4 was chosen for further study. The geological profile along this line is shown in Figure 2. The rock mass in the hanging wall is mainly comprised of hornstone (the metamorphic product of mudstone or sandy shale). The strata overlying the orebody are mainly composed of marble and diorite. In fact, as shown in Figure 2, the marble is sandwiched between diorite and granite and has a ‘funnel’ shape in the vertical profile. The width of the marble varies from 60 to 80 m. In Figure 1, it appears as a narrow stripe aligned in the ESE–WNW direction. According to on-site drilling data, the marble contains fissures that are highly developed.
The footwall in the mining area mainly consists of granite, and discontinuities are widely developed in the surrounding rock mass. Two dominant discontinuity sets (J1–J2) were found in the footwall through investigation of the geological outcrops and mining roadways, as illustrated in Figure 3. The first discontinuity set, J1, has an orientation of 74°∠82°. It is the most developed and shows high persistence, so it is simply referred to here as ‘one fully persistent discontinuity’. The discontinuity surfaces are rough, planar, and brown. The second discontinuity set, J2, has an orientation of 209°∠82°. It is developed and has medium persistence (the persistence of discontinuities is about 0.5). The discontinuity surfaces are rough and iron-stained. Some discontinuities in other orientations were also observed. However, compared to J1 and J2, these are not well-developed.

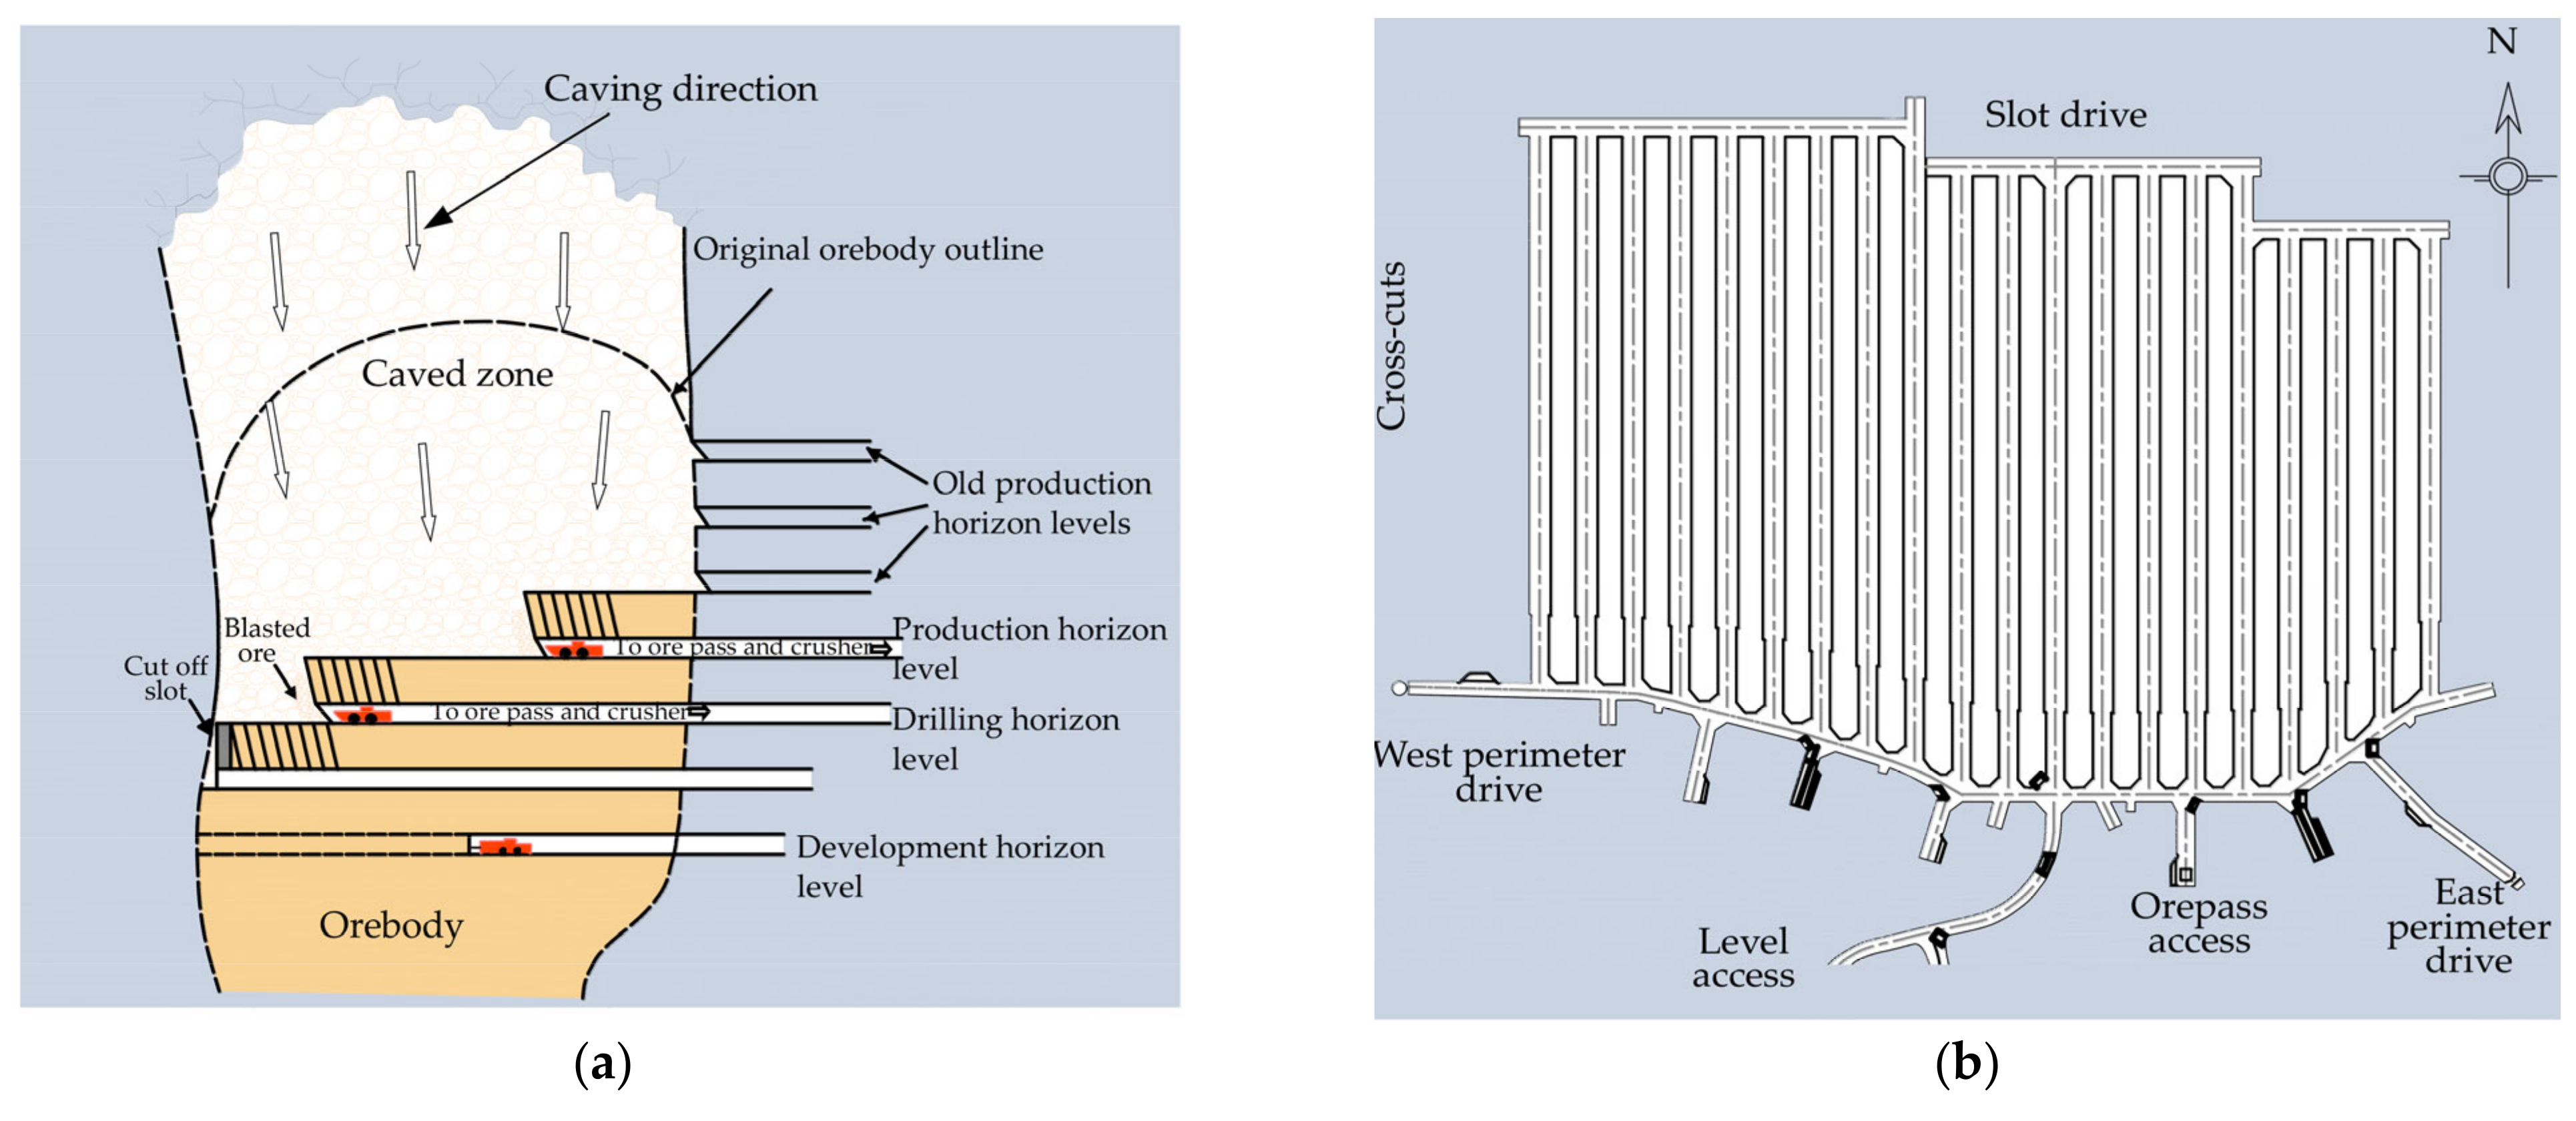
2.2. Mining Situation

Several orebodies can be found in the region (see Figure 1). The orebodies in the eastern part of the Chengchao Iron Mine (i.e., nos. I, II, III, and IV) have strikes in the NWW direction and dips in the SSW direction. The plans drawn up to mine the area specified that sublevel caving should be adopted to mine the orebody. This mining method utilizes a true caving technique, in that the aim of mining activity is to induce free displacement of the country rock overlying an orebody. The main conceptual components of sublevel caving are demonstrated in Figure 4. Mining progresses downwards in an orebody, with each old production horizon level being progressively eliminated as mining proceeds. Generally, the production horizon level consists of a series of sub-levels, and the phase height is between 60 to 80 m. The phase height is chosen to be 70 m and the sublevel interval varies from 10 to 12 m in the Chengchao Iron Mine. To improve the production capacity of the mine, the sublevel interval is increased to 14 m when mining the −218 to −358 m levels. Moreover, below the −358 m level, the sublevel interval is further increased to 17.5 m. The orebody in the eastern area was first mined in 1969. After more than 50 years of mining, the mined-out areas shown in Figure 5 have been formed. Further details of the mining schedule are presented in Table 1. As can be seen, the −80, −150, −220, −290, −360, and −430 m levels have been mined out. At present (up to June 2021), the −463 and −480.5 m levels are still being excavated.

3. Numerical Modeling

3.1. Numerical Method

The application of continuum theory in rock mechanics is limited due to the existence of discontinuities [39]. To solve this problem, discrete element methods were employed in media containing discontinuities. Based on the monitoring data, the area affected by strata movement in the Chengchao Iron Mine is about 2500 m in length and 1500 m in width. It is most reasonable to use three-dimensional numerical simulation software to explore the strata movement in the eastern area of the Chengchao Iron Mine. However, it is difficult for 3D numerical simulation in the case of a large geometrical domain requiring fine mesh discretization. The orebody in the study area is essentially strip-shaped, with a length along the strike direction of about 2000 m, and width along the normal direction of about 300 m. The lithology changes little along the strike direction of the ore body. Because of this geometry, the strata movement can be simplified to a 2D plane strain problem along the strike direction of the orebody. In particular, the discrete element software package UDEC (4.0 version, ITASCA Consulting Group, Minneapolis, MN, USA) has achieved good results in geotechnical engineering applications in recent years [40,41]. The orebody in the study area is essentially ‘strip-shaped’, with little change in lithology. This means that the rock masses can be treated as a simple 2D plane strain problem. Hence, a 2D numerical UDEC method is used in this study.

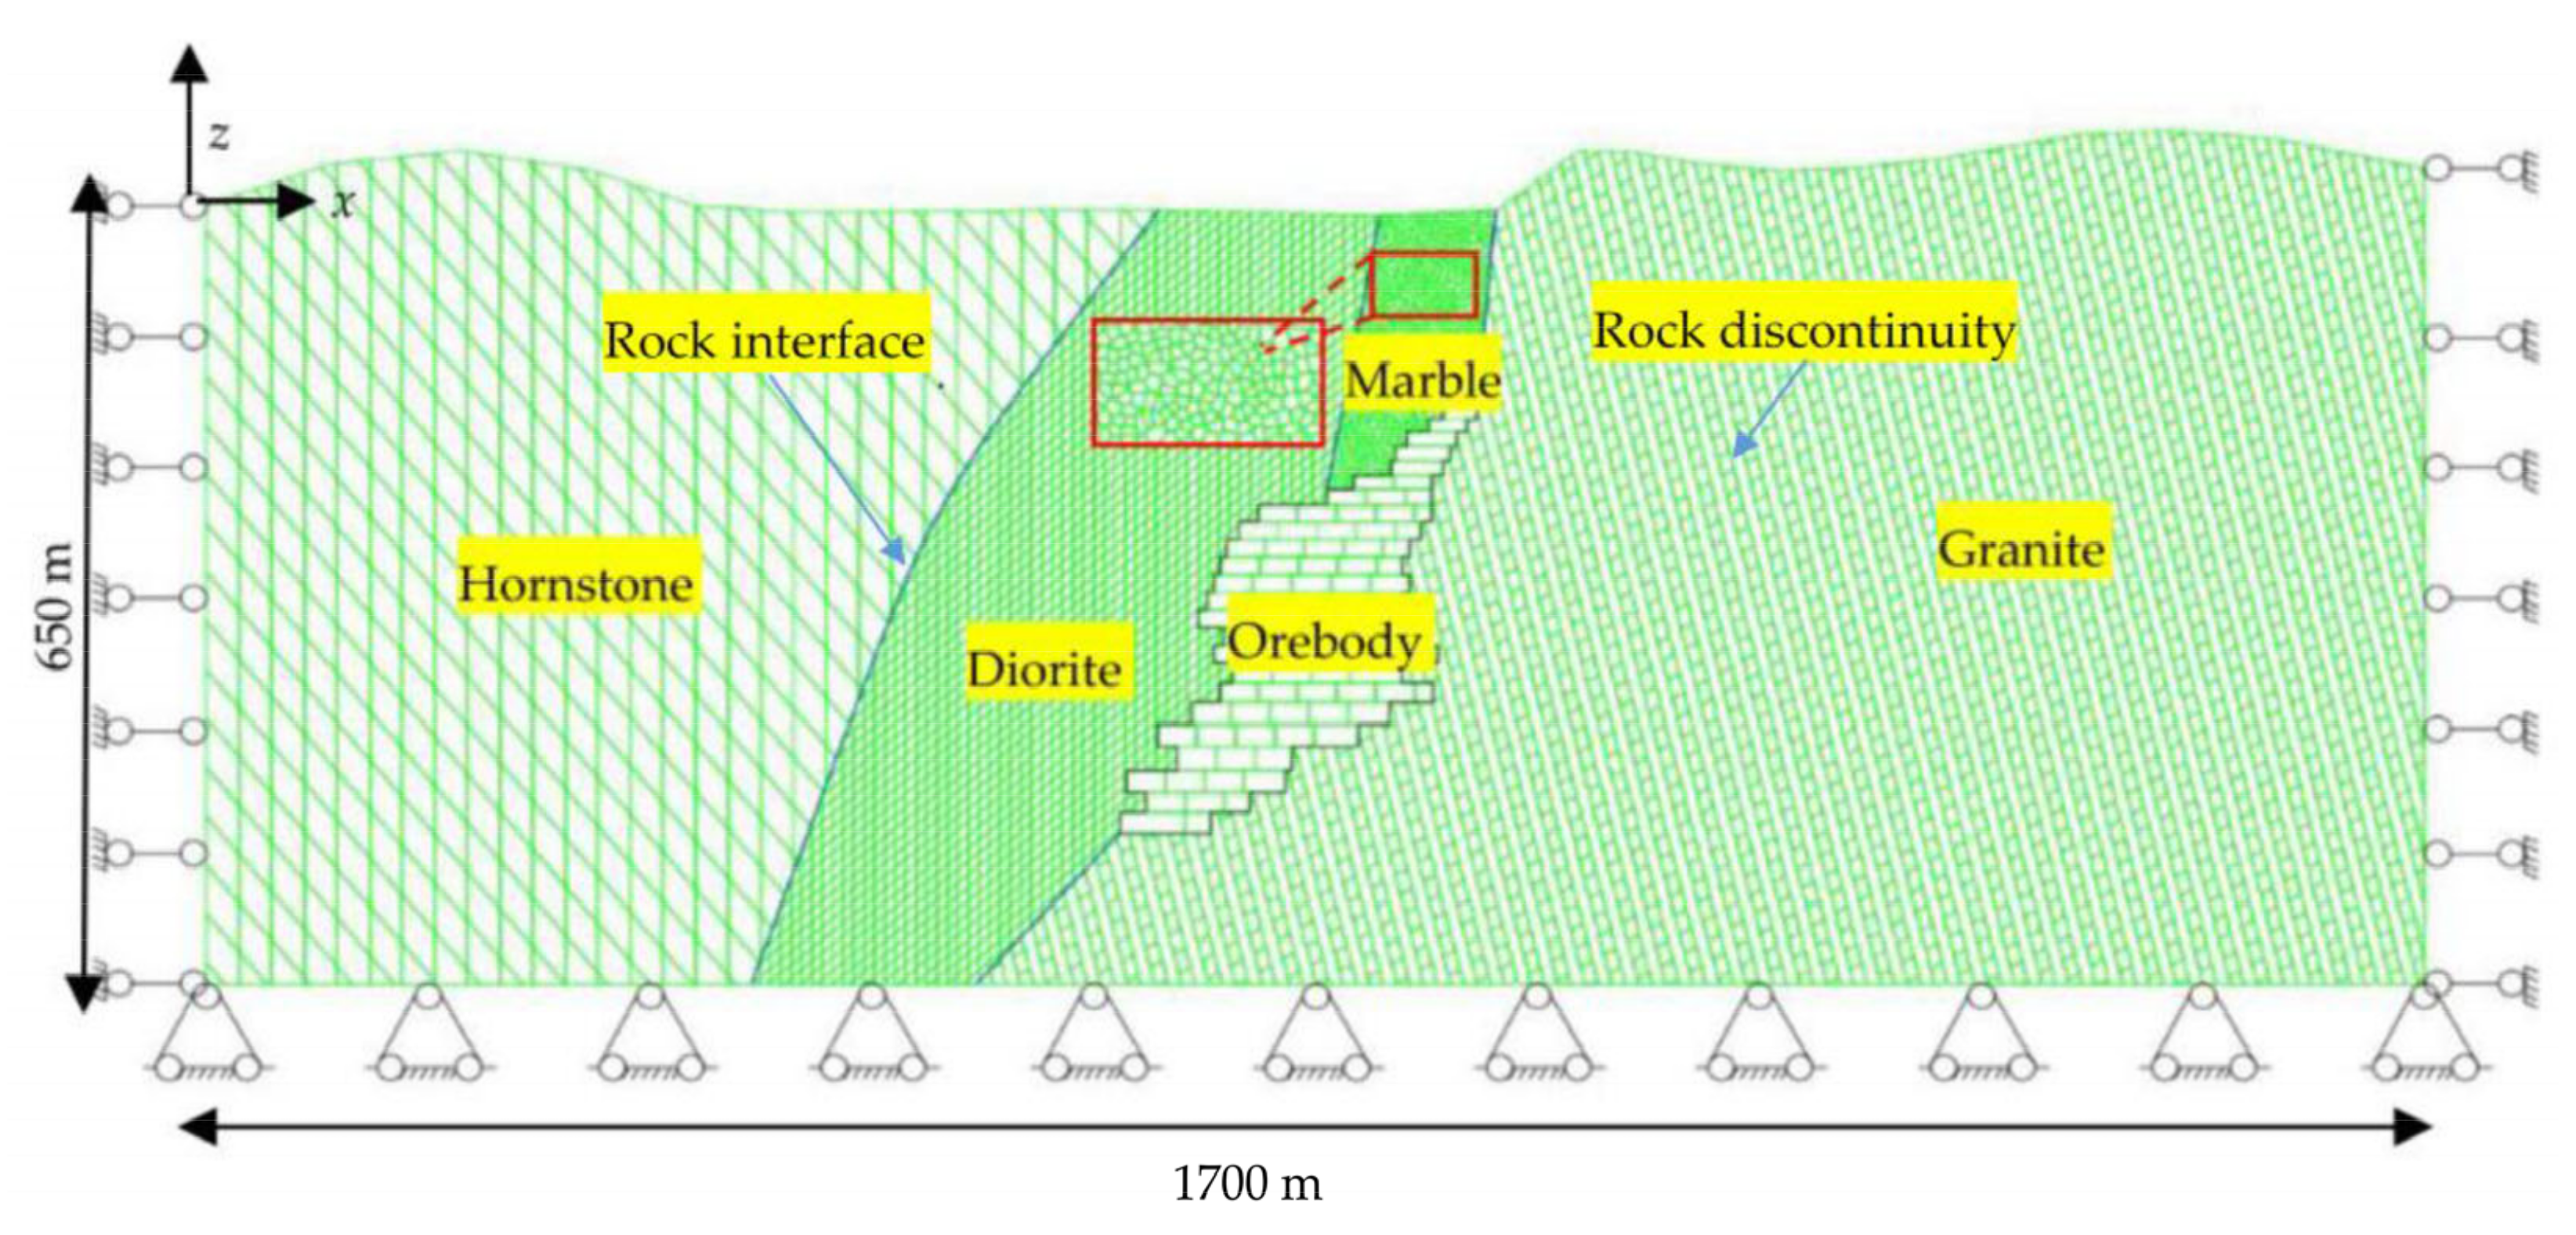
3.2. Modeling and In Situ Stress Field

Figure 6 shows the numerical model established using UDEC (which is based on the geological profile shown in Figure 2, i.e., that appropriate to exploration line no. 4). As can be seen, the model is 1700 m long and 650 m wide. The model aims to accurately reproduce the behavior of the hornstone, diorite, marble, granite, and orebody in the region. The boundary conditions of the model are as follows: the top surface is free, and the velocity of the bottom face is confined in the x- and z-directions. The velocity on two sides of the numerical model is confined in the x-direction.
To ensure a stable response from the computational model, a modified FISH function “ZONK.fis” is utilized. More specifically, “ZONK.fis” can detect the interior boundaries of the excavation and gradually release the forces thereon. The release factor R is the key parameter that controls this process and ranges from 0 to 1. An R value of 0.2 is chosen herein, indicating that there are five relaxation stages and 20% of the force applied to an excavation boundary is released in each one. This function in UDEC is mainly applied to the excavation of underground spaces. Considering the complexity of the mined-out area, an advance of the working face of 20 m is regarded as a mining step. In this paper, the mining of the orebody in the −150 to −480 m levels is simplified into 86 steps. Table 2 illustrates a relationship between excavation steps and mining levels in the numerical model. As shown in Table 2, mining the −150 m level orebody corresponds to the first step in the numerical simulation; mining the −232 m level orebody corresponds to the eleventh to fifteenth steps in the numerical simulation, etc.
The granite in the numerical model features two main sets of discontinuities: one that is of high persistence and steeply dipping and one that is of medium persistence and gently dipping. The fissures in the marble are highly developed and it is difficult to describe the distribution characteristics of the discontinuities. Therefore, Voronoi blocks are utilized in the UDEC model to account for the irregular nature of the discontinuities. The specific geometric parameters and distributions of the discontinuities in the model are listed in Table 3.
The Chengchao Iron Mine has suffered from intensive tectonic movement, and the in situ stress test results can be summarized as follows:
  • The direction of the maximum principal stress σ 1 in the mining area is consistent with the strike of the orebody (N 85° to 75° W). The measured value of σ 1 is 1.1704 to 1.6296   γ z , with a mean average value of 1.274   γ z (where γ and z are the unit weight of rock mass and the depth below ground surface).
  • The direction of the intermediate principal stress σ 2 is found to be perpendicular to the strike of the orebody. In the deep parts, the intermediate principal stress is close to the vertical stress caused by the effect of gravity on the rock masses.
  • The direction of the minimum principal stress σ 3 is found to be perpendicular to the strike of the orebody. The measured value of σ 3 is 0.59 to 0.926   γ z , with a mean average value of 0.758   γ z .
In the numerical model (Figure 6), the x-axis corresponds to the strike direction of the No. 4 exploration line, the y-axis is perpendicular to exploration line No. 4, and the z-axis points vertically upwards. A modified FISH function ‘Stress.field’ is used in this paper. This function in UDEC is mainly applied to apply stress to each zone. The in situ stress field in the numerical model therefore takes the following form:
σ x = k x γ z
σ y = k y γ z
σ z = γ z
where kx and ky are the horizontal pressure coefficients along the x- and y-directions, respectively. The actual values of kx and ky are 1.0 and 1.4, respectively.

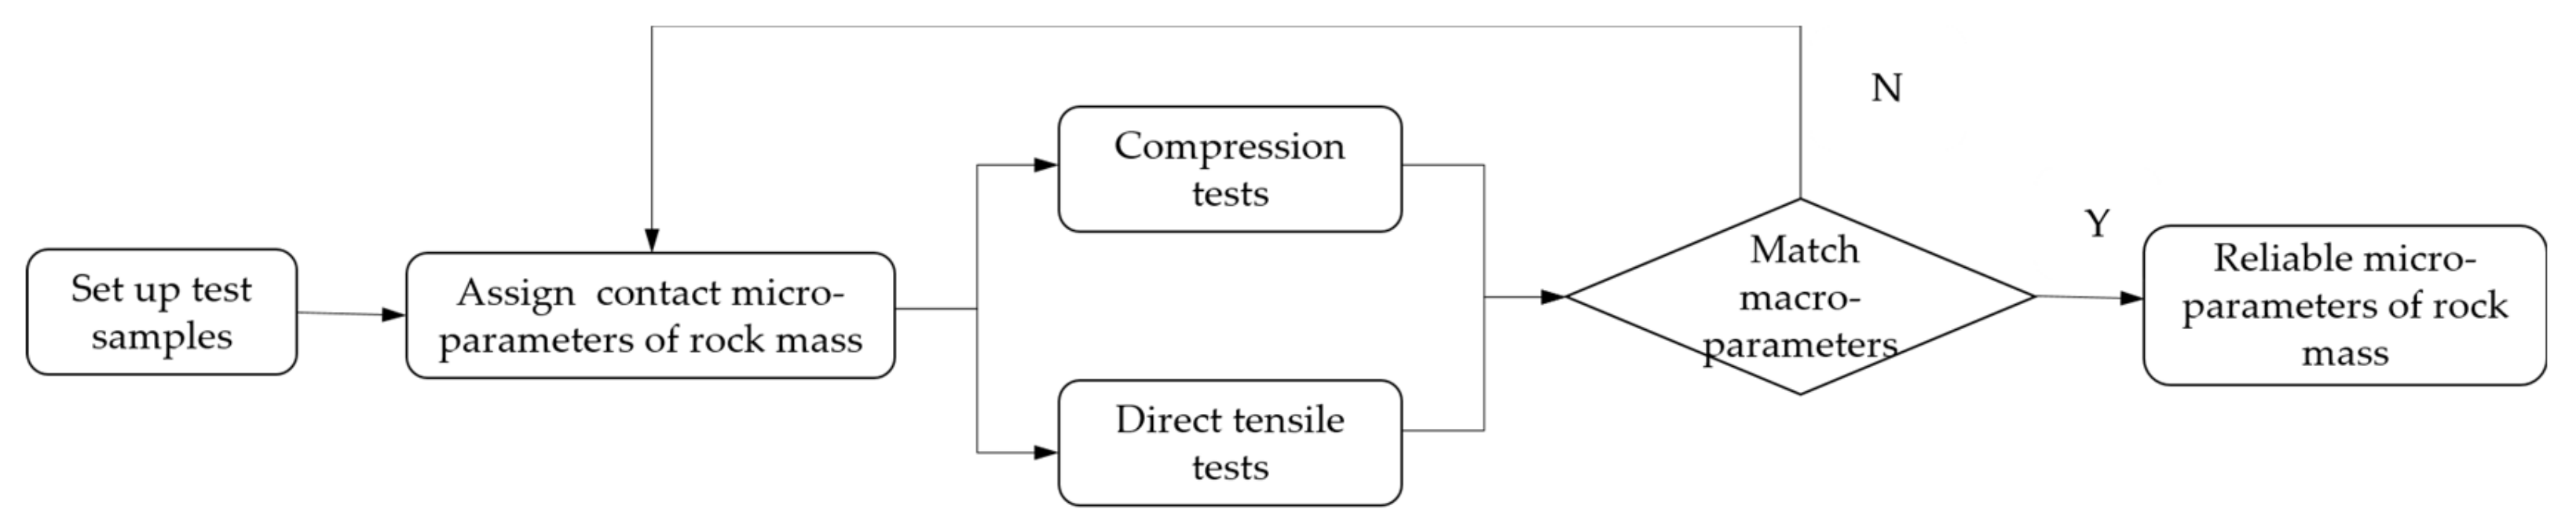
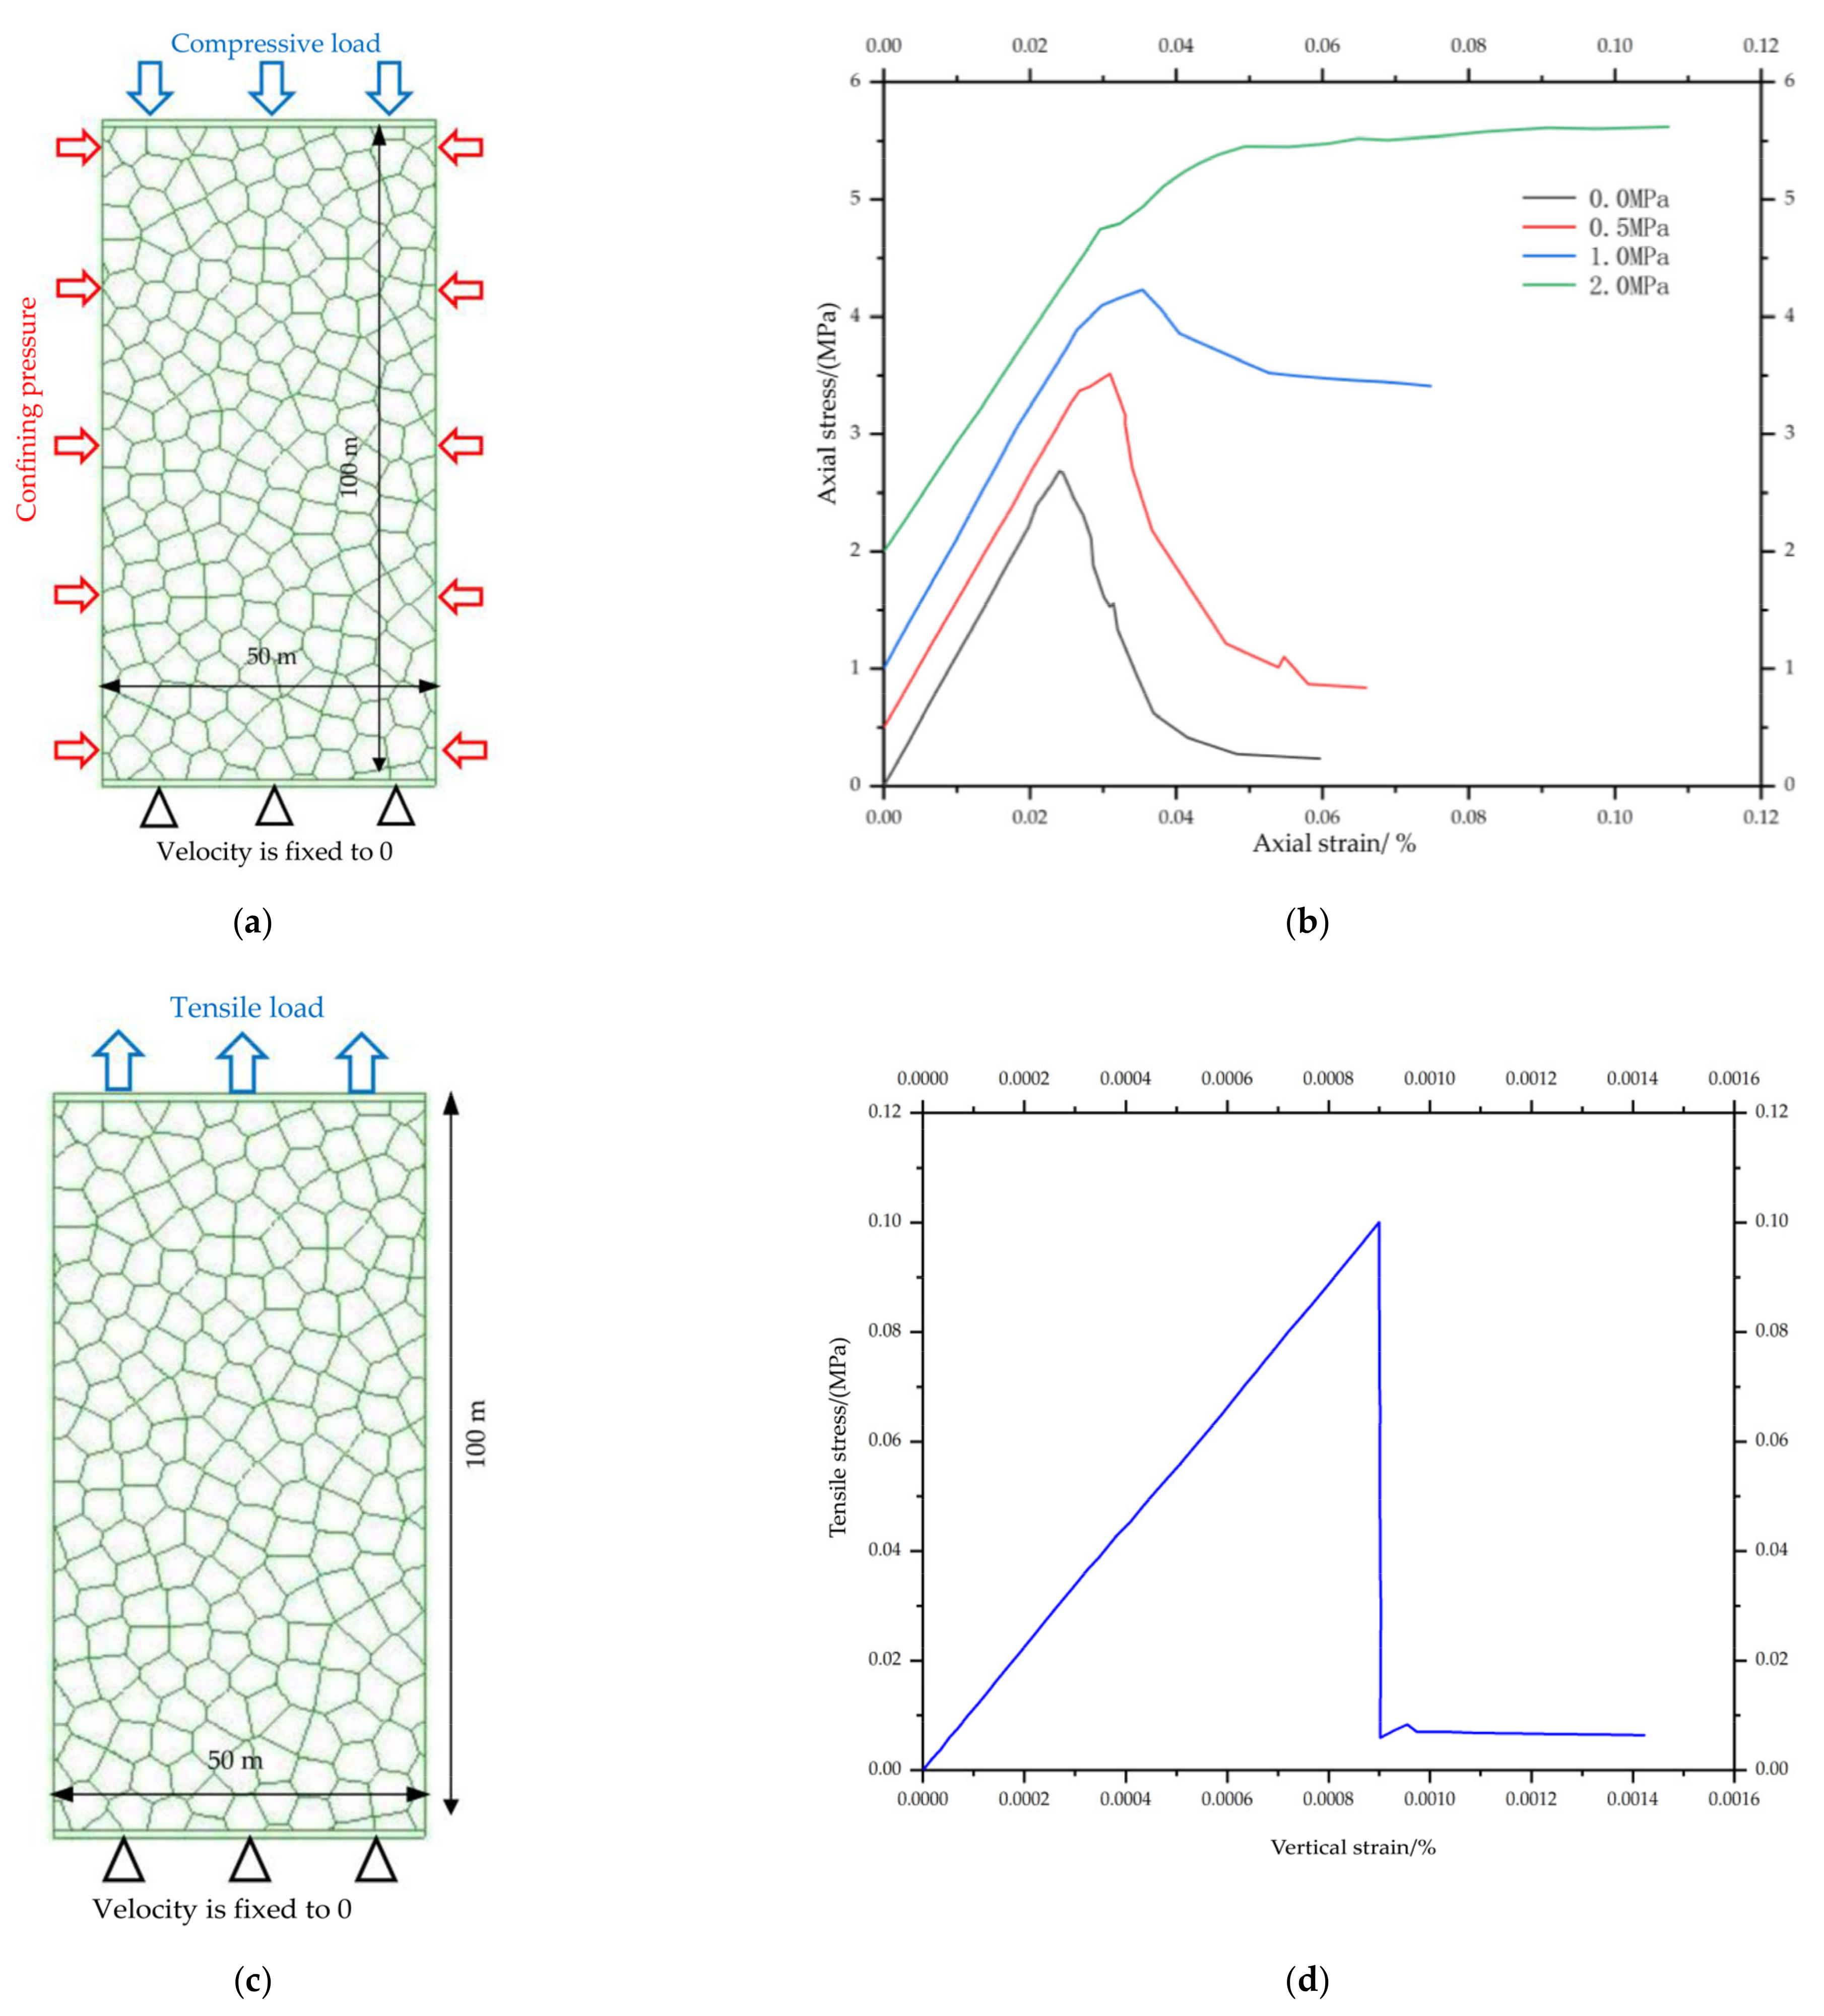
3.3. Calibration of the Rock Mass Parameters

The Mohr–Coulomb constitutive model was adopted to describe the mechanical behavior of the rock masses. The presence of joints changes the mechanical parameters of rock massed and intact rock. Based on many laboratory tests on small specimens (50 mm × 100 mm), the mechanical parameters of the intact rock were determined. The mechanical parameters of the rock mass could be calculated using the Hoek–Brown failure criterion [42,43]. More specifically, the value of GSI, the Hoek–Brown constant (mi), and the disturbance factor of the rock mass (D) were determined based on geological investigations and excavation characteristics. Then, the cohesion and friction angle of the rock mass were obtained by fitting the non-linear Hoek–Brown strength parameters using RocLab software (1.010 version, Rocscience, Toronto, ON, Canada). Finally, the mechanical parameters of rock mass were determined in Table 4.
A Coulomb slip model incorporating residual strength was used for the discontinuities. The strength parameters of the discontinuities were determined by laboratory testing. Compared to the strength parameters, it is difficult to determine the normal stiffness (kn) and shear stiffness (ks) of the discontinuities. Although UDEC does provide expressions to calculate the values of kn and ks,
k n = m K + 4 3 · G Δ z min ,   1   m   10
k s = k n G E
these parameters have been found to adopt a large range of values.
The monitoring data pertaining to the ground–surface displacement are used to conduct back-analysis to derive more reliable values for the stiffness parameters in this paper. More specifically, monitoring points A31 and C03 are located near the east main shaft (Figure 1), and their locations could be found in the UDEC model. The cumulative horizontal deformation of monitoring points A31 and C03 from March 2012 to March 2017 was 397.77 cm and 119.23 cm, and it corresponds to the excavation stage from −393.0 m to −410.0 m levels in the numerical model. By referring to Equations (4) and (5), many back-analysis calculations were performed to simulate the mining of −393.0 m to −410.0 m levels in the numerical model. When the stiffness parameters of discontinuities listed in Table 5 were specified, the error rates of measuring points A31 and C03 between the calculated horizontal displacement and the measured horizontal displacement from March 2012 to March 2017 were minimal (Table 6); therefore, the stiffness parameters of discontinuities listed in Table 5 were used herein.
The Voronoi approach was used to calibrate marble, and the mechanical properties of marble were determined by many Voronoi blocks. In the Voronoi approach, an elastic model is used to describe the mechanical behavior of the Voronoi blocks, and a Coulomb slip model is adopted to describe the contact between them. Thus, the microparameters of Voronoi blocks are composed of block properties and contact properties (Table 7). More specifically, the deformation behavior of each Voronoi block is controlled by the bulk moduli of the block, its shear moduli, and the normal and shear stiffnesses of the contact. Rock failure is controlled by the occurrence of contact failure. Shear or tensile failure can occur if the shear or tensile stress exceeds the contact strength. Thus, the strength of rock mass is controlled by cohesion, friction angle, and tensile strength of the contacts.
The process of calibrating microparameters is illustrated in Figure 7. As shown in Figure 7, the first step is to establish calibration model of direct tensile tests and compression tests. Figure 8a,c illustrates models of the compression test and tensile test. To reduce boundary effects, the dimensions of the test samples used should be at least 10 times the size of the Voronoi block. Thus, rectangular test samples measuring 50 m × 100 m were adopted in this work (as the average size of Voronoi block is 5 m). Secondly, a typical value of each microparameter was assigned to the test samples. Then, a series of numerical tests in compression and direct tension were conducted iteratively until the simulated test results were consistent with the macroparameters of the marble, as listed in Table 4 [44].
More specifically, the deformation moduli and shear stiffness of the block contacts were obtained by conducting a series of unconfined compression tests. As for the friction angle and cohesion of the contacts, they can be determined by conducting a series of confined compression tests. Based on a series of confined compression tests in Figure 8a, the strength envelope can be obtained from a regression analysis of the compressive strength for the various confining pressures. On this basis, the friction angle (φ) and cohesion of the contacts can be obtained from the gradient (m) and vertical intercept (b) of the strength envelope curve with reference to Equations (6) and (7) [45]:
φ = arcsin ( m 1 m + 1 )
c = b ( 1 sin φ 2 cos φ )
The tensile strength of the contacts could also be acquired by a series of tensile tests in Figure 8c. The final deformation and strength characteristics obtained are shown in Figure 8b,d. Finally, the most appropriate microparameters for the blocks and contacts in the UDEC Voronoi model were calibrated (Table 7).

4. Results

When metal mines are mined using sublevel caving, the strata do not move very much in the early mining stages. As the orebody is continuously mined, however, the overlying strata continuously fall, and collapse pits are formed on the ground surface. It was also found that there is an obvious difference in the movement of the strata before and after the formation of the collapse pits. The formation of a collapse pit leads to stress release, and this accelerates the rate at which the strata move. The calculation results suggest that the movement of the strata in the footwall in the eastern part of the Chengchao Iron Mine can be divided into two stages. These are referred to as the arch caving development stage (ACDS) and post arch caving development stage (PACDS). The latter stage, PACDS, can be further subdivided into a flexural-toppling stage and deep rock mass failure stage.

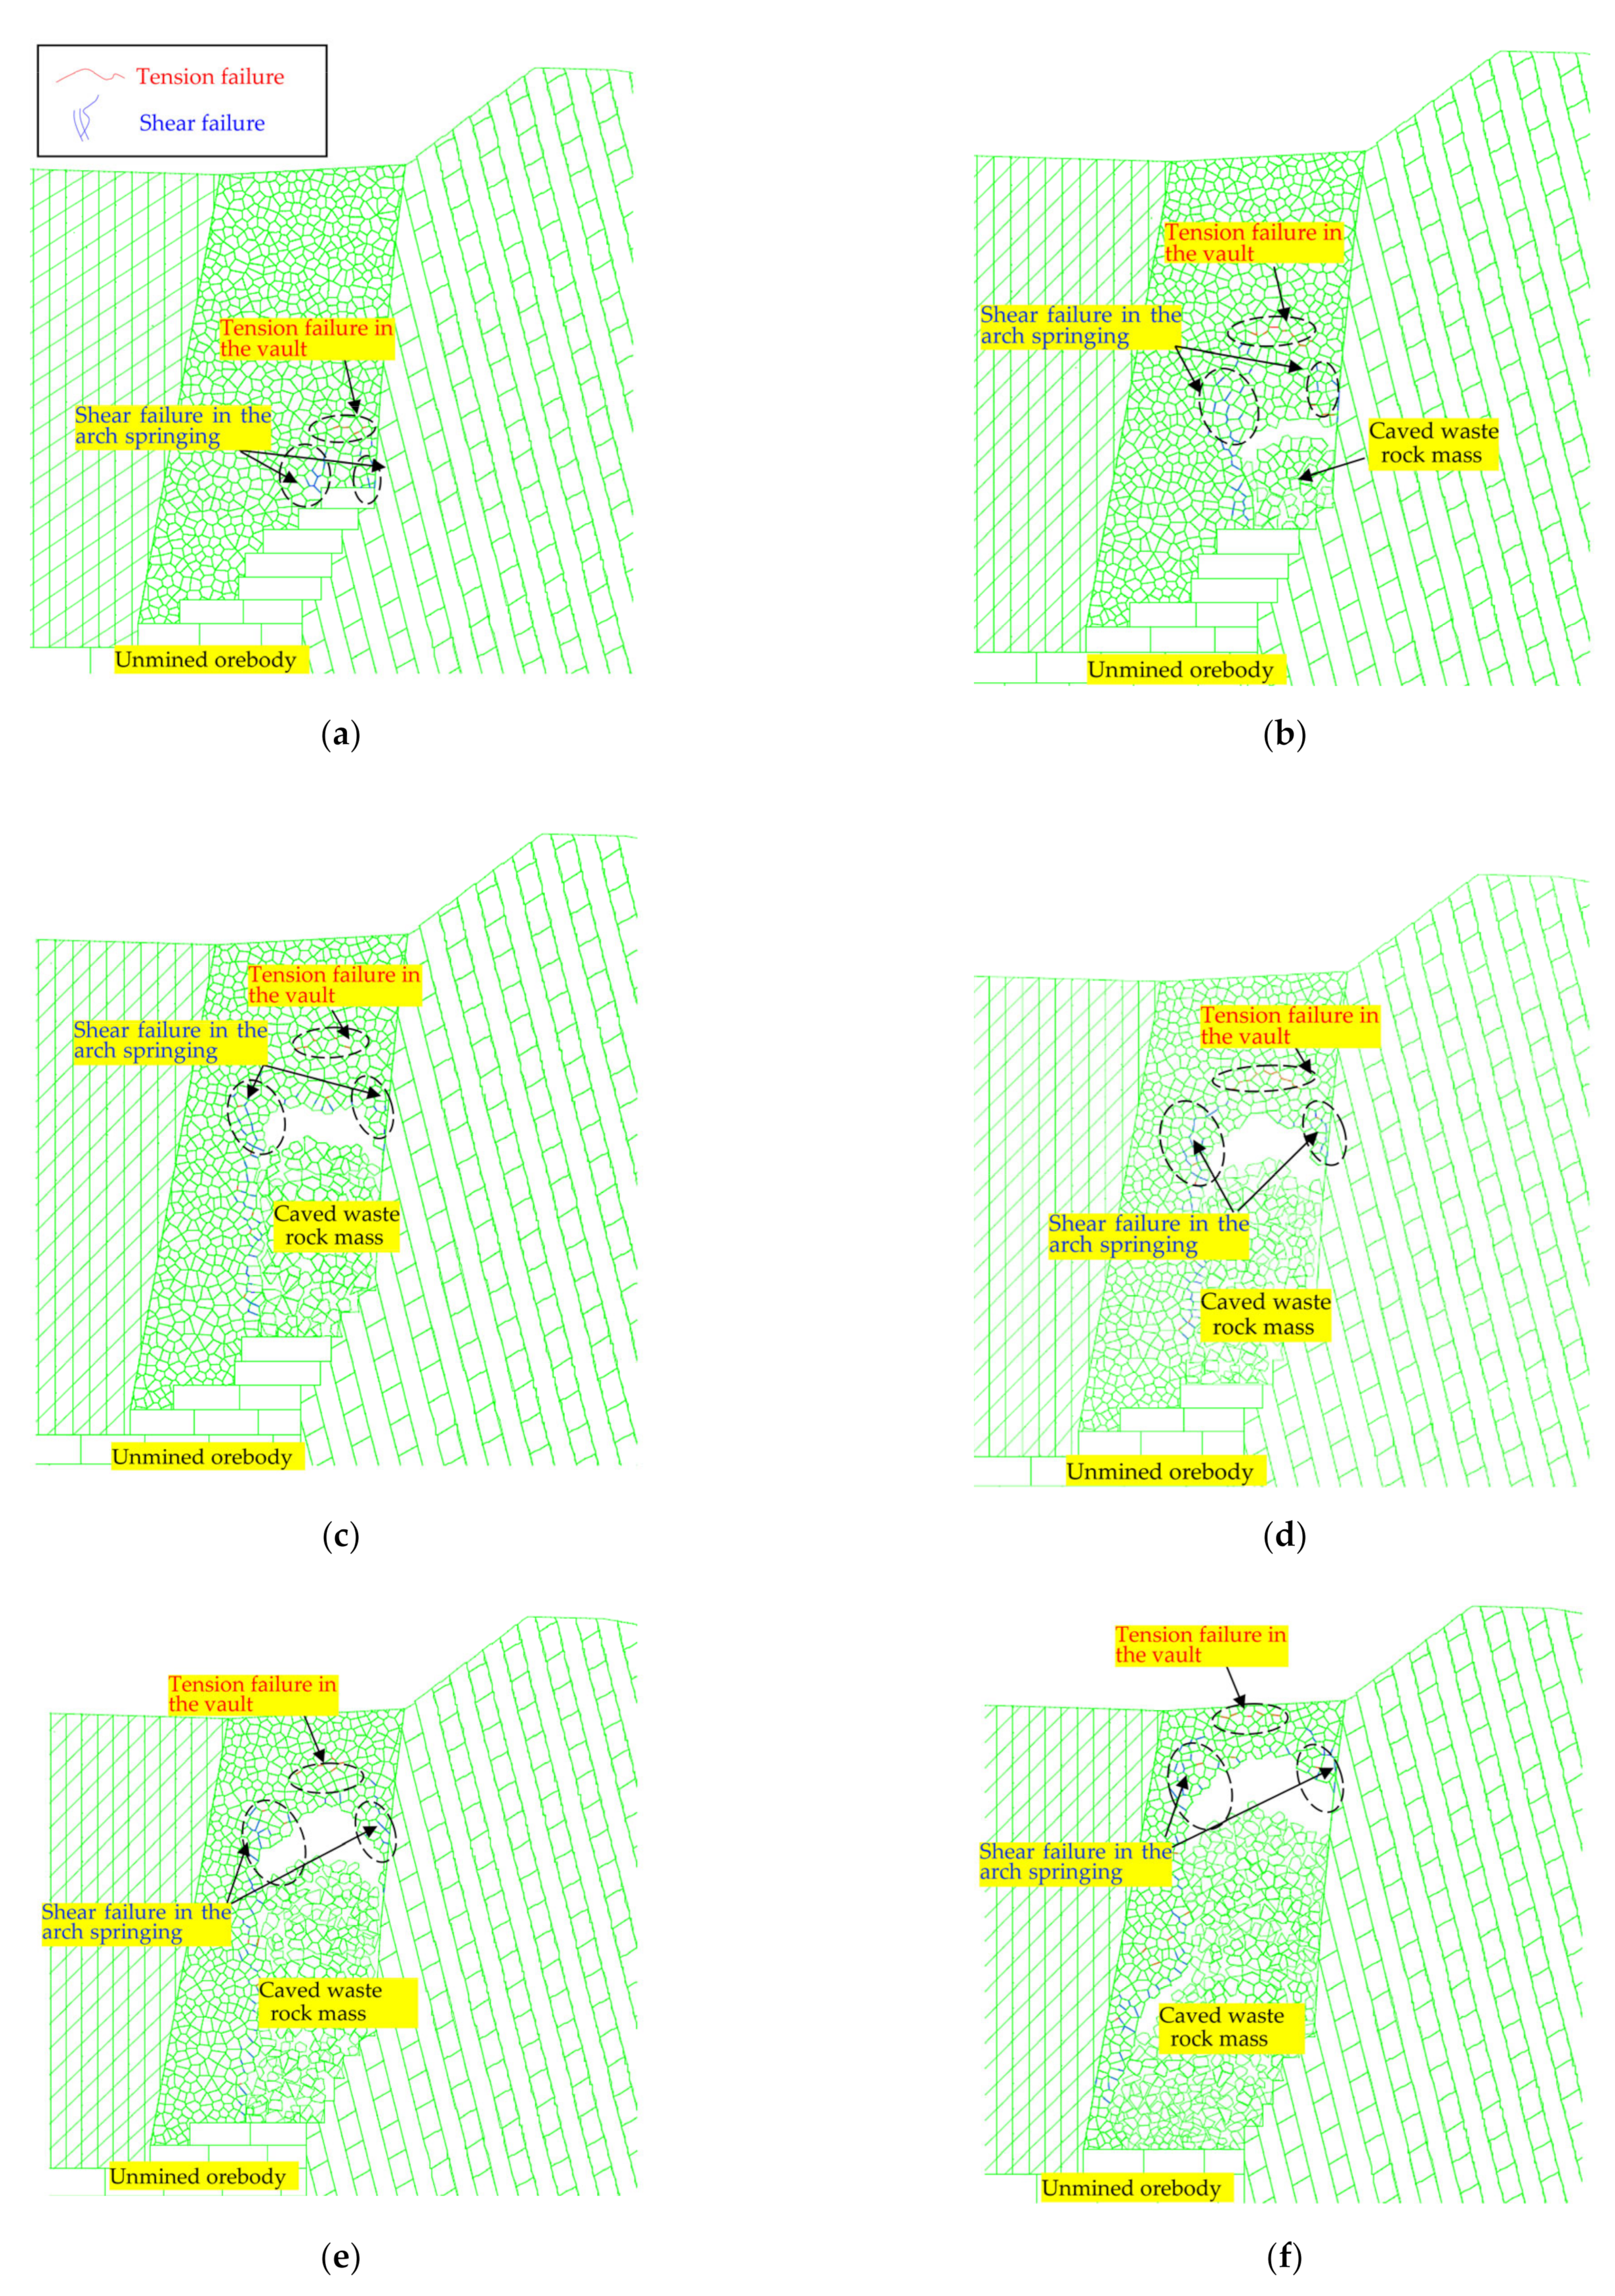
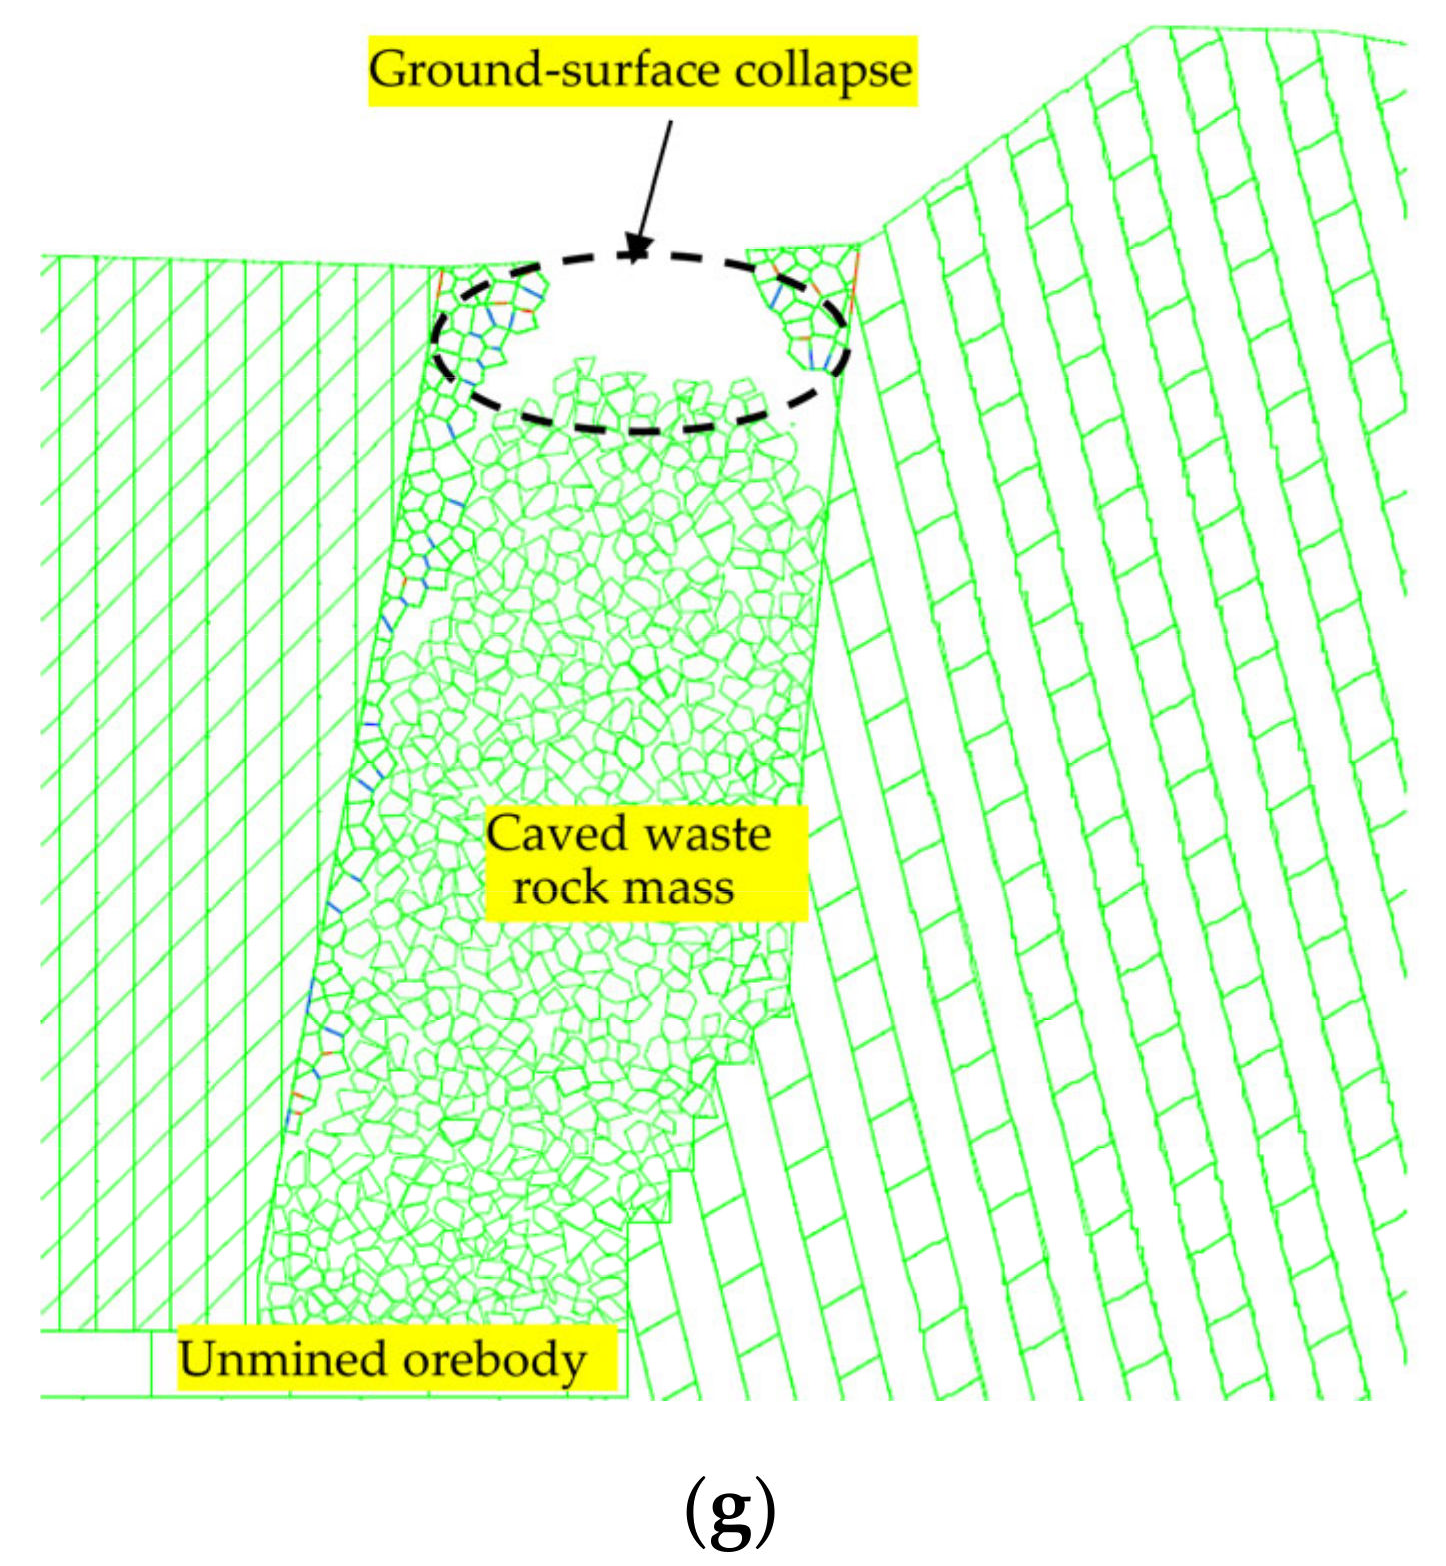
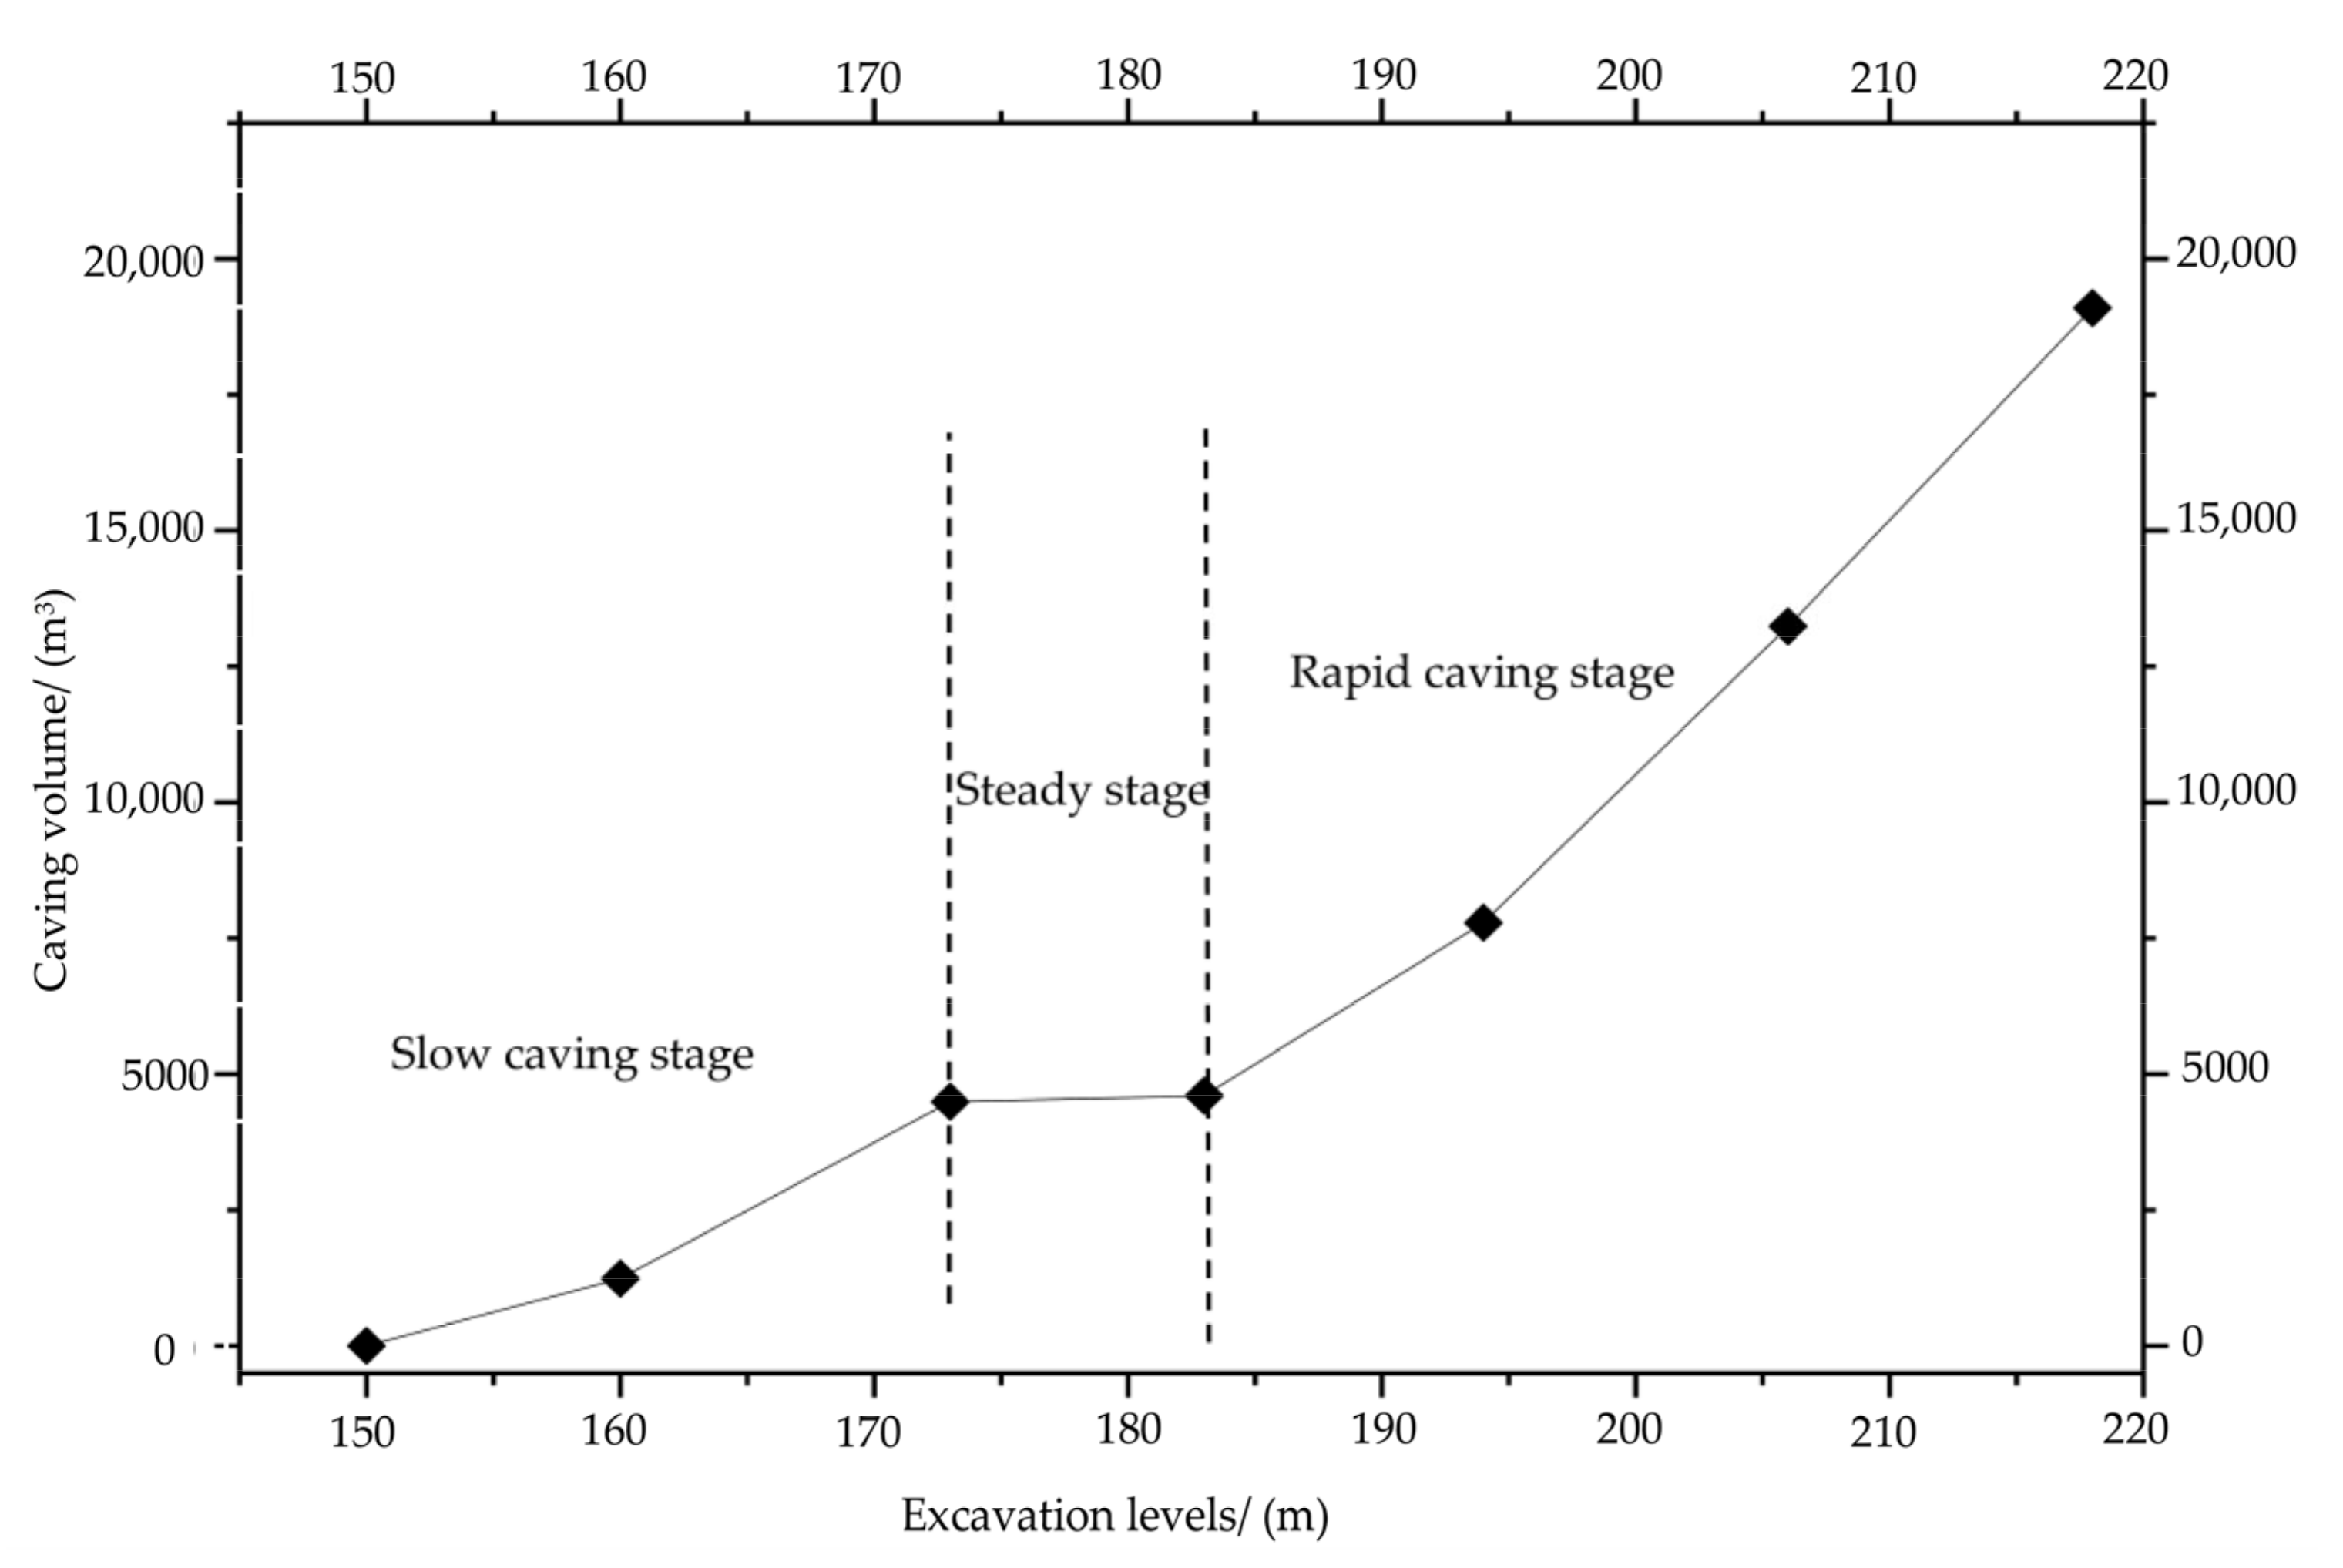
4.1. Arch Caving Development Stage

The orebody in the eastern area of the Chengchao Iron Mine is ‘olive-shaped’ (i.e., narrow at both ends and wide in the middle). This means that the mined-out area formed in the initial mining stage is mainly located below the marble (see Figure 2). The disturbance caused by mining leads to the redistribution of the stress in the surrounding rock, and hence displacement. This induces the arch of the overlying strata to cave towards the mined-out area.
Figure 9 illustrates the caving process that occurs in the marble. In these Figures, the blue lines denote shear failure, and the red lines denote tensile failure. After the −150 m level is mined, the overlying strata in the mined-out area suffer ‘arch-shaped’ damage. More specifically, shear failure mainly occurs at the feet of the arch and tensile failure mainly occurs at its vault (Figure 9a). Although these areas are damaged (to different degrees), the overlying stratum remains stable, as a complete failure surface is not formed. The damage in the overlying stratum continues to expand further as the mined-out area continues to increase. When the −160 m level is completely mined, the marble starts to cave as a complete failure surface is formed between the vault and arch feet (Figure 9b). As the mining depth deepens, the overlying stratum caves several times. Caving occurs as the −171.5, −194.5, and −206 m levels are mined (Figure 9c,e,f), and the failure process follows the same pattern that occurred previously. The arch caving process gradually migrates to the ground surface so that a collapse pit is formed after the −218 m level is mined (Figure 9g).
Figure 10 can be obtained using FISH function for the calculation results. Figure 10 presents a graph of the volume of the caved rock generated as the mining activity moves to progressively deeper levels (the thickness is taken as 1). As can be seen, the caving volume changes dynamically as the mining progresses. In fact, the caving process can be observed following three stages: slow caving, stable caving, and rapid caving. In other words, the caving process has a pattern that can be described as ‘caving–stability–caving’.
In the slow caving stage (−150 to −171.5 m levels), the overlying strata experience caving on a small scale, and so the caving volume is small. In the steady stage (−171.5 to −183 m levels), although there are a few individual unstable rock masses experiencing caving towards the mined-out area, the overlying rock mass does not exhibit instability overall. The caving volume is close to constant at this stage. As the mining depth increases, the disturbance caused by the mining activity continues to lead to instability in the overlying strata, and then caving occurs again. In the rapid caving stage (−194.5 to −206 m levels), the overlying stratum experiences large-scale caving. The caving arch expands rapidly towards the ground surface and eventually forms a collapse pit.
The caving process outlined above is supported by the in situ monitoring data. Figure 11a illustrates the distributions of the ground surface collapse pits in the eastern area of the Chengchao Iron Mine at different times. In the 1990s (when the −218 m level was being mined), the ground surface collapse pits marked with blue lines in Figure 11a were discovered near exploration line no. 4. The range of the collapse pits subsequently continued to increase, leading to the present situation shown in Figure 11b.

4.2. Post Arch Caving Development Stage

4.2.1. Flexural-Toppling Stage

There are two groups of developed discontinuities in the footwall. Among these, those that are steeply dipping and have an orientation of 74°∠82° are the most developed. When a collapse pit is formed, a free face is generated in the footwall, at which deformation and flexural toppling can occur. Figure 12 illustrates the plastic failure zones and displacement vectors in the footwall when the −232, −288, and −358 m levels are mined, respectively.
After the −232 m level is mined, the displacement of the ground surface is mainly in the horizontal direction and points towards the collapse area (Figure 12a). The stratal displacement exhibits obvious layering; more specifically, the displacement of the shallow strata is greater than that of the deep strata. Flexural-toppling deformation is observed in the footwall near the collapse area. Continued mining activity leads to further stress release in the footwall. This extends the flexural-toppling deformation further and to deeper regions (Figure 12b). After the −358 m level is mined, the area of plastic failure is not obvious in the deep rock masses, though the flexural-toppling deformation has extended to the east main shaft. More specifically, the failure surface is discontinuous. In other words, a through-going failure surface is not produced in the footwall (Figure 12c). This may be because the caved rock mass (or mining waste) provides a certain amount of support to the footwall rock mass, thus limiting the occurrence of flexural-toppling failure [46]. Although a shear failure zone is observed around the mined-out area, it is not very well-developed.
The above results can be confirmed by carrying out on-site investigations of the surface cracks in the area and examining the GPS monitoring data. Figure 13c illustrates the distribution of major cracks in the area near the east main shaft. Four groups of major tension cracks were visible in the area in 2012. The crack shown in Figure 13a, which is 140 m long and 2 m wide, is the most developed. Unsurprisingly, these tension cracks constitute a serious threat to the safe production of ore from the mine. The GPS data shown in Figure 14 make it clear that the horizontal displacement is much larger than the vertical displacement near the east main shaft. This can, to a certain extent, be seen as a sign that flexural-toppling deformation is taking place.

4.2.2. Deep Rock Mass Failure Stage

Based on the above analysis, it is obvious that flexural-toppling deformation took place during the mining of the −218 to −358 m levels. Figure 15 illustrates the daily change in the displacement of certain representative monitoring points plotted as a function of time (HDR refers to the horizontal displacement rate and VDR refers to the vertical displacement rate).
The displacements of monitoring points E05, S60, and A53 first started to accelerate in 2009, which can be regarded as marking the beginning of the flexural-toppling deformation process. It is worth noting that the above monitoring points also underwent a second period of acceleration in 2017, when the ground surface deformation was in a rapid stage of growth. The occurrence of this second acceleration stage may imply that there is some special feature of the failure mechanism acting in the footwall at this point. If so, the calculation results may be able to clarify the reason for this phenomenon.
Figure 16 illustrates the plastic failure zones in the footwall when the −375.5, −393, and −410.5 m levels were mined. The caved waste rock exerts a supporting effect on the footwall rock mass, but this effect is weakened as the caved rock flows into the newly mined-out levels. After the −375.5 m level is mined, the flexural-toppling failure of the footwall rock mass is further intensified, and a flexural-toppling failure surface is formed in the deep rock mass (red line in Figure 16a). At the same time, a shear-slip failure surface is formed adjacent to the mined-out area due to the stress concentration formed by the mining disturbance (blue line in Figure 16a). By the time the orebody in the −393 m level has been excavated, the flexural-toppling and shear-slip failure surfaces can be seen to have expanded further, as shown in Figure 16b. One interesting observation is that a compression and slipping-toppling failure surface is formed between the flexural-toppling failure surface and shear-slip failure surface (cyan line in Figure 16; further details of this surface are given later). Under the continued disturbance caused by mining, the compression and slipping-toppling failure surface develops further and eventually forms a through-going failure surface (Figure 16c).
Two monitoring points have been established on each side of the through-going failure surface to monitor the velocity thereof. As shown in Figure 16c, monitoring point A is located between the collapse pit and the through-going failure surface, and monitoring point B is located outside the through-going failure surface. Figure 17 illustrates the velocity of monitoring points A and B as a function of the increasing number of simulation steps. As shown in Figure 17, a slow increase in velocity can be observed at monitoring point B. This means that the area outside the through-going failure surface is less affected by mining disturbance. Compared to monitoring point B, there are three important inflection points, Av1, Av2, and Av3, on the velocity curve of monitoring point A. These are observed after 500,000, 1,750,000, and 3,700,000 steps of the numerical calculation, which correspond to mining of the −218 m, −288 m, and −410.5 m levels, respectively.
More specifically, stage I corresponds to the arch caving development stage. The values of velocity are very small at this stage. The inflection point Av1 is caused by stress release due to overlying strata caving to the surface. Stage II corresponds to the flexural-toppling stage. The velocity increases slowly and approximately linearly. Continuous deformation mainly occurs at this stage, and the rock mass is stable. Stage III corresponds to the failure of the deep rock mass. The velocity increases faster, which means that the rock mass is in its transition from the stable to unstable stages. Under the continued disturbance caused by mining, the velocity suddenly increases after Av3. This means the through-going failure surface is eventually formed, and the rock mass is unstable after mining the −410.5 m level.
The industrial use of the east main shaft was eventually abandoned because of the through-going crack in the ground surface (Figure 13a). Due to a shortage of land resources in the mining area, the through-going crack was backfilled, and the east main shaft was again used in 2017. The through-going crack again became exposed to the surface at some point in 2020. Damage was then caused to buildings and facilities on the ground surface. The zone between the collapse pit and through-going failure surface is called the ‘failure zone’, and the parts of the footwall that remain undisturbed form the ‘stable zone’. Monitoring points were set up on both sides of the through-going crack in May 2021 in order to monitor the deformation of the crack. The results show that the through-going crack is currently expanding at a rate of about 2 cm per month (Figure 18). Thus, the existence of the through-going failure surface allows the rock mass in the failure zone to move towards the mined-out area at a much faster rate than the rock mass in the stable zone.

5. Discussion

The footwall can be divided into a stable zone, flexural-toppling failure zone (FTFZ), shear-slipping failure zone (SSFZ), and compression and slipping-toppling failure zone (CSTFZ) according to the failure mechanism operating (Figure 19a). The details are as follows:
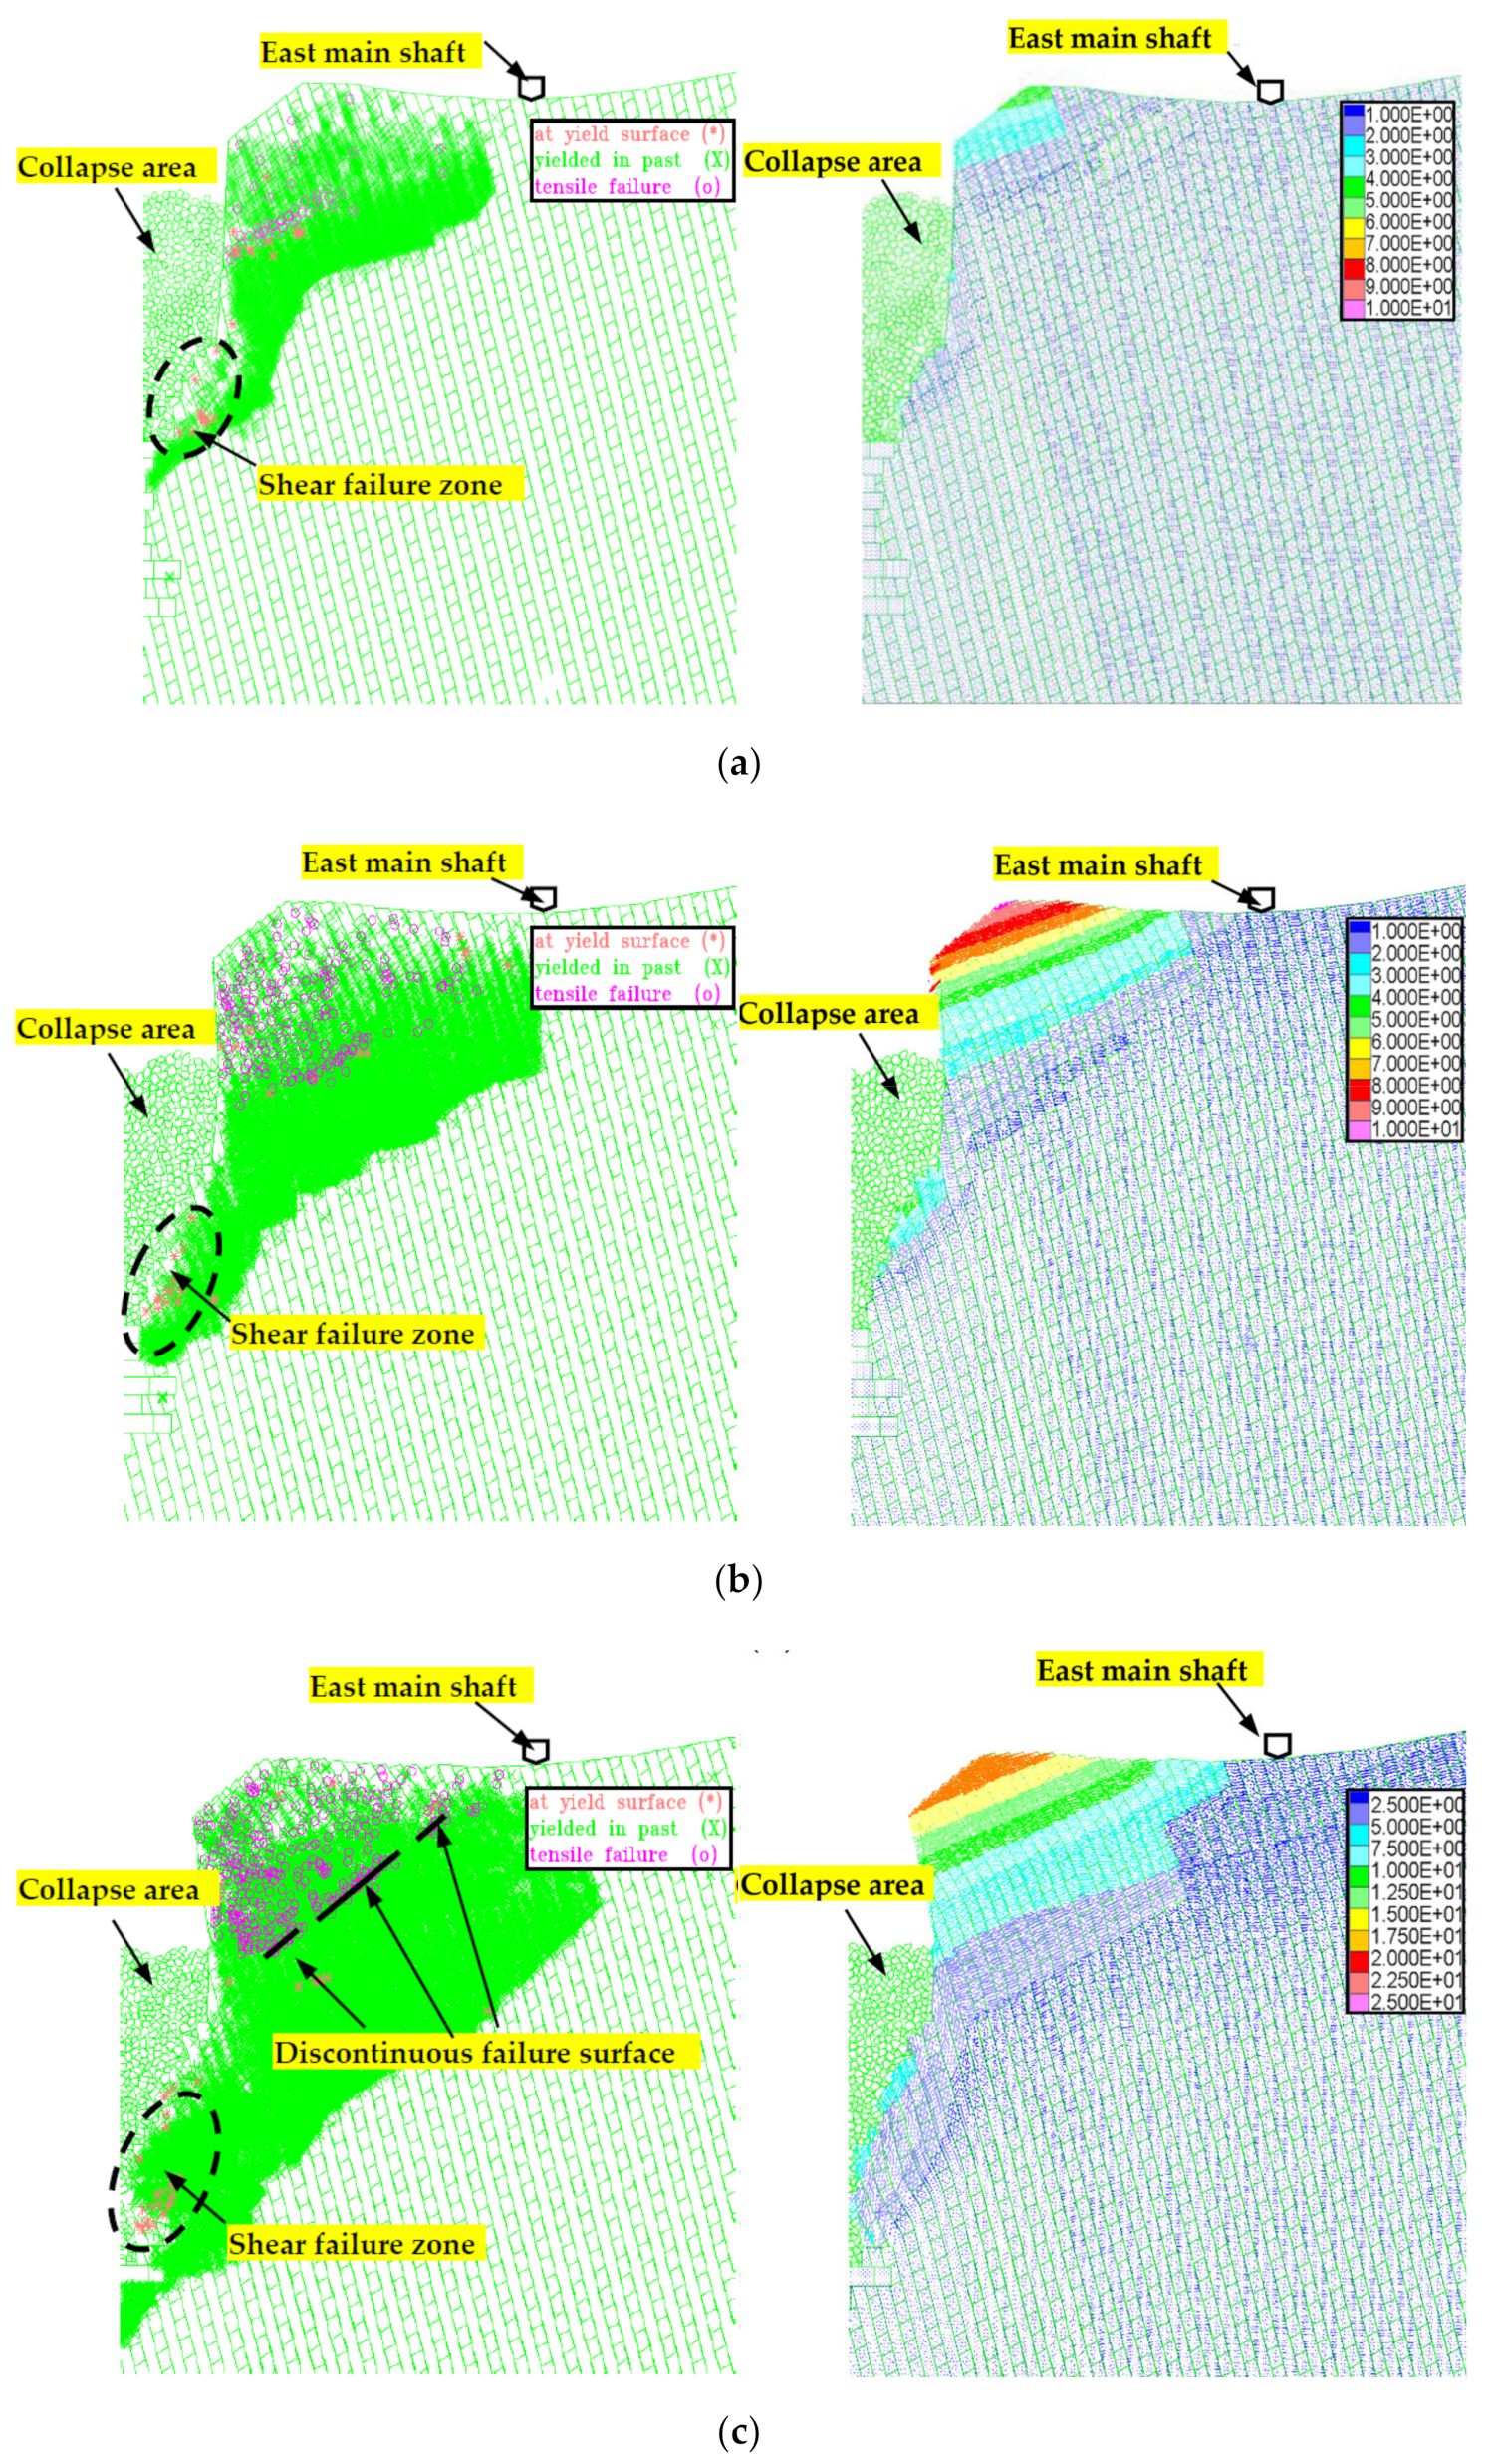
  • The FTFZ is located above the flexural-toppling failure surface, which corresponds to the red area in Figure 19a. The formation of the collapse pit causes stress to be released and provides a free surface for the strata to move in the footwall [47]. The existence of highly dipping discontinuities and tectonic stress further induces the occurrence of flexural-toppling deformation. Initially, the flexural-toppling failure surface is not obvious, due to the support provided to the footwall by the caved waste rock. The enlargement of the mined-out area allows the caved waste rock to continuously flow into these areas, which reduces the support it provides to the footwall. Finally, the flexural-toppling failure surface is formed in the deep rock mass after the −373 m level is mined out.
  • The SSFZ is located above the shear-slip failure surface (blue area in Figure 19a). The SSFZ is formed by the concentration of stress due to mining, its existence inducing the rock mass to slide towards the mined-out area. Svartsjaern et al. [48] observed a similar phenomenon in the Kiirunavaara Iron Mine in Sweden. In the early mining stages, the stress concentration has a less obvious effect because the mining depth is shallow and the mined-out area is relatively small. As the mining depth increases, an obvious shear-slip failure surface is formed near the mined-out area in the footwall (by the time the −375.5 m level is mined).
  • The CSTFZ is located above the compression and slipping-toppling failure surface (the cyan area in Figure 19a). The formation of this zone is controlled by the FTFZ and SSFZ. The rock mass in this zone is subjected to compressive forces from the rock mass in the FTFZ. The SSFZ induces it to slip towards the mined-out area. Mining activity further induces the formation of a compression and slipping-toppling failure surface. After mining the −410 m level, the CSTFZ develops further to form a through-going failure surface.
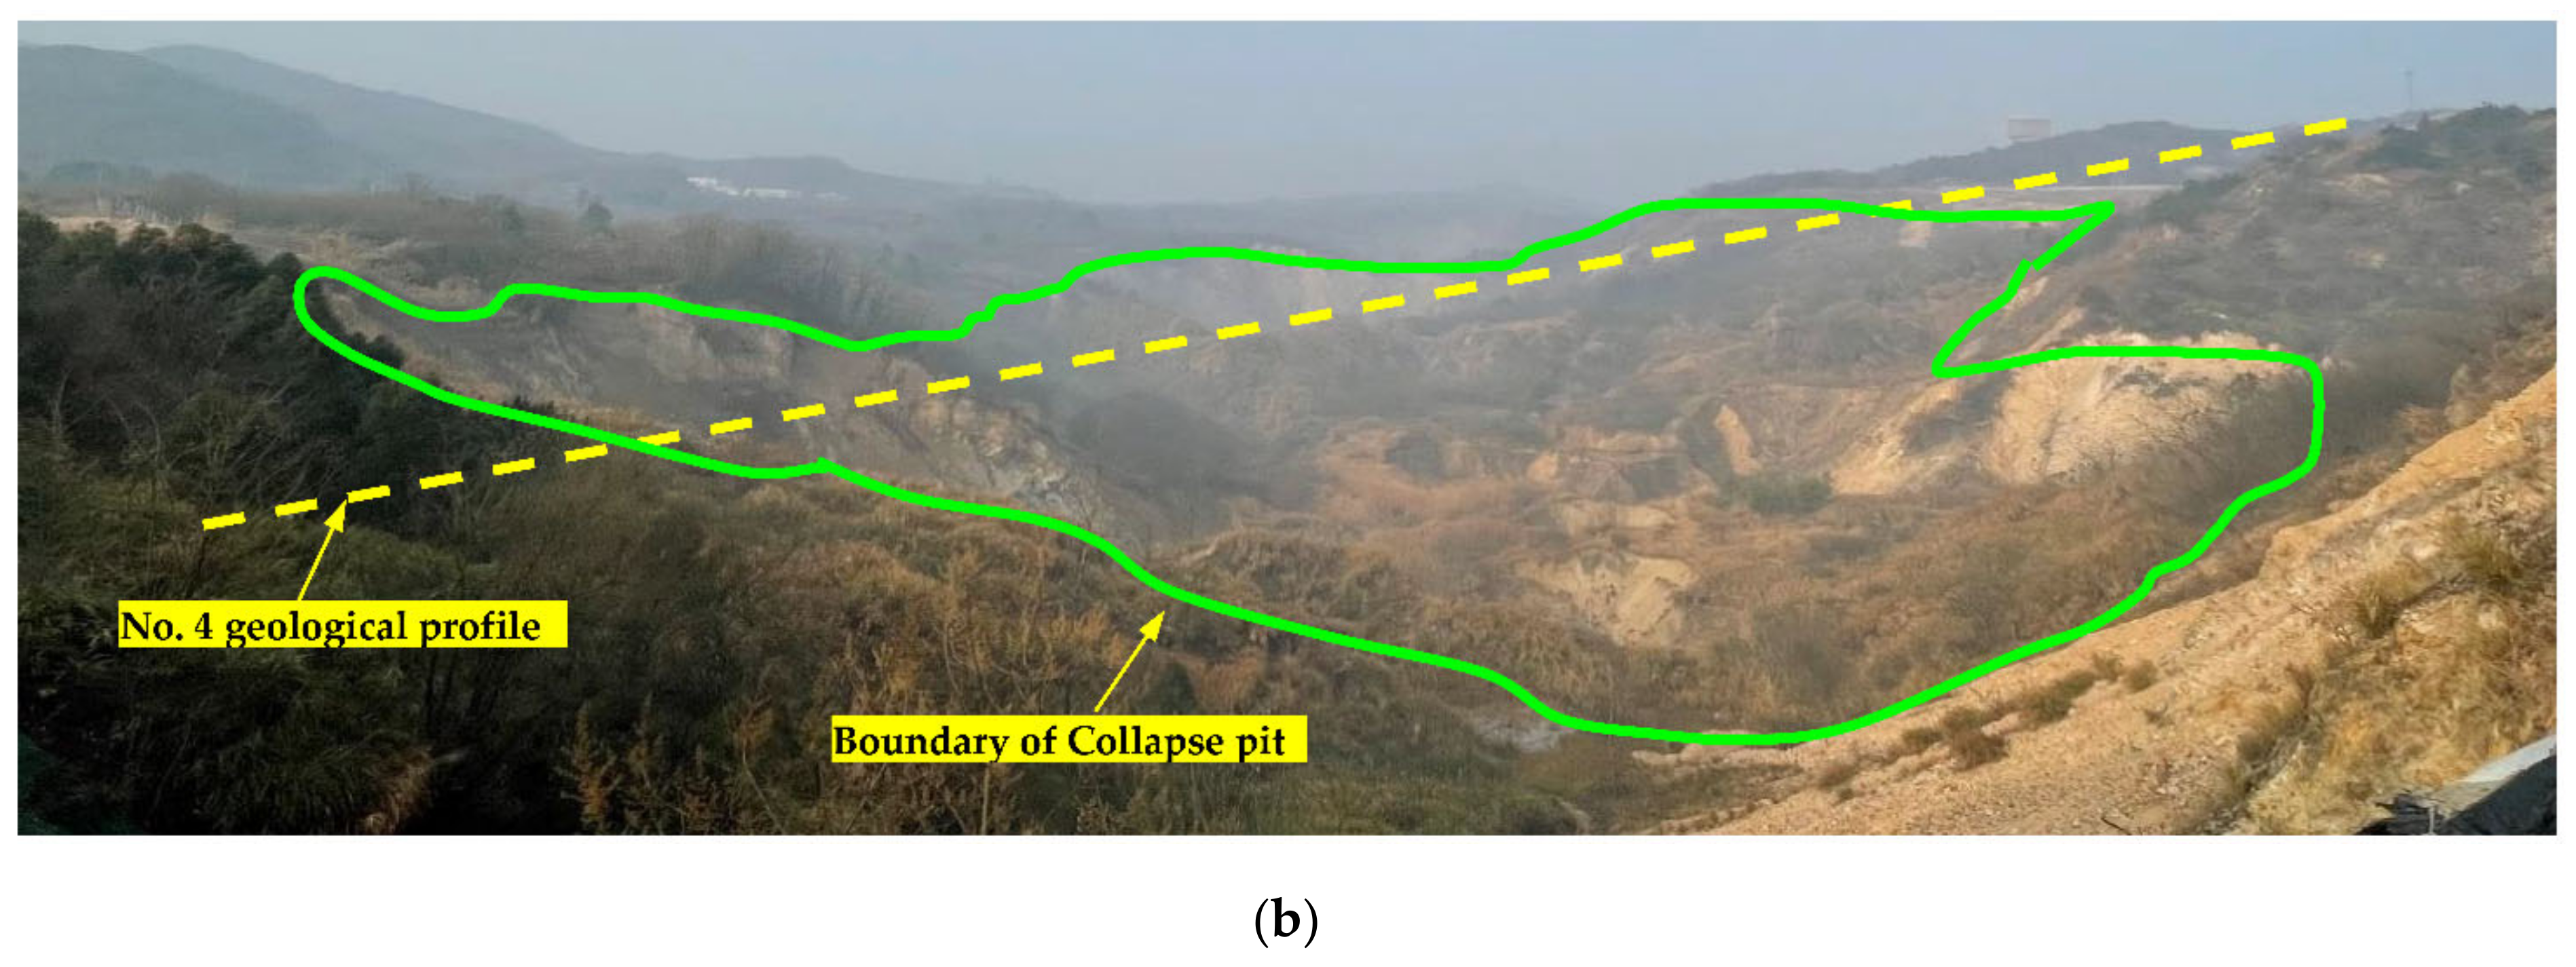
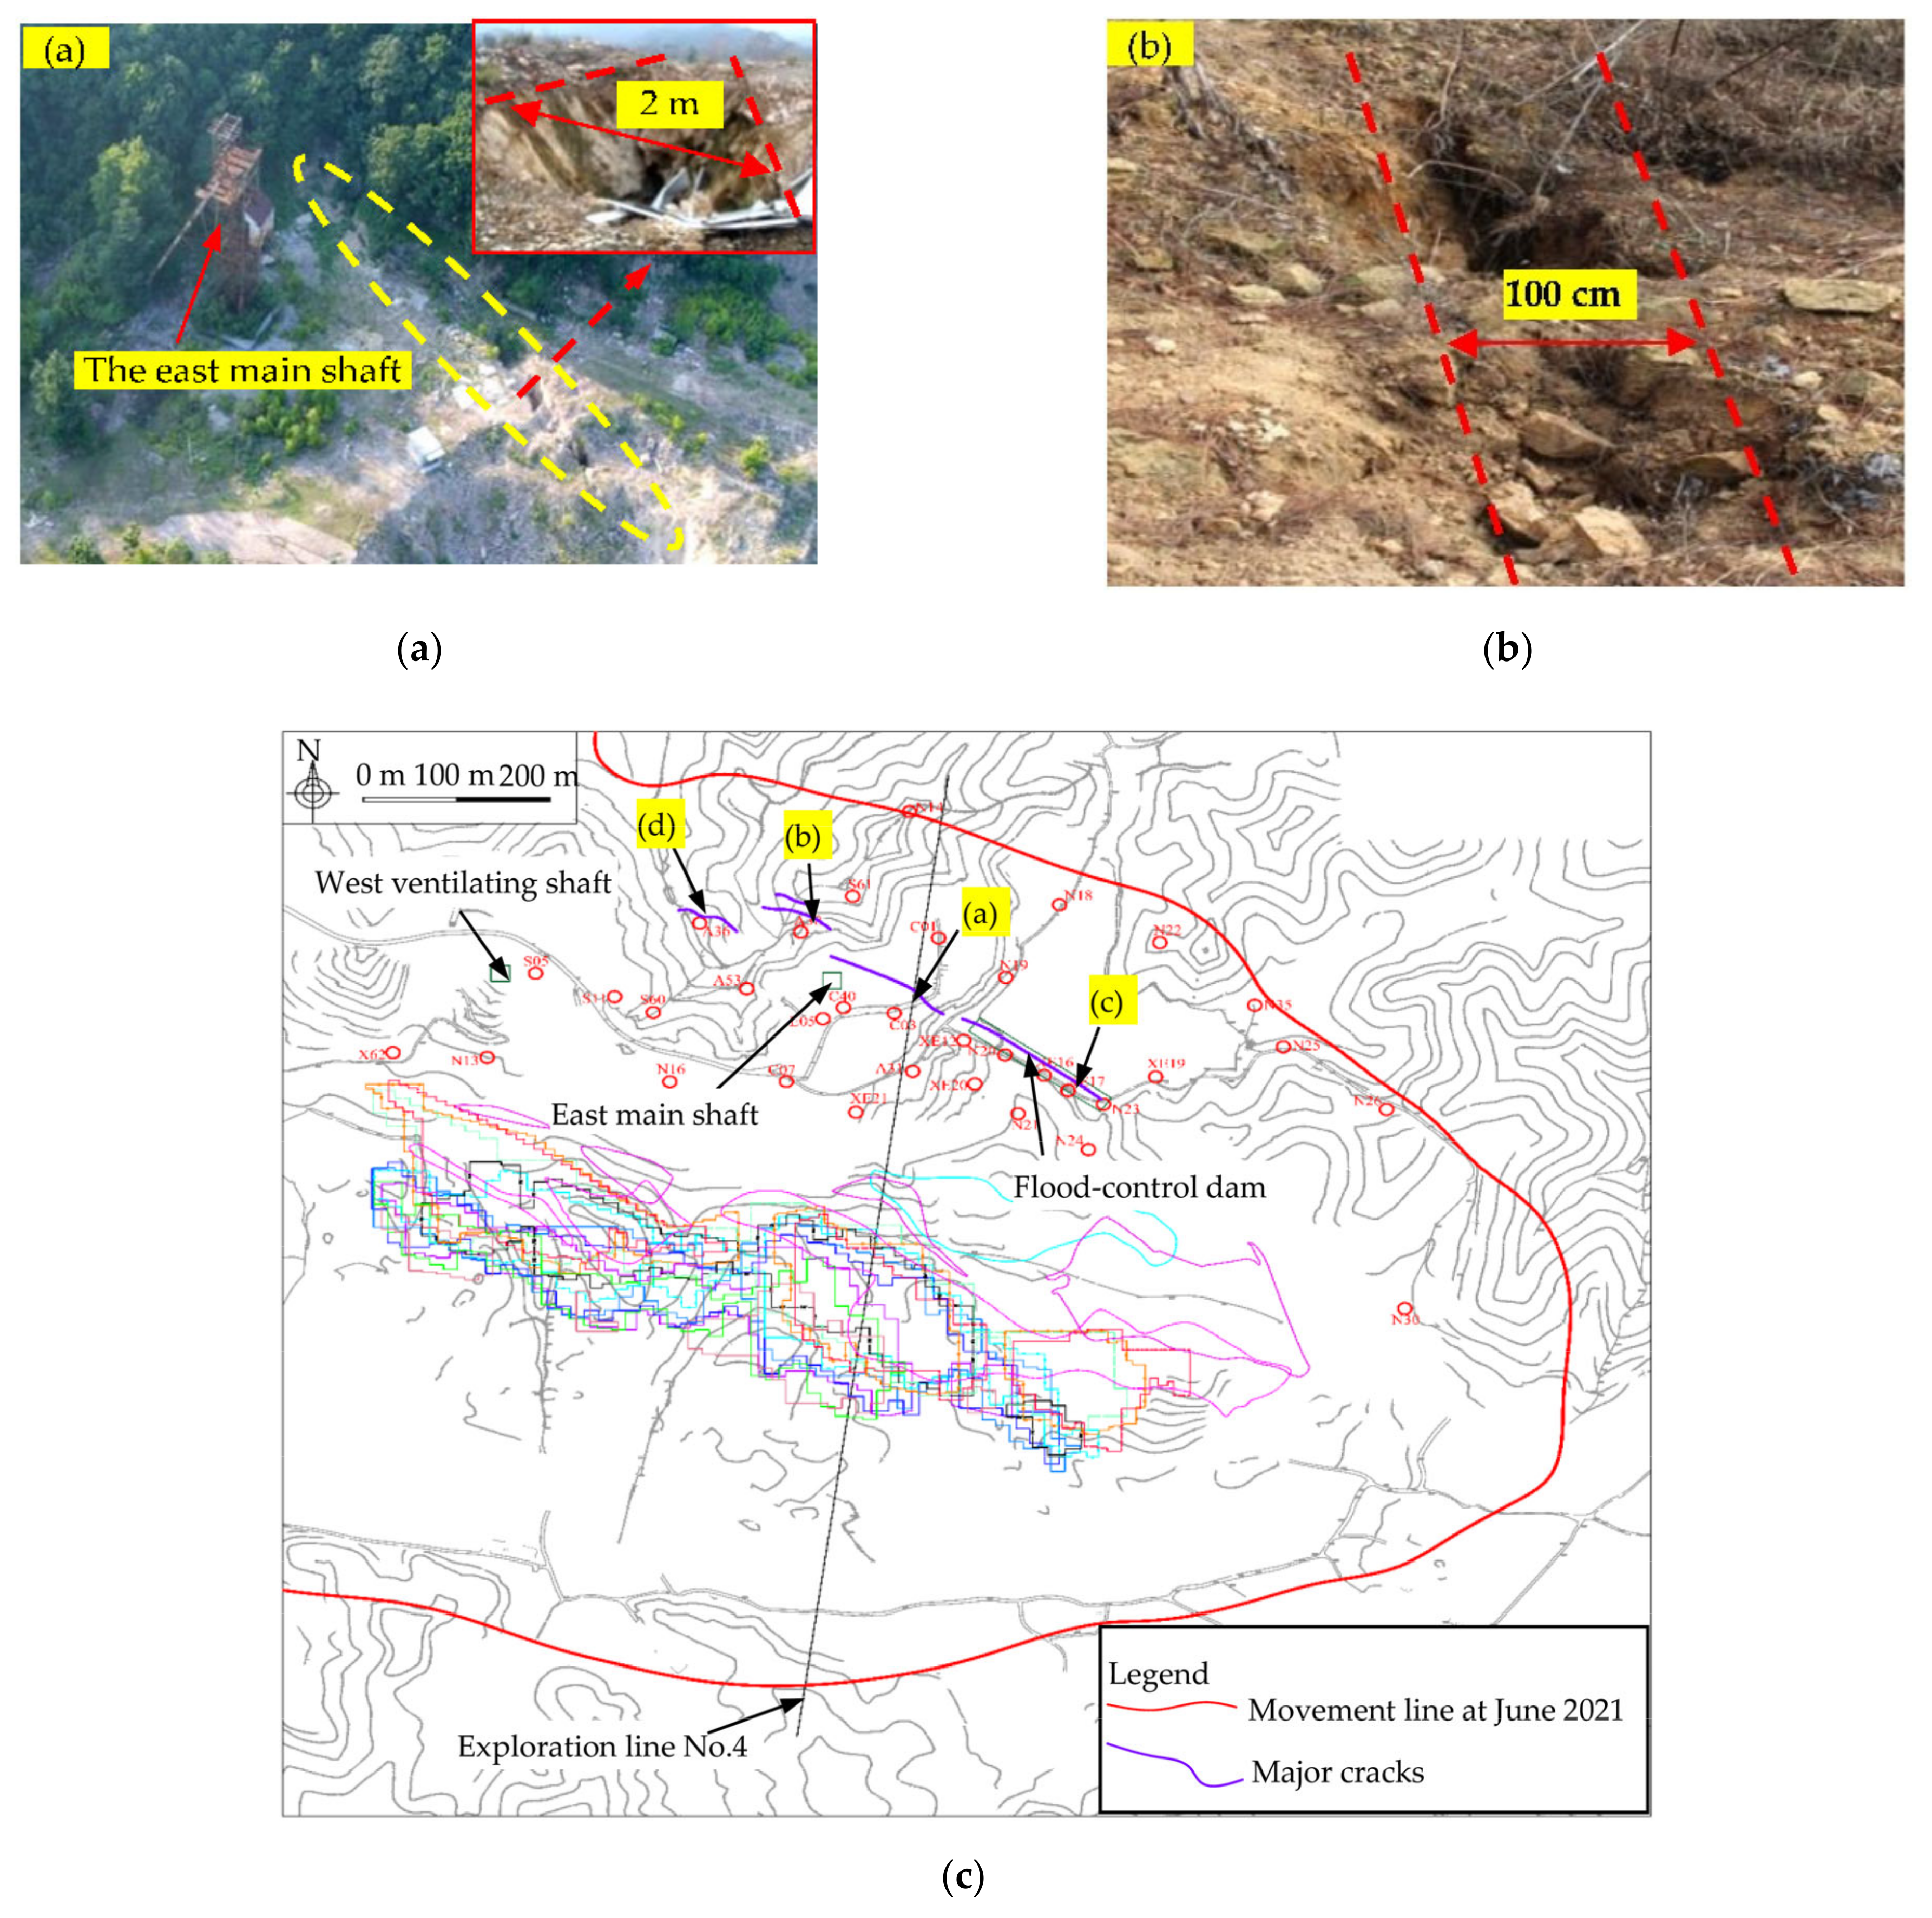
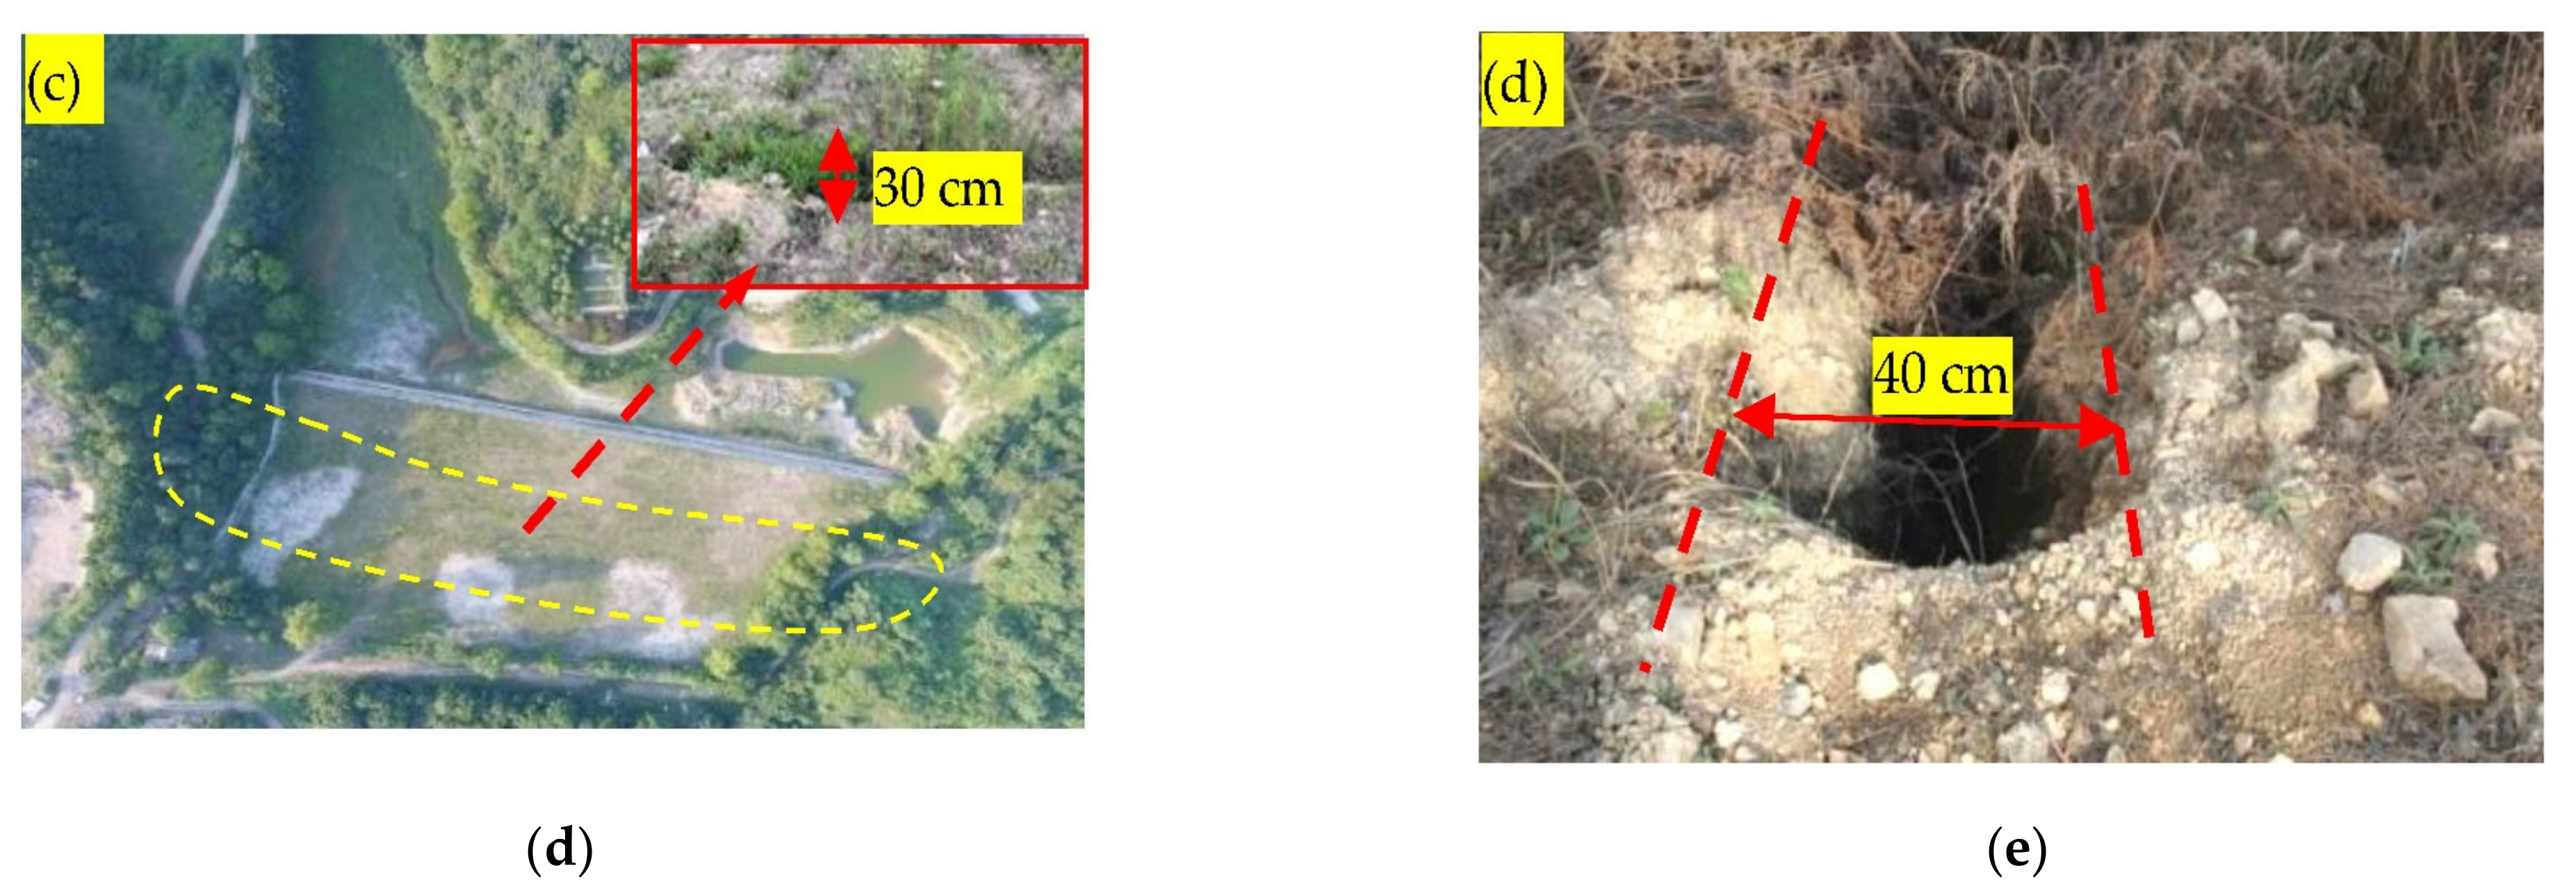
  • The stable zone is outside the through-going failure surface (black area in Figure 19a). As the rock mass in the stable zone is relatively far away from the mined-out area, it is less affected by the mining activity. The through-going failure surface marks the interface between the failure and stable zones. Once the through-going failure surface is formed, the ground surface in the failure zone undergoes a rapid increase in its rate of deformation, and serious damage is caused to the buildings and facilities on the surface (Figure 19b,c). Although microcracks may be observed in the buildings and facilities on the ground surface, the movement of the strata is generally not obvious [49,50]. Mining is a dynamic process, and the rock masses near the through-going failure surface that are currently in the stable zone may be absorbed into the failure zone in the future.

6. Conclusions

By analyzing the deformation failure occurring when extracting minerals by underground mining, the following conclusions could be drawn:
  • The movement of the strata in the footwall in the eastern area of the Chengchao Iron Mine seems to occur in different stages. Depending on whether the overlying strata have caved to the ground surface or not, the movement of the footwall strata can be divided into two stages called ACDS and PACDS. The PACDS can be further subdivided into a flexural-toppling stage and deep rock mass failure stage according to the failure mechanism operating.
  • In the ACDS, ‘arch-shaped’ caving occurs due to the nearby mining activity which leads to a redistribution of the stress in the overburden. Shear failure occurs in the feet of the arch, and tension failure occurs in the vault thereof. The caving process can be divided into three consecutive stages involving slow caving, stable caving, and then rapid caving.
  • In the PACDS, the strata undergo flexural-toppling deformation in the direction of the collapse pit driven by the tectonic stress and presence of steeply dipping discontinuities. The flexural-toppling failure of the rock mass intensifies as the mining activity continues. A flexural-toppling failure surface is formed after the −375.5 m level is mined out. As the mining activity moves to greater depths, the compression and slipping-toppling failure surface develops further, eventually forming a through-going failure surface. Based on the different failure mechanisms, the footwall can be divided into four zones: a stable zone, flexural-toppling failure zone, compression and slipping-toppling failure zone, and shear-slipping failure zone.
  • The through-going failure surface forms the interface between the failure zone and stable zone. The failure surface is exposed on the ground surface in the form of a well-developed macroscopic crack. After the through-going failure surface is formed, the ground surface in the failure zone undergoes a rapid increase in its rate of deformation. When this occurs, serious damage may be suffered by the buildings and facilities on the ground surface.

Author Contributions

Conceptualization, X.L. (Xuanting Liu) and C.C.; data curation, K.X.; funding acquisition, C.C. and K.X.; Investigation, X.L. (Xiumin Liu); methodology, X.L. (Xuanting Liu) and K.X.; writing—original draft, X.L. (Xuanting Liu) and K.X.; writing—review & editing, X.L. (Xiumin Liu) and T.W. All authors have read and agreed to the published version of the manuscript.

Funding

This work was funded by the Young Scholar Fund of National Natural Science Foundation of China, grant number 42002292.

Data Availability Statement

Data are contained within the article.

Acknowledgments

The authors thank the Chengchao Iron Mine of the Wuhan Iron and Steel (Group) Corporation for providing the information. The authors also thank Zaiqiang Ren, Zaobing Wang, Jiabing Wang, and Zhian He for their assistance in collecting the in situ data from the Chengchao Iron Mine.

Conflicts of Interest

The authors declare no conflict of interest.

References

  1. Brady, B.H.G.; Brown, E.T. Rock Mechanics for Underground Mining, 3rd ed.; Springer: Berlin, Germany, 2006; pp. 347–368. [Google Scholar]
  2. Khodayari, F.; Pourrahimian, Y.; Liu, W.V. Production Scheduling with Horizontal Mixing Simulation in Block Cave Mining. J. Min. Sci. 2019, 55, 789–803. [Google Scholar] [CrossRef]
  3. Zarate, E.U.; Pourrahimian, Y.; Boisvert, J. Optimizing block caving drawpoints over multiple geostatistical models. Int. J. Min. Min. Eng. 2018, 34, 55–74. [Google Scholar] [CrossRef]
  4. Deng, Y.Y.; Chen, C.X.; Xia, K.Z.; Pang, H.S.; Sun, C.Y.; Yang, K.Y.; Zheng, X.W. Investigation on the distribution characteristics of ground cracks in the Chengchao Iron Mine. Environ. Earth Sci. 2019, 78, 280. [Google Scholar] [CrossRef]
  5. Xia, K.Z.; Chen, C.X.; Zheng, Y.; Zhang, H.N.; Liu, X.M.; Deng, Y.Y.; Yang, K.Y. Engineering geology and ground collapse mechanism in the Chengchao Iron-ore Mine in China. Eng. Geol. 2019, 249, 129–147. [Google Scholar] [CrossRef]
  6. Edelbro, C.; Sjöberg, J.; Malmgren, L.; Dahnér-Lindqvist, C. Prediction and follow-up of failure and fallouts in footwall drifts in the Kiirunavaara mine. Can. Geotech. J. 2012, 49, 546–559. [Google Scholar] [CrossRef]
  7. Henry, E.; Dahnér-Lindqvist, C. Footwall stability at the LKAB’s Kiruna sublevel caving operation, Sweden. In Proceedings of the 3rd International Conference and Exhibition on Mass Mining, Brisbane, Australia, 29 October–2 November 2000. [Google Scholar]
  8. Kashnikov, Y.A.; Ermashov, A.O.; Efimov, A.A. Geological and Geomechanical Model of the Verkhnekamsk Potash Deposit Site. J. Min. Inst. 2019, 237, 259–267. [Google Scholar] [CrossRef]
  9. Simmons, B.S.; Wempen, J.M. Quantifying relationships between subsidence and longwall face advance using DInSAR. Int. J. Min. Sci. Technol. 2021, 31, 91–94. [Google Scholar] [CrossRef]
  10. Huang, P.; Zhang, J.X.; Yan, X.J.; Spearing, A.; Li, M.; Liu, S.W. Deformation response of roof in solid backfilling coal mining based on viscoelastic properties of waste gangue. Int. J. Min. Sci. Technol. 2021, 31, 279–289. [Google Scholar] [CrossRef]
  11. Brücker, C.; Preuße, A. The future of underground spatial planning and the resulting potential risks from the point of view of mining subsidence engineering. Int. J. Min. Sci. Technol. 2020, 30, 93–98. [Google Scholar] [CrossRef]
  12. Wang, H.Z.; Zhang, D.S.; Wang, X.F.; Zhang, W. Visual Exploration of the Spatiotemporal Evolution Law of Overburden Failure and Mining-Induced Fractures: A Case Study of the Wangjialing Coal Mine in China. Minerals 2017, 7, 35. [Google Scholar] [CrossRef]
  13. Marschalko, M.; Yilmaz, I.; Křístková, V.; Fuka, M.; Bednarik, M.; Kubečka, K. Determination of actual limit angles to the surface and their comparison with the empirical values in the Upper Silesian Basin (CzechRepublic). Eng. Geol. 2012, 124, 130–138. [Google Scholar] [CrossRef]
  14. Marshalko, M.; Yilmaz, I.; Kubechka, K.; Bushal, T.; Bednarik, M.; Druza, M.; Bendova, M. Utilization of ground subsidence caused by underground mining to produce a map of possible land-use areas for urban planning purposes. Arab. J. Geosci. 2015, 8, 579–588. [Google Scholar] [CrossRef]
  15. Marschalko, M.; Bednárik, M.; Yilmaz, I.; Bouchal, T.; Kubečka, K. Evaluation of subsidence due to underground coal mining: An example from the Czech Republic. Bull. Eng. Geol. Environ. 2012, 71, 105–111. [Google Scholar] [CrossRef]
  16. Hoek, E. Progressive caving induced by mining an inclined orebody. Trans. Inst. Min. Metall. Sect. A Min. Technol. 1974, 83, A133–A139. [Google Scholar]
  17. Brown, E.T.; Ferguson, G.A. Prediction of progressive hanging-wall caving, Gaths mine, Rhodesia. Trans. Inst. Min. Metall. Sect. A Min. Technol. 1979, 88, A92–A105. [Google Scholar]
  18. Lupo, J.F. Evaluation of Deformations Resulting from Mass Mining of an Inclined Orebody. Ph.D. Thesis, Colorado School of Mines, Denver, CO, USA, 1996. [Google Scholar]
  19. Lupo, J.F. Progressive failure of hanging wall and footwall Kiirunavaara Mine, Sweden. Int. J. Rock Mech. Min. Sci. 1997, 34, 184.e1–186.e11. [Google Scholar] [CrossRef]
  20. Baryakh, A.A.; Tennyson, L.O.; Samodelkina, N.A. Assessment of horizontal deformations in undermined areas. Min. Inf. Anal. Bull. 2021, 11, 5–18. [Google Scholar] [CrossRef]
  21. Baryakh, A.A.; Fedoseev, A.K.; Lobanov, S.Y.; Matveenko, V.P.; Plekhov, O.A. Deformations and fracture of rock strata during deep level potash mining. In Proceedings of the 22nd Winter School on Continuous Media Mechanics, Moscow, Russia, 22–26 March 2021. [Google Scholar]
  22. Baryakh, A.A.; Samoldekina, N.A. Geomechanical estimation of deformation intensity above the flooded potash mine. J. Min. Sci. 2018, 53, 630–642. [Google Scholar] [CrossRef]
  23. Hastaoğlu, K.Ö.; Gül, Y.; Poyraz, F.; Kara, B.K. Monitoring 3D areal displacements by a new methodology and software using UAV photogrammetry. Int. J. Appl. Earth Obs. Geoinf. 2019, 83, 101916. [Google Scholar] [CrossRef]
  24. Modeste, G.; Doubre, C.; Masson, F. Time evolution of mining-related residual subsidence monitored over a 24-year period using InSAR in southern Alsace, France. Int. J. Appl. Earth Obs. Geoinf. 2021, 102, 102392. [Google Scholar] [CrossRef]
  25. Villegas, T.; Nordlund, E.; Dahnér-Lindqvist, C. Hangingwall surface subsidence at the Kiirunavaara mine, Sweden. Eng. Geol. 2011, 121, 18–27. [Google Scholar] [CrossRef]
  26. Sitharam, T.G.; Sridevi, J.; Shimizu, N. Practical equivalent continuum characterization of jointed rock masses. Int. J. Rock Mech. Min. Sci. 2001, 38, 437–448. [Google Scholar] [CrossRef]
  27. Rybak, J.; Khayrutdinov, M.M.; Kuziev, D.A.; Kongar-Syuryun, C.B.; Babyr, N.V. Prediction of the geomechanical state of the rock mass when mining salt deposits with stowing. J. Min. Inst. 2022, 253, 61–70. [Google Scholar] [CrossRef]
  28. Villegas, T.; Nordlund, E. Numerical analyses of the hangingwall failure due to sublevel caving: Study case. Int. J. Min. Min. Eng. 2013, 4, 201–223. [Google Scholar]
  29. Hamdi, P.; Stead, D.; Elmo, D.; Toyra, D. Use of an integrated finite/discrete element method-discrete fracture network approach to characterize surface subsidence associated with sub-level caving. Int. J. Rock Mech. Min. Sci. 2018, 103, 55–67. [Google Scholar] [CrossRef]
  30. Yu, L.; Ignatov, Y.; Ivannikov, A.; Khotchenkov, E.; Krasnoshtanov, D. Common features in the manifestation of natural and induced geodynamic events in the eastern regions of Russia and China. In IOP Conference Series: Earth and Environmental Science; IOP Publishing: Bristol, UK, 2019; Volume 324, p. 012004. [Google Scholar]
  31. Sanz Pérez, E.; Sanz Riaguas, C. Identification and Investigation of Subsidence Areas to Mitigate Karstic Risks in Urbanized Areas of Madrid, Spain: A Case Study. Sustainability 2021, 13, 7716. [Google Scholar] [CrossRef]
  32. Sanz Pérez, E.; Menéndez Pidal, I.; Lomoschitz, A.; Galindo-Aires, R. The Pico de Navas slump (Burgos, Spain): A large rocky landslide caused by underlying clayey sand. J. Iber. Geol. 2016, 42, 55–68. [Google Scholar] [CrossRef]
  33. Song, X.G.; Chen, C.X.; Xia, K.Z.; Yang, K.Y.; Chen, S.; Liu, X.M. Analysis of the surface deformation characteristics and strata movement mechanism in the main shaft area of Chengchao Iron Mine. Environ. Earth Sci. 2018, 77, 335. [Google Scholar] [CrossRef]
  34. Xia, K.Z.; Chen, C.X.; Yang, K.Y.; Zhang, H.N.; Pang, H.S. A case study on the characteristics of footwall ground deformation and movement and their mechanisms. Nat. Hazards 2020, 104, 1039–1077. [Google Scholar] [CrossRef]
  35. Xia, K.Z.; Chen, C.X.; Liu, X.M.; Zheng, Y.; Fu, H. Ground movement mechanism in tectonic stress metal mines with steep structure planes. J. Cent. South Univ. 2017, 24, 2092–2104. [Google Scholar] [CrossRef]
  36. Cheng, G.W.; Chen, C.X.; Ma, T.H.; Liu, H.Y.; Tang, C.A. A Case Study on the Strata Movement Mechanism and Surface Deformation Regulation in Chengchao Underground Iron Mine. Rock Mech. Rock Eng. 2016, 50, 1011–1032. [Google Scholar] [CrossRef]
  37. Deng, Y.Y.; Chen, C.X.; Xia, K.Z.; Yang, K.Y.; Sun, C.Y.; Zheng, X.W. Investigation on the characteristics of overlying strata caving in the Chengchao Iron Mine, China. Environ. Earth Sci. 2018, 77, 362. [Google Scholar] [CrossRef]
  38. Brunton, I.D.; Fraser, S.J.; Hodgkinson, J.H.; Stewart, P.C. Parameters influencing full scale sublevel caving material recovery at the Ridgeway gold mine. Int. J. Rock. Mech. Min Sci. 2010, 47, 647–656. [Google Scholar] [CrossRef]
  39. Han, Z.Y.; Li, D.Y.; Zhou, T.; Zhu, Q.Q.; Ranjith, P.G. Experimental study of stress wave propagation and energy characteristics across rock specimens containing cemented mortar joint with various thicknesses. Int. J. Rock Mech. Min. Sci. 2020, 131, 104352. [Google Scholar] [CrossRef]
  40. Cao, S.; Song, W.D.; Deng, D.; Lei, Y.K.; Lan, J.Q. Numerical simulation of land subsidence and verification of its character for an iron mine using sublevel caving. Int. J. Min. Sci. Technol. 2016, 26, 327–332. [Google Scholar] [CrossRef]
  41. Zhang, D.; Bai, J.B.; Yan, S.; Wang, R.; Meng, N.K.; Wang, G.Y. Investigation on the Failure Mechanism of Weak Floors in Deep and High-Stress Roadway and the Corresponding Control Technology. Minerals 2021, 11, 1408. [Google Scholar] [CrossRef]
  42. Hoek, E.; Carranza-Torres, C.T.; Corkum, B. Hoek–Brown failure Criterion–2002 Edition. In Proceedings of the Fifth north American Rock Mechanics Symposium, Toronto, ON, Canada, 7–10 July 2002. [Google Scholar]
  43. Xia, K.Z.; Chen, C.X.; Wang, T.L.; Zheng, Y.; Wang, Y. Estimating the geological strength index and disturbance factor in the Hoek–Brown criterion using the acoustic wave velocity in the rock mass. Eng. Geol. 2022, 306, 106745. [Google Scholar] [CrossRef]
  44. Gao, F.Q.; Stead, D.; Coggan, J. Evaluation of coal long-wall caving characteristics using an innovative UDEC Trigon approach. Comput. Geotech. 2014, 55, 448–460. [Google Scholar] [CrossRef]
  45. Sun, C.Y.; Chen, C.X.; Zheng, Y.; Zhang, W.; Liu, F. Numerical and theoretical study of bi-planar failure in footwall slopes. Eng. Geol. 2019, 260, 105234. [Google Scholar] [CrossRef]
  46. Svartsjaern, M.; Saiang, D. Discrete element modelling of footwall rock mass damage induced by sub-level caving at the Kiirunavaara Mine. Minerals 2017, 7, 109. [Google Scholar] [CrossRef]
  47. Cheng, G.W.; Chen, C.X.; Li, L.C.; Zhu, W.C.; Yang, T.H.; Dai, F.; Ren, B. Numerical modelling of strata movement at footwall induced by underground mining. Int. J. Rock Mech. Min. Sci. 2018, 108, 142–156. [Google Scholar] [CrossRef]
  48. Svartsjaern, M.; Saiang, D.; Nordlund, E.; Eitzenberger, A. Conceptual numerical modeling of large-scale footwall behavior at the Kiirunavaara Mine, and implications for deformation monitoring. Rock Mech. Rock Eng. 2016, 49, 943–960. [Google Scholar] [CrossRef]
  49. Pang, H.S.; Chen, C.X.; Xia, K.Z.; Deng, Y.Y.; Zhang, C.Q.; Sun, C.Y. A methodology based on strain analysis for identifying potential discontinuous deformation zones in sublevel caving mines. Eng. Geol. 2020, 279, 105872. [Google Scholar] [CrossRef]
  50. Deng, Y.Y.; Chen, C.X.; Xia, K.Z.; Sun, C.Y.; Chen, S.; Zhang, Y.P.; Zheng, X.W. A field investigation on the distribution characteristics of structure cracks in the Chengchao Iron Mine, China. Arab. J. Geosci. 2020, 13, 231. [Google Scholar] [CrossRef]
Figure 1. Distribution of the rock masses and orebodies in the Chengchao Iron Mine region [5] (numbers near the exploratory lines are the names of the geological profiles).
Minerals 12 01025 g001
Figure 2. Geological profile along line no. 4 in the study area [5].
Minerals 12 01025 g002
Figure 3. Pole plot of the discontinuities in the footwall (red rectangles denote the most developed region of the dominant discontinuity sets).
Minerals 12 01025 g003
Figure 4. (a) Diagrammatic long section of sublevel caving; (b) diagrammatic plan of sublevel caving [38].
Minerals 12 01025 g004
Figure 5. Distribution of the mined-out areas (numbers near the exploratory lines are the names of the geological profiles).
Minerals 12 01025 g005
Figure 6. UDEC numerical model corresponding to the geological profile along line no. 4 (green lines denote discontinuities; blue lines denote the interfaces between different rock masses; red rectangles denote the partial enlarged detail of Voronoi blocks).
Minerals 12 01025 g006
Figure 7. Flowchart summarizing the method of calibrating microparameters.
Minerals 12 01025 g007
Figure 8. Calibration of the UDEC Voronoi model. (a) Compression test model; (b) axial stress–strain curves obtained from unconfined and confined compression tests (i.e., using confining pressures of 0, 0.5, 1.0, and 2.0 MPa); (c) tensile test model; and (d) the results of a direct tensile test showing the stress–strain curve obtained.
Minerals 12 01025 g008
Figure 9. The seven stages shown correspond to depths of: (a) −150 m, (b) −160 m, (c) −171.5 m, (d) −183 m, (e) −194.5 m, (f) −206 m, and (g) −218 m. Red lines denote tensile failure; blue lines denote shear failure.
Minerals 12 01025 g009aMinerals 12 01025 g009b
Figure 10. Plot of the caving volume of the overlying marble as a function of excavation level.
Minerals 12 01025 g010
Figure 11. (a) Distribution of the ground surface collapse pits in the eastern area of the Chengchao Iron Mine at different mining stages (numbers near the exploratory lines are the names of the geological profiles); (b) photograph of the collapsed ground (taken on 26 August 2021).
Minerals 12 01025 g011aMinerals 12 01025 g011b
Figure 12. Plastic failure zones and displacement vector diagrams for the footwall at different excavation levels. The three stages shown correspond to depths of: (a) −232 m, (b) −288 m, and (c) −358 m.
Minerals 12 01025 g012
Figure 13. (a) Major crack at the east main shaft, (b) major crack near the east main shaft, (c) distribution of cracks in the area near the east main shaft, (d) major crack near the flood-control dam, and (e) major crack near the west ventilating shaft.
Minerals 12 01025 g013aMinerals 12 01025 g013b
Figure 14. Plots of the HD/VD ratio as a function of time at various GPS monitoring points (HD stands for horizontal displacement; VD stands for vertical displacement).
Minerals 12 01025 g014
Figure 15. Graphs showing the rate of change of displacement as a function of time at representative monitoring points (HDR denotes the horizontal displacement rate; VDR the vertical displacement rate).
Minerals 12 01025 g015
Figure 16. Plastic failure zones in the footwall corresponding to different excavation levels. The three stages shown correspond to depths of: (a) −375.5 m, (b) −393 m, and (c) −410.5 m. Red lines denote the flexural-toppling failure surface; cyan lines denote the compression and slipping-toppling failure surface; and blue lines denote the shear-slipping failure surface.
Minerals 12 01025 g016
Figure 17. Graphs showing the velocity of monitoring points A and B as a function of simulation steps.
Minerals 12 01025 g017
Figure 18. Graphs showing the crack deformation rate as a function of time.
Minerals 12 01025 g018
Figure 19. (a) Schematic diagram showing the different zones in the rock mass of the footwall. (b) Damaged buildings and facilities near the east main shaft. (c) The through-going crack in the east main shaft.
Minerals 12 01025 g019
Table 1. Extent of the mining activity at different times.
Mining Level (m)Mining DateOrebody NumberMining Scope (Exploration Line Numbers)
StartEndBeginningEnding
−16.0−96.019691978I,II4 to 16; 20 to 26
−106.0−150.019791984II10 to 24
−160.0−206.019841990II9 to 22
−218.0−260.019901997II11 to 22
−260.0−302.019982002II13 to 22
−302.0−358.020022008/07III15 to 16
−358.0−375.02007/052012/02III15 to 16
−375.0−393.02009/052013/12III15 to 16
−393.0−410.52012/032017/03III15 to 14
−410.5−430.02014/072018/07III15 to 12
−430.0−447.52016/062018/08III15 to 10
−447.5−463.02018/11---
−463.0−480.02019/10---
Table 2. Relationship between excavation steps and mining levels in the numerical model.
Levels
(m)
Corresponding Steps in the Numerical Model
12345678910111213141516171819
150*
160 *
171.5 *
183 *
194.5 *
206 **
218 ***
232 *****
246 ****
20212223242526272829303132333435363738
246*
260 *****
274 *****
288 *****
302 ***
39404142434445464748495051525354555657
302**
316 *****
330 *****
344 ******
358 *
58596061626364656667686970717273747576
358***
375.5 ******
393 *****
410.5 *****
77787980818283848586
428***
445.5 ****
463 **
480 *
Note: * denotes the mining step in the numerical simulation.
Table 3. Geometric parameters and distributions of the discontinuities.
LithologyDensity
(kg/m3)
Deformation Modulus
(GPa)
Poisson’s Ratio
(GPa)
Cohesion
(MPa)
Tensile Strength
(MPa)
Friction Angle
(°)
Dilation Angle
(°)
Granite2600.0016.090.220.800.1630.200
Marble2700.0012.050.280.300.1027.000
Hornstone2600.0022.500.251.840.1831.800
Diorite2630.0025.310.260.800.1631.000
Ore body3923.0022.410.212.480.2538.100
Note: MV represents mean value; MRD the maximum random deviation from the mean.
Table 4. Mechanical parameters of the rock masses.
LithologyDensity
(kg/m3)
Bulk Modulus
(GPa)
Shear Modulus
(GPa)
Cohesion
(MPa)
Tensile Strength
(MPa)
Friction Angle
(°)
Dilation Angle
(°)
Granite2600.008.386.820.800.1630.200
Marble2700.008.454.360.300.1027.000
Hornstone2600.0015.009.001.840.1831.800
Diorite2630.0018.0010.000.800.1631.000
Ore body3923.0012.909.262.480.2538.100
Table 5. Mechanical parameters of the discontinuities.
No.Discontinuity TypeNormal
Stiffness
(GPa/m)
Shear
Stiffness
(GPa/m)
Friction
Angle
(°)
Cohesion
(MPa)
Tensile Strength
(MPa)
Residual
Cohesion
(MPa)
IRock interface10.05.1300.20.10.1
IIRock discontinuity24.012.4300.40.10.2
Note: Rock interface denotes the interface between different rock masses; rock discontinuity represents a discontinuity in the rock mass.
Table 6. Back analysis of the calculated and in situ monitored horizontal deformations.
Monitoring PointHorizontal Deformation (March 2012 to March 2017)Error (cm)Percentage Error (%)
Calculated Value (cm)Monitored Value (cm)
A31360.78397.7736.999.30
C03102.34119.2316.8914.2
Table 7. Microparameters used in the UDEC Voronoi model used to describe the marble.
Voronoi
Block Size (m)
Block PropertiesContact Properties
Unit Weight
(kN/m3)
Bulk
Moduli
(GPa)
Shear
Moduli
(GPa)
Normal
Stiffness
(GPa/m)
Shear
Stiffness
(GPa/m)
Friction Angle
(°)
Cohesion
(MPa)
Tensile Strength
(MPa)
527.08.454.3614.305.5827.200.380.08
Publisher’s Note: MDPI stays neutral with regard to jurisdictional claims in published maps and institutional affiliations.

