Abstract
Stream and alluvial sediments of the Savinja and Voglajna rivers were sampled, and sediment fractions <0.063 and 0.063–0.125 mm were analyzed on the content of 60 of the main and trace elements. The objective was to determine elemental associations and identify possible sources of these associations. Differences of Al/Ti oxides ratio (9.7–26) can be attributed to the variations in the source rocks, while the K/Al oxides ratio indicates erosional or depositional river regime and variation in source rocks. One anthropogenic and three natural associations of elements were identified. The anthropogenic association (Ag, In, Sb, Cu, As, Zn, Pb, Cd, Bi, Mo and Sn) is linked to historic Zn smelting in the Celje area, and the subsequent erosion of the material from inadequately managed pyrometallurgical waste deposit. The second association (Li, Sc, Al, V, Cs and Ga) is linked to clay minerals, the third one (Mg, Ca and Te) to carbonate rocks, and the fourth one (Hf, Zr) to the heavy mineral fraction.
1. Introduction
Alluvial sediments are formed by the weathering of host rocks, transport of weathered particles by water and their deposition in basins along river banks, resulting in the formation of flat areas with more or less developed fluvial geomorphological features. Areas of alluvial deposits have been densely populated throughout human history. Extensive farming developed on alluvial flats, as abundance of surface and underground fresh water allowed human civilization to flourish. Human habitation inevitably affects the composition of sediments, while contaminated sediments decrease the quality of life as food production and sources of drinking water are impacted. Increased knowledge of alluvial sediment composition allows for better agricultural planning, sourcing of drinking water and, where and when necessary, remediation measures.
The main natural process which creates alluvial sediments is physical weathering of host rocks, while anthropogenic activities can also influence the composition of sediments to a smaller or similar degree as natural processes. These can be mining, erosion of waste deposits, dumping of various wastes on river banks, major construction projects, various disasters (i.e., dam collapse), etc. Mining in the catchment area and dumping of waste along riverbanks are particularly known to change the elemental composition of alluvial sediments downstream [1,2,3,4].
Certain elements can be particularly useful for studying the composition of alluvial sediments. Al, Si, Fe, Mn, K and Ti can indicate increased supply of siliciclastic materials to fluvial systems [5]. Among them, Al and Ti are especially resistant to weathering [6]. K and Si are indicators of the mafic/felsic nature of igneous rocks, while Fe and Mn are more mobile and can indicate pyroclastic and/or hydrothermal origin of the components [7]. Various ratios of the aforementioned elements, in particular K/Al (proxy for illite content, indicating higher weathering; [8]), Al/Ti (proxy for sediment transportation/weathering [5]) and (Fe + Mn)/Ti vs. Al/(Al + Fe + Mn) (proxy for pyroclastic/hydrothermal component [9]) ratios, can help to determine which lithological units are the main sources of sediments. Such indexes are generally applied to marine sediment studies. However, they can also be used for determination of sediment genesis for (terrestrial) fluvial systems.
Many studies addressed anthropogenic contamination of alluvial sediments, including in the cases of Hackensack river [10], Paglia and Tiber rivers [11], Drava river [2], Vardar river [3], Idrijca river [12], Meža river [13] Elbe river [14] and estuarine sediments, as in the case of the Gulf of Cambay [15]. Increased levels of Cu, Zn, Cd, Ni, Cr, Hg, As and many other potentially toxic elements are commonly associated with anthropogenic impacts. Although many studies have researched contamination of alluvial sediments, most of them targeted only a specific pollutant or set of pollutants, which limits their potential to distinguish between natural and anthropogenic processes in river systems. Many comprehensive studies in urbanized areas addresses various elements. However, studies addressing the complicated interplay between natural and anthropogenic processes are uncommon. With the increased production and usage of emerging technologies, new pollutants such as REE [16,17,18], Y, Ti, Nb or In [19,20] are also being introduced into the environment and concern regarding their potential toxicity is growing [21,22,23]. To be able to better assess what kind of negative impacts these new pollutants have on the environment, we need to define a baseline for them. This will also help future generations to better evaluate and mitigate any potential environmental hazards which might emerge from them. A holistic approach to sediment studies is needed, combining analyses of a number of different array of elements and various geochemical and statistical tools to distinguish between anthropogenic and natural anomalies.
The aim of this study is to define abundances for a large array of elements on the study area, to define geochemical associations, and to separate natural and anthropogenic influences which control the distribution of specific elements in stream sediments on the study area.
2. Study Area
The Savinja river is a left tributary of the Sava river, which flows into the Danube river at Belgrade. Savinja originates in a glacial valley Logarska dolina in Kamniško-Savinjske Alps at an altitude of 1280 m.a.s.l. In the upper part, the river flows SE through mountainous landscapes composed mainly of carbonate formations of Triassic age, with the subordinate inserts of clastic rocks and volcanoclastites (andesite tuff, tuffite, volcanic breccia) [24]. Approximately 40 km from its spring, the river reaches the Celje basin lowlands at approx. 250–300 m.a.s.l. and starts flowing towards E for another 10 km. Sediments in the Celje basin are mainly of carbonate origin—gravel, sand, and silt. In the E part clays could be found. Savinja leaves the Celje basin at the town of Celje and turns south. In the next 20 km, it forms antecedent flow through Sava folds. Folding is perpendicular to the river course. The geological composition of Sava folds is very diverse: from Paleozoic clastic rocks and carbonates (Carboniferous, Permian age), Mesozoic carbonates (dolomite prevails), clastic rocks and tuffs, and Paleogene clastic rocks in the anticlines. Quartz containing keratophyre intrusions of Triassic age are also typical for this area [24]. Savinja flows into the Sava river at the town of Zidani most. The Savinja river catchment area covers 1864 km2. Its length is 107 km, and its drop is 750 m. Small-scale Sb–Pb–Zn-Fe mineral occurrences with small-scale historic mine developments (Zavrh, Železno, Lepa Njiva, Puharje and Galicija) are present in its catchment.
The largest tributary of the Savinja river, the Voglajna river, joins its course at the town of Celje. It flows W through hills which are composed of Paleogene and Neogene clastic sediments—predominantly sandstone, marl, claystone, with some intermediate sections of older tuff and felsic extrusive igneous rocks (rhyolite and trachyte). To summarize, the geological composition of the study area can be generalized into four parts (Figure 1; [24,25]):
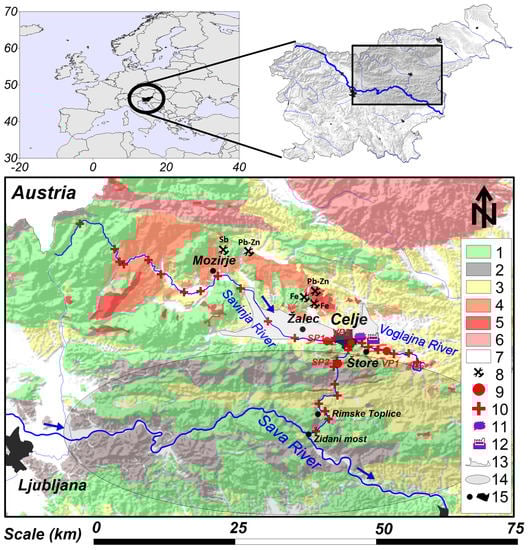
Figure 1.
Simplified geological composition of the study area, sampling locations, populated areas, and major anthropogenic sources of elements. 1-mainly Mesozoic carbonates (limestone, dolomite); 2-Palaeozoic clastic rocks; 3-Paleogene and Neogene sedimentary clastic rocks (PG); 4-andesite tuffs and tuffites of Oligocene age; 5-Triassic keratophire intrusions; 6-other volcanic and igneous rocks (mainly felsic) various ages; 7-Palaeocene—Pleistocene sediments in basins; 8-small-scale metal mineralisation in the catchment area; 9-alluvial sediment sampling location (profiles), 10-stream sediments sampling locations, 11-pyrometallurgical waste deposit; 12-ironworks; 13-Celje basin; 14-Sava folds; 15-towns. Geological maps are simplified from [24,25].
- -
- Carbonates and andesite tuff of the Southern Alps in the upper part of the Savinja flow;
- -
- Gravel of mainly carbonate origin in the Celje basin in the middle part of the Savinja river flow;
- -
- Paleocene and Eocene (PC) clastic rocks and sediments in the E part of the area, where the Voglajna river flows;
- -
- Sava folds with a variety of lithological units in the lower parts of the Savinja river, after the affluent with the Voglajna river.
Higher annual precipitation is recorded in the upper part of the Savinja river’s flow, reaching approximately 1700 mm. The average precipitation in the middle, eastern and lower parts of the study area is approximately 1200 mm. In 2020, the minimum, average and maximum discharges of Savinja river were 9.4, 33.5 and 392 m3/s, respectively at the Veliko Širje measurement station, situated few km before the affluent with Sava river [26]. The Savinja river discharge regime has two maximums and two minimums. The main maximum occurs in early spring due to the melting of snow in the mountains, while the second one is in late autumn. The two discharge minimums are during the summer and in the winter, the latter being shorter than the summer minimum [27,28]. Land use of the Savinja river catchment area is predominantly forests and agriculture. Smaller settlements exist along its course—Celje is the largest town (less than 40,000 inhabitants). The Savinja river shows its torrential character along its entire length, with intense erosion sections in the upper mountainous part, well-developed alluvial plains in the Celje basin and again erosional character in antecedent flow through the Sava fold hills.
A characteristic feature which influences the sediment’s elemental composition is historic Zn smelting in the Celje area. Many authors reported the environmental burdens due to this activity, including impacts on river sediments in recent years. More details can be found in the study of [29] and references cited therein and will not be discussed in detail in this paper.
3. Sampling, Samples Preparation and Determination of Elements
Samples of stream sediments were collected in Summer 2019. Stream sediment samples represent the fine-grained fraction, deposited on the banks of the active river channel during the annual high-water events. They were collected on the concave part of the river meanders with a plastic spatula and sealed in PVC bags. A total of 23 stream sediment samples were collected along the Savinja river course, and 7 samples along the Voglajna river course, between 2 and 4 km apart. Alluvial sediments are deposited outside the active river channel on the alluvial plains during the larger flooding. They were collected using a hand auger up and downstream of the main anthropogenic sources. The samples were collected every 20 cm until the gravel base layer was reached. Four profiles were sampled, 2 in the Savinja river and 2 in the Voglajna river, resulting in 23 samples. The deepest profile was at the Savinja river floodplains below Celje town with a total depth of 140 cm. All samples were air dried and sieved in granulometric laboratories of the Geological Survey of Slovenia. Potential aggregates were gently crushed in the ceramic mortar. We used <0.063 mm and 0.125–0.063 mm meshes to obtain pulps for elemental determination, which was conducted in the external commercial laboratories of Bureau-Veritas in Vancouver, Canada. The four-acid near total digestion ultratrace method (analytical package MA250 using ICP–MS) was used, with the addition of Hg analysis by ICP–MS prior to aqua regia digestion. A total of 60 chemical elements were determined: Mo, Cu, Pb, Zn, Ag, Ni, Co, Mn, Fe, As, U, Th, Sr, Cd, Sb, Bi, V, Ca, P, La, Cr, Mg, Ba, Ti, Al, Na, K, W, Zr, Sn, Be, Sc, S, Y, Ce, Pr, Nd, Sm, Eu, Gd, Tb, Dy, Ho, Er, Tm, Yb, Lu, Hf, Li, Rb, Ta, Nb, Cs, Ga, In, Re, Se, Te, Tl and Hg.
The quality of laboratory analytics included tests of precision, accuracy, and bias. Precision was tested with 21 double analyses of the same material and expressed as the average relative percent difference (ARD). Accuracy was tested with 27 analyses of 12 different reference standard materials, including ACME internal standards and standards obtained from the European Joint Research Centre, Directorate F–Health, and Consumers and Reference Materials. Accuracy was expressed as the average percent recovery rate (AR). The quantity of standard analyses which were used for AR calculation differs from element to element because not all used standards have the same amount of certified reference values. Laboratory contamination was measured by 11 analyses of bulk samples (triple distilled water). The parameter bias (B) represents the average value of all blank analyses for a specific element. All additional samples for laboratory quality control were mixed in the original batch in a random order.
Data curation included removal of values below the detection limit, by replacement of such data with 50% of the corresponding lower detection limit. Samples for which a certain elemental level was detected to be above the laboratory detection limit were analyzed again by diluting the digests and repeating the analysis with ICP–MS.
Four different ratios, including Al/Ti, K/Al, Al/(Al + Fe + Mn) and (Fe + Mn)/Ti, were calculated using elemental levels expressed in %. Results were presented on the map, or on the plot, by using Microsoft Excel (MS Office 365 ProPlus) and Golden Software Surfer (v. 22.1.151) programs.
Descriptive non-parametrical statistical parameters were calculated next. Multivariate statistics included factor analysis to obtain natural and anthropogenic geochemical associations of elements on combined set of analysis from stream and alluvial sediments and for both fractions. Because the dataset contains only 106 individual analyses, not all the elements could be included in factor analysis. Four factors were extracted based on the plot of eigenvalues. A higher number of factors would not be reasonable, since each successive factor eigenvalue would be around 1 or lower. Elements, which tend not to be loaded in any of the first four factors or have the highest factor loading below the value of 0.8, were excluded from the factor analysis. In total, 22 elements were retained: Mo, Cu, Pb, Zn, Ag, As, Cd, Sb, Bi, V, Ca, Mg, Al, Sn, Sc, Cs, Ga, In, Te, Li, Hf and Zr. Factor analysis was performed on the logarithmically transformed data with a zero-mean unit-variance for each element individually. Obtained values of factor scores [30] were plotted against the location of the sample to make proper interpretation of obtained geochemical associations. Statistical analyses were performed using TIBCO software Statistica ver. 13.5.0.17 and maps were prepared by using Golden Software Surfer (v. 22.1.151).
Four samples (<0.063 mm) with the highest calculated values of factor scores (F1, F2, F3 and F4) were selected for determination of mineral composition. PANalytical Empyrean X-ray diffractometer (Malvern Panalytical, Malvern, UK) equipped with CuKα radiation and a PIXcel 1D detector was used. Measurements were conducted at 45 kV with a current of 40 mA, in the 2θ range from 4° to 70°. Step size was set to 0.026° with a scan step time of 297 s. Analysis of X-ray diffraction patterns was performed using X’Pert High Score Plus software (v.4.1.0.19887) by Malvern Panalytical company, Malvern, UK), combined with PANanalytical version 2.1 and ICSD FIZ Karlsruhe2014-1 databases. The Rietveld refinement method was used to estimate the mineral composition of samples.
4. Results
Descriptive non-parametrical statistics, the results of analytical quality control and comparisons with the European average values for stream sediments [31] and with the average composition of continental crust [32], are presented in Table 1 and Figure 2. The quality control results showed that chemical analytics were satisfactory. Bias is negligible for most of the elements, except for Zn, Ni, Cr and Se, where only a slight contamination of instruments was detected. The recovery rate values were between 85% and 115% for most elements. Only Cd, S, Be and Ba analyses showed smaller values than certified ones, and oppositely, Te values were much higher than expected. The precision of analytics was also satisfactory for most of the elements. Lower precision was detected for In, Be, S, Re, Ag, Se and Te, where average deviations of double analysis were higher than 15%.

Table 1.
Descriptive statistics of elemental levels in stream and alluvial sediments (53 samples) in the studied area and their comparison with European average values for stream sediments [31] and upper continental crust [32] and the enrichment ratio between median values in the smaller fraction, compared to coarser ones.
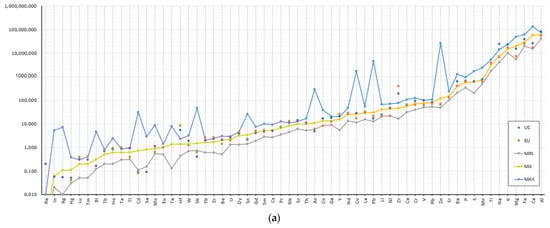
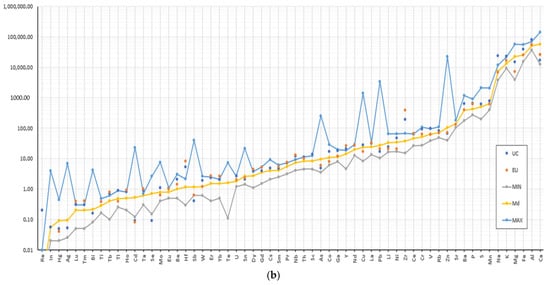
Figure 2.
Minimum (MIN), median (Md) and maximum (MAX) levels of elements in the fractions <0.063 mm (a) and 0.063–0.125 mm (b), and comparison with the corresponding average values for European alluvial sediments (EU) [31] and the upper crust (UC) [32].
It is also evident that the composition of stream and alluvial sediments is comparable with the European average values for most elements. Higher levels in the study area have been detected for Cd, Ca, Hg, Mg, Sb, Ni, Li, As, Zn, Co, Tl, Cu, Sn, Pb, Be and Mo, while lower values have been detected for Ti, Nb, Ta, Y, Hf, Zr and some REEs. Compared to the upper crust, stream and alluvial sediments in the study area are depleted of Mn, Se, Cd, Sb, Ca, As, Hg, Ag, Bi, Pb, Zn, Li, Sn and Mg, and enriched with, U, Ti, Mo, Co, Cr, V, Ga, Fe, W, Y, Ho, Al, Nb, Sc, Tl, Ta, K, Ba, Na, Hf, Zr and selected REEs. Trace elemental levels are higher in the finer fraction for the majority of elements, except for Te, where the coarser fraction is enriched. in the case of Mg, Lu, Ta, Tm, Ba, Ca, Na, Sr, Yb, In and Y, the elemental levels are comparable in both fraction (deviations in median value less than 10%). Raw analytical data are available in Supplementary material, Table S1.
We examined the distribution of the K/Al and Al/Ti ratios (Figure 3). The Al/Ti ratio varies between 9.75 and 25.6 and is generally lower in the upper part of the Voglajna river, while the K/Al ratio varies between 0.23 and 0.32 and is higher for the Voglajna river and lower for a part of the Savinja river. Figure 4 shows the scaling of Al/(Al + Fe + Mn) and (Fe + Mn)/Ti for stream sediments for the Savinja and Voglajna rivers. The determined Al/(Al + Fe + Mn) ratio was between 0.67 and 0.71. No significant differences for the Savinja and Voglajna rivers were observed. However, the (Fe + Mn)/Ti ratio differs for the Savinja and Voglajna rivers. Determined ranges were between 7.5 and 12.8 for the Savinja river, and 4.1–10.2 for the Voglajna river (Figure 4).
Figure 3.
The distribution of the Al/Ti (a) and K/Al (b) ratios in stream sediments of the Savinja and Voglajna rivers in the <0.063 mm fraction. The size of the symbol is linearly proportional to the ratio. Color coding is identical as on Figure 1.
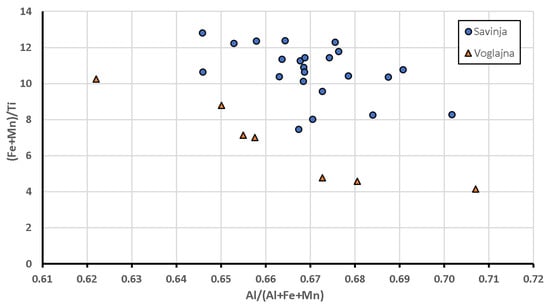
Figure 4.
Scaling of the Al/(Al + Fe + Mn) and (Fe + Mn)/Ti ratios for the Savinja and Voglajna stream sediments.
Factor analysis included the following 22 elements: Ag, In, Sb, Cu, As, Zn, Pb, Cd, Bi, Mo, Sn Li, Sc, Al, V, Cs, Ga, Mg, Ca, Te, Hf and Zr.. Four factors were extracted. Factor loadings after varimax raw factorial axes rotation are presented in Table 2. Factors explain 48%, 24%, 14% and 9% of total variance for factors 1, 2, 3 and 4, respectively. A total of 95% of all variances can be explained by factor analysis for this specific set of elements. Four geochemical associations were determined accordingly. The first geochemical association includes Ag, In, Sb, Cu, As, Zn, Pb, Cd, Bi, Mo and Sn. The second geochemical association consists of Li, Sc, Al, V, Cs and Ga, the third one of Mg, Ca and Te, while the fourth one of Hf and Zr.
Table 2.
Factor loadings in factor analysis.
Figure 5a shows the factor scores distribution for stream sediments of the Savinja river for both fractions, while Figure 5b displays the same for the Voglajna river. Factor score values vary between −3 and +3 and are generally higher in the smaller fraction in the case of F1 and F3, but are higher in the coarser fraction in the case F2 and F4.
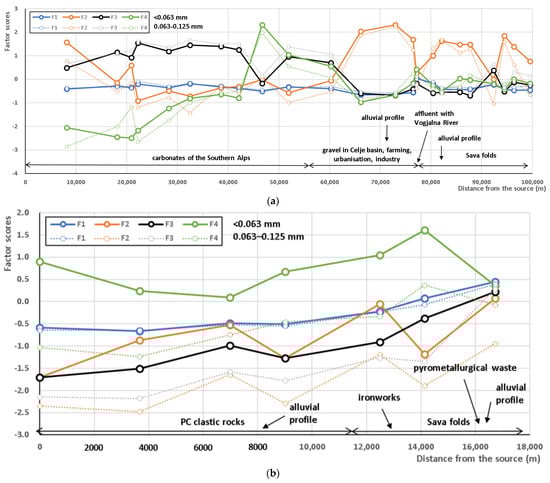
Figure 5.
Factor scores distribution in stream sediments of the Savinja (a) and Voglajna (b) rivers for fractions <0.063 and 0.063–0.125 mm.
Figure 6 presents factor score values versus depth and granulometric fraction in the alluvial sediments of the Savinja river above (Figure 6a) and below (Figure 6b) the town of Celje, which is the main source of anthropogenic elements in the environment. The affluent between the Savinja and Voglajna rivers is located between these two profiles. Figure 7 presents factor score values in alluvial profiles of the Voglajna river, for the coarser and finer fractions separately. Profiles were excavated in a relatively uncontaminated area (Figure 7a) and below the main anthropogenic sources of contamination—the pyrometallurgical waste dump in Celje (Figure 7b).
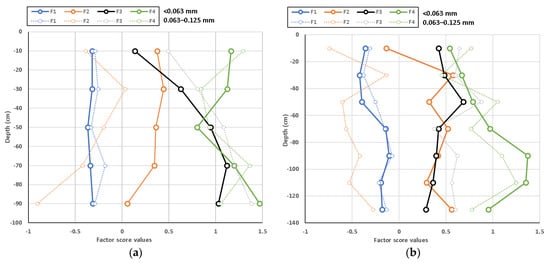
Figure 6.
Factor score values in the profiles through alluvial sediments of the Savinja river, above (a) and below (b) the affluent with the Voglajna river.
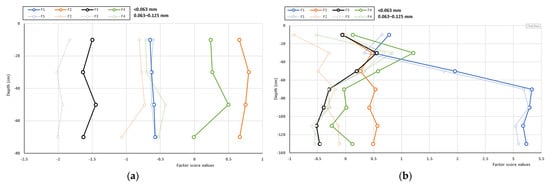
Figure 7.
Factor score values in the profiles through alluvial sediments of the Voglajna river, above (a) and below (b) the main anthropogenic sources of elements.
Factor score values for the Savinja river alluvial sediments are evenly distributed, with the largest deviations from the neutral value being slightly above 1. This is not the case for the Voglajna river, where factor score values deviate much more around neutral value, to up to the value of 3.5. It is also evident that the differences in factor score values between the finer and coarser fractions are also generally higher for the Voglajna river alluvial sediments.
Obtained XRD diffractograms for the samples are presented on Figure 8, and the results are summarized in Table 3. The main components are quartz, calcite, dolomite, plagioclase and micas, constituting between 85% and 95% of the sample. The sample with the highest F1 scores (Voglajna river profile below pyrometallurgical waste dump, 60–80 cm depth) also potentially contains traces (<3%) of various Cu, Cd, Pb, Zn oxides, hydroxides, hydrates and other compounds. The sample with the highest value of F2 scores (Savinja stream sediment in the Celje basin) contains almost 10% of clay minerals (kaolinite?), and potential traces of zeolites and Eucryptite (Li-bearing alumosilicate). The sample with the highest values of F3 scores (sample of stream sediment in the upper part of the Savinja river) contains a lower proportion of quartz, a much higher proportion of dolomite, 9.1% of Ankerite (Fe and Mn containing carbonate) and potentially also traces of Edwardsite (Cu hydrated sulphate). The sample with the highest value of F4 scores (Voglajna river stream sediment downstream Štore ironworks) contains the highest proportion of quartz and calcite and the lowest proportion of micas, and potentially also traces of alumosilicates and other compounds.
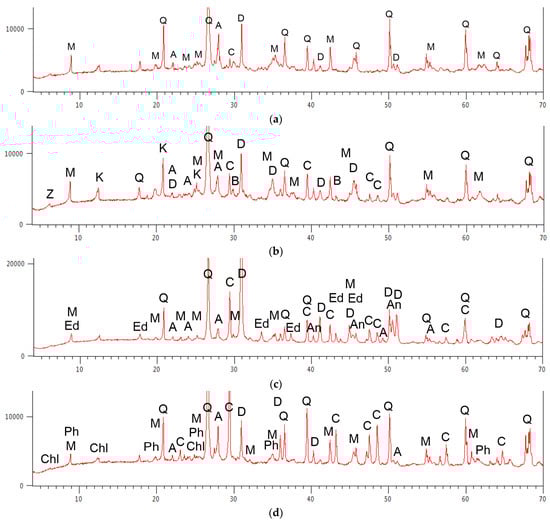
Figure 8.
Obtained X-ray diffraction patterns for the samples where the highest values of factor scores were determined for the finer fraction (<0.063 mm) for the F1 (a), F2 (b), F3 (c) and F4 (d). The key for peak indicators is presented in Table 3.
Table 3.
The results of X-ray diffraction analysis for samples (<0.063 mm only) where the highest values of factor F1–F4 scores were calculated.
5. Discussion
Sixty elemental levels were determined in stream and alluvial sediments of the Savinja and Voglajna rivers to determine geochemical associations present in the study area. Compared to the upper Earths’ crust, alluvial sediments in the study area are enriched with Cd, Sb, As, Hg, Pb, Sn, Ag, Bi and Zn, which could be attributed to the anthropogenic sources in the environment, with Ca and Mg, indicating the presence of carbonates in the catchment area, and Se and Li, which could be due to the presence of felsic igneous intrusions. Stream sediments are depleted with elements, which are usually contained in the heavy minerals of mafic igneous rocks, such as Zr, Hf and Sr. Compared to the composition of the European stream sediments, sediments of the study area are enriched with several pollutants, such as Cd, Hg, Sb, Ni, As, Zn, Co, Tl, Cu, Sn, Pb, Be and Mo. Other enriched elements, compared to the European average, Ca, Mg and Li, as previously discussed, are most likely the results of weathering of host rocks (carbonates, felsic intrusions).
To evaluate the impact of weathering of host rocks, we examined ratios of Al/Ti and K/Al. The Al/Ti ratio is an indication of alkalinity of the host rocks. In this study, the ratio varies between 9 and 25; if recalculated to oxides Al2O3/TiO2, the ratio is between 11 and 29, which suggests felsic to intermediate granitoids as host rocks [23]. Changes in the Al/Ti ratio could also be attributed to other factors. Sediments in sediment–sink areas have considerably lower Ti content, because the heavy mineral fraction tends to deposit in the upper parts of the river system, while the lighter, Al-rich fraction, can be transported further. The increased Al/Ti ratio can also be attributed to the presence of aeolian deposits in the sediments [5]. It is highly unlikely that changes in the Al/Ti ratio can be described with aeolian processes in this study, because the aeolian component in the Savinja and Voglajna river sediments is not expected to be significant. Changes are more likely caused by Al/Ti variation in host rocks and differences in depositional/erosional regime. Spatial distribution of the Al/Ti ratio in the fraction <0.063 mm (Figure 3a) shows that it has much larger values in the Savinja river than in the Voglajna river. This is probably the consequence of differences in the geological composition of the catchment area for both rivers. The geological composition of the Savinja river catchment area includes carbonates, andesite tuffs and keratophire intrusions [24], while the catchment area for the Voglajna river is predominately composed of younger clastic sedimentary rocks of Neogene age (mainly Miocene; [25]). It is also evident (Figure 3a) that the highest ratios are found in the mountainous areas, and lower values in the lowlands. Two potential explanations are proposed: a higher amount of fresh (unweathered) deposit in mountainous areas increasing this ration, while a higher amount of sediment weathering in basins is decreasing it.
The second observed ratio is between K/Al, which can also be used as an indicator of the origin of sediments, since clay minerals and feldspars have distinctly different values of this ratio [33,34]. In this study, lower K2O/Al2O3 ratio in the upper part of the Savinja river was found, ranging between 0.15 and 0.18 (recalculated values from elemental values to corresponding oxides), indicating weathered clay minerals, probably originating from andesite tuffs and tuffites and insoluble remains of carbonates. The lowest K/Al ratios are recorded particularly in the area where these rocks outcrops. In the lower part of the Savinja river and during the entire course of the Voglajna river, the K/Al oxides ratio is higher—between 0.17 and 0.21 (Figure 3b). The reason for this increase might be the differences in rock composition, especially in the course of the Voglajna river and parts of the Savinja river, where felsic rocks are present (keratophyre), but more significantly due to the presence of younger Miocene rocks in the upper parts of the Voglajna river.
A plot of the (Fe + Mn)/Ti and Al/(Al + Fe+ Mn) ratios, indicators of the presence of hydrothermal or pyroclastic components, revealed clear differences between both rivers. Data points for the Savinja river (Figure 4) are placed in the upper part of the graph, indicating a higher amount of the pyroclastic component in stream sediments (<0.063 mm fraction), compared to the Voglajna river. Similarly, as in the case of the Al/Ti ratio, this observation can be interpreted by the presence of andesite tuffs and tuffites in the Savinja river catchment area. No such rocks are present in the Voglajna river catchment.
Factor analysis revealed four geochemical associations of elements. Factor 1 represents the first association. It is loaded with elements which are typical of anthropogenic contamination of sediments, including potentially toxic elements, such as Sb, Cu, Zn, Pb, Cd, and others [3,35,36,37,38]. The distribution of factor scores is heavily influenced by the presence of anthropogenic activities, such as ironworks, population centers, and waste dumps. A sharp peak in factor 1 score values is recorded in the Savinja river just after the affluent with the Voglajna river (Figure 5a), while in the Voglajna river, factor 1 score values are rising continuously from the headwaters towards its joint with the Savinja river in the industrialized town of Celje (Figure 5b). A sharp rise in factor 1 scores is also recorded in alluvial profile from the Voglajna river which was sampled in an industrialized area (Figure 7b). Factor 1 scores are also slightly higher in the coarser fraction, compared to the finer one. X-ray diffraction of sample with the highest calculated F1 score for the <0.063 mm fraction indicates the possible presence of traces of various Cu, Cd, Pb, Zn and Fe oxides, hydroxides and hydrates (Table 3). This suggests that leaking of metals from pyrometallurgical waste dump can be the main reason for this factor. The potential process for metal transport from waste dump to the alluvial deposit is the following. First metals ions dissolute in the waste heap by infiltrated rain water under anoxic low pH conditions—this dump also contains a lot of tar and other organic compounds as a result of coal gasification process used in the past to produce gas. Metals are then transported in the solution towards the Voglajna river by underground waters. Finally, these ions then precipitate in the geochemical barrier in sediments when underground water reach oxygen-rich alluvial sediments containing calcite, which increases pH. Another indication for this process is also the fact that the sample with the highest Factor 1 score values is depleted of carbonates (Table 3). More details about anthropogenic contamination and spatial distribution of selected pollutants can be found in previous paper [29] and will not be discussed in detail in this paper.
Factor 2 is loaded with alkali metals, such as Li and Cs, light transition metals, such as Sc and V, and light post transition metals, such as Al and Ga. The presence of this geochemical association might be a result of aluminosilicate mineral weathering, which are commonly the source of clay minerals. Factor 2 score values are much higher in the smaller fraction, thus indicating that this geochemical group could be linked to clay fraction. This is also confirmed by the X-ray diffraction of sample, where the highest factor 2 score values were calculated. This sample contains the highest amount of kaolinite, which is a typical clay mineral, as well as various other alumosilicates, such as muscovite or eucryptite (Table 3). The highest factor 2 score values are recorded in alluvial sediments of the Savinja river in the Celje basin and in Sava folds (Figure 5), where Savinja transitions from erosional to depositional regime. The same trend is also observed for the Voglajna river, where factor 2 score values steadily increase downstream. No clear and distinctive trend is observed for factor 2 score values in alluvial sediment profiles (Figure 6 and Figure 7), except that factor 2 score values are higher in the finer fraction. We can conclude that high factor 2 score values represent depositional and low factor 2 score values represent erosional regime.
Factor 3 is loaded with Ca, Mg and Te. It is undoubtedly that the presence of this geochemical group is a result of weathering of carbonate rocks in the study area. This is also confirmed by the X-ray diffraction results, indicating that the sample where the highest factor 3 score values were calculated (fraction < 0.063 mm), contains the highest amount of dolomite, relatively high amount of calcite, and the lowest amount of quartz (Table 3). The presence of the mineral Edwardsite (Cu and Cd sulphate hydrate) within this sample is interesting, which might be a consequence of antifungal plant treatment with Cu–based substances in the area. The highest factor 3 score values are recorded in alluvial sediments of the Savinja river in its upper, mountainous parts of Southern Alps, which are composed mainly of carbonates (Figure 5). Factor 3 score values afterwards rapidly decline when the Savinja river reaches the lower parts of the Celje basin and Sava folds. Factor 3 scores are also lower for the Voglajna river sediments, because almost no limestones and dolomite are present in the catchment area. However, when the Voglajna river approaches the Celje basin carbonates start to outcrop and factor 3 score values slightly increase. There is no clear consistent trend for alluvial sediment profiles (Figure 6 and Figure 7). Factor 3 score values are sometimes higher on the surface and lower in the deeper parts, while in other cases the situation is reversed or there is no significant change. This can be explained by the assumption that during historic flash flood events sediments originated from various geological backgrounds, depending on the areas of heaviest rainfall. The presence of Te in this geochemical group is interesting. Te is a very rare element in the Earth’s crust and is usually not linked to carbonates. For this reason, Te levels in stream sediments in the 0.063–0.125 mm fraction, where the highest Te levels were recorded, were investigated in more details (Figure 9). One of the highest levels of Te in Europe was found in top and bottom soils of Dinarides [31]. While the upper part of the Savinja catchment area is geologically very similar to Dinarides, the catchment area of the Voglajna river is composed of much younger sedimentary rocks of Pannonian basin. Further investigation of Te carriers and origins of Te anomaly in this part is advised.
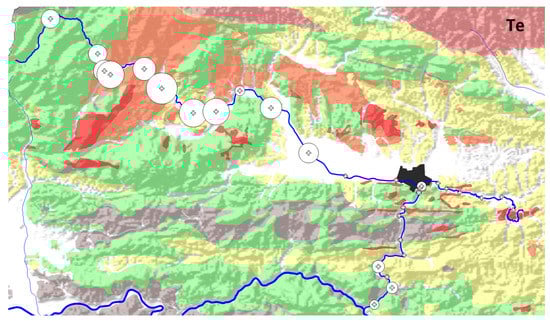
Figure 9.
Te levels in stream sediments in the 0.063–0.125 mm fraction. Color coding is identical as on Figure 1.
Factor 4 is loaded with Hf and Zr. Both elements produce stable and insoluble oxides and are contained within the heavy fraction of alluvial sediments. Zirconium mineral is a solid solution of Zr and Hf with the formula ZrSiO4 and is a typical mineral of igneous and metamorphic rocks. It can be present in erosional remains and enriched by fluvial processes. The sample with the highest factor 4 scores contains the highest amount of quartz and calcite, low amounts of mica and dolomite and traces of Fe and Mg-rich alumosilicates. Zirconium crystals, which can be found as a compound of quartz sand, are most likely connected to the weathering of Miocene sedimentary rocks in the Voglajna river catchment. It is notable that factor 4 score values for the Savinja river sediments are low in its uppermost part, increase when the river reaches the basin and starts to deposit sediments, and afterwards remains relatively stable downstream. Factor 4 score values are very similar in both fractions. There is no clear pattern present for the Voglajna river sediments, except that factor 4 score values are significantly higher in the finer fraction. The same is valid for alluvial sediment profiles. It can be assumed that the micro-location of the sampling is the main factor influencing the levels of Hf and Zr, because heavy fraction deposition can be spatially highly variable [39].
Further studies could focus on identifying of typical carriers of individual geochemical associations, which were identified in this study, and observing some of the carriers of individual elements (i.e., Zn, Cd, Te) by the means of SEM/EDS inspection. More detailed sampling in smaller areas could reveal spatial changes within individual floodplain. Experimental work with a physical model of river using the same sediment material could be used to model erosional and depositional patterns of heavy fraction and anthropogenic particles which are carriers of pollutants, thus identifying most contaminated areas within floodplains. The focus of further studies could also be identifying particle–water interactions, and potential toxic element sinks. This study also pinpointed the lack of lithogeochemical studies in the study area, to assist at the interpretation of elemental levels in various sediments.
6. Conclusions
Levels of 60 elements were measured in the Savinja and Voglajna river stream and alluvial sediments in two fractions: <0.063 and 0.063–0.125 mm. Geochemical associations and spatial trends were determined based on the results of ICP–MS and X-ray diffraction. The finer fraction is enriched with the majority of analyzed main and trace elements, compared to the coarser one. The Al/Ti ratio indicates the variations in source rock composition. Spatial distribution of the K/Al ratio shows the depositional and erosional regime. In the mountainous upper parts, this ratio is lower, while in basin areas and in the lower parts the ratio is higher. Factor analysis on a subset of elements revealed 4 geochemical associations. The first group of elements (Ag, In, Sb, Cu, As, Zn, Pb, Cd, Bi, Mo and Sn) is linked to anthropogenic activities. The highest loadings of this factor were detected around urban and industrial areas, particularly in the vicinity of pyrometallurgical waste deposit. Mineral characterization reveals a depletion of calcite, and the presence of various metal oxides and hydroxides. The second group of elements (Li, Sc, Al, V, Cs and Ga) is a natural association, representing clay fraction. Factor 2 loadings are significantly higher in the smaller fraction, compared to the coarser one, and are also higher in areas where river flow changes its regime from erosional to depositional. The sample with the highest factor 2 score value is enriched with muscovite and kaolinite. Factor 3 (Mg, Ca and Te) is also natural association of elements which are connected to the weathering of carbonates. The sample with the highest factor 3 score value is abundant in dolomite. Te anomaly is of regional character, linked to mountain areas of Southern Alps and Dinarides. The last identified association is once again a natural one, and consists of two elements: Zr and Hf. This association represents the amount of heavy mineral fraction in quartz-rich alluvial sediments. The highest factor 3 scores were detected in the smaller fraction of the Voglajna river sediments.
Supplementary Materials
The following supporting information can be downloaded at: https://www.mdpi.com/article/10.3390/min12070861/s1, Supplementary material, Table S1: Elemental analyses of the Savinja and Voglajna river stream and alluvial sediments.
Funding
This research was funded by the Slovenian Research Agency (research core funding No. P1–0025 “Mineral resources”) and the project no. J1-1713 “Dynamics and matter flow of potentially toxic elements (PTEs) in urban environment”.
Data Availability Statement
Data are available in Supplementary material.
Acknowledgments
The author acknowledges the help of Barbara Čeplak with field and laboratory work; Emil Pučko, who kindly checked the English language; Lea Žibret from Civil engineering institute Ljubljana, who kindly provided X-ray diffraction patterns; four anonymous reviewers and editors for useful comments and handling of the manuscript.
Conflicts of Interest
The authors declare no conflict of interest.
References
- Žibret, G.; Gosar, M.; Miler, M.; Alijagić, J. Impacts of mining and smelting activities on environment and landscape degradation-Slovenian case-studies. Land Degrad. Dev. 2018, 29, 4457–4470. [Google Scholar] [CrossRef] [Green Version]
- Peh, Z.; Šajn, R.; Halamić, J.; Galović, L. Multiple discriminant analysis of the Drava River alluvial plain sediments. Environ. Geol. 2008, 55, 1519–1535. [Google Scholar] [CrossRef]
- Popov, S.I.; Stafilov, T.; Šajn, R.; Tanaselia, C. Distribution of trace elements in sediment and soil from river Vardar Basin, Macedonia/Greece. J. Environ. Sci. Health A 2016, 51, 1–14. [Google Scholar] [CrossRef]
- Gosar, M.; Žibret, G. Mercury contents in the vertical profiles through alluvial sediments as a reflection of mining in Idrija (Slovenia). J. Geochem. Explor. 2011, 110, 81–91. [Google Scholar] [CrossRef]
- Chen, H.F.; Yeh, P.Y.; Song, S.R.; Hsu, S.C.; Yang, T.N.; Wang, Y.; Chi, Z.; Lee, T.Q.; Chen, M.T.; Cheng, C.L.; et al. The Ti/Al molar ratio as a new proxy for tracing sediment transportation processes and its application in aeolian events and sea level change in East Asia. J. Asian Earth Sci. 2013, 73, 31–38. [Google Scholar] [CrossRef] [Green Version]
- Wei, G.; Liu, Y.; Li, X.; Shao, L.; Liang, X. Climatic impact on Al, K, Sc and Ti in marine sediments: Evidence from ODP Site 1144, South China Sea. Geochem. J. 2003, 37, 593–602. [Google Scholar] [CrossRef] [Green Version]
- Dhongil, L.; Jihun, K.; Wonnyon, K.; Jonguk, K.; Dongsung, K.; Le, Z.; Kyungun, K.; Zhaokai, X. Characterization of Geochemistry in Hydrothermal Sediments from the Newly Discovered Onnuri Vent Field in the Middle Region of the Central Indian Ridge. Front. Mar. Sci. 2022, 9, 810949. [Google Scholar] [CrossRef]
- Wehausen, R.; Brumsack, H.J. Cyclic variations in the chemical composition of eastern Mediterranean Pliocene sediments: A key for understanding sapropel formation. Mar. Geol. 1999, 153, 161–176. [Google Scholar] [CrossRef]
- Dias, Á.S.; Barriga, F.J.A.S. Mineralogy and geochemistry of hydrothermal sediments from the serpentinite-hosted Saldanha hydrothermal field (36°34′ N; 33°26′ W) at MAR. Mar. Geol. 2006, 225, 157–175. [Google Scholar] [CrossRef]
- Sohn, S.Y.; Haggblom, M.M. Reductive dehalogenation activity of indigenous microorganism in sediments of the Hackensack River, New Jersey. Environ. Pol. 2016, 214, 374–383. [Google Scholar] [CrossRef]
- Rimondi, V.; Costagliola, P.; Lattanzi, P.; Morelli, G.; Cara, G.; Cancetti, C.; Fagotti, C.; Fredduyyi, A.; Marchetti, G.; Sconocchia, A.; et al. A 200 km-long mercury contamination of the Paglia and Tiber floodplain: Monitoring results and implications for environmental management. Environ. Pol. 2019, 255, 113191. [Google Scholar] [CrossRef] [PubMed]
- Biester, H.; Gosar, M.; Covelli, S. Mercury speciation in sediments affected by dumped mining residues in the drainage area of the Idrija mercury mine, Slovenia. Environ. Sci. Technol. 2000, 34, 3330–3336. [Google Scholar] [CrossRef]
- Gosar, M.; Miler, M. Anthropogenic metal loads and their sources in stream sediments of the Meza River catchment area (NE Slovenia). Appl. Geochem. 2011, 26, 1855–1866. [Google Scholar] [CrossRef]
- Reese, A.; Zimmermann, T.; Profrock, D.; Irrgeher, J. Extreme spatial variation of Sr, Nd and Pb isotopic signatures and 48 element mass fractions in surface sediment of the Elbe River Estuary-Suitable tracers for processes in dynamic environments? Sci. Total Environ. 2019, 668, 512–523. [Google Scholar] [CrossRef]
- Qasim, A.; Singh, S.P.; Ahmad, N.; Argal, J.; Chandrashekhar, A.K. Inter-estuarine and seasonal to decadal variations of heavy metal pollution in the Gulf of Cambay, India. Environ. Monit. Assess. 2022, 194. [Google Scholar] [CrossRef]
- US Environmental Protection Agency. Rare Earth Elements: A Review of Production, Processing, Recycling, and Associated Environmental Issues; EPA/600/R-12/572; EPA: Washington, DC, USA, 2012.
- Bau, M.; Dulski, P. Anthropogenic origin of positive gadolinium anomalies in river waters. Earth Planet Sci. Lett. 1996, 143, 245–255. [Google Scholar] [CrossRef]
- Tepe, N.; Romero, M.; Bau, M. High-technology metals as emerging contaminants: Strong increase of anthropogenic gadolinium levels in tap water of Berlin, Germany, from 2009 to 2012. Appl. Geochem. 2014, 45, 191–197. [Google Scholar] [CrossRef]
- Downs, W.L.; Scott, J.K.; Yuile, C.L.; Caruso, F.S.; Wong, L.C. The toxicity of niobium salts. Am. Ind. Hyg. Assoc. Q. 1965, 26, 337–346. [Google Scholar] [CrossRef]
- Tanaka, A.; Hirata, M.; Kiyohara, Y.; Nakano, M.; Omae, K.; Shiratani, M.; Koga, C. Review of pulmonary toxicity of indium compounds to animals and humans. Thin. Solid Films 2010, 518, 2934–2936. [Google Scholar] [CrossRef]
- Pagano, G.; Guida, M.; Tommasi, F.; Oral, C. Health effects and toxicity mechanisms of rare earth elements—Knowledge gaps and research prospects. Ecotoxicol. Environ. Saf. 2015, 115, 40–48. [Google Scholar] [CrossRef]
- Haley, T.J. Toxicity. In Handbook on the Physics and Chemistry of Rare Earths; Schneider, K.A., Jr., Eyring, K.A., Eds.; North-Holland: Amsterdam, The Netherlands, 1979; pp. 553–585. [Google Scholar]
- Pagano, G. Rare Earth Elements in Human and Environmental Health: At the Crossroads between Toxicity and Safety; Jenny Stanford Publishing: Singapore, 2016; 292p. [Google Scholar]
- Mioč, P. Basic Geological Map of SFR Jugoslavija, 1:100,000, Sheet Ravne with the Explanatory Text; Fedral Geological Survey: Belgrade, Serbia, 1980; 69p.
- Buser, S. Basic Geological Map of SFR Jugoslavija, 1:100,000, Sheet Celje with the Explanatory Text; Fedral Geological Survey: Belgrade, Serbia, 1977; 72p.
- ARSO. Vodnatost Eek v Letu 2020. Available online: https://www.arso.gov.si/vode/poročilainpublikacije/Vodnatostrekvletu2020.pdf (accessed on 4 January 2022).
- Bat, M.; Beltram, G.; Cegnar, T.; Tehovnik, M.D.; Grbović, J.; Krajnc, M.; Mihorko, P.; Brancelj, I.R.; Remec-Rekar, Š.; Uhan, J. Tekoče vode. In Vodno Bogastvo Slovenije; Uhan, J., Bat, M., Eds.; Agencija Republike Slovenije za Okolje: Ljubljana, Slovenia, 2003. [Google Scholar]
- Kolbezen, M.; Pristov, J. Površinski Vodotoki. In Vodna Bilanca Slovenije (Surface Streams and Water Balance of Slovenia); Ministrstvo za Okolje in Proctor, Hidrometeorološki Zavod Republike Slovenije: Ljubljana, Slovenia, 1998. [Google Scholar]
- Žibret, G.; Čeplak, B. Distribution of Pb, Zn and Cd in stream and alluvial sediments in the area with past Zn smelting operations. Sci. Rep. 2021, 11, 17629. [Google Scholar] [CrossRef] [PubMed]
- Child, D. The Essentials of Factor Analysis, 3rd ed.; Bloomsbury Academic: London, UK, 2006. [Google Scholar]
- Salminen, R.; Batista, M.; Bidovec, M.; Demetriades, A.; De Vivo, B.; De Vos, W.; Duris, M.; Gilucis, A.; Gregorauskiene, V.; Halamic, J.; et al. Geochemical Atlas of Europe; Geological Survey of Finland: Espoo, Finland, 2005; 526p. [Google Scholar]
- Rudnick, R.L.; Gao, S. The Composition of the Continental Crust. In Treatise on Geochemistry; Holland, H.D., Turekian, K.K., Eds.; The Crust; Elsevier-Pergamon: Oxford, UK, 2003; Volume 3, pp. 1–64. [Google Scholar] [CrossRef]
- Noa Tang, S.D.; Atangana, J.N.; Onana, V.L. Mineralogy and geochemistry of alluvial sediments from the Kadey plain, eastern Cameroon: Implications for provenance, weathering, and tectonic setting. J. Afr. Earth Sci. 2020, 163, 103763. [Google Scholar] [CrossRef]
- Cox, R.; Lowe, D.R.; Cullers, R. The influence of sediment recycling and basement composition on evolution of mudrock chemistry in the southwestern United States. Geochim. Cosmochim. Acta 1995, 59, 2919–2940. [Google Scholar] [CrossRef]
- Šajn, R.; Halamić, J.; Peh, Z.; Galović, L.; Alijagić, J. Assessment of the natural and anthropogenic sources of chemical elements in alluvial soils from the Drava River using multivariate statistical methods. J. Geochem. Explor. 2011, 110, 278–289. [Google Scholar] [CrossRef]
- Vasilevska, S.; Stafilov, T.; Šajn, R. Distribution of trace elements in sediments and soil from Crn Drim River Basin, Republic of Macedonia. SN Appl. Sci. 2019, 1, 555. [Google Scholar] [CrossRef] [Green Version]
- Miler, M.; Gosar, M. Chemical and morphological characteristics of solid metal-bearing phases deposited in snow and stream sediment as indicators of their origin. Environ. Sci. Pollut. Res. 2015, 22, 1906–1918. [Google Scholar] [CrossRef]
- Teršič, T.; Miler, M.; Gaberšek, M.; Gosar, M. Vsebnosti arzena in nekaterih drugih prvin v potočnih sedimentih in vodah porečja Medije, osrednja Slovenija = Contents of arsenic and some other elements in stream sediments and waters of the Medija drainage basin, central Slovenia. Geologija 2018, 61, 5–24. [Google Scholar] [CrossRef]
- Brady, L.L.; Jobson, H.E. An Experimental Study of Heavy-Mineral Segregation Under Alluvial-Flow Conditions; US Geological Survey Professional Paper 562-k; United States Government Printing Office: Washington, DC, USA, 1973; 38p.
Publisher’s Note: MDPI stays neutral with regard to jurisdictional claims in published maps and institutional affiliations. |
© 2022 by the author. Licensee MDPI, Basel, Switzerland. This article is an open access article distributed under the terms and conditions of the Creative Commons Attribution (CC BY) license (https://creativecommons.org/licenses/by/4.0/).