Article

Application of Chemical Sequence Stratigraphy to the Prediction of Shale Gas Sweet Spots in the Wufeng and Lower Longmaxi Formations within the Upper Yangtze Region

1
Chinese Academy of Geological Sciences, China Geological Survey, Beijing 100037, China
2
School of Earth Sciences and Resources, China University of Geosciences, Beijing 100083, China
*
Author to whom correspondence should be addressed.
Minerals 2022, 12(7), 859; https://doi.org/10.3390/min12070859
Submission received: 31 May 2022 / Revised: 28 June 2022 / Accepted: 28 June 2022 / Published: 5 July 2022

Abstract

:
Effective shale gas exploration is hindered by the need for obtaining high-resolution correlations between shale strata and the need for classifying shale facies. To address these issues, chemostratigraphy, sequence stratigraphy, and shale gas geology methods were integrated to develop a new method known as “chemical sequence stratigraphy,” which was successfully applied to the Wufeng–Lower Longmaxi Formations in the upper Yangtze region. Well Huadi 1 was used as a case study, and detailed data were acquired. Multivariate statistical analyses were applied to three defined indices having different genetic significance, namely: terrigenous input intensity (TII), authigenic precipitation intensity (API), and organic matter adsorption and reduction intensity (OARI). By analyzing the trends of these three indices, the Wufeng–Lower Longmaxi Formations were divided into five fourth-order chemical sequences (from bottom to top): LCW, MCL1-1, MCL1-2, MCL1-3, and MCL1-4. The geochemical facies were named and classified using the chemical sequence stratigraphic framework. The enrichment factor (EF) transformation of elements was conducted to determine whether an element is rich or deficient. The results showed that the favorable geochemical facies in the well were EF-Al deficient, EF-Ca rich, and EF-V rich. The organic matter content and rock brittle strength were then used as chemical parameters, and it was predicted that the LCW and MCL1-1 chemical sequences most likely comprised shale gas sweet spots. This conclusion is consistent with the drilling results and indicates that our proposed method is effective and reliable. This method is further applied to the Changning Shuanghe section, the Shizhu Liutang section, and sections in the Xindi 1 well in the upper Yangtze region. The comparative study of these four sections showed that LCW and MCL1-1 are the key chemical sequences for shale gas exploration and development in the Wufeng–Lower Longmaxi Formations within the Upper Yangtze region.

1. Introduction

The world is facing huge challenges associated with global warming caused by excessive carbon emissions. Shale gas is one of the cleanest fossil energy sources, and its use is thus significant for reducing such emissions. During the 13th Five-Year Plan (2016–2020) period, China discovered more than 500 billion m3 of proven geological shale gas field reserves in Changning, Weiyuan, Zhaotong, Fuling, and Weirong [1]. The Wufeng-Lower Longmaxi Formations are composed of deepwater shelf facies, and they are the main gas producing layer within these super-large shale gas fields [1,2,3,4,5,6,7,8]. In recent years, shale gas production has been increasing rapidly, from 108 × 108 m3 in 2018, to 154 × 108 m3 in 2019, and over 200 × 108 m3 in 2020 [8].
However, shale gas research is currently experiencing two main difficulties. First, although important breakthroughs have been made in the exploration and development of shale gas in the Sichuan Basin, showing good development prospects, it is still difficult to predict shale gas sweet spots in regions outside the basin, or in new layers within the basin that have not been explored to the same extent. Second, it is difficult to precisely divide strata associated with a deep water environment from those containing fine-grained sediment (shale) and to define the correlations between similar strata. Making isochronous divisions that appear to identify shale strata, and then determining if the strata are rich in organic matter and brittle minerals are key problems in shale gas geological research and sweet spot prediction [9,10].
With respect to the first problem, researchers globally have generally used geological methods in shale gas research, and these involve the analysis and testing of many factors, such as the organic carbon content, vitrinite reflectance, kerogen type, porosity, permeability, rock density, and isothermal adsorption [11,12]. Such methods require large samples and are time-consuming and costly for sweet spot prediction. Therefore, convenient and cheap methods need to be discovered. With respect to the second problem, the main research methods used in stratigraphic division and correlation are lithostratigraphy, biostratigraphy, chemical stratigraphy, and sequence stratigraphy, all of which have the following advantages and limitations. (1) The main basis of lithostratigraphy is identifying changes in lithology and of lithology combinations [13,14]. The stratification accuracy is determined by a group or segment, which is highly maneuverable. However, for large sets of thick shale, the stratification accuracy is low, and the method cannot meet the demands of shale gas exploration. (2) Biostratigraphy is based on identifying changes in biological fossils and their combinations. The stratification accuracy can apply to groups, segments, and zones, and highly precise divisions of strata and correlations can be achieved [15,16]. However, the method relies on the preservation of biological fossils, and their analysis requires professional identification skills. (3) Chemical stratigraphy is mainly based on identifying changes in chemical elements and their combinations and ratios. The accuracy of stratification is within the chemical zone; data can be easily obtained, and the strata can be divided and compared with high precision [17,18]. However, there are great differences in the horizontal distribution of elements, and it is difficult to achieve large regional correlations between strata. (4) Sequence stratigraphy is based on the relative rise and fall of sea level, which is isochronic, and it can be used to realize stratigraphic divisions and correlations in large areas [19,20,21].However, divisions are based on lithology and seismic and logging information, and the accuracy is therefore still limited, although shale strata can generally be divided into second- and third-order sequences and system tracts [7,22,23,24,25].
This study addresses these two main problems and proposes a method known as “chemical sequence stratigraphy,” which enables the highly precise stratigraphic division of shale sequences and the prediction of sweet spots. The method is based on the use of both sequence stratigraphy and chemical stratigraphy. Using combinations of chemical elements from different origins as an index, the relative sea level changes are analyzed, and the sequence and system tract are divided. On the basis of chemical sequence stratigraphic research, geochemical facies are further divided by iconic elements, and the geochemical facies that are favorable for organic matter development are identified. In favorable geochemical facies, key evaluation parameters are used to evaluate the organic matter content and the rock brittle strength. Finally, the shale gas potential is evaluated, and the sweet spots are predicted. Through drilling production verification and the comparative study of several sections, it is concluded that our method is effective in areas where exploration rates are low and in new layers where data are lacking.

2. Theories and Methods

Sedimentary strata provide a record about the sediment source, sedimentary environment, diagenesis, and chemical element signals. The basic premise of our new method, chemical sequence stratigraphy, is to divide sequences and system tracts using rules associated with variations in chemical element combinations that are associated with different geneses.
It is well known that sea level rise and fall affects changes in the sedimentary environment. In addition, different rock types are formed in different sedimentary environments. These rocks contain various minerals, and the minerals are composed of constituent elements (Table 1); therefore, the elements have genetic significance. For example, Al, K, Ti, and Zr are the most common representative elements of a terrigenous clastic input [26,27,28,29,30], Ca, Mg, Mn, and Ba are the most common representative elements of authigenic precipitation [10,31], and V, U, and Mo are the most common representative elements of reduction environment [32,33,34]. The different chemical elements within strata have particular responses to the relative rise and fall of sea level, and the element combinations therein can be considered as an effective response index. In this study, sequences were divided based on such responses. The geochemical facies were divided based on the chemical sequence stratigraphic framework, and the shale gas sweet spots were ultimately predicted.
The key steps included the following: (1) compiling an optimum geochemical element combination index; (2) establishing a chemical sequence stratigraphy theory model, and dividing the sequence and system tract; (3) classifying and naming geochemical facies and selecting geochemical facies that are favorable for shale gas exploration; (4) evaluating the key chemical parameters of the shale gas sweet spot.

2.1. Optimum Geochemical Element Combination Index

The first step used to develop our method was to establish an optimum geochemical element index. According to chemical stratigraphy research, geochemical elements in marine shale are mainly derived from either authigenic mineral precipitation or crystallization, or from terrigenous detrital, biological enrichment, or submarine hydrothermal inputs [9,10,30,32,33,34]. Of these, submarine hydrothermal inputs are unrelated to changes in sea level, and we thus used three indices to compile the optimum geochemical element combination index: terrigenous input intensity (TII), authigenic precipitation intensity (API), and organic matter adsorption and reduction intensity (OARI). These three indices are described as follows.
(1) Terrigenous input intensity (TII) is a chemical element index that reflects changes in the total terrigenous debris input, and the terrigenous debris input intensity is closely related to the relative rise and fall of regional sea level. With a relative rise in sea level, the area covered by seawater gradually expands, the area of exposed provenance gradually shrinks, the corresponding climate becomes gradually more humid, and the input intensity of terrigenous debris gradually weakens, whereas the opposite occurs with a relative decrease in sea level [10,32]. Because relative sea level rise and fall is regional (and even global), TII was the main index used to analyze chemical sequence stratigraphy.
(2) Authigenic precipitation intensity (API) is a chemical element index that reflects changes in the total amounts of authigenic precipitated or crystalline minerals in the original sedimentary environment. Argillaceous sediments are mainly composed of terrigenous clasts and authigenic precipitated minerals, and their proportional contents have opposite variations; with a relative rise of sea level, the input intensity of terrigenous detritus gradually decreases, while the intensity of authigenic precipitation increases, and the opposite occurs when the relative sea level decreases [10,32,33,34]. Authigenic precipitates or crystalline minerals are formed in both original sedimentary environments and burial diagenetic environments, and the latter does not reflect relative changes in sea level. Therefore, API was selected as an auxiliary index to analyze chemical sequence stratigraphy.
(3) Organic matter adsorption and reduction intensity (OARI) is a chemical element index that reflects changes in the redox intensity and the total amount of adsorbed elements in organic matter and organic-rich clay. Organic matter is usually enriched and preserved in an anoxic reductive environment, but is easily decomposed by oxidizing, or aerobic bacteria in an oxidizing environment [35]. With the relative rise in sea level, there is an increase in the hypoxic area of deep water and a subsequent gradual increase in organic matter, and the opposite occurs with a relative decrease in relative sea level [10,32,33]. As the elements within organic matter and organic-rich clay can also be derived from terrigenous heavy minerals and carbonate minerals, which cannot completely reflect changes in oxidation reducibility, the OARI was also used as an auxiliary index for chemical sequence stratigraphy in this study.
We also used multivariate statistical analyses that included a correlation analysis, principal component analysis, and cluster analysis to select element combinations from the many major and trace elements in shale formations that had similar genetic significance. These three analysis types were used to determine whether the combinations of elements were highly correlated, had a high load value, and had a small Euclidean distance, respectively [9,32,33,35].

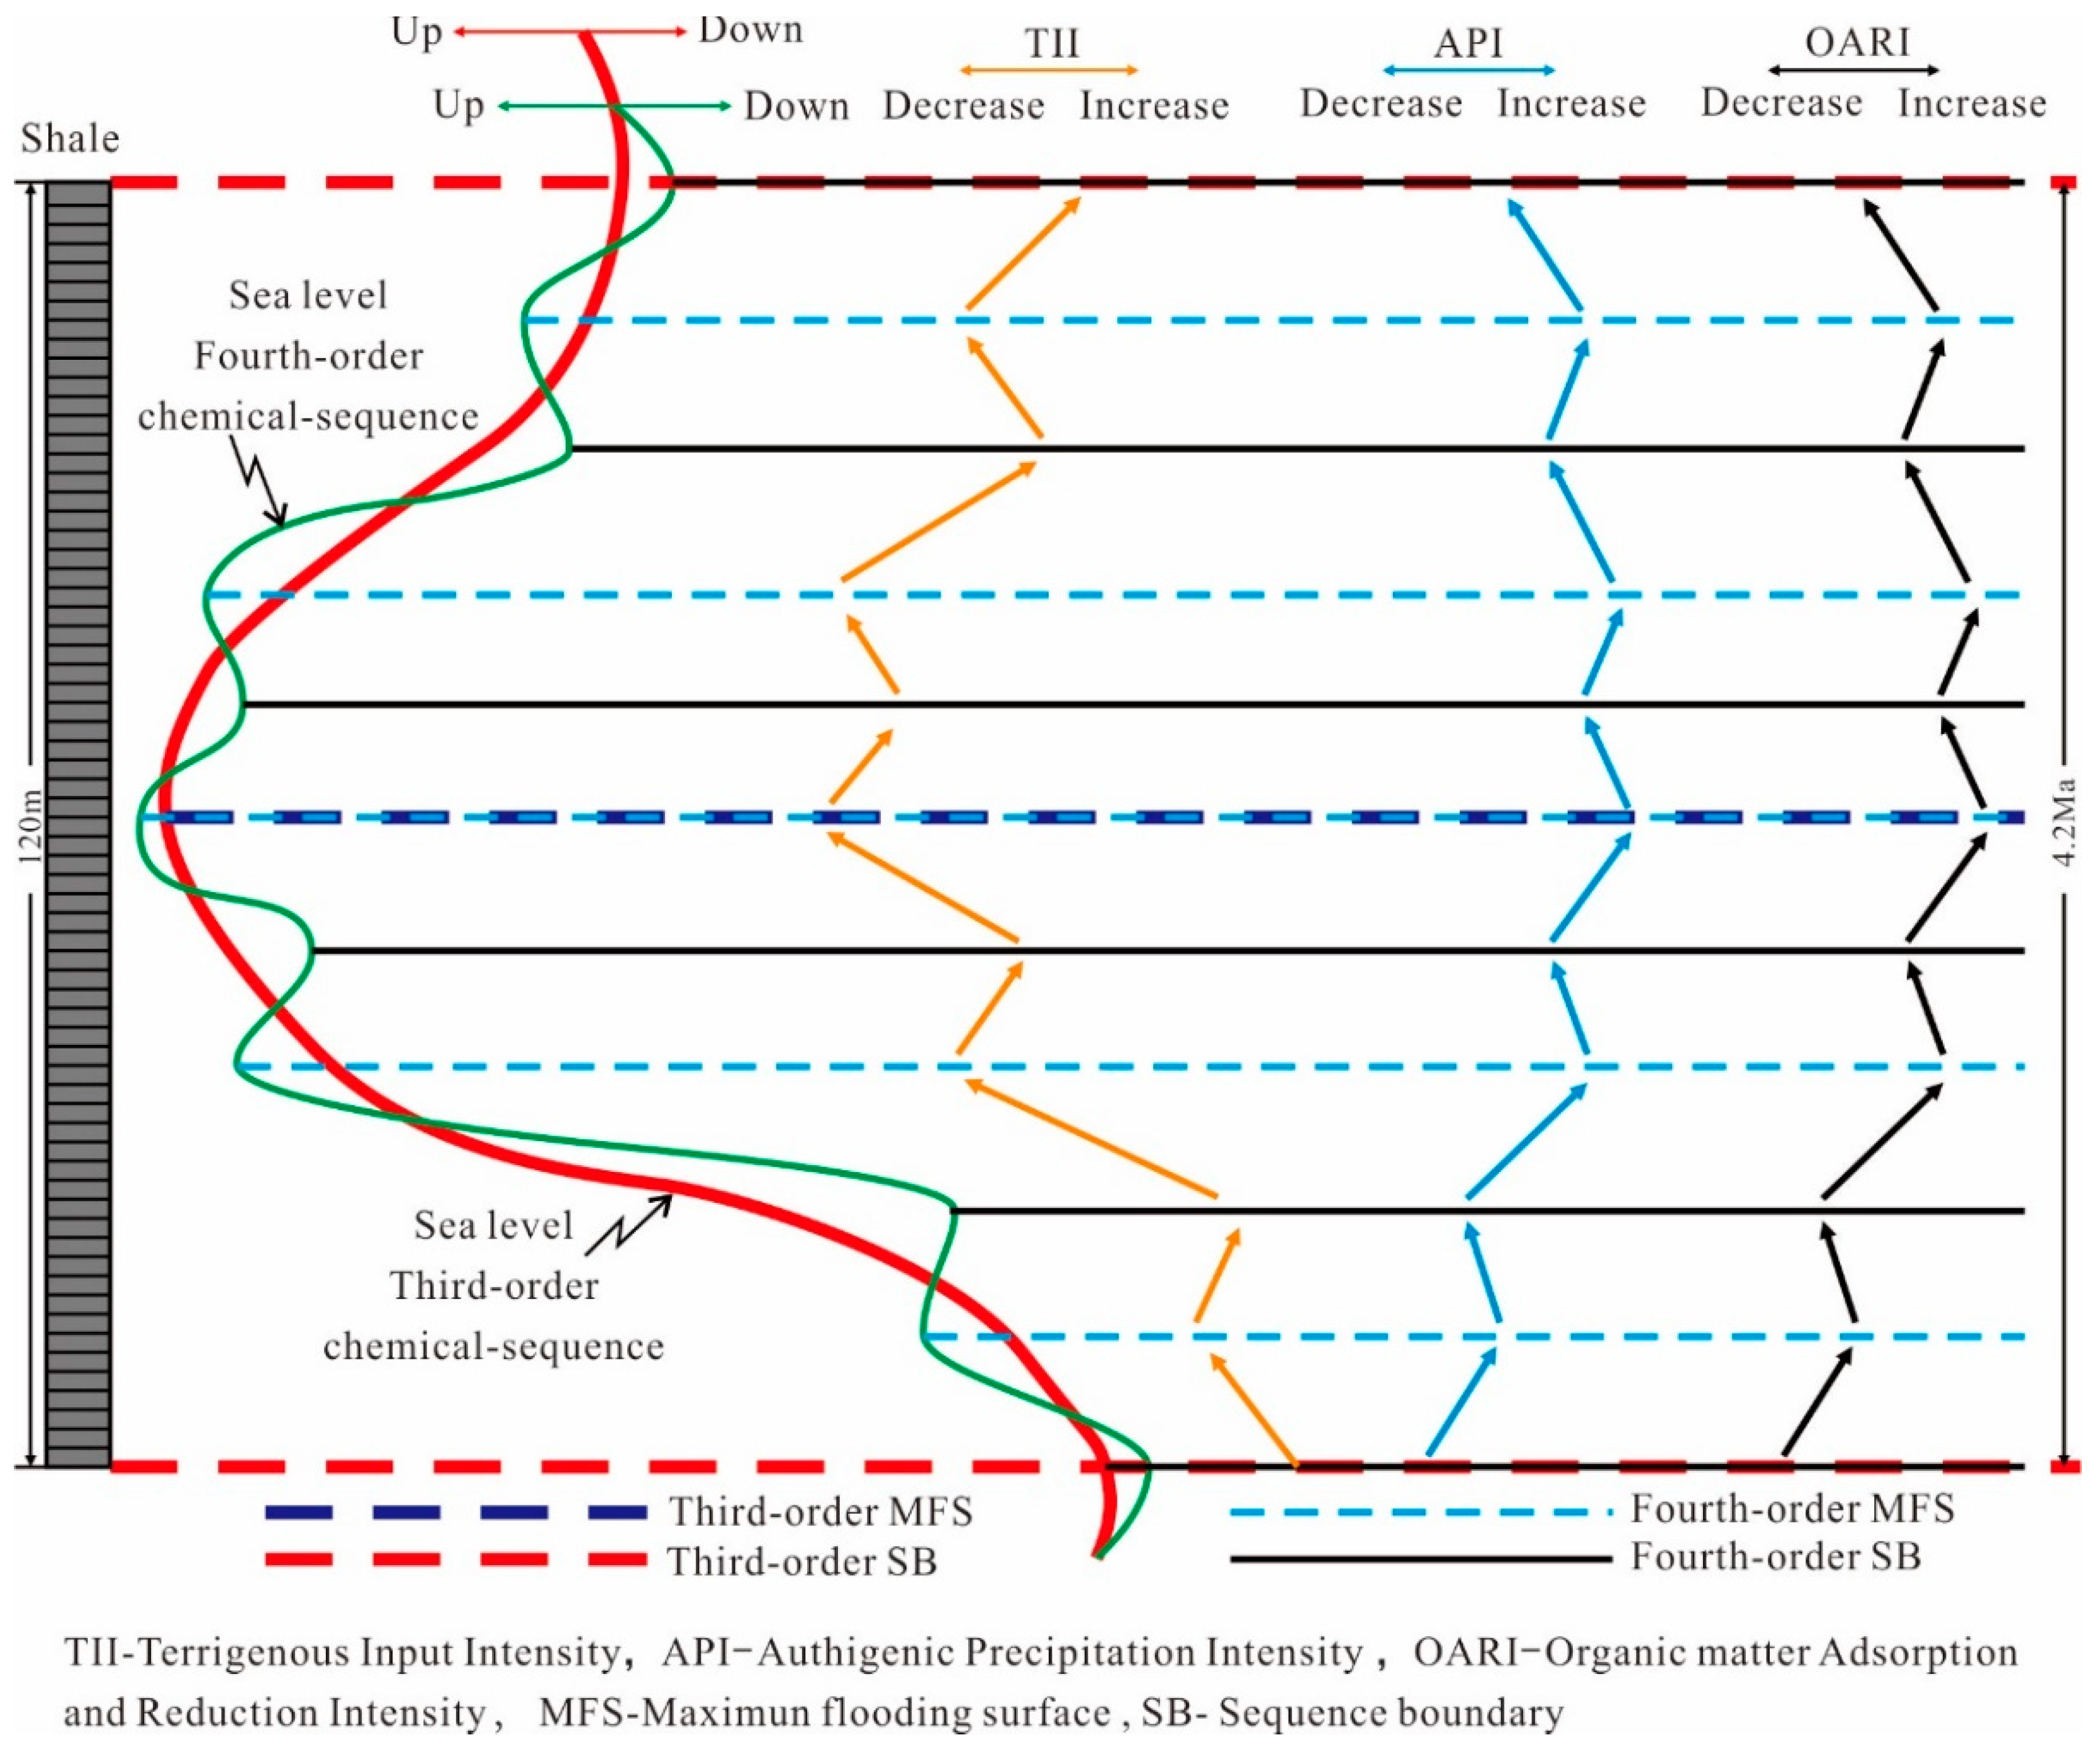
2.2. Establishing the Chemical Sequence Stratigraphy Theory Model

The second step in developing our method was to establish a theoretical chemical sequence stratigraphy model that could be used to divide the sequence and system tracts according to the optimized geochemical element combination index. Chemical sequence stratigraphy is consistent with the transgressive–regressive (T-R) model of classical sequence stratigraphy. The basic theory of the T-R model is that taking the lowest point of relative sea level decline as the sequence boundary, the highest point of relative sea level rise as the maximum sea flooding surface, and a sedimentary sequence with a relative sea level rise and fall cycle as a sequence, the sequences can be divided into transgressive system tracts and regressive system tracts [36,37,38]. Chemical sequence stratigraphy also responds to the relative rise and fall of sea level, which is similar to the T-R model, and the sequences division method of chemical sequence stratigraphy is not determined by lithology, but by geochemical element combination indices. In transgressive systems with a rising sea level, the TII index shows a decreasing trend, while the API and OARI indices show increasing trends. In regressive systems with a declining sea level, the TII index shows an increasing trend, while the API and OARI indices show decreasing trends. The sequence boundaries are located at the maximum value of the TII index and the minimum values of the API and OARI indices, and the maximum sea flooding surface is located at the minimum value of the TII index and the maximum values of the API and OARI indices (Figure 1).

2.3. Dividing Geochemical Facies

Large sets of thick shale are generally formed in a deepwater environment, and sedimentary facies are generally stable. We cannot distinguish shale gas favorable facies from monotonous facies by traditional sedimentary study. Although some sedimentary microfacies can be divided, the results are still far from the requirements for identifying shale gas sweet spots. The third step used to develop our method was to divide and name the geochemical facies. The geochemical facies were classified based on the chemical sequence stratigraphic framework, and these were more precise than sedimentary facies.
Geochemical facies contain main geochemical element combinations that reflect changes in sedimentary environmental conditions [39]. To analyze geochemical facies using the method developed, Al standardization and enrichment factor (EF) transformation of elements are conducted, which are explained as follows.
(1)
The main aim of the Al standardization of elements is to attenuate the effects of the terrigenous detrital input and amplify the effects of the non-terrigenous input element [40,41], calculated as
Al standardized value of the element (X): Al-X = X/Al.
(2)
The main aim of the enrichment factor transformation of elements is to clearly determine whether an element is rich or deficient within a sample [33], and the calculation formula is the ratio of the standardized Al value of an element in the shale samples to the standardized Al value of the same element of the world average shale [42,43,44],
EF transformative value of the element (X): EF-X = (X/Al)sample/(X/Al)AS,
where AS represents “global average shale.” When EF-X is equal to 1, the element X of this sample has the same enrichment degree as that of globally average shale; when EF-X is less than 1, X of this sample is less deficient than that of globally average shale; and when EF-X is greater than 1, X of this sample is richer than that of globally average shale [10]. In our method, we divide the value of EF-X into six levels: EF-X  <  0.1 is extremely deficient, 0.1  ≤  EF-X  <  0.5 is deficient, 0.5  ≤  EF-X  <  1 is slightly deficient, 1  ≤  EF-X  <  2 is slightly rich, 2  ≤  EF-X  <  5 is rich, and EF-X  ≥  5 is extremely rich.
In general, a depositional environment with a low terrigenous detrital input intensity, low authigenic precipitation intensity, and a high adsorption and reduction organic matter intensity is favorable for the enrichment of organic matter in shale, and vice versa. In other words, when the TII index is more deficient, the API index is more deficient, and the OARI index is richer, we know that the organic matter is more enriched. Conversely, when the TII index is richer, the API index is richer, and the OARI index is more deficient, the organic matter is more deficient.
To reduce the variables, the most sensitive elements in TII, API, and OARI are further screened out. In general, the most iconic element of TII is Al, the most iconic element of API is Ca, and the most iconic element of OARI is V, U, or Th [9,10,30,32,33,34]. Organic matter is most enriched in geochemical facies when EF-Al is extremely deficient, EF-Ca is extremely deficient, and EF-V, EF-U, or EF-TH are extremely rich; such facies are the most favorable geochemical facies for shale gas exploration.

2.4. Evaluation Key Chemical Parameters

The final step in the model process is to evaluate the key chemical parameters of the shale gas sweet spot based on chemical facies division.
The shale gas sweet spot is a shale segment that has a high gas content, with high productivity [9,45]. The shale gas content has a very close relationship with the total organic carbon (TOC) content, and the brittleness of shale is an important factor affecting shale gas productivity [46,47]. In our model, the TOC is described using the TOC geochemical index, and shale brittleness is described using (SiO2 + CaO) as a substitute geochemical index. The shale gas potential can be evaluated and the sweet spot predicted based on these two parameters, which are described as follows.
(1) Total organic carbon (TOC) index: Results show that the TOC is positively correlated with shale gas content. In the lower Silurian shale in southern China, when the TOC is >1.0%, the shale gas content is >1.2 m3/t; when the TOC is >2.0%, the shale gas content is > 2.0 m3/t; and when the TOC is >3.0%, the shale gas content is >4.0 m3/t [1]. The shale gas content can be determined by calibrating the TOC measured data, and the its potential can be predicted.
In this study, The shale gas potential is divided into three levels, according to the TOC: when TOC is < 1%, the shale gas potential is average; when 1%  ≤  TOC  <  3%, the shale gas potential is good; and when the TOC is ≥3%, the shale gas potential is excellent.
(2) (SiO2 + CaO) index: The matrix permeability of shale is low (generally less than 0.1 × 10⁻³ μm2), and the existence of fractures can significantly improve shale gas productivity [48]. Shale segments that have a high brittle mineral content and strong brittleness are conducive to the formation of natural fractures and artificial fracturing [49]. The brittle mineral content of Wufeng–Longmaxi shale in the Changning gas field, the Weiyuan gas field, the Taiyang gas Field, and the Fuling gas field is 42–95%, 42–96%, 55–70%, and 50–80%, respectively [8]. Its average value is therefore approximately 66%, which shows that the brittle mineral content is relatively high. The brittle minerals in shale are non-clay minerals and are mainly silicate and carbonate minerals. The SiO2 content has a good positive correlation with the silicate mineral content, and the CaO content has a good positive correlation with the carbonate mineral content [8,50]. Therefore, the relative content of (SiO2 + CaO) can represent the relative contents of silicate and carbonate minerals, and as such, can be used as a substitute index for the brittle mineral content in shale.
In this study, the brittleness of shale is divided into two grades according to the relative content of (SiO2 + CaO): when (SiO2 + CaO) < 70%, the shale has low brittleness, and when (SiO2 + CaO) ≥ 70%, the shale is highly brittle. In conclusion, shale layers that have an excellent potential (TOC  ≥  3%) or a good potential (1%  ≤  TOC  <  3%) and high brittleness ((SiO2 + CaO) ≥ 70%) can be predicted, and shale sweet spots can be determined.

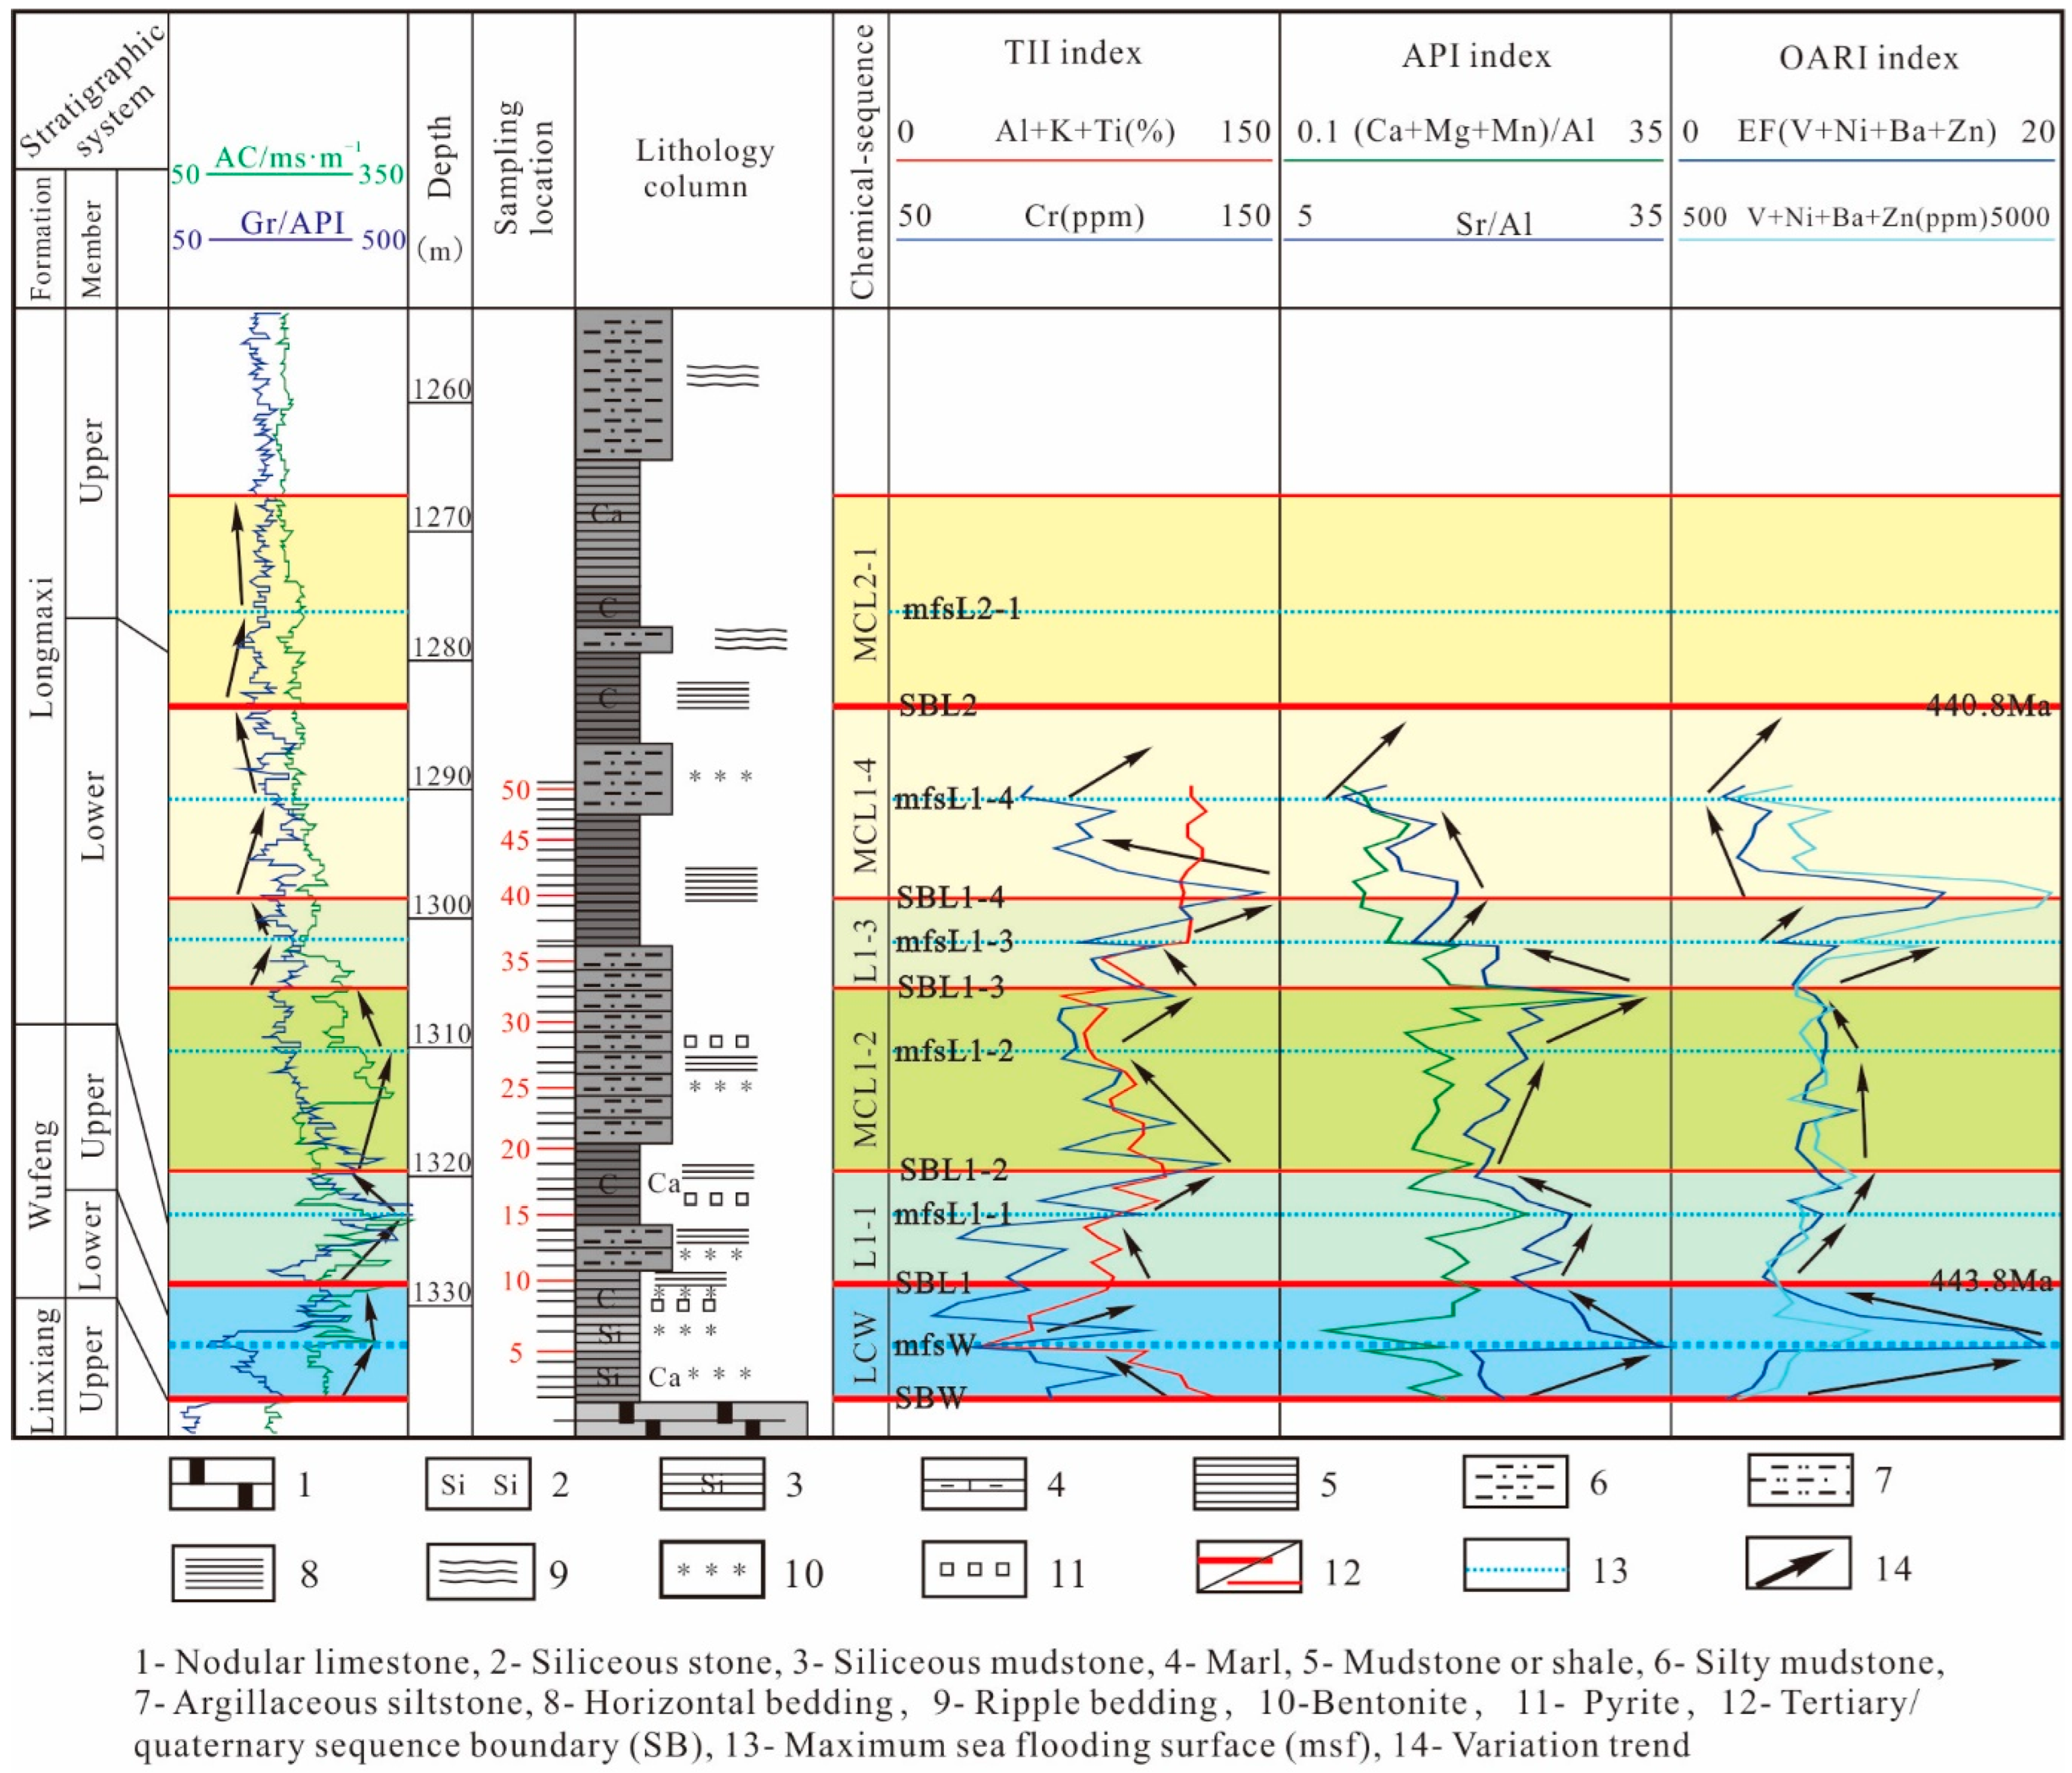
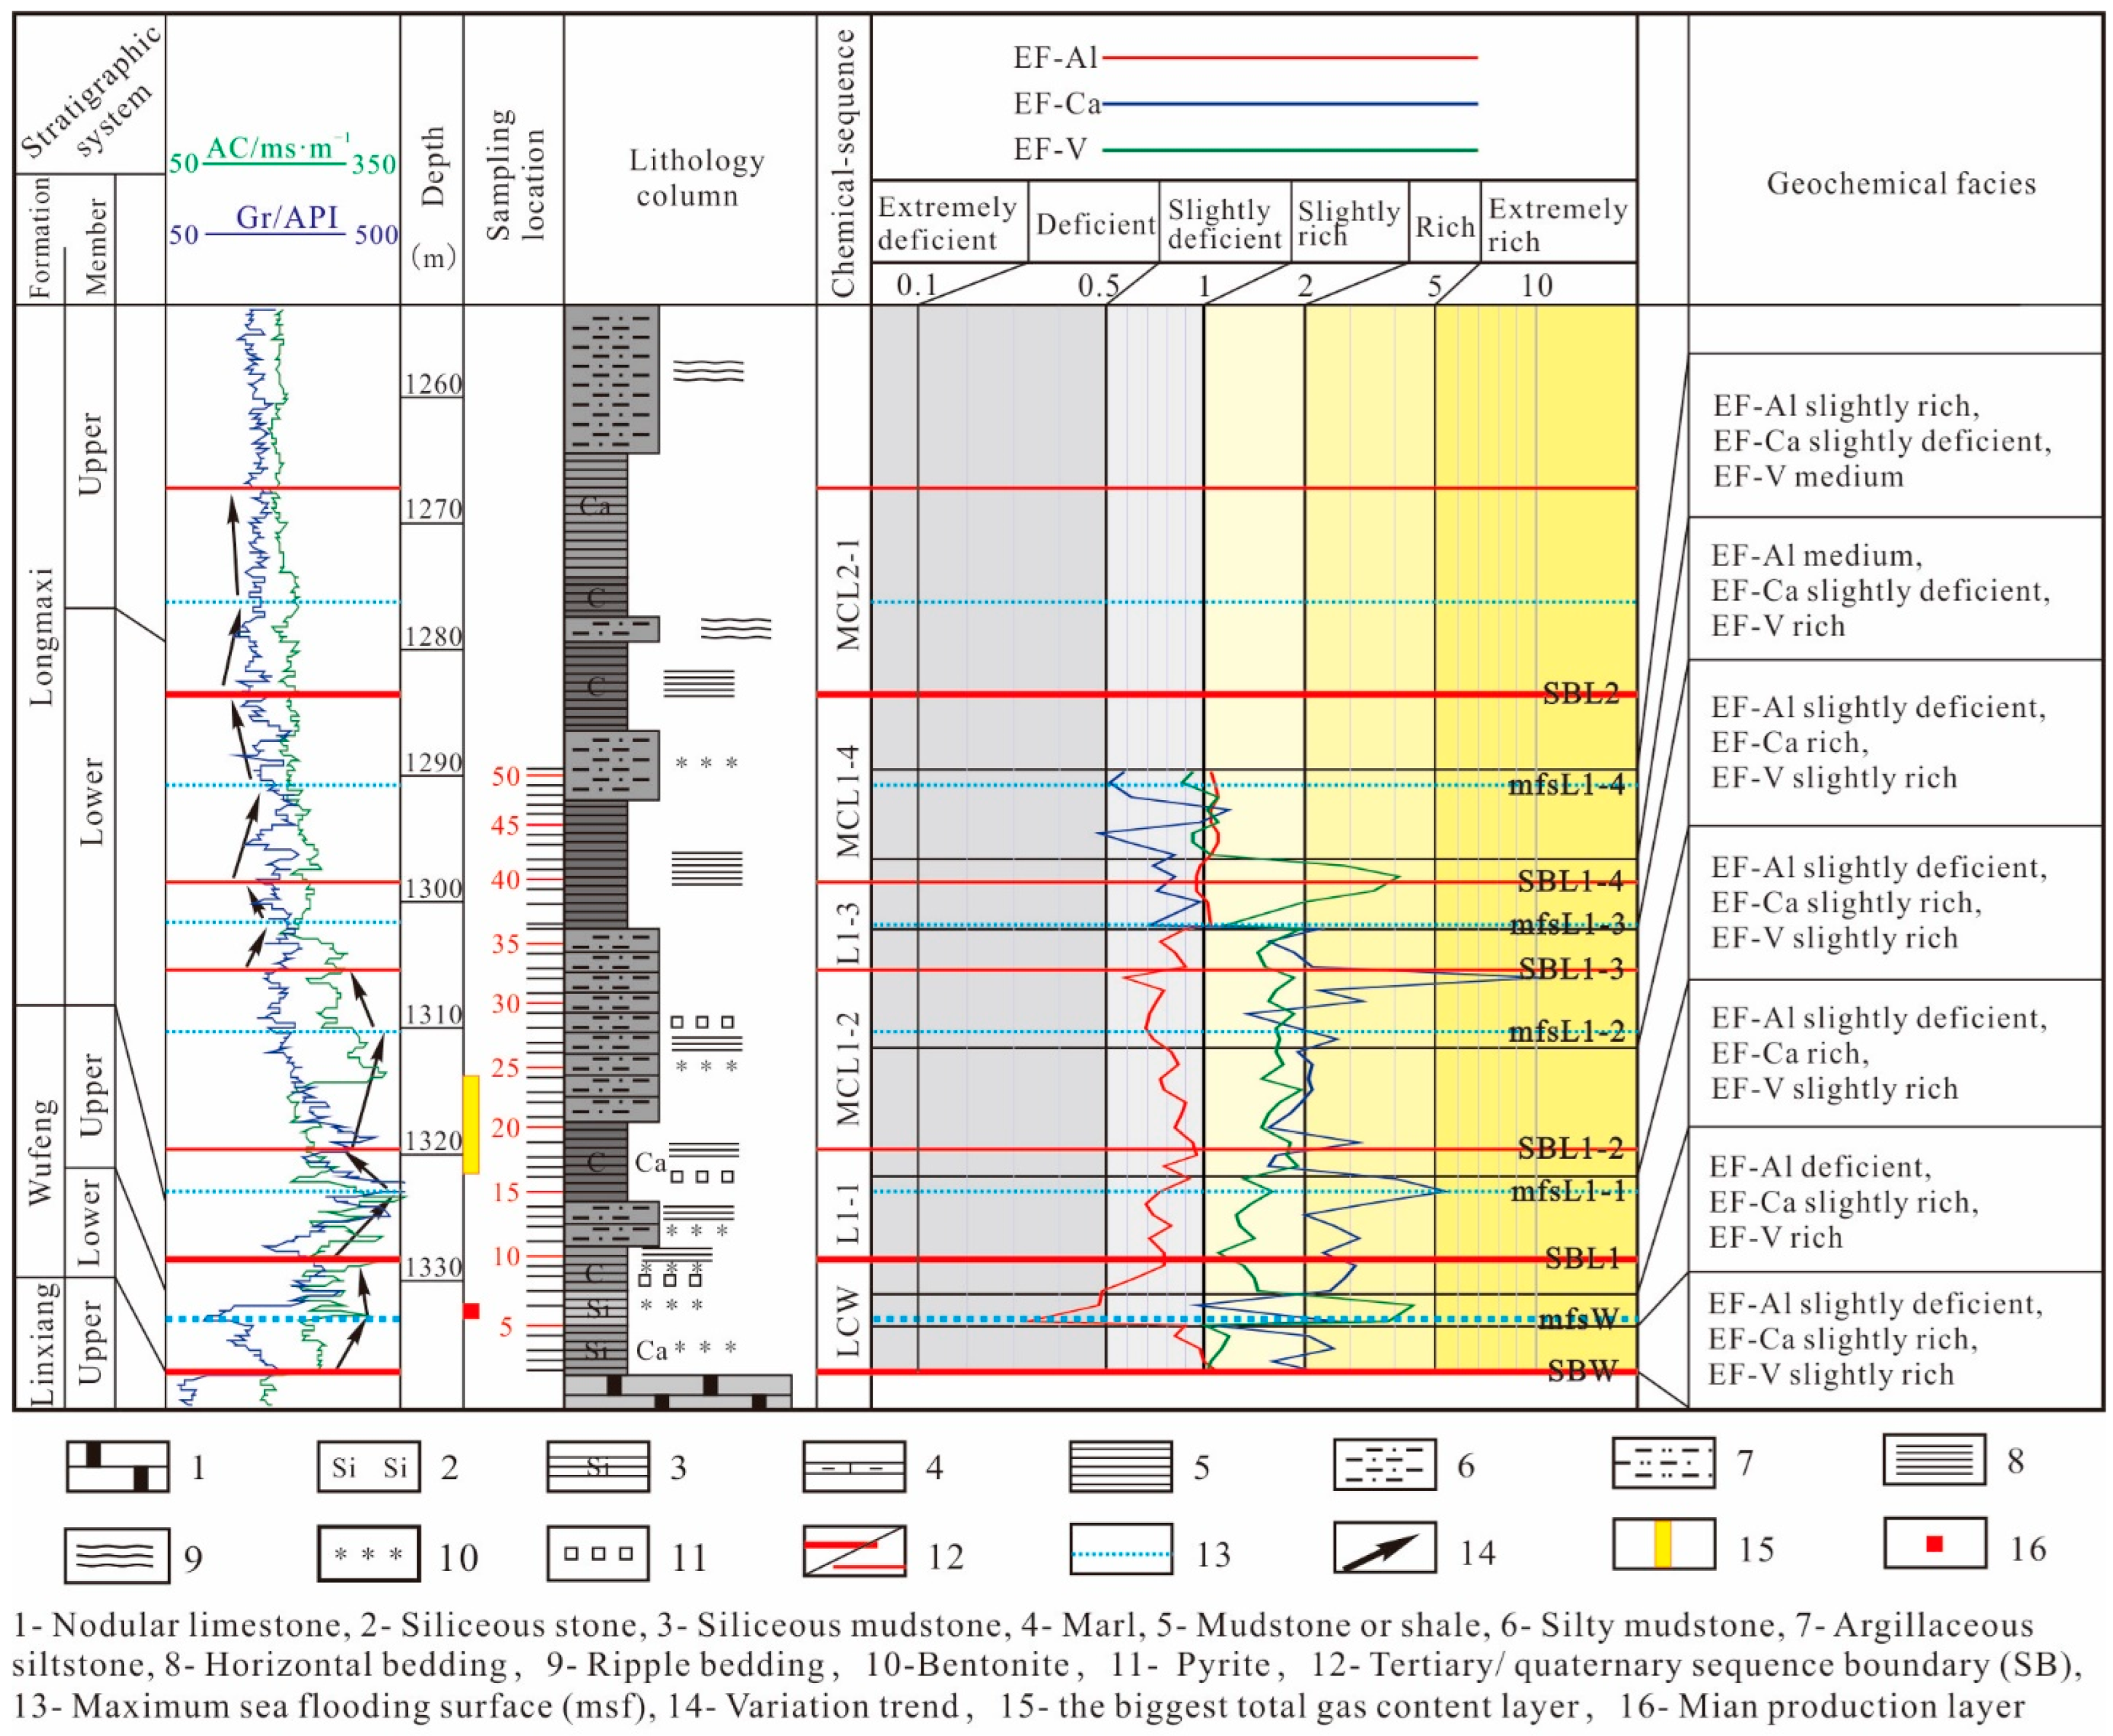
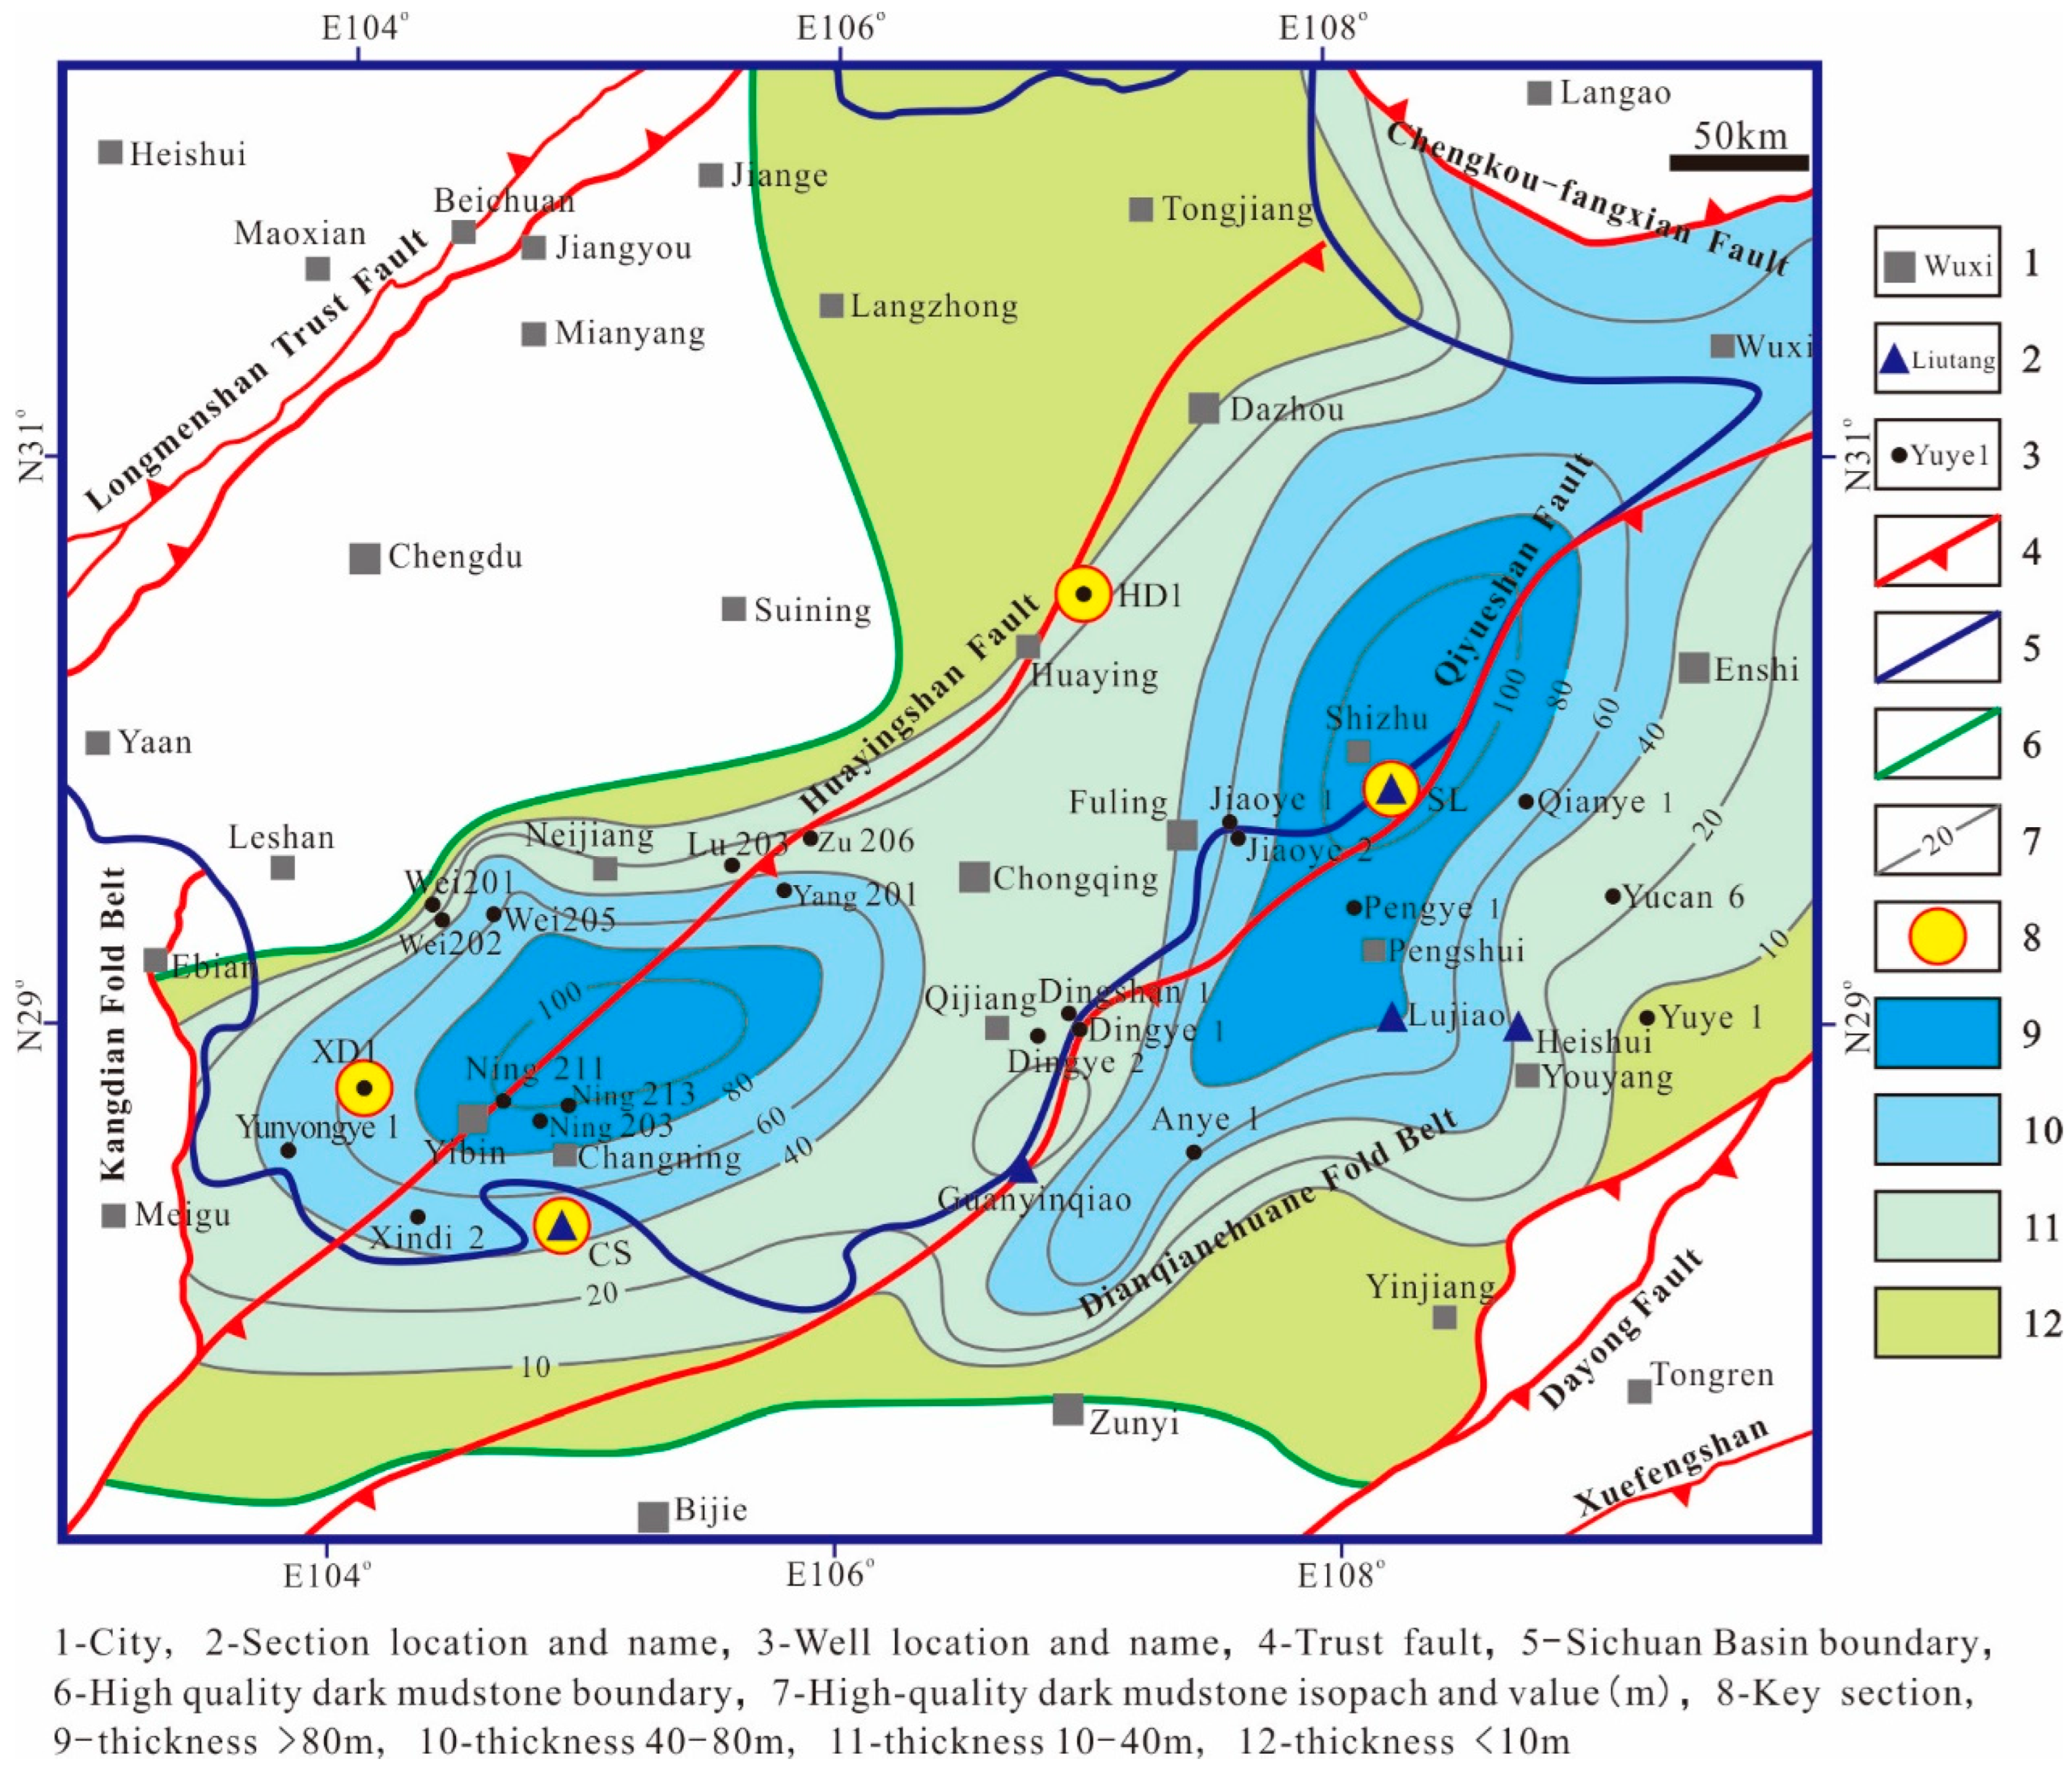
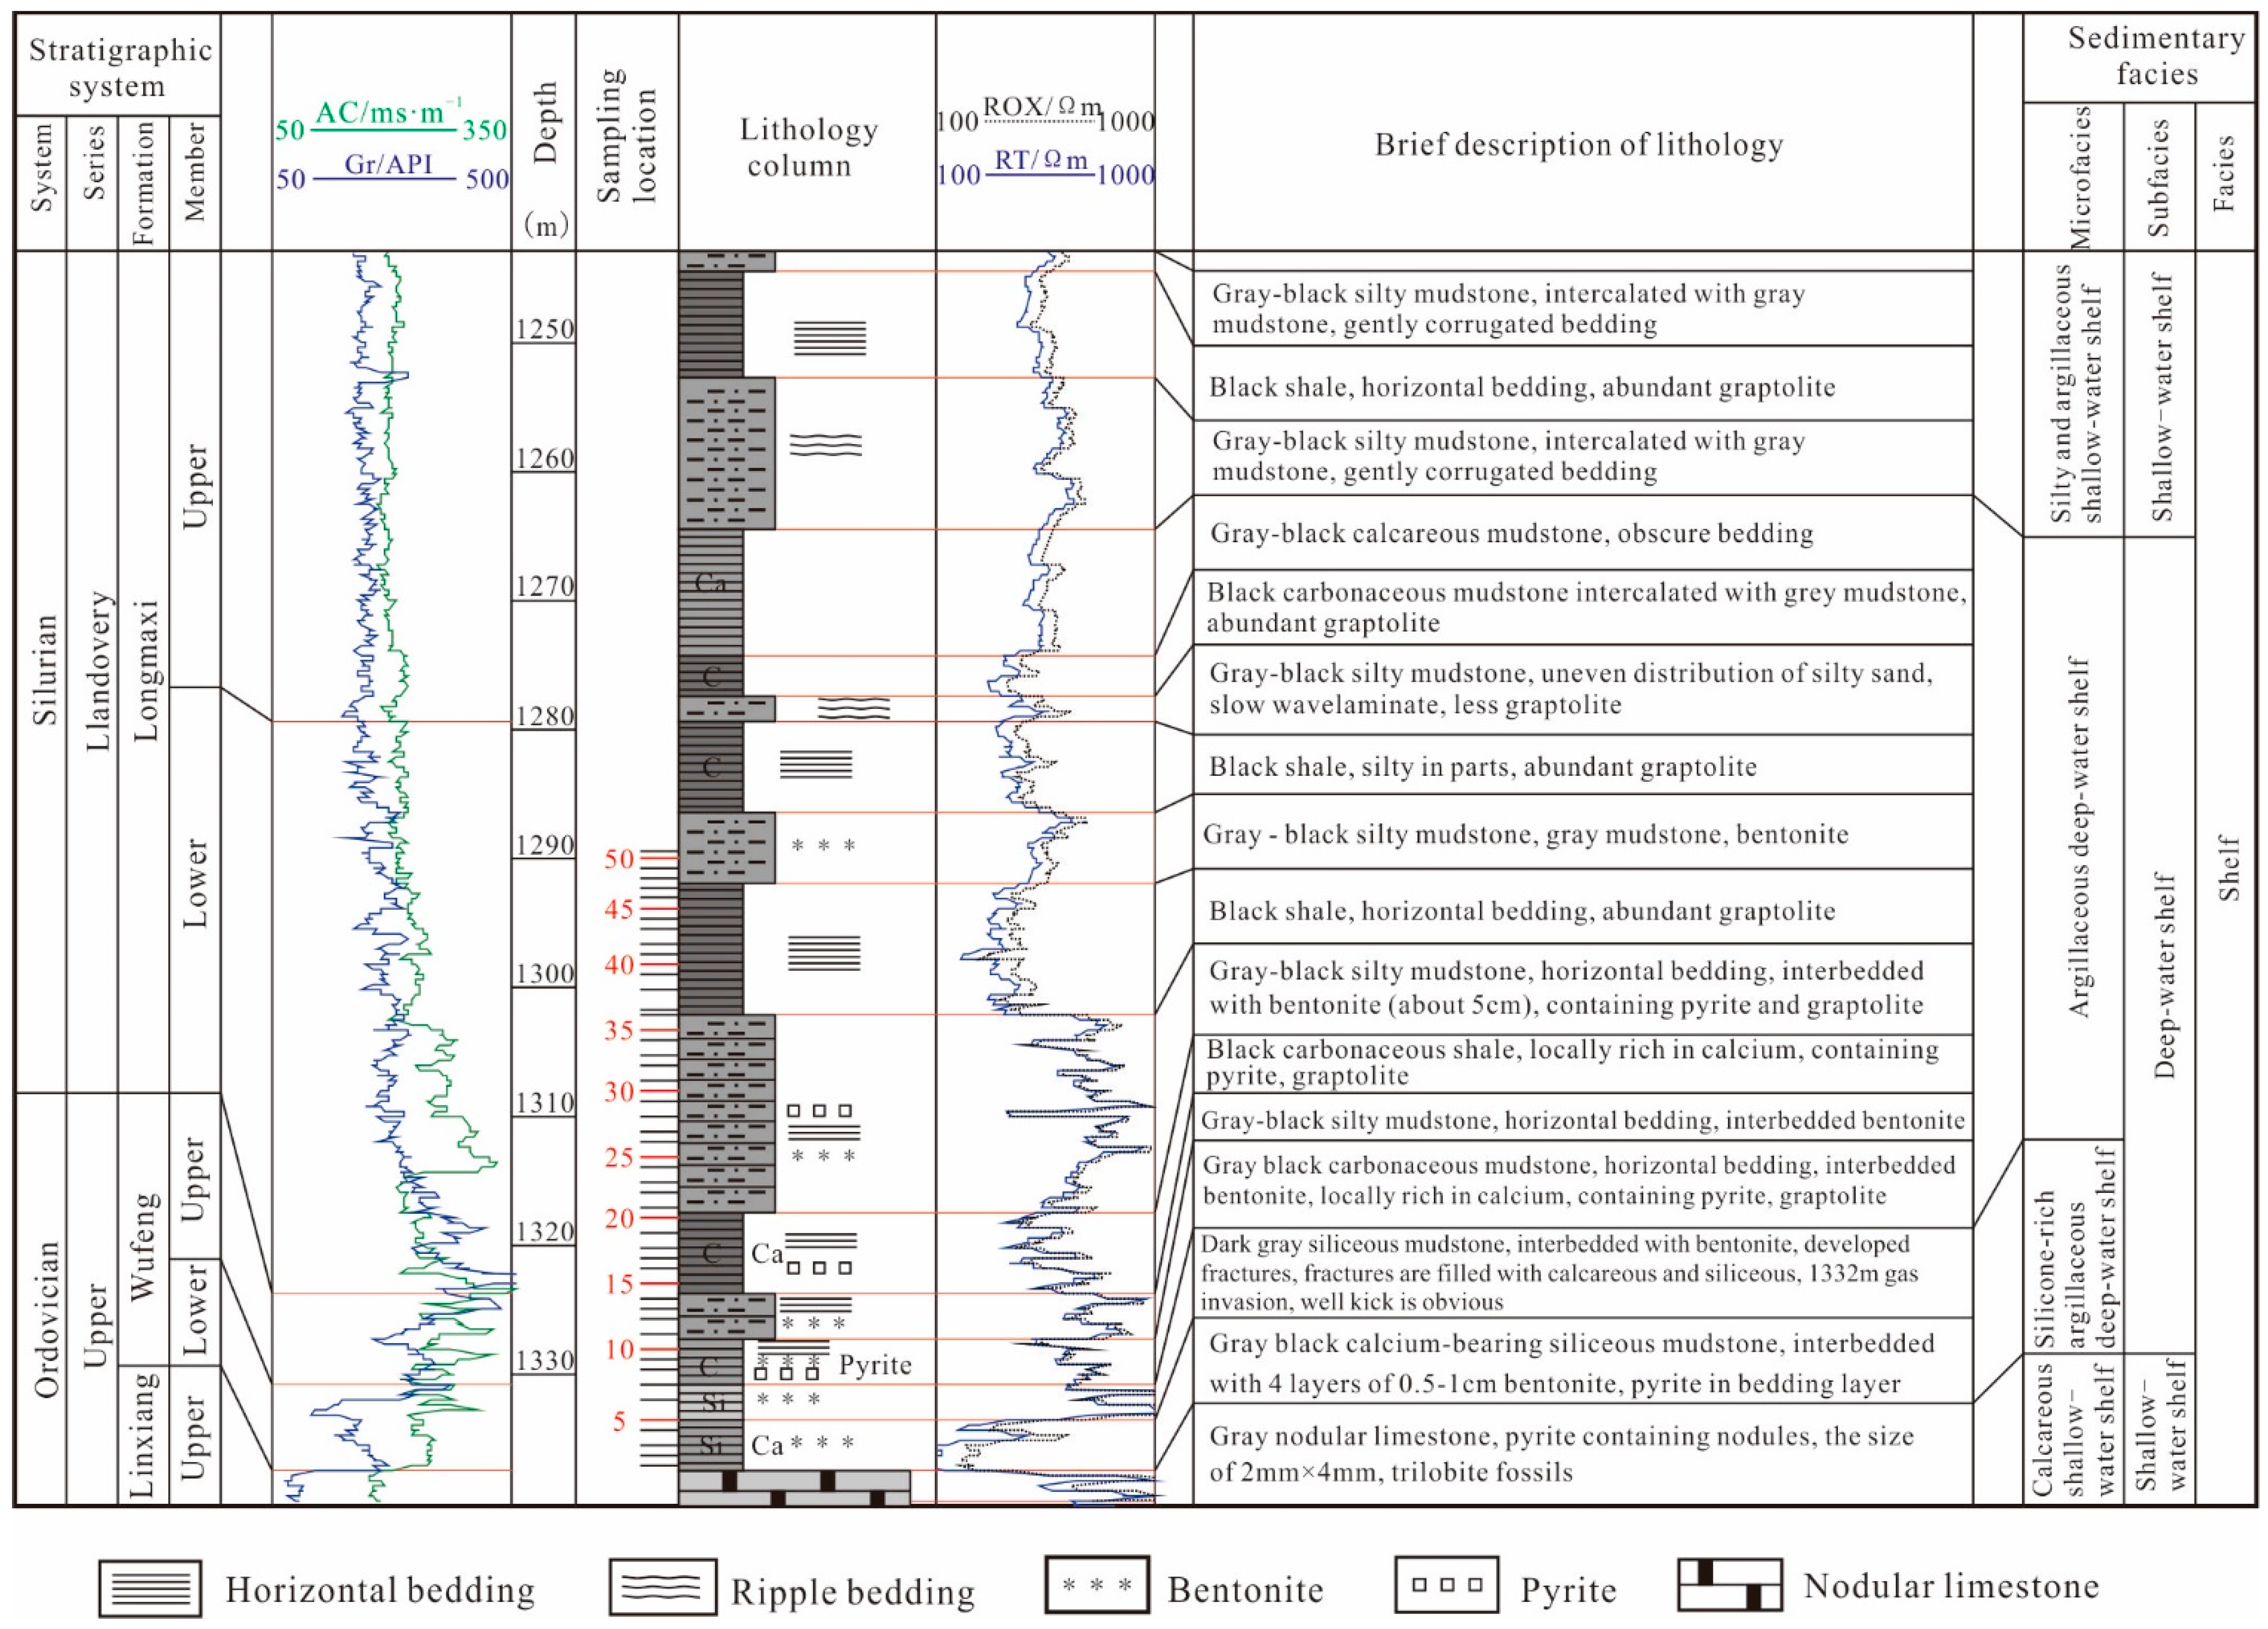
3. Section and Samples

The principles and methods used in chemical sequence stratigraphy were applied to four sections with large spans in the upper Yangtze region, namely the Changning Shuanghe (CS) section, the Shizhu Liutang (SL) section, and sections in the Xindi 1 (XD1) well and the Huadi 1 (HD1) well (Figure 2). The CS section and SL section are located approximately 348 km apart in the northwest margin of the Dianqianchuane fold belt. HD1 and XD1 are located approximately 340 km apart in the Sichuan basin. In the northeast, the SL section is located approximately 135 km from HD1, and in the southwest, the CS section is located approximately 80 km from XD1. A comparative analysis of the chemical sequence stratigraphy, geochemical facies, and key indices was conducted between the sections, and shale gas sweet spots were predicted in the Wufeng–Longmaxi Formations within the upper Yangtze region. Taking HD1 as an example, the application of chemical sequence stratigraphy in shale gas sweet spot prediction is briefly discussed in the following paragraphs.
HD1 is located in the high part of the Sihaishan–Honghuadian segment within the Huayingshan anticline, which is located in the high and steep fold belt of the eastern Sichuan Basin, where the Triassic is exposed (Figure 2). From bottom to top, the following are revealed: the middle Ordovician Shizipu Formation, the upper Ordovician Baota Formation, the Linxiang Formation, the Wufeng Formation, the Silurian Llanovery Longmaxi Formation, the Shiniulan Formation, the Silurian Wenlock Hanjiadian Formation, the upper Carboniferous Huanglong Formation, the lower Permian Liangshan Formation, the middle Permian Qixia Formation, the Maokou Formation, the upper Permian Longtan Formation, and the Changxing Formation. The Ordovician Wufeng Formation and the Silurian Longmaxi Formation are the main drilling targets.
The Wufeng Formation (O3w) has a thickness of 13.74 m, is divided into upper and lower sections, and is in integrated contact with the underlying Linxiang Formation. The Longmaxi Formation (S1l) has a thickness of 486.4 m, is divided into upper and lower sections, and is in integrated contact with the underlying the Wufeng Formation and overlying the Shiniulan Formation. Lithologically, the Wufeng Formation mainly comprises calcium-siliceous mudstone, siliceous mudstone, carbonaceous mudstone, and silty mudstone. The lower section of the Longmaxi Formation comprises carbonaceous shale, shale, calcareous mudstone, and interbedded silty mudstone, with unequal thickness that is dominated by black shale. The upper section of the Longmaxi Formation comprises silty carbonaceous mudstone, carbonaceous silty mudstone, silty mudstone, mudstone, and carbonaceous mudstone. With respect to their sedimentary environments, the lower section of the Wufeng Formation is a silica-rich argillaceous deepwater shelf, the upper section of the Wufeng Formation and the lower section of Longmaxi Formation are argillaceous deepwater shelf microfacies, and the upper section of the Longmaxi Formation is a silt-rich argillaceous shallow water shelf microfacies (Figure 3).
In HD1, the Wufeng–Lower Longmaxi Formations were cored continuously, and 51 samples were collected. The samples from the Wufeng Formation were numbered D1–D14, and those from the Lower Longmaxi Formation were numbered D15–D51 (Figure 3).

4. Data Processing and Analysis

Mineralogical and geochemical tests were conducted on 51 samples obtained from HD1. Mineralogical tests of the samples were conducted using thin section authentication and X-ray diffraction (XRD), and the major and trace elements were determined using a wavelength dispersive X-ray fluorescence (XRF) spectrometer. The analysis was finished in Experimental Center of Research Institute of China University of Geosciences (Beijing).

4.1. Data Processing

Data processing included zero value processing and outlier value processing, which are described as follows.
(1) Zero value processing: The zero value in the data is not the real zero value; rather, it is a missing value caused by the content of certain instrument [51]. chemical elements in the sample being less than the minimum detection value of the detection The existence of a zero value has an important influence on evaluating parameters and analyzing the structure of data, and it can destroy the ability to determine a real relationship between components or variables. In particular, it is not possible to conduct a subsequent logarithmic transformation of data [52,53]. Methods used to manage the effects of zero values (missing values) in data mainly include the correlation variable correction method, the maximum expectation algorithm, and the empirical value method. For the data of HD1, the correlation variable correction method was adopted. When the zero value appears in part of the data of element X, another element of the same sample needs to be chosen as an aim element. The selection criteria for the aim element is that it has no zero value and has a high correlation coefficient (R2) with element X. To replace the missing value of element X, an appropriate value that was lower than the lowest detected value was obtained by multiplying the data of the aim element by the given coefficient.
(2) Outlier value processing: Outlier values can significantly affect the results of statistical calculations, especially those based on covariance [54,55]. Multivariate statistical methods are generally used to detect and manage outlier values. It is generally assumed that the values of variables have a normal or lognormal distribution [56]. In this study, no outlier values were found after zero value processing.

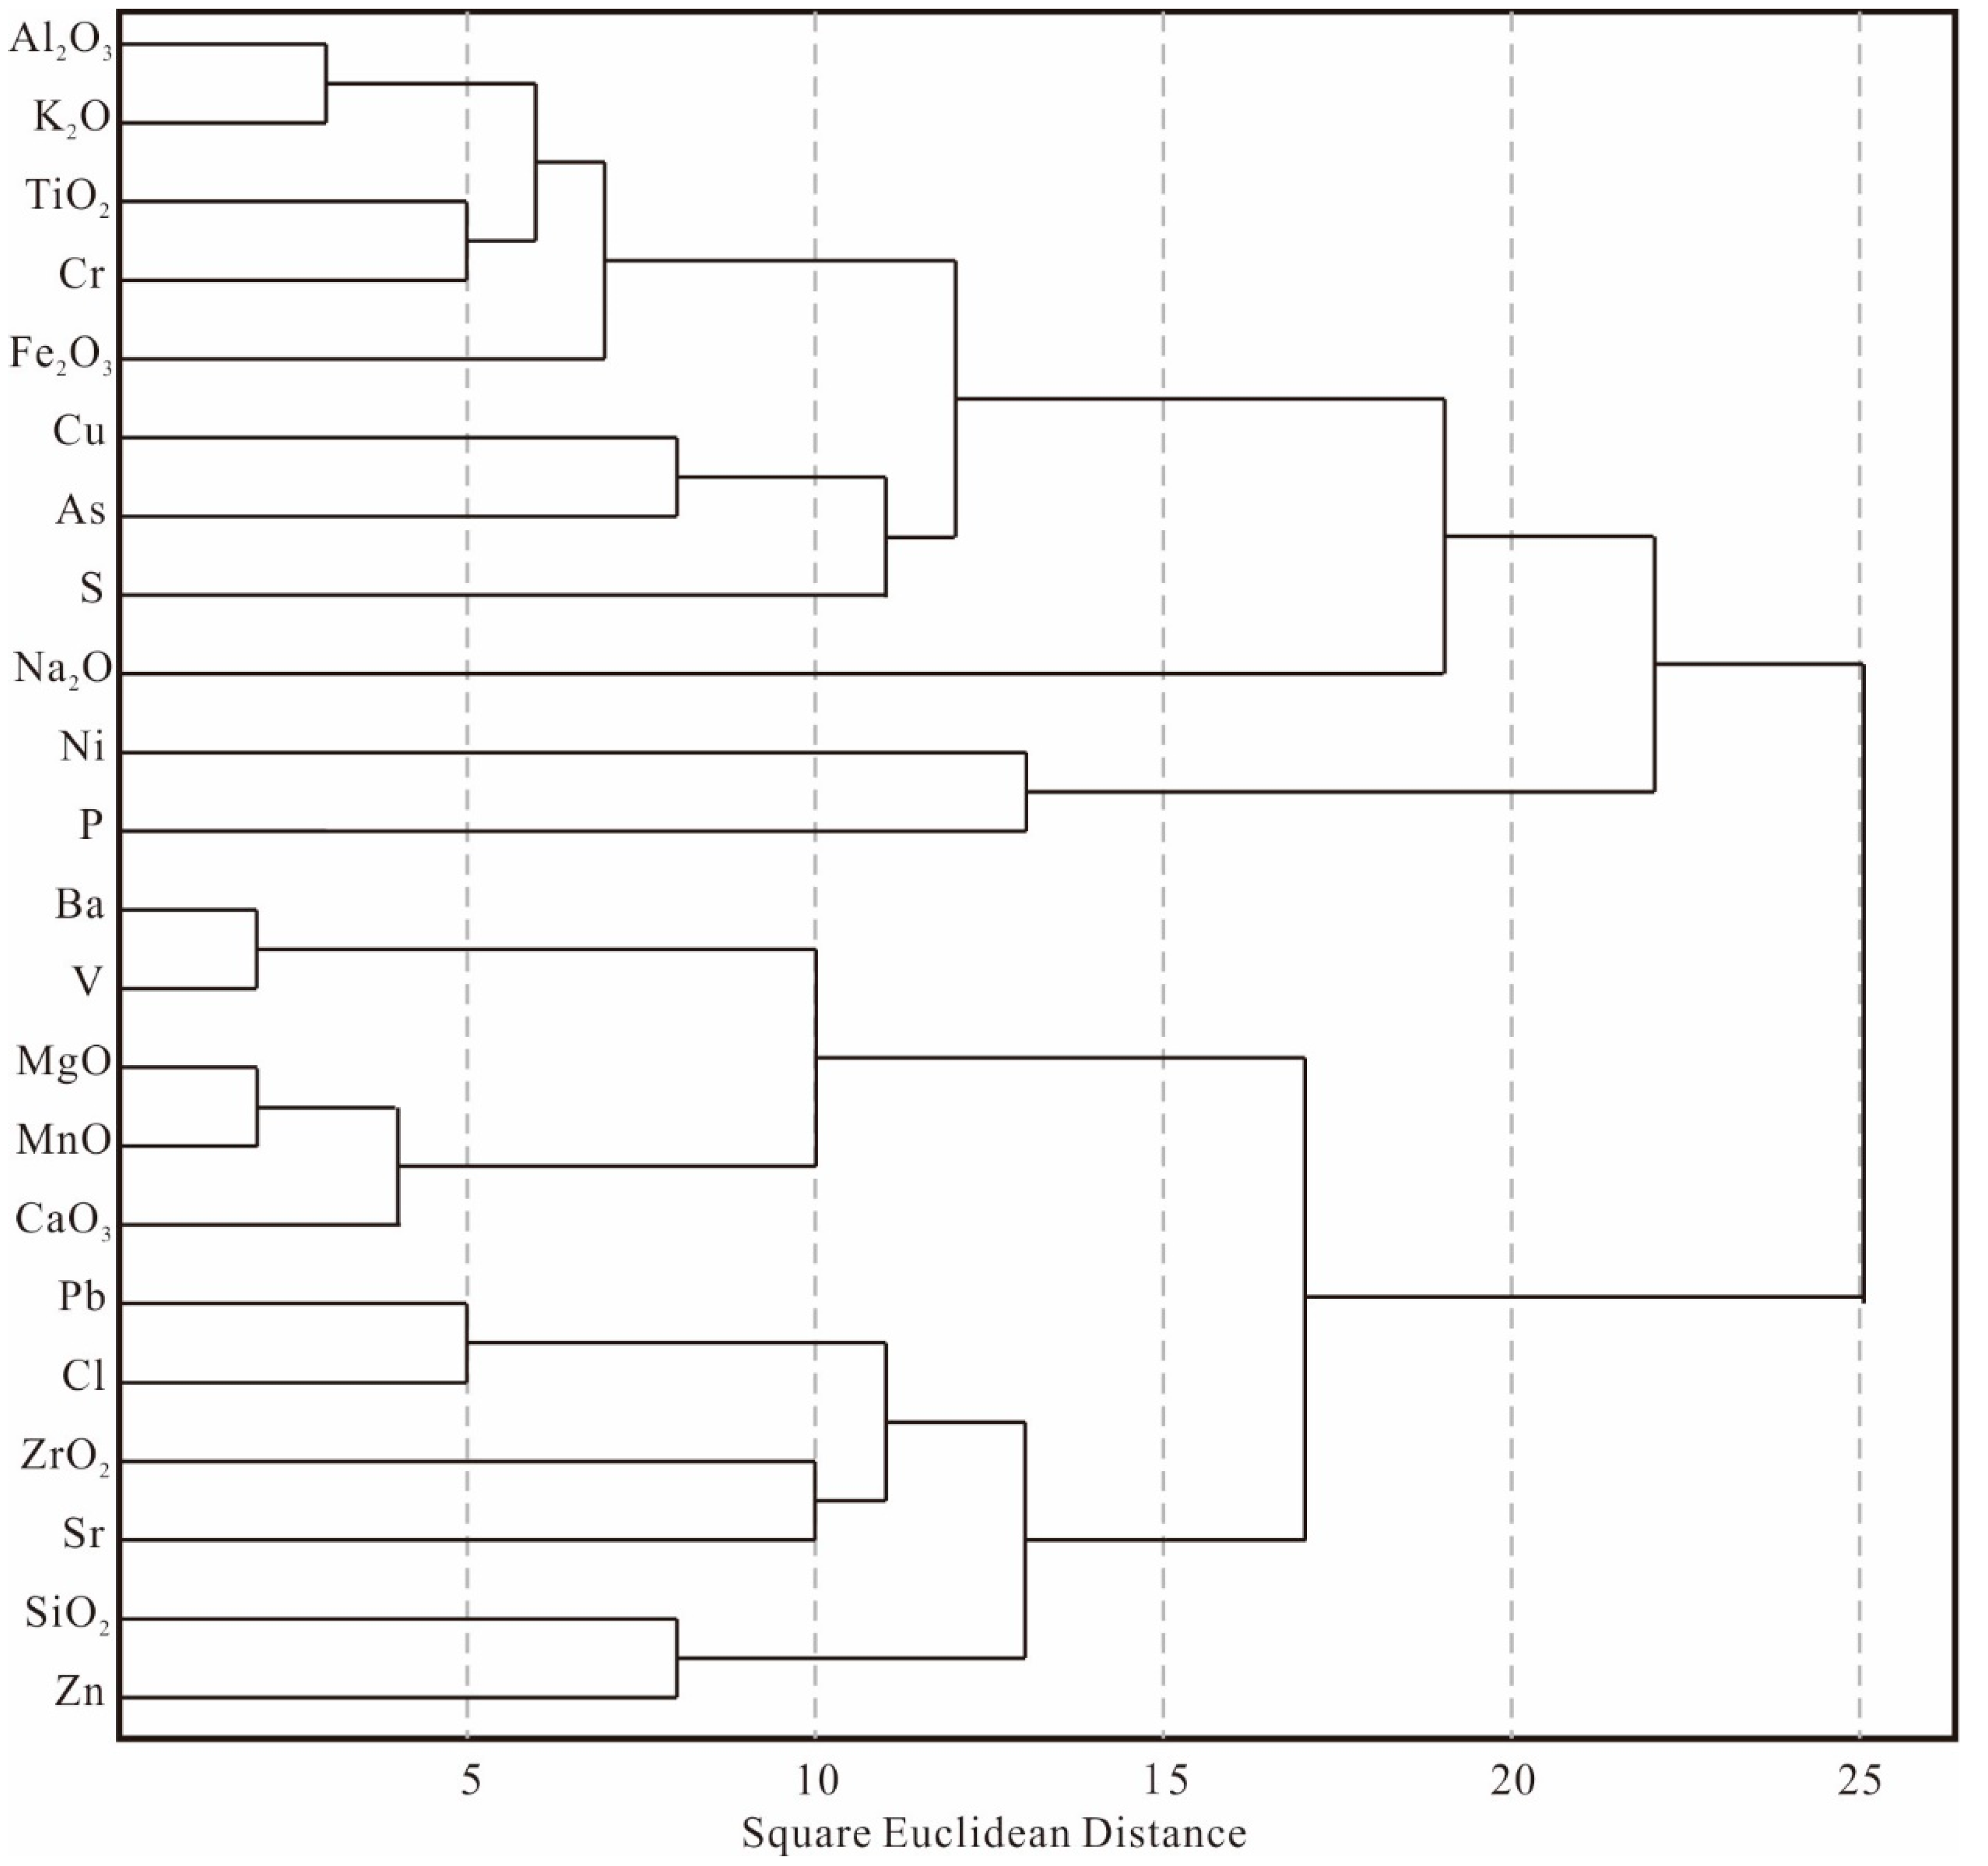
4.2. Data Analysis and Index Optimization

The following minerals were detected in HD1: clay minerals, quartz, feldspar, calcite, pyrite, and mica. The main elemental oxides detected were Fe2O3, Al2O3, K2O, Na2O, MgO, TiO2, ZrO2, CaO, SiO2, and MnO. The trace elements detected were Zr, V, Cr, Ni, Zn, Cu, Ba, P, As, Pb, Sr, S, and Cl. The correlation analyses of these elements and minerals were conducted. Although SiO2 had a very good positive correlation with quartz (R2 = 0.892), it could not be selected as an indicator because of its unclear chemical stratigraphy significance. It was considered possible that the high correlation could be a response to both terrigenous clastic quartz and to chemical and biological quartz, but the chemical stratigraphic significance of the two types of quartz would be quite different. The main terrigenous minerals were feldspar and clay minerals, and these were positively correlated with Al2O3, K2O, TiO2, and Cr; for example, the R2 value between clay minerals and Al2O3 was as high as 0.931. The main authigenic precipitated minerals were calcite, dolomite, and pyrite, and there were obvious positive correlations with CaO, MnO, and P2O5. For example, the R2 value of calcite and CaO was as high as 0.897. The R2 value between TOC and V, Ni, and Zn was above 0.5, and the R2 value between TOC and V was as high as 0.678. These results show that Al was the typical terrigenous input indicator, Ca was a typical authigenic precipitation indicator, and V was a typical organic matter adsorption indicator. These calculation results are basically consistent with those summarized in previous studies (Table 1). However, to optimize the combination of elements that had the same genetic significance, SPSS statistical software was used to analyze the data, and the following analyses were conducted.
(1) Correlation analysis: As shown in Table 2, the R2 value of Al2O3 and K2O was 0.92, the R2 value of Al2O3 and TiO2 was 0.61, and the R2 value of Cr and TiO2 was 0.60. Furthermore, the R2 value of CaO with MgO, MnO, and Sr was 0.53, 0.48, and 0.82, respectively, and the R2 value of MgO and MnO was as high as 0.89. The R2 value of V with Ba and Cr was 0.91 and 0.81, respectively, and the R2 value of Ni and Zn reached over 0.5 (0.59), which was very high compared to Ni and other elements.
(2) Clustering analysis: Figure 4 shows that the square Euclidean distance (SED) between Al2O3 and K2O was approximately 3, between TiO2 and Cr was approximately 5, and between the combination of Al2O3, K2O, TiO2, and Cr was less than 7. The SED of MnO and MgO was 2, the SED between MgO, MnO, and CaO was 4, and the SED between CaO, MgO, MnO, and Sr was 17. The SED of V and Ba was the lowest at 2. The SED of Ni and P was 13, and the overall SED between V, Ba, and Zn was within 17. Generally, element combinations from the many major and trace elements in shale formations that had similar genetic significance had a small Euclidean distance.
(3) Clustering analysis: As evident from Table 3 and Table 4, the load values of Al2O3, K2O, and TiO2 in principal component 1 were 0.823, 0.748, and 0.648, respectively, and the load value of Cr in principal component 2 was 0.661, which was higher than that in principal component 1 (0.506). The load values of CaO, MnO, and MgO in principal component 2 were 0.889, 0.585, and 0.626, respectively, and the load value of Sr in principal component 4 was 0.791. The load values of V, Ni, Cr, and Zn in principal component 1 were 0.638, 0.853, 0.506, and 0.532, respectively, all of which were very high.
As mentioned above, the same element combinations have the following characteristics: a high R2, a small SED value, and a high load value. In summary, the optimal combinations in HD1 associated with the three indices are as follows: (1) for the terrigenous input intensity (TII) index: Al, K, Ti, Cr; (2) for the authigenic precipitation intensity (API) index: Ca, Mg, Mn, Sr; and (3) for the organic matter adsorption and reduction intensity (OARI) index: V, Ni, Ba, Zn.

5. Results and Discussion

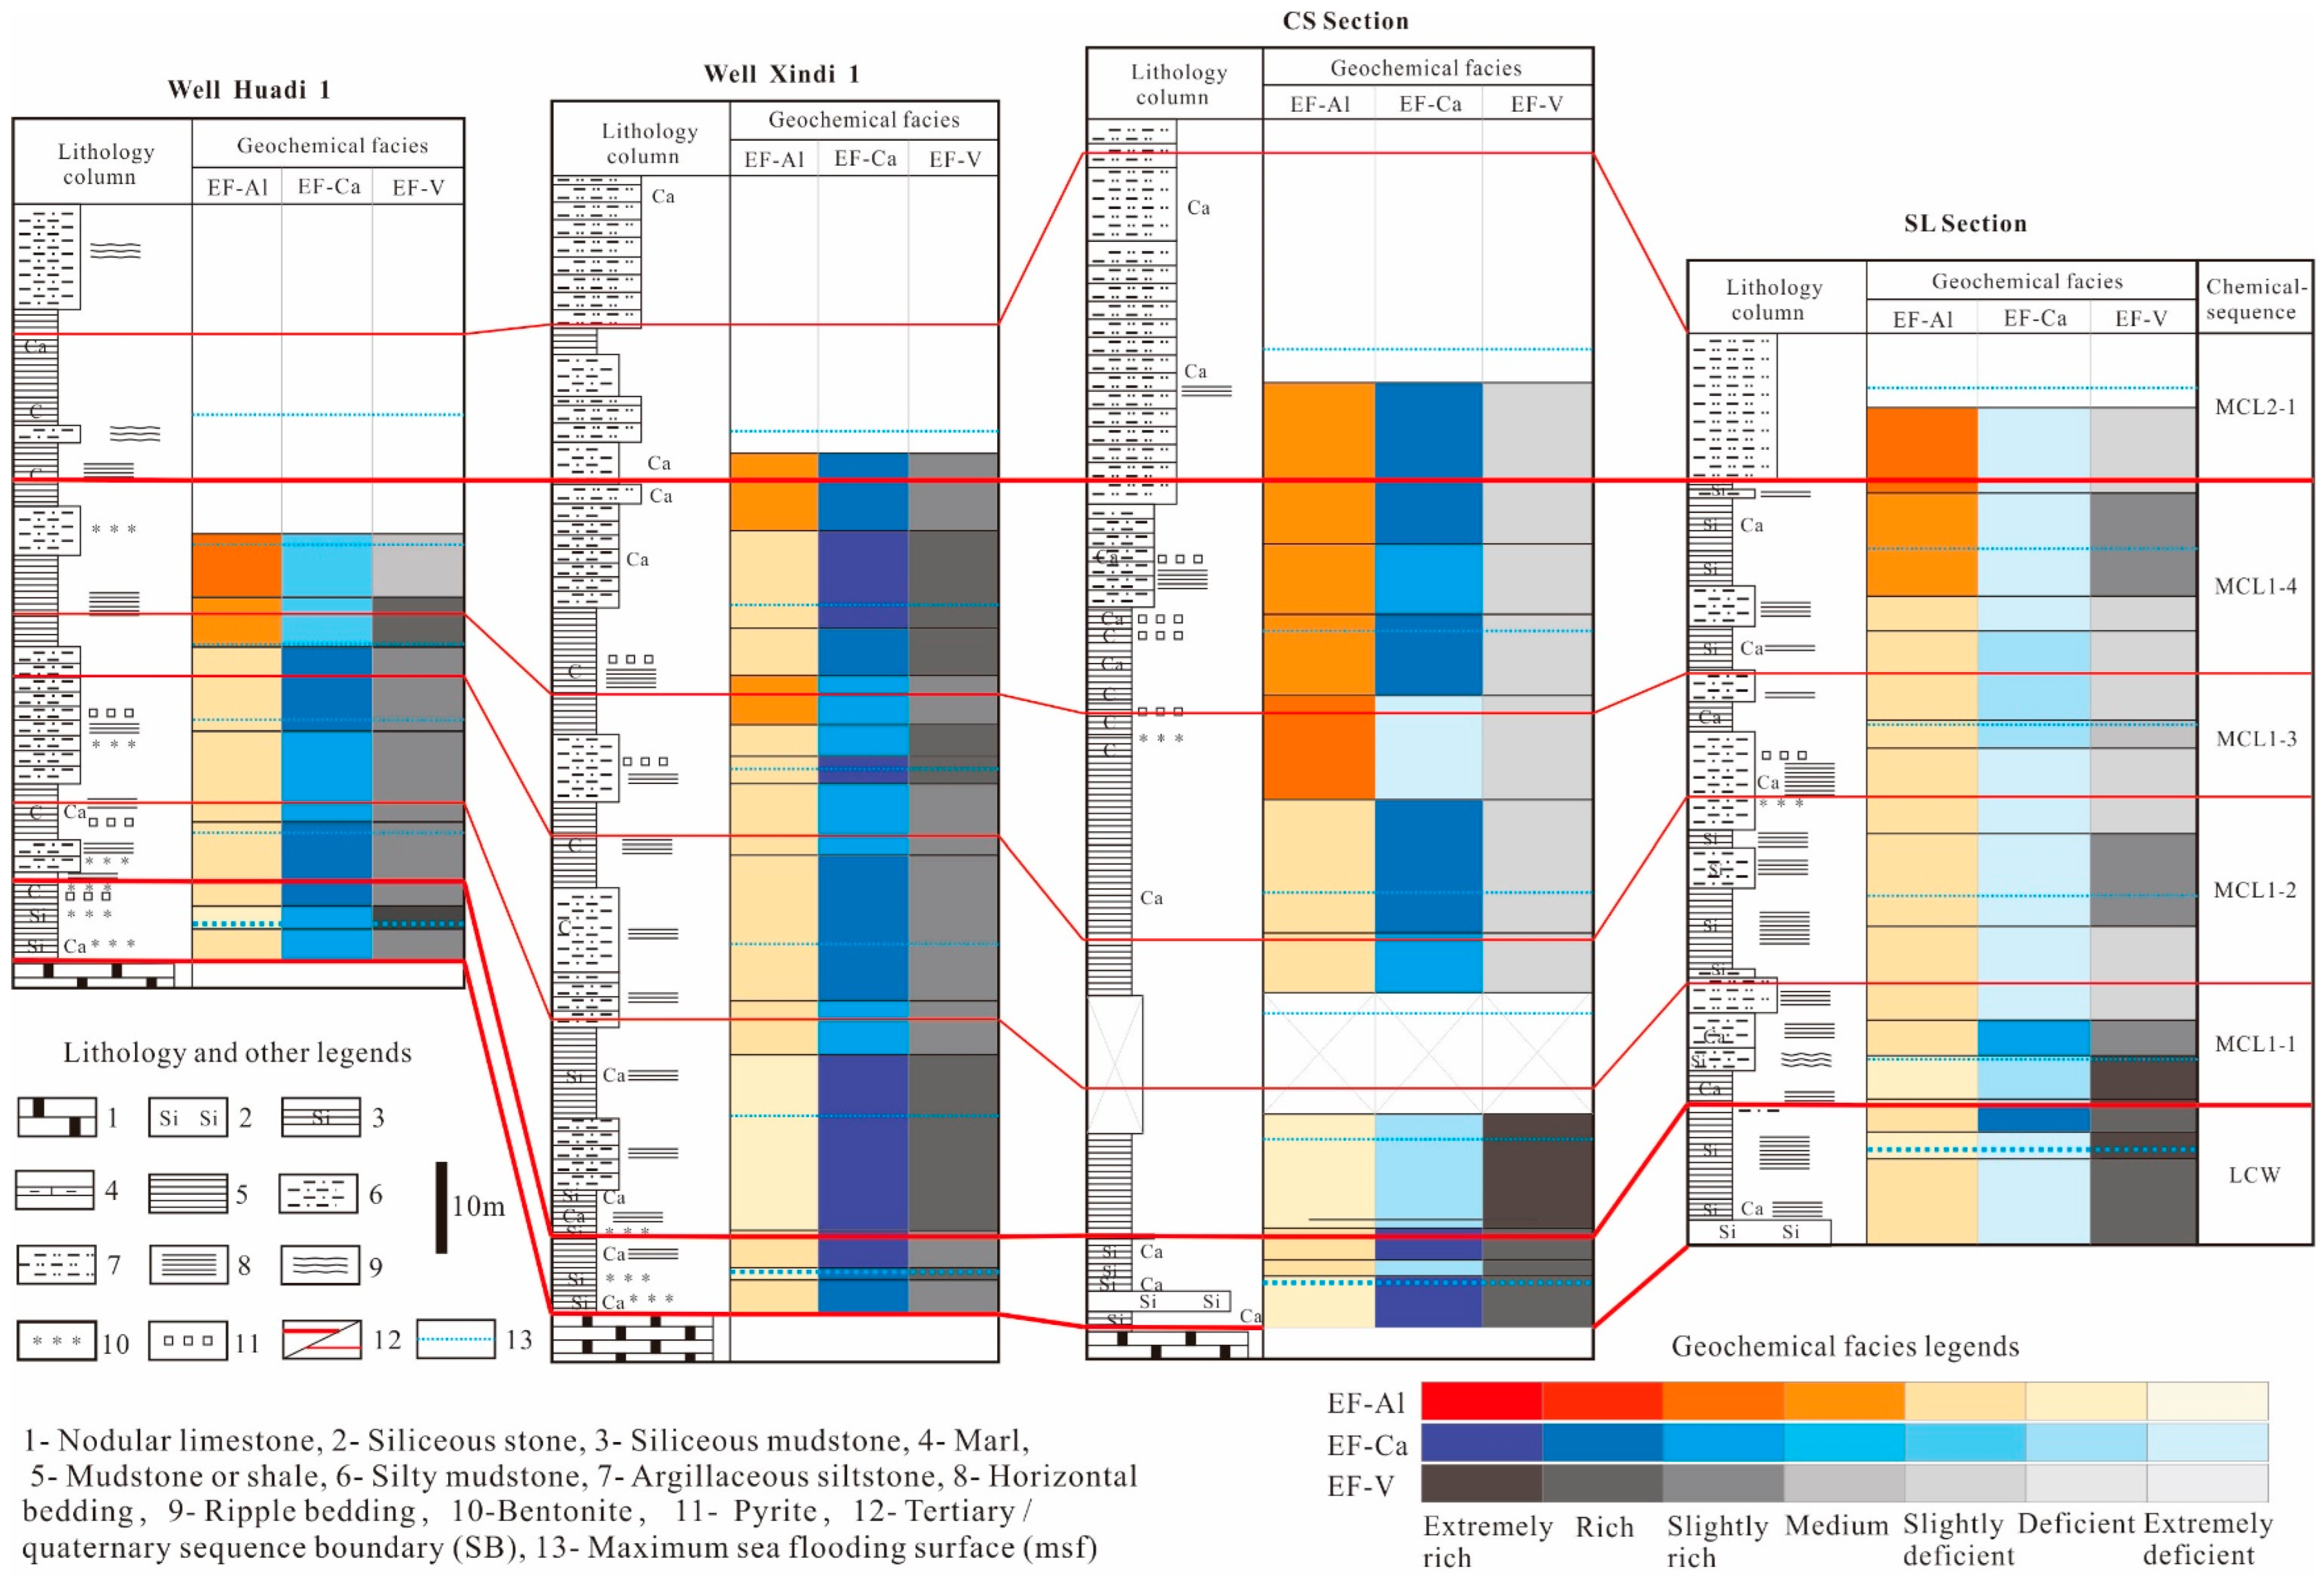
5.1. Chemical Sequence Stratigraphy Division of HD1

Different units of measurement were used in the calculations due to the large differences in the order of magnitude between the major and trace element contents. In this respect, the TII index adopts the original data of the elements, the API adopts the Al standardized value (X/Al) of the elements, and the OARI adopts the original data and an enrichment factor transformative value (EF-X) of the elements. For HD1, the TII index values were the (Al + K + Ti) total content and Cr content, the API index values were the (Ca + Mg + Mn)/Al and Sr/Al contents, and the OARI index values were the (V + Ni + Ba + Zn) total content and the EF- (V + Ni + Ba + Zn).
Based on a comprehensive analysis of the trend in variation of the TII, API, and OARI indices, one chemical sequence (named LCW) was identified within the Wufeng Formation of HD1. Four chemical sequences (named MCL1-1, MCL1-2, MCL1-3, and MCL1-4, from the bottom up) were identified in the Lower Longmaxi Formation of HD1; the respective interfaces of each sequence were named SBW, SBL1, SBL1-2, SBL1-3, and SBL1-4, and the maximum flooding surfaces of each sequence were named mfsW, mfsL1-1, mfsL1-2, mfsL1-3, and mfsL1-4, respectively. The time span of these sequences is less than 1Ma. According to research results on the sequence order [57,58], they are equivalent to fourth-order sequences, and are more highly accurate than the third-order sequences previously identified. The data of each sequence and the key interfaces are shown in Table 5.
According to the histogram for the chemical sequence stratigraphy analysis conducted in HD1 (Figure 5), the terrigenous input intensity (TII) index showed an obvious increasing trend from bottom to top, which reflected a gradual increase in terrigenous input. The TII index increased relatively near each sequence interface, decreased relatively near each maximum sea flooding surface, and underwent a cyclical change from decreasing to increasing in each sequence. This cyclical change represents a response to regional sea level changes, and it can thus be used as the basis for a regional stratigraphic correlation. As previously mentioned, TII was the main index used in chemical sequence stratigraphic division and correlation.
The authigenic precipitation intensity (API) index showed a decreasing trend from bottom to top. Generally, the API index decreased relatively near the interfaces of SBW, SBL1, and SBL1-2, increased relatively near the interfaces of mfsW, mfsL1-1, and mfsL1-2, and showed cyclic changes from increasing to decreasing in the LCW and MCL1-1 chemical sequences. However, the opposite API index changes were seen in the upper MCL1-2, MCL1-3, and MCL1-4, which could be related to the proximity of the HD1 to the central Sichuan uplift. When the water is shallow, the API index is affected by injections of fresh water and evaporation. When the sea level falls, seawater salinity increases, and autogenic precipitation is enhanced; when the sea level rises, seawater salinity decreases, and autogenic precipitation is weakened. As previously mentioned, the API was used as an auxiliary index in this study.
The organic matter adsorption and reduction intensity (OARI) index showed a decreasing trend from bottom to top. It decreased relatively near the interfaces of SBW and SBL1, and increased relatively near the mfsW interface. In the LCW chemical sequence, the OARI changed cyclically from increasing to decreasing. However, in the upper MCL1-1, lower MCL1-2, upper MCL1-3, and MCL1-4 chemical sequences, the changes were opposite. This trend was consistent with that of the TII index, and was probably related to shallow water and the influence of terrigenous organic matter input. As mentioned above, the OARI was also employed as an auxiliary index.

5.2. Geochemical Facies Division of HD1

For the Wufeng–Lower Longmaxi Formations in HD1, the most iconic elements in the TII, API, and OARI indices were Al, Ca, and V, respectively. Therefore, under the chemical sequence stratigraphic framework, the geochemical facies of the well were named according to the enrichment and deficiency degrees of EF-Al, EF-Ca, and EF-V. According to the classifications used in this study, the geochemical facies of HD1 were determined as follows (Table 6, Figure 6).
The overall change rule of HD1 is as follows: EF-Al is deficient in the lower and middle parts, rich in the upper part, and is gradually enriched from bottom to top. In contrast, EF-Ca and EF-V gradually decrease from bottom to top.
For HD1, 29 TOC samples from the Wufeng–Lower Longmaxi Formations were tested, all of which were found to have a TOC content greater than 2.0%. The following information was also determined: there was a certain negative correlation between EF-Al and TOC (R2 = −0.189962), a slightly positive correlation between EF-V and TOC (R2 = 0.090624), and a minimal correlation between EF-Ca and TOC (R2 = −0.00144379). According to this relationship, the favorable geochemical facies of shale gas were considered to be EF-Al deficient, EF-Ca rich, and EF-V rich. It can be seen that these favorable geochemical facies are mainly developed in the LCW, MCL1-1, and MCL1-2 chemical sequences (Figure 6), and their measured TOC is higher, with average values of 3.27%, 3.59%, and 3.33%, respectively.

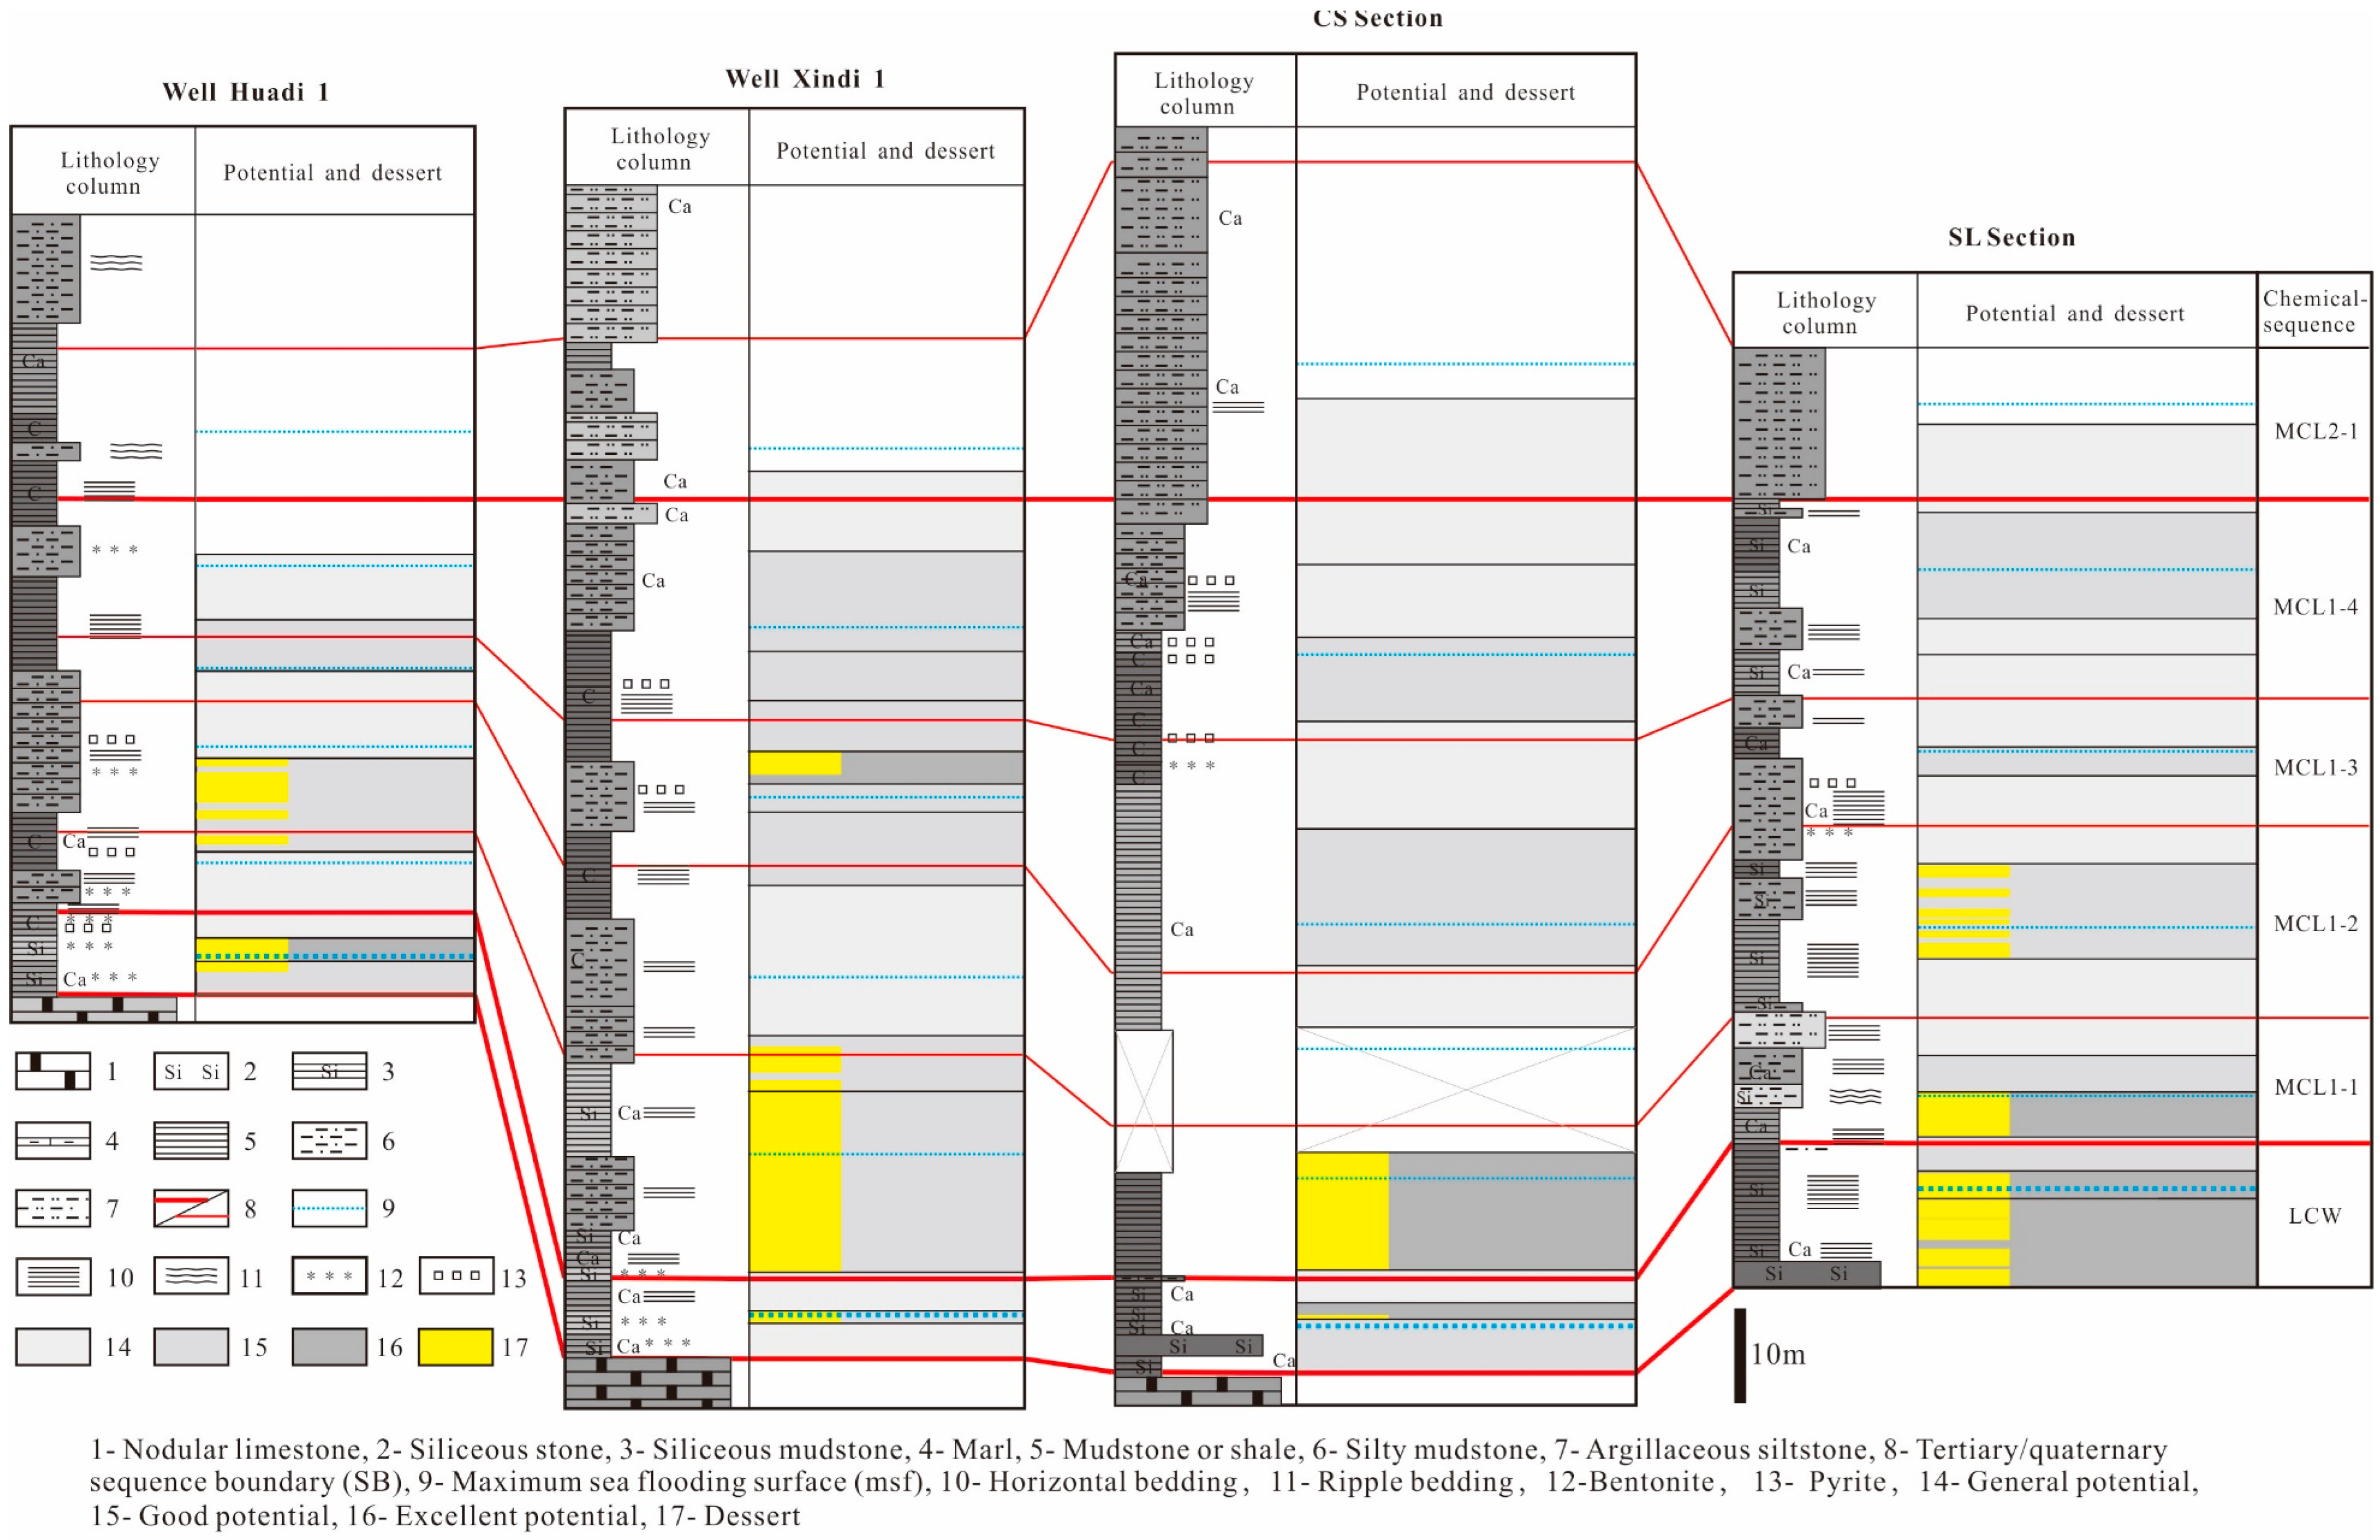
5.3. Sweet Spot Prediction based on HD1

The key parameters of TOC and (SiO2 + CaO) were evaluated based on the analysis of favorable geochemical facies. As discussed above, shale sweet spots occur in shale layers with an excellent potential (TOC  ≥  3%) or a good potential (1%  ≤  TOC  <  3%), and high brittleness ((SiO2 + CaO) ≥  70%).
The results of evaluating the shale gas potential in the Wufeng–Lower Longmaxi Formations from HD1 are as follows (Table 7, Figure 7).
Among these good and excellent shale gas potential areas, the lower and middle parts of the LCW chemical sequence, the vicinity of SBL1-2, and the middle and lower parts of the MCL1-2 chemical sequence all contain high brittle shale (Figure 7), and are thus predicted to be the shale gas sweet spots in HD1.
The wellhead blowout pipeline of HD1 reportedly successfully induced ignition, with a flame height of 7–8 m, and the gas-producing layers are considered to be “the main production layer” and “the biggest total gas content layer” [59]. “The main production layer” is consistent with the shale gas sweet spot identified in the middle and lower part of LCW chemical sequence, and “the biggest total gas content layer” is basically consistent with the sweet spot identified near SBL1-2 and the middle and lower parts of the MCL1-2 chemical sequence (Figure 7). Therefore, these results prove that the research method presented here is feasible.

5.4. Comparative Study of the Upper Yangtze

For the fine isochronal division of strata over a large area, the chemical sequence stratigraphy research method was applied to the Changning Shuanghe (CS) section, the Shizhu Liutang (SL) section, and sections in the Xindi 1 (XD1) well and the Huadi 1 (HD1) well in the upper Yangtze region. The depositional background of the Wufeng–Lower Longmaxi Formations in the upper Yangtze region is a craton platform covered by vast amounts of seawater that lacks a terrigenous coarse clastic supply. High-quality dark mudstone is mainly distributed in the Shizhu–Yibin area, where the maximum cumulative thickness reaches over 120 m, but is generally greater than 40 m [60]. The SL section is located in the thickest depositional center of the high-quality dark mudstone, the HD1 well is located near the Huayingshan fault structural belt where the high-quality dark mudstone is the thinnest, and the CS section and the XD1 well are located between them (Figure 8). The chemical sequence stratigraphy research results for the XD1, CS, and SL sections have been previously published [31,61,62]. Such results were used to conduct comparative research for the HD1 well–XD1 well–CS section–SL section, which runs from a point near the uplift to the deposition center, with the aim of analyzing the change rules for the chemical sequences, the geochemical facies, and the shale gas potentials.
As seen in the table providing the statistics of chemical sequence thicknesses (Table 8) and the joint comparison between the chemical sequence stratigraphy and geochemical facies (Figure 9), five fourth-order chemical sequences (LCW, MCL1-1, MCL1-2, MCL1-3, and MCL1-4, from the bottom up) were identified in each section over a large area. The same sequences in four sections show obvious differences in the thickness changes, and these are presumed to be mainly related to the terrigenous input and authigenic precipitation and tectonic subsidence and later reformation. For example, the thickness of LCW undergoes a gradually increasing trend from the uplift to the deposition center. The thickness of MCL1-1 changes from thickening to thinning, that of MCL1-2 changes from thickening to thinning and then thickening, that of MCL1-3 changes from thickening to thinning, and that of MCL1-4 changes from thickening to thinning. In general, the changes in the thicknesses of each chemical sequence in HD1, which is the closest to the Central Sichuan Uplift, are relatively small.
There are similar characteristics in the geochemical facies within the same chemical sequence of each section. LCW and MCL1-1 are dominated by EF-Al deficient, EF-Ca rich, and EF-V-rich chemical facies, which are shale gas favorable chemical facies. MCL1-2 and MCL1-3 are dominated by EF-Al slightly deficient, EF-Ca slightly rich, and EF-V slightly rich geochemical facies, and MCL1-4 is dominated by EF-Al slightly rich, EF-Ca slightly deficient, and EF-V slightly rich or slightly deficient geochemical facies. Vertically, from bottom to top, EF-Al changes from deficient to rich, and EF-Ca and EF-V changes from rich to deficient. There is obvious EF-Al enrichment and EF-V depletion near each chemical sequence interface, while EF-Al depletion and EF-V enrichment appear near each maximum flood surface (Figure 9).
The joint comparison figure shows certain differences in the shale gas potential and the development of the sweet spot in each section (Figure 10). The SL section has the thickest and best shale gas potential, followed by the CS section. XD1 is thinner, and HD1 is the thinnest, which shows that the shale gas potential decreases from the deposition center to the uplift. For the shale gas sweet spot, LCW and MCL1-1 are the main development chemical sequences, whereas the numbers of shale gas sweet spots in MCL1-2 and MCL1-3 decrease. The MCL1-4 chemical sequence shows an underdeveloped sweet spot.
In conclusion, LCW and MCL1-1 are the key chemical sequences for shale gas exploration and development in the Wufeng–Lower Longmaxi Formations within the Upper Yangtze region.

6. Conclusions

The new chemical sequence stratigraphic research method developed in this study is an effective tool for finely dividing thick mud shale strata and making associated comparisons. It not only provides the advantages of high precision chemical stratigraphy, but also uses the large-area isochronism of sequence stratigraphy. As such, it is a reliable new method for identifying shale gas sweet spots, which is worthy of wide application. This study mainly discussed the results obtained for the three indices in well HD1, which were as follows: ① the terrigenous input intensity (TII) index: Al, K, Ti, and Cr; ② the authigenic precipitation intensity (API) index: Ca, Mg, Mn, and Sr; and ③ the organic matter adsorption and reduction intensity (OARI) index: V, Ni, Ba, and Zn. According to their changing trends, the Wufeng Formation was divided into one LCW chemical sequence, and the Longmaxi Formation was divided into four chemical sequences, MCL1-1, MCL1-2, MCL1-3, and MCL1-4, from the bottom up. According to the enrichment of the iconic elements, it is considered that EF-Al deficient, EF-Ca rich, and EF-V rich geochemical facies are favorable for organic matter development. Shale layers with an excellent potential (TOC  ≥  3%) or a good potential (1%  ≤  TOC  <  3%) and high brittleness ((SiO2 + CaO) ≥ 70%) are predicted to be sweet spots. The results of this study show that the LCW and MCL1-1 chemical sequences are the key layers for shale exploration and development within the Wufeng–Lower Longmaxi Formations in the Upper Yangtze region.

Author Contributions

Conceptualization, Q.W. and Y.H.; methodology, Q.W.; software, Z.Z.; validation, Z.Z., C.W. and X.L.; formal analysis, Q.W.; investigation, Q.W.; resources, Q.W.; data curation, Z.Z.; writing—original draft preparation, Q.W.; writing—review and editing, Q.W.; visualization, Z.Z.; supervision, Y.H.; project administration, Y.H.; funding acquisition, Q.W. All authors have read and agreed to the published version of the manuscript.

Funding

This research was funded by the National Science and Technology Major Project (Grant No:2016ZX05029-001, Project name:“Study on oil and gas geology and enrichment law in global key fields”) and Petrochina Southwest Oil and Gas Company (Project name: Study on the relationship between deep structural characteristics and hydrocarbon accumulation in Sichuan Basin).

Data Availability Statement

Not applicable.

Acknowledgments

In the process of researching and writing this article, we have received great help from many teachers and colleagues from the China University of Geosciences (Beijing), Chengdu Geological Survey Center of China Geological Survey. We would like to express our heartfelt thanks to Xin Renchen and Zhai Gangyi for their guidance. We sincerely thank the editors and reviewers for their valuable comments and suggestions.

Conflicts of Interest

The authors declare no conflict of interest.

References

  1. Jiang, Z.X.; Song, Y.; Tang, X.L.; Li, Z.; Wang, X.M.; Wang, G.Z.; Xue, Z.X.; Li, X.; Zhang, K.; Chang, J.Q.; et al. Controlling factors of marine shale gas differential enrichment in southern China. Pet. Explor. Dev. Online 2020, 47, 617–628. [Google Scholar] [CrossRef]
  2. Guo, X.S.; Hu, D.F.; Wen, Z.D.; Liu, R.B. Major factors controlling the accumulation and high productivity in marine shale gas in the Lower Paleozoic of Sichuan Basin and its periphery: A case study of the Wufeng-Longmaxi Formation of Jiaoshiba area. Geol. China 2014, 41, 893–901. [Google Scholar]
  3. Tang, X.L.; Jiang, Z.X.; Li, Z.; Gao, Z.Y.; Bai, Y.Q.; Zhao, S.; Feng, J. The effect of the variation in material composition on the heterogeneous pore structure of high-maturity shale of the Silurian Longmaxi formation in the southeastern Sichuan Basin, China. J. Nat. Gas Sci. Eng. 2015, 23, 464–473. [Google Scholar] [CrossRef]
  4. Zhao, W.Z.; Li, J.Z.; Yang, T.; Wang, S.F.; Huang, J.L. Geological difference and its significance of marine shale gases in South China. Pet. Explor. Dev. 2016, 43, 499–510. [Google Scholar] [CrossRef]
  5. Jin, Z.J.; Hu, Z.Q.; Gao, B.; Zhao, J.H. Controlling factors on the enrichment and high productivity of shale gas in the Wufeng-Longmaxi Formations, southeastern Sichuan Basin. Earth Sci. Front. 2016, 23, 1–10. [Google Scholar]
  6. Zhai, G.Y.; Wang, Y.F.; Bao, S.J.; Guo, T.X.; Zhou, Z.; Chen, X.L.; Wang, J.Z. Major factors controlling the accumulation and high productivity of marine shale gas and prospect forecast in the southern China. Earth Sci. 2017, 42, 1057–1068. [Google Scholar]
  7. Qiu, Z.; Zou, C.N.; Wang, H.Y.; Dong, D.Z.; Lu, B.; Chen, Z.H.; Liu, D.X.; Li, G.Z.; Liu, H.L.; He, J.L.; et al. Discussion on characteristics and controlling factors of differential enrichment of Wufeng-Longmaxi Shale gas in South China. Nat. Gas Geosci. 2020, 5, 117–128. [Google Scholar] [CrossRef]
  8. Zou, C.N.; Zhao, Q.; Cong, L.T.; Wang, H.Y.; Shi, Z.S.; Wu, J.; Pan, S.Q. Development progress, potential and prospect of shale gas in China. Nat. Gas Ind. 2021, 41, 1–14. [Google Scholar]
  9. Zhai, G.Y.; Li, J.; Jiao, Y.; Wang, Y.F.; Liu, G.H.; Xu, Q.; Wang, C.; Chen, R.; Guo, X.B. Applications of chemostratigraphy in a characterization of shale gas Sedimentary Microfacies and predictions of sweet spots—Taking the Cambrian black shales in Western Hubei as an example. Mar. Pet. Geol. 2019, 109, 547–560. [Google Scholar] [CrossRef]
  10. La Grange, M.T.; Konhauser, K.O.; Catuneanu, O.; Brette, S.H.; Tiffany, L.P.; Murray, K.G. Sequence stratigraphy in organic-rich marine mudstone successions using chemostratigraphic datasets. Earth-Sci. Rev. 2020, 203, 103137. [Google Scholar] [CrossRef]
  11. Schoepfer, S.D.; Shen, J.; Wei, H.; Tyson, R.V.; Ingall, E.; Thomas, J.A. Total organic carbon, organic phosphorus, and biogenic barium fluxes as proxies for paleomarine productivity. Earth-Sci. Rev. 2014, 149, 23–52. [Google Scholar] [CrossRef]
  12. Qiu, Z.; Zou, C.N. Controlling factors on the formation and distribution of “sweet-spot areas” of marine gas shales in South China and a preliminary discussion on unconventional petroleum sedimentology. J. Asian Earth Sci. 2020, 194, 103989. [Google Scholar] [CrossRef]
  13. Li, J.T.; Liu, J.B.; Sun, Y.C.; Yan, Z.; Wu, R.C.; Zhan, R.B. On the Lower Ordovician Lunshan Formation in Lower Yangtze Region, South China: Its petrology, stratigraphy and palaeogeography. J. Paleogeography 2016, 18, 411–423. [Google Scholar]
  14. Wang, Y.Q.; Li, Q.; Bai, B.; Zhang, Z.Q.; Xu, R.C.; Wang, X.Y.; Zhang, X. Lithostratigraphic subdivision and correlation of the Paleogene in China. J. Stratigr. 2021, 45, 402–425. [Google Scholar]
  15. Nie, H.K.; Li, D.H.; Jiang, T.; Yan, C.N.; Du, W.; Zhang, G.R. Logging isochronous stratigraphic division of shale based on characteristics of graptolite zones and its significance: A case study of Wufeng Formation-Longmaxi Formation in Sichuan Basin and its periphery. Acta Pet. Sin. 2020, 41, 273–283. [Google Scholar]
  16. Li, Y.X.; Ji, Z.S.; Wu, G.C. New Progress on the early Triassic conodont biostratigraphy in the Coqun area, Lhasa terrane. Acta Micropalaeontologica Sin. 2021, 38, 334–351. [Google Scholar]
  17. Banner, J.L. Radiogenic isotopes: Systematics and applications to earth surface processes and chemical stratigraphy. Earth-Sci. Rev. 2004, 65, 141–194. [Google Scholar] [CrossRef]
  18. Traversi, R.; Becagli, S.; Castellano, E.; Cerri, O.; Morganti, A.; Severi, M.; Udisti, R. Study of Dome C site (East Antartica) variability by comparing chemical stratigraphies. Microchem. J. 2009, 92, 7–14. [Google Scholar] [CrossRef]
  19. Posamentier, H.W.; Vail, P.R. Eustatic controls on clastic deposition II—sequenceand systems tract model. In Sea Level Changes—An Integrated Approach; Wilgus, C.K., Hastings, B.S., Ross, C.A., Posamentier, H., Van Wagoner, J., Kendall, C., Eds.; Special Publication; Society of Economic Paleontologists and Mineralogists, (SEPM): Tulsa, OK, USA, 1988; Volume 42, pp. 125–154. [Google Scholar]
  20. Haq, B.U.; Hardenbol, J.; Vail, P.R. Mesozoic and cenozoic chronostratigraphy and cycles of sea-level change. In Sea-Level Changes—An Integrated Approach; SEPM Special Publication; SEPM: Tulsa, OK, USA, 1988; Volume 42, pp. 71–108. [Google Scholar]
  21. Zheng, R.C.; Wen, H.G.; Li, F.J. High-Resolution Sequence Stratigraphy; Geological Publishing House: Beijing, China, 2010; pp. 1–404. [Google Scholar]
  22. Li, Y.F.; Fan, T.L.; Gao, Z.Q.; Zhang, J.C.; Wang, X.M.; Zeng, W.T.; Zhang, J.P. Sequence stratigraphy of Silurian black shale and its disturbution in the southeast area of Chongqing. Nat. Gas Geosci. 2012, 23, 299–306. [Google Scholar]
  23. Wang, T.; Yang, K.M.; Xiong, L.; Shi, H.L.; Zhang, Q.L.; Wei, L.M.; He, X.L. Shale sequence stratigraphy of Wufeng-Longmaxi Formation in southern Sichuan and their control on reservoirs. Acta Pet. Sin. 2015, 36, 915–925. [Google Scholar]
  24. Wang, Y.M.; Dong, D.Z.; Li, X.J.; Huang, J.L.; Wang, S.F.; Wu, W. Stratigraphic sequence and sendimentary characteristics of Lower Sliurian Longmaxi Formation in Sichuan Basin and its peripheral area. Nat. Gas Ind. 2015, 35, 12–21. [Google Scholar]
  25. Guo, X.S. Sequence stratigraphy and evolution model of the Wufeng-Longmaxi shale in the upper Yangtze area. Earth Sci. 2017, 42, 1069–1082. [Google Scholar]
  26. Pearce, T.J.; Wray, D.; Ratcliffe, K.T.; Wright, D.K.; Moscariello, A.; Collinson, J.D.; Jones, N.S. Chemostratigraphy of the Upper Carboniferous Schooner Formation, southern North Sea. In Carboniferous Hydrocarbon Resources: The Southern North Sea and Surrounding Onshore Areas; Collinson, J.D., Evans, D.J., Holliday, D.W., Eds.; Occasional Publication Series of the Yorkshire Geological Society: Yorkshire, UK, 2005; Volume 7, pp. 147–164. [Google Scholar]
  27. Ratcliffe, K.T.; Wright, A.M.; Schmidt, K. Application of inorganic whole-rock geochemistry to shale resource plays: An example from the Eagle Ford Shale Formation, Texas. Sediment. Rec. 2012, 10, 4–9. [Google Scholar] [CrossRef]
  28. Sano, J.L.; Ratcliffe, K.T.; Spain, D. Chemostratigraphy of the Haynesville Shale. In Geology of the Haynesville Gas Shale in East Texas and West Louisiana, USA; Hammes, U., Gale, J., Eds.; AAPG Memoir: Tulsa, OK, USA, 2013; Volume 105, pp. 137–154. [Google Scholar]
  29. Nyhuis, C.J.; Riley, D.; Kalasinska, A. Thin section petrography and chemostratigraphy: Integrated evaluation of an upper Mississippian mudstone dominated succession from the southern Netherlands. Neth. J. Geosci. 2016, 95, 3–22. [Google Scholar] [CrossRef] [Green Version]
  30. Turner, B.W. Utilization of Chemostratigraphic Proxies for Generating and Refining Sequence Stratigraphic Frameworks in Mudrocks and Shales. Ph.D. Thesis, University of Oklahoma Graduate College, Norman, OK, USA, 2016; pp. 1–98. [Google Scholar]
  31. Wang, Q.; Huang, Y.J.; Zhang, Z.F.; Wang, C.H.; Li, X.; Liu, W. High resolution chemical sequence stratigraphy analysis of Wufeng Formation and lower Longmaxi formation in the well Xindi 1, upper Yangtze Region. Geol. China. 2020. Available online: https://kns.cnki.net/kcms/detail/detail.aspx?FileName=DIZI20201220002&DbName=CAPJ2020. (accessed on 22 December 2020).
  32. Ramkumar, M. Chemostratigraphy: Concepts, Techniques, and Applications; Elsevier: Amsterdam, The Netherlands, 2015; pp. 1–432. [Google Scholar]
  33. Craigie, N. Principles of Elemental Chemostratigraphy—A Practical User Guide; Springer: Berlin, Germany, 2018; pp. 1–177. [Google Scholar]
  34. Sial, A.N.; Gaucher, C.; Ramkumar, M.; Ferreira, V.P. Introduction: Chemostratigraphy as a formal stratigraphic method. In Chemostratigraphy across Major Chronological Boundaries; Sial, A.N., Gaucher, C., Ramkumar, M., Ferreira, V.P., Eds.; AGU Geophysical Monograph Series; Wiley: Hoboken, NJ, USA, 2019; pp. 3–25. [Google Scholar]
  35. Tribovillard, N.; Algeo, T.J.; Lyons, T.; Riboulleau, A. Trace metals as paleoredox and paleoproductivity proxies: An update. Chem. Geol. 2006, 232, 12–32. [Google Scholar] [CrossRef]
  36. Mørk, A.; Embry, A.F.; Weitschat, W. Triassic transgressive-regressive cycles in the Sverdrup Basin, Svalbard and the Barents Shelf. In Correlation in Hydrocarbon Exploration; Collinson, J.D., Ed.; Springer: Dordrecht, The Netherlands, 1989. [Google Scholar]
  37. Dromart, G.; Monier, P.; Curial, A.; Moretto, R.; Guillocheau, F. Triassic Transgressive-Regressive Cycles in the Bresse-Jura and Adjacent Basins, Eastern France. In Hydrocarbon and Petroleum Geology of France; Mascle, A., Ed.; Special Publication of the European Association of Petroleum Geoscientists; Springer: Berlin/Heidelberg, Germany, 1994; Volume 4. [Google Scholar]
  38. Lü, M.; Chen, K.; Xue, L.; Yi, L.; Zhu, H. High-resolution transgressive-regressive sequence stratigraphy of Chang 8 Member of Yanchang Formation in southwestern Ordos basin, northern China. J. Earth Sci. 2010, 21, 423–438. [Google Scholar] [CrossRef]
  39. Montero-Serrano, J.C.; Palarea-Albaladejo, J.; Martin-Fernandez, J.A.; Martínez-Santana, M.; Gutiérrez-Martín, J.V. Sedimentary chemofacies characterization by means of multivariate analysis. Sediment. Geol. 2010, 228, 218–228. [Google Scholar] [CrossRef]
  40. Calvert, S.E.; Pedersen, T.F. Geochemistry of Recent oxic and anoxic marine sediments: Implications for the geological record. Mar. Geol. 1993, 113, 67–88. [Google Scholar] [CrossRef]
  41. Turgeon, S.; Brumsack, H.J. Anoxic vs dysoxic events reflected in sediment geochemistry during the Cenomanian-Turonian Boundary Event (Cretaceous)in the Umbria-Marche Basin of central Italy. Chem. Geol. 2006, 234, 321–339. [Google Scholar] [CrossRef]
  42. Wedepohl, K.H. Environmental influences on the chemical composition of shales and clays. In Physics and Chemistry of the Earth; Ahrens, L.H., Press, F., Runcorn, S.K., Eds.; Pergamon: Oxford, UK, 1971; pp. 305–333. [Google Scholar]
  43. Li, Y.H.; Schoonmaker, J.E. Chemical composition and mineralogy of marine sediments. In Treatise on Geochemistry, Sediments, Diagenesis, and Sedimentary Rocks; Rudnick, R.L., Ed.; Elsevier Sciences: New York, NY, USA, 2003; Volume 7, pp. 1–35. [Google Scholar]
  44. Li, G.Q.; Cheng, W.B.; Zhang, Y.M.; Zhang, Y.; Lv, P.R.; Dai, H.Z.; Zhang, X.G.; Xia, B.B. Geochemical Characteristics and Their Geologic Significance of the Lower Jurassic Ridang Formation Host Strata from the Zhaxikang Sb-Pb-Zn-Ag Polymetallic Ore-concentrated District, South Tibet. Bull. Mineral. Petrol. Geochem. 2014, 33, 598–608. [Google Scholar]
  45. Xu, Z.Y.; Liang, X.; Wang, W.X.; Zhang, J.H.; Wang, X.Y.; Shu, H.L.; Huang, C.; Wang, G.C.; Lu, H.L.; Liu, C.; et al. Controlling factors for shale gas sweet spots distribution in the Upper Yangtze region: A case study of the Upper Ordovician Wufeng Fm–Lower Silurian Longmaxi Fm, Sichuan Basin. Nat. Gas Ind. 2016, 36, 35–43. [Google Scholar]
  46. Zou, C.N.; Dong, D.Z.; Wang, Y.M.; Li, X.J.; Huang, J.L.; Wang, S.F.; Guan, Q.Z.; Zhang, C.C.; Wang, H.Y.; Liu, H.L.; et al. Shale gas in China: Characteristics, challenges and prospects (II). Pet. Explor. Dev. 2016, 43, 166–178. [Google Scholar] [CrossRef]
  47. Xie, X.N.; Hao, F.; Lu, Y.C.; He, S.; Shi, W.Z.; Jiang, Z.X.; Xiong, Y.Q.; Zhang, J.C. Differential enrichment mechanism and key technology of shale gas in complex areas of south China. Earth Sci. 2017, 42, 1045–1056. [Google Scholar]
  48. Bowker, K.A. Barnett Shale gas production, Fort Worth Basin: Issues and discussion. AAPG Bull. 2007, 91, 523–533. [Google Scholar] [CrossRef]
  49. Dong, D.Z.; Cheng, K.M.; Wang, S.Q.; Lv, Z.G. An evaluation method of shale gas resource and its application in the Sichuan basin. Nat. Gas Ind. 2009, 29, 33–39. [Google Scholar]
  50. Ross, D.J.; Bustin, R.M. The importance of shale composition and pore structure upon gas storage potential of shale gas reservoirs. Mar. Pet. Geol. 2009, 26, 916–927. [Google Scholar] [CrossRef]
  51. Palarea-Albaladejo, J.; Martín-Fernández, J.A.; Gómez-García, J. A parametric approach for dealing with compositional rounded zeros. Math. Geol. 2007, 39, 625–645. [Google Scholar] [CrossRef]
  52. Martin-Fernandez, J.A.; Barcelo-Vidal, C.; Pawlowsky-Glahn, V. Dealing with zeros and missing values in compositional data sets using nonparametric imputation. Math. Geol. 2003, 35, 253–278. [Google Scholar] [CrossRef]
  53. Martín-Fernández, J.A.; Barceló-Vidal, C.; Pawlowsky-Glahn, V.; Kovács, L.Ó.; Kovács, G.P. Subcompositional patterns in Cenozoic volcanic rocks of Hungary. Math. Geol. 2005, 37, 729–752. [Google Scholar] [CrossRef]
  54. Pison, G.; Rousseeuw, P.J.; Filzmoser, P.; Croux, C. Robust factor analysis. J. Multivar. Anal. 2003, 84, 145–172. [Google Scholar] [CrossRef] [Green Version]
  55. Filzmoser, P.; Hron, K. Outlier detection for compositional data using robust methods. Math. Geosci. 2008, 40, 233–248. [Google Scholar] [CrossRef]
  56. Reiman, C.; Filmoser, P. Normal and lognormal data distribution in geochemistry: Death of a myth. Consequences for the statistical treatment of geochemical and environmental data. Environ. Geol. 2000, 39, 1001–1014. [Google Scholar] [CrossRef]
  57. Catuneanu, O.; Abreu, V.; Bhattacharya, J.; Blum, M.; Dalrymple, R.; Eriksson, P.; Fielding, C.; Fisher, W.; Galloway, W.; Gibling, M.; et al. Towards the standardization of sequence stratigraphy. Earth-Sci. Rev. 2009, 92, 1–33. [Google Scholar] [CrossRef] [Green Version]
  58. Lin, C.S.; Zhang, Y.M.; Liu, J.Y.; Pang, B.C. High resolution sequence stratigraphy and reservoir prediction. Earth Sci. Front. 2000, 7, 111–117. [Google Scholar]
  59. He, J.L.; Wang, J.; Yu, Q.; Liu, W.; Ge, X.Y.; Yang, P.; Wang, Z.J.; Lu, J.Z. Pore structure of shale and its effects on gas storage and transmission capacity in well HD-1 eastern Sichuan Basin. China Fuel 2018, 226, 709–720. [Google Scholar] [CrossRef]
  60. Wang, Y.M.; Li, X.J.; Dong, D.Z.; Zhang, C.C.; Wang, S.F. Main factors controlling the sedimentation of high-quality shale in Wufeng–Longmaxi Fm, Upper Yangtze region. Nat. Gas Ind. 2017, 37, 9–20. [Google Scholar] [CrossRef]
  61. Wang, Q.; Huang, Y.J.; Zhang, Z.F.; Wang, C.H.; Li, X.; Liu, W. Application of high-resolution chemical sequence stratigraphy to Deep-water fine-grained sediments—a case study of the Wufeng Formation and the lower member of Longmaxi formation in Liutang outcrop, upper Yangtze Region. Geoscience 2021, 35, 281–292. [Google Scholar]
  62. Wang, Q.; Huang, Y.J.; Zhang, Z.F.; Wang, C.H.; Li, X.; Liu, W. Chemical sequence stratigraphy of the Wufeng Formation-lower member of Longmaxi formation in Shuanghe outcrop, upper Yangtze Region. Northwestern Geol. 2021, 54, 1–14. [Google Scholar]
Figure 1. Theoretical chemical sequence stratigraphy model. In transgressive systems, the TII decreases, while the API and OARI increase; in regressive systems, the TII increases, while the API and OARI decrease.
Minerals 12 00859 g001
Figure 2. Geological map of the Upper Yangtze region (modified from a 1:500,000 Geological Map, [1]).
Minerals 12 00859 g002
Figure 3. Comprehensive histogram of Wufeng–Lower Longmaxi Formations in Well Huadi 1.
Minerals 12 00859 g003
Figure 4. Tree diagram of element cluster analysis of Well Huadi 1. (Element combinations that had similar genetic significance had a small square Euclidean distance.).
Minerals 12 00859 g004
Figure 5. Histogram of chemical sequence stratigraphy of Wufeng–Lower Longmaxi Formations in Well Huadi 1. Five fourth-order chemical sequences (LCW, MCL1-1, MCL1-2, MCL1-3, and MCL1-4 from the bottom up) were identified; the respective interfaces of each sequence were named SBW, SBL1, SBL1-2, SBL1-3, SBL1-4, and the maximum flooding surfaces of each sequence were named mfsW, mfsL1-1, mfsL1-2, mfsL1-3, and mfsL1-4.
Minerals 12 00859 g005
Figure 6. Histogram of geochemical facies in Wufeng–Lower Longmaxi Formation within Well Huadi 1. Seven geochemical facies were named, according to the enrichment and deficiency degrees of EF-Al, EF-Ca, and EF-V.
Minerals 12 00859 g006
Figure 7. Histogram of shale gas sweet spot prediction results for the Wufeng–Lower Longmaxi Formations within Well Huadi 1. “The main production layer” and “the biggest total gas content layer” [59] are basically consistent with the sweet spots (yellow) identified in this study).
Minerals 12 00859 g007
Figure 8. Isopach map of high-quality dark mudstone of the Wufeng–Longmaxi Formations in the Upper Yangtze region (modified from Wang et al., 2017). The SL section is located in the thickest depositional center of the high-quality dark mudstone, the HD1 well is located near the Huayingshan fault structural belt where the high-quality dark mudstone is the thinnest, and the CS section and the XD1 well are located between them.
Minerals 12 00859 g008
Figure 9. Chemical sequence and geochemical facies of a joint section in the Wufeng–Lower Longmaxi Formations in the upper Yangtze Region (LCW and MCL1-1 are dominated by EF-Al deficient, EF-Ca rich, and EF-V-rich chemical facies, which are shale gas favorable chemical facies. From bottom to top, EF-Al changes from deficient to rich, EF-Ca and EF-V changes from rich to deficient.).
Minerals 12 00859 g009
Figure 10. Shale gas potential and sweet spots in a joint section of the Wufeng–Lower Longmaxi Formations in the upper Yangtze Region.
Minerals 12 00859 g010
Table 1. Genetic relationship between elements and minerals (modified from [10,33]).
ElementsAssociated MineralsGenetic Significance
SiQuartz, other silicatesTerrigenous/Authigenic
Al, GaMainly clay minerals, a small amount related to feldsparTerrigenous
K, RbPotash feldspar, mica, and clay minerals (especially illite)Terrigenous
Cs, ScClay minerals and feldsparTerrigenous
VMainly clay minerals (V adsorbed on clay minerals under anoxic conditions)Reduction
CaMainly calcite and dolomite; also gypsum and anhydrite, and to a lesser extent with montmorillonite and plagioclaseMainly authigenic
MgMainly dolomite, calcite, or clay minerals (especially chlorite)Mainly authigenic
Fe, MnVarious clay, carbonate minerals, and pyriteTerrigenous/Authigenic
Namainly plagioclase; some sodium is related to stone salts or clay minerals (montmorillonite)Terrigenous/Authigenic
Ti, Ta, NbTitanium magnetite, magnetite, ilmenite, rutile, anatase, sphaleriteTerrigenous
ThHeavy minerals, especially monazite, zircon, and apatiteTerrigenous
REELight rare earth elements are most abundant in clay minerals and feldspar, while heavy rare earth elements are found in heavy minerals.Terrigenous
UHeavy mineral, organic matterTerrigenous/Reduction
CrHeavy minerals (chrome spinel)Terrigenous
Zr, HfZirconTerrigenous
PBiological phosphorus, phosphorous heavy minerals (apatite and monazite); small amounts of phosphorus associated with carbonate and clay mineralsAuthigenic
Zn, Ni, Mo, Co, CuPyrite, ferric hydroxide, carbonate, clay mineralsAuthigenic/Terrigenous
BaCarbonate (barite)Authigenic
SrFeldspar, clay minerals, carbonateTerrigenous/Authigenic
Table 2. Correlation coefficients (R2) of elements in the Wufeng–Lower Longmaxi Formation in Well Huadi 1.
Fe2O3Al2O3K2ONa2OMgOTiO2ZrO2CaOSiO2MnOVCrNiZnCuBaPAsPbSrSCl
Fe2O31.00
Al2O30.631.00
K2O0.440.921.00
Na2O0.010.03−0.031.00
MgO0.480.350.280.121.00
TiO20.570.610.54−0.020.121.00
ZrO2−0.60−0.36−0.180.18−0.34−0.301.00
CaO−0.13−0.25−0.030.210.53−0.250.261.00
SiO2−0.59−0.63−0.69−0.07−0.57−0.500.16−0.361.00
MnO0.540.240.19−0.040.890.18−0.480.48−0.491.00
V0.310.160.16−0.20−0.070.78−0.17−0.20−0.130.101.00
Cr0.460.280.32−0.120.290.60−0.280.12−0.290.390.811.00
Ni−0.10−0.40−0.330.03−0.37−0.010.37−0.010.28−0.330.400.351.00
Zn−0.25−0.31−0.22−0.21−0.24−0.270.300.040.40−0.220.230.310.591.00
Cu0.240.330.220.110.410.01−0.300.07−0.310.35−0.26−0.12−0.61−0.431.00
Ba0.390.190.12−0.13−0.040.85−0.27−0.27−0.190.150.910.620.24−0.06−0.211.00
P−0.36−0.48−0.28−0.23−0.63−0.150.220.010.29−0.370.10−0.030.370.17−0.450.061.00
As0.150.280.23−0.030.51−0.01−0.300.12−0.340.39−0.23−0.09−0.54−0.320.39−0.10−0.401.00
Pb0.00−0.20−0.160.26−0.24−0.110.03−0.050.07−0.23−0.13−0.230.22−0.22−0.18−0.030.14−0.261.00
Sr−0.35−0.250.020.210.20−0.090.510.82−0.190.15−0.050.050.100.05−0.12−0.120.11−0.12−0.031.00
S−0.110.200.20−0.440.04−0.04−0.06−0.180.090.090.040.09−0.220.280.12−0.09−0.080.22−0.79−0.161.00
Cl−0.020.060.190.40−0.050.050.100.19−0.01−0.060.000.070.12−0.09−0.17−0.050.03−0.220.570.37−0.481.00
Table 3. Principal component matrix of major elements in Well Huadi 1 samples (Kaiser–Meyer–Olkin index = 0.577).
Main Elemental OxidesPrincipal Component 1Principal Component 2Principal Component 3Principal Component 4Principal Component 5
Fe2O30.829−0.135−0.2410.2320.140
Al2O30.823−0.4120.237−0.020−0.280
K2O0.748−0.3090.424−0.245−0.268
Na2O0.0080.2460.5070.820−0.071
MgO0.6970.626−0.1240.024−0.131
TiO20.648−0.4550.1160.0680.530
ZrO2−0.5410.1590.697−0.2150.164
CaO0.1070.8890.275−0.1870.100
SiO2−0.825−0.158−0.3460.176−0.134
MnO0.6820.585−0.356−0.0170.043
Table 4. Principal component matrix of trace elements in Well Huadi 1 samples (Kaiser–Meyer–Olkin index = 0.571).
Trace ElementsPrincipal Component 1Principal Component 2Principal Component 3Principal Component 4Principal Component 5
Zr0.315−0.4960.5440.2820.130
V0.6380.663−0.2930.1180.097
Cr0.5060.661−0.2190.320−0.158
Ni0.853−0.0630.163−0.132−0.212
Zn0.5320.1610.599−0.029−0.473
Cu−0.7240.136−0.1900.203−0.058
Ba0.4830.606−0.4740.0250.282
P0.495−0.2130.208−0.3570.573
As−0.6650.255−0.0880.1840.012
Pb0.244−0.650−0.590−0.238−0.155
Sr0.234−0.3670.1830.7910.264
S−0.2690.5740.6310.0270.026
Cl0.299−0.513−0.4400.389−0.203
Table 5. Chemical sequence stratigraphy data of Wufeng–Lower Longmaxi Formation in Well Huadi 1 (SB—sequence boundary; msf—maximum sea flooding surface).
Sequences/
Key Surfaces
TII IndexAPI IndexOARI Index
Al + K + Ti (%)Cr (ppm)(Ca + Mg + Mn)/AlSr/AlV + Ni + Ba + Zn (ppm)EF(V + Ni + Ba + Zn)
SBL2//////
mfsL1-423.70720.188.4912343.74
SBL1-422.541430.2911.66431013.10
MCL1-4 (average)22.2391.450.239.591631.095.59
mfsL1-316.61890.259.6812488.58
SBL1-319.771112.0528.1510547.38
MCL1-3 (average)20.501020.3414.741883.387.91
mfsL1-216.00820.4517.1012077.86
SBL1-221.381060.3613.2510417.69
MCL1-2 (average)17.6992.230.5316.251188.357.94
mfsL1-115.11610.8620.5711067.82
SBL116.92740.4117.689695.88
MCL1-1 (average)17.72810.5017.731103.786.61
mfsW6.86630.4134.59124819.19
SBW25.43790.3113.937432.91
LCW (average)16.9076.100.3918.931049.78.19
Table 6. Geochemical facies division of Wufeng–Lower Longmaxi Formation in Well Huadi 1 (SB—sequence boundary; msf—maximum sea flooding surface; 0.1  ≤  EF-X  <  0.5 is deficient, 0.5  ≤  EF-X  <  1 is slightly deficient, 1  ≤  EF-X  <  2 is slightly rich, 2  ≤  EF-X  <  5 is rich, and the medium means EF value is approximately 1).
Geochemical Facies NumberPositionGeochemical Facies Description
EF-AlEF-CaEF-V
1In the lower part of LCWslightly deficientslightly richslightly rich
2In the vicinity of mfsWdeficientslightly richrich
3From SBL1 to msfL1-1slightly deficientrichslightly rich
4In the vicinity of SBL1-2slightly deficientslightly richslightly rich
5From mfsL1-2 to SBL1-3slightly deficientrichslightly rich
6From mfsL1-3 to SBL1-4mediumslightly deficientrich
7In the vicinity of mfsL1-3slightly richslightly deficientmedium
Table 7. The shale gas potential of Wufeng–Lower Longmaxi Formation in Well Huadi 1. (SB—sequence boundary; msf—maximum sea flooding surface; the shale gas potential is average when TOC <  1%, the potential is good when 1%  ≤ TOC  <  3%, and the potential is excellent when TOC ≥ 3%).
NumberPositionShale Gas Potential
1in the lower part of the LCW chemical sequencegood
2in the vicinity of mfsW (in the middle of the LCW)excellent
3from SBL1 to mfsL1-1average
4from SBL1-2 to mfsL1-2 (lower-middle of the MCL1-2)good
5from mfsL1-2 to SBL1-3average
6from mfsL1-3 to SBL1-4good
7in the vicinity of mfsL1-4average
Table 8. Chemical sequence thicknesses of each section in the Wufeng–Lower Longmaxi Formations (m).
Chemical SequenceWell HD1Well XD1CS SectionSZ Section
MCL1-414.9023.8826.0121.55
MCL1-36.9615.8125.2613.80
MCL1-214.1620.4816.5920.79
MCL1-18.7324.2816.5913.47
LCW8.928.6310.1815.90
Publisher’s Note: MDPI stays neutral with regard to jurisdictional claims in published maps and institutional affiliations.

