1. Introduction
China’s coal-bearing strata are widely distributed not only laterally (geographically) but also vertically in relation to different geological periods of deposition. In addition to their locations at the source, coal-bearing oil and gas reservoirs are distributed in both near-source and far-source regions as a result of migration. Therefore, the exploration prospects of these strata are broad [
1,
2,
3]. However, with the increasingly prominent dangers that carbon dioxide and other greenhouse gases pose to the environment, improving the accuracy of oil and gas exploration and development has become an important method for reducing carbon emissions [
4,
5]. Consequently, the continuous intensification of oil and gas exploration coincident with the increasing demand for low-carbon development has imposed new requirements on technological innovation and development for geophysical processing and interpretation [
6].
Seismic wave forward modelling, which is performed to simulate the propagation of seismic waves through the Earth, enables the relationships between the propagation characteristics of seismic waves and the parameters of the Earth’s interior to be studied. Through the forward modelling of seismic waves, the propagation of seismic waves can be correctly documented, and the reflection and transmission characteristics of different geological models can be verified, which is helpful for geological interpretation and reservoir prediction endeavors when utilizing actual seismic data [
7]. However, for many thin interbedded lithologic formations, the seismic reflection and transmission characteristics and prestack amplitude variation with offset (AVO) characteristics are different from those of single sets of thick layers; thus, the basic theory employed for single layers cannot be directly used for seismic inversion and interpretation [
8]. In particular, in source rocks containing thin coal seams, seismic data are seriously disturbed by the reflections from these seams, and these perturbations easily cause false bright spots in reservoir characterization, especially in sections marked by dense reflections from both sand and coal [
9]. Therefore, according to the geophysical characteristics of coal-bearing reservoirs, seismic forward modelling is conducted to simulate the small-scale seismic responses of different combinations of lithologies and to implement prestack AVO characteristics, all of which are conducive to finely describing the spatial distributions of oil and gas in coal-bearing reservoirs.
To understand how seismic waves propagate through subsurface media, seismic waves are numerically simulated based on the fundamental theory of seismic wave propagation [
10,
11]. The reflectivity method, which is a numerical transformation technique, is one of the most effective methods for simulating the full wave field in a layered half-space. Its accuracy is higher than those of the finite difference method and the ray method, and its computational cost is intermediate to those of these two approaches [
12,
13]. The advantage of the reflectivity method is that it considers multiple reflections and converted waves in a system comprising numerous reflectors; accordingly, the synthetic records are highly accurate [
14]. Nevertheless, due to the strong reflection characteristics of coal seams, if a coal seam is above or below a sandstone reservoir or if there are multiple interbedded layers of sand and coal with other lithologies, the seismic response of the sandstone deviates, resulting in inaccurate or even incorrect reservoir and boundary characterization. Coal seam reflections are characterized by low frequencies, strong amplitudes and strong energy. Correspondingly, Wang et al. (2016) proposed the maximum energy method based on empirical mode decomposition (EMD) to suppress the strong reflection amplitudes of coal seams, thereby highlighting the seismic responses of gas reservoirs and clearly describing the sandstone boundary of the target layer [
15]. Du et al. (2016) used matching tracking technology to remove the strong reflections from multiple thin coal seams below the target layer and achieved the small-scale characterization of a sandstone reservoir through frequency division and reconstruction in the time–frequency domain [
16]. Thin coal seams interbedded with thin sandstone layers produce complex reflection interference; thus, the effects of thin coal seams on sandstone reservoirs are often characterized by seismic forward modelling [
17]. For instance, considering how the strong reflections from an overlying coal seam can obscure a sandstone reservoir below, Wang et al. (2021) screened out the seismic frequency band sensitive to the underlying sandstone in a coal-bearing formation by applying spectrum decomposition to the seismic data and retained only the seismic data sensitive to the sandstone reservoir through the wavelet reconstruction technique, which improved the accuracy with which the coal-bearing reservoir was predicted [
18].
The time–frequency analysis of seismic signals and the extraction of seismic attributes can effectively obtain substantial information on subsurface stratigraphic structures and lithologies. Through the application of EMD to the seismic data of complex structures, the seismic attributes can be accurately extracted [
19]. For thin interbedded formations, the combination of the maximum amplitude and centroid frequency attributes exhibits a better linear relationship with formation thickness than the amplitude or frequency alone [
20]. However, the seismic responses of coal-bearing reservoirs cannot directly reflect the geological characteristics of sandstone reservoirs due to the strong reflections from coal seams; fortunately, coal seams and sandstones have greatly different seismic properties (such as their amplitude, phase, and frequency). Therefore, the effects of reflections from coal seams can be removed from the comprehensive seismic response according to these differences in seismic attributes, which allows sandstone reservoirs to be accurately characterized. Moreover, for multiple thin coal seams, the coal seam distribution cannot be reliably obtained by conventional exploration methods, but due to the typical stratigraphic combination of thin coal seams and mudstones, the relationships between various instantaneous attributes and the coal seam thickness and distribution can be simulated through the calculation of high-resolution seismic attributes [
21]. Through an analysis of the relationships between many seismic attributes and coal seams, four attributes, namely, the average peak amplitude, maximum absolute amplitude, amplitude kurtosis and slope of the instantaneous frequency, were found to be sensitive to coal seam thickness. Based on a backpropagation (BP) neural network and polynomial regression theory, Meng et al. (2006) established a model for predicting coal seam thickness by comprehensively using multiple attributes and carried out an error analysis of the coal seam thickness prediction results [
22]. With the development of artificial intelligence, machine learning has greatly improved the efficiency and accuracy of the comprehensive optimization of attributes and of coal seam thickness prediction in combination with the characteristics of the study area [
23,
24]. These improved neural network algorithms are completely data-driven and, therefore, provide an important scientific basis for the small-scale characterization of subsurface stratigraphic structures and for the identification of coal quality [
25]. Recently, to facilitate low-carbon development and high-resolution exploration, Huang et al. (2022) first used EMD and variational mode decomposition (VMD) to denoise seismic signals, after which a long short-term memory (LSTM) neural network was used to predict the thickness of coal seams with complex stratigraphic structures [
26].
AVO analysis is often conducted to analyse and invert the subsurface’s lithological structure by evaluating how the characteristics of reflection amplitudes vary with offset to describe and detect oil and gas reservoirs [
27,
28]. Different stratigraphic structures and lithological combinations correspond to different AVO types. Therefore, the analysis of AVO characteristics is helpful for identifying the lithologies of subsurface strata [
29,
30]. However, due to the obvious influences of coal seams on the seismic responses of sandstone, the comprehensive AVO characteristics of interbedded sand–coal strata can no longer represent the prestack seismic responses of sandstone reservoirs. Therefore, it is necessary to finely investigate the prestack AVO characteristics of coal-bearing reservoirs and to study the influences of coal seams on the AVO characteristics of sandstone [
31].
The theoretical basis of the AVO technique is the Zoeppritz equation, which describes the properties of the reflected and transmitted waves when an incident wave strikes the interface between two media [
32,
33,
34]. Due to the large number of parameters in the Zoeppritz equation, the calculation process is extremely complicated, and the physical meaning is difficult to express, so this equation is not highly practical [
35]. To overcome the limitations prohibiting the practical application of the Zoeppritz equation, many experts and scholars have approximated and simplified its seven parameters to different degrees; notable examples include the Shuey approximation and the Aki approximation [
36,
37,
38,
39]. These simplified equations greatly reduce the calculation difficulty and increase the practicality of this approach [
40]. Accordingly, AVO forward modelling has been used to preliminarily ascertain the existence of oil and gas reservoirs and determine their approximate locations by analysing the variations in seismic wave reflection amplitudes with offset [
41]. Since elastic parameters, such as the longitudinal-wave velocity and shear-wave velocity, have different sensitivities to fluids, the AVO technique has become an important means for identifying oil and gas reservoirs [
42,
43]. Specifically, in recent years, the AVO method has played an increasingly important role in locating coal-bearing reservoirs by facilitating crucial tasks such as coal seam characterization and coal quality differentiation [
44,
45].
Nevertheless, because they produce low-frequency and strong-amplitude reflections, coal seams effectively obscure the reflections from sandstone layers; consequently, sandstone reservoirs cannot be accurately identified and characterized. In particular, the composite reflections from multiple thin coal seams (those with a single-layer thickness of less than 2 m) and sandstone layers are quite complicated. Moreover, the AVO characteristics of coal-bearing reservoirs cannot be used as the basis for sandstone reflection characteristics due to the significant influence of coal seams. Therefore, studying the reflection characteristics of coal-bearing formations is invaluable for the characterization of coal seams and the identification of fluids in seismic interpretation. However, previous studies focused predominantly on the applications of coal seam stripping and multi-attribute fusion in predicting the thickness of coal seams, whereas almost no fine analyses have been conducted on the different lithological combinations of coal-bearing reservoirs in actual work areas by forward modelling the corresponding seismic responses.
According to actual seismic and logging data acquired in the field, 11 theoretical models featuring the coal seam wedge, sandstone thickness, layer interval, mode of sand–coal coupling, number of coal seams, and complex lateral change profiles are constructed in this study. Specifically, the influences of coal seams on sandstone reflections are evaluated by synthesizing various seismic attributes with each model. Then, the seismic reflection characteristics of different lithological combinations of coal-bearing reservoirs in actual seismic data are summarized and verified. In addition, the AVO characteristics of sandstone reservoirs with different fluids are compared and analysed by considering synthetics both with and without coal seams, and the influences of coal seams on the prestack AVO responses of sandstone are clarified. This summary of seismic models of coal-bearing reservoirs is conducive to realizing high-resolution seismic inversion and interpretation and can provide important guidance for actual seismic exploration in the field.
3. Synthetic Examples
The seismic reflection patterns of coal-bearing reservoirs are studied by forward synthetics on the basis of the convolution operation. Due to the complexity of the actual stratigraphic structure, the effects of various factors on the seismic records are superimposed; thus, it is difficult to distinguish the contribution of each factor to the seismic response. Therefore, it is necessary to summarize the typical lithologic combination characteristics of coal-bearing reservoirs according to the seismic interpretation results in the field, build a single-well theoretical model with the influencing factors of seismic reflection records in each combination as the research object, and analyse the impact of each factor on seismic records and seismic attributes separately. Thus, the seismic response mode of coal-bearing reservoirs in different lithological combinations is systematically analysed. The data used in the model are set according to the actual logging data of the target interval. The main frequency of the seismic wavelet is set to 25 Hz. The elastic parameters of the theoretical model corresponding to each lithology are shown in the following table (
Table 1) and are used in all the model tests below.
In
Figure 1, yellow represents sandstone, black represents coal, and grey represents mudstone. The double-layer wedge model is shown in
Figure 1a, and the maximum thickness of each layer in the wedge model is 25 m. The sandstone-bearing model with a thickness of 30 m at the top of the double-layer wedge is shown in
Figure 1c.
Figure 1b,d present the synthetic seismic records of the models in
Figure 1a,c, respectively. Comparing
Figure 1b,d reveals that when the top of the double wedge is composed of sandstone, compared with the scenario when the top of the double wedge is not sandstone, the sandstone reflection is submerged by the strong reflection from the coal seam. This lithological artefact increases the difficulty of reservoir identification. Considering that multiple thin coal seams may be present, geological models with different lithological combinations are constructed. Then, based on forward modelling theory, the influences of these coal seams are removed by using seismic attribute characteristics, and excluding these influences is helpful for accurately identifying the reservoir.
The following different sand–coal combination models are constructed based on the lithological interpretation results of actual logging data. The time of the model starts at 3.05 s, which indicates that the depth of the target layer corresponding to these models is approximately 5000 m. In the seven models constructed below, for the single-well model diagram, yellow represents sandstone, black represents coal, and grey represents mudstone. The blue curves overlaid atop the figure are the corresponding synthetic seismic records. SMC (sandstone–mudstone–coal) models with sandstone layers both above and below multiple coal seams are shown in
Figure 2 and
Figure 3.
Figure 2a illustrates three sets of coal seams with a single-layer thickness of 1 m, and the top and bottom layers of each model with a single coal seam are sandstone layers with the same thickness. The interval between rock layers is 4 m, and among the models, the sandstone thickness increases gradually in the lateral direction.
Figure 2b–d show that the synthetics differ slightly with the sandstone thickness, and the frequency spectrum and phase change trends of the different models are basically the same. As shown in
Figure 2e–g, as the sandstone thickness gradually increases from 1.5 m to 7.5 m, the change in the maximum amplitude is small, the central frequency increases as a whole, and the composite attribute generally decreases.
Figure 3a presents three sets of coal seams with a single-layer thickness of 1 m, and the top and bottom layers of each model are sandstone strata, each with a thickness of 4.5 m. The interval between a single coal seam is 4 m, the sandstone thickness remains unchanged, and the distance between the sandstone and coal seam (i.e., the interval) gradually increases from 1.3 m to 6.5 m. In
Figure 3b–d, the seismic record and spectrum change regularly with the sandstone thickness, the peak value of the frequency spectrum increases monotonously, and the phase remains almost unchanged. In
Figure 3e–g, with an increase in the sandstone interval, the maximum amplitude increases linearly, the centre frequency increases slightly, and the composite attribute increases linearly. According to the definition of the composite attribute, when the centre frequency remains almost unchanged, the composite attribute has the same trend as the maximum amplitude. The model test results are in full agreement with the theoretical values of the composite attribute. As shown in
Figure 2b and
Figure 3b, for the model with sandstone both above and below multiple coal seams, when the sandstone thickness or interval increases, the amplitude increases only slightly. Hence, the influence of the distance between the sandstone and coal seam on the synthetic record is only slightly greater than that of the variation in the sandstone thickness. In general, however, the variations in the sandstone thickness and interval have little effect on the synthetics.
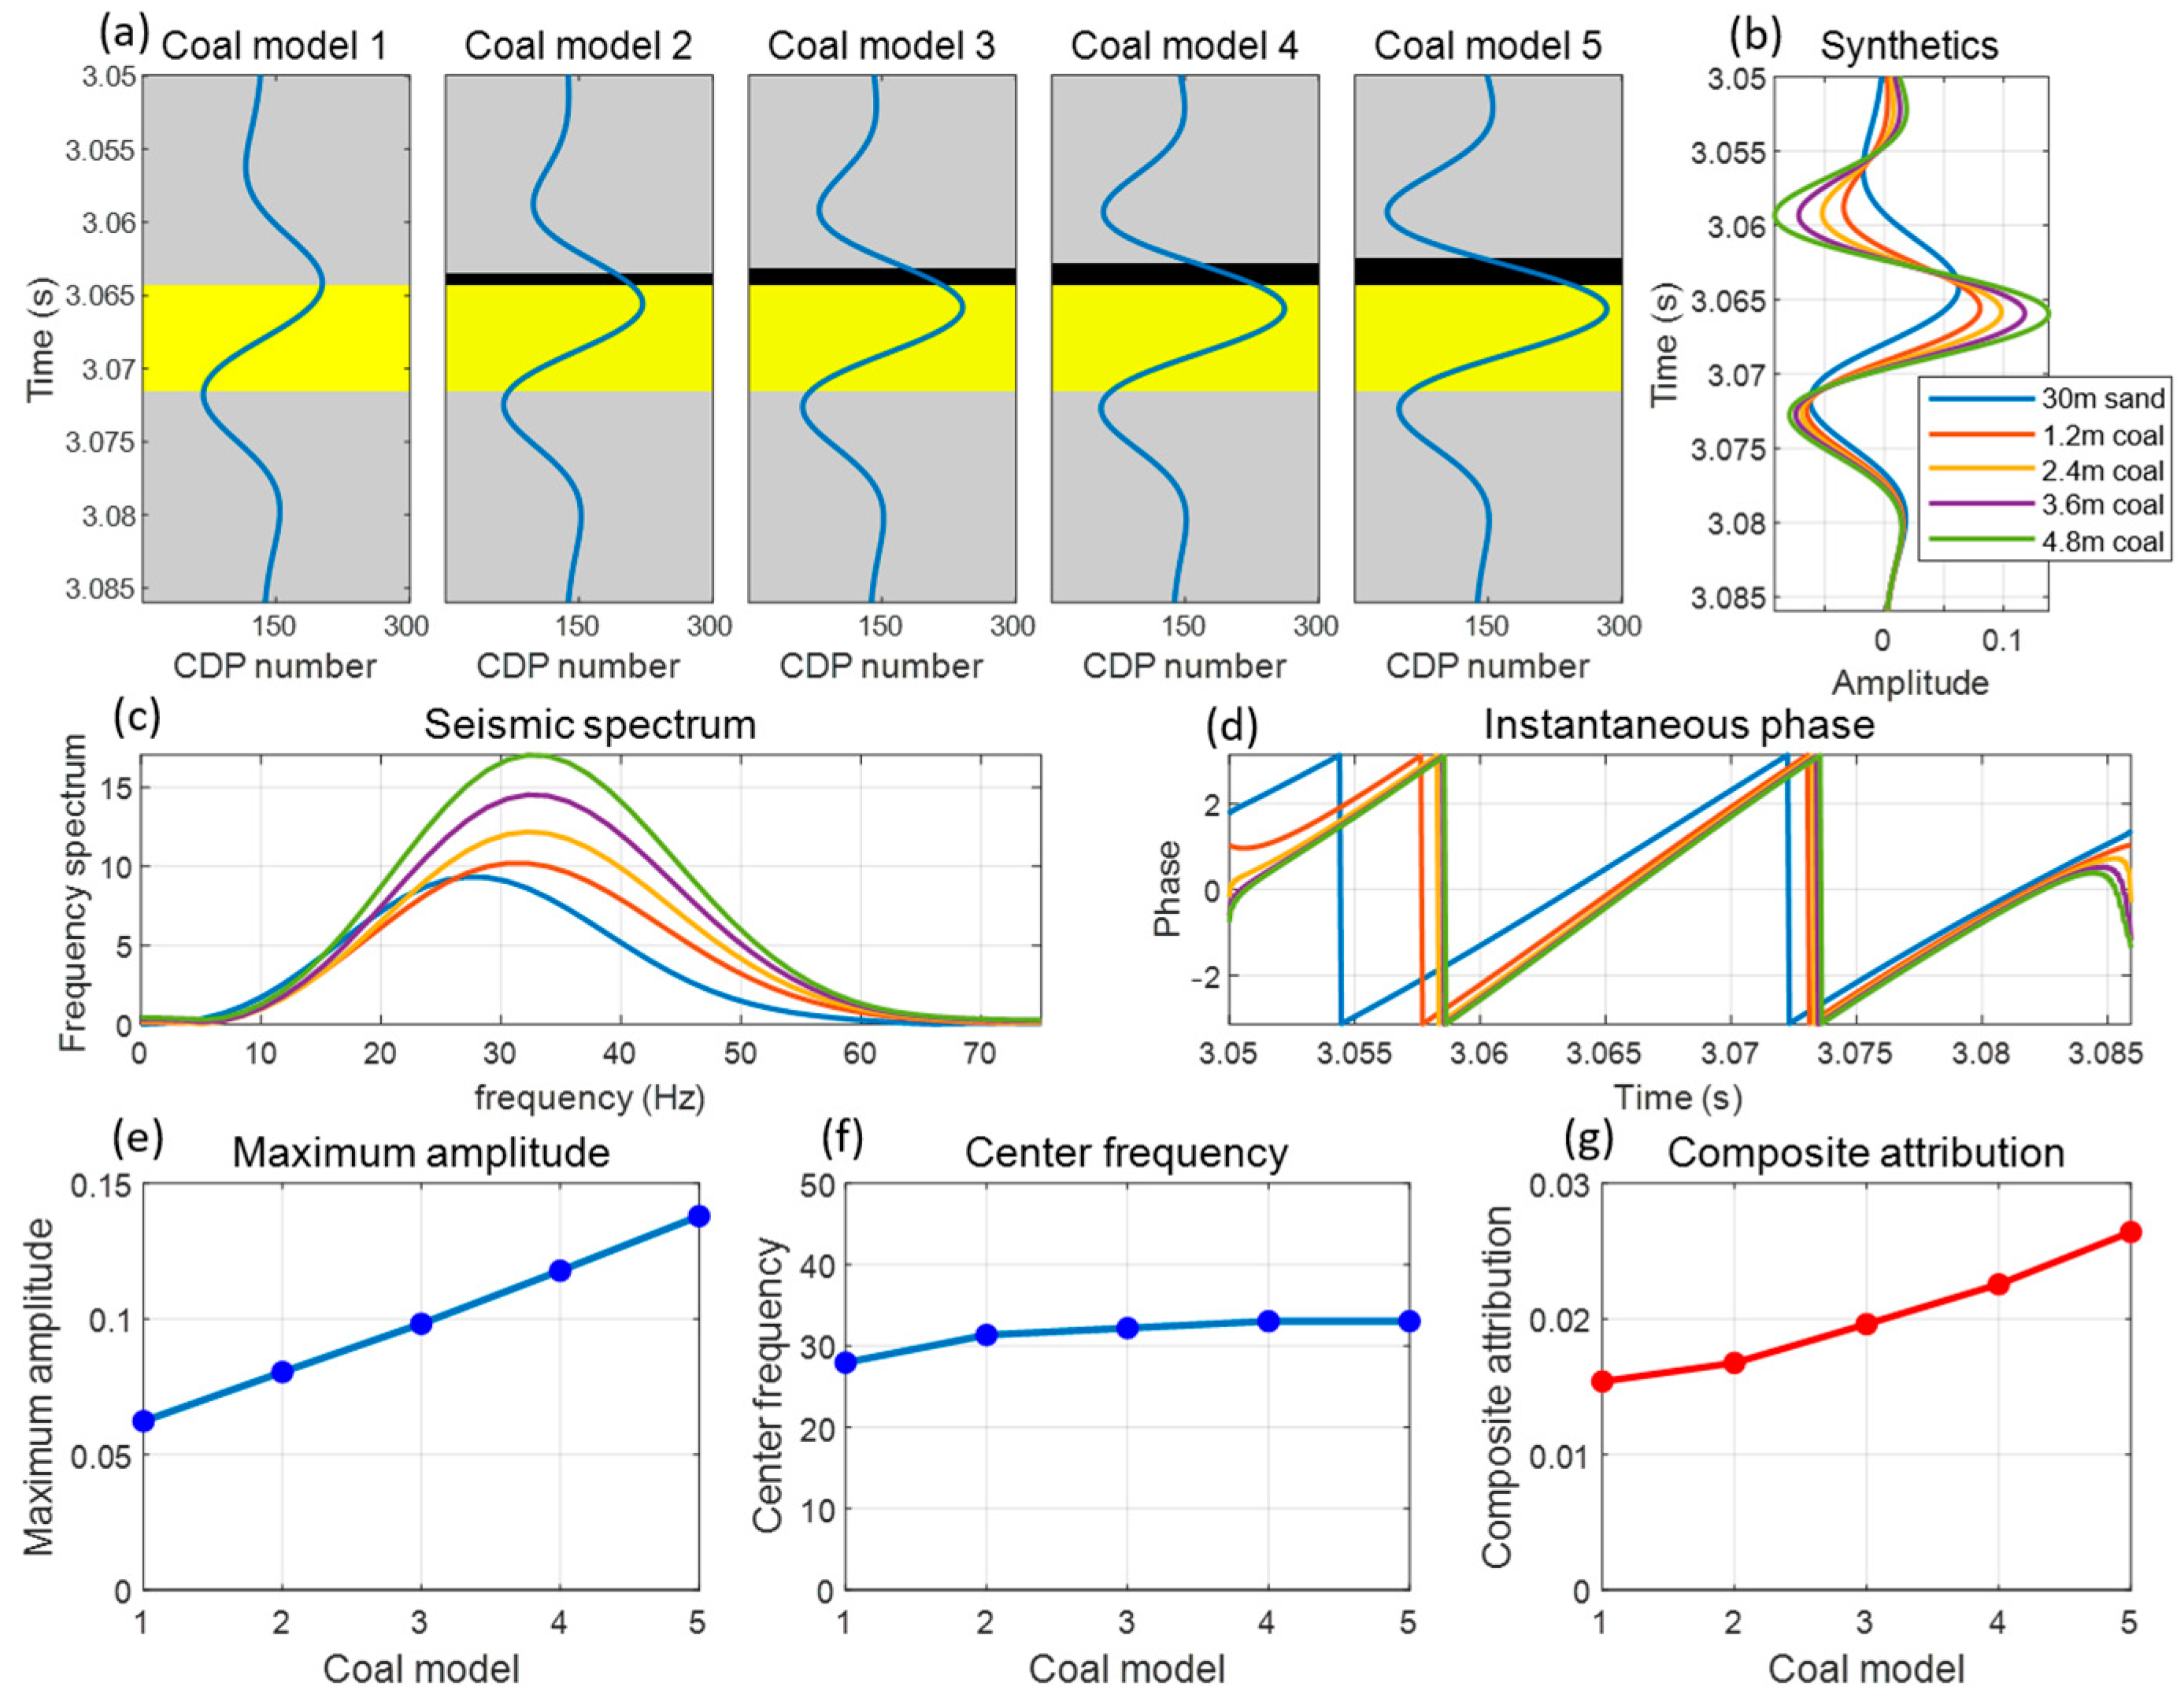
Figure 4 shows the attributes of the CS (coal–sandstone) model comprising a thick sandstone layer overlain by a coal seam. In
Figure 4a, the sandstone thickness is 30 m, the thickness of the coal seam gradually increases from zero to 4.8 m, and the interval between the coal seam and sandstone is 0.
Figure 4b–d show that when the sandstone is overlain by a coal seam, compared with those of pure sandstone (that is, when the coal seam thickness is 0), the synthetics and peak positions of the frequency spectrum are shifted, and the instantaneous phase is obviously staggered. As the thickness of the coal seam increases, the peak value of the spectrum increases gradually, and the onset of the phase mutation is delayed. As shown in
Figure 4e–g, when the thickness of the coal seam increases gradually from 0, the maximum amplitude increases monotonically. When the model changes from pure sandstone to a coal-bearing model, the composite attribute increases slowly and then increases rapidly with a gradual increase in the coal’s seam thickness; this feature clearly reflects the abnormal characteristics of a coal seam as it grows, which is conducive to a better understanding the forward-modelled characteristics of different lithological combinations.
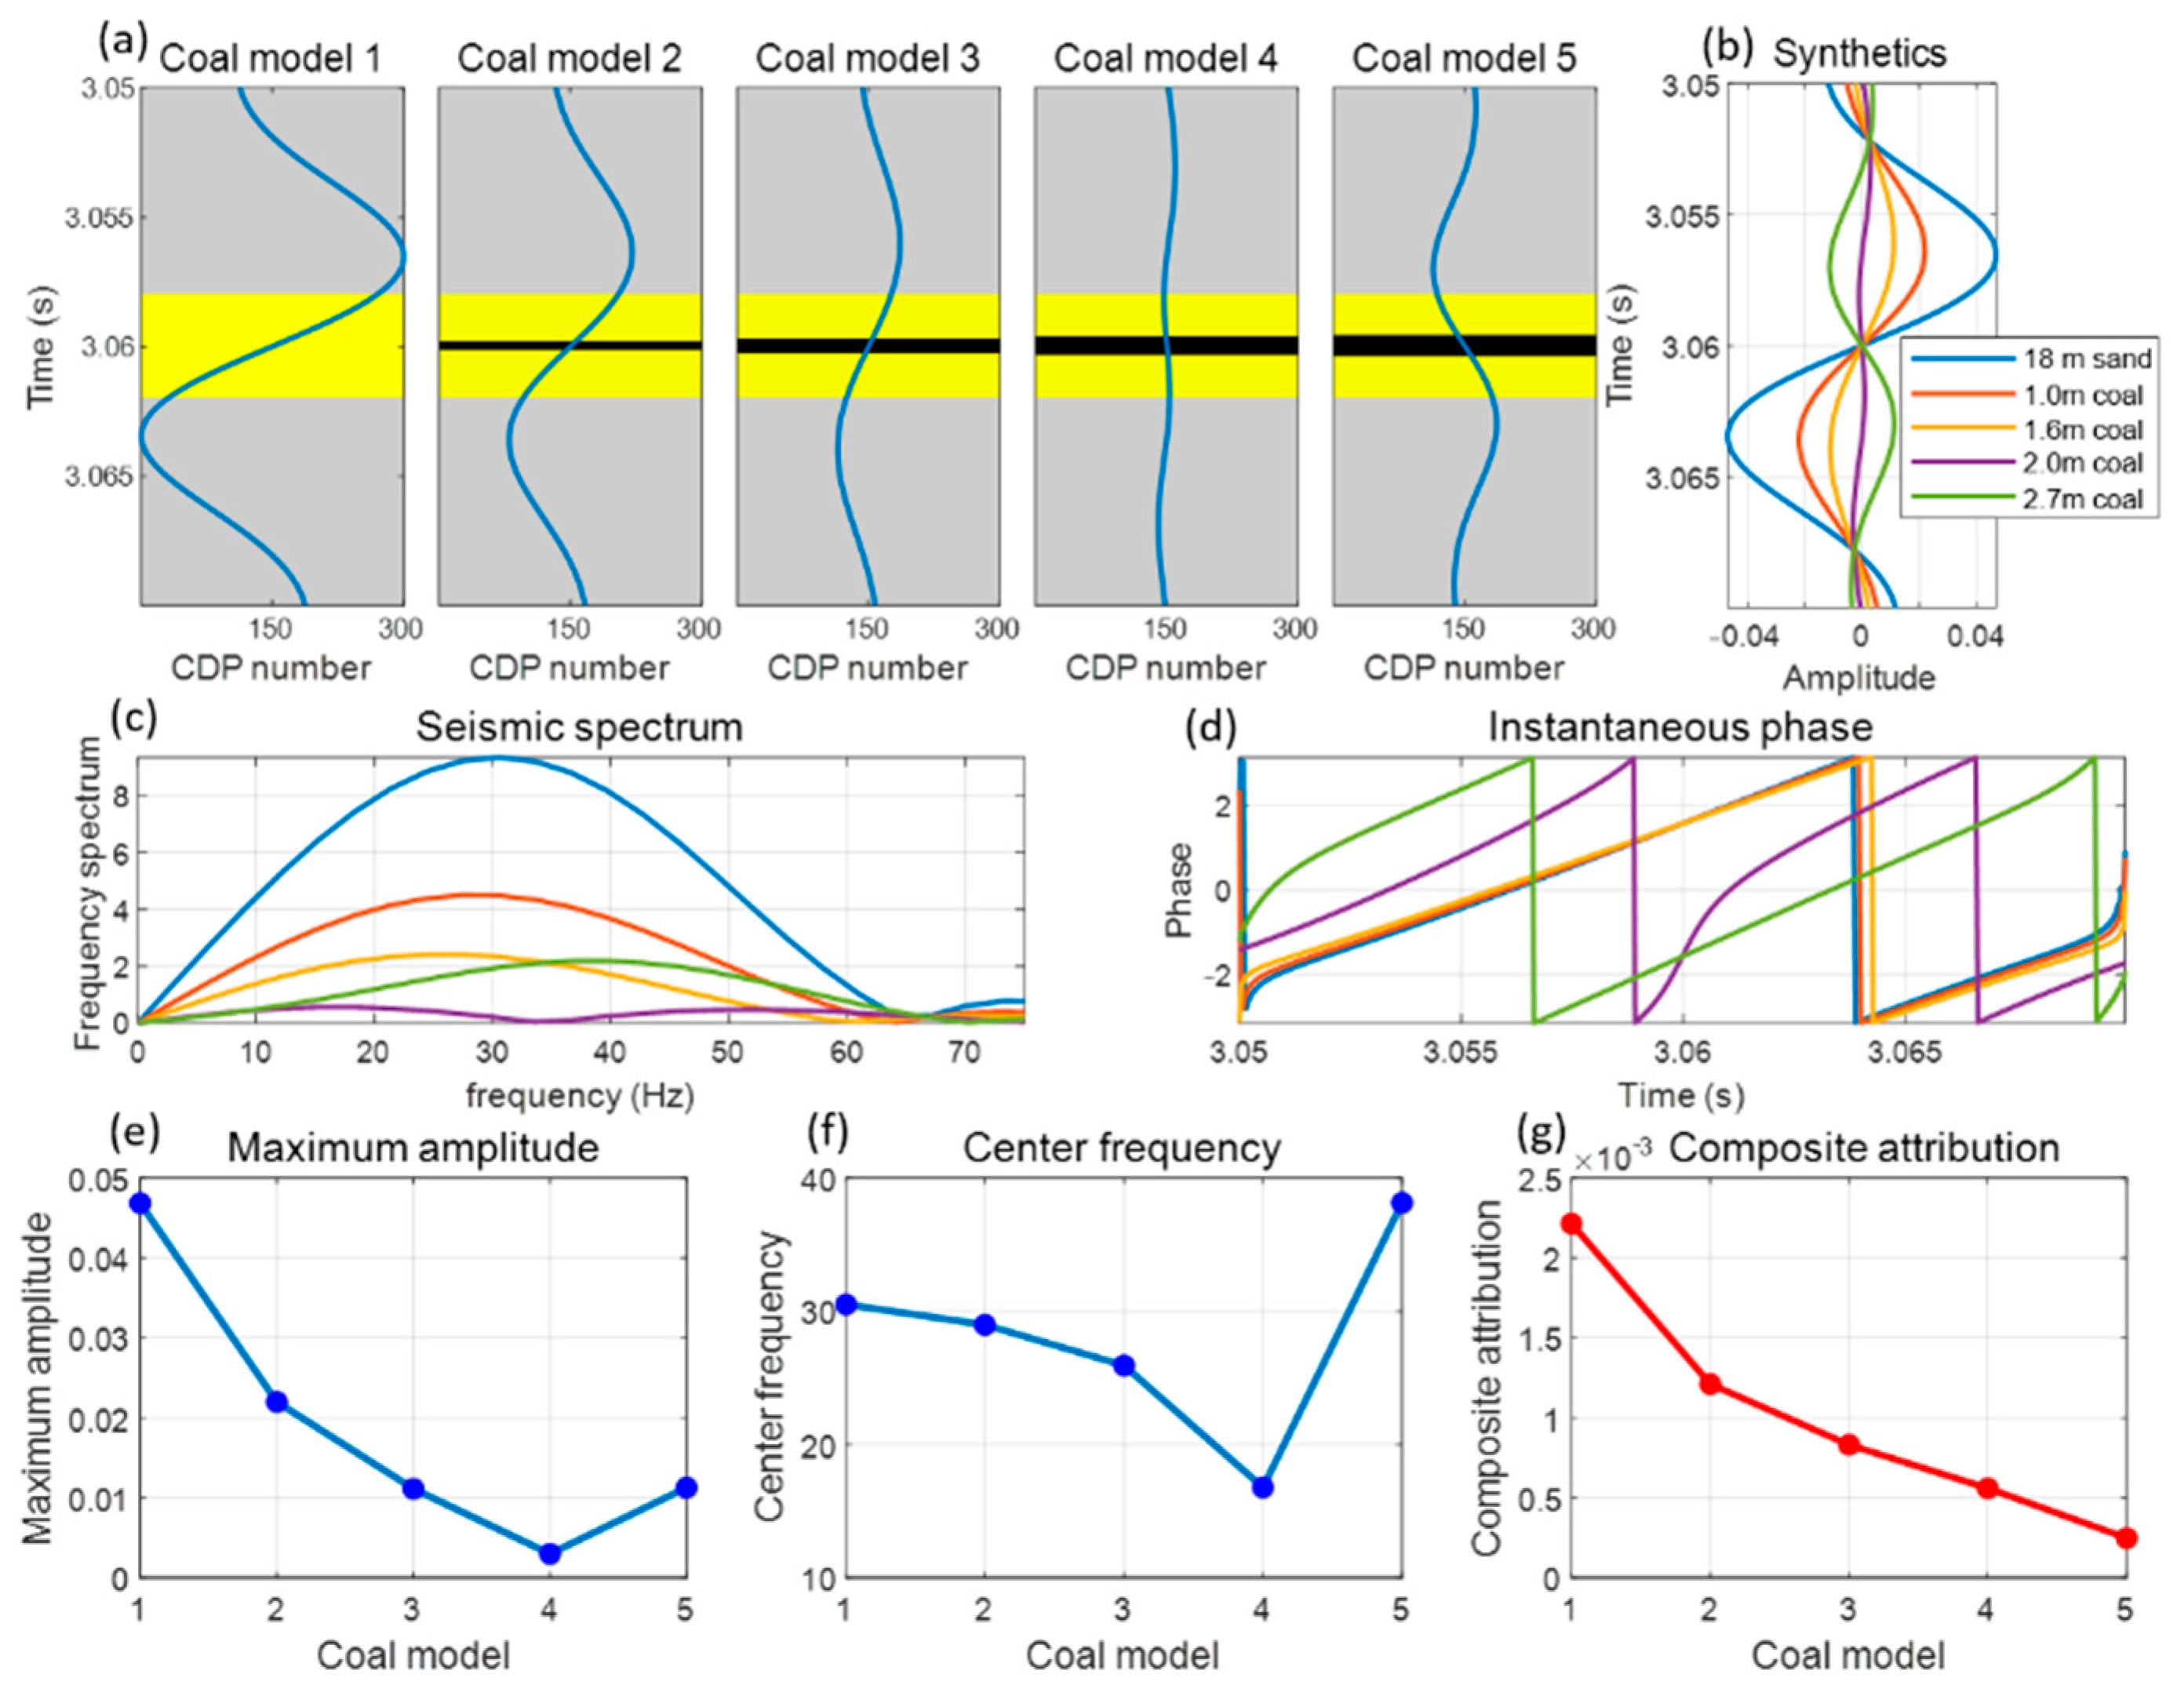
Figure 5 shows the attributes of the SCS (sandstone-coal-sandstone) model containing a thick sandstone layer with a coal seam in the middle. In
Figure 5a, the thickness of the sandstone is 18 m, and the thickness of the coal seam in the middle of the sandstone gradually increases from zero to 2.7 m.
Figure 5b–d demonstrate that when a single coal seam traverses the middle of a thick sandstone layer, the seismic amplitude decreases (and a polarity reversal even occurs) as the coal seam thickens. Before a polarity reversal occurs, the peak value of the spectrum decreases obviously with an increase in the coal’s seam thickness, but after polarity reversal, the instantaneous phase is obviously staggered. As shown in
Figure 5e–g, the amplitude and centre frequency of the synthetics decrease before polarity reversal but increase after polarity reversal. The composite attribute decreases with an increase in the coal’s seam thickness and decreases sharply when the lithology changes from pure sandstone to a coal-bearing model. Moreover, as the thickness of the coal seam in the sandstone increases gradually, the composite attribute decreases slowly. Therefore, the rate at which the composite attribute decreases can be adopted as a characteristic for recognizing a coal seam in thick sandstone.
Figure 6 illustrates the attributes of the SCS (sandstone-coal-sandstone) model containing a thick sandstone layer with multiple thin coal seams. In
Figure 6a, the thickness of the sandstone is 18 m, the number of thin coal seams in the middle of the sandstone gradually increases from 0 to 4 sets, and the thickness of each set is 0.5 m.
Figure 6b–d demonstrate that when there are multiple thin coal seams in the middle of a thick sandstone layer, the variations in the synthetic records and attributes are similar to those in the model with a single coal seam in the middle of a thick sandstone layer (
Figure 5). As shown in
Figure 6e–g, when the number of coal seams (each with a thickness of 0.5 m) is less than 4, the maximum amplitude decreases linearly with an increase in the number of thin coal seams; however, when the number of thin coal seams increases to 5, the polarity of the synthetics is reversed, and the maximum amplitude and centre frequency both increase. In addition, the composite attribute decreases nearly linearly with an increase in the number of coal seam sets, and the rate of decrease is similar to that observed in
Figure 5. Thus, according to
Figure 5 and
Figure 6, when thick sandstone is intercalated with one or more thin coal seams, their presence still has a considerable impact on the seismic synthetics, even if the total thickness of all coal seams is less than 1 m.
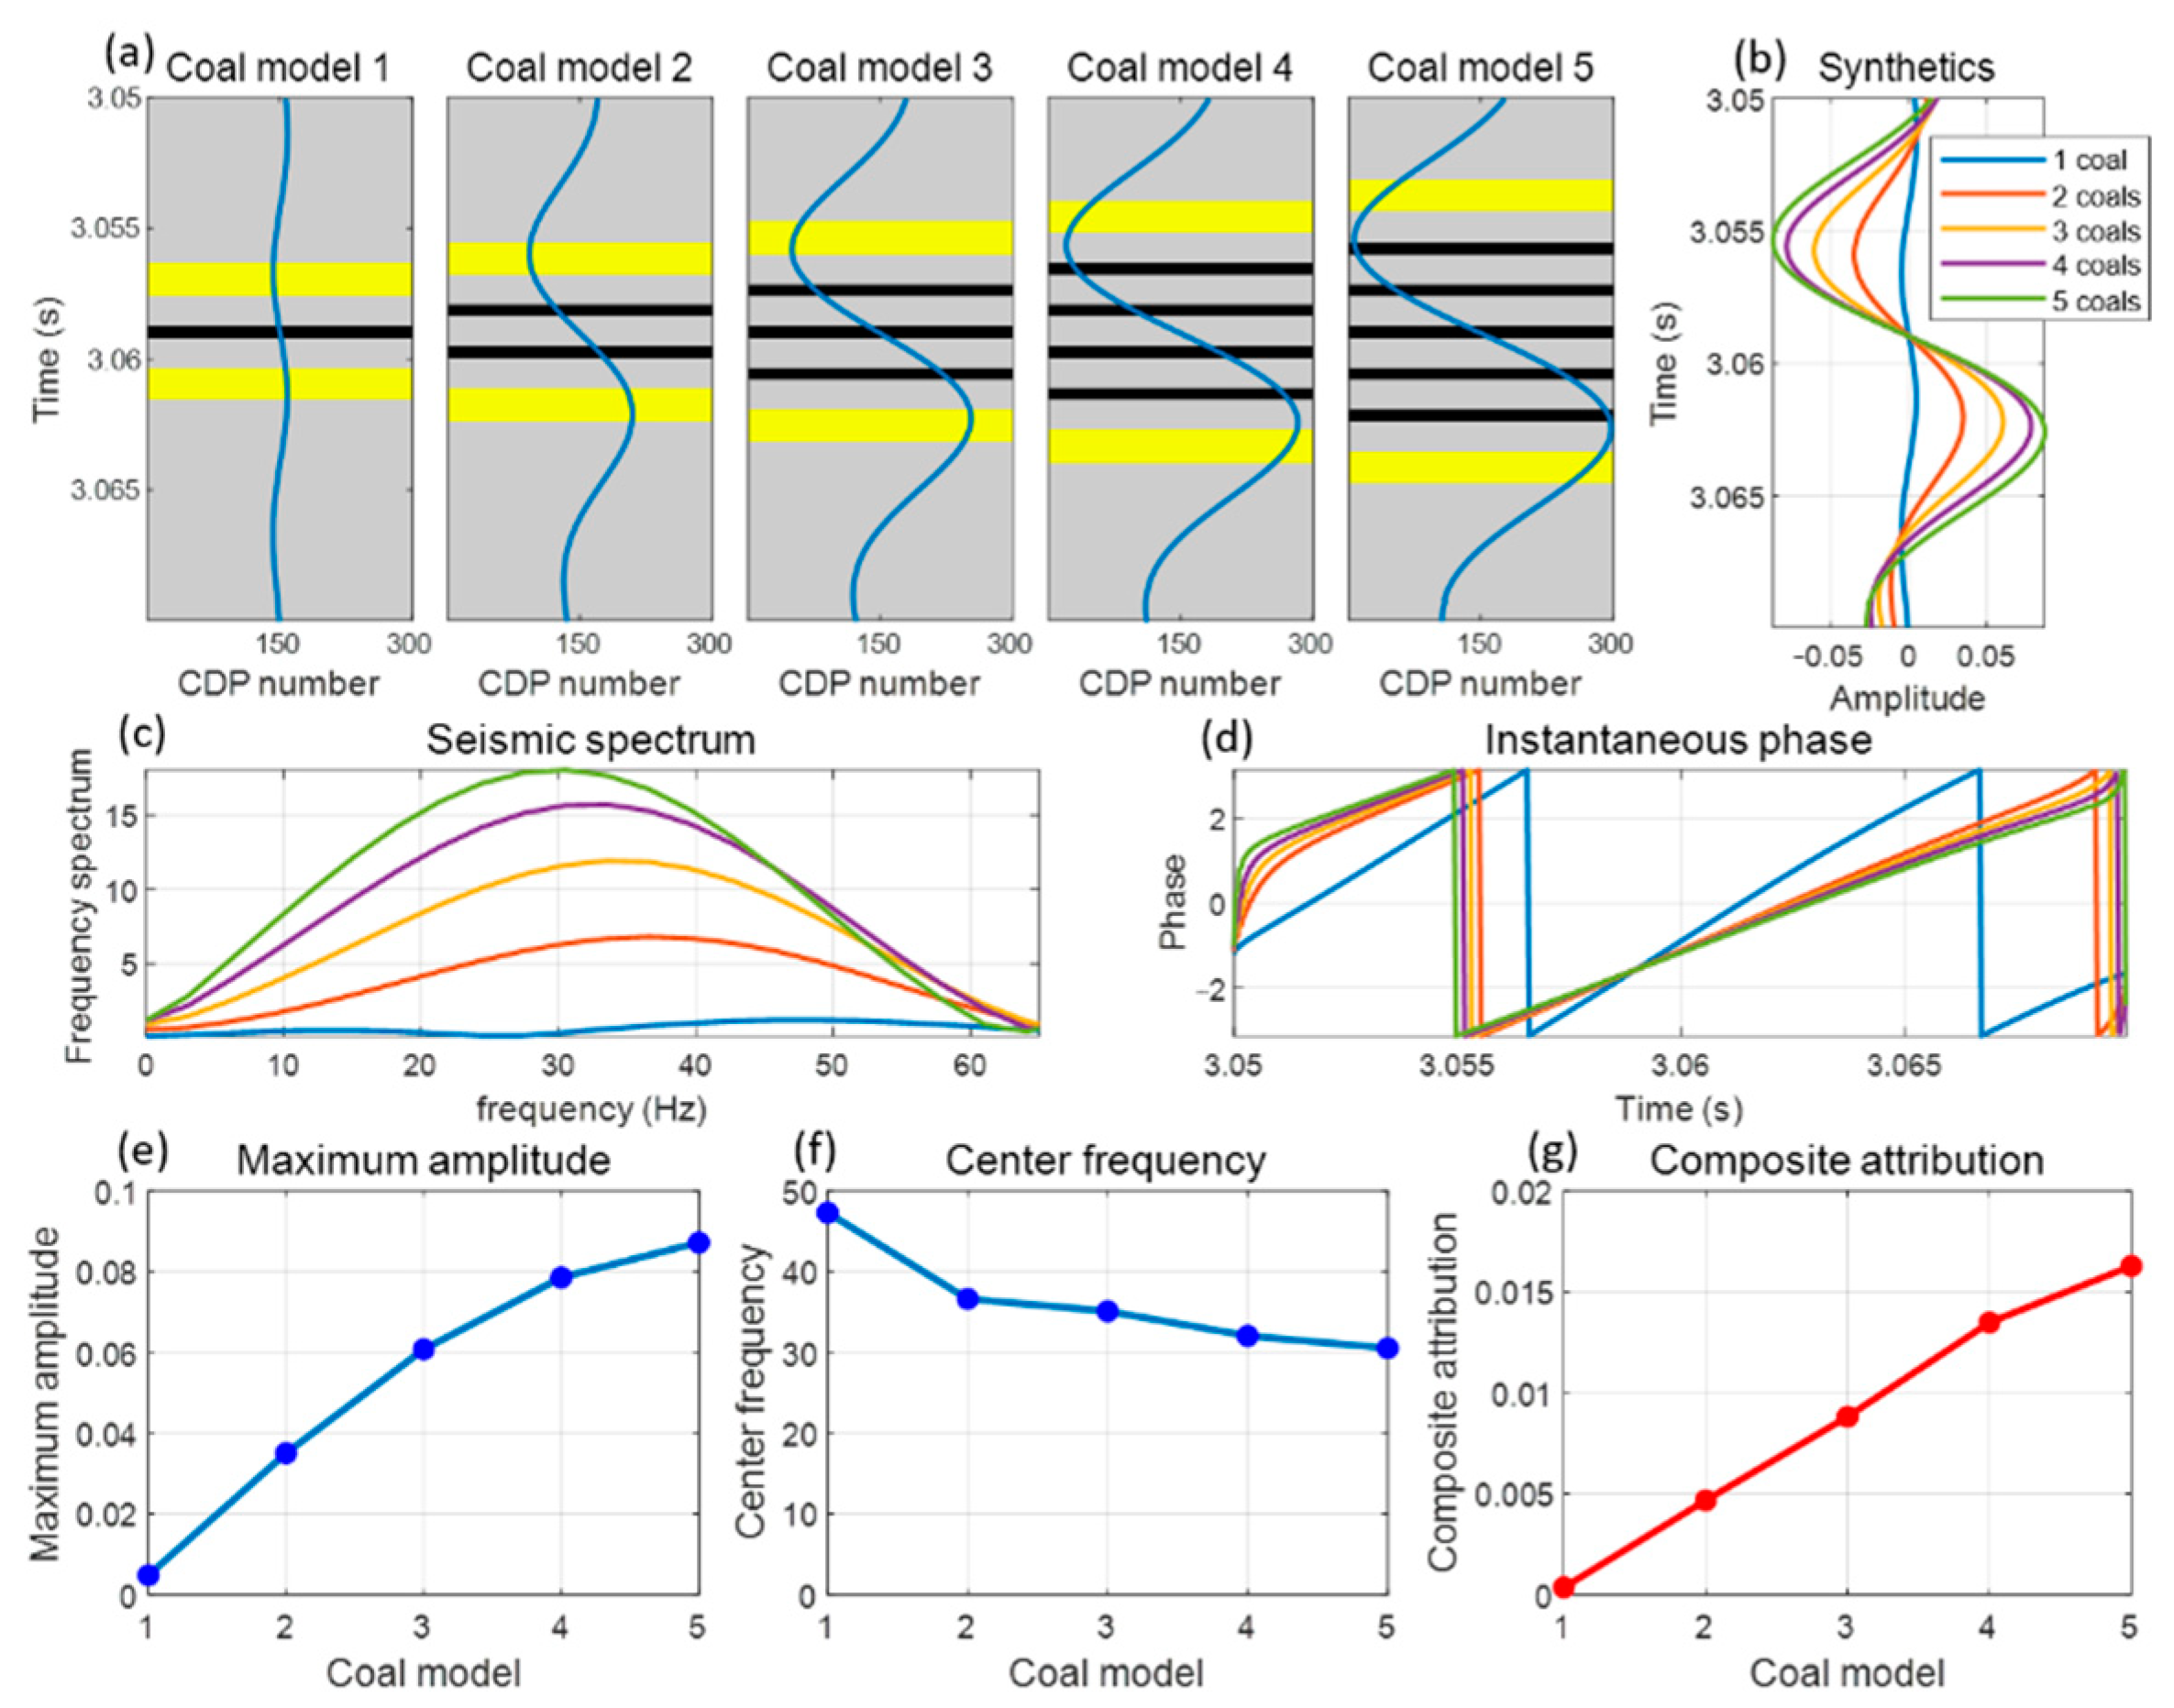
Figure 7 illustrates the attributes and seismic spectra of the SMC (sandstone-mudstone-coal) model comprising a small number of sandstone layers and several thin coal seams coupled in a mudstone background.
Figure 7a presents two sets of sandstone with a thickness of 5 m and a set of thin coal seams, each with a thickness of 1.3 m. The interval between each rock stratum is 4.5 m. As shown in
Figure 7b–d, with an increase in the number of coal seams, the seismic amplitude and peak frequency gradually increase; in addition, the instantaneous phase shift is small. As shown in
Figure 7e–g, the maximum amplitude is positively correlated with the thickness of the coal seam, whereas the centre frequency is negatively correlated with the coal seam thickness. Accordingly, since the composite attribute contains both amplitude and phase information, it exhibits a nearly linear positive correlation with the number of coal seams.
In the MCS (mudstone-sandstone-coal) model visualized in
Figure 8, the thin sandstone and thin coal seam are coupled with each other, and the seismic synthetics and attributes are shown.
Figure 8a presents four sets of thin sandstone with a thickness of 3.5 m, and the sandstone interval is 6 m. The number of coal seams gradually increases in the lateral direction from 0 to 4, and each thin coal seam is 0.5 m thick. Each coal seam lies directly atop the corresponding sandstone layer.
Figure 8b–d reveal that with an increase in the number of coal seams, the peak of the seismic synthetic record is delayed, the peak frequency of the seismic spectrum first increases and then decreases, and the staggered instantaneous phase mutation is delayed successively as the number of coal seams increases up to 4. As shown in
Figure 8e–g, compared with those of pure sandstone, the maximum amplitude and centre frequency increase when a coal seam is present. As the number of coal seams gradually increases, the maximum amplitude decreases gradually, and the centre frequency increases first and then decreases. Compared with the four sets of pure sandstone, the composite attributes of the coal-bearing models are slightly reduced. If sandstone is coupled with one or more thin coal seams, the composite attribute decreases gradually with an increase in the number of thin coal seams. In conclusion, when sandstone is coupled with a thinner coal seam, the seismic amplitude increases, but the maximum amplitude is delayed. When the sandstone is coupled with multiple thinner coal seams, the seismic amplitude decreases significantly, and no sandstone reflection anomaly can be observed against the mudstone background.
Comparing
Figure 2 to
Figure 8 reveals that, first, the coal seam has the greatest influence on the seismic reflection of the sandstone when the thick sandstone and the thin coal seam are combined: The amplitude change of the coal seam at the top of the thick sandstone is the most obvious, the amplitude change of the multiple extremely thin coal seams in the middle of the thick sandstone is second, and when the thick sandstone contains a set of thin coal seam in the middle, the amplitude change is small. Second, the change in the distance between thin sandstone and thin coal seams and the increase in the number of coal seams in the thin interbedded sand and coal seam have similar effects on the seismic amplitude, which are both smaller than the effect of the combination of thick sandstone and thin coal seams on the amplitude. Finally, in the lithological assemblages of multiple sets of thin coal seams and thin sandstone couplings, the sandstone’s thickness has the least effect on the variation in seismic amplitude.
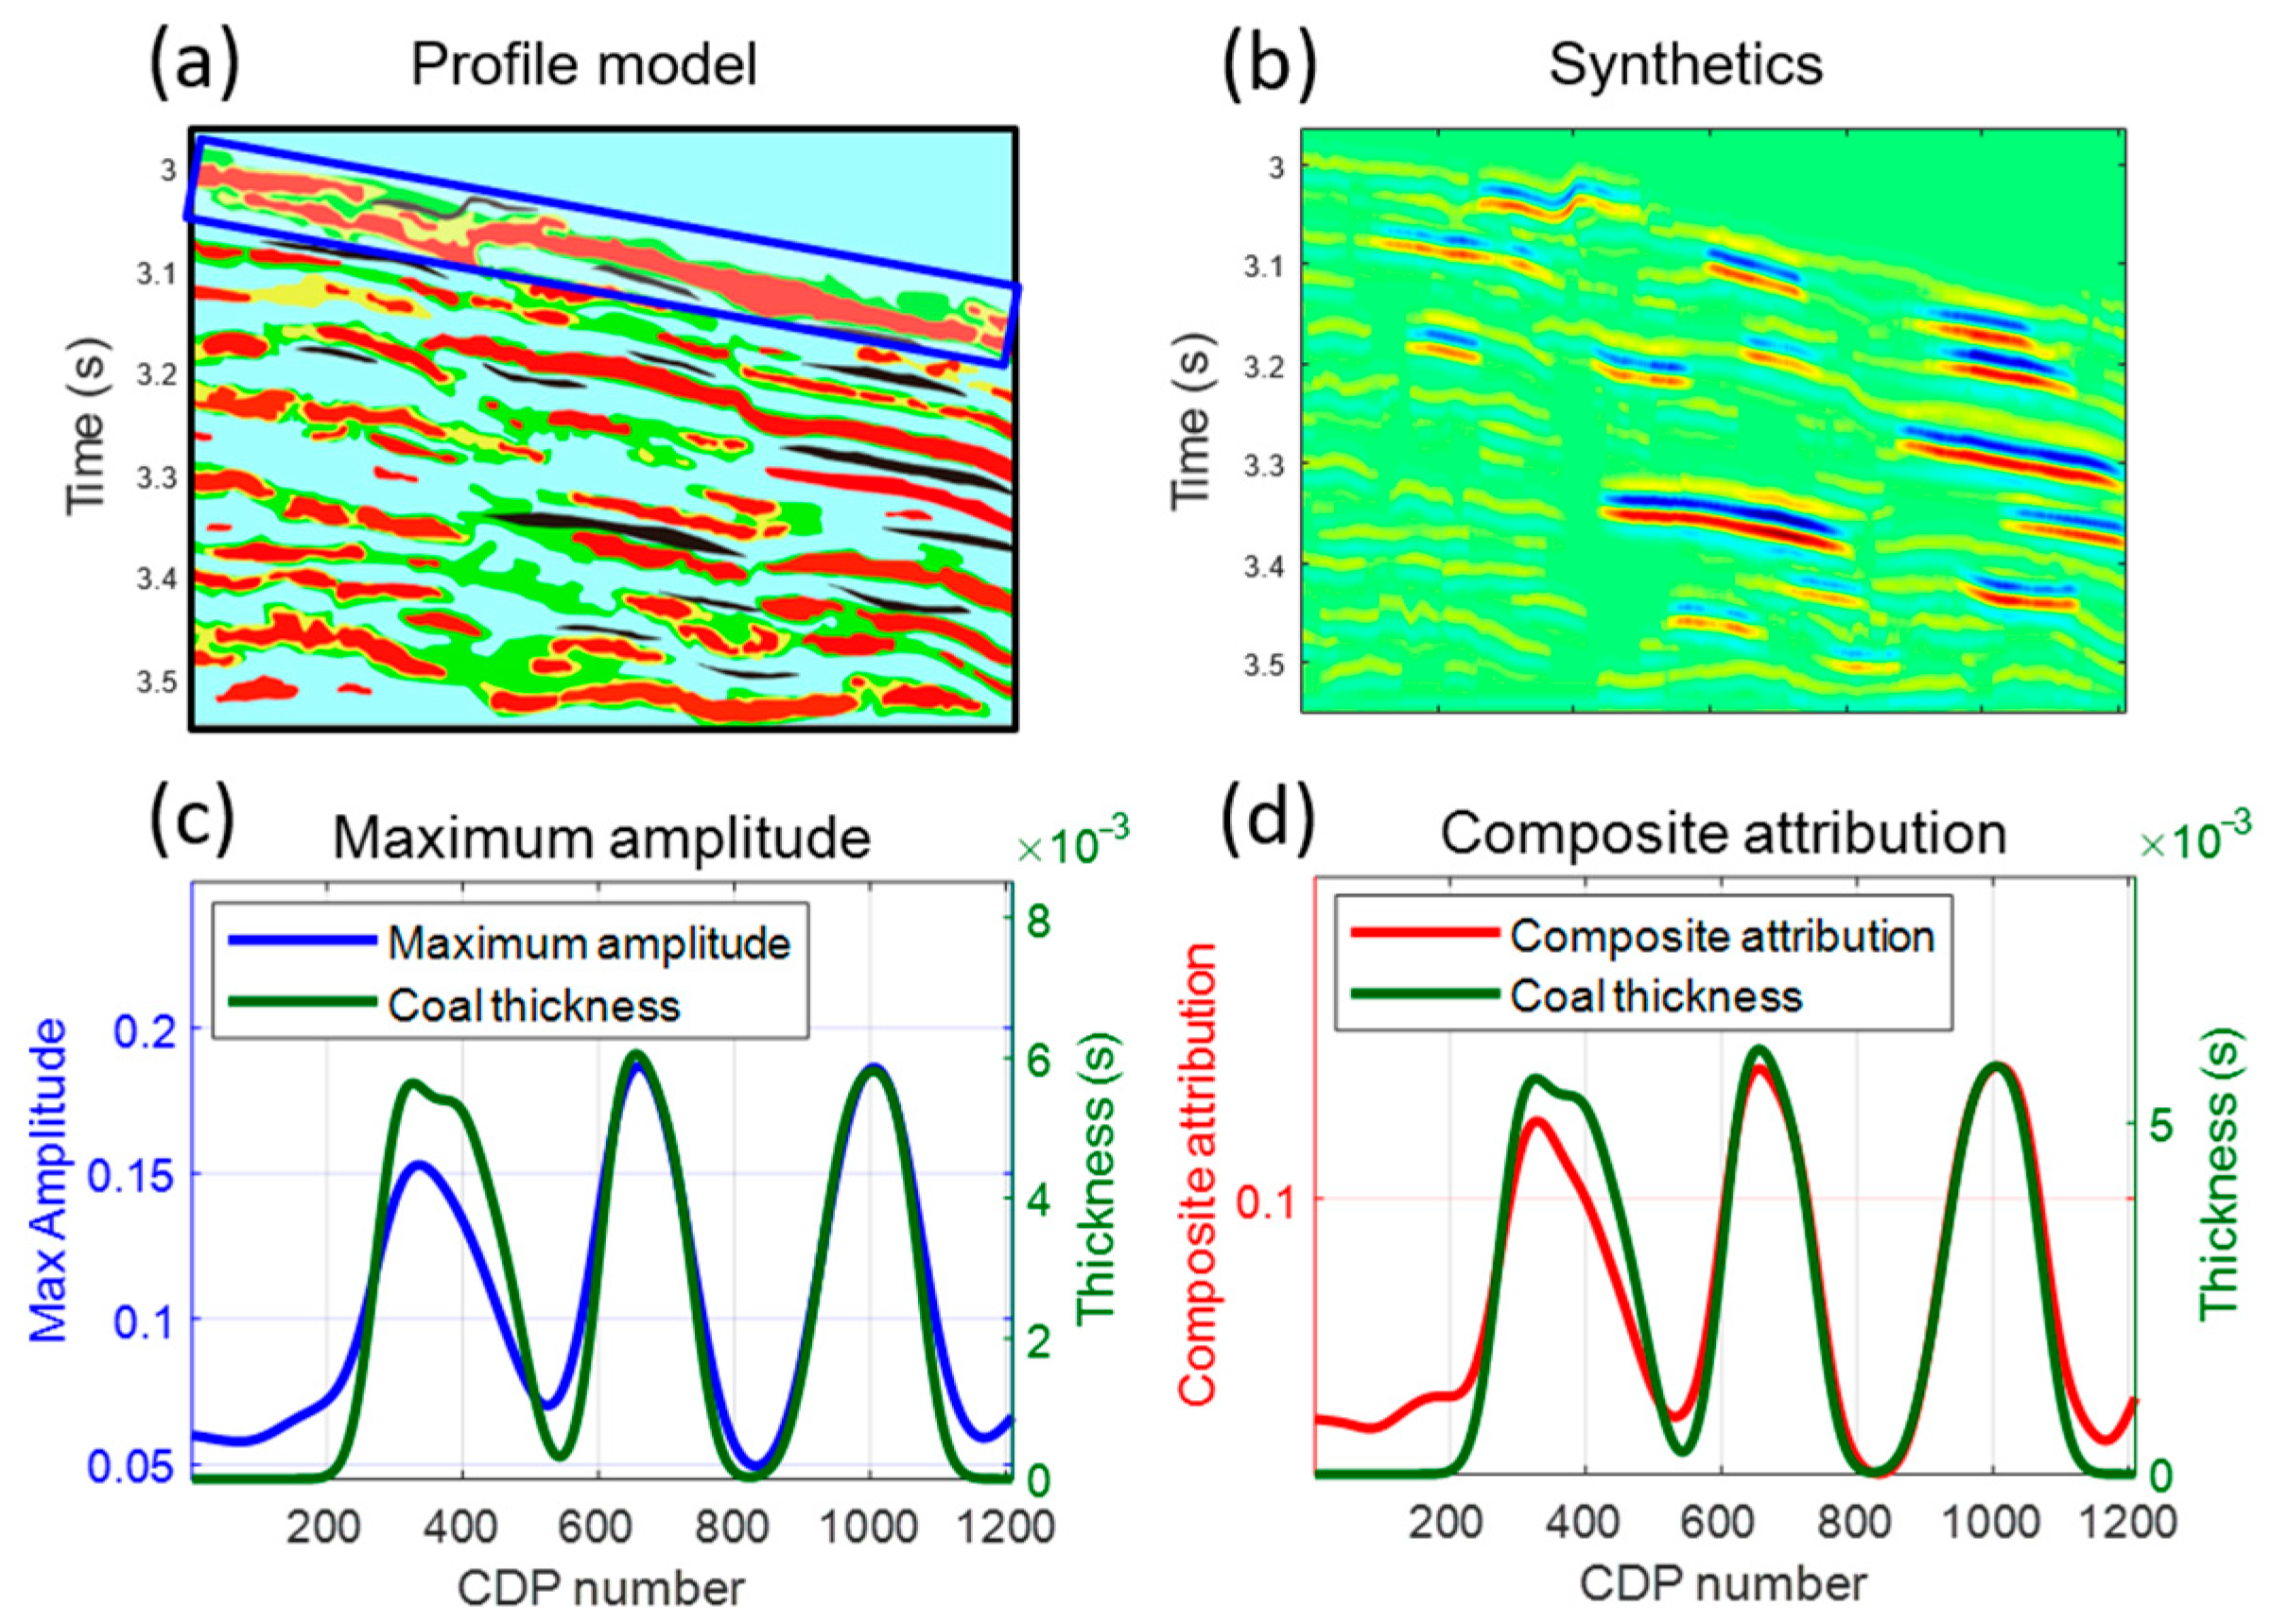
The above seven models have different lithological combinations in the vertical direction, whereas the media are homogeneous and isotropic in the lateral direction. Thus, based on the spatial distribution characteristics of the stratigraphic structure of the actual seismic profile, a complex seismic model with lateral variations is constructed, as shown in
Figure 9 and
Figure 10.
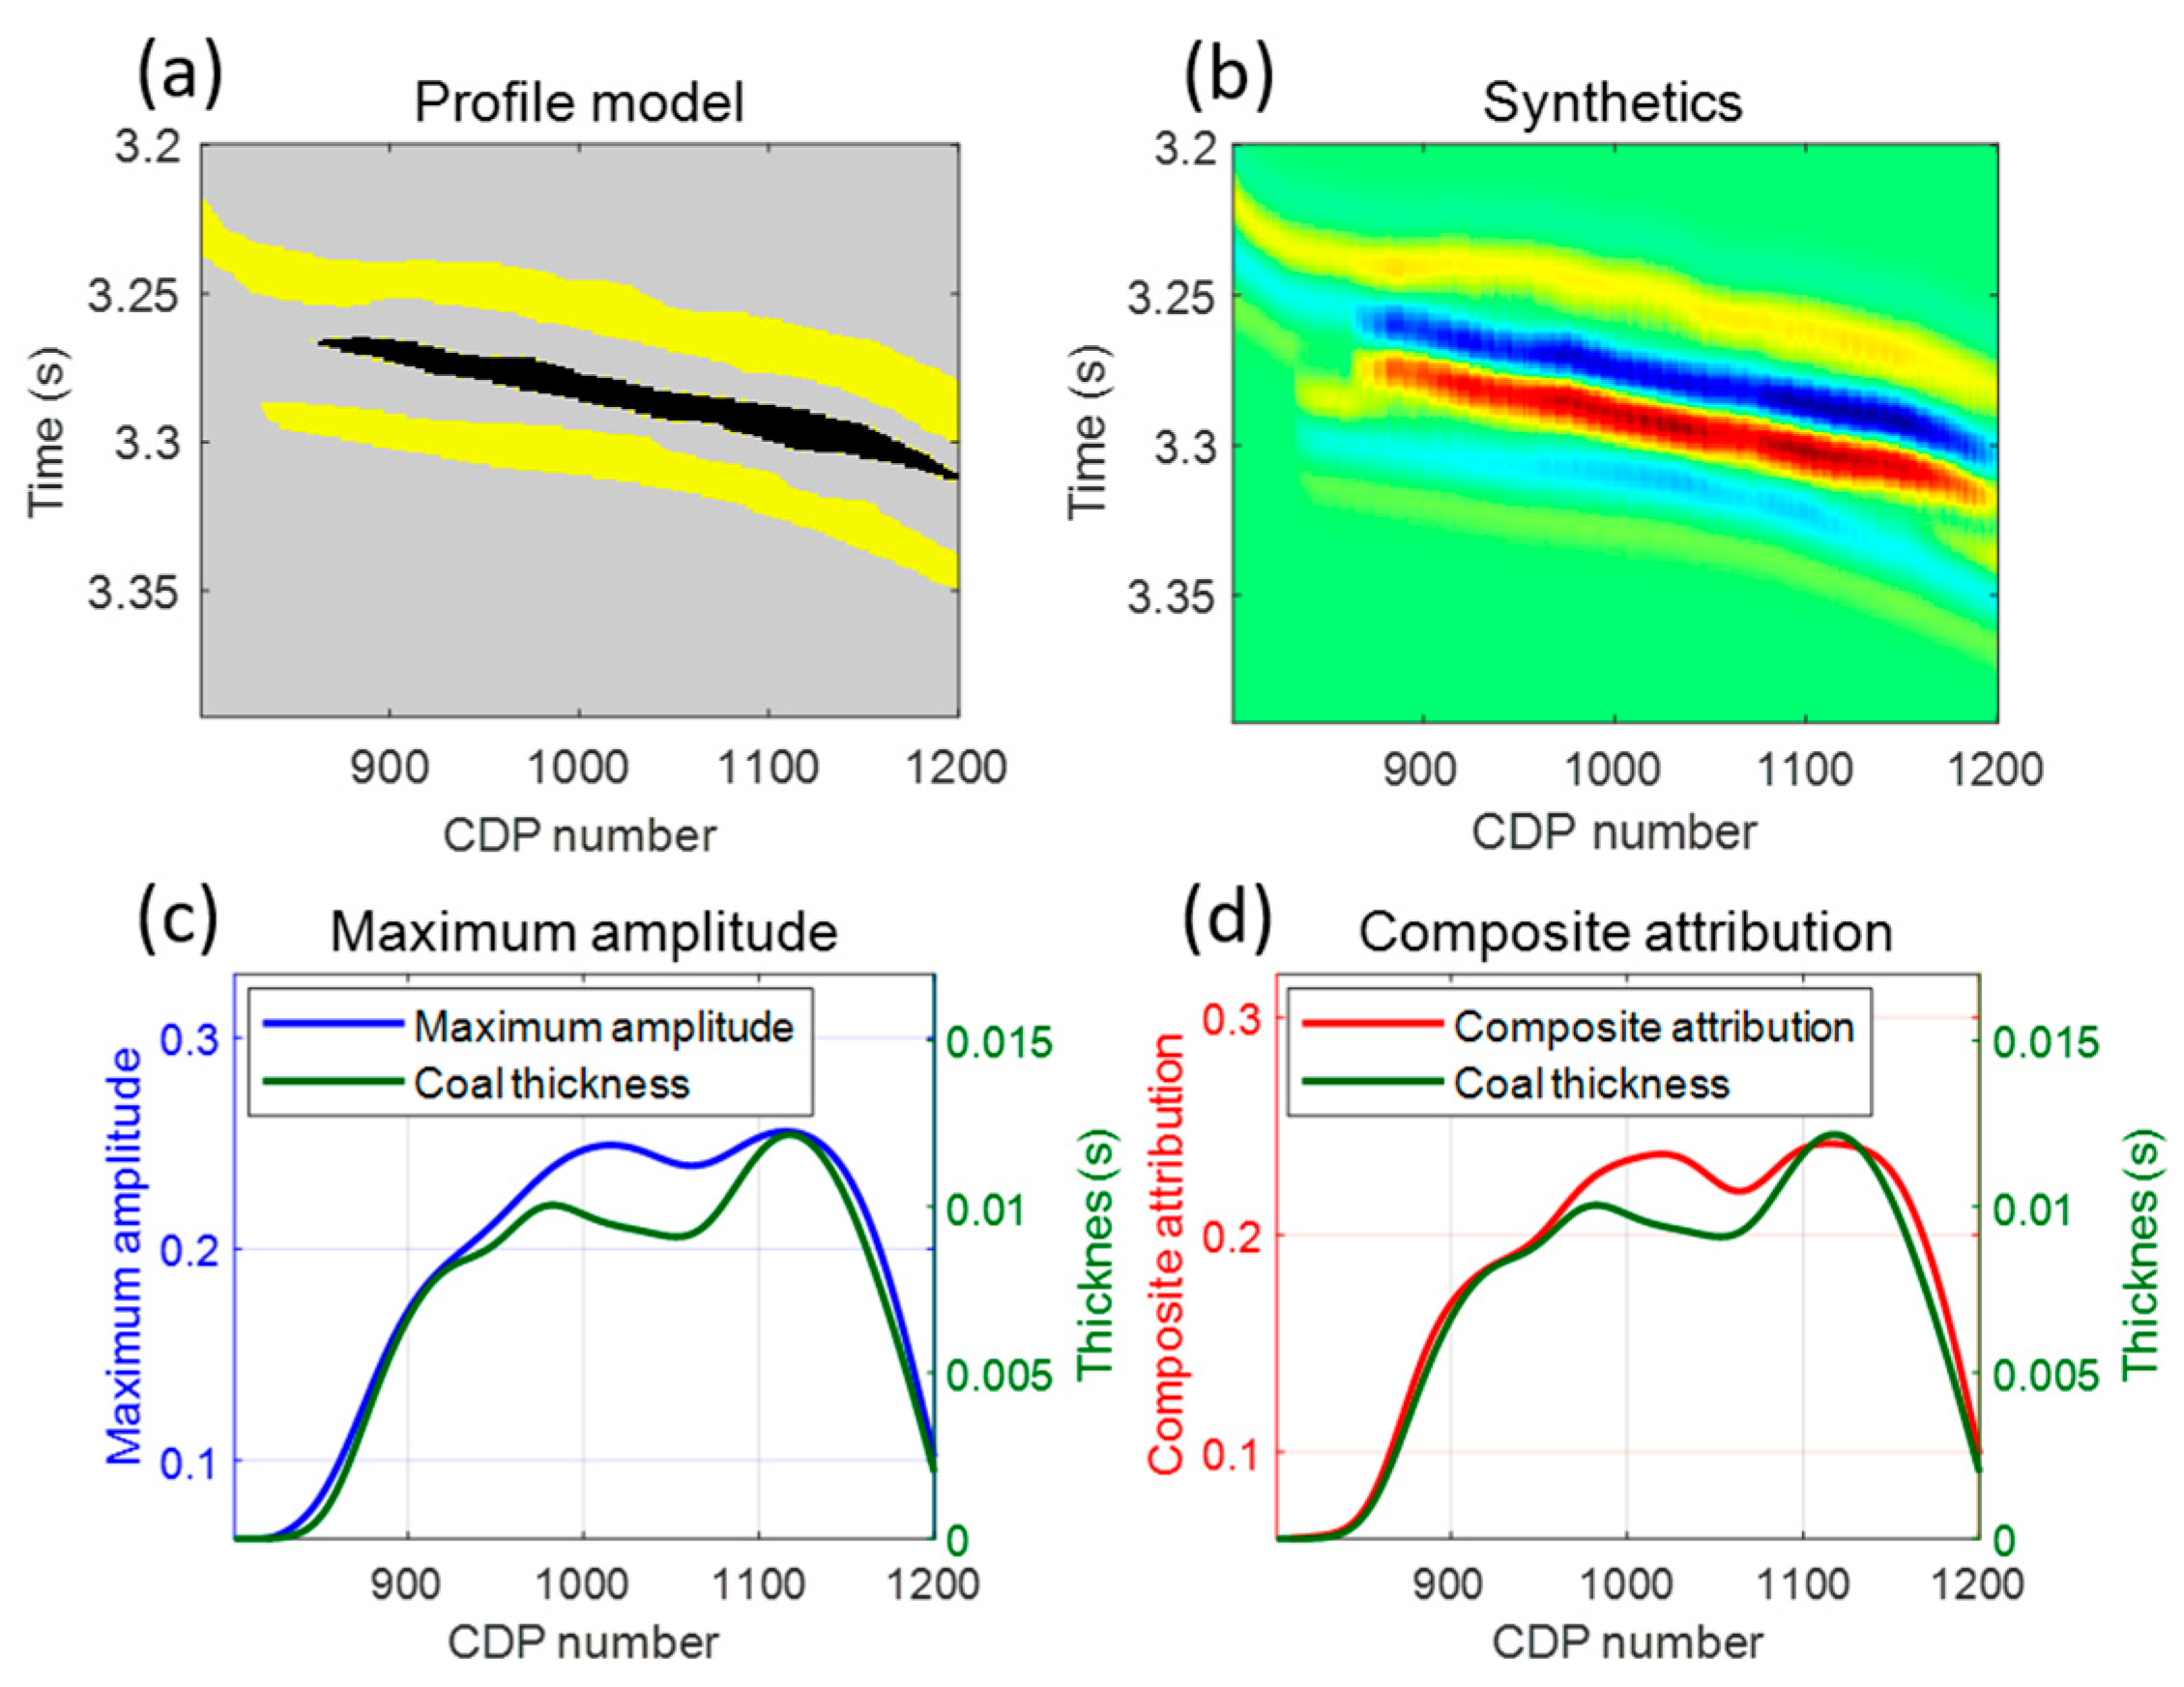
Figure 9a shows a seismic model comprising two sandstone layers with one coal seam exhibiting lateral variation, and
Figure 9b shows the 2D profile synthetic of the model.
Figure 9c shows the maximum amplitude of the synthetic record, in which the green curve is the actual thickness of the coal seam and the blue curve is the maximum amplitude.
Figure 9d plots the composite attribute of the synthetic record, in which the green curve is the actual thickness of the coal seam and the red curve is the composite attribute.
Figure 9 shows that in this laterally variable model, both the maximum amplitude and the composite attribute can accurately describe the thickness of the coal seam. Additionally, the meanings of all the subgraphs in
Figure 10 are the same as those in
Figure 9. In
Figure 10a, the different colours represent different lithologies, and black still represents the coal seam; red and yellow represent sandstones with different properties, and blue and green represent surrounding rocks with different properties. This model is far more complex than that in
Figure 9, as the coal seam and sandstone change more substantially in the lateral direction. The seismic attributes in
Figure 10 are calculated by selecting the time window in the blue box of the model in
Figure 10a. Comparing
Figure 10c,d reveals that for a complex coal model with lateral variations, the composite attribute is more sensitive to the thickness of the coal seam than is the maximum amplitude attribute.
Figure 11a–c show the lithology (yellow represents sandstone, and grey represents mudstone), shale content, and porosity of actual logging data, and
Figure 11d–f show the longitudinal- and shear-wave velocities, density, and elastic moduli of sandstones containing different fluids calculated based on petrophysical models (blue represents water, green represents oil, and red represents gas). Then, the fluid is replaced based on the elastic modulus of the reservoir, and the Aki–Richards approximation is used to perform prestack forward modeling.
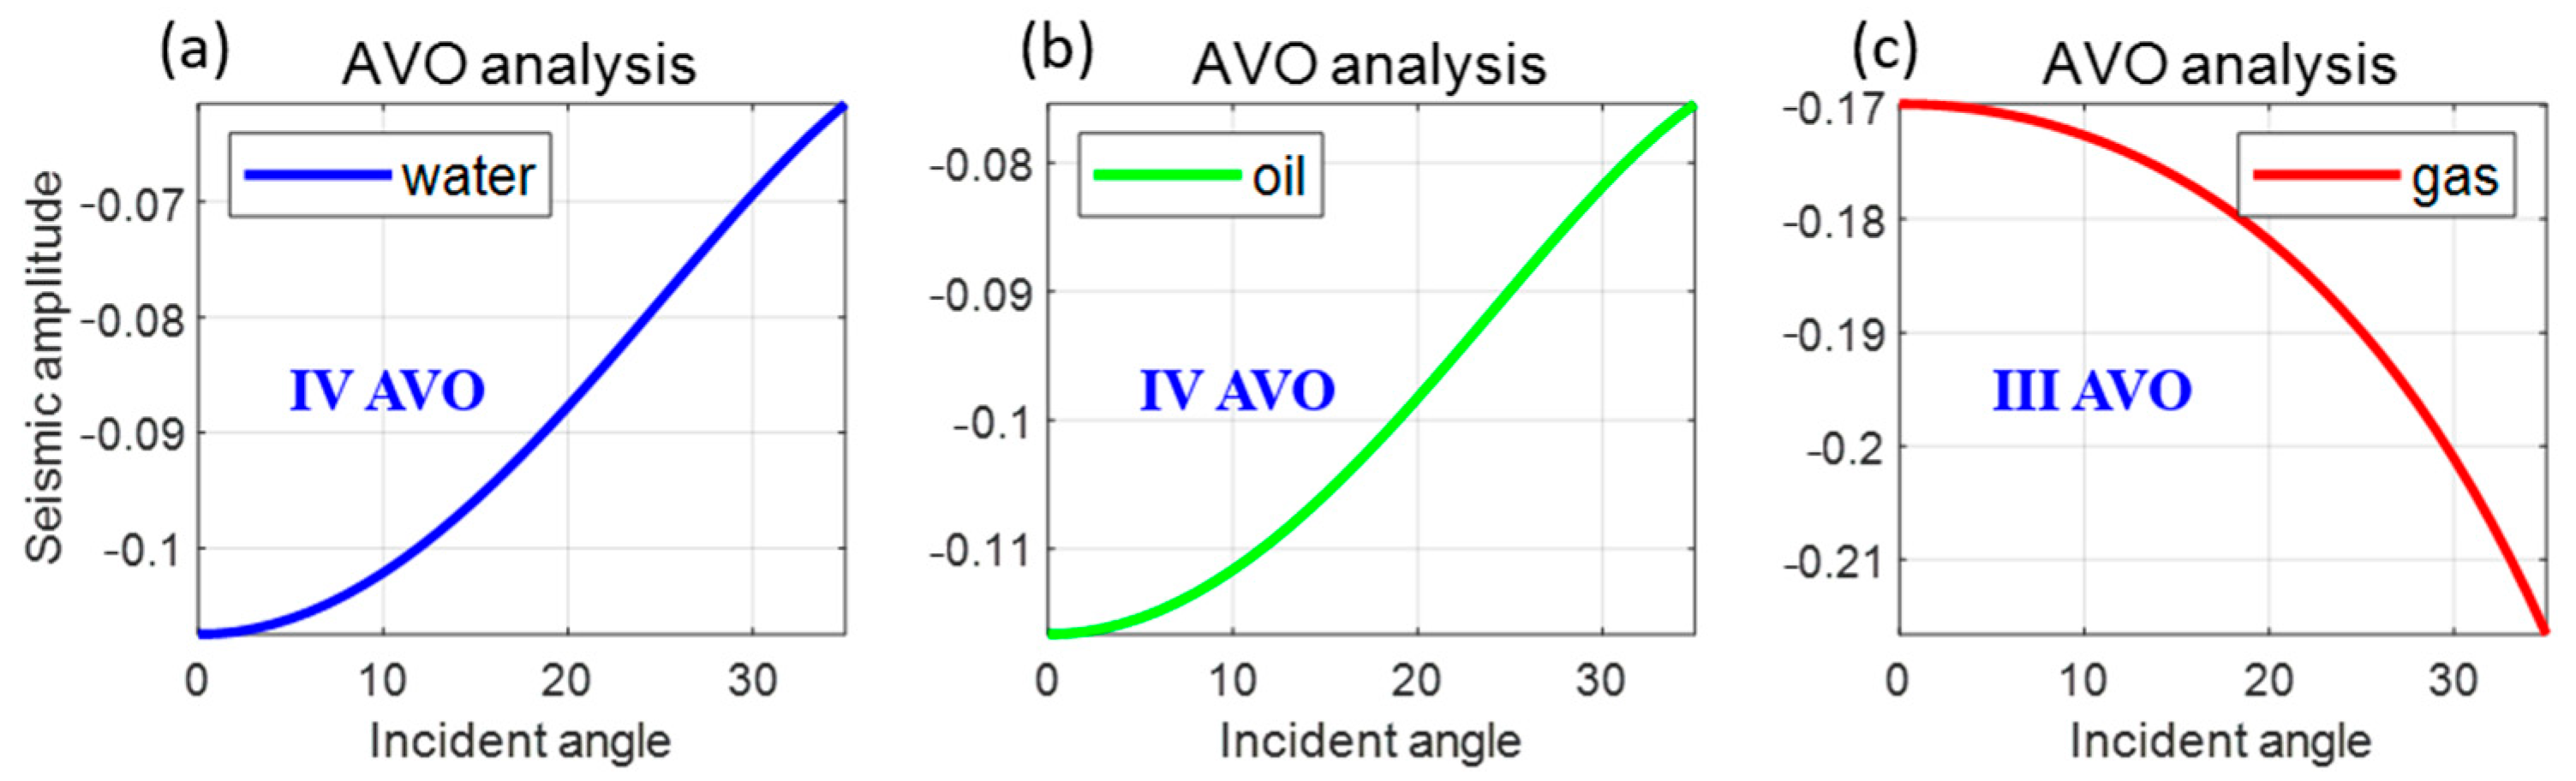
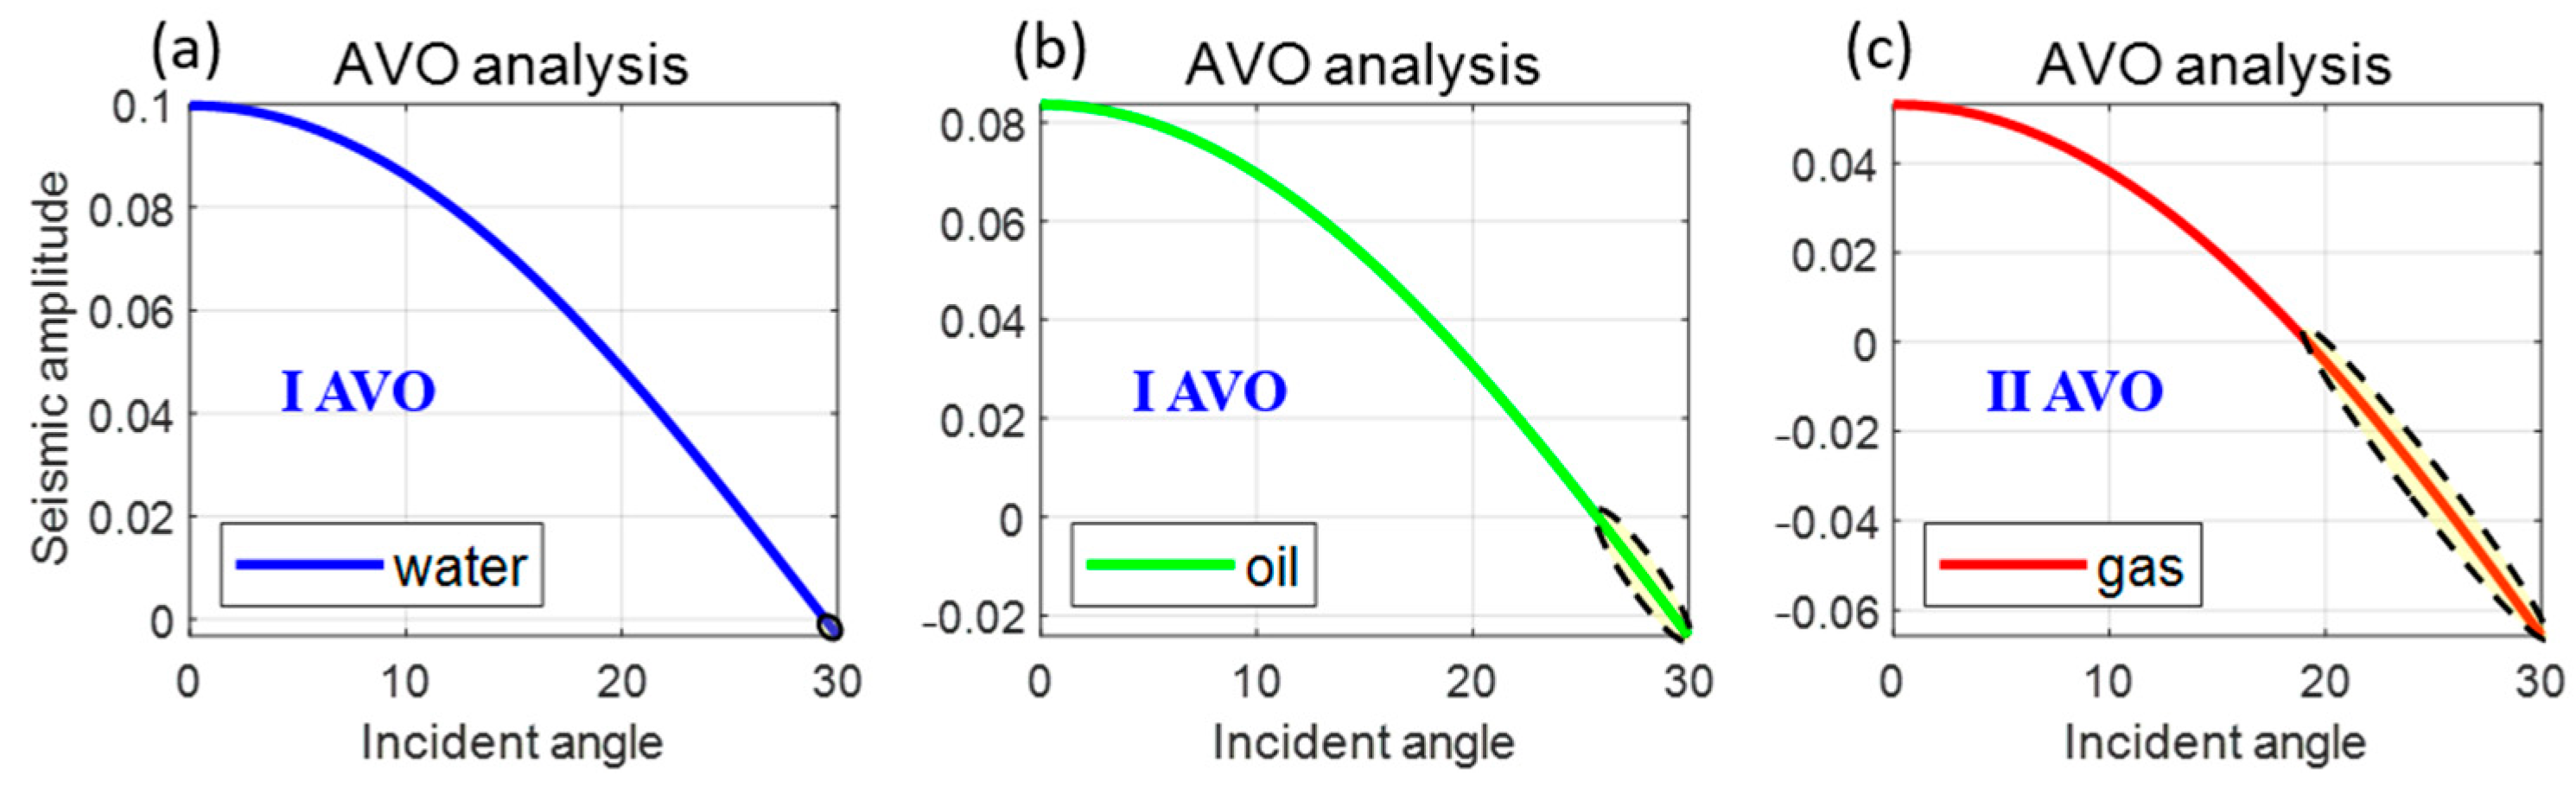
Figure 12 and
Figure 13 show the AVO responses of low-velocity sandstone and high-velocity sandstone, respectively, containing different fluids. As shown in
Figure 12, the low-velocity sandstone at 2.7 s is the fourth type of AVO when it contains water and oil, and the absolute value of the amplitude is larger when it contains oil than when it contains water. However, when gas is present, the third type of AVO is observed. Therefore, the AVO characteristics of gas reservoirs are obviously different from those of oil-bearing and water-bearing reservoirs. Furthermore, as shown in
Figure 13, the high-velocity sandstone at 2.96 s is the first type of AVO when it contains both water and oil. The seismic amplitudes are almost positive, and the absolute value of the amplitude is slightly larger when water is present. However, the second type of AVO is identified when the sandstone contains gas, and the polarity reversal of the seismic amplitude occurs at incident angles exceeding 20°.
4. Real Data Examples
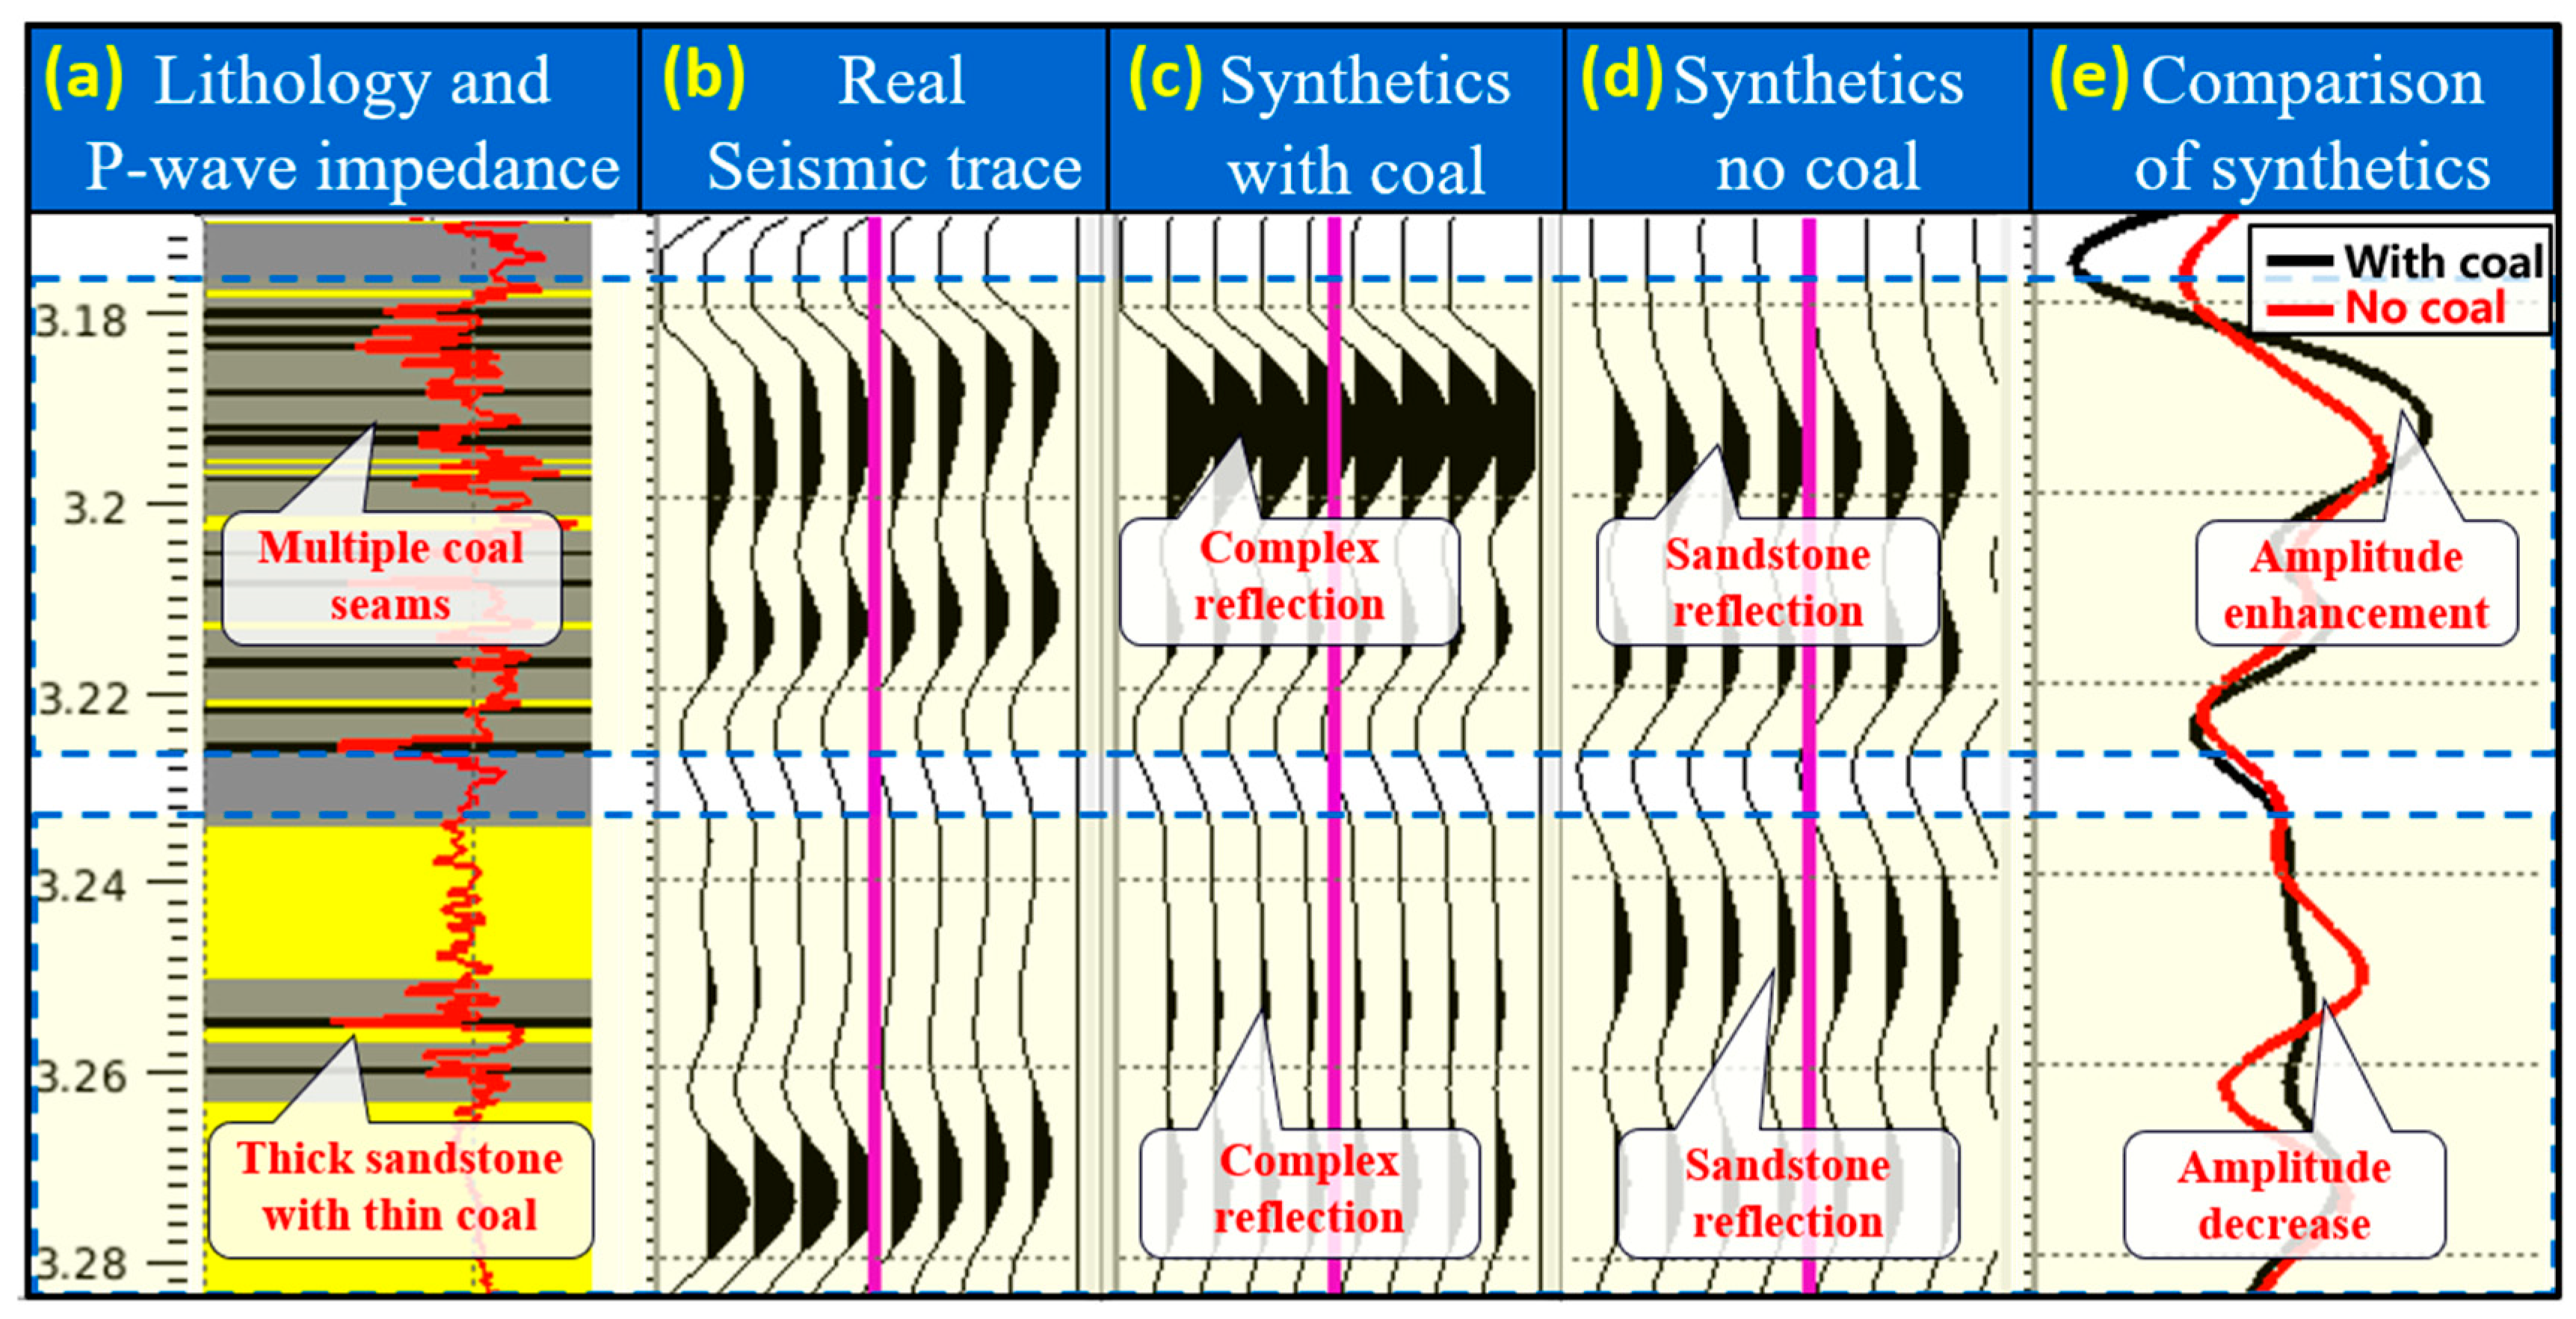
From the actual well data acquired in the field, several sections with lithologic combinations similar to those of the theoretical model were selected to verify the theoretical conclusions of the above model tests. A comparison with seismic records in the target section is shown in
Figure 14. In the lithological interpretation of
Figure 14a, yellow represents sandstone, grey represents mudstone, and black represents a coal seam. The longitudinal-wave impedance represented by the red curve overlies the lithology. The seismic trace from the side of the borehole in the selected time window in
Figure 14b highlights the reflection characteristics of the actual formation.
Figure 14c shows the synthetic seismic records obtained by the convolution model using these well data, revealing good consistency with the seismic record from the side of the borehole, which confirms the rationality of the synthetic record method and its practical application. After replacing the coal seam in
Figure 14a with mudstone, lithology results without a coal seam are obtained. The seismic record without a coal seam is calculated using the lithological interpretation results with only sandstone in a mudstone background, as shown in
Figure 14d. A single trace is extracted from the two synthetic records for comparison. In
Figure 14e, the black and red curves represent the seismic records with and without coal seams, respectively. In comparison with the lithological characteristics in
Figure 14a, where the curves in
Figure 14e are inconsistent, when multiple sets of thin sandstone layers and coal seams are present, if the number of coal seams is similar to the number of sandstone layers, the coal seams weaken the sandstone reflection amplitudes; this is consistent with the model test result of a decreasing amplitude in
Figure 8. Similarly, when thick sandstone is intercalated with a coal seam, the amplitude of the sandstone is also weakened, which is consistent with the model test result of the decreasing amplitude in
Figure 4.
The lithology of the selected logging target interval in
Figure 15 is characterized by multiple coal seams in a mudstone background and a thick sandstone layer with multiple thin coal seams. The meanings of the colours and curves in the subgraphs are the same as those in
Figure 14.
Figure 15e shows that the amplitude increases when there are multiple thin coal seams in the mudstone background. When there is a coal seam in the middle of a thick sandstone layer, the reflection amplitude of the sandstone decreases. Therefore, the influence of the coal seam on the sandstone is both weakened and enhanced. In particular, when multiple sets of thin sand layers and coal seams are coupled with each other, the waveforms interfere with each other and form complex composite waves. The lithology of the selected logging target interval is characterized by a small number of thin sandstone layers coupled with multiple thin coal seams. The meanings of the colours and curves in the subgraphs are the same as those in
Figure 14.
Figure 16e shows that when a small number of thin sandstone layers and multiple thin coal seams are coupled in a mudstone background, the reflection amplitudes are enhanced due to the dominant coal seam reflections. This comparison is consistent with the model test result of amplitude enhancement in
Figure 7.
The influence of the coal seam on the seismic amplitude in the above typical lithologic assemblages of coal-bearing reservoirs validates the conclusion of the theoretical model. This verification justifies the rationale of the theoretical method and its implementation. It also further shows that the analysis results for coal seams and sandstone in terms of seismic properties and other aspects are reliable. Because the multiple effects of the actual formation are superimposed together and the lithologic combination characteristics are not comprehensive, it is necessary to construct a theoretical model based on the actual logging parameters in the target area to systematically analyse the influence of coal seams on the seismic response of sandstone.
The logging data pertaining to sandstone reservoirs containing oil, gas, and water are selected, and a prestack AVO response analysis is performed on the top interface of each sandstone reservoir. According to the average elastic modulus of the overlying mudstone and the target sandstone reservoir, the theoretical variation in the reflection coefficient with the incident angle is analysed based on the Aki–Richards approximation. As shown in
Figure 17a, the high-velocity sandstone theoretical model of the gas-bearing reservoir is the second type of AVO. The reflection coefficient is positive, and the absolute value is lower than 0.02 at incident angles of less than approximately 18°; at incident angles exceeding approximately 18°, however, the polarity reverses, and the reflection coefficient is negative. After normalizing all seismic records, the AVO type is fitted with the amplitude wave peak value of the actual seismic data corresponding to the top sandstone interface and compared with the synthetic record of actual well data and the synthetic record without a coal seam. In
Figure 17b, the asterisks represent the actual seismic data of the top sandstone interface corresponding to different incident angles. The black solid line is the fitting result of the actual seismic data points, while the solid line with blue triangles represents the synthetic seismic record of the interface obtained by using the actual well data, and the solid line with red circles represents the synthetic seismic record without considering a coal seam (after all the coal seams in the well data are replaced with mudstone).
Figure 17b shows that the AVO curve of the synthetic seismic record is consistent with the fitting curve of the actual seismic data, and both belong to the first type of AVO, further supporting the rationality of the synthetic seismic record. In addition, the synthetic record of the model without a coal seam undergoes a polarity reversal at an incident angle of approximately 15°, and its AVO characteristics are closer to the theoretical AVO trend, which verifies that the coal seam has a considerable influence on the gas-bearing sandstone reservoir and even changes its AVO type.
Figure 18 shows the AVO response of the top interface of the oil-bearing sandstone; all the colours and curves in the figure have the same meanings as those in
Figure 17. The high-velocity sandstone theoretical model of oil-bearing sandstone in
Figure 18a presents the first type of AVO. In
Figure 18b, the influence of the coal seam on the AVO characteristics of oil-bearing sandstone is reflected mainly at incident angles exceeding 15°. When the incident angle increases from 15° to 35°, the amplitudes of the seismic record without a coal seam change to a greater extent with increasing incident angle, and its AVO characteristics are more obvious. Likewise,
Figure 19 shows the AVO response of the top interface of the water-bearing sandstone, and once again, all the colours and curves in the figure have the same meanings as those in
Figure 17. The high-velocity sandstone theoretical model of the water-bearing sandstone in
Figure 19a also presents the first type of AVO. In
Figure 19b, the influence of the coal seam on the AVO characteristics of the water-bearing sandstone is reflected mainly at incident angles of less than 20°. When the incident angle is between 0° and 20°, the amplitudes of the seismic record without a coal seam are larger than those of the synthetic records with a coal seam, and its AVO characteristics are more in line with the theoretical AVO trend.
5. Discussion and Conclusions
The presence of a coal seam has a nonnegligible effect of obscuring the reflections from sandstone strata, which can mislead reservoir boundary descriptions and make reservoir identification endeavours highly challenging. This is especially true when multiple thin coal seams are coupled with sandstone and mudstone, forming a more complex and comprehensive reflection sequence.
Consider the SMC model of multiple thin layers, for example, a sandstone layer with a thickness of less than 8 m and multiple coal seams, each with a thickness of less than 2 m, which are coupled in a mudstone background. The composite wave polarity is negative, and the thickness and interval of the sandstone layer have little effect on the seismic amplitude. With an increase in the number of coal seams, the amplitude increases monotonically, the central frequency decreases monotonically, and the composite attribute shows a nearly linear positive correlation.
For the CS model comprising thick layers, such as a thick sandstone more than 25 m thick overlain by a thin coal seam with a thickness of less than 4 m, with a gradual increase in the thickness of the thin coal seam, the amplitude increases significantly, and the phases are staggered in turn.
Now consider the SCS model of multiple thick layers, for example, a thick sandstone layer with a thickness of greater than 16 m that contains thin coal seams, each with a thickness of less than 2 m, which are coupled in a mudstone background. With an increase in either the thickness or the number of coal seams, the amplitude of the original positive composite wave gradually decreases, and its polarity may even reverse to negative. Before such a polarity reversal occurs, the centre frequency decreases, and the spectrum peak decreases; after the polarity reverses, the instantaneous phase is obviously staggered, and the composite attribute decreases nearly linearly.
For the MCS model of thin layers, such as a thin sandstone layer less than 4 m thick and a thin coal seam with a thickness of less than 2 m that are regularly coupled in a mudstone background, with an increase in the number of coal seams, the seismic amplitude of the complex wave is obviously reduced, and the phases are always obviously staggered. Moreover, the composite attribute decreases monotonically with an increase in the number of coal seams (if the formation contains coal seams, that is).
In the actual subsurface, which is characterized by complex lateral variations, the composite attribute is more sensitive to the coal seam thickness than are other seismic attributes, such as the maximum amplitude. The AVO responses to fluid substitution in both actual and synthetic seismic data confirm that the AVO characteristics and trends of seismic records without coal seams are more in line with the theoretical (predicted) values; hence, this work lays an important foundation for the fine characterization of coal seams and the accurate removal of their effects on sandstone reflections. In future work, based on the seismic responses of coal-bearing reservoirs summarized in this study, these multi-attribute characteristics and AVO characteristics can be accurately applied to distinguish the influences of coal seams on sandstone reservoirs. In addition, multiple thin coal seams form strong vertical transverse isotropy (VTI) characteristics; hence, considering the anisotropy and anisotropic attenuation characteristics of coal-bearing reservoirs with azimuths will be a major research direction in the future.


