
Research on Leaching of V and Ni in Spent FCC Catalyst Using Oxalic Acid/H2O2 under Microwave-Assisted Conditions

Abstract
:1. Introduction
2. Materials and Methods
2.1. Materials
2.2. Methods
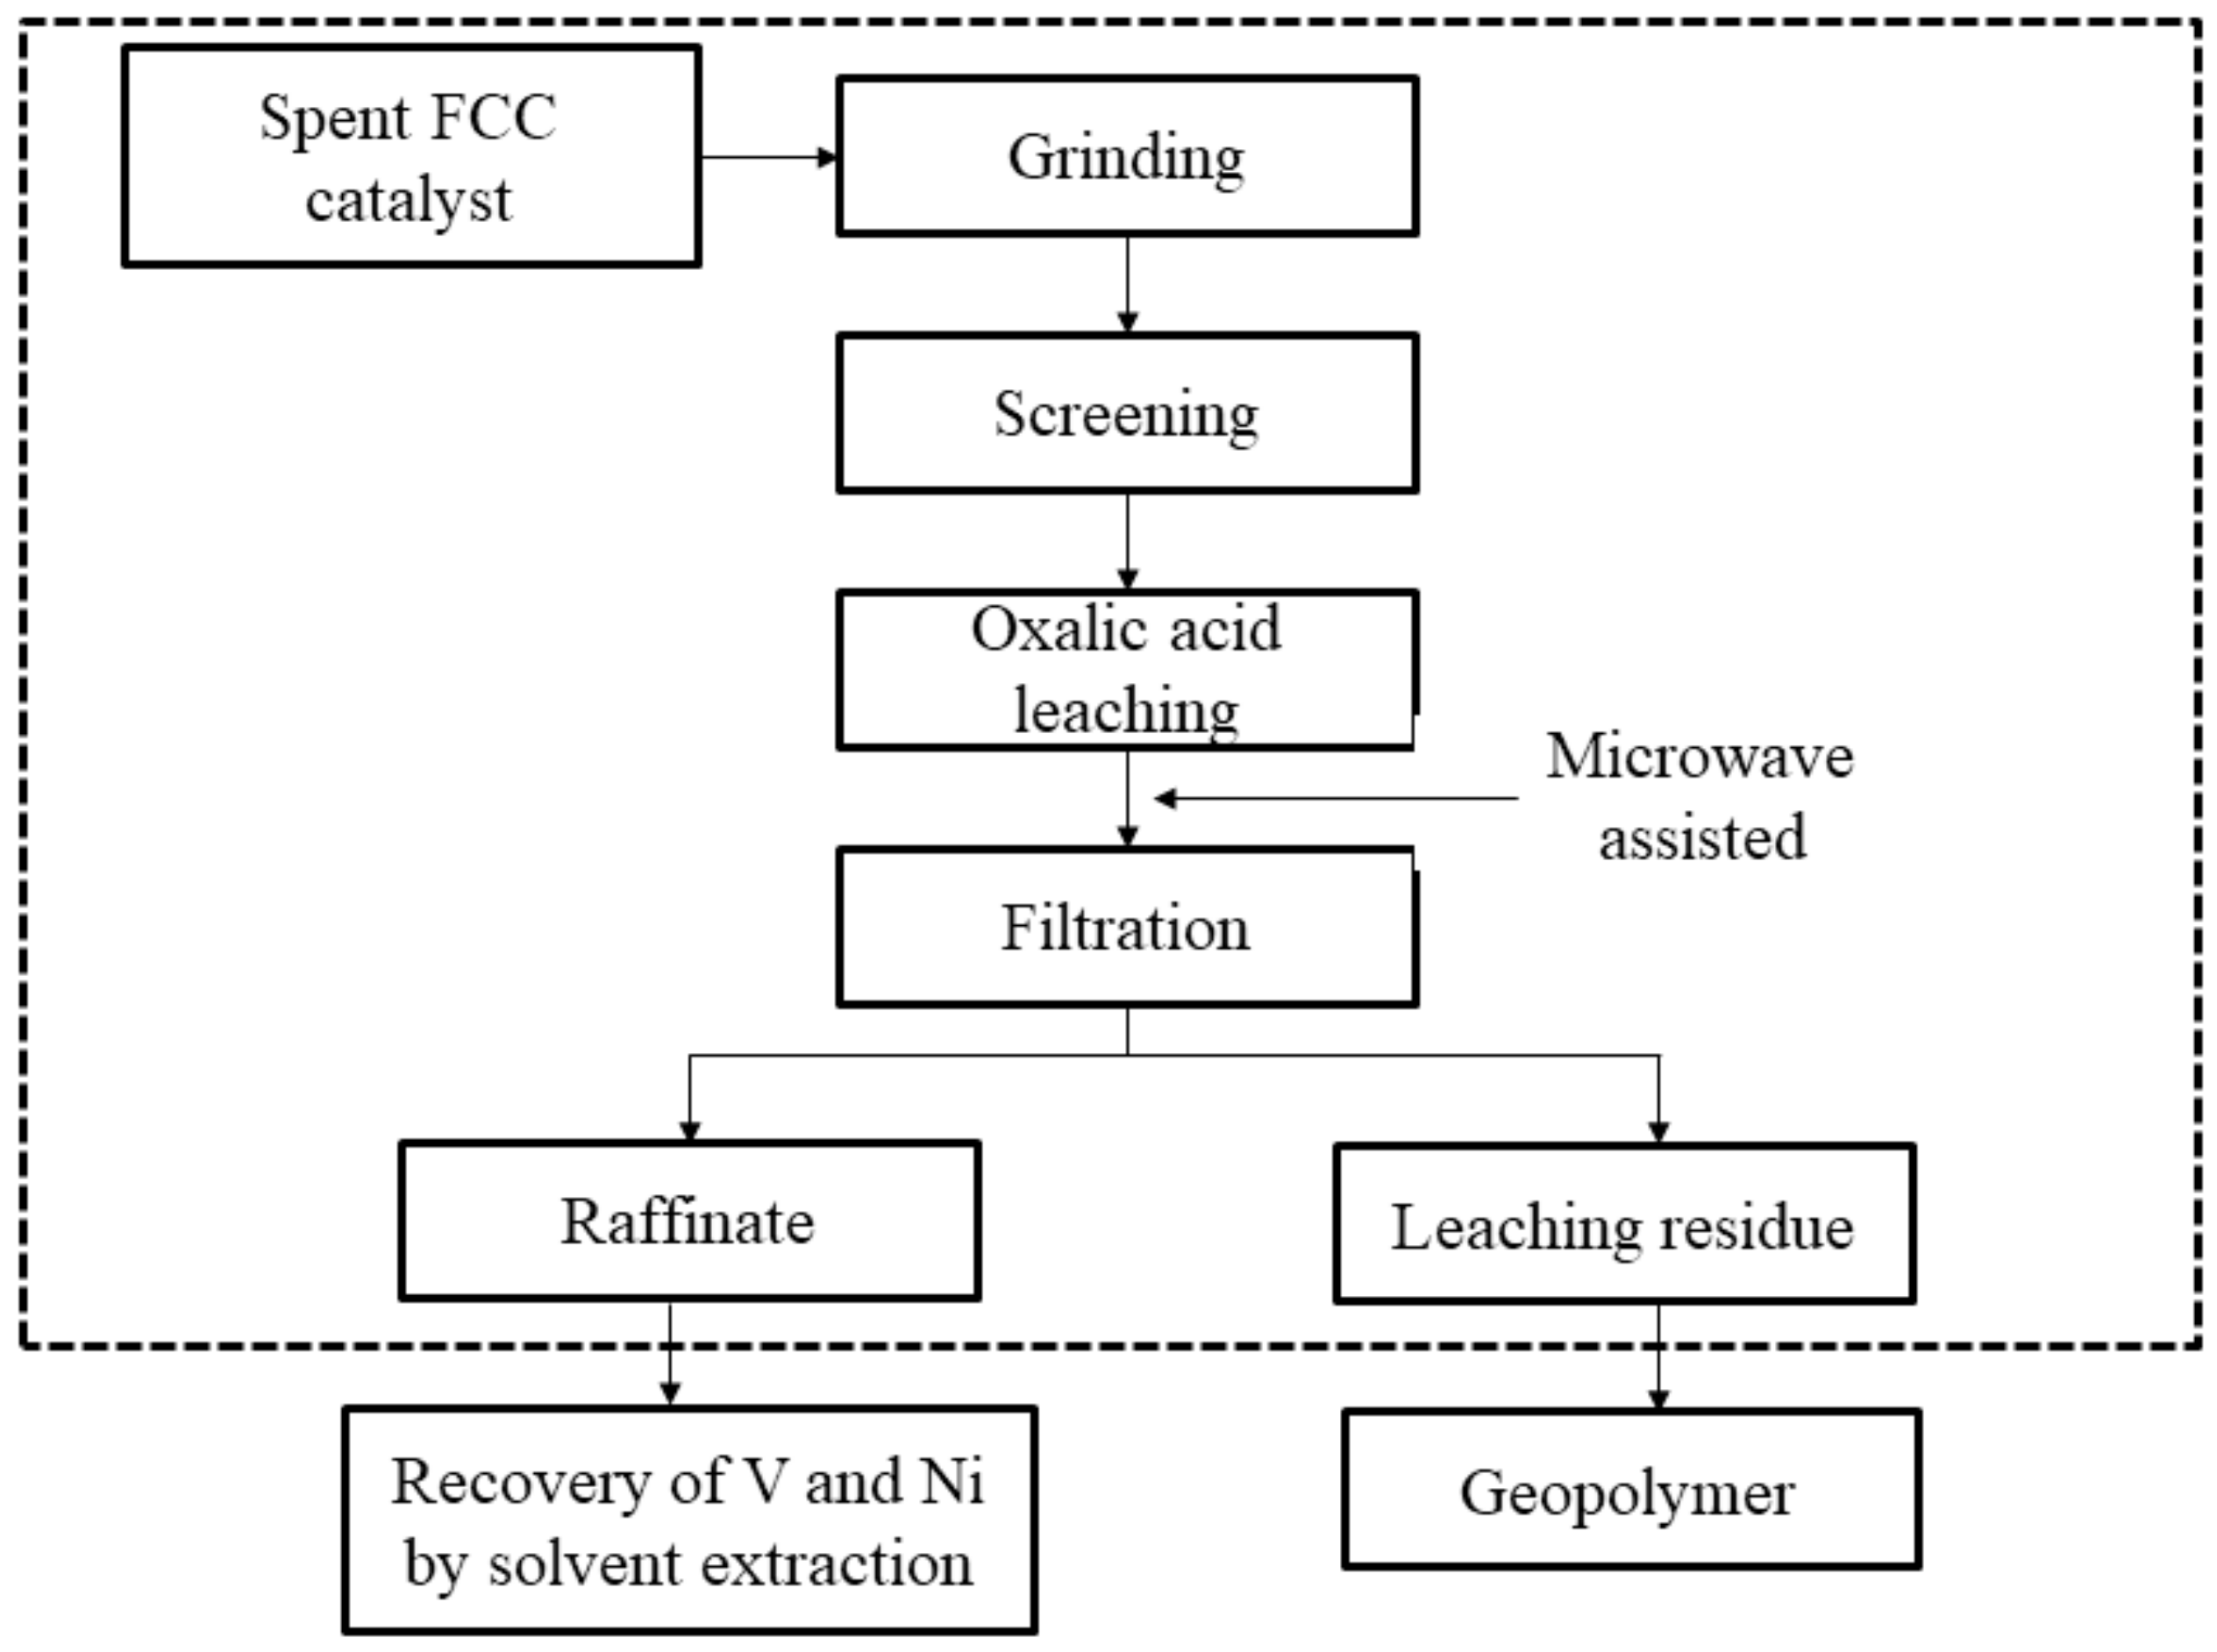
2.2.1. Preparation of the Catalyst
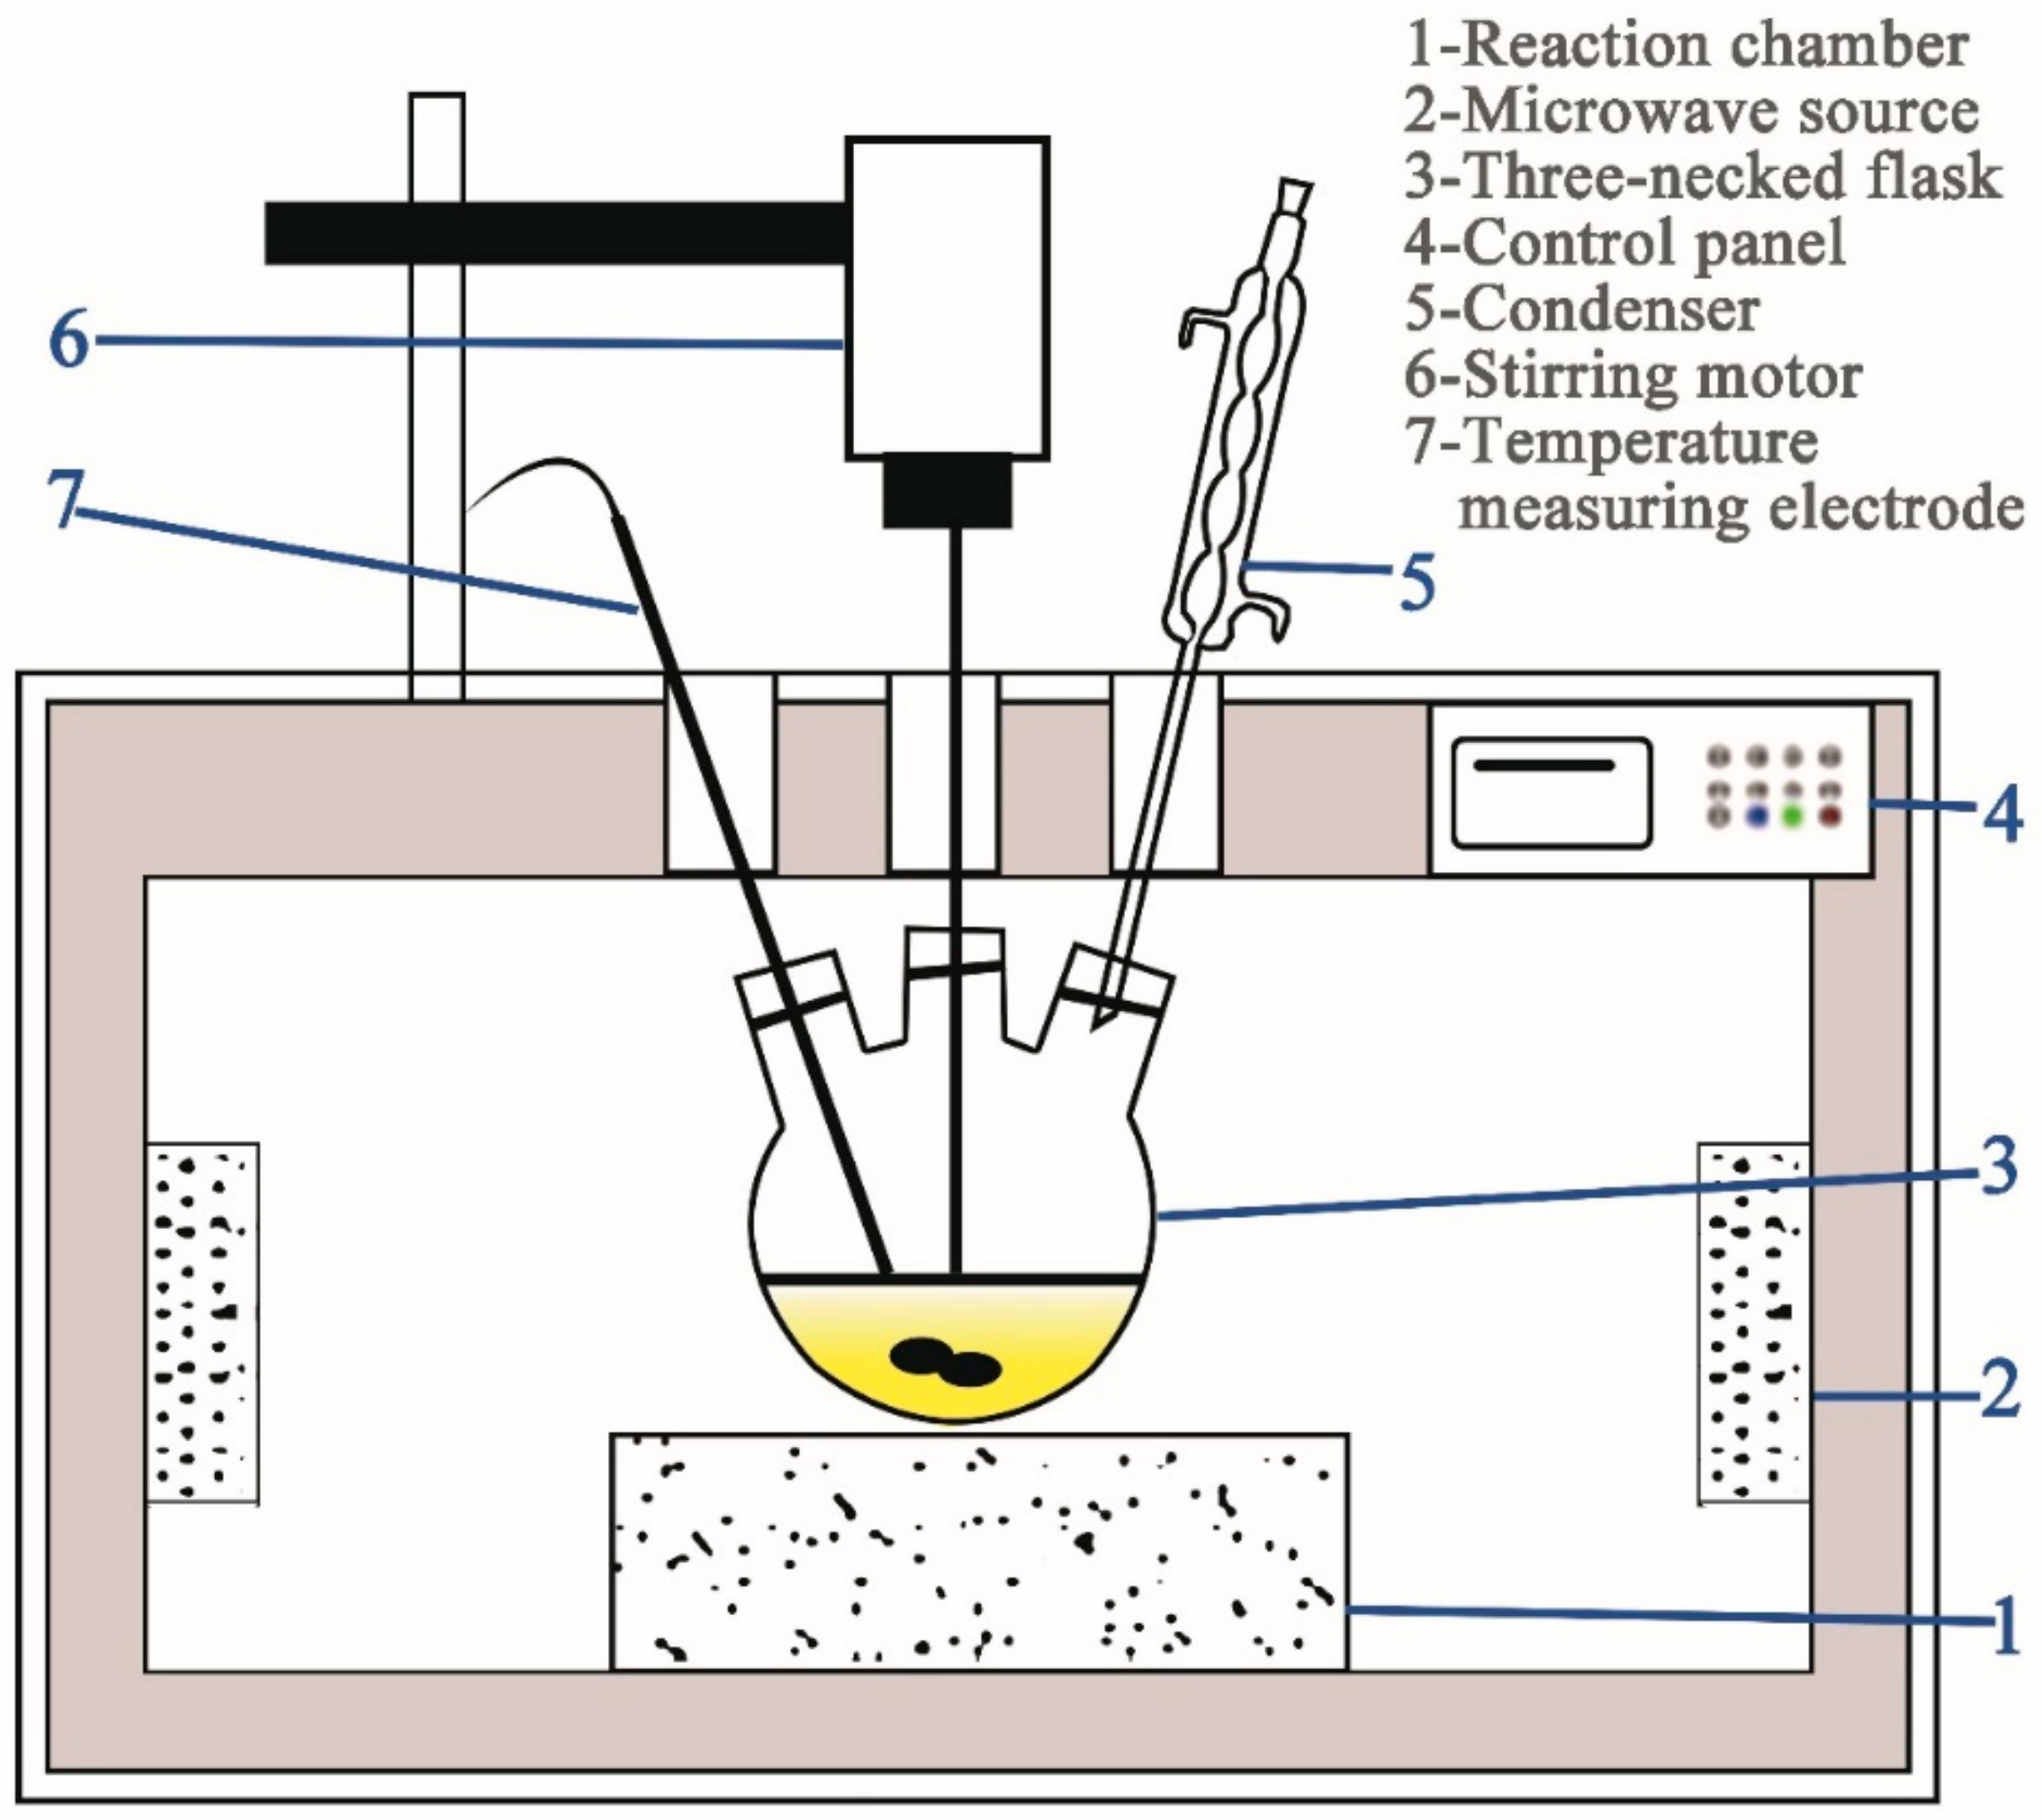
2.2.2. Method for Leaching Tests
2.3. Characterization Techniques
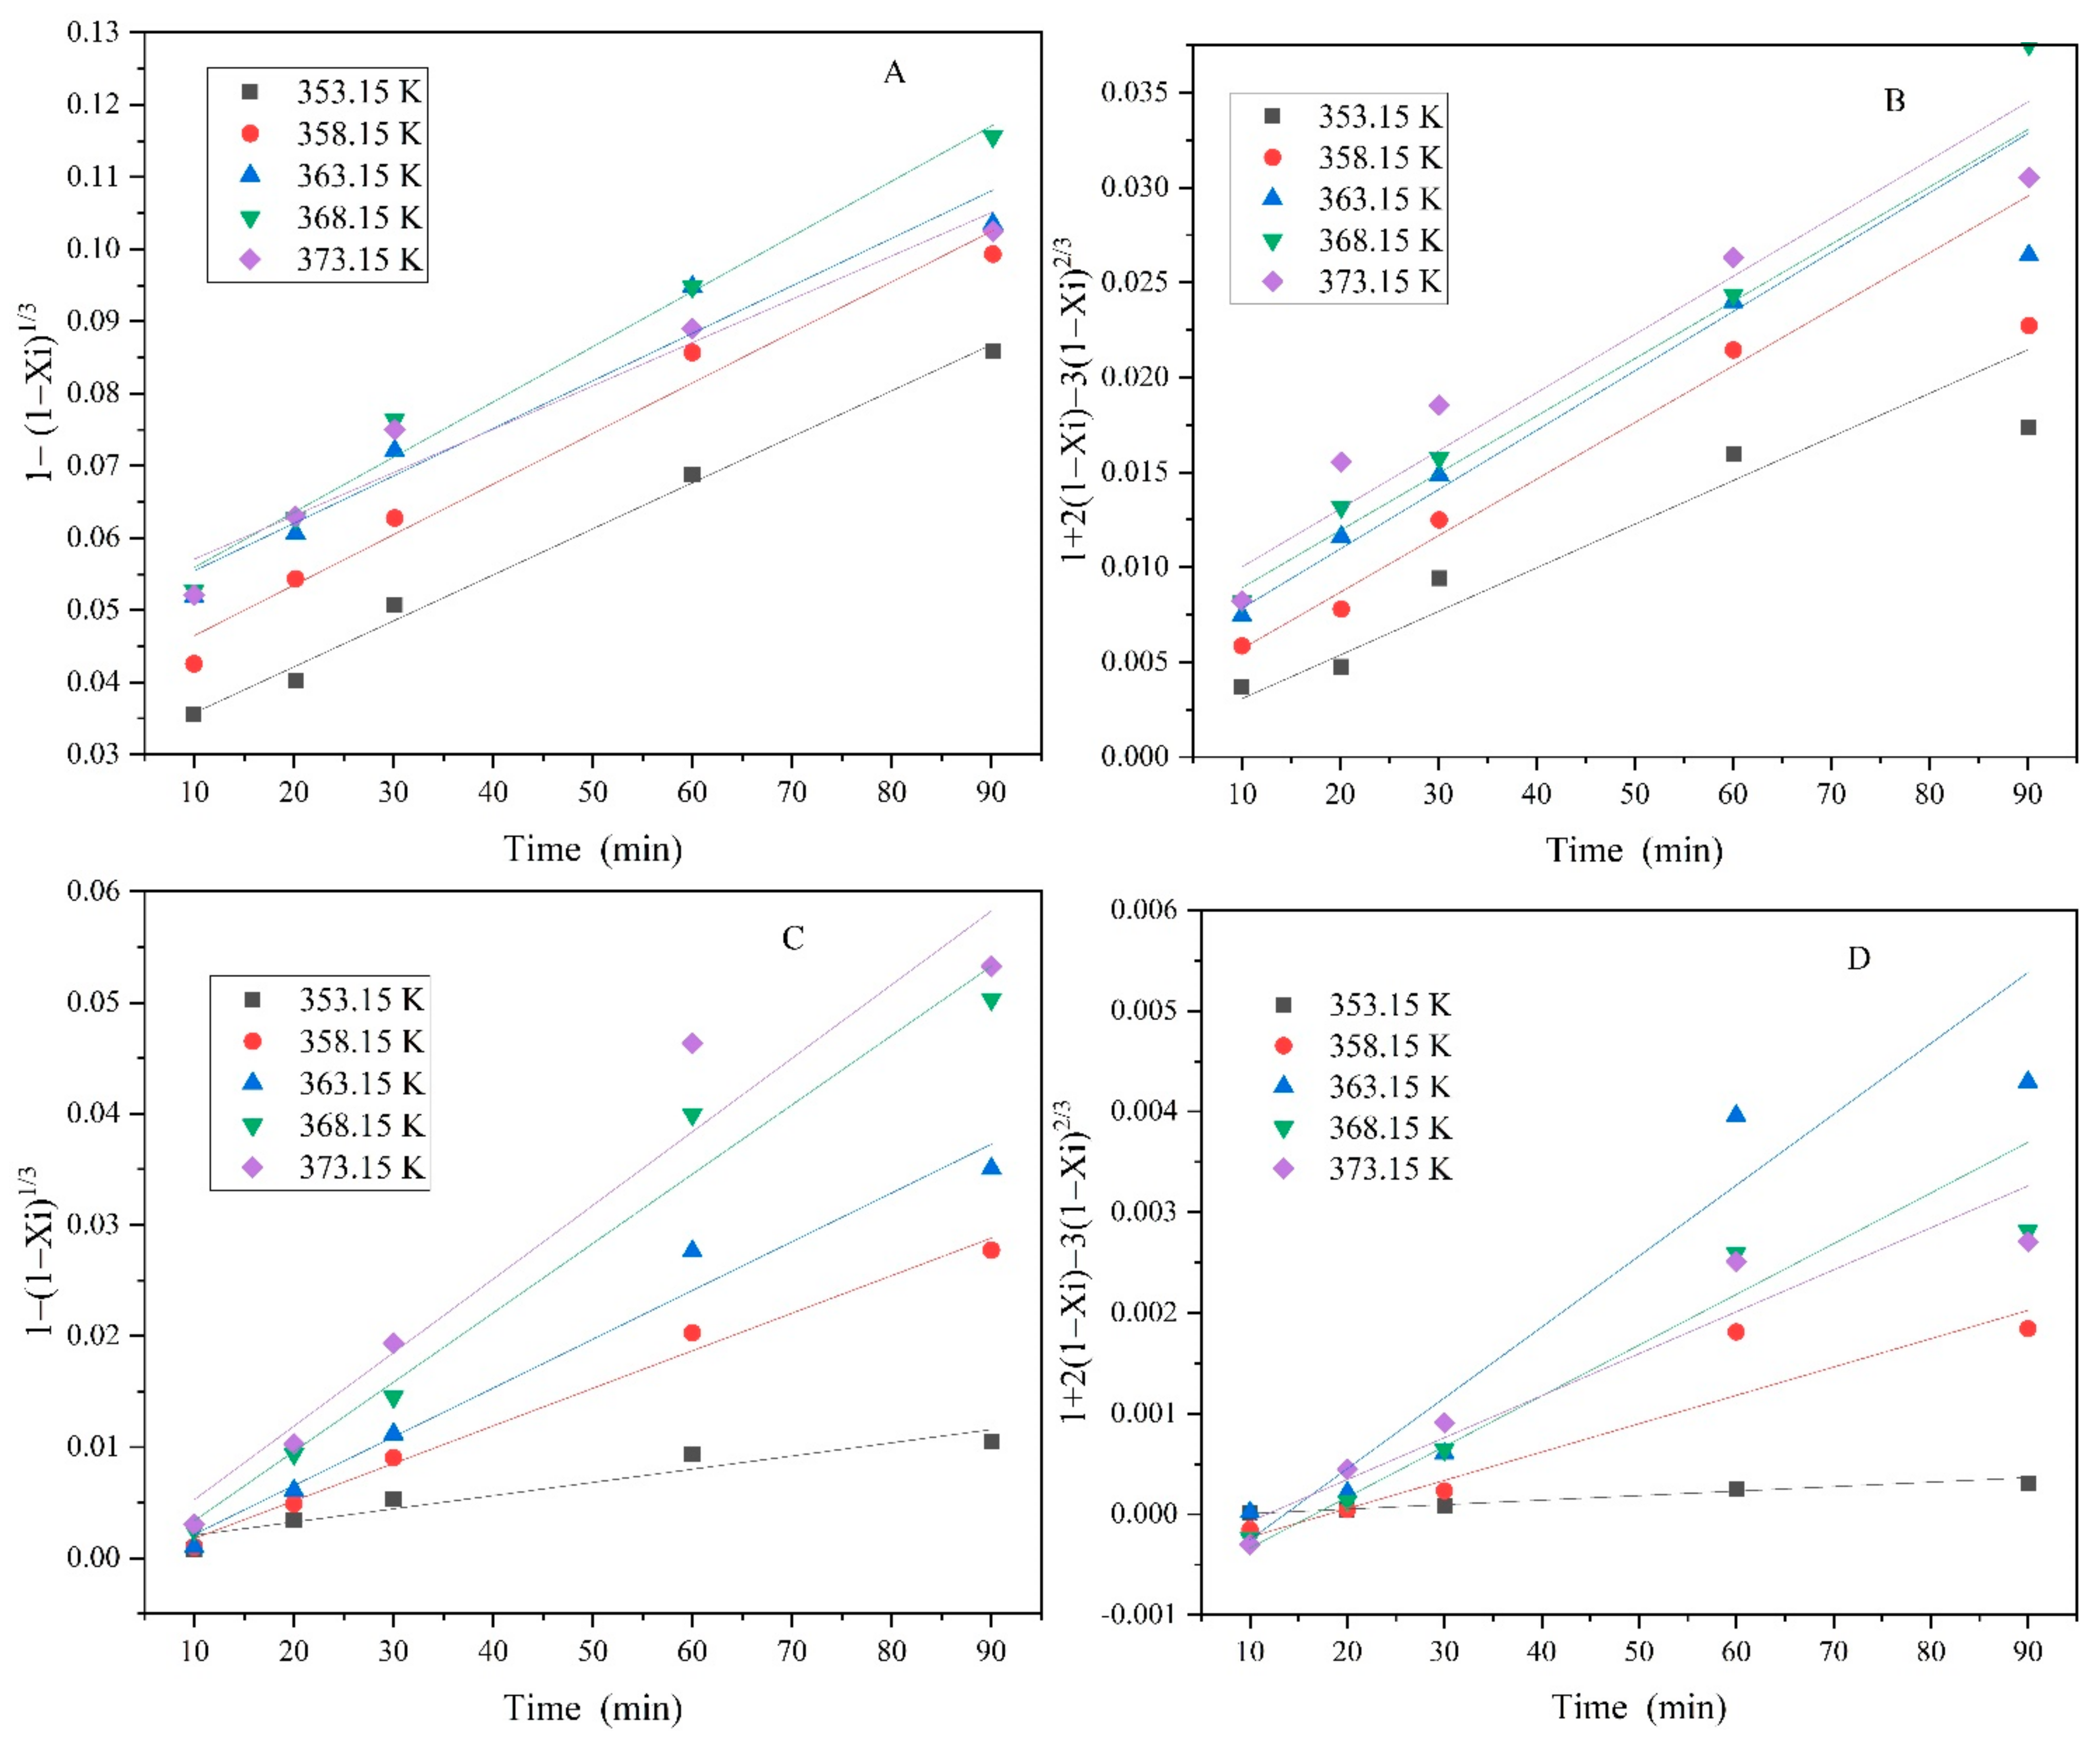
2.4. Mechanism of Kinetic Model Determination
- (1)
- Surface chemical reaction control model:
- (2)
- Diffusion controls model:
2.5. Experimental Design
3. Results
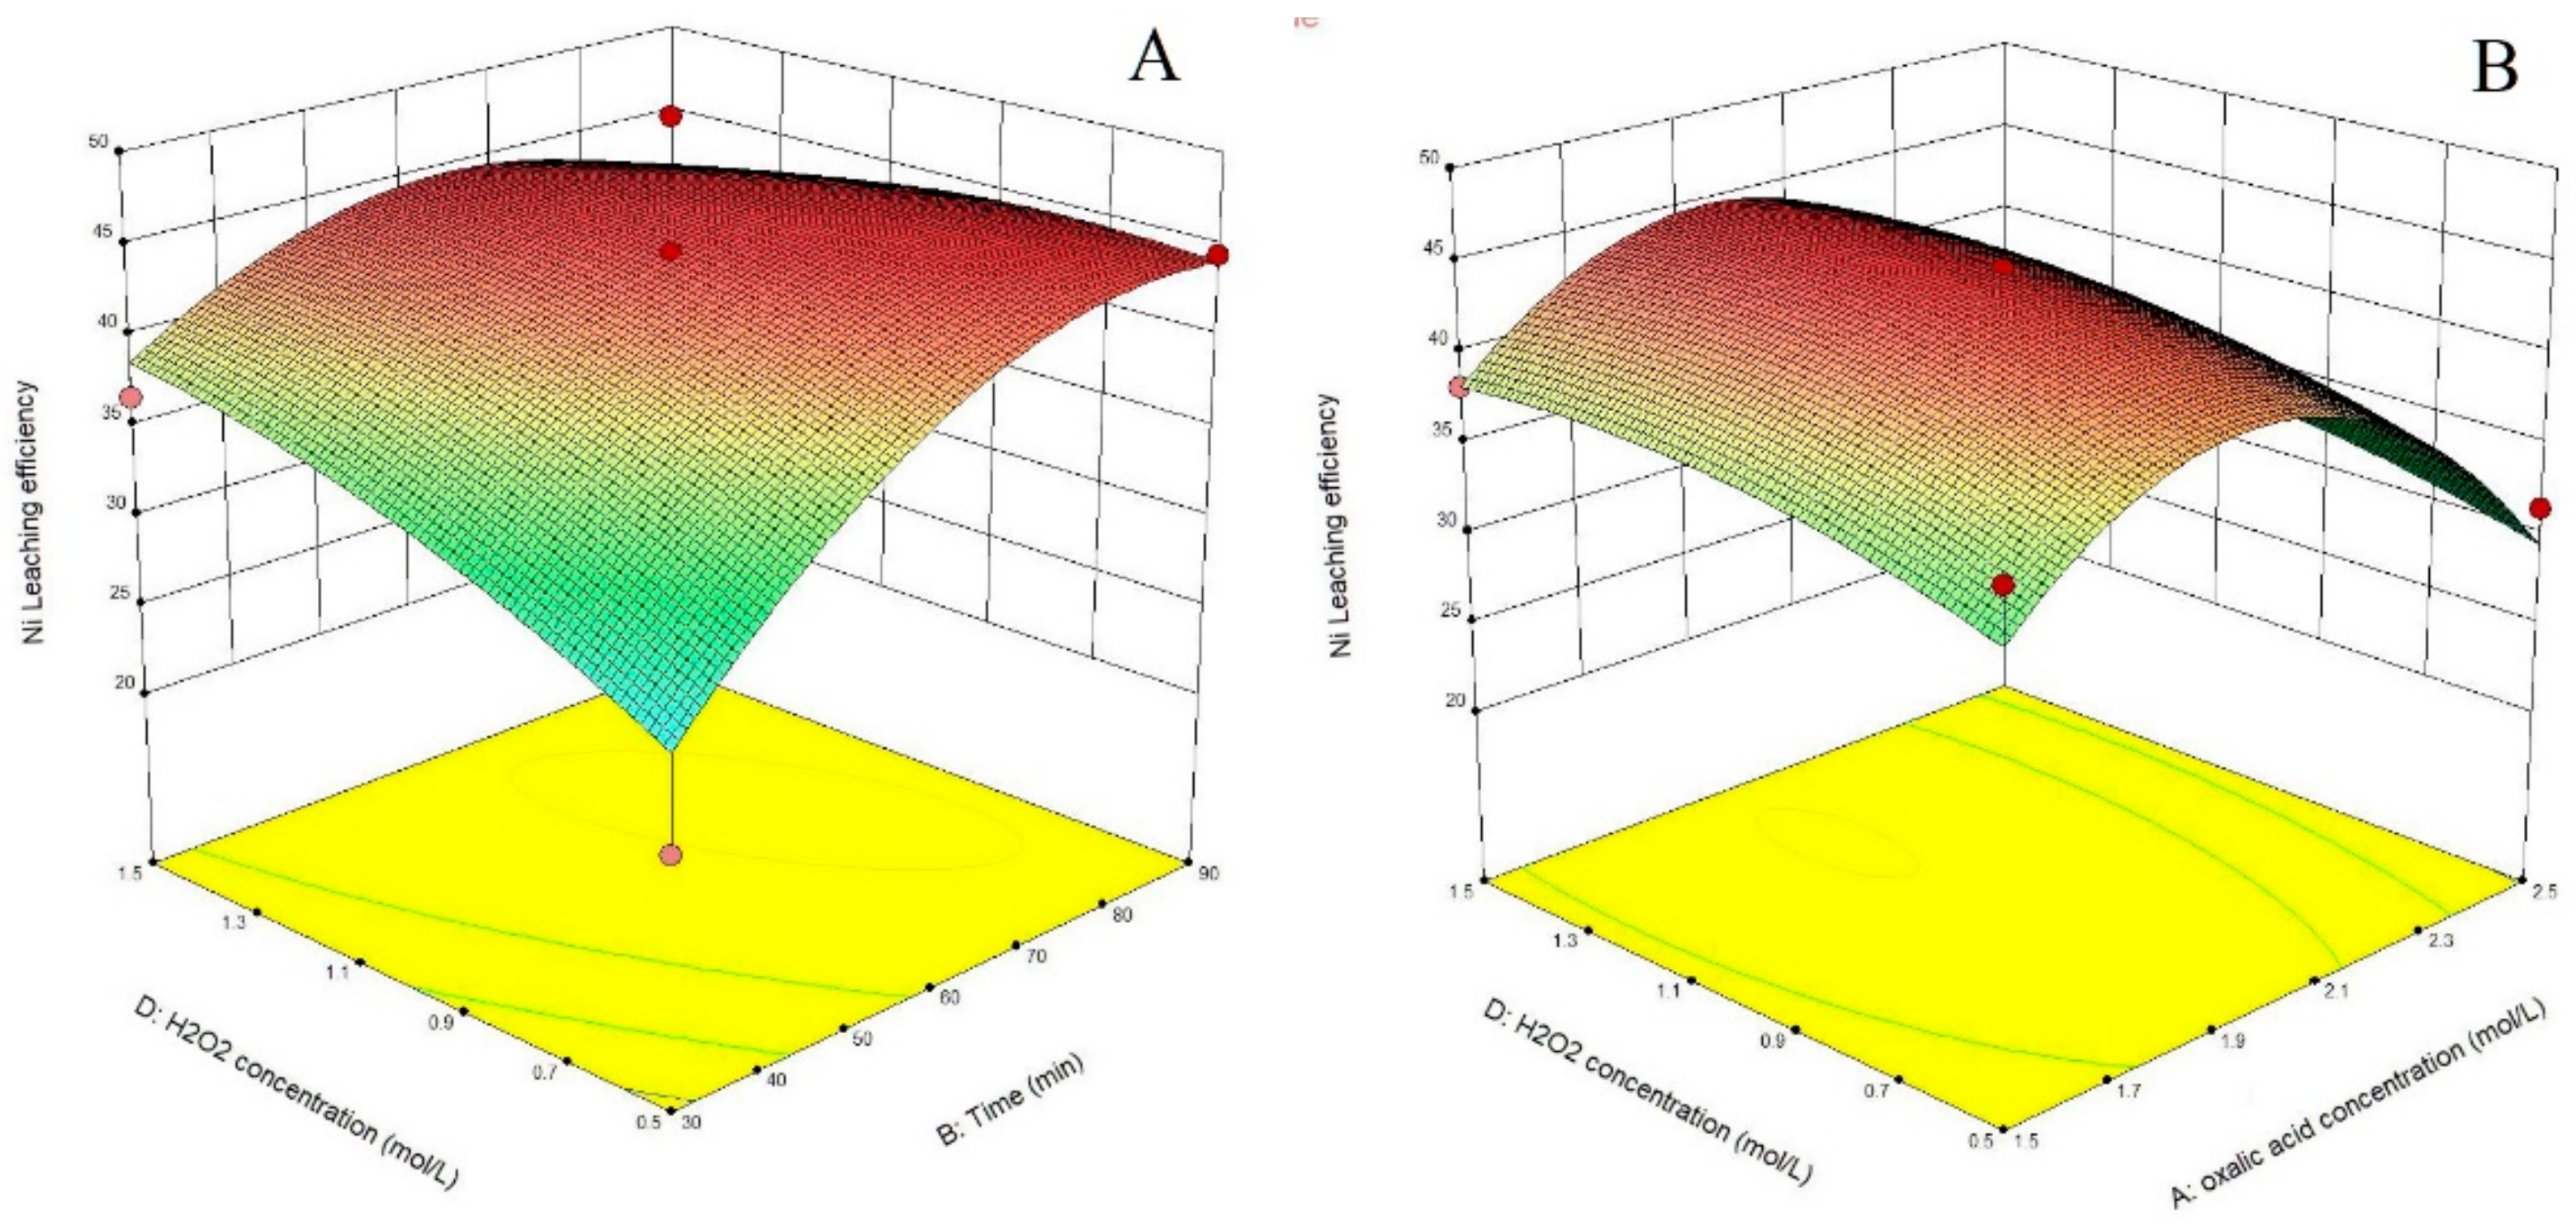
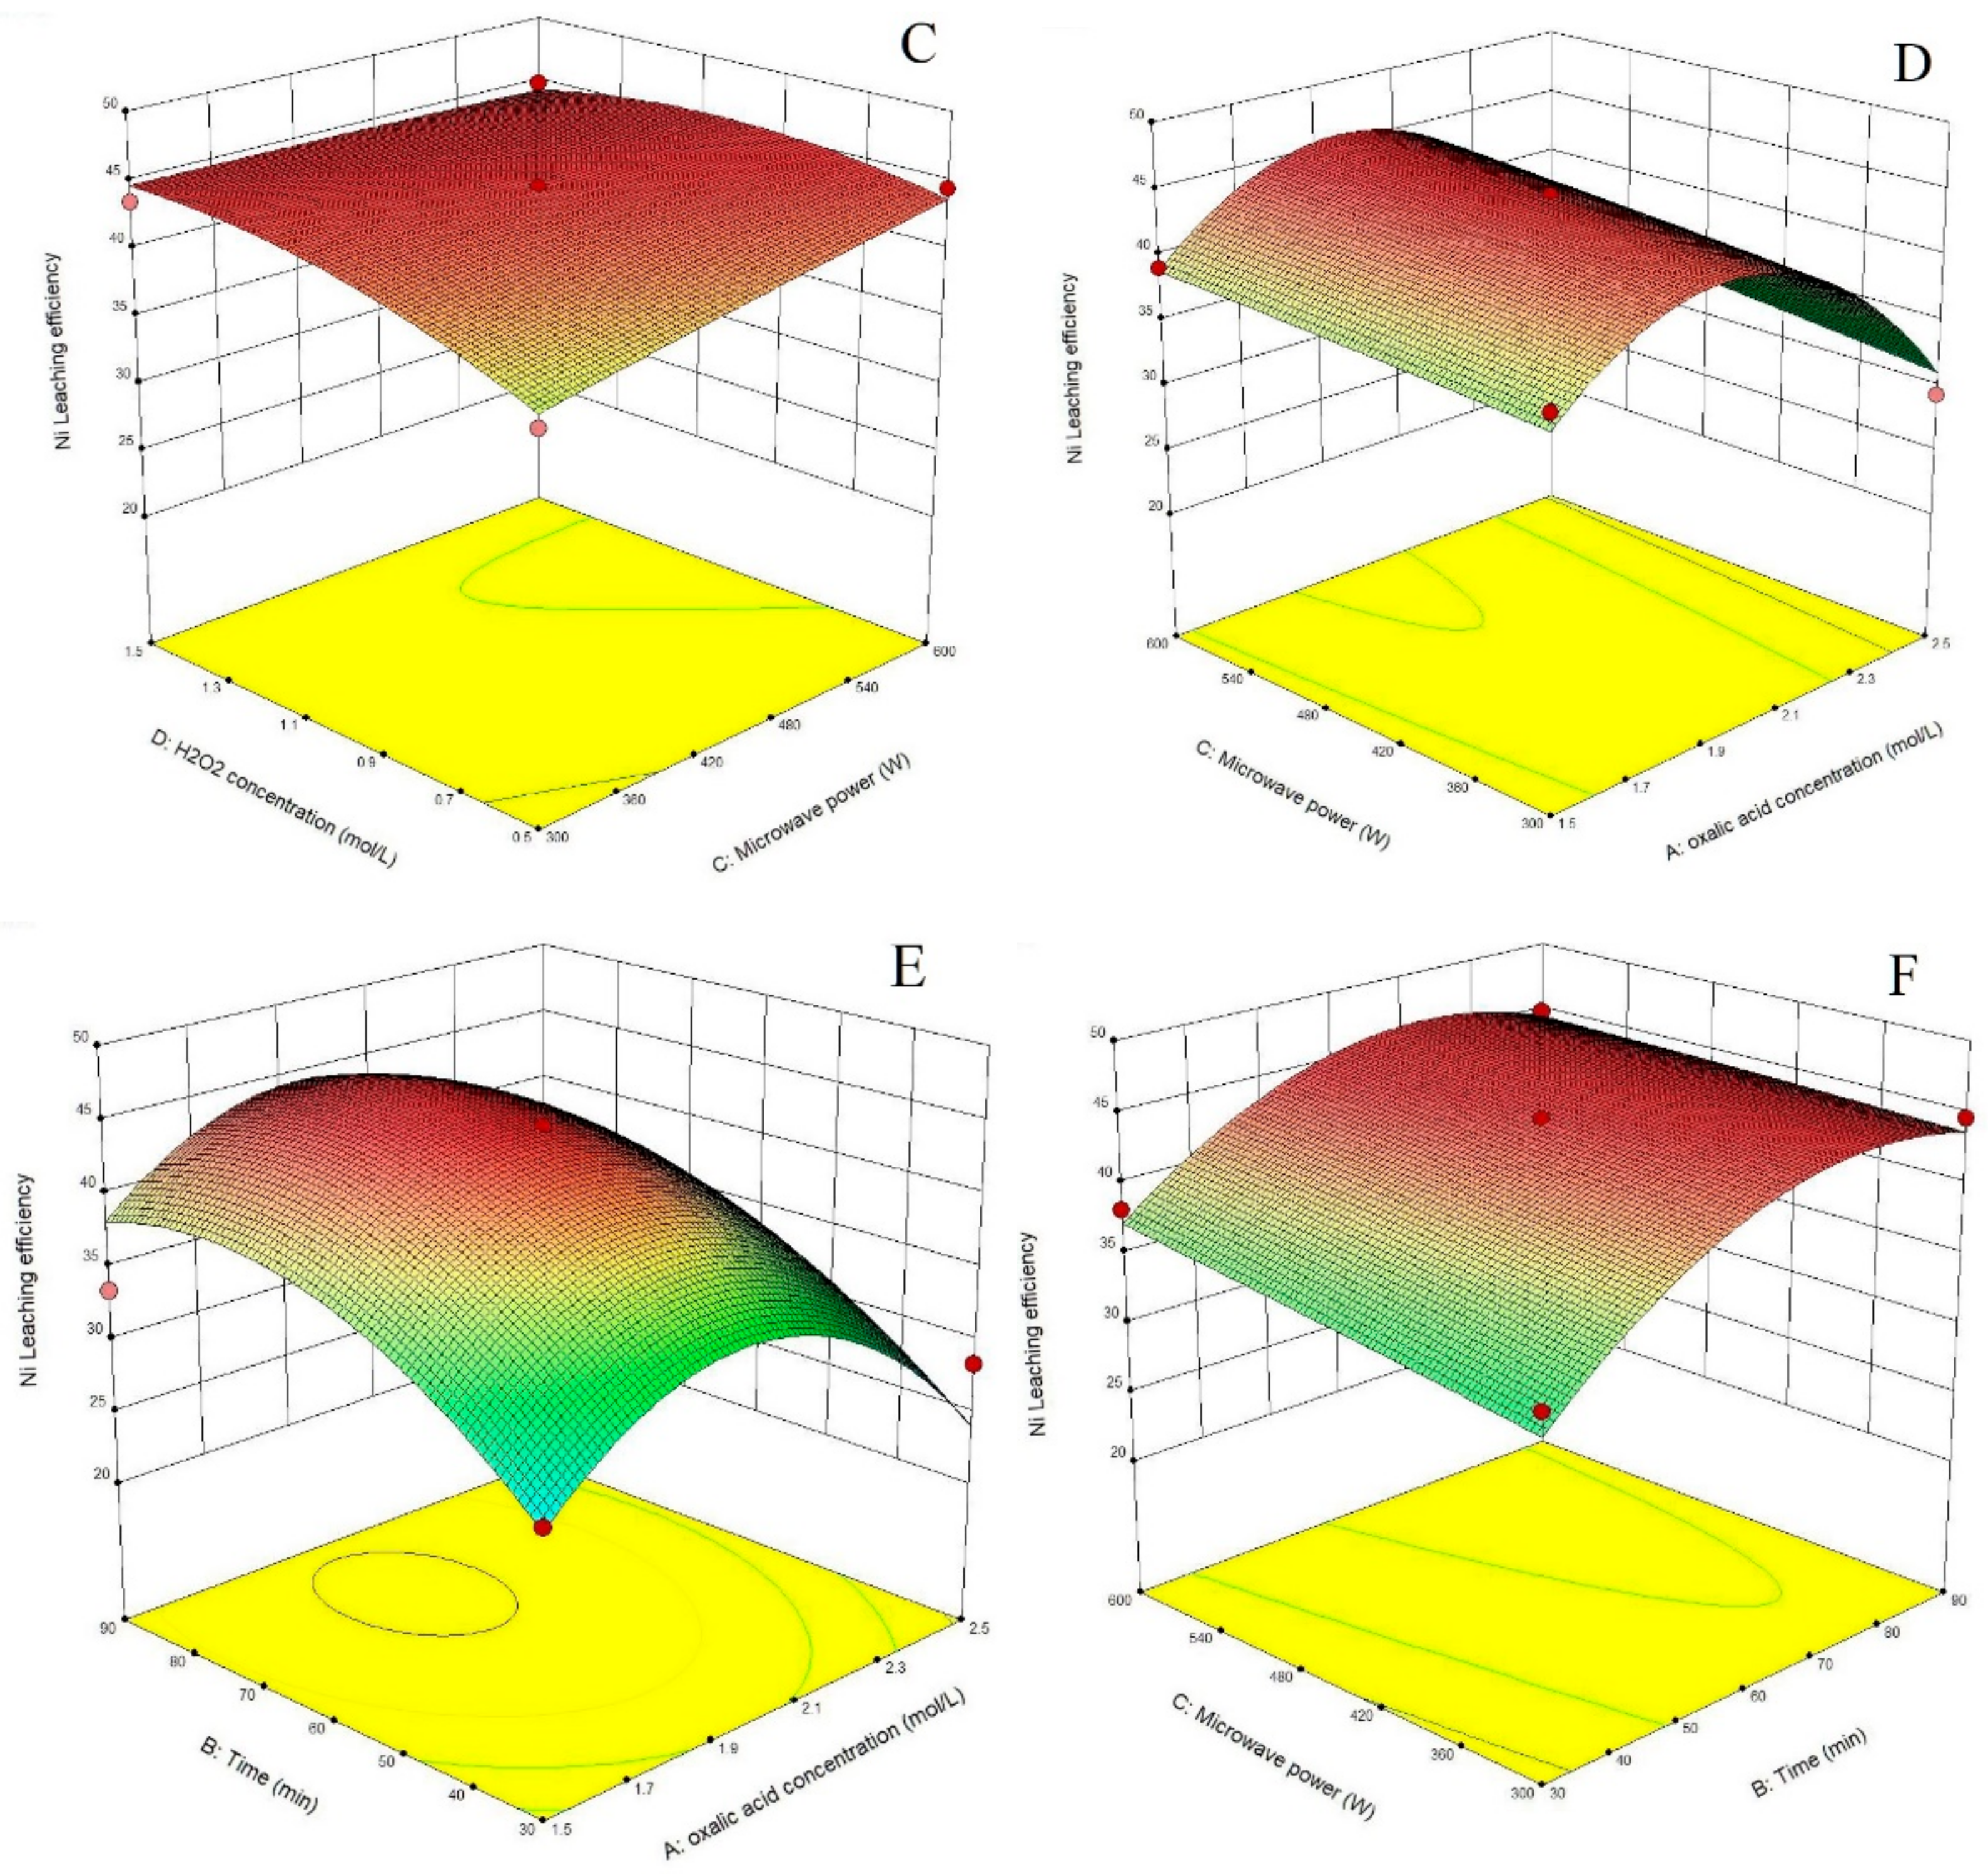
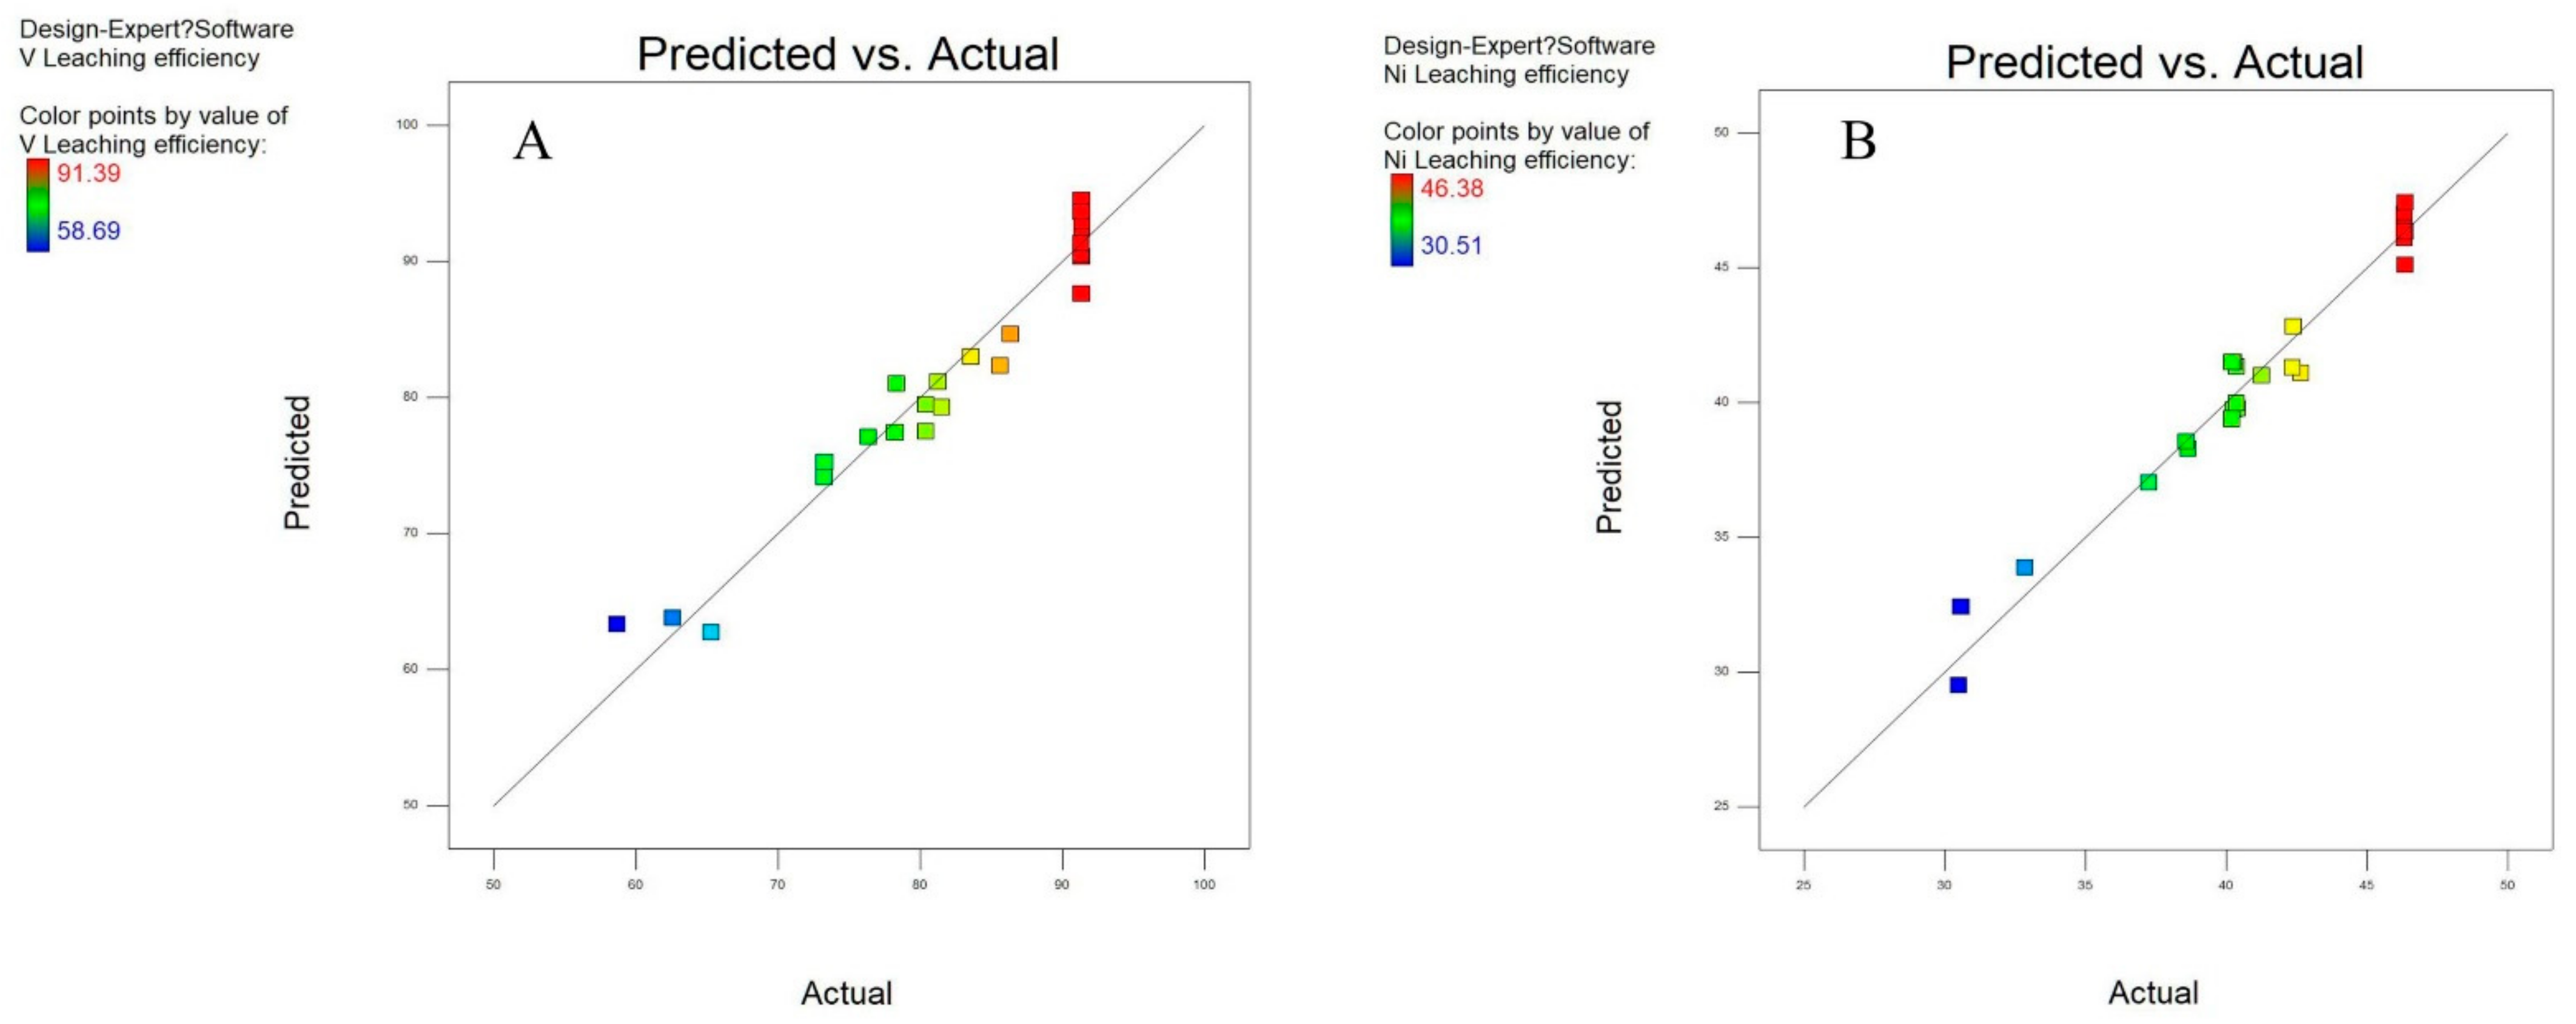
3.1. Statistical Analysis and Model Fitting
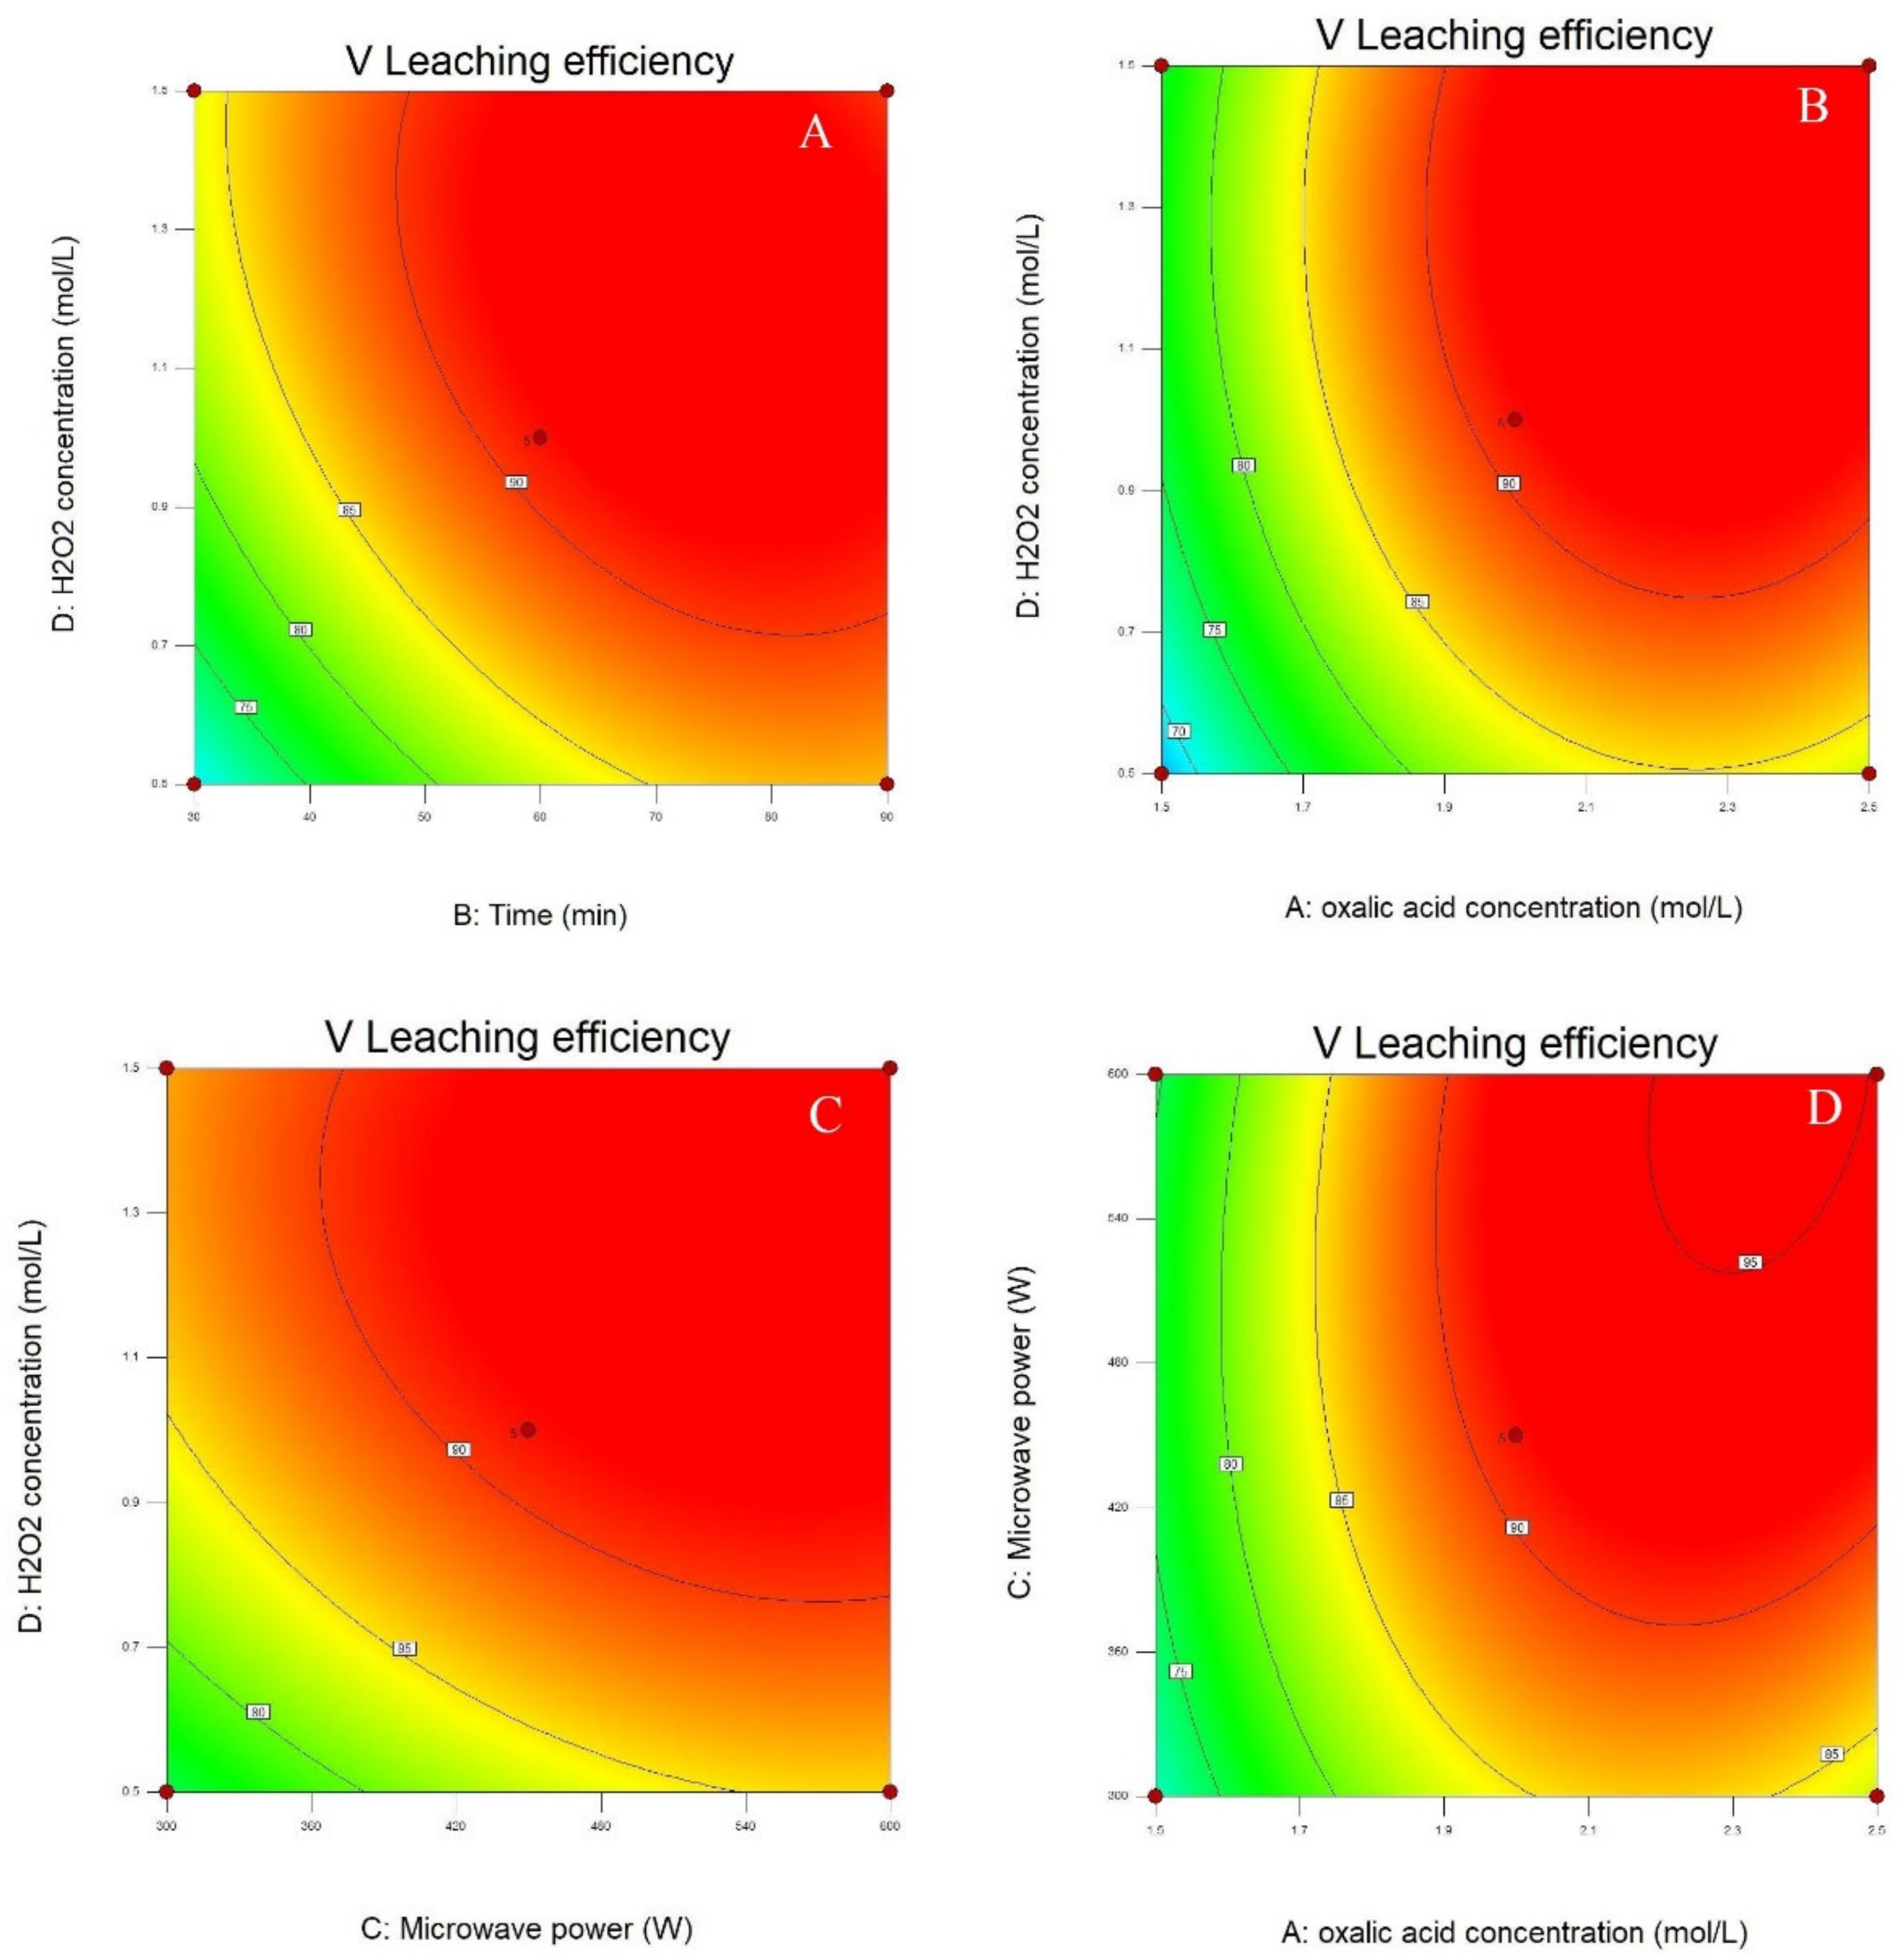
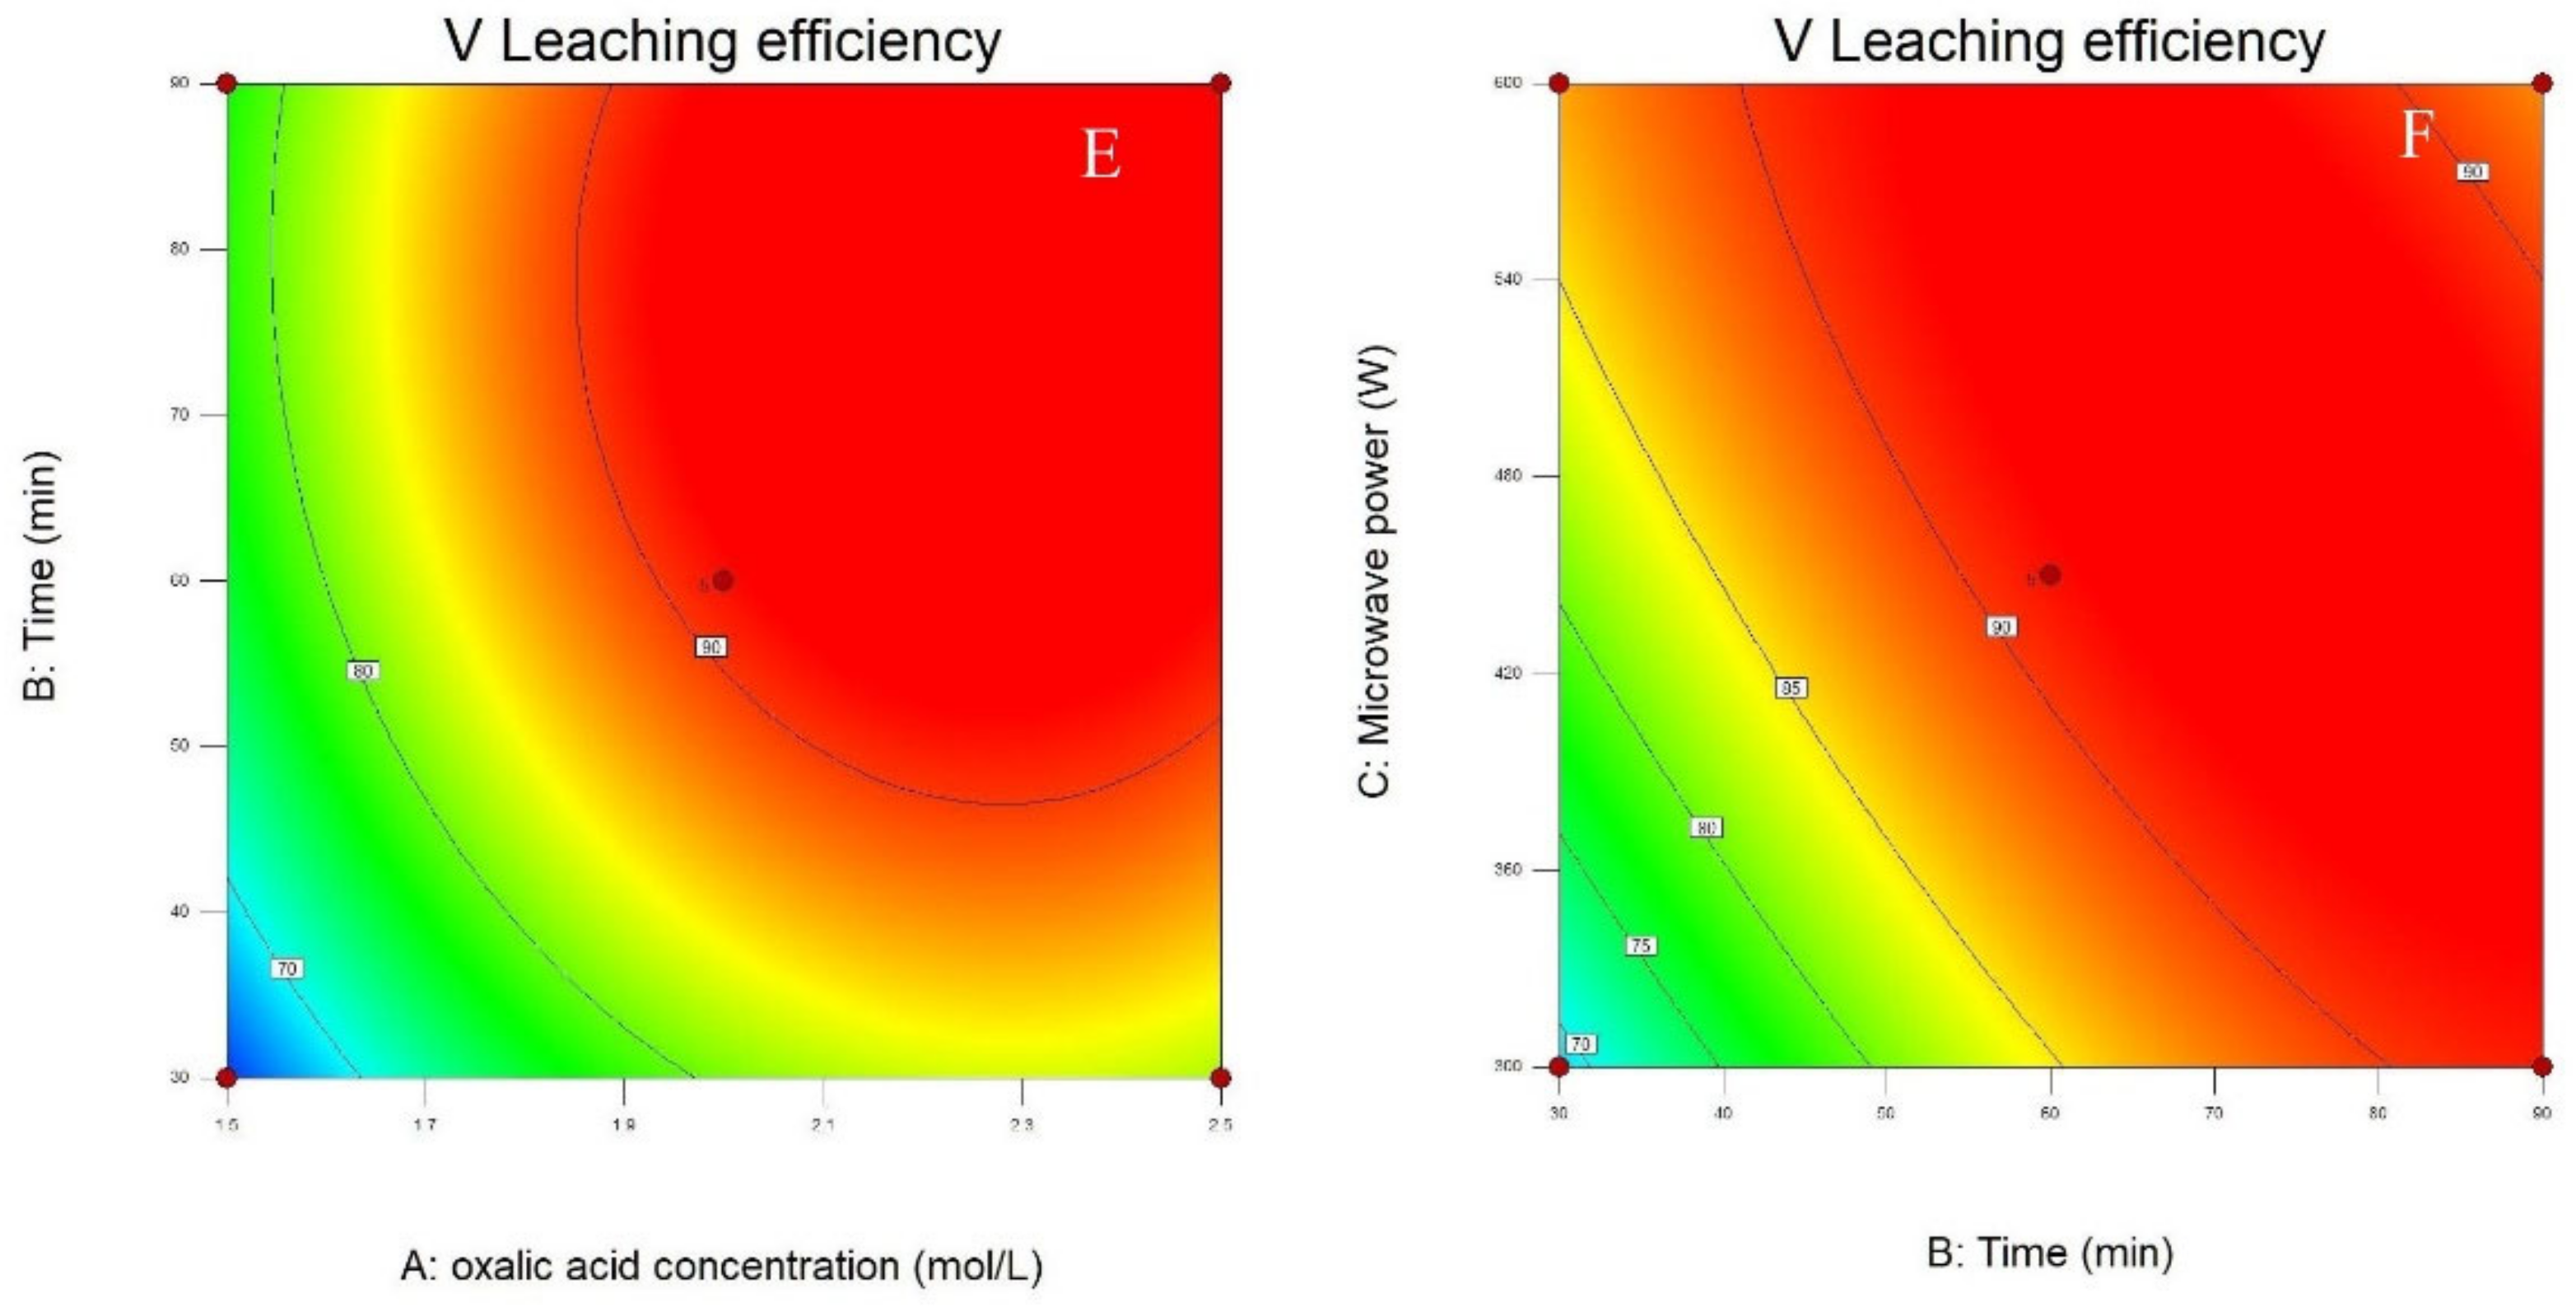
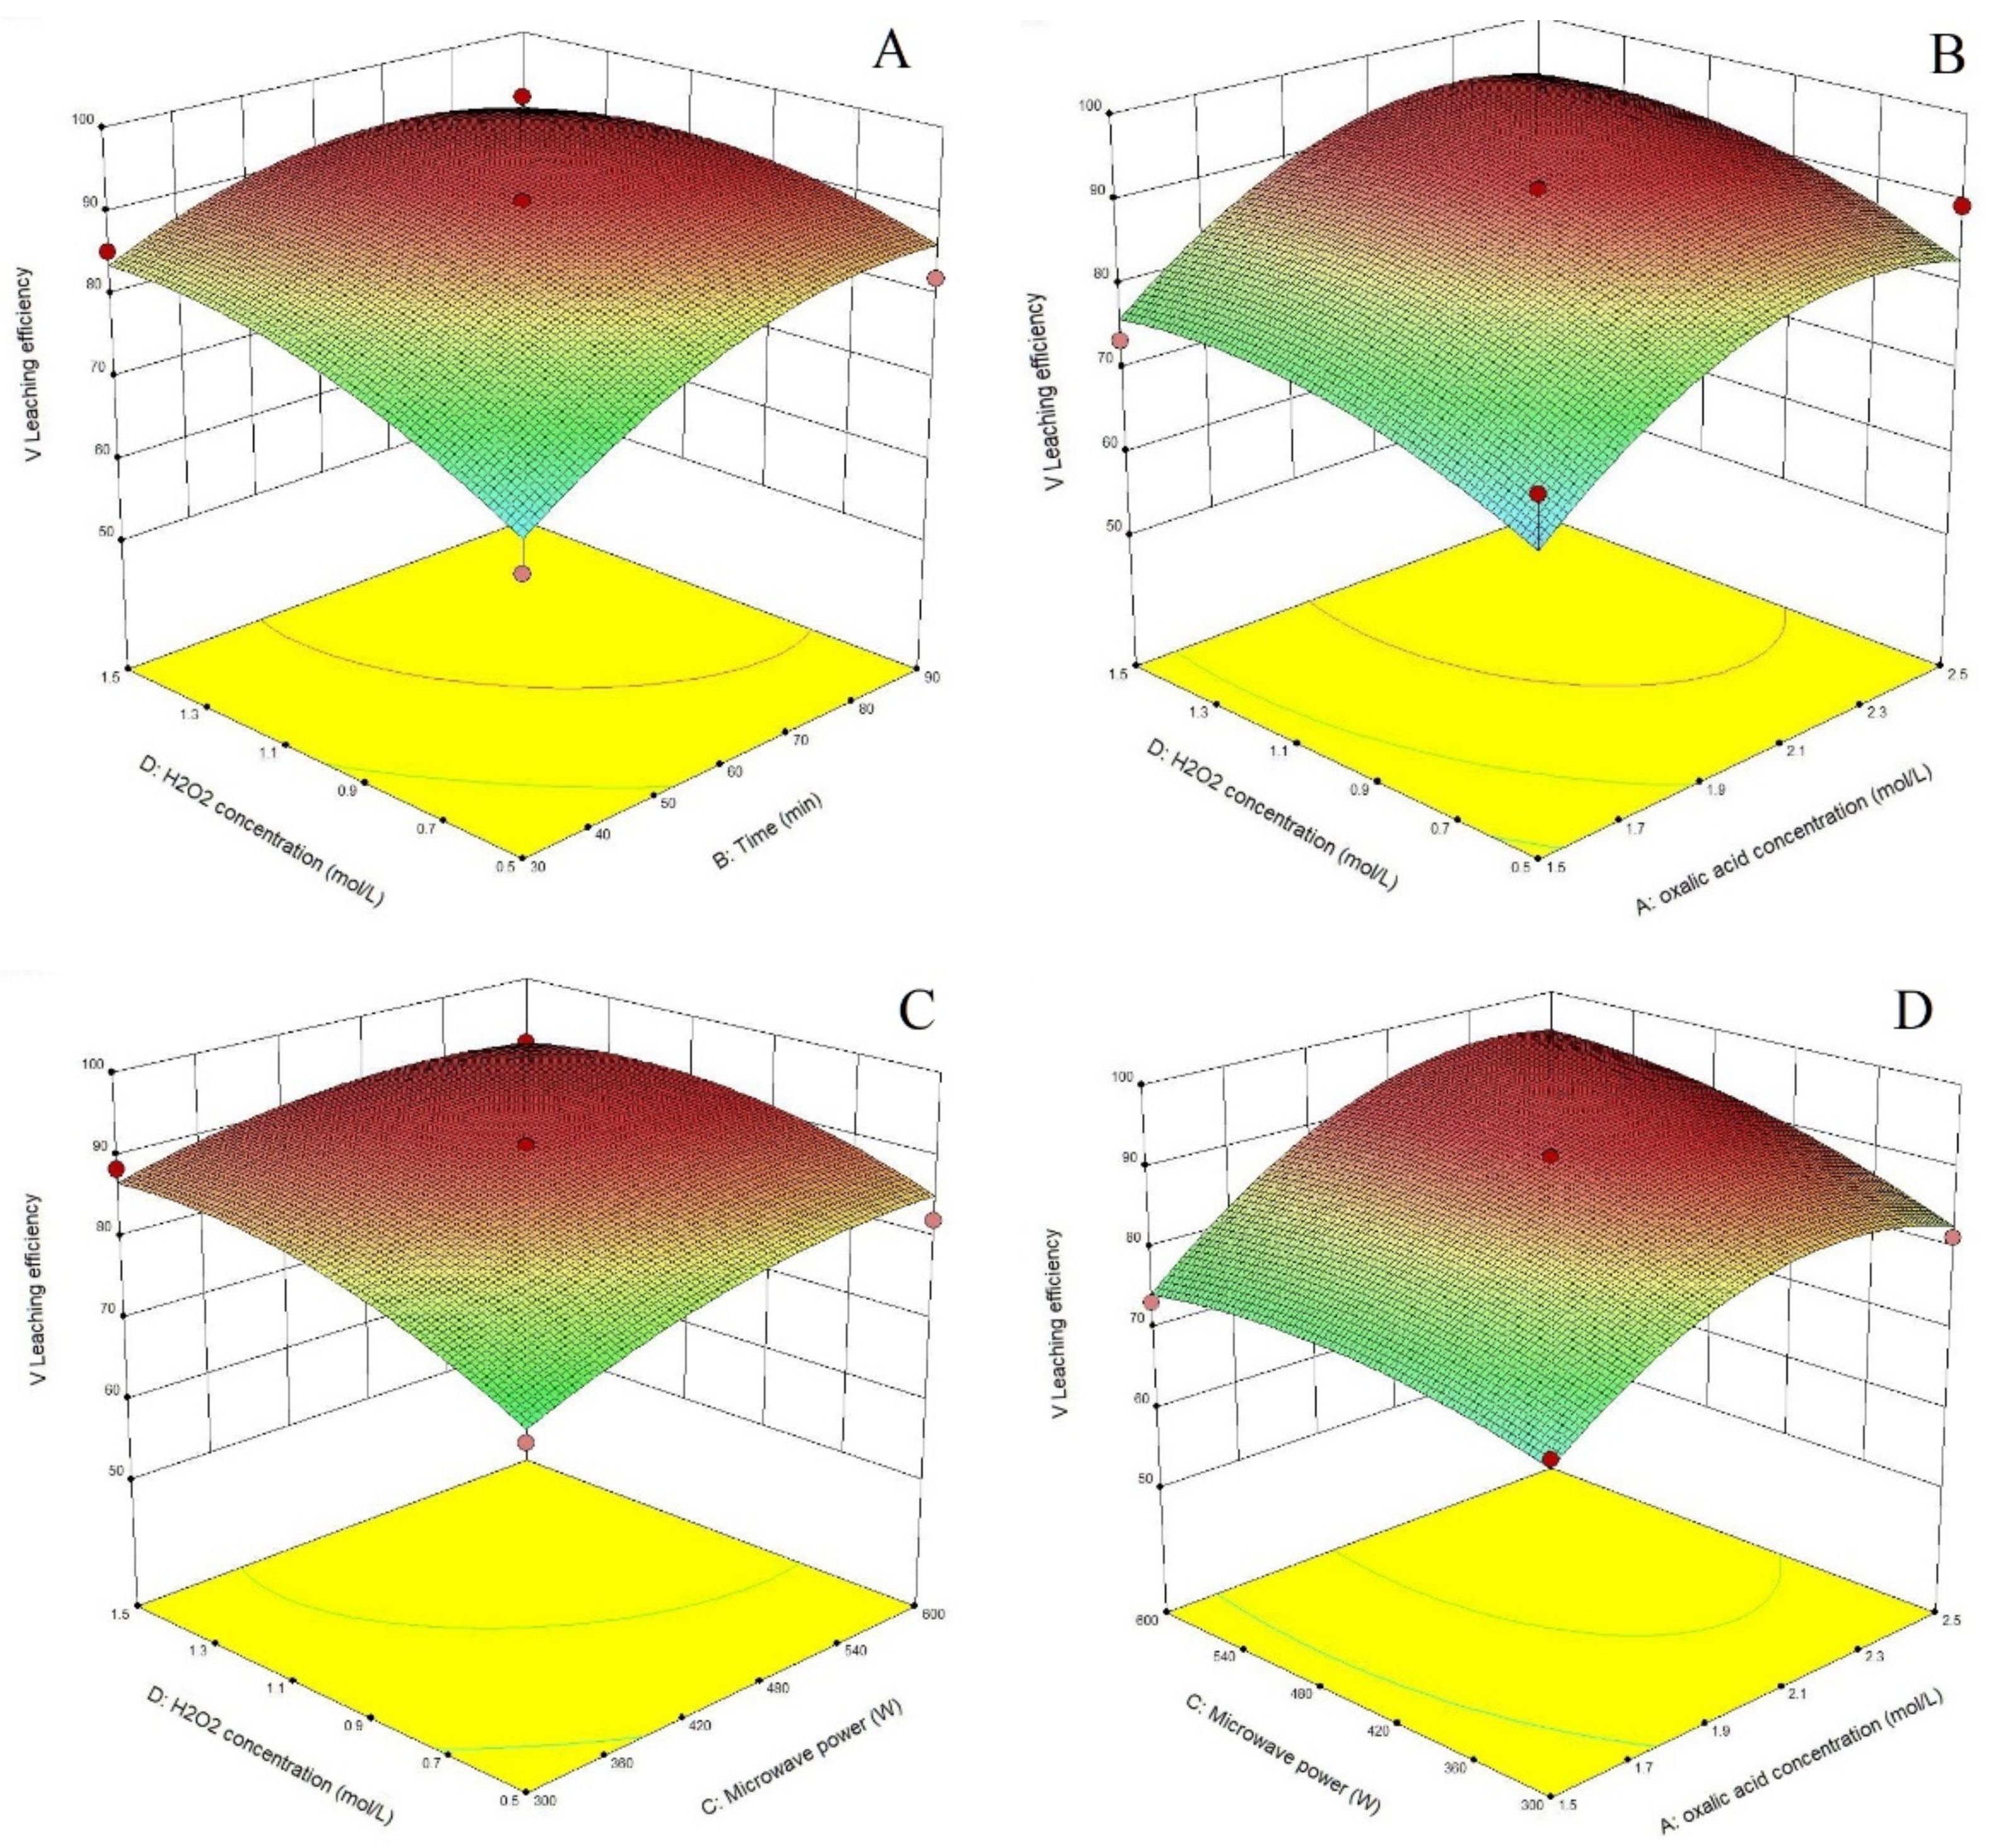
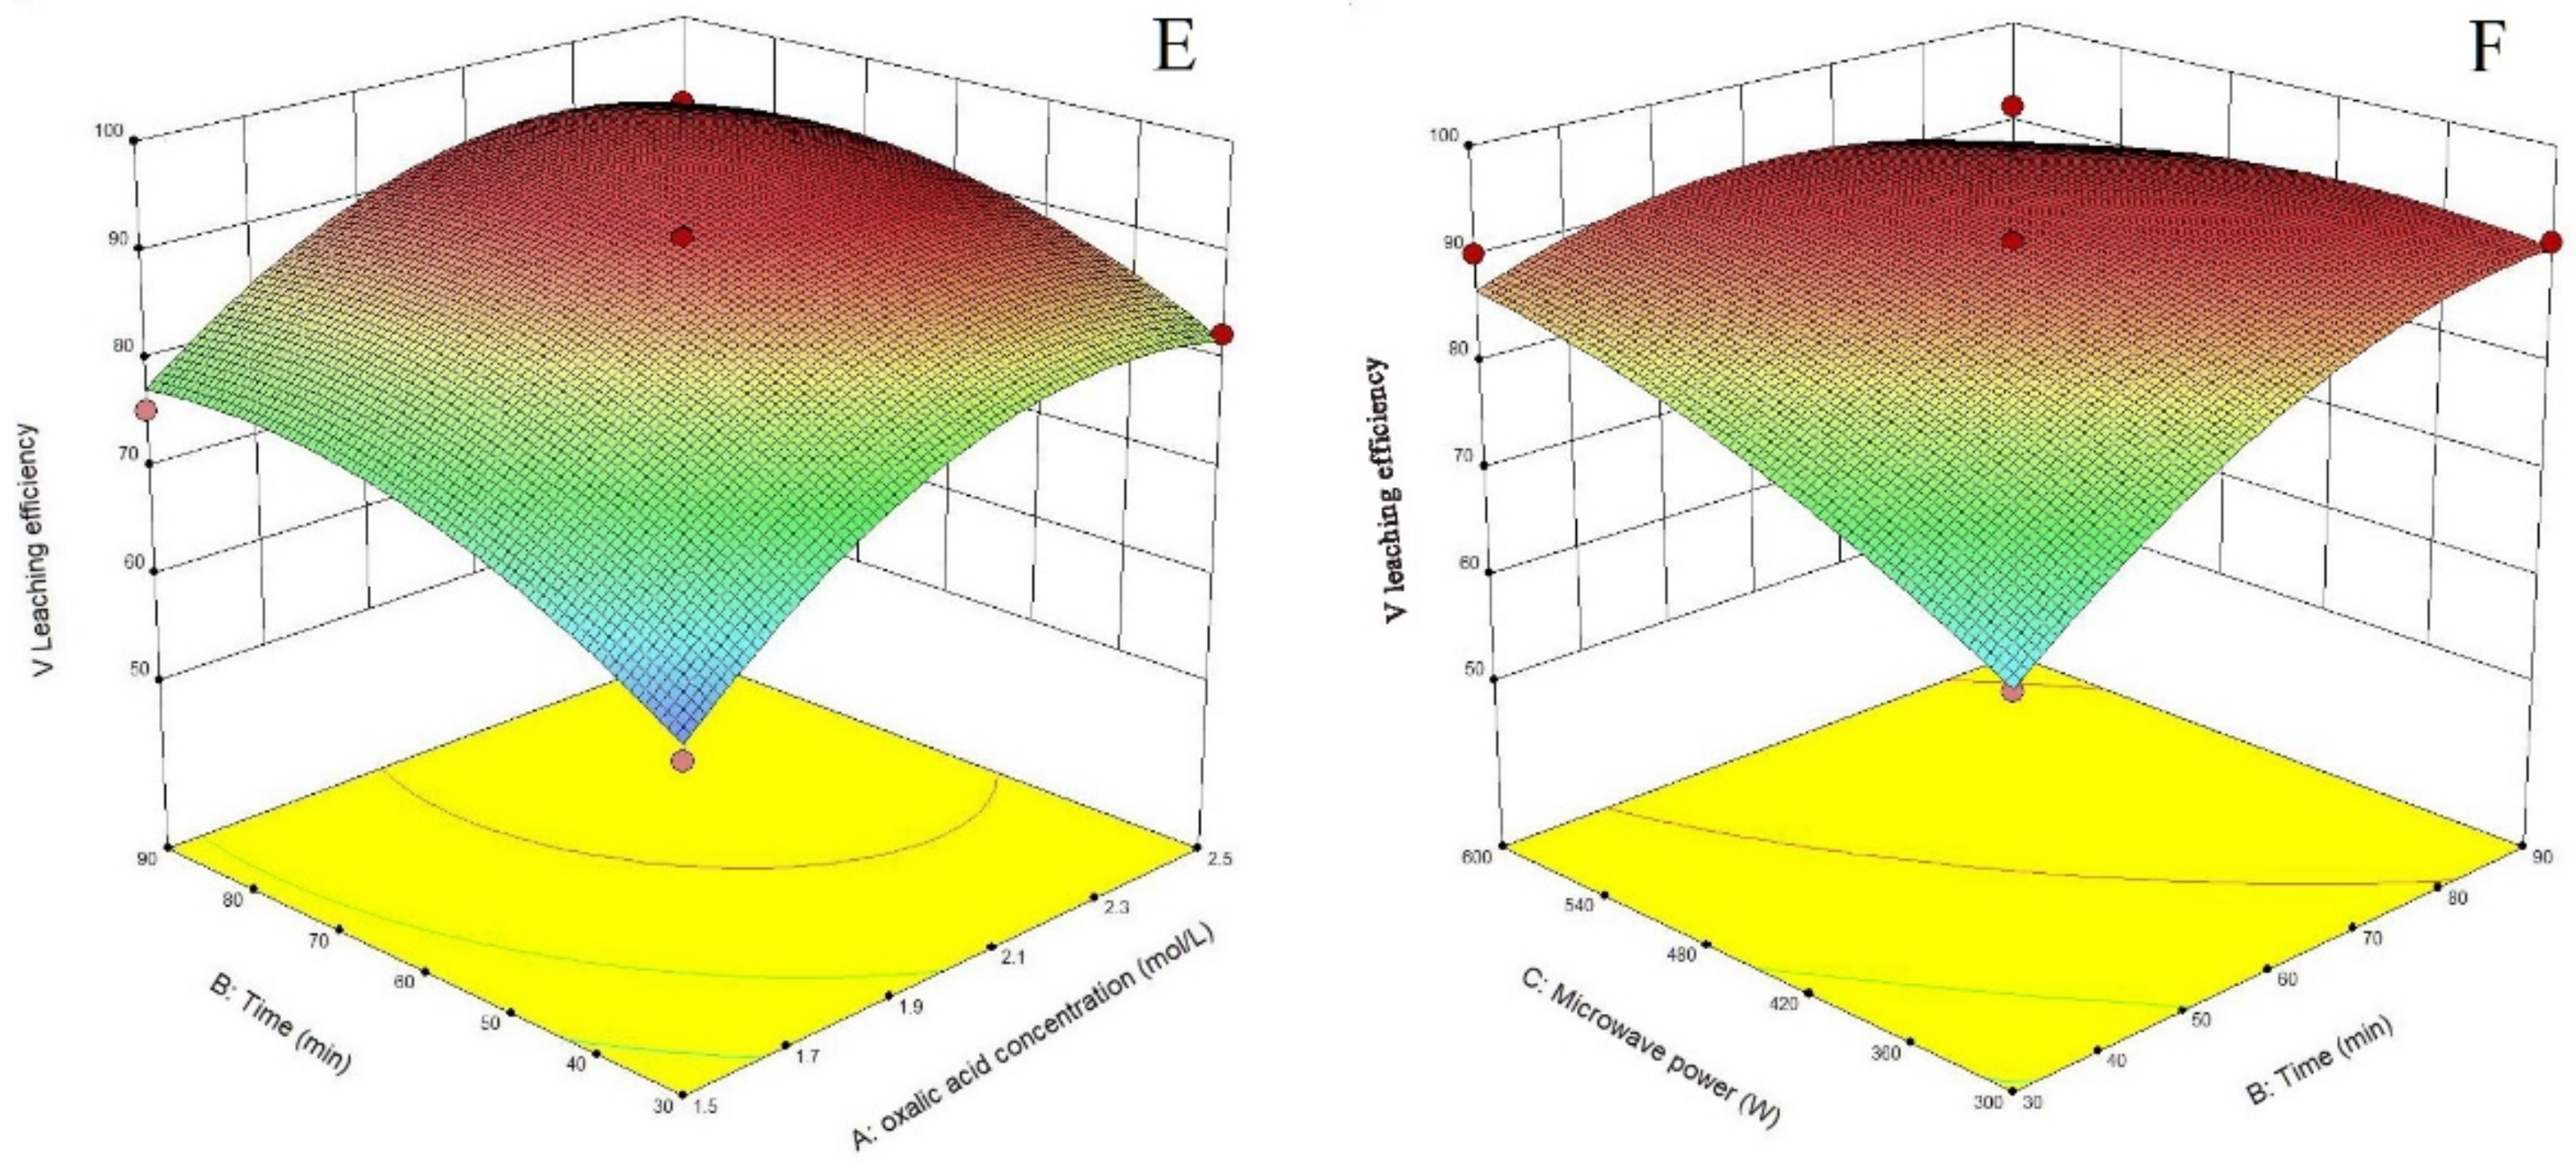
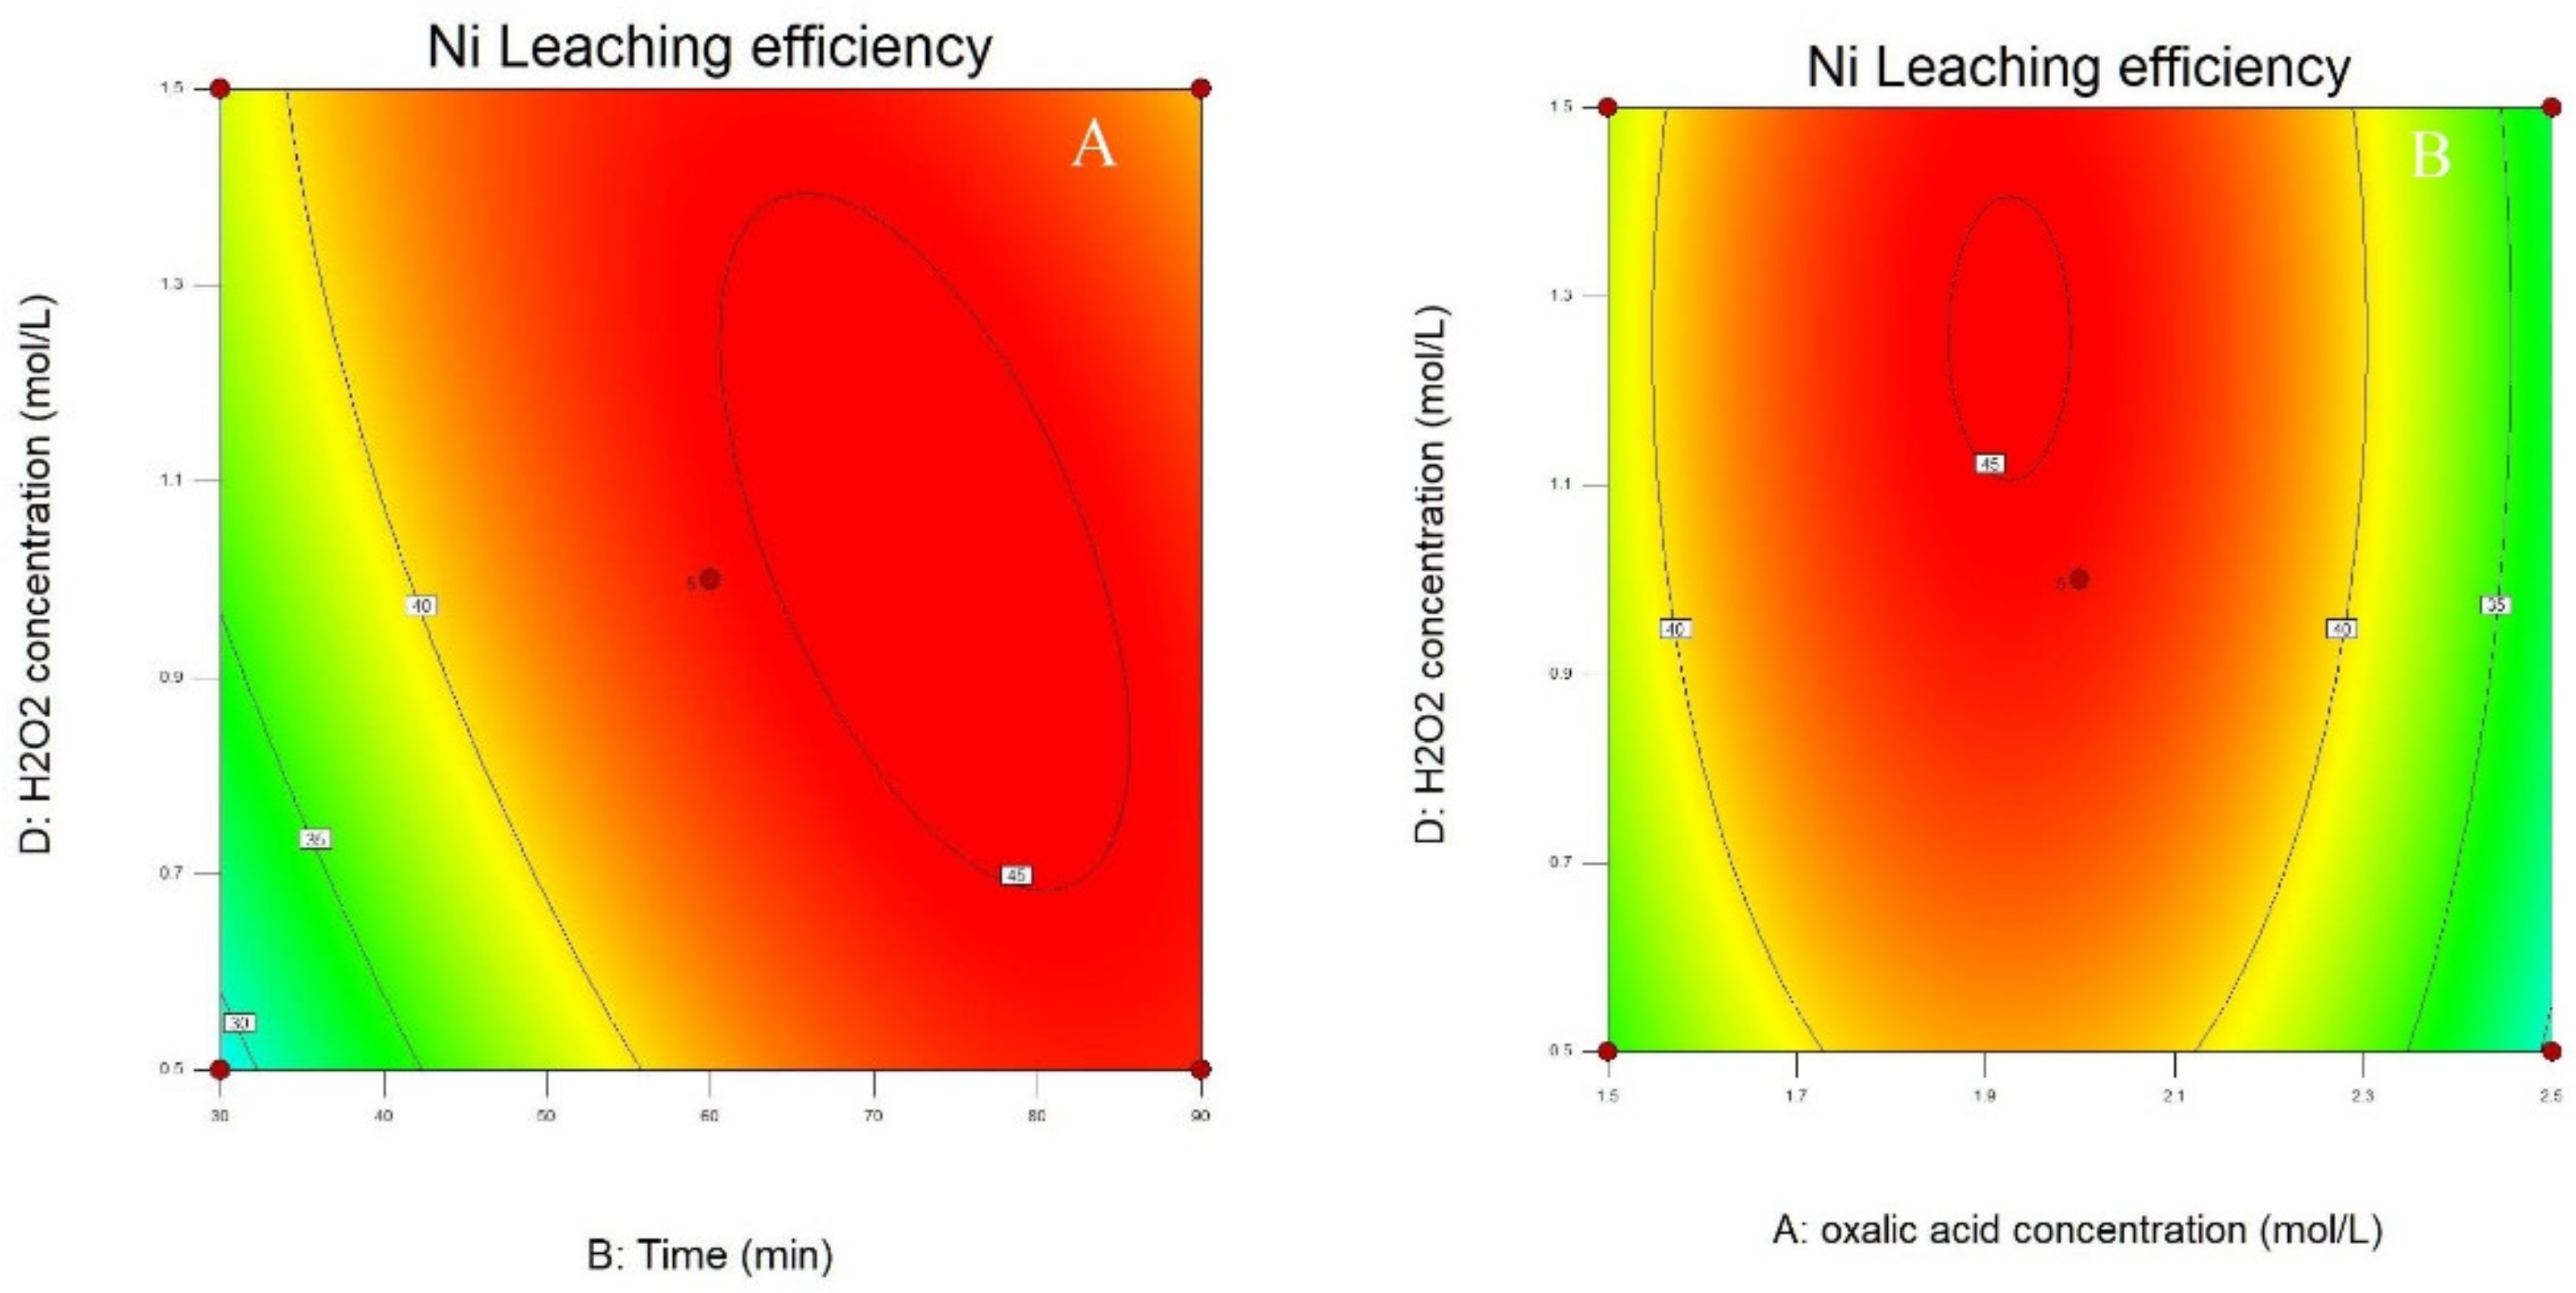
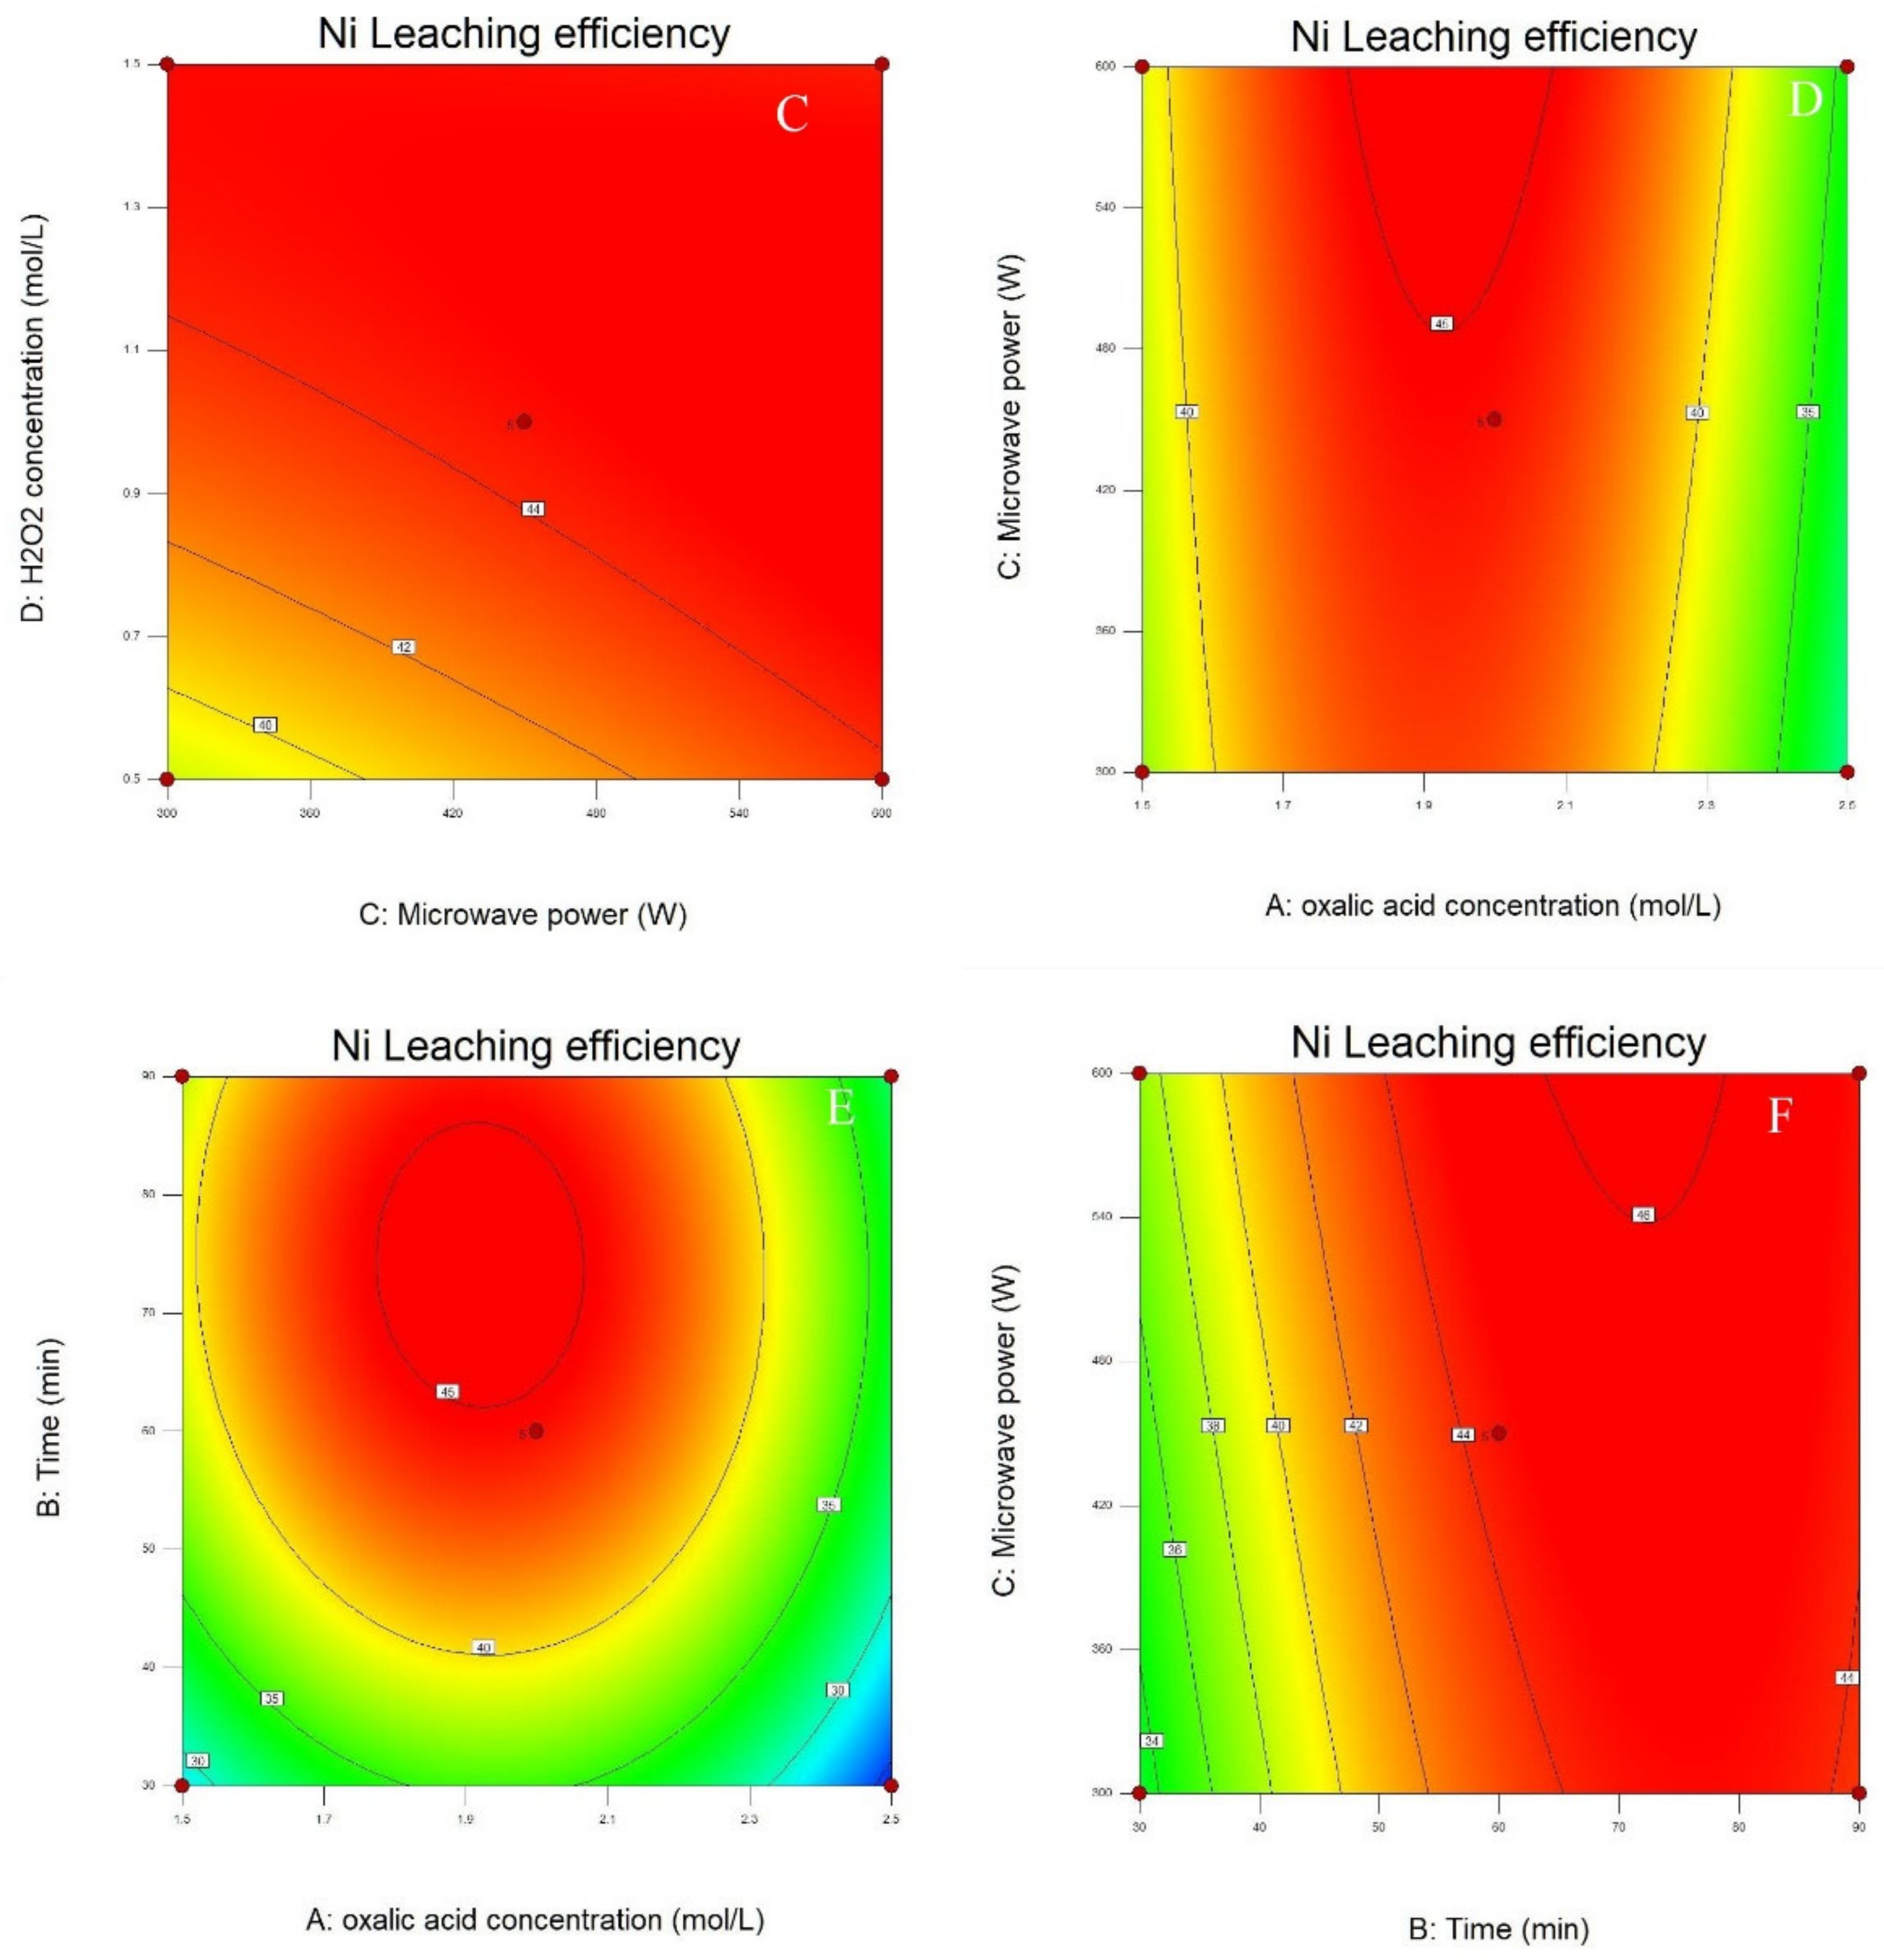
3.2. Process Optimization
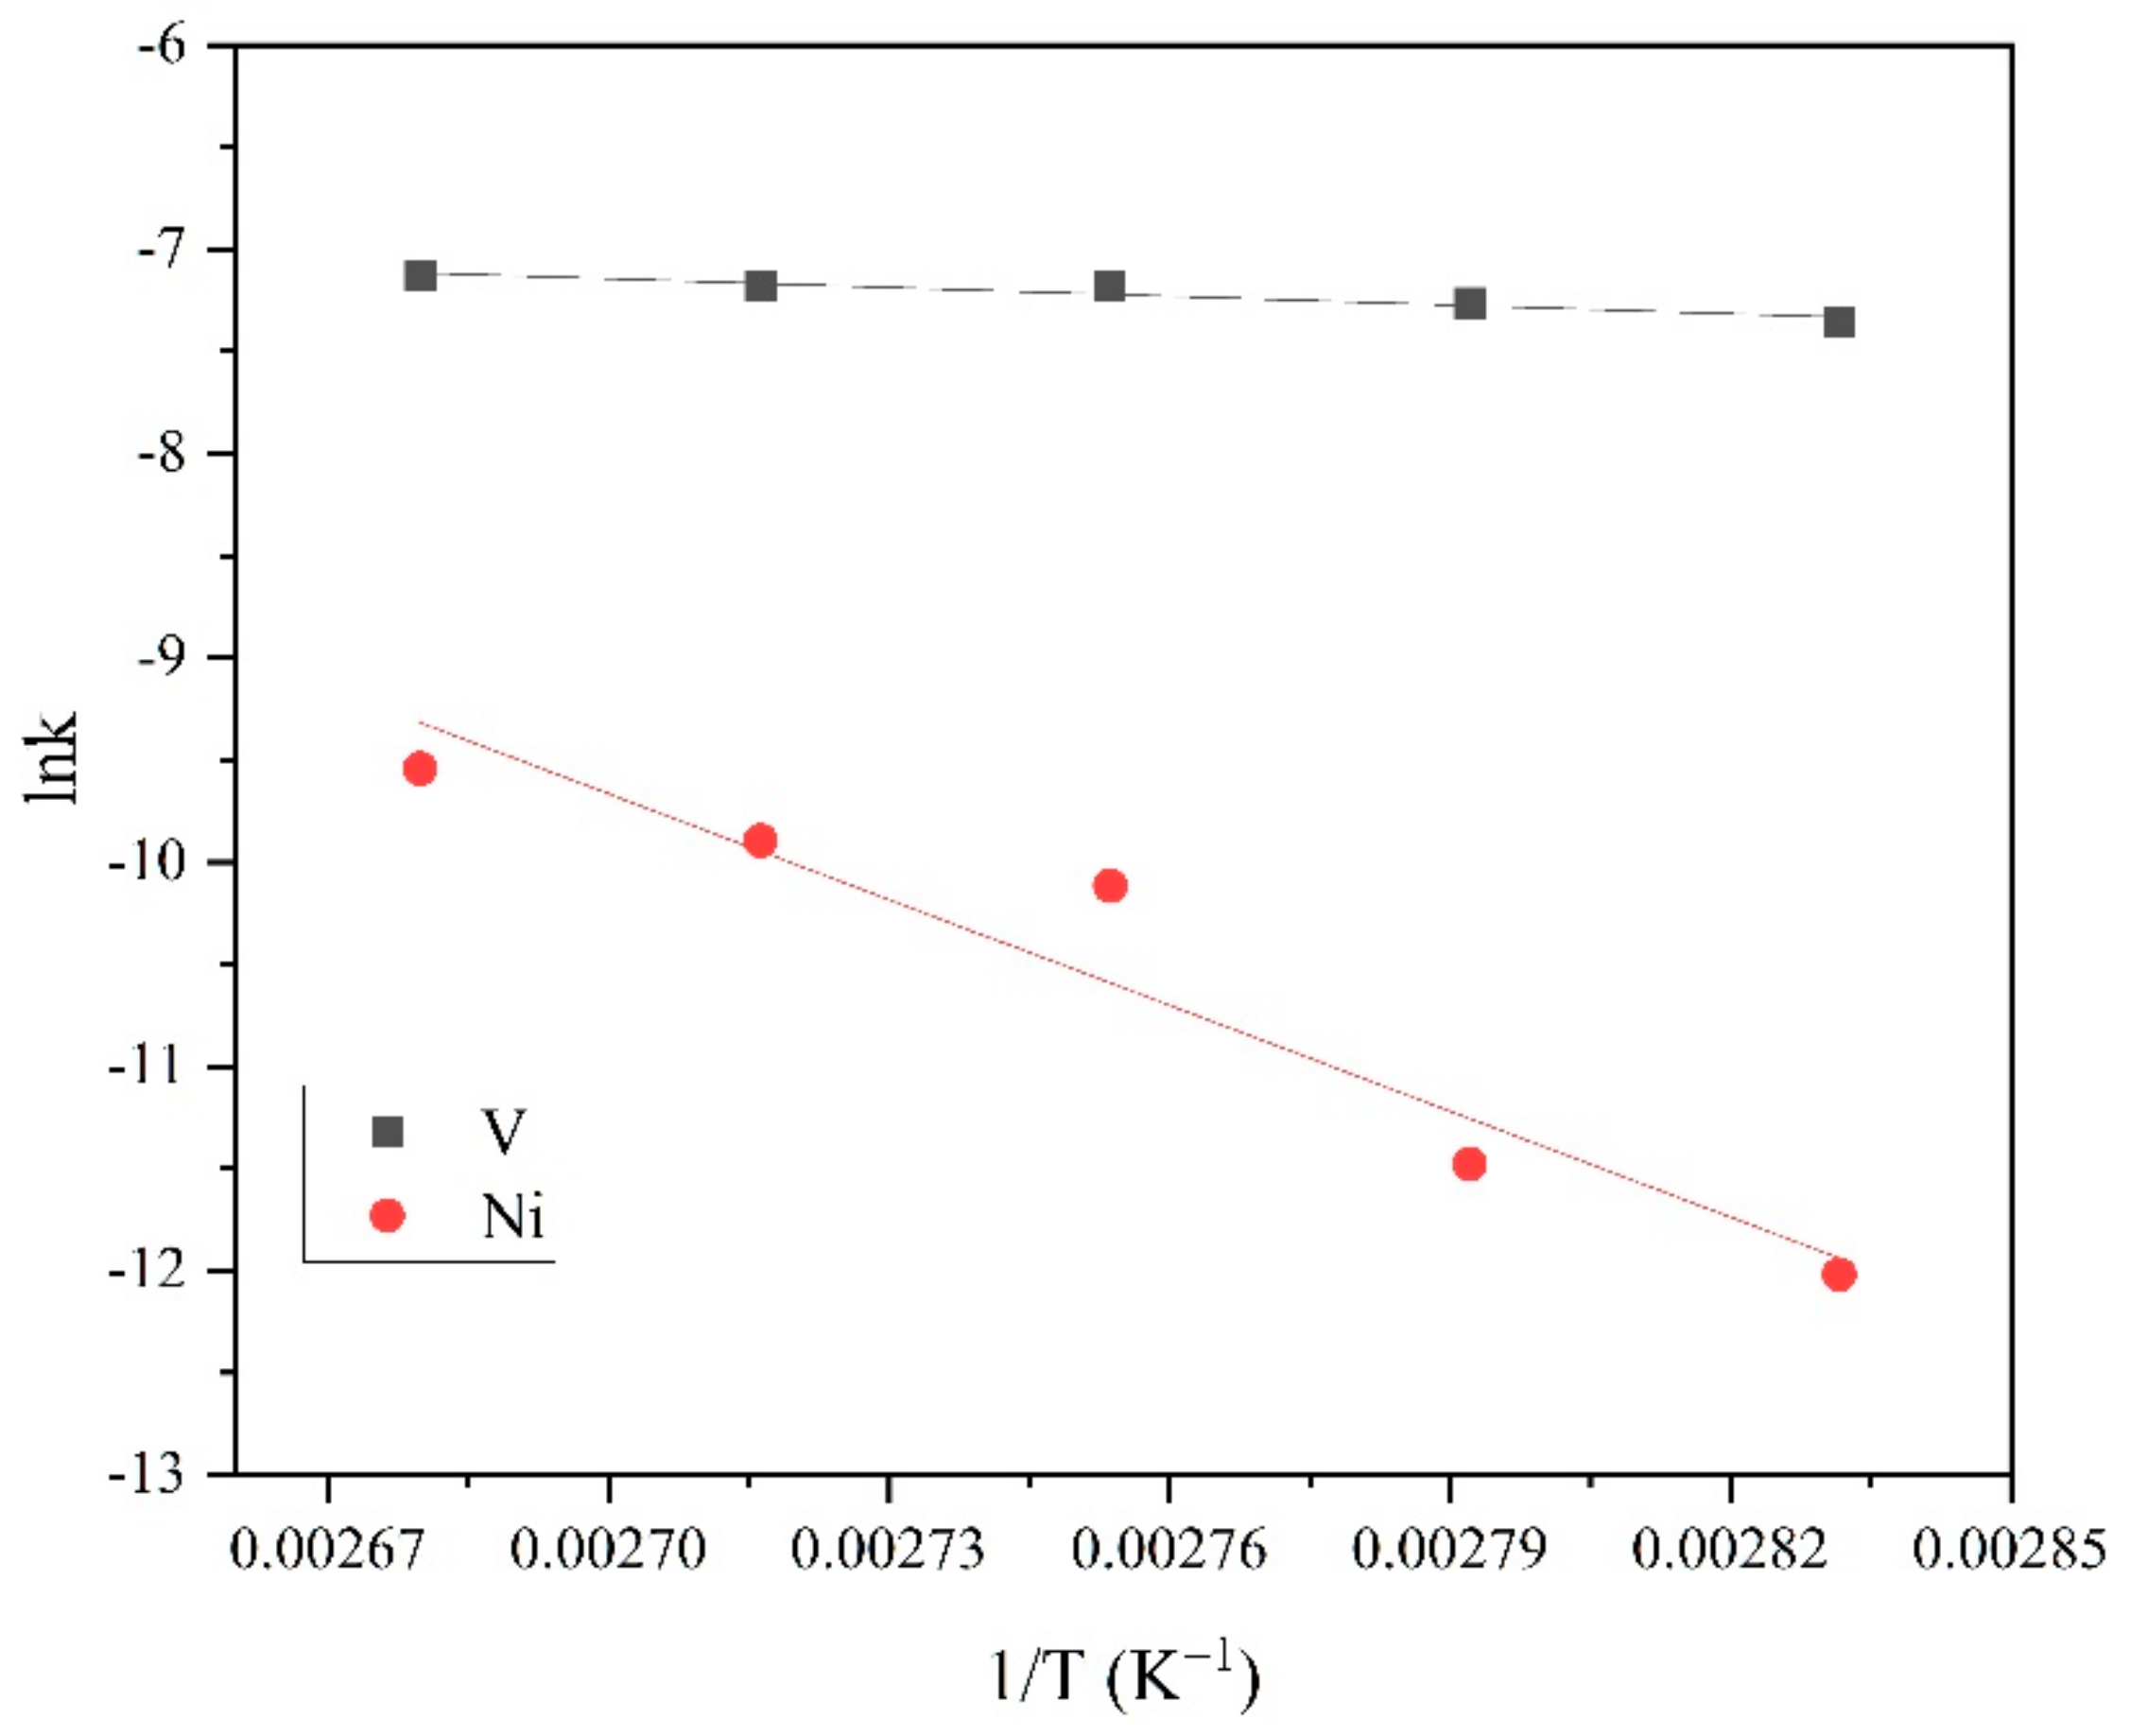
3.3. Leaching Kinetics
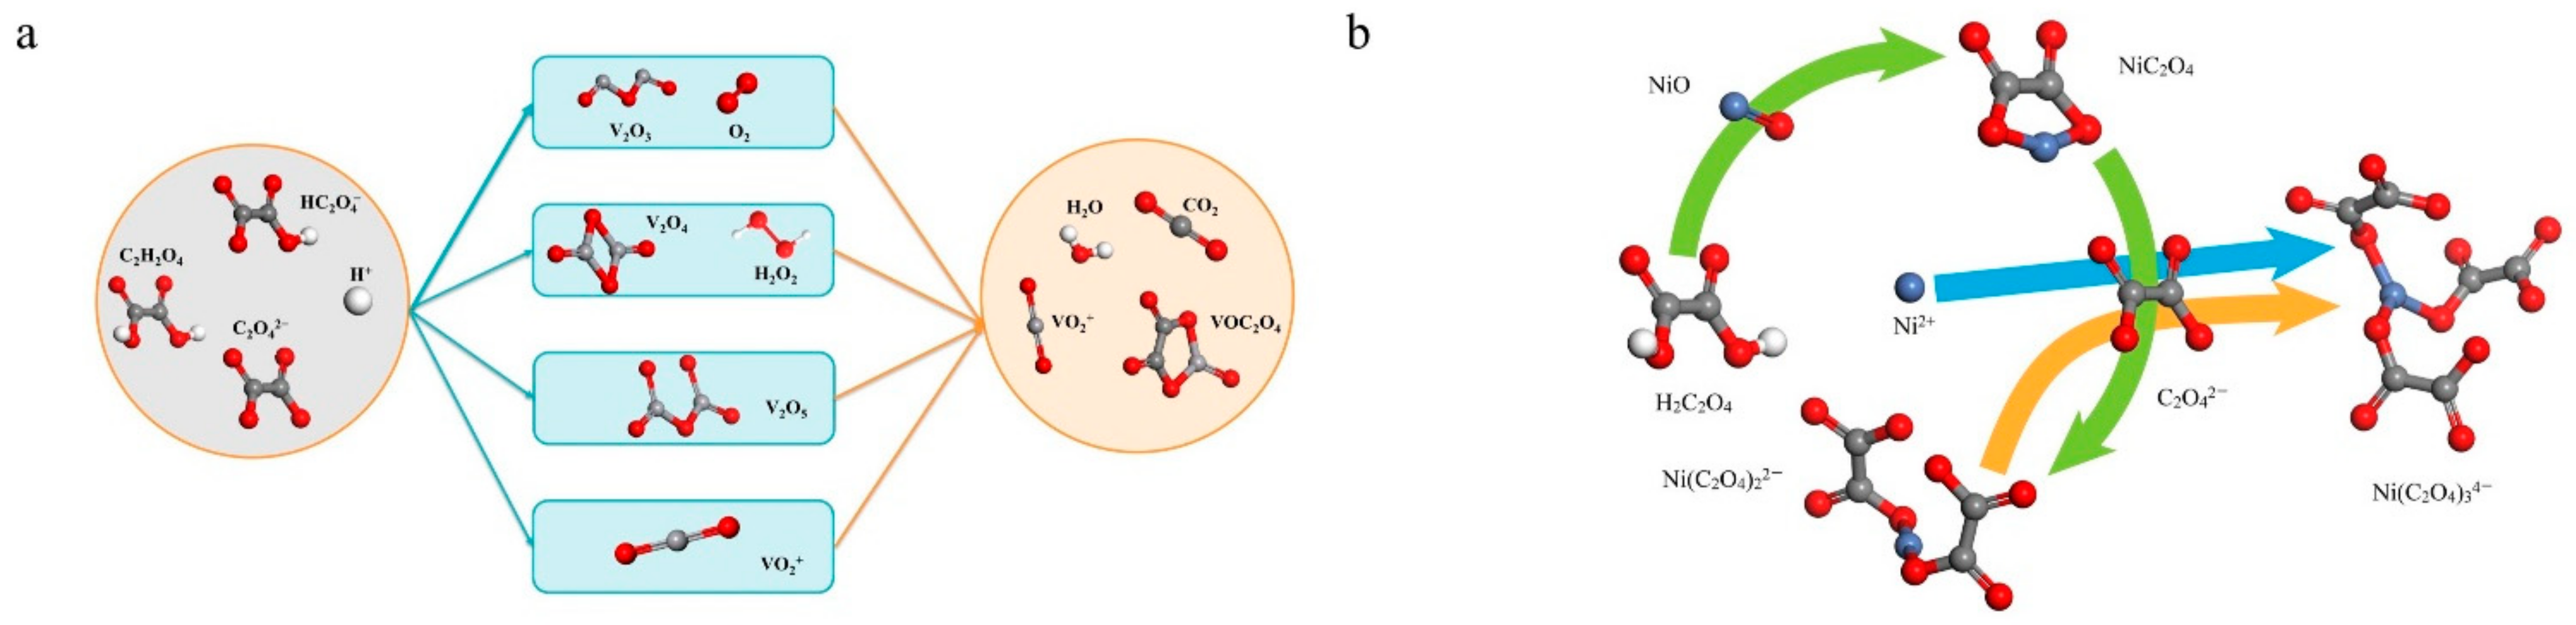
4. Discussion
5. Conclusions
Supplementary Materials
Author Contributions
Funding
Acknowledgments
Conflicts of Interest
References
- Ferella, F. A review on management and recycling of spent selective catalytic reduction catalysts. J. Clean. Prod. 2020, 246, 118990. [Google Scholar] [CrossRef]
- Bai, P.; Etim, U.; Yan, Z.; Mintova, S.; Zhang, Z.; Zhong, Z.; Gao, X. Fluid catalytic cracking technology: Current status and recent discoveries on catalyst contamination. Catal. Rev. 2018, 61, 333–405. [Google Scholar] [CrossRef]
- Ferella, F.; Innocenzi, V.; Maggiore, F. Oil refining spent catalysts: A review of possible recycling technologies. Resour. Conserv. Recycl. 2016, 108, 10–20. [Google Scholar] [CrossRef]
- Vogt, E.T.C.; Weckhuysen, B.M. Fluid catalytic cracking: Recent developments on the grand old lady of zeolite catalysis. Chem. Soc. Rev. 2015, 44, 7342–7370. [Google Scholar] [CrossRef] [Green Version]
- Zhou, Q.; Qi, Y.; Liu, Q.; Ren, F.; Chen, Z.; Zhu, Y.; Etschmann, B.; Zhang, L. A detailed speciation of iron on FCC catalysts based on an integrated use of advanced characterisation methods and thermodynamic equilibrium simulation. Appl. Catal. A Gen. 2020, 599, 1175977. [Google Scholar] [CrossRef]
- Zhang, Y.S.; Lu, X.; Owen, R.; Manos, G.; Xu, R.; Wang, F.R.; Maskell, W.C.; Shearing, P.R.; Brett, D.J.L. Fine structural changes of fluid catalytic catalysts and characterization of coke formed resulting from heavy oil devolatilization. Appl. Catal. B Environ. 2020, 263, 118329. [Google Scholar] [CrossRef]
- Luan, H.; Lin, J.; Xiu, G.; Ju, F.; Ling, H. Study on compositions of FCC flue gas and pollutant precursors from FCC catalysts. Chemosphere 2020, 245, 125528. [Google Scholar] [CrossRef]
- Senter, C.; Mastry, M.C.; Mannion, A.M.; McGuire, R.; Houtz, D.; Yilmaz, B. Quantitative Visual Characterization of Contaminant Metals and their Mobility in Fluid Catalytic Cracking Catalysts. Catalysts 2019, 9, 831. [Google Scholar] [CrossRef] [Green Version]
- Zhang, R.; Zhang, Y.; Liu, T.; Wan, Q.; Zheng, D. Immobilization of vanadium and nickel in spent fluid catalytic cracking (SFCC) catalysts-based geopolymer. J. Clean. Prod. 2022, 332, 130112. [Google Scholar] [CrossRef]
- Wan, Q.; Zhang, Y.; Zhang, R. Using mechanical activation of quartz to enhance the compressive strength of metakaolin based geopolymers. Cem. Concr. Compos. 2020, 111, 103635. [Google Scholar] [CrossRef]
- Wan, Q.; Rao, F.; Song, S.; Leon-Patino, C.A.; Ma, Y.; Yin, W. Consolidation of mine tailings through geopolymerization at ambient temperature. J. Am. Ceram. Soc. 2019, 102, 2451–2461. [Google Scholar] [CrossRef]
- Le, M.N.; Lee, M.S. A Review on Hydrometallurgical Processes for the Recovery of Valuable Metals from Spent Catalysts and Life Cycle Analysis Perspective. Miner. Process. Extr. Metall. Rev. 2020, 42, 335–354. [Google Scholar] [CrossRef]
- Mazurek, K. Recovery of vanadium, potassium and iron from a spent vanadium catalyst by oxalic acid solution leaching, precipitation and ion exchange processes. Hydrometallurgy 2013, 134–135, 26–31. [Google Scholar] [CrossRef]
- Le, T.; Li, X.; Ravindra, A.V.; Wang, Q.; Peng, J.; Ju, S. Leaching behavior of contaminant metals from spent FCC catalyst under microwave irradiation. Mater. Res. Express 2019, 6, 035509. [Google Scholar] [CrossRef]
- Ma, Z.-Y.; Liu, Y.; Zhou, J.-K.; Liu, M.-D.; Liu, Z.-Z. Recovery of vanadium and molybdenum from spent petrochemical catalyst by microwave-assisted leaching. Int. J. Miner. Metall. Mater. 2019, 26, 33–40. [Google Scholar] [CrossRef]
- Li, K.; Jiang, Q.; Gao, L.; Chen, J.; Peng, J.; Koppala, S.; Omran, M.; Chen, G. Investigations on the microwave absorption properties and thermal behavior of vanadium slag: Improvement in microwave oxidation roasting for recycling vanadium and chromium. J. Hazard. Mater. 2020, 395, 122698. [Google Scholar] [CrossRef]
- Gao, H.; Jiang, T.; Xu, Y.; Wen, J.; Xue, X. Leaching Kinetics of Vanadium and Chromium During Sulfuric Acid Leaching with Microwave and Conventional Calcification-Roasted High Chromium Vanadium Slag. Miner. Process. Extr. Metall. Rev. 2018, 41, 22–31. [Google Scholar] [CrossRef]
- Pinto, I.S.S.; Soares, H.M.V.M. Microwave-assisted selective leaching of nickel from spent hydrodesulphurization catalyst: A comparative study between sulphuric and organic acids. Hydrometallurgy 2013, 140, 20–27. [Google Scholar] [CrossRef]
- Hosseini Nasab, M.; Noaparast, M.; Abdollahi, H. Dissolution optimization and kinetics of nickel and cobalt from iron-rich laterite ore, using sulfuric acid at atmospheric pressure. Int. J. Chem. Kinet. 2020, 52, 283–298. [Google Scholar] [CrossRef]
- Tavakoli, M.R.; Dreisinger, D.B. The kinetics of oxidative leaching of vanadium trioxide. Hydrometallurgy 2014, 147–148, 83–89. [Google Scholar] [CrossRef]
- Sadeghi, S.M.; Jesus, J.; Pinto, E.; Almeida, A.A.; Soares, H.M.V.M. A simple, efficient and selective process for recycling La (and Al) from fluid cracking catalysts using an environmentally friendly strategy. Miner. Eng. 2020, 156, 106375. [Google Scholar] [CrossRef]
- Le, M.N.; Lee, M.S. Selective dissolution of vanadium(V) from spent petroleum catalysts by oxalic acid solution. J. Min. Metall. Sect. B Metall. 2020, 56, 127–133. [Google Scholar] [CrossRef] [Green Version]
- Hu, P.; Zhang, Y.; Liu, T.; Huang, J.; Yuan, Y.; Xue, N. Source separation of vanadium over iron from roasted vanadium-bearing shale during acid leaching via ferric fluoride surface coating. J. Clean. Prod. 2018, 181, 399–407. [Google Scholar] [CrossRef]
- Petrus, H.T.B.M.; Wijaya, A.; Putra, A.D.P.; Iskandar, Y.; Bratakusuma, D.; Mufakhir, F.R.; Astuti, W.; Wiratni. Effect of temperature and acid concentration on Ianthanum extraction from spent catalyst using organic acid. In Proceedings of the 2nd Mineral Processing and Technology International Conference, Tangerang, Indonesia, 1 November 2018; Volume 10, pp. 12–17. [Google Scholar]
- Biswas, S.; Chakraborty, S.; Chaudhuri, M.G.; Banerjee, P.C.; Mukherjee, S.; Dey, R. Optimization of process parameters and dissolution kinetics of nickel and cobalt from lateritic chromite overburden using organic acids. J. Chem. Technol. Biotechnol. 2014, 89, 1491–1500. [Google Scholar] [CrossRef]
- Chauhan, G.; Pant, K.K.; Nigam, K.D. Development of green technology for extraction of nickel from spent catalyst and its optimization using response surface methodology. Green Process. Synth. 2013, 2, 259–271. [Google Scholar] [CrossRef]
- Waba, I.E.; Abubakar, A.; Yunusa, S.; Audu, N. Reactivation of Spent FCC Catalyst via Oxidation and Acid Treatment. Appl. J. Environ. Eng. Sci. 2020, 6, 22–34. [Google Scholar]
- Liu, J.; Qiu, Z.; Yang, J.; Cao, L.; Zhang, W. Recovery of Mo and Ni from spent acrylonitrile catalysts using an oxidation leaching–chemical precipitation technique. Hydrometallurgy 2016, 164, 64–70. [Google Scholar] [CrossRef]
- Verma, A.; Kore, R.; Corbin, D.R.; Shiflett, M.B. Metal Recovery Using Oxalate Chemistry: A Technical Review. Ind. Eng. Chem. Res. 2019, 58, 15381–15393. [Google Scholar] [CrossRef]
- Mulak, W.; Szymczycha, A.; Leśniewicz, A.; Żyrnicki, W. Prliminary resluts of metals leaching from a spent Hydrodeslphurzation HDS catalyst. Physicochem. Probl. Miner. Process. 2006, 40, 69–76. [Google Scholar]
- Nagar, N.; Garg, H.; Gahan, C.S. Integrated bio-pyro-hydro-metallurgical approach to recover metal values from petroleum refinery spent catalyst. Biocatal. Agric. Biotechnol. 2019, 20, 101252. [Google Scholar] [CrossRef]
- Pathak, A.; Vinoba, M.; Kothari, R. Emerging role of organic acids in leaching of valuable metals from refinery-spent hydroprocessing catalysts, and potential techno-economic challenges: A review. Crit. Rev. Environ. Sci. Technol. 2020, 51, 1–43. [Google Scholar] [CrossRef]

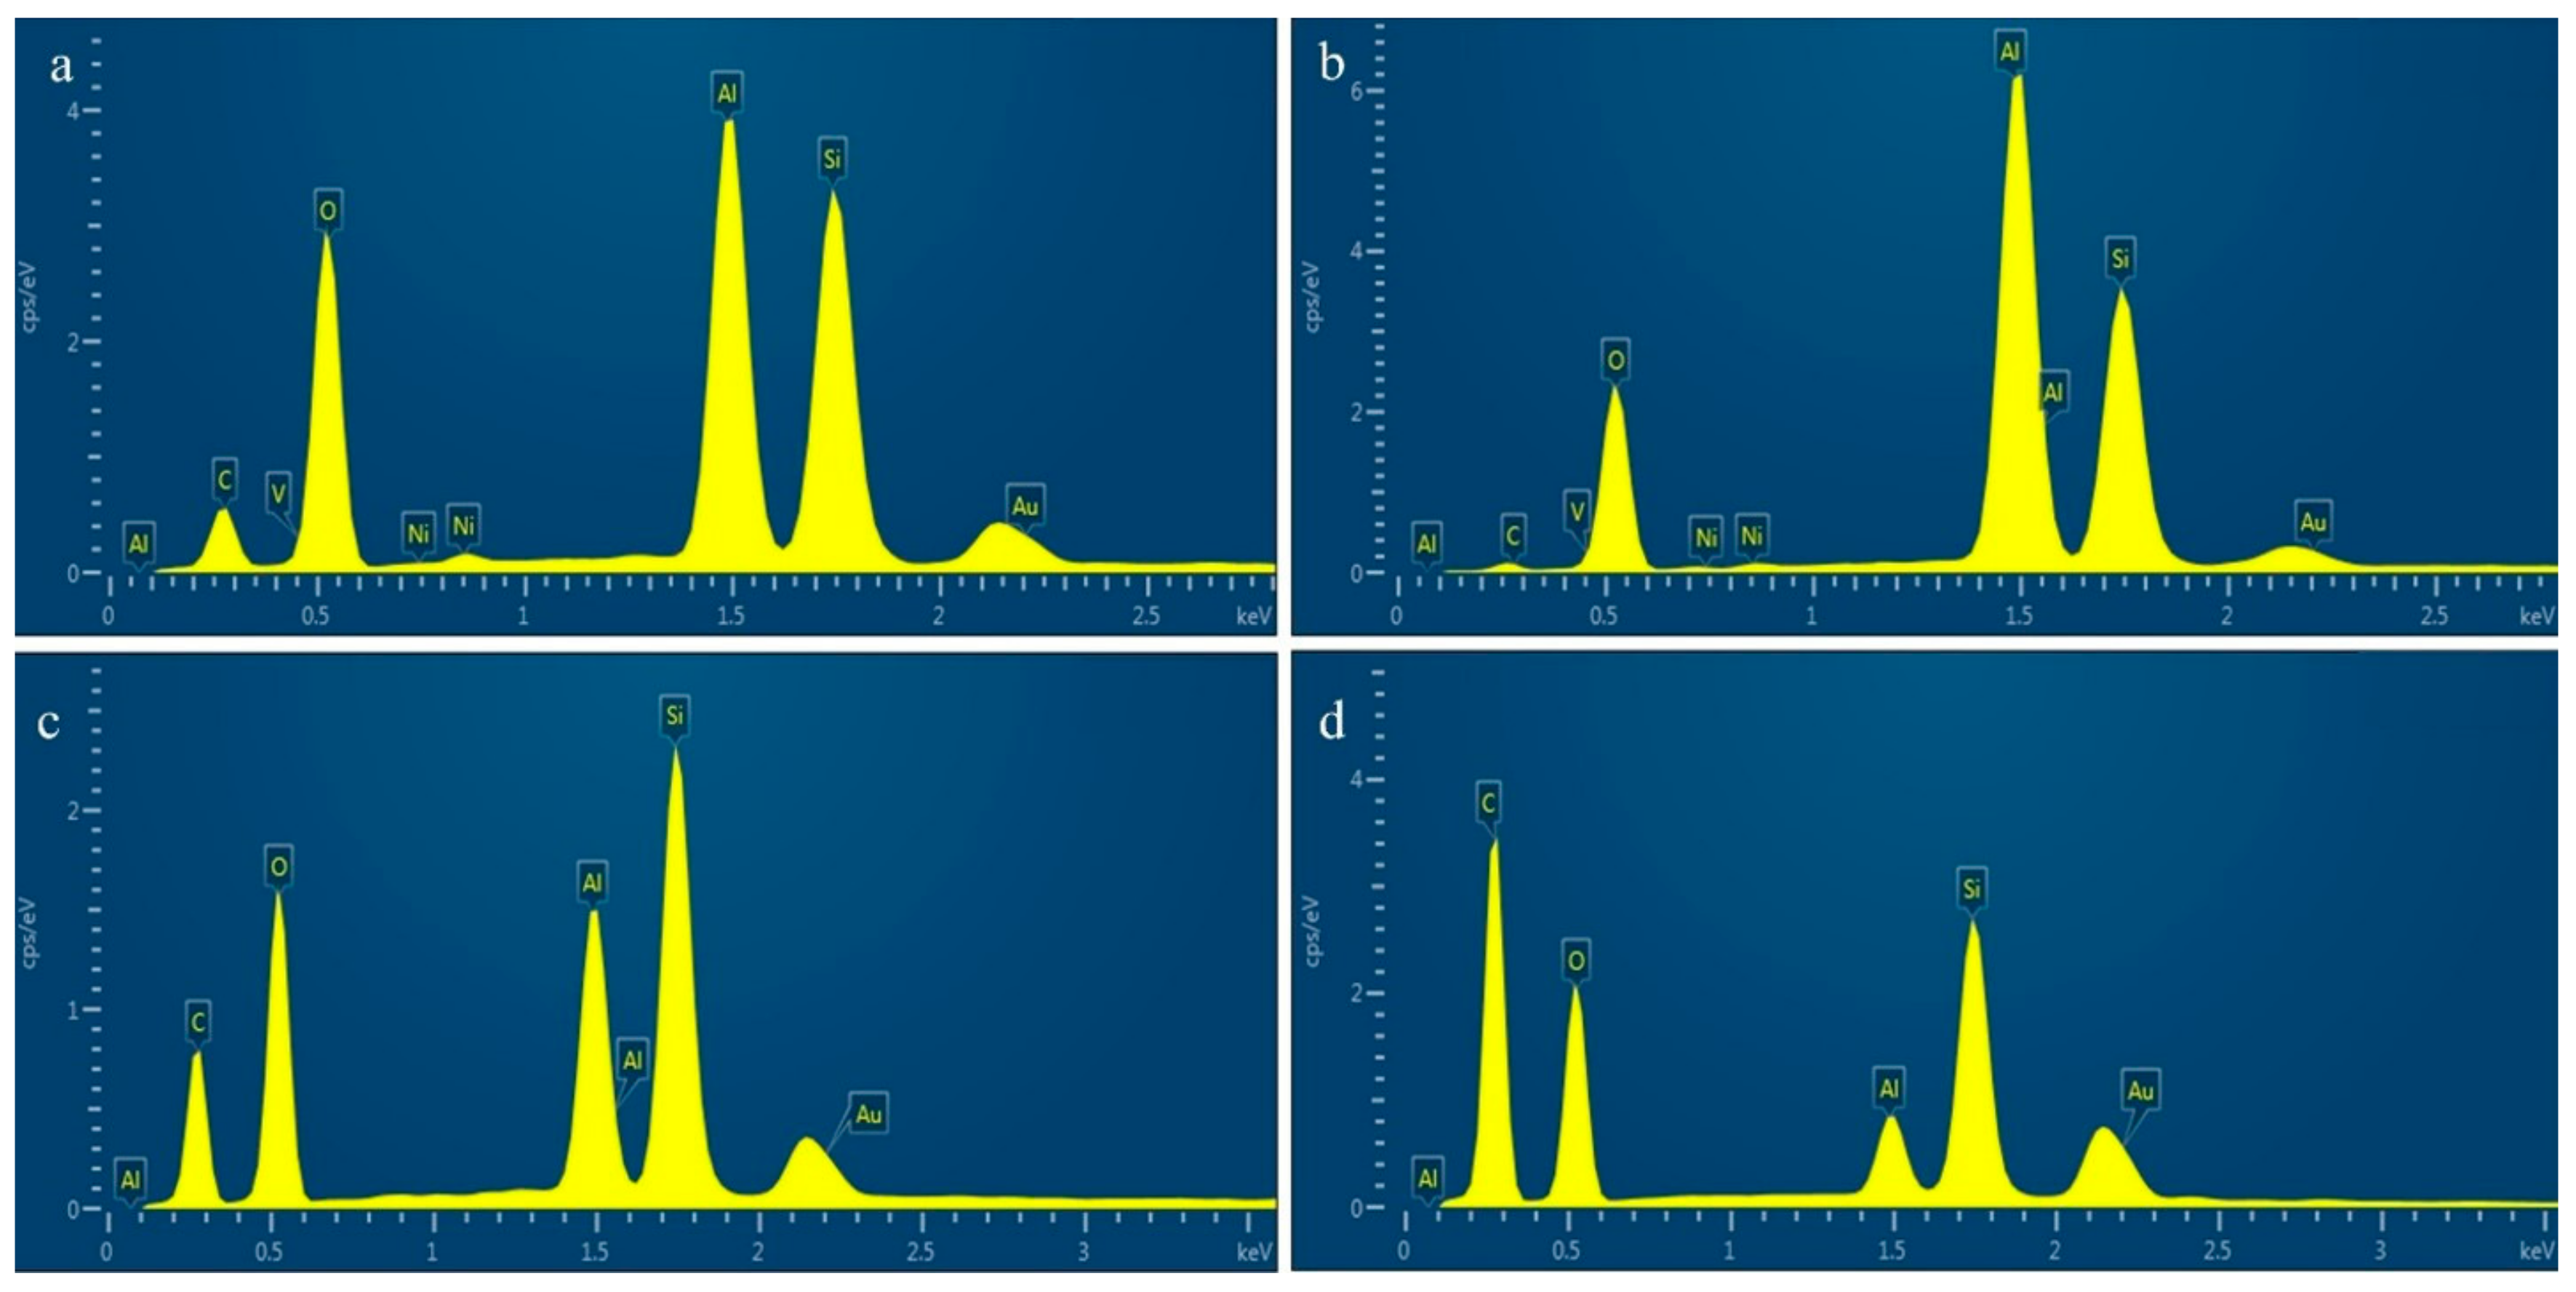
| Element | Al | Si | Fe | V | Ni | La | Ce |
|---|---|---|---|---|---|---|---|
| (wt.%) | 29.26 | 17.59 | 0.48 | 0.44 | 0.53 | 1.67 | 0.68 |
| Factors | Symbol | Range and Levels | ||
|---|---|---|---|---|
| −1 | 0 | 1 | ||
| H2O2 amount (mol/L) | x1 | 0 | 2 | 4 |
| C2H2O4 concentration (mol/L) | x2 | 2 | 4 | 6 |
| leaching time (min) | x3 | 20 | 40 | 60 |
| microwave power (W) | x4 | 150 | 350 | 550 |
| Run | X1 | X2 | X3 | X4 | Y1 | Y2 | Run | X1 | X2 | X3 | X4 | Y1 | Y2 |
|---|---|---|---|---|---|---|---|---|---|---|---|---|---|
| 1 | 1 | 1.5 | 90 | 450 | 85.64 | 30.58 | 16 | 1 | 2 | 120 | 550 | 91.37 | 46.35 |
| 2 | 0.5 | 2.5 | 90 | 500 | 78.35 | 40.36 | 17 | 0.5 | 2 | 90 | 450 | 78.26 | 42.65 |
| 3 | 1.5 | 2 | 90 | 450 | 91.39 | 46.38 | 18 | 1 | 2.5 | 120 | 500 | 91.38 | 40.38 |
| 4 | 1 | 2.5 | 90 | 550 | 91.38 | 40.21 | 19 | 1 | 1.5 | 120 | 500 | 83.59 | 42.35 |
| 5 | 1 | 2 | 90 | 500 | 91.35 | 46.35 | 20 | 1 | 2.5 | 60 | 500 | 76.35 | 38.66 |
| 6 | 1 | 1.5 | 60 | 500 | 62.59 | 30.51 | 21 | 1.5 | 1.5 | 90 | 500 | 86.38 | 40.28 |
| 7 | 1.5 | 2 | 60 | 500 | 73.29 | 40.26 | 22 | 1 | 2 | 60 | 450 | 73.25 | 37.25 |
| 8 | 0.5 | 2 | 90 | 550 | 80.39 | 46.35 | 23 | 1 | 2 | 90 | 500 | 91.37 | 46.34 |
| 9 | 1 | 2 | 90 | 500 | 91.36 | 46.34 | 24 | 1 | 1.5 | 90 | 550 | 81.26 | 41.28 |
| 10 | 1 | 2 | 60 | 550 | 81.54 | 42.38 | 25 | 1 | 2 | 90 | 500 | 91.36 | 46.36 |
| 11 | 1 | 2 | 120 | 450 | 91.38 | 46.37 | 26 | 1.5 | 2.5 | 90 | 500 | 91.38 | 40.39 |
| 12 | 0.5 | 2 | 120 | 500 | 80.44 | 46.33 | 27 | 0.5 | 2 | 60 | 500 | 65.28 | 38.59 |
| 13 | 1.5 | 2 | 120 | 500 | 91.39 | 46.36 | 28 | 1.5 | 2 | 90 | 550 | 91.39 | 46.35 |
| 14 | 1 | 2.5 | 90 | 450 | 91.37 | 40.21 | 29 | 0.5 | 1.5 | 90 | 500 | 58.69 | 32.84 |
| 15 | 1 | 2 | 90 | 500 | 91.36 | 46.35 |
| Statistical Results | V | Ni |
|---|---|---|
| Model F-value | 11.19 | 60.37 |
| Model prob > F | <0.0001 | <0.0001 |
| R-squared | 0.959 | 0.971 |
| CV% | 3.30 | 2.74 |
| Adjusted R-squared | 0.918 | 0.942 |
| Adequate precision | 15.998 | 21.700 |
| Kt = 1 − (1 − Xi)1/3 | Kt = 1 + 2 (1 − Xi) − 3 (1 − Xi)2/3 | |||||
|---|---|---|---|---|---|---|
| T (K) | k | R2 | T (K) | k | R2 | |
| V | 353.15 | 6.38 × 10⁻⁴ | 0.952 | 353.15 | 1.83 × 10⁻⁴ | 0.887 |
| 358.15 | 7.00 × 10⁻⁴ | 0.969 | 358.15 | 2.26 × 10⁻⁴ | 0.889 | |
| 363.15 | 7.58 × 10⁻⁴ | 0.938 | 363.15 | 2.41 × 10⁻⁴ | 0.921 | |
| 368.15 | 7.64 × 10⁻⁴ | 0.979 | 368.15 | 3.50 × 10⁻⁴ | 0.986 | |
| 373.15 | 8.00 × 10⁻⁴ | 0.942 | 373.15 | 3.59 × 10⁻⁴ | 0.904 | |
| Ni | 353.15 | 4.46 × 10⁻⁶ | 0.994 | 353.15 | 3.84 × 10⁻⁶ | 0.953 |
| 358.15 | 2.81 × 10⁻⁵ | 0.993 | 358.15 | 2.85 × 10⁻⁵ | 0.858 | |
| 363.15 | 4.04 × 10⁻⁵ | 0.945 | 363.15 | 3.18 × 10⁻⁵ | 0.881 | |
| 368.15 | 5.04 × 10⁻⁵ | 0.997 | 368.15 | 4.17 × 10⁻⁵ | 0.901 | |
| 373.15 | 7.17 × 10⁻⁵ | 0.983 | 373.15 | 6.83 × 10⁻⁵ | 0.886 | |
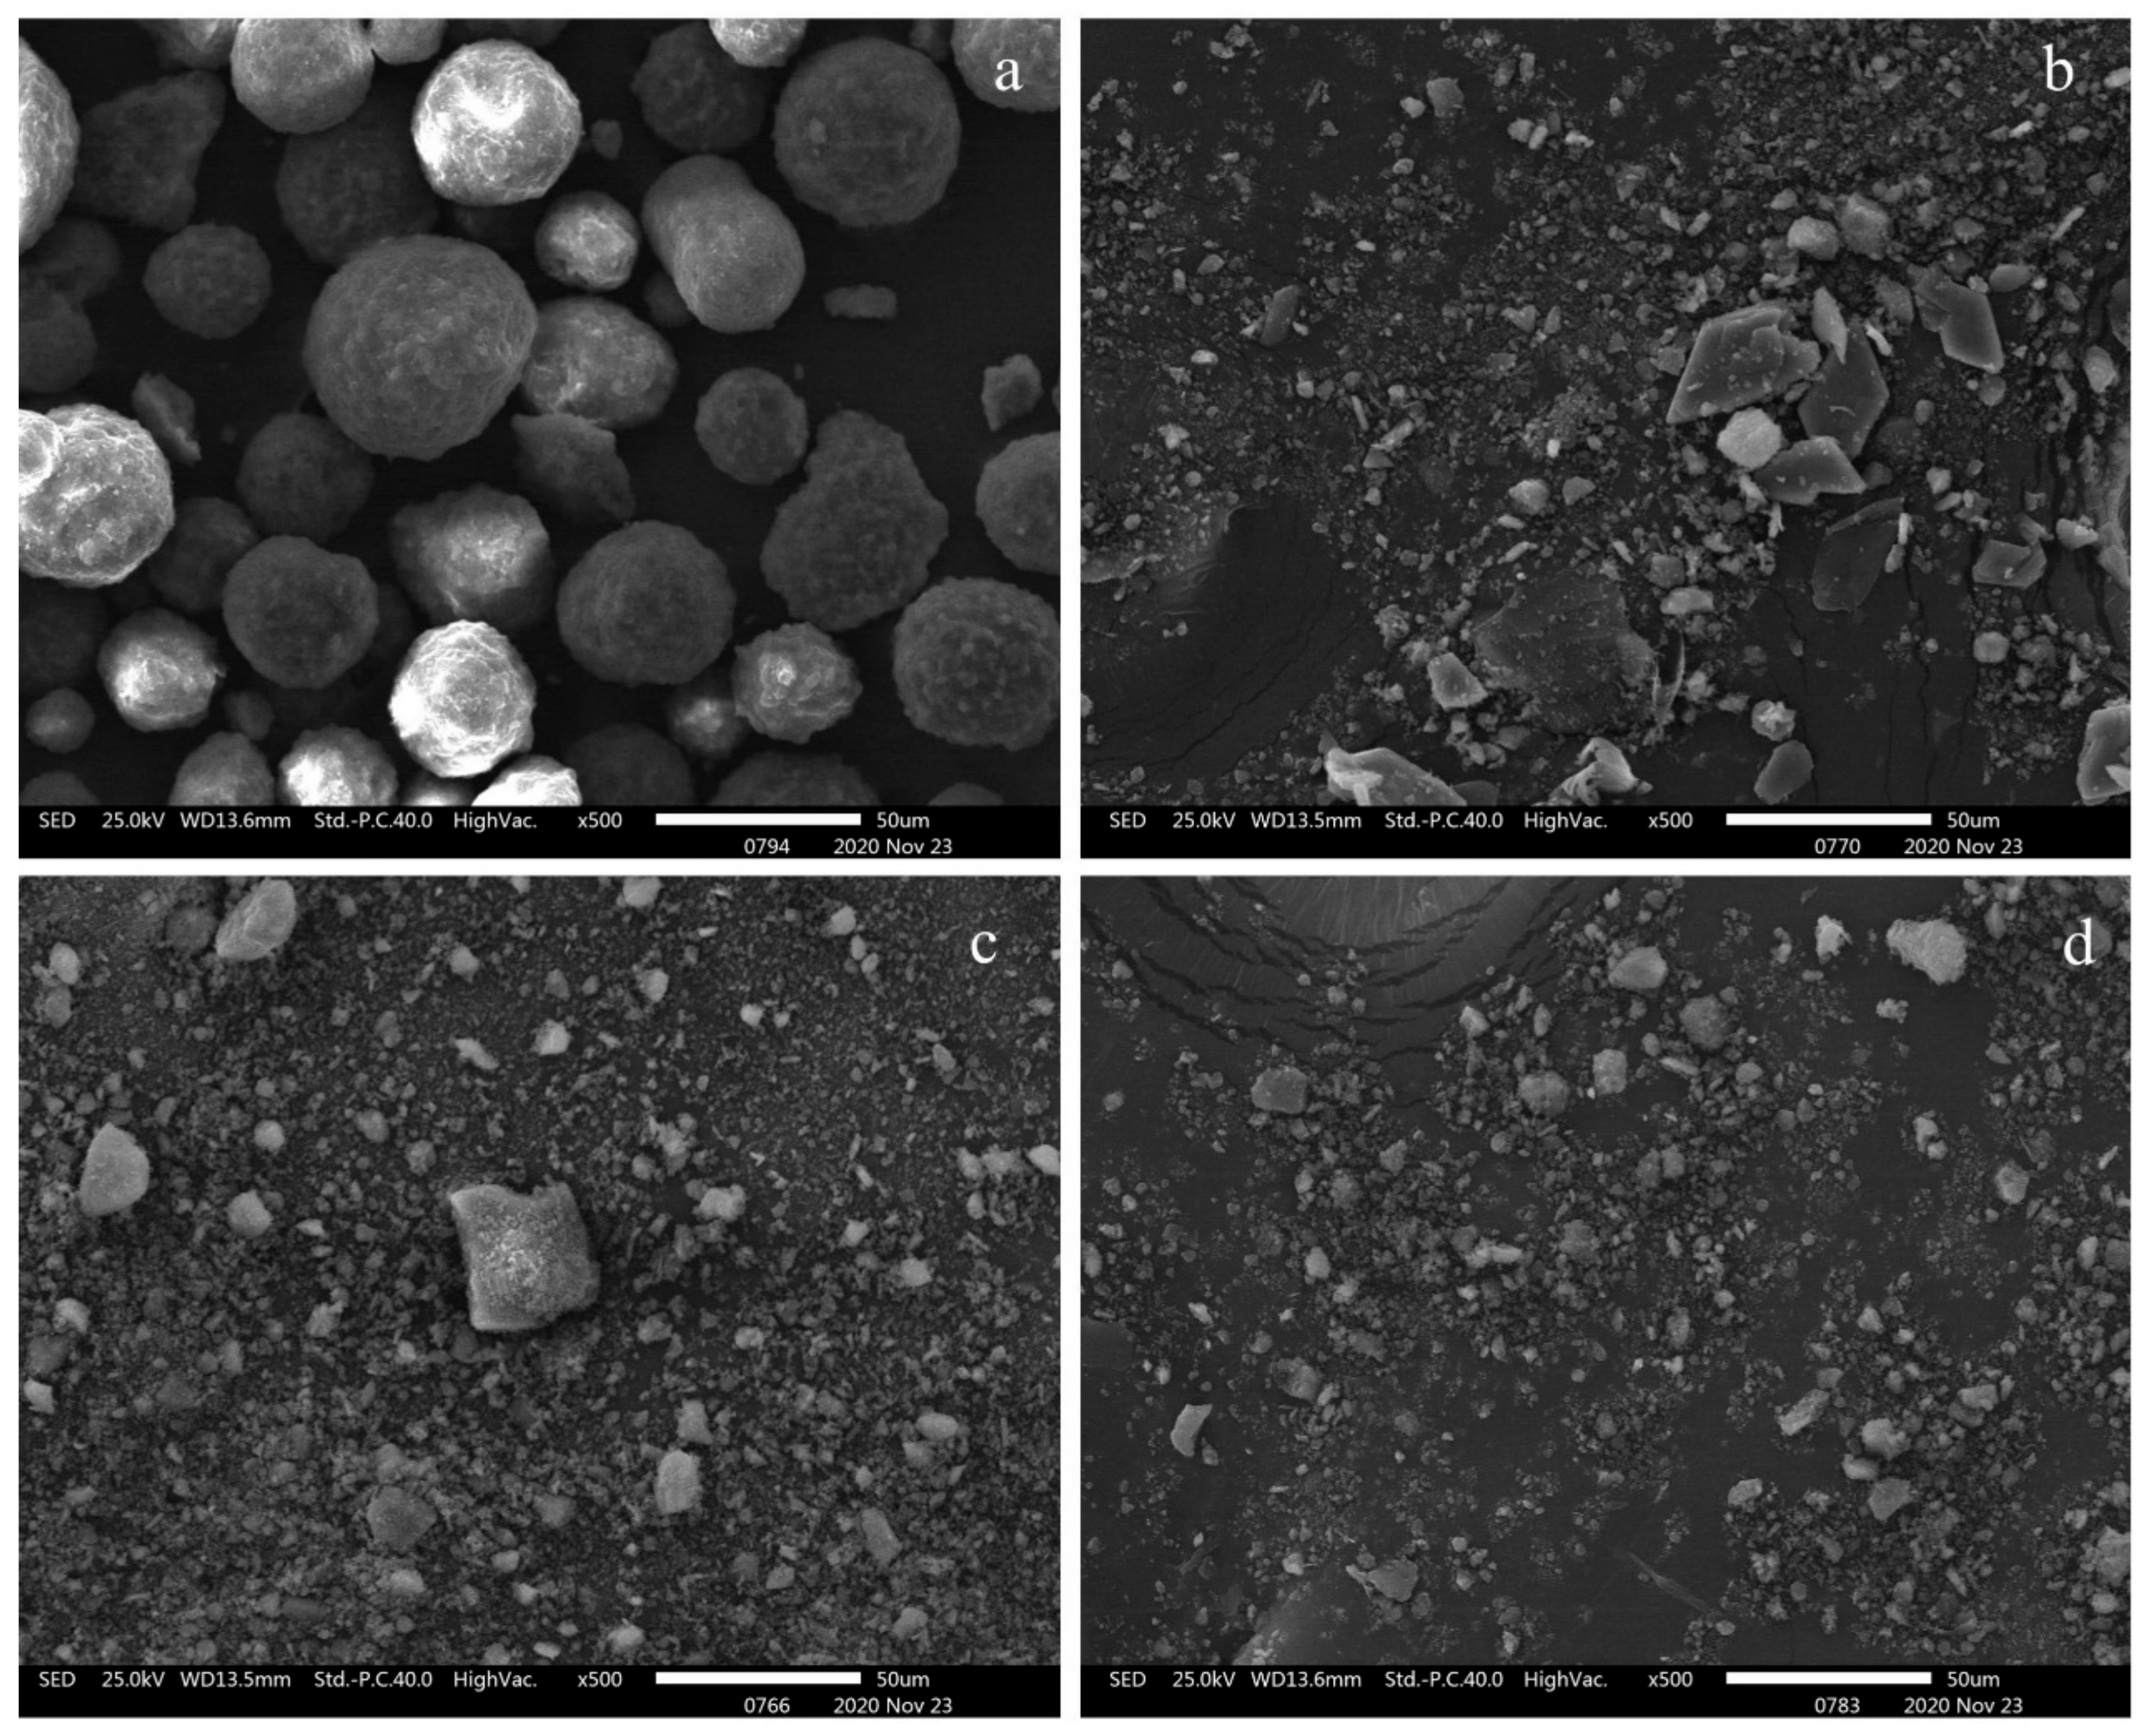
| Sample | Specific Surface Area (m2/g) | Average Grain Size (nm) |
|---|---|---|
| Fresh FCC catalyst | 51.34 | 20.10 |
| Spent FCC catalyst | 34.86 | 24.23 |
| Conventional leaching residue | 58.91 | 18.48 |
| Conventional leaching with H2O2 leaching residue | 72.45 | 13.56 |
| Microwave-assisted with H2O2 leaching residue | 83.33 | 7.47 |
Publisher’s Note: MDPI stays neutral with regard to jurisdictional claims in published maps and institutional affiliations. |
© 2022 by the authors. Licensee MDPI, Basel, Switzerland. This article is an open access article distributed under the terms and conditions of the Creative Commons Attribution (CC BY) license (https://creativecommons.org/licenses/by/4.0/).
Share and Cite
Zheng, D.; Zhang, Y.; Liu, T.; Huang, J.; Cai, Z.; Zhang, R. Research on Leaching of V and Ni in Spent FCC Catalyst Using Oxalic Acid/H2O2 under Microwave-Assisted Conditions. Minerals 2022, 12, 834. https://doi.org/10.3390/min12070834
Zheng D, Zhang Y, Liu T, Huang J, Cai Z, Zhang R. Research on Leaching of V and Ni in Spent FCC Catalyst Using Oxalic Acid/H2O2 under Microwave-Assisted Conditions. Minerals. 2022; 12(7):834. https://doi.org/10.3390/min12070834
Chicago/Turabian StyleZheng, Dalong, Yimin Zhang, Tao Liu, Jing Huang, Zhenlei Cai, and Ruobing Zhang. 2022. "Research on Leaching of V and Ni in Spent FCC Catalyst Using Oxalic Acid/H2O2 under Microwave-Assisted Conditions" Minerals 12, no. 7: 834. https://doi.org/10.3390/min12070834
APA StyleZheng, D., Zhang, Y., Liu, T., Huang, J., Cai, Z., & Zhang, R. (2022). Research on Leaching of V and Ni in Spent FCC Catalyst Using Oxalic Acid/H2O2 under Microwave-Assisted Conditions. Minerals, 12(7), 834. https://doi.org/10.3390/min12070834