Article

Effects of Coal Rank and Macerals on the Structure Characteristics of Coal-Based Graphene Materials from Anthracite in Qinshui Coalfield

1
College of Geoscience and Surveying Engineering, China University of Mining and Technology (Beijing), D11, Xueyuan Road, Haidian District, Beijing 100083, China
2
Shanxi Institute of Geology and Mineral Resources Compmany Limited, No. 3, Dongling Lane, Qingnian Road, Yingze District, Taiyuan 030000, China
*
Author to whom correspondence should be addressed.
Minerals 2022, 12(5), 588; https://doi.org/10.3390/min12050588
Submission received: 9 April 2022 / Revised: 2 May 2022 / Accepted: 4 May 2022 / Published: 6 May 2022

Abstract

:
Thirteen raw coal samples from Qinshui coalfield were prepared to produce coal-based graphene, and the raw coal, coal-based graphite, and coal-based graphene sheets (GS) were characterized by X-ray diffraction (XRD), Raman spectroscopy, scanning electron microscopy with energy dispersive spectrometer (SEM-EDS), and high-resolution transmission electron microscopy (HRTEM). The results show that the graphitization degree of coal-based graphite is positively linearly correlated with the reflectance of raw coal, has a low positive correlation with the content of inertinite, and has a low positive correlation with the content of vitrinite in raw coal. The crystallite width (La) and crystallite height (Lc) of coal-based graphite and graphene are positively linearly correlated with the reflectance of raw coal. La and Lc of coal-based graphite are distributed in 17.591–48.374 nm and 11.359–23.023 nm, respectively. After redox, La and Lc of coal-based graphene are distributed in 4.405 nm–6.243 nm and 0.804–1.144 nm, respectively. The defect degree (ID/IG) of coal-based graphene is higher than that of raw coal, demineralized coal, and coal-based graphite. The coal-based graphene is thin and transparent, and only contained carbon and oxygen. Combined with the parameters of XRD and HRTEM, it is calculated that the interlayer spacing (d002) of Qinshui-coal-based graphene is about 0.4007 nm and the number of layers (Nave) is about 5.

1. Introduction

Graphene has excellent physical [1] and electrochemical [2] properties, and its prospects for application are considerable. In recent years, graphene and its derivatives have been widely used in nano electronic devices [3], biomedicine [4], composites [5], and cell imaging [6]. At present, the main carbon sources for industrial production of these materials are graphite [7], methane [8], and acetylene [9], with high cost. As a cheap and abundant carbon source, coal is rich in polycyclic aromatic organic compounds [10] and sp2 hybrid carbon [11], which is an ideal carbon raw material for the preparation of graphene.
The molecular structure of coal is mainly composed of polycyclic aromatic hydrocarbons (PAHs), or alkyl substituted aromatic hydrocarbons, with similar structure and different sizes [12], and is also known as the aromatic core of coal [13], which is an aromatic cluster composed of benzene rings, hydrogenated aromatic rings, aliphatic rings, and other heterocyclics [14]. The composition of PAHs in coal has been studied for a long time [15,16,17]; the small and almost planar PAHs in coals have a graphene-like structure. Scholars have discussed the influence of different factors (coal rank, sedimentary environment, element content difference, etc.) on the PAHs of coal [18,19]. The metamorphism of coal is a chemical change process of carbon enrichment, dehydrogenation, and deoxidation, accompanied by the changes of physical–chemical properties, such as porosity and density [20,21], and the alkyl side chains and functional groups with weak bond energy are cracked successively. The formation of basic structural units (BSUs) in the late coalification is the main mechanism of coal graphitization [22]; during the coal-to-graphite transition, the aromatic lattices become increasingly linear and oriented, forming oriented domains of limited sizes [23]. With the progress of aromatization and aromatic ring condensation, the order degree of BSUs in coal is continuously enhanced, and finally it evolves into graphite with a three-dimensional crystal structure [23,24,25].
The arrangement of PAHs in coals dominates the preferred orientation changes of coal structure and determines the sizes and crosslinking degree of aromatic layers in coals [26,27,28]. Most of the adjacent aromatic layers in coal are stacked in a lower order, presenting a vortex-graphene-like structure [29], and the interlayer spacing between vortex layers (>0.342 nm) is greater than that of crystalline graphite (generally 0.335 nm) [30]. After high-temperature heat treatment, the arrangement of coal structure will change to a more orderly trend, which is similar to the change of coal structure under natural metamorphism [31,32]. Combined with the characteristics that anthracite can be transformed into graphite at a temperature above 2000 °C [26,33], it can be speculated that coal-based GS and its derivatives with different sizes and average number of coal-based graphene layers (Nave) can be obtained by using mature preparation technology according to the occurrence and distribution characteristics of graphene microcrystalline structure in different coals. Based on these, coal structure is often modified by means of high temperatures [33,34], strong acids, and strong oxidation [35] in the laboratory to extract and prepare coal-based fullerene [36,37,38], carbon nanotubes (CNTs) [39,40], graphene oxides (GOs) [35,41], GS [42,43,44,45,46,47], and graphene quantum dots (GQDs) [48,49,50].
Coal-based graphene is usually prepared by redox [51,52] and chemical vapor deposition (CVD) [53,54]. The original structure and structural evolution of coal are important factors affecting the characteristics of coal-based graphene. It has been found that coal rank and the graphitization degree of coal determine the structure and properties of coal-based graphene [32,42,55]. There are many impurities in the raw coal, the minerals in the coal may destroy the integrity of the aromatic layer during graphitization [32,56,57], and the raw coal can be demineralized or purified into carbon source gas before coal-based graphene preparation. In addition, the special structure of macerals in coal will affect the characteristics of thermal evolution of coal structure [58,59], which is another important factor affecting the characteristics of coal-based graphene [60]. At present, the research on coal-based graphene is becoming more and more diversified. For bituminous coal with high activity, the electrochemical method can be considered to prepare coal-based graphene [61]. Sierra et al. prepared graphene oxides (GOs) from coal tar, studied its structural characteristics, and expanded the raw materials of coal-based nano carbon materials [62]. However, as raw materials, the structure and properties of coal are significantly affected by the metamorphism degree and composition of coal. At present, the detailed study of the effect of coal reflectance on coal-based graphene needs to be further studied, and the properties and formation mechanisms of coal-based graphene from macerals need to be revealed. In addition, the questions of how to improve the yield of coal-based graphene and promote the application of coal-based graphene are also difficult problems.
The Qinshui coalfield is located between Taiyue Mountain and the middle and south section of Taihang Mountain in the southeast of Shanxi Province. It is one of the richest coalfields in North China and has the largest anthracite base in China. The preparation of carbon materials such as coal-based graphene is conducive to the comprehensive utilization of coal resources. Therefore, taking thirteen coal samples from Qinshui coalfield as carbon raw materials, graphene was prepared by the redox method, and the products were characterized by spectral methods. The effects of reflectance and macerals of coal on graphitization degree were analyzed, and the graphitization degree formula of coal-based graphite was put forward. Moreover, the influence of the reflectance of coal on the structural parameters of the products during the preparation of coal-based graphene was systematically studied. It is hoped that this work can provide theoretical guidance for enriching the research of coal-based graphene and improving the added value of coal-based products.

2. Material and Methods

2.1. Material

2.1.1. Samples

The Qinshui coalfield is located in the center of North China platform. The coal bearing sequence of the Qinshui coalfield includes the Benxi (Middle Carboniferous), Taiyuan (Upper Carboniferous), and Shanxi (Lower Permian) formations [63,64]. In this study, thirteen raw coal samples with different reflectances were collected from the Qinshui coalfield and they were all bench samples, except WK-15#-KC and BZ-2#-KC, which were channel samples. The descriptions of these samples are listed in Table 1. Each coal bench sample was cut over an area about 20 cm wide and 10 cm deep by an interval of 10–30 cm for the coal seam, and each channel sample was collected and cut as a 20 cm wide and 10 cm deep channel. The coal samples collected were from 5 coal seams: the 15th, 9th, and 8th coal seams of the Carboniferous Taiyuan Formation, and the 3rd and 2nd coal seams of the Lower Permian Shanxi Formation [63].

2.1.2. Demineralization and Graphitization

In order to avoid the influence of minerals in the coal samples on the graphitization process and structural analysis of coal-based products, the samples were demineralized in advance. Samples were crushed to 200 mesh. Coal powders were treated with HCl, HF, and HNO3 successively in polytetrafluoroethylene (PTFE) beakers (soaked and stirred in 60 °C ultrapure water for 24 h) to remove minerals in the coal samples [32,46,65]. After washing (washed with ultrapure water until pH = 7) and drying (at 60 °C in vacuum oven), demineralized samples were obtained and marked with prefix D.
Coal powders were weighed to 5 g and put into a graphite crucible, heated to 1000 °C (5 °C/min) for 1 h carbonization in a graphite furnace under vacuum, then rapidly heated (20 °C/min) to 2800 °C and maintained at this temperature for 3 h under an argon atmosphere to prepare coal-based graphite [46,47,66]. The coal-based graphite obtained above were marked with prefix G.

2.1.3. Preparation of Coal-Based GS

Coal-based GO was prepared according to modified Hummers’ method [41,67,68]. A measure of 68 mL concentrated H2SO4 (mass fraction 98%) was mixed with 1.5 g NaNO3 powder into a 200 mL beaker and stirred for about 10 min until the NaNO3 was completely dissolved. A measure of 2 g of coal-based graphite was added to the beaker and the temperature was kept below 5 °C in an ice bath. After the coal-based graphite was stirred evenly, the intercalation effect of strong acid on graphite could be established by maintaining the stirring reaction for 20 minutes. A measure of 10 g KMnO4 was slowly added to the reaction system and stirring was continue for about 30 min to ensure the oxidation effect of KMnO4 on coal-based graphite. Next, after the reactants were continuously stirred in a 35 °C water bath for 3 h, 50 mL of ultrapure water was slowly added to the reaction system. Then, the temperature was turned to 98 °C, and the reactants were stirred for 20 minutes. After the beaker was taken out, about 30 mL of hydrogen peroxide (H2O2, mass fraction 30%) was added until no bubbles were generated to ensure the complete removal of KMnO4. The obtained reactants were centrifuged at the speed of 5000 r/min for 30 min, the supernatant solution was poured, the paste was washed to neutrality with ultrapure water, and dried in a vacuum-drying oven at 50 °C for 24 h to obtain coal-based GO.
The coal-based GO prepared in the previous step was ground into powder, and the coal-based GO suspension was obtained by pouring ultrapure water into a 200 mL beaker and stirring. After 5 h in ultrasonic water, the reactants were centrifuged for 20 min (7000 r/min), and the supernatant solution was transferred to a glass dish. After freezing, reactants were dried with a vacuum freeze dryer for about 12 h to obtain coal-based graphene oxide solid.
About 100 mg of coal-based graphene oxide solid and 500 mL N,N-Dimethylformamide were placed in a beaker, and the mixture was ultrasonicated for about 2 h. The reaction system was heated to 95 °C, 2 mL N2H4·H2O was added, heated in a constant temperature water bath for about 5 h, and stirred continuously. When the reactants were cooled to room temperature, they were washed to neutral with ultrapure water, and the washing solution was tested to ensure that SO42− and NO3−1 were not detected. The washed products were freeze-vacuum-dried to obtain coal-based GS. The coal-based GS above were labeled with prefix GS.

2.2. Methods

2.2.1. Basic Characteristics

The maximum reflectance of vitrinite (Ro,max, %) was determined by a Leitz Orthoplan microscope equipped with a Daytronic mainframe 9005 spectrophotometer based on ASTM Standard D 2798-11a [69]. Proximate analyses of coal were determined following ASTM Standard D3173-11 [70], ASTM Standard D3174-11 [71], ASTM Standard D3175-11 [72], and ASTM Standard D3177-02 [73], and the ultimate analysis was performed based on ASTM Standard D5373-08 [74]. Coal samples were ground to 20 mesh prepared into epoxy-bound polished pellets. The pellets were examined using reflected-light oil-immersion microscopy using a magnification of 500×. According to the morphology, structure, color, and relative reflectance of the macerals, the macerals and minerals in coals were classified and quantified with the microscope. The classification of the macerals was based on the International Committee for Coal and Organic Petrography (ICCP) System 1994 [75,76].

2.2.2. X-ray Diffraction (XRD)

The crystal structure and graphitization degree of the products were determined using a RIGAKU D/max 2500 VK/PC X-ray diffractometer under Cu K radiation at 40 kV and 100 Ma α, scanning all coal-based precursors and products with graphite monochromator. Measurements were recorded at 2θ = 10–80° at a scanning speed of 2°/min. For the XRD spectrum, the baseline correction and peak splitting were carried out by Jade software to obtain the information of peak position, peak area, full width at half-maximum (FWHM), and peak height, and then the curves were fitted by Origin software. The diameter (La) of the microcrystalline carbon and the stacking thickness (Lc) of the aromatic layers representing the microcrystalline in the c-axis direction were calculated by the Scherrer Equations (1) and (2). The average interlayers spacing (d002) and the average number of aromatic layers (Nave) were calculated by Formulas (3) and (4), respectively. The graphitization degree (G) was calculated by Formula (5) [33,77,78].
La(Å) = K1λ/(β100cos θ100)
Lc(Å) = K2λ/(β002cos θ002)
d002(Å) = λ/2sin θ002
Nave = (Lc/d002) + 1
G = (0.3440 − d002)/(0.3440 − 0.3354) × 100%
where K is the microcrystalline shape factor (K1 = 1.84, K2 = 0.94); λ is the X-ray wavelength (λ = 1.54056 Å); βhkl is the full width at half-maximum (FWHM, rad) of the diffraction peak corresponding to hkl peak; θhkl is the diffraction angle (o); and 3.440 nm is the interlayer spacing of non-graphitized carbon (Å).

2.2.3. Raman Spectroscopy

Raman spectra of the raw materials and process products were obtained from a Renishaw in Via spectrometer that utilizes an argon ion laser of 532 nm wavelength (24.3 mV) and is equipped with a 1024 Pixel CCD camera. These spectra were recorded in the range of 800 cm−1 to 3000 cm−1. Each spectrum was subjected to peak fitting with Origin software in order to resolve the curve using a Gaussian-curve-fitting module. The parameters obtained include the peak position (frequency, cm−1), FWHM, and ratio of D peak intensity to G peak intensity (ID/IG) [79].

2.2.4. Scanning Electron Microscopy (SEM)

JSM-6701F was used to observe the morphological characteristics of the products in this study. The element composition of products was analyzed qualitatively and quantitatively by SEM-EDS. The resolution of electron microscope was 1.0 nm (15 kV), the magnification range was 25 to 650,000×, and SEM images analysis software used was Photoshop.

2.2.5. High-Resolution Transmission Electron Microscope (HRTEM)

The prepared products were observed by HRTEM with TECNAI G2 F30 S-TWIN microscope equipped with computer imaging system. Under ultrasonic conditions, about 5 micrograms of the sample were diluted with ethanol, the products were deposited on the carbon film, and the ethanol was evaporated. HRTEM was operated at 200 kV–300 kV with a dot resolution of 0.20 nm and a line resolution of 0.102 nm. HRTEM images were analyzed by Photoshop and Digital Micrograph.

3. Results and Discussion

3.1. Basic Sample Properties

Results of proximate analyses, ultimate analyses, and maceral composition analyses are shown in Table 2. According to International Standard ISO-11760 [80], coals in the present study are all classified as anthracite C (high rank C). Maximum reflectance (Ro, max) of vitrinite was distributed between 2.25–2.72%. Moisture (air-dry basis) in coals was distributed between 0.86–2.50%. Ash yields were distributed between 2.09–13.34%, of which XJ-3#-M6, XJ-15#-M6, and WK-15#-M2 were classified as very low ash coal; BZ2#-M4, JSFH-15#-M6, KXYQ-15#-M5, SJZ-15#-M4 were classified as low-ash coal; and the rest were classified as medium-ash coal [80]. Sulfur contents of these coals range from 0.43–4.02%, of which KXYQ-15#-M5 and TAHX-15#-M8 were classified as high-sulfur coal (St,d ≥ 3%); KXYQ-9#-M1, XJ-15#-M6, GZ-15#-M4, JSFH-15#-M6 were classified as medium-sulfur coal (1 ≤ St,d < 3%); the rest were classified as low-sulfur coals (St,d < 1%) based on Chou [81]. The atomic ratio of H/C and O/C of the coal samples ranged from 0.353–0.523 and 0.010–0.040, respectively. The contents of vitrinite range from 44.4–82.0%, of which KXYQ-9#-M1, GZ-15#-M4, XJ-8#-M6, and WK-15#-M2 were classified as medium-vitrinite coal; JSFH-15#-M6 and SJZ-15#-M4 were classified as high-vitrinite coal; and the rest were classified as moderately high vitrinite coal based on International Standard ISO-11760 [80]. To better study the characteristics of Qinshui-coal-based graphitic products, the Lutang meta-anthracite (G-LT) from Lutang graphite mine, Hunan Province, China was selected as the comparison sample, and the data of the Lutang series products were cited from Huan et al. [46].

3.2. XRD Characterization of Products

After 2800 °C graphitization, the (002) peaks at about 26° of coal-based graphite were extremely sharp, and there were three-dimensional characteristic diffraction peaks of graphite, such as (100), (101), (004), and (110) (Figure 1). The average interlayer spacings (d002) of the prepared Qinshui-coal-based graphite were all less than the 0.3393 nm of Lutang meta-anthracite (see in Table 3), and the average value was 0.3383 nm. The d002 of G-GZ-15#-M4, G-WK-15#-M2, and G-WK-15#-KC was less than 0.3380 nm, of which the d002 of G-WK-15#-KC was the smallest, 0.3374 nm, close to the natural flake graphite at d002 = 0.3371 nm [66]. The La of the prepared Qinshui-coal-based graphite ranged from 17.591 nm–48.374 nm, larger than that of Lutang meta-anthracite (see in Table 3), which is related to the horizontal ordered arrangement of macromolecules in coal during graphitization. The Lc of Qinshui-coal-based graphite was distributed between 11.359 nm and 23.028 nm, and the Lc of G-XJ-15#-M6, G-SJZ-15#-M4, G-WK-15#-M2, and G-WK-15#-KC was more than that of Lutang meta-anthracite (see in Table 3), which indicates that the four kinds of coal-based graphite experienced strong three-dimensional ordering in the process of high-temperature graphitization, resulting in a significant increase in the degree of order and the size of BSUs, which effectively improved the aromatic structure. However, the Lc of other coal-based graphite was lower than that of Lutang meta-anthracite (see in Table 3), which may be caused by the compressive stress of the geological body during the formation of the Lutang sample. The average number of aromatic layers (Nave) was determined by the Lc and d002, and the Nave of the Qinshui-coal-based graphite is distributed between 34.54–69.22. The Nave of G-XJ-15#-M6, G-SJZ-15#-M4, G-WK-15#-M2, and G-WK-15#-KC was higher than that of Lutang meta-anthracite, while the Nave of other Qinshui-coal-based graphite was lower than that of Lutang meta-anthracite. The graphitization degree was determined by d002, which is a parameter that directly reflects the quality of coal-based graphite. It can be seen from Table 3 that the graphitization degree of all Qinshui-coal-based graphite was higher than that of the Lutang sample, distributed between 55.62% and 76.18%, and the average was 65.69%. These results show that, after 2800 °C high-temperature treatment, the d002 of aromatic layers of coal samples was significantly reduced, the degree of order was enhanced, and the graphite-like structure was increased.
As can be seen from the scatter diagrams of the relationship between graphitization degree and macerals in coal (Figure 2), the graphitization degree of coal-based graphite has a low negative correlation with the proportion of vitrinite in the reflectance range of the selected coal samples. On the contrary, there was also a low positive correlation between graphitization degree and the proportion of inertinite. As can be seen from Figure 3, the graphitization degree of coal-based graphite increased with the increase in the reflectance of bulk samples. The graphitization degree of coal-based graphite had a positive linear correlation relationship with the reflectance of raw coal; the correlation equation is graphitization degree G = 29.33Ro,max − 8.23, correlation coefficient r = 0.686. It can also be seen from Figure 3 that the trend of the graphitization degree of coal-based graphite was consistent with the trend of inertinite content of coal, and it was contrary to the change in the trend of the vitrinite content. Therefore, we used MATLAB software to study the relationship between graphitization degree and inertinite content in this reflectance range (Ro,max, 2.25–2.72%) by using the partial correlation coefficient. In MATLAB, the partial correlation coefficient R = 0.641 (P = 0.025) was obtained from code [R,P] = partialcorr (I, G, Ro,max), showing that there was an obvious positive correlation between graphitization degree and inertinite content of coal under the condition of controlling the influence of variable Ro,max. Similarly, R = −0.691 (P = 0.013) was obtained from code [R,P] = partialcorr (V, G, Ro,max), showing that there was an obvious negative correlation between graphitization degree and inertinite content of coal under the condition of controlling the influence of variable Ro,max. In the same way, R = 0.815 (P = 0.001) and R = 0.803 (P = 0.002) were calculated from code [R,P] = partialcorr (Ro,max, G, V) and [R,P] = partialcorr (Ro,max, G, I), respectively, showing that there was an obvious positive correlation between graphitization degree and Ro,max of raw coal under the condition of controlling the influence of I(%) and V(%). According to the above analysis, after demineralization, the graphitization degree of Qinshui-coal-based graphite is related to the reflectance of raw coal and the proportion of macerals in coal. After multiple regression fitting with Origin software, the graphitization degree formulas of Qinshui-coal-based graphite were G = 29.18Ro,max − 0.27V + 10.38 (R = 0.834, P = 0.001), G = 29.63Ro,max + 0.26I − 16.36 (R = 0.810, P = 0.002), and G = 28.89Ro,max − 0.43V − 0.18I + 27.80 (R = 0.818, P = 0.004).
It can be seen from Figure 4 that within the reflectance range (Ro,max, 2.25–2.72%) of the selected coal samples, the change trend La and Lc of Qinshui-coal-based graphite was consistent with the change of the graphitization degree of the coal. The La of the coal-based graphite had a larger variation range than the Lc, showing that the change of coal molecules in the vertical direction was not as significant as that in the horizontal direction during graphitization. Through the results of linear fitting in Figure 4, it was found that there was a positive linear correlation between the La and Lc of coal-based graphite and the reflectance of raw coal.
Compared with coal-based graphite (Figure 1), the (002) peak intensity of coal-based graphene decreased, the (100), (101), (004), and (110) peaks subsided, and the (002) peak also shifted from about 26° to about 24° (Figure 5 and Table 4). The FWHM of the G peak (FWHM-G) increased, and the aromatic sheets interlayer spacing d002 increased significantly, which were distributed in the 0.3594 nm–0.3749 nm range. These indicate that, after the redox reaction, the Van der Waals force between the aromatic layers was weakened, the aromatic sheets were peeled off, and ideal graphene formed in layers. The scatter diagram of La and Lc (Figure 6) showed that La and Lc increased their zigzag, and, like the coal-based graphite, the La of coal-based graphene had a larger variation range than the Lc. The crystallite sizes La and Lc were distributed from 4.405 nm–6.243 nm and 0.804 nm–1.144 nm, respectively. The average value of La (5.508 nm) of Qinshui-coal-based graphene was close to that of GS-LT, while the value of LC was generally lower than that of GS-LT, which was due to the weak vertical stacking of the Qinshui coal structure in the previous high-temperature graphitization process. Same as coal-based graphite, there was a positive linear correlation of La and Lc of coal-based graphene with the reflectance of the raw coal according to the fitting equation in Figure 6. According to the XRD parameters, the number of layers (Nave) of the Qinshui-coal-based graphene was distributed from 3–5 (less than that of GS-LT), which classified as few layers of graphene (less than 10 layers), and the Nave was significantly less than that of coal-based graphite, indicating that the stripping effect was ideal.

3.3. Raman Characterization of Products

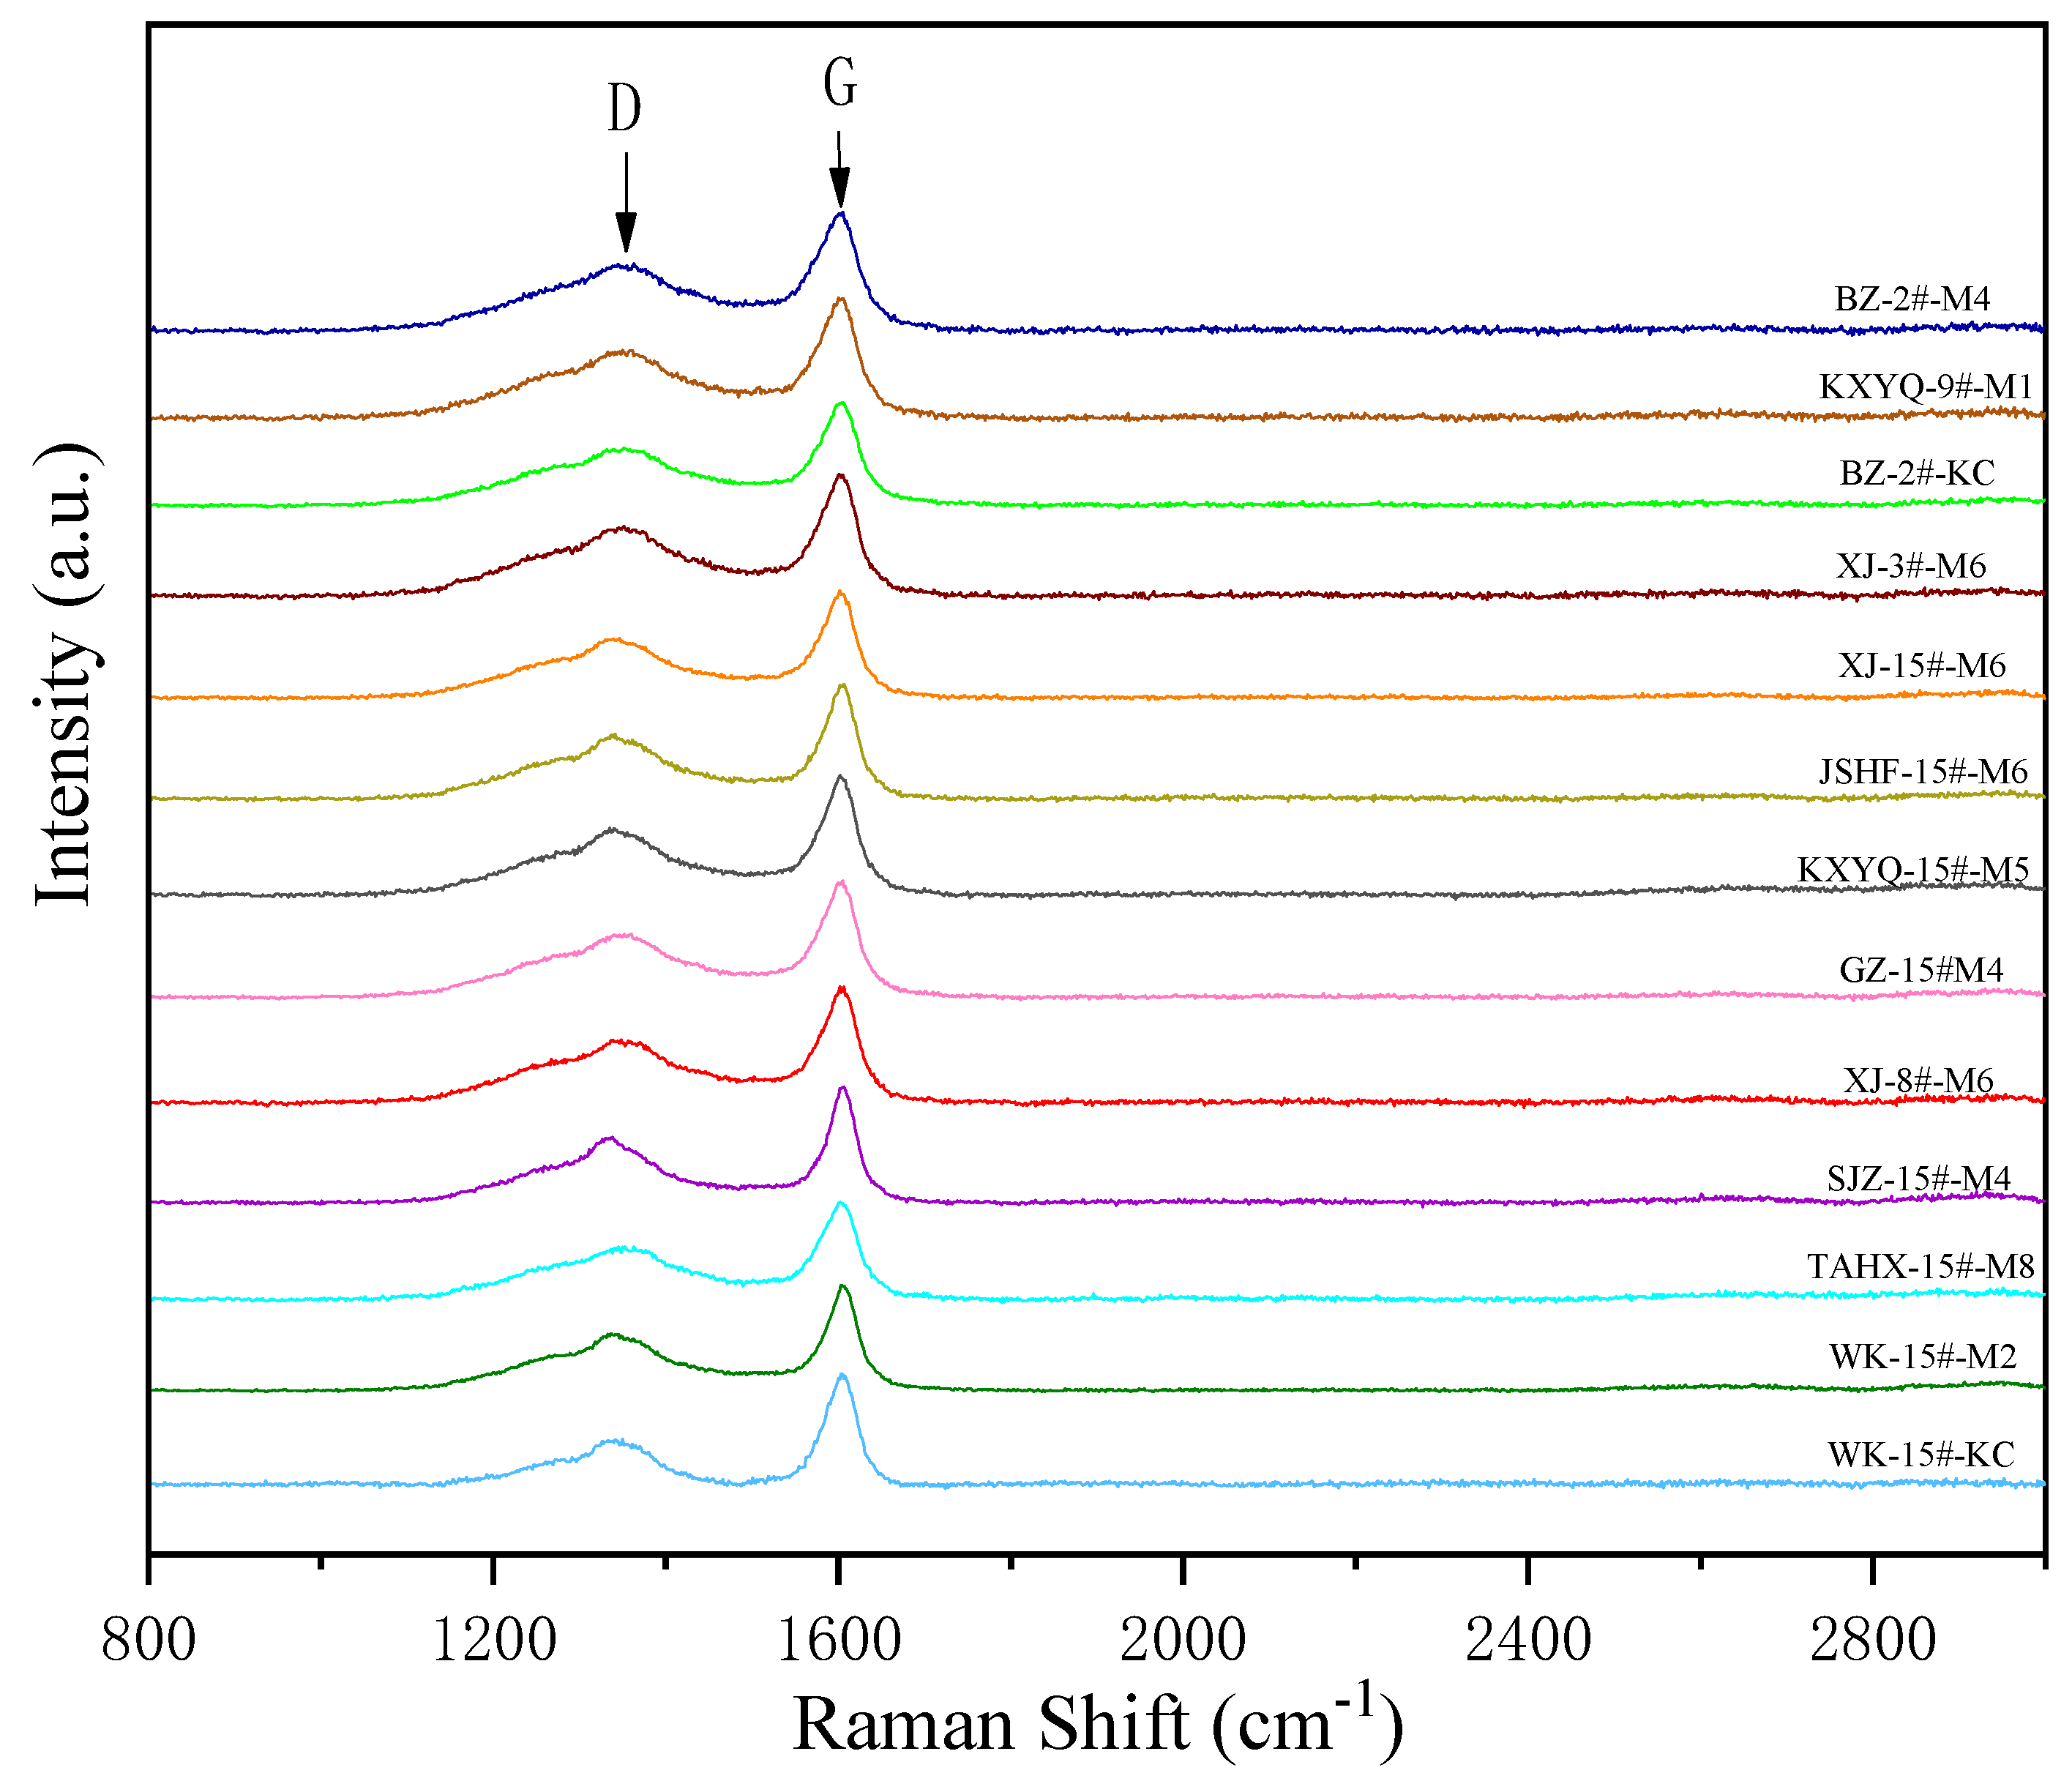
The structural changes in each phrase of coal-based graphene from coals are reflected in the Raman spectra. The G band (~1600 cm−1) corresponds to the first-order Raman scattering of the E2g mode attributed to the structural order of the graphite-like carbon. The D band (~1350 cm−1) is related to the structural defects or disorder (noncarbon atoms, vacancies, and amorphous structures, etc.) [82]. ID/IG represents the relative intensity between the D band and G band, and it can reflect the disorder degree and defect density of the sample [83,84]. The larger the ratio is, the worse the ordering structure of the carbon material is, and the more numerous the defects are [52,79].
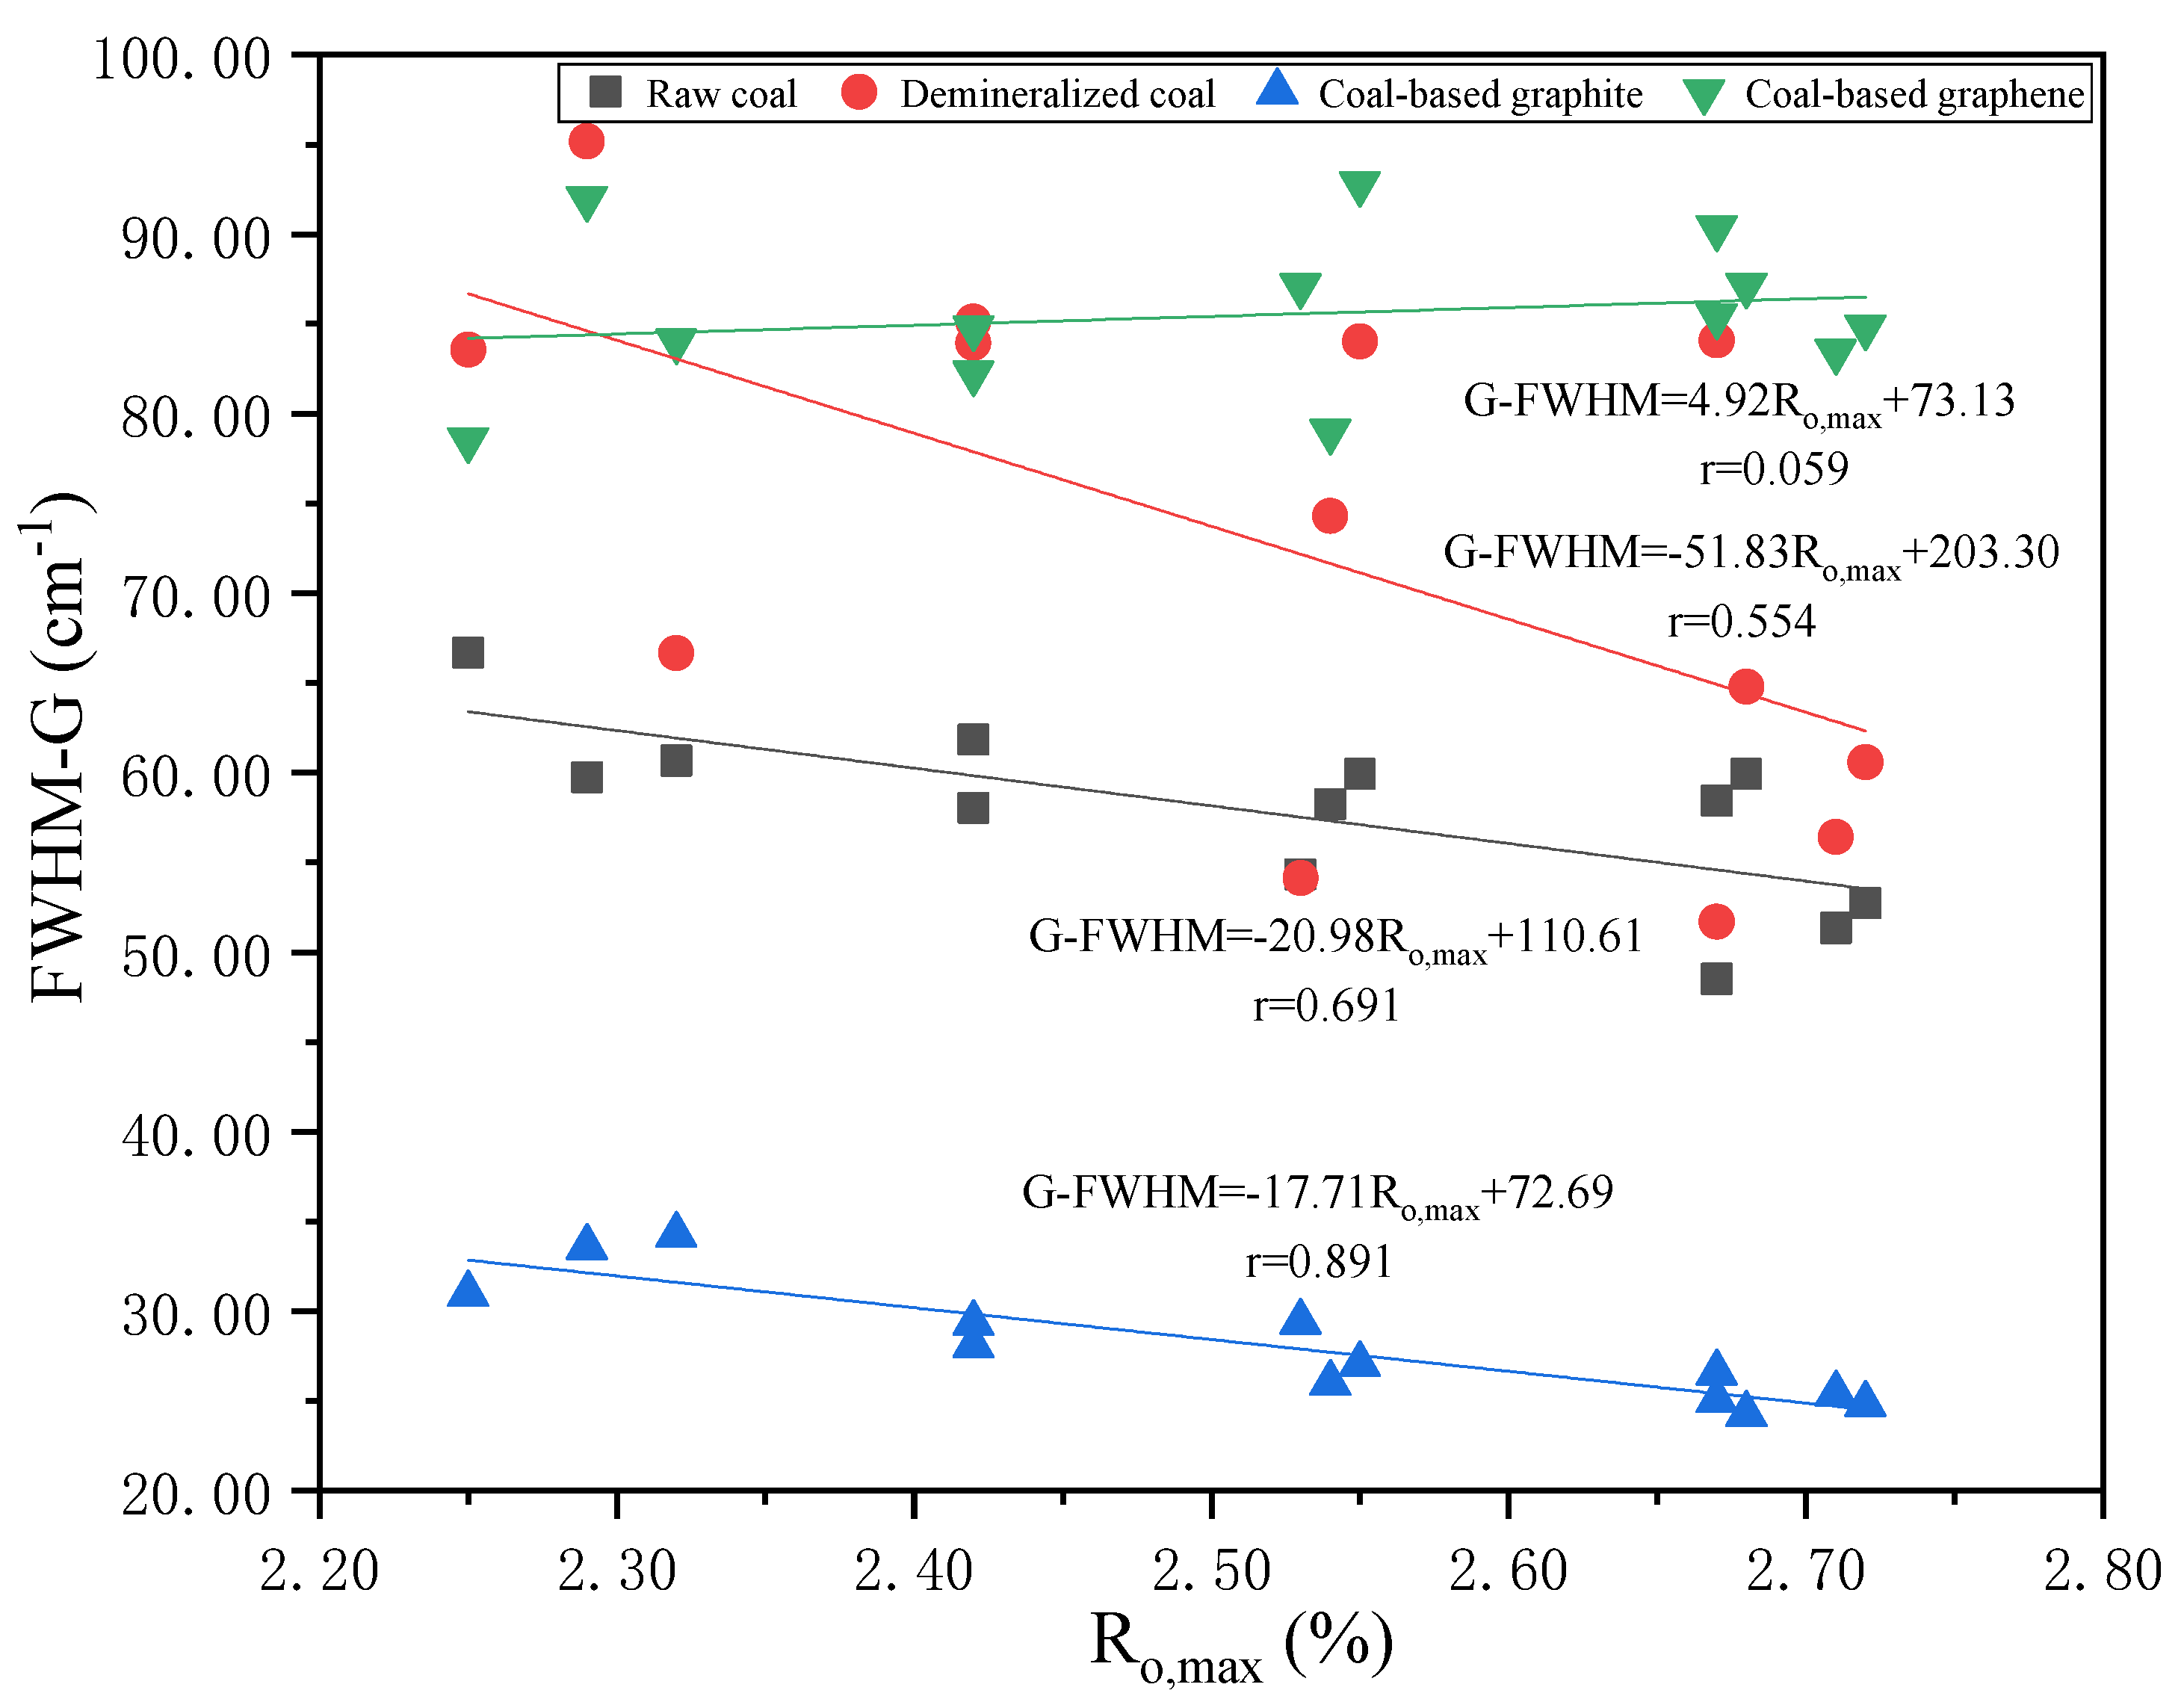
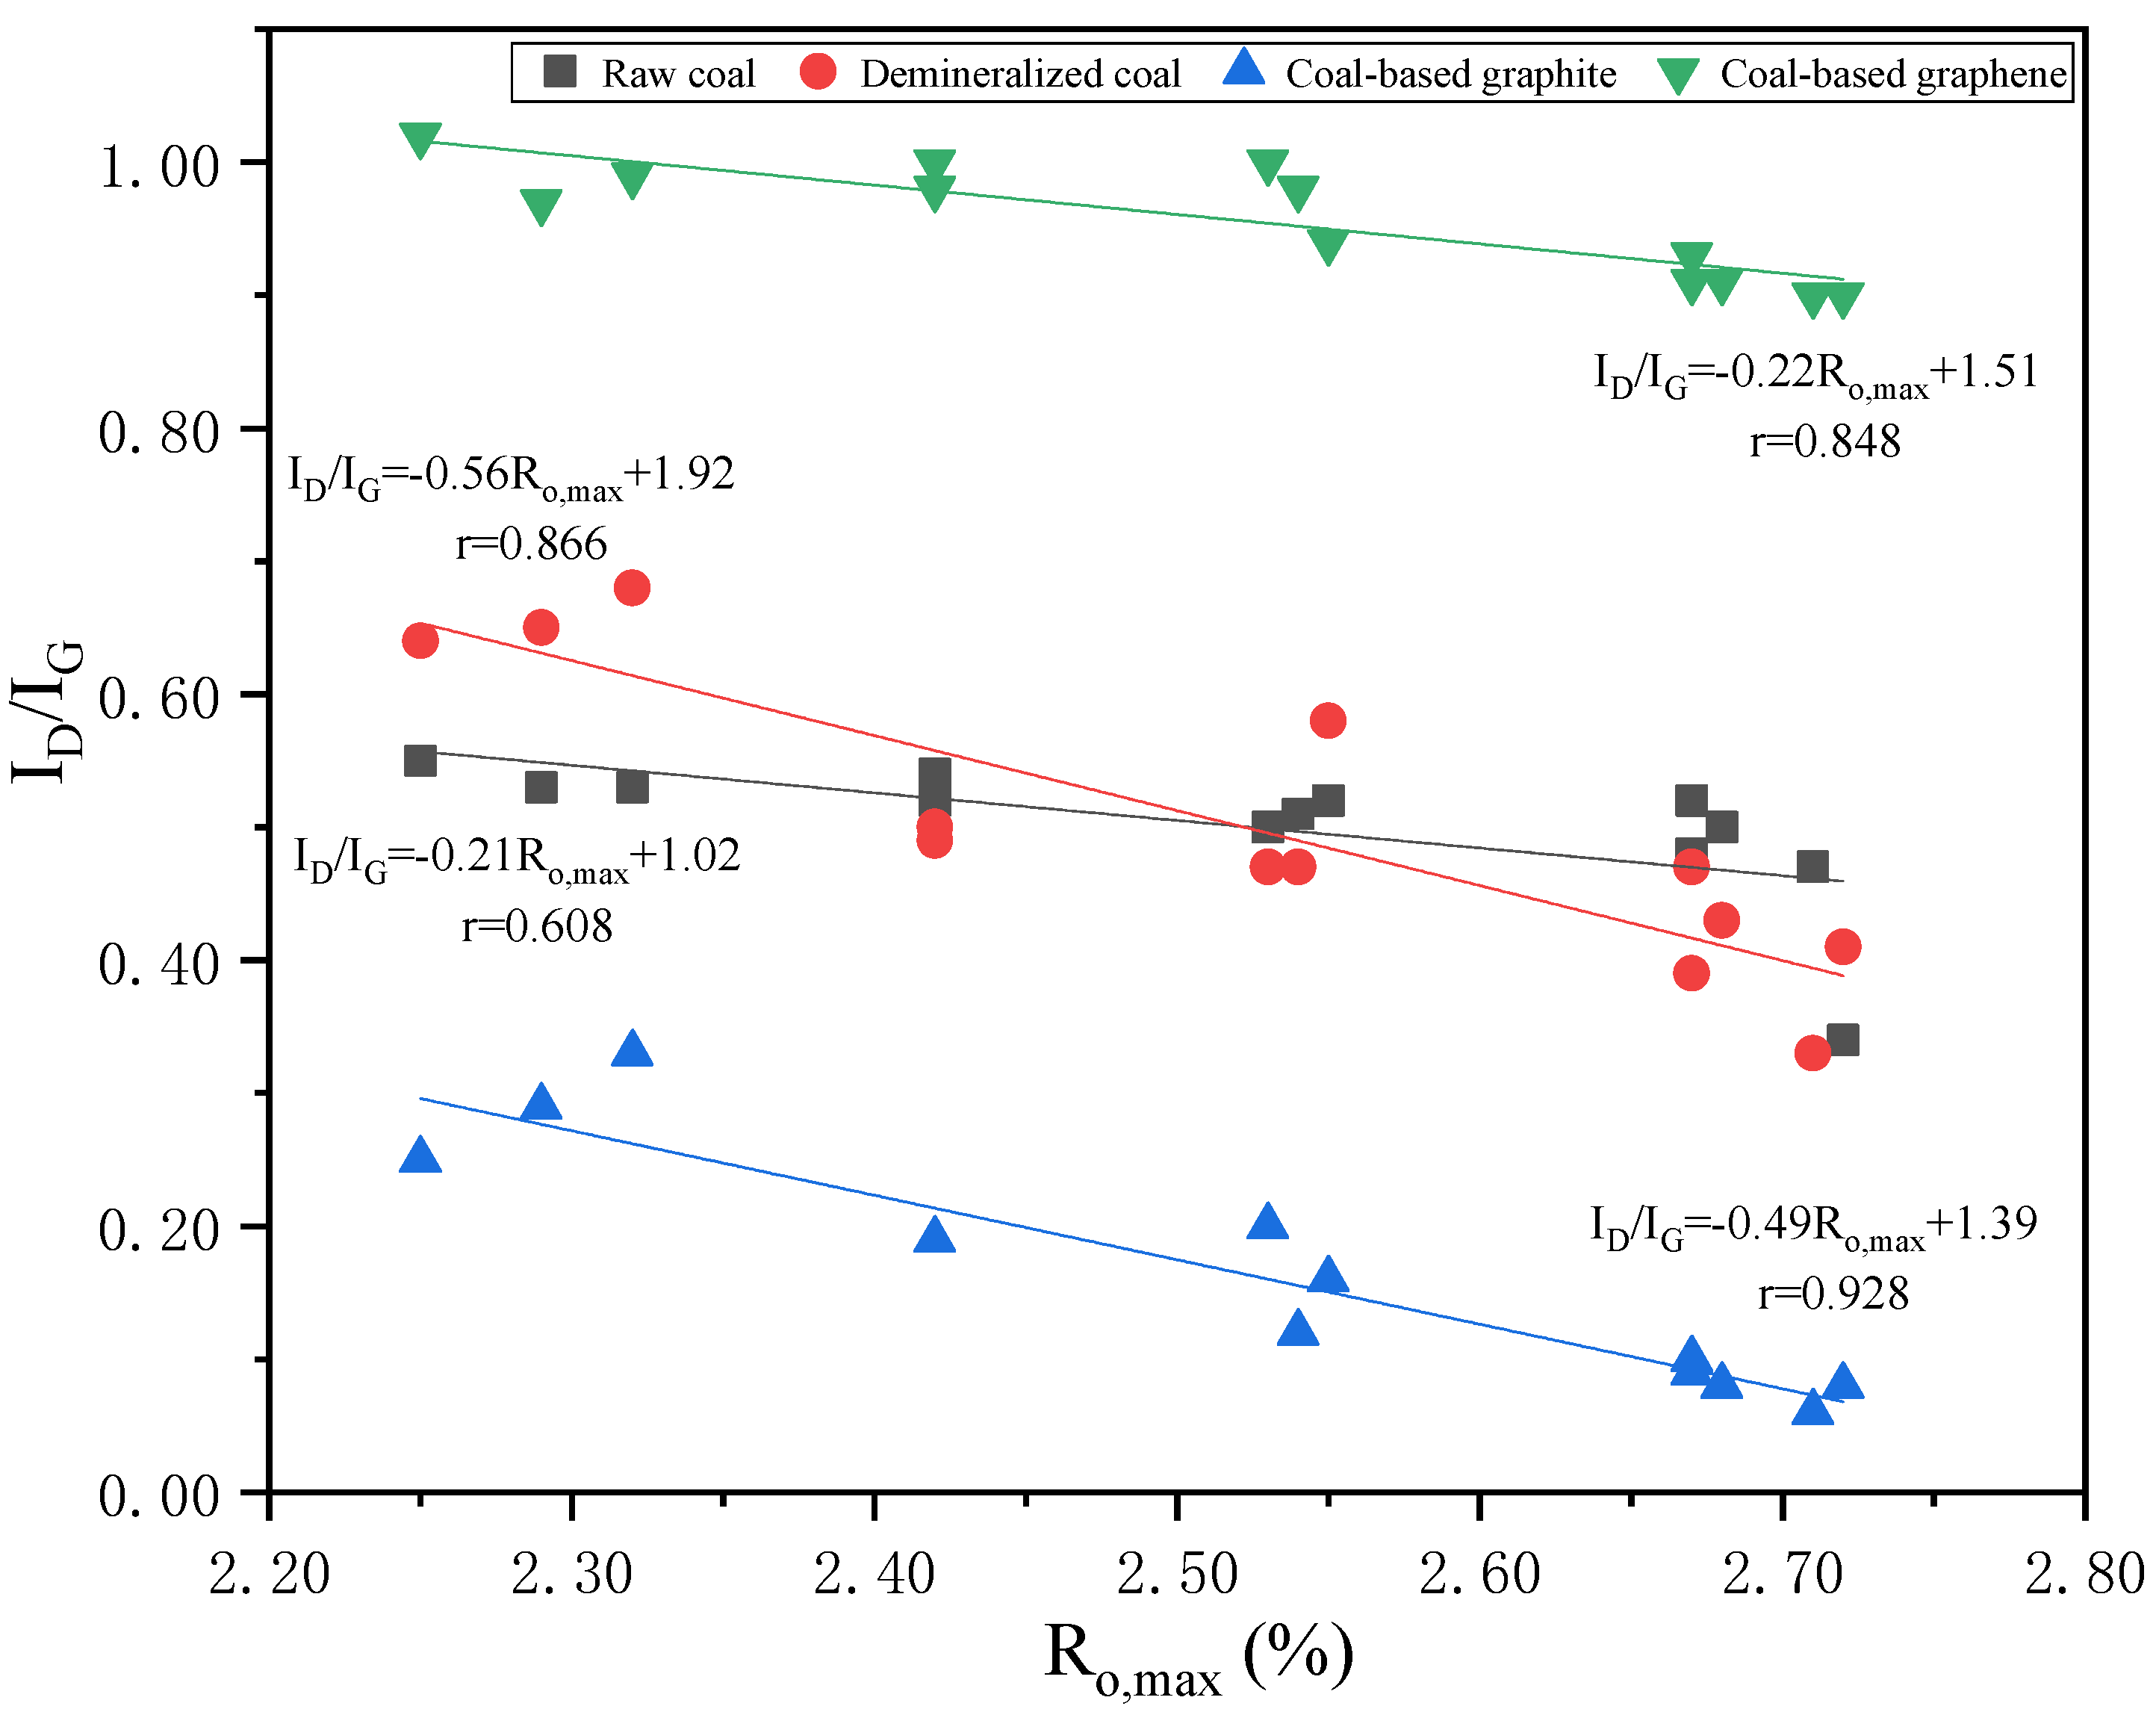
The basic Raman spectra parameters of raw coal and demineralized coal are shown in Figure 7 and Table 5, and Figure 8 and Table 6, respectively. The D band and G band of raw coal and demineralized coal were all located at around 1350 cm−1 and 1600 cm−1. The ratio of ID/IG of raw coal and demineralized coal was distributed between 0.34–0.55 and 0.33–0.68, respectively, the average values were both 0.50, showing that demineralization had no significant effect on the Raman ID/IG ratio of the samples. Therefore, it is impossible to compare the structural defects of raw coal and demineralized coal with the ratio of ID/IG. From Table 5 and Table 6, the value of FWHM-G of demineralized coal (distributed in 48.50–66.66 cm−1, average value was 57.72 cm−1) was obviously larger than that of raw coal (distributed in 51.70–95.18 cm−1, average value was 72.35 cm−1), and peak position difference between band G and band D (G-D) of raw coal (distributed in 248.80–268.06 cm−1, average value was 257.83 cm−1) was obviously larger than that of demineralized coal (distributed in 221.00–272.45 cm−1, average value was 245.91 cm−1), indicating the order of the coal molecular structure was destroyed during demineralization and the defects density increased after demineralization. In addition, for both the raw coal and the demineralized coal, the G-D of the bulk samples increased with the increase in reflectance of the raw coal (Table 5 and Table 6). It can be seen from Figure 9 and Figure 10 that both the FWHM-G and ID/IG ratio of the bulk of raw coal and the demineralized coal decreased with the increase in reflectance of raw coal, and linear fitting results showing FWHM-G and ID/IG ratio of raw coal and demineralized coal had a negative linear correlation with the reflectance of raw coal.
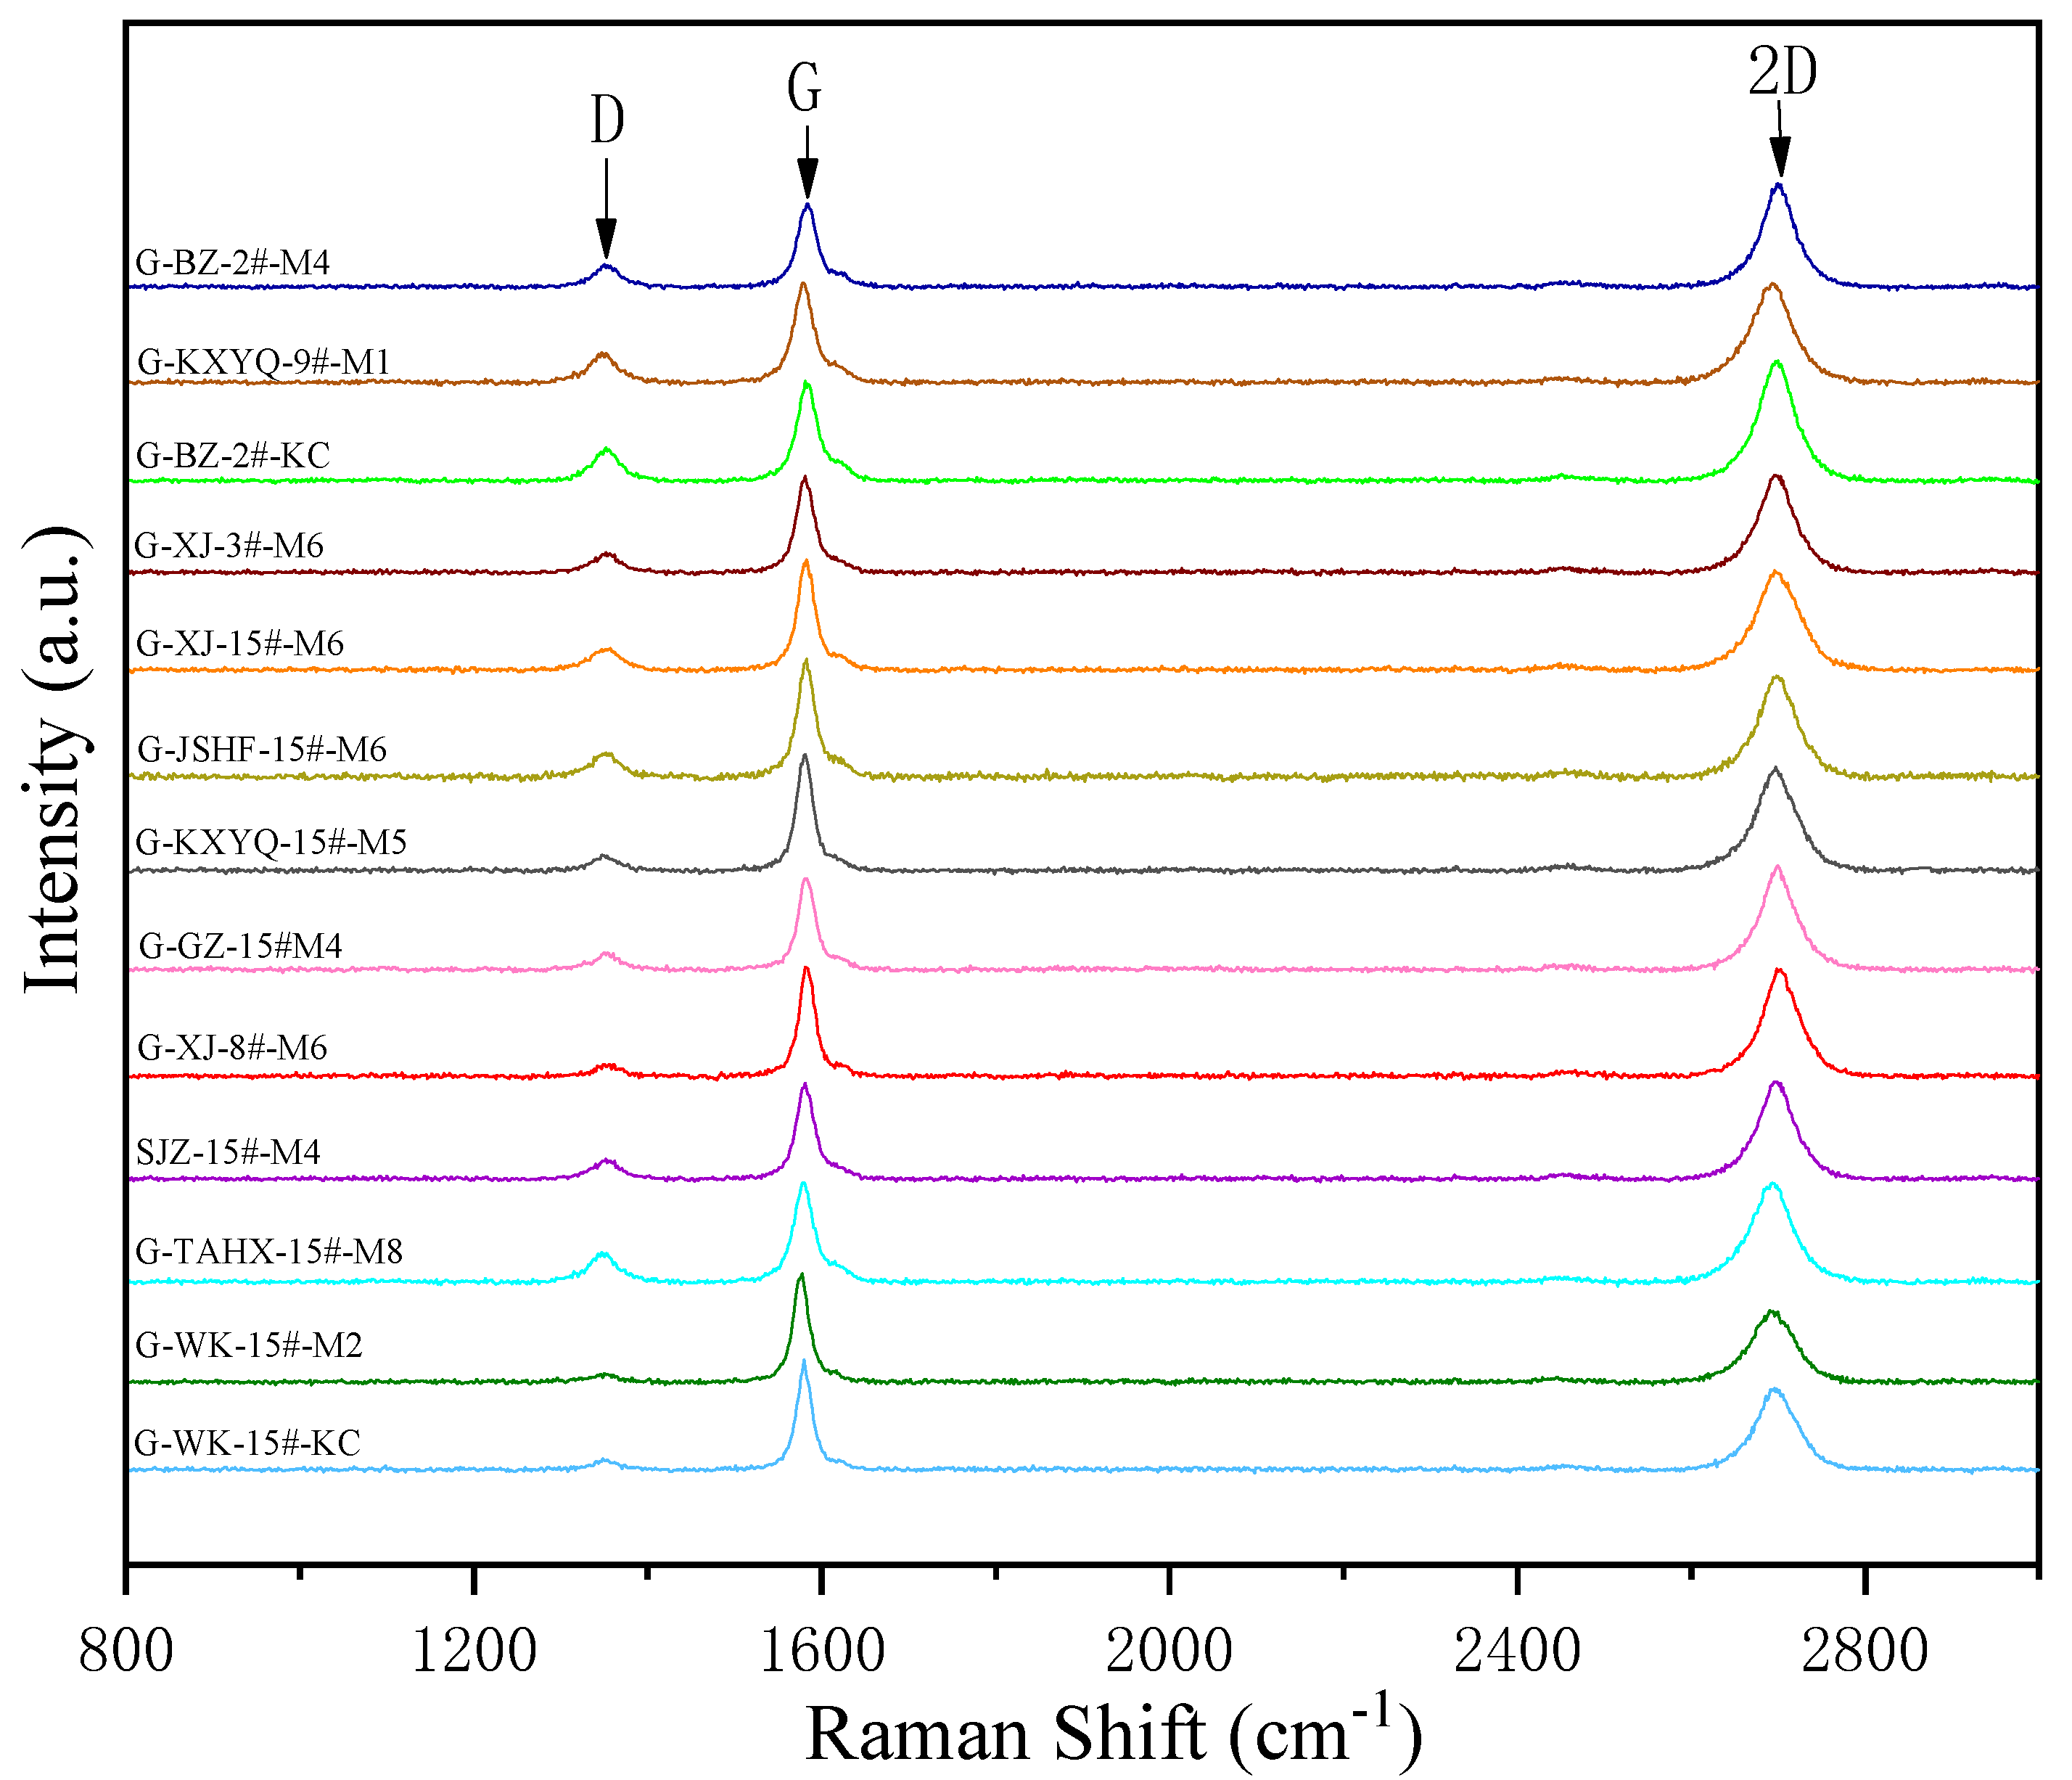
The D band of coal-based graphite shifted at ~1350 cm−1, the G band became sharper and shifted to ~1585 cm−1 (Figure 11 and Table 7). A strong 2D peak appeared at ~2700 cm−1, which was sensitive to the stacking order of the graphene-like sheets along the c-axis [85], indicating the structure in the coal transformed well into a graphite structure. The ID/IG ratio of the coal-based graphite was distributed from 0.34 nm–0.55 nm and the FWHM-G of the coal-based graphite was distributed from 24.25 cm−1–33.57 cm−1 (Figure 11 and Table 7), both of which are significantly lower than those of raw coal and demineralized coal and had a negative linear correlation with the reflectance of raw coal. The FWHM-G and ID/IG ratio of the bulk of coal-based graphite decreases with the increase in reflectance of raw coal, as see in Figure 9 and Figure 10. The distribution of G-D of coal-based graphite (223.80 cm−1–231.79 cm−1) was more uniform than that of raw coal and demineralized coal and the G-D of the bulk of coal-based graphite were significantly lower than those of raw coal and demineralized coal (Table 7). This is because the graphitization degree of the samples reached a certain degree, which made the difference in G-D for all coal-based graphite generally smaller [86]. The above results indicate that the defect degree of coal-based graphite was reduced well after graphitization.
In Figure 12, similar to raw coal and demineralized coal, there are D and G bands near 1350 cm−1 and 1600 cm−1 for coal-based graphene. Due to the peeling of graphene sheets after redox, the 2D peak representing the stacking height of graphene layers almost disappeared, while the D peak representing lattice defects increased significantly. The intensity of the G band related to sp2 carbon decreased and the FWHM-G increased significantly, and was larger than that of coal-based graphite (Figure 12 and Table 8). Differently from raw coal, demineralized coal, and coal-based graphite, there was no linear correlation between the FWHM-G of coal-based graphene and the reflectance of raw coal (Figure 9). However, similar to raw coal, demineralized coal, and coal-based graphite, there was a negative linear correlation between the ID/IG of coal-based graphene and the reflectance of raw coal (Figure 10), indicating that the ID/IG ratio of the bulk of coal-based graphene decreased with the increase in the reflectance of raw coal; the higher the reflectance of raw coal, the lower the defect degree of the coal-based graphene prepared. In addition, the ID/IG ratio of Qinshui-coal-based graphene (distributed between 0.90–1.02) (Table 8) was higher than that of coal, demineralized coal, and coal-based graphite (Figure 10), which shows that, after redox and peeling, the ordered carbon atoms on the aromatic ring were destroyed by oxidants and reductants and the structural integrity of the aromatic layers became worse.

3.4. SEM Characterization of Products

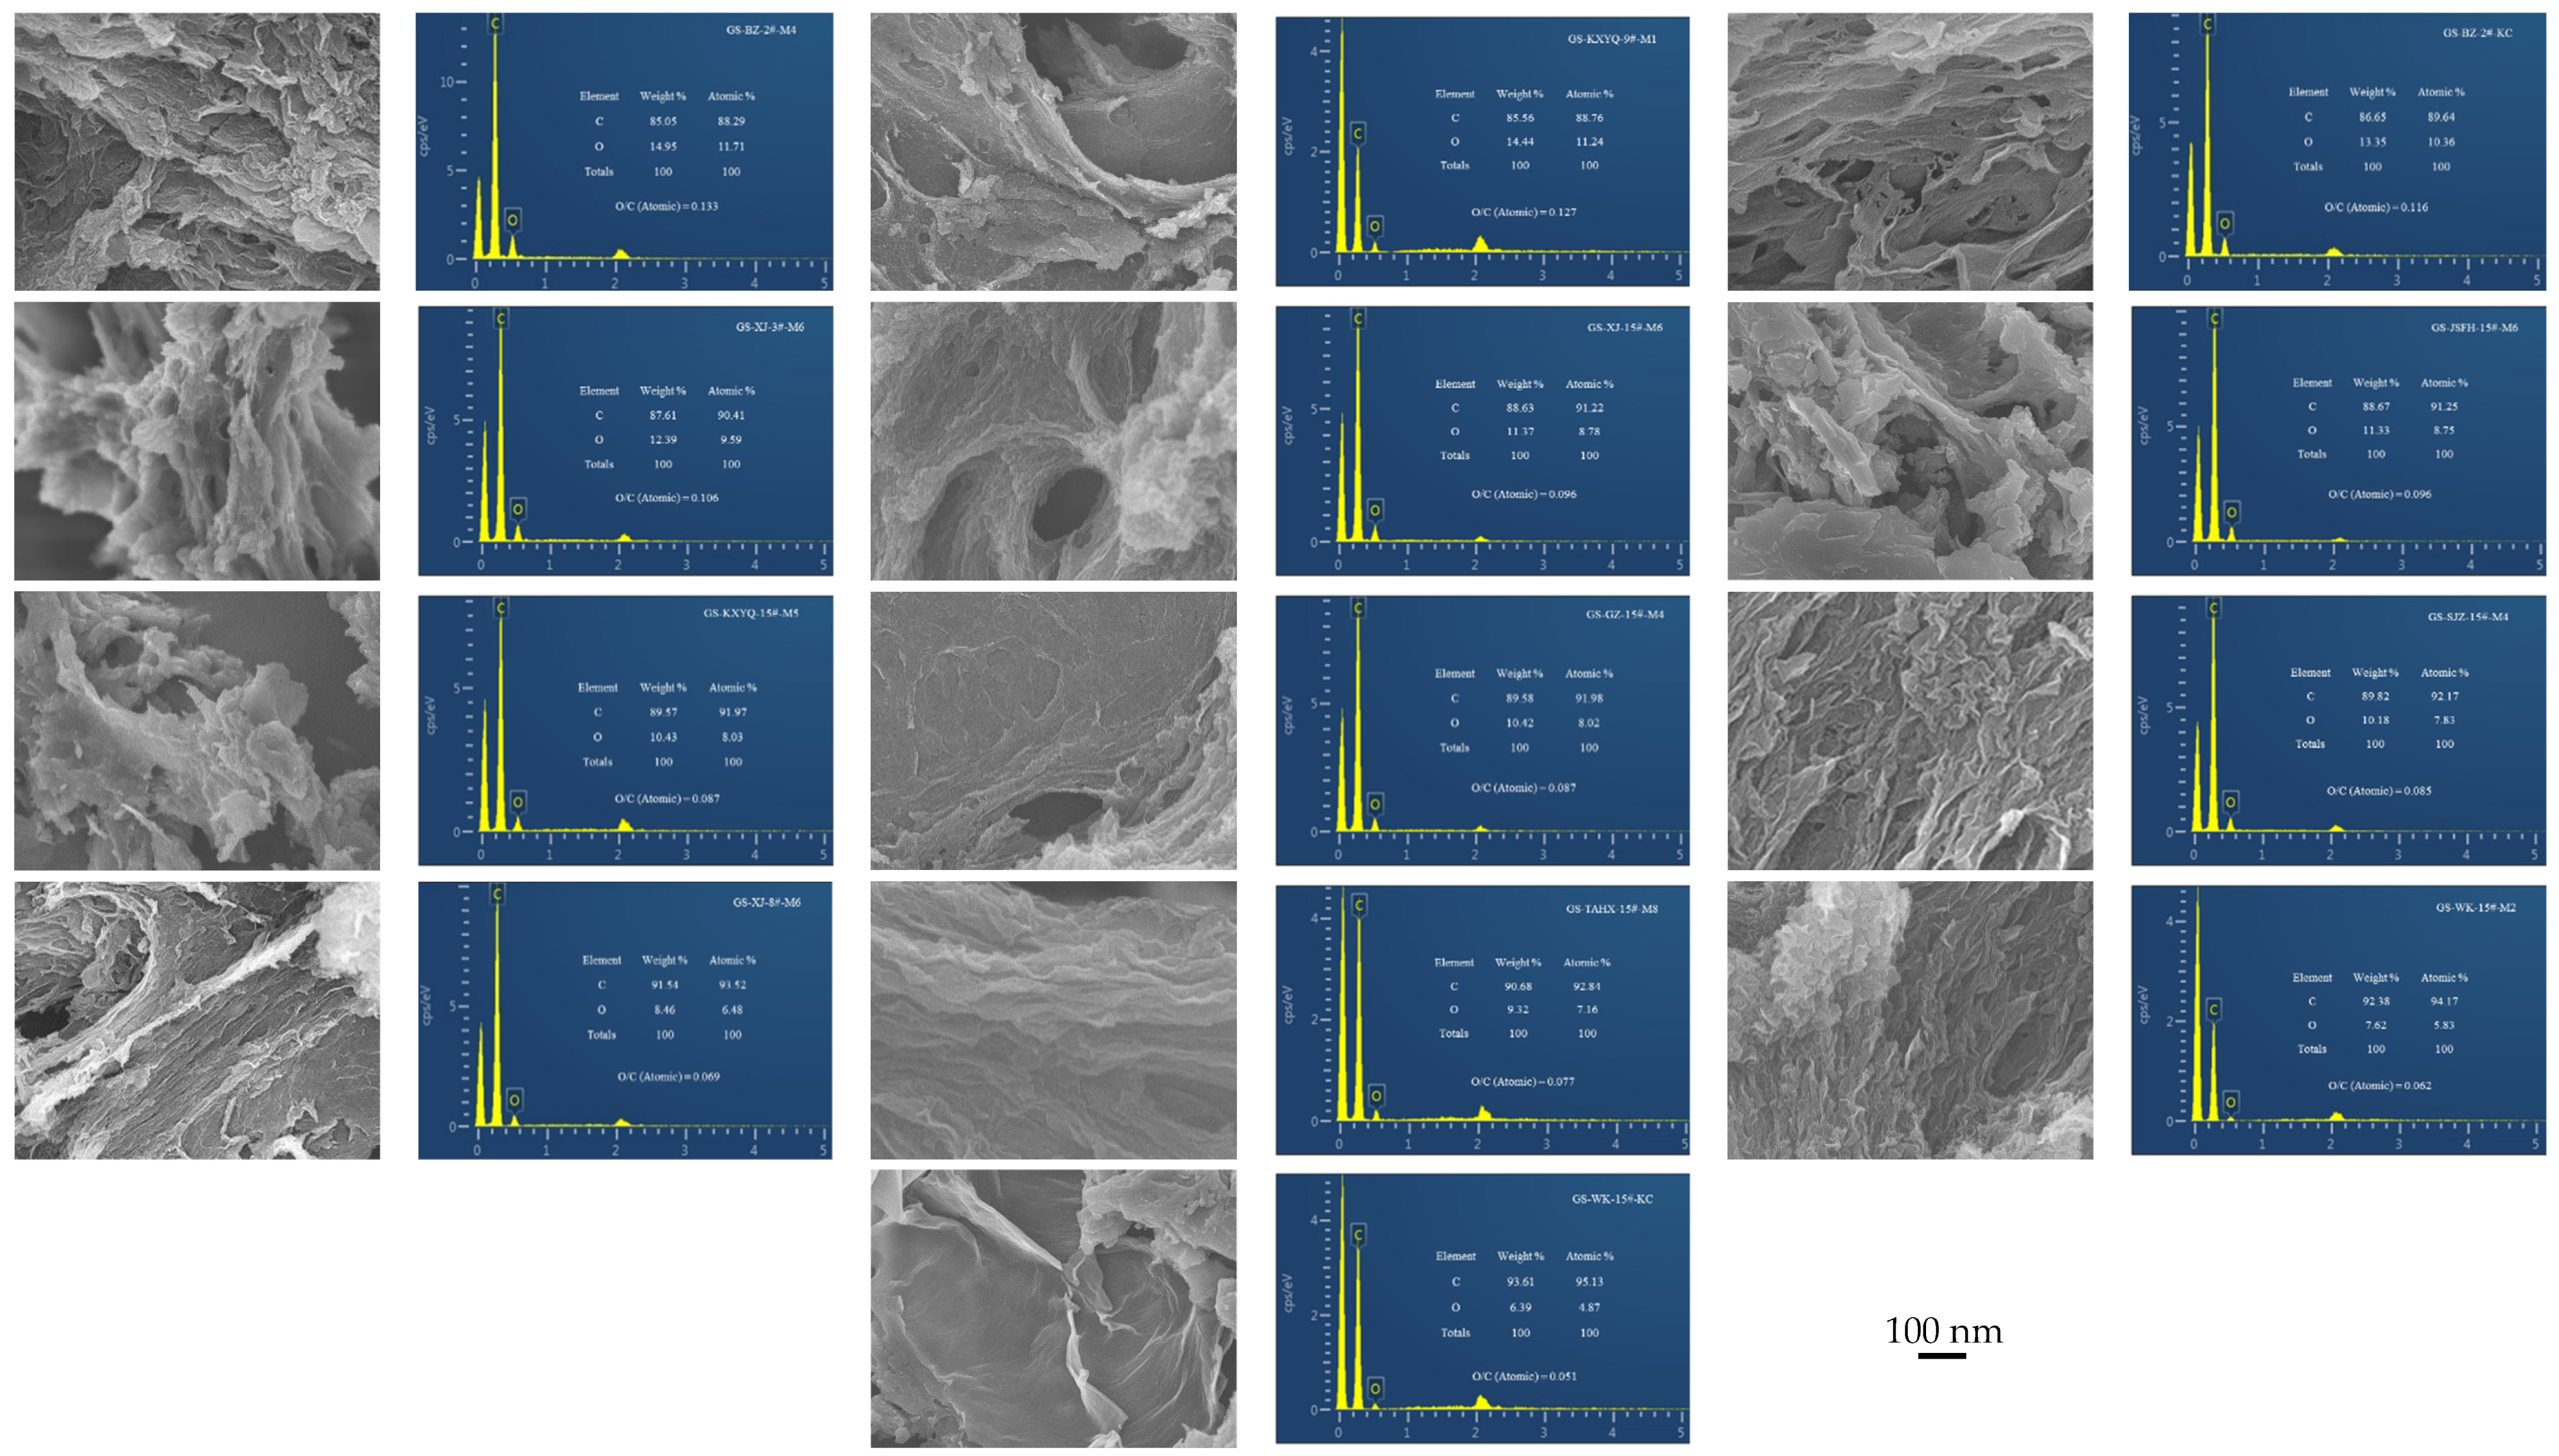
Because of its advantages of high magnification, large depth, and high resolution, the micro-morphological characteristics of samples and products can be investigated using SEM. The SEM images of the coal-based graphene (Figure 13) show that the microstructure of the coal-based graphene was a thin layer, with many curls at the edge of the lamellar and folds inside the lamellar. This was because the thin graphene layers in the natural state maintain their thermodynamic stability in the form of curls. At the same time, due to the weak electrostatic and hydrophilic interaction between the graphene layers, the face surface and the edge surface bonding and merging between the graphene layers interweave to form a three-dimensional structure of overlapping sheets, close agglomeration, and a multi-net structure, as shown in the pictures. In addition, the SEM images also show some differences in the micro-morphology of the thirteen Qinshui-coal-based graphene products. The lower the reflectance of the raw coal, the more unstable the small aromatic molecules in the coal, so that the layers of graphene from the coal with lower reflectance are destroyed, and polycondensation occurs during the preparation process. As shown in the SEM images of GS-BZ-2#-M4, GS-KXYQ-9#-M1, GS-BZ-2#-KC, and GS-XJ-3#-M6, there were more graphene layers aggregates on the surfaces with more holes, and the stripping effect of the layers was not obvious. With a higher reflectance, more stable macromolecules are present in raw coal, so that no large area of polycondensation occurs for the prepared coal-based graphene layers. As shown in the SEM images, GS-GZ-15#-M4, GS-SJZ-15#-M4, GS-XJ-8#-M6, GS-TAHX-15#-M8, GS-WK-15#-M2, and GS-WK-15#-KC were purer and smoother, with fewer holes and more obvious peeling and curling effects than the other products.
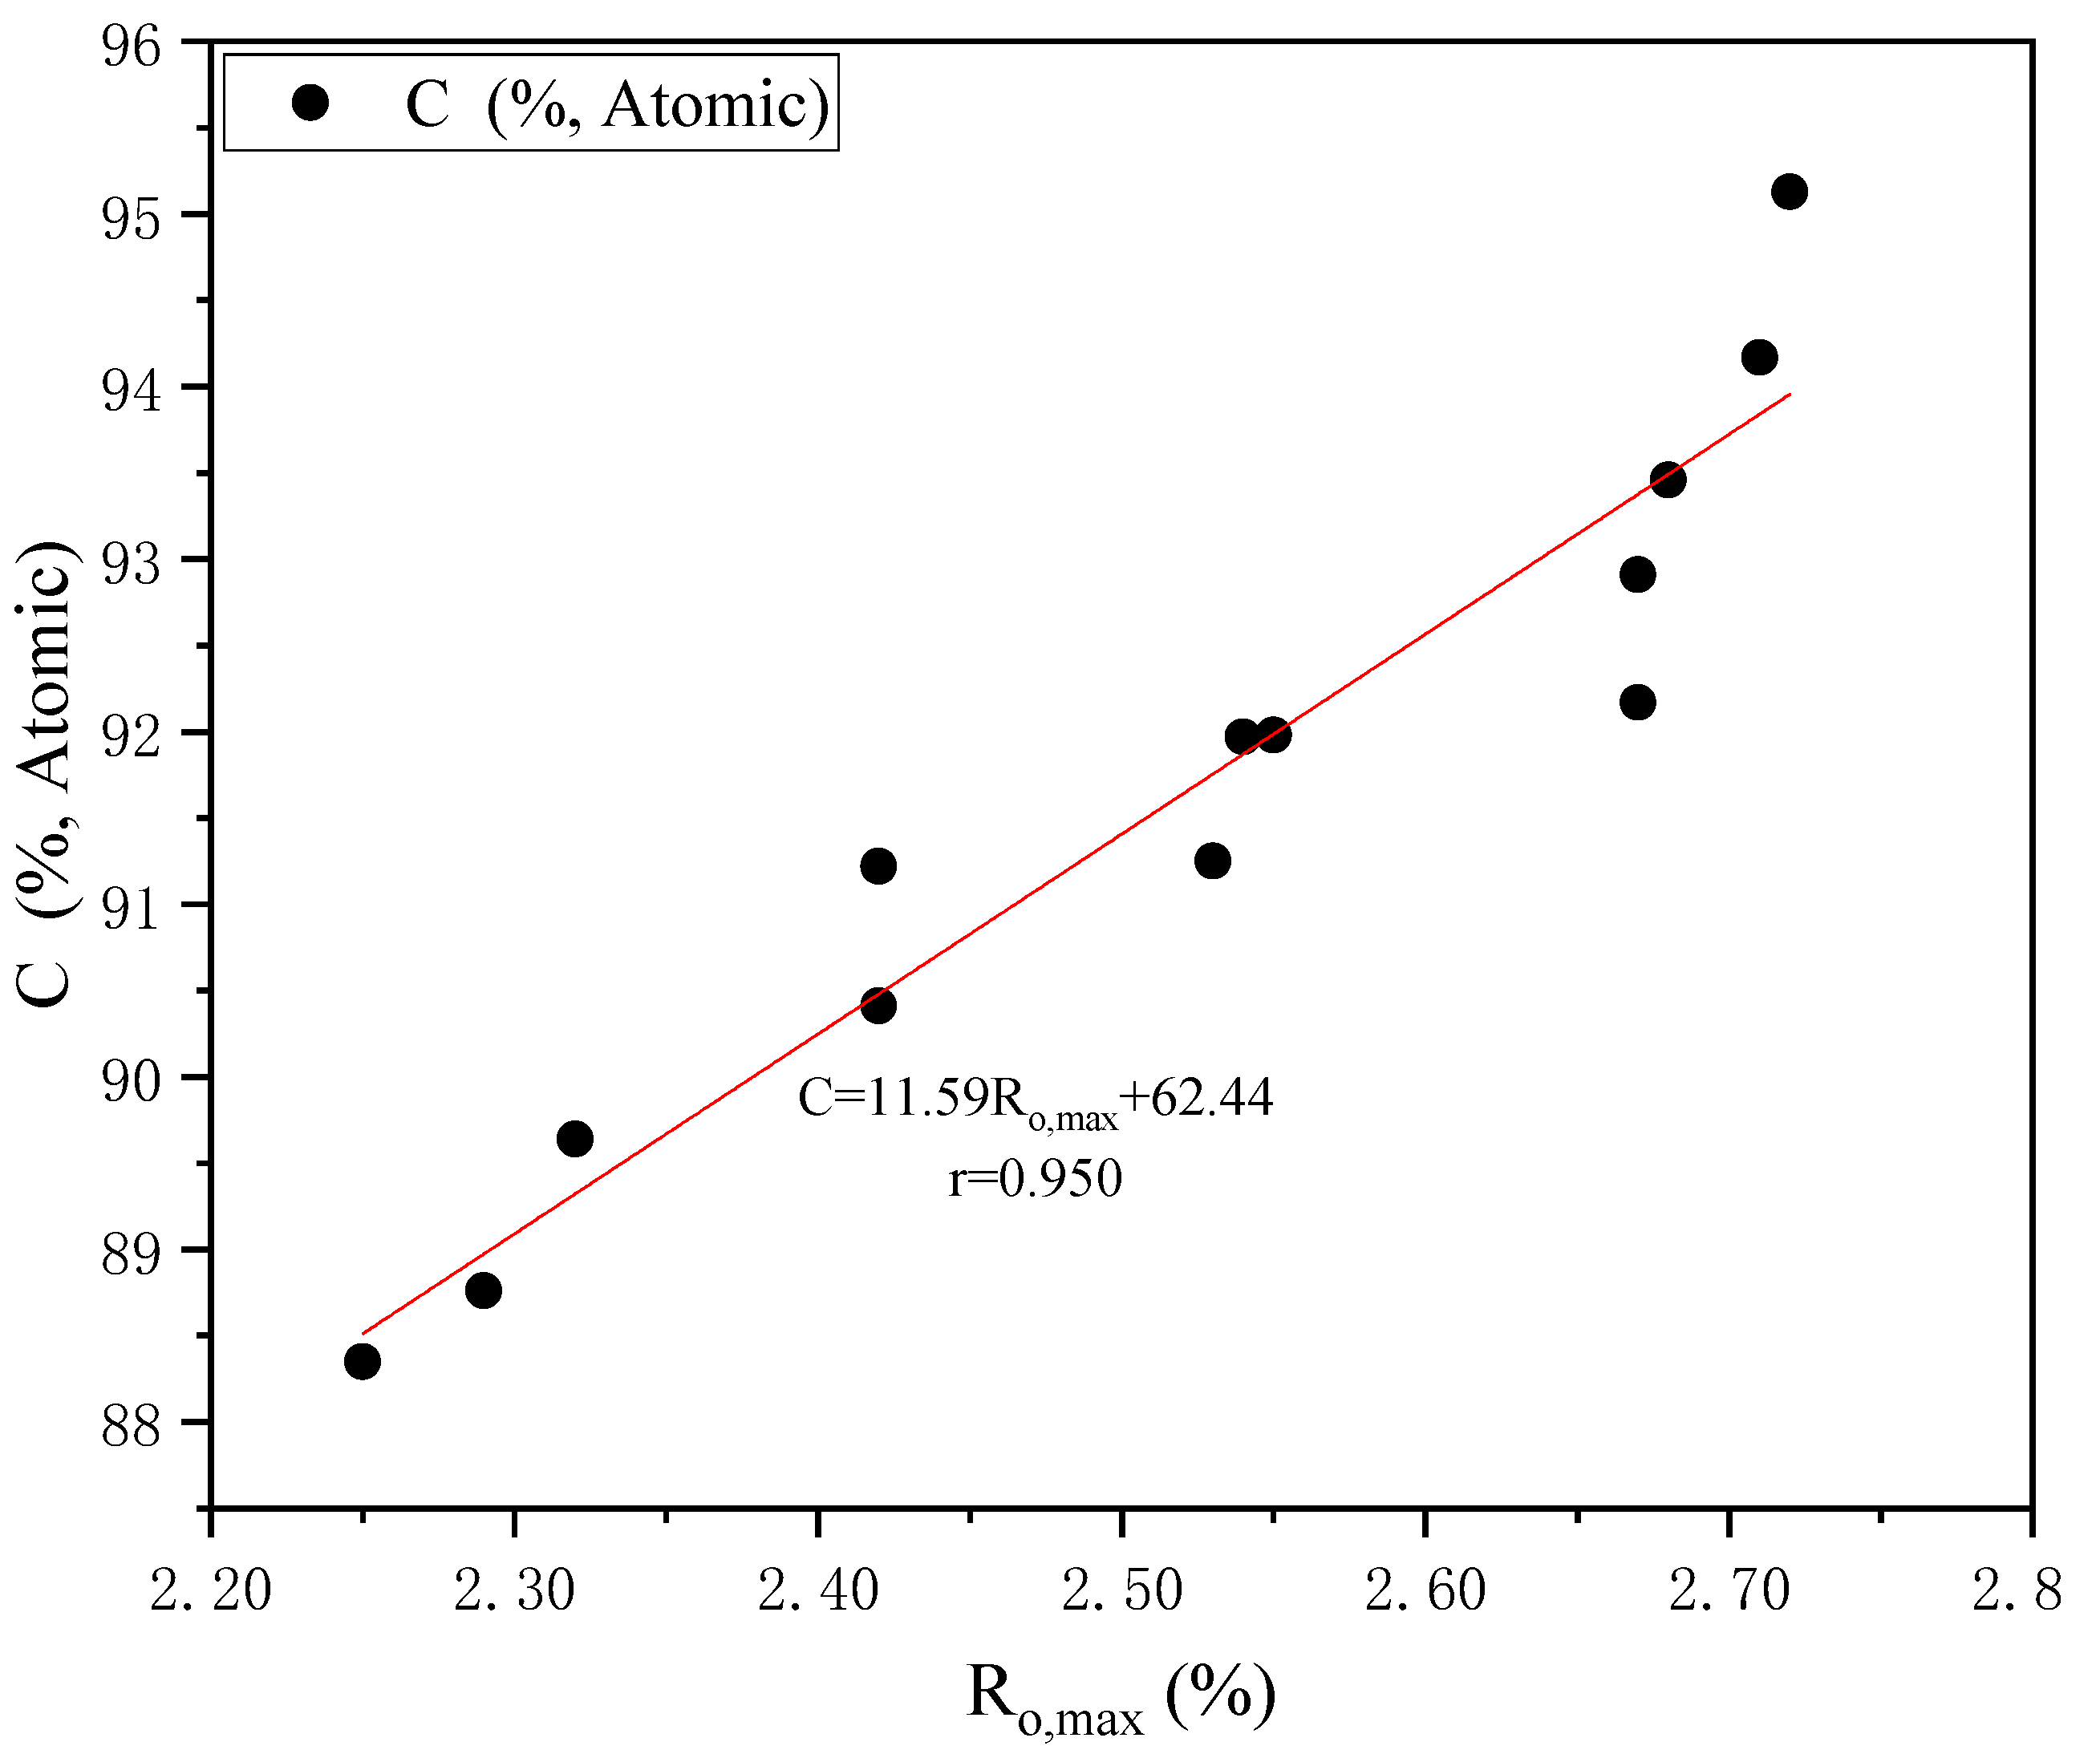
The element composition of the products can be analyzed by EDS images (Figure 13). The element compositions of all Qinshui-coal-based graphene samples were relatively simple. The Qinshui-coal-based graphene contains only two elements, carbon and oxygen, of which carbon accounts for more than 85%, both in mass ratio and atomic ratio. GS-WK-15#-KC had the highest atomic percentage of carbon elements, up to 95.17%, with an O/C atomic ratio of 0.051, while GS-BZ-2#-M4 had the lowest atomic percentage of carbon elements (88.29%), with an O/C atomic ratio of 0.133. There was an obvious positive linear correlation between the carbon content (atomic) of the coal-based graphene and the reflectance of the raw coal (Figure 14). On the contrary, there was an obvious negative linear correlation between the O/C (atomic) of the coal-based graphene and the reflectance of the raw coal (Figure 15). During the preparation process, strong oxidants entered into the molecular layers of coals under the action of strong acids; considering the polycondensation of aromatic molecular by reducing agents, the amount of added reducing agents was not enough to carry out the reduction in these oxygen-containing functional groups. Therefore, compared with raw coals, the atomic ratios of O/C of all the Qinshui-coal-based graphene samples were clearly improved, and there was a significant negative linear correlation with the reflectance of the raw coal (Figure 13 and Figure 15).

3.5. HRTEM Characterization of Products

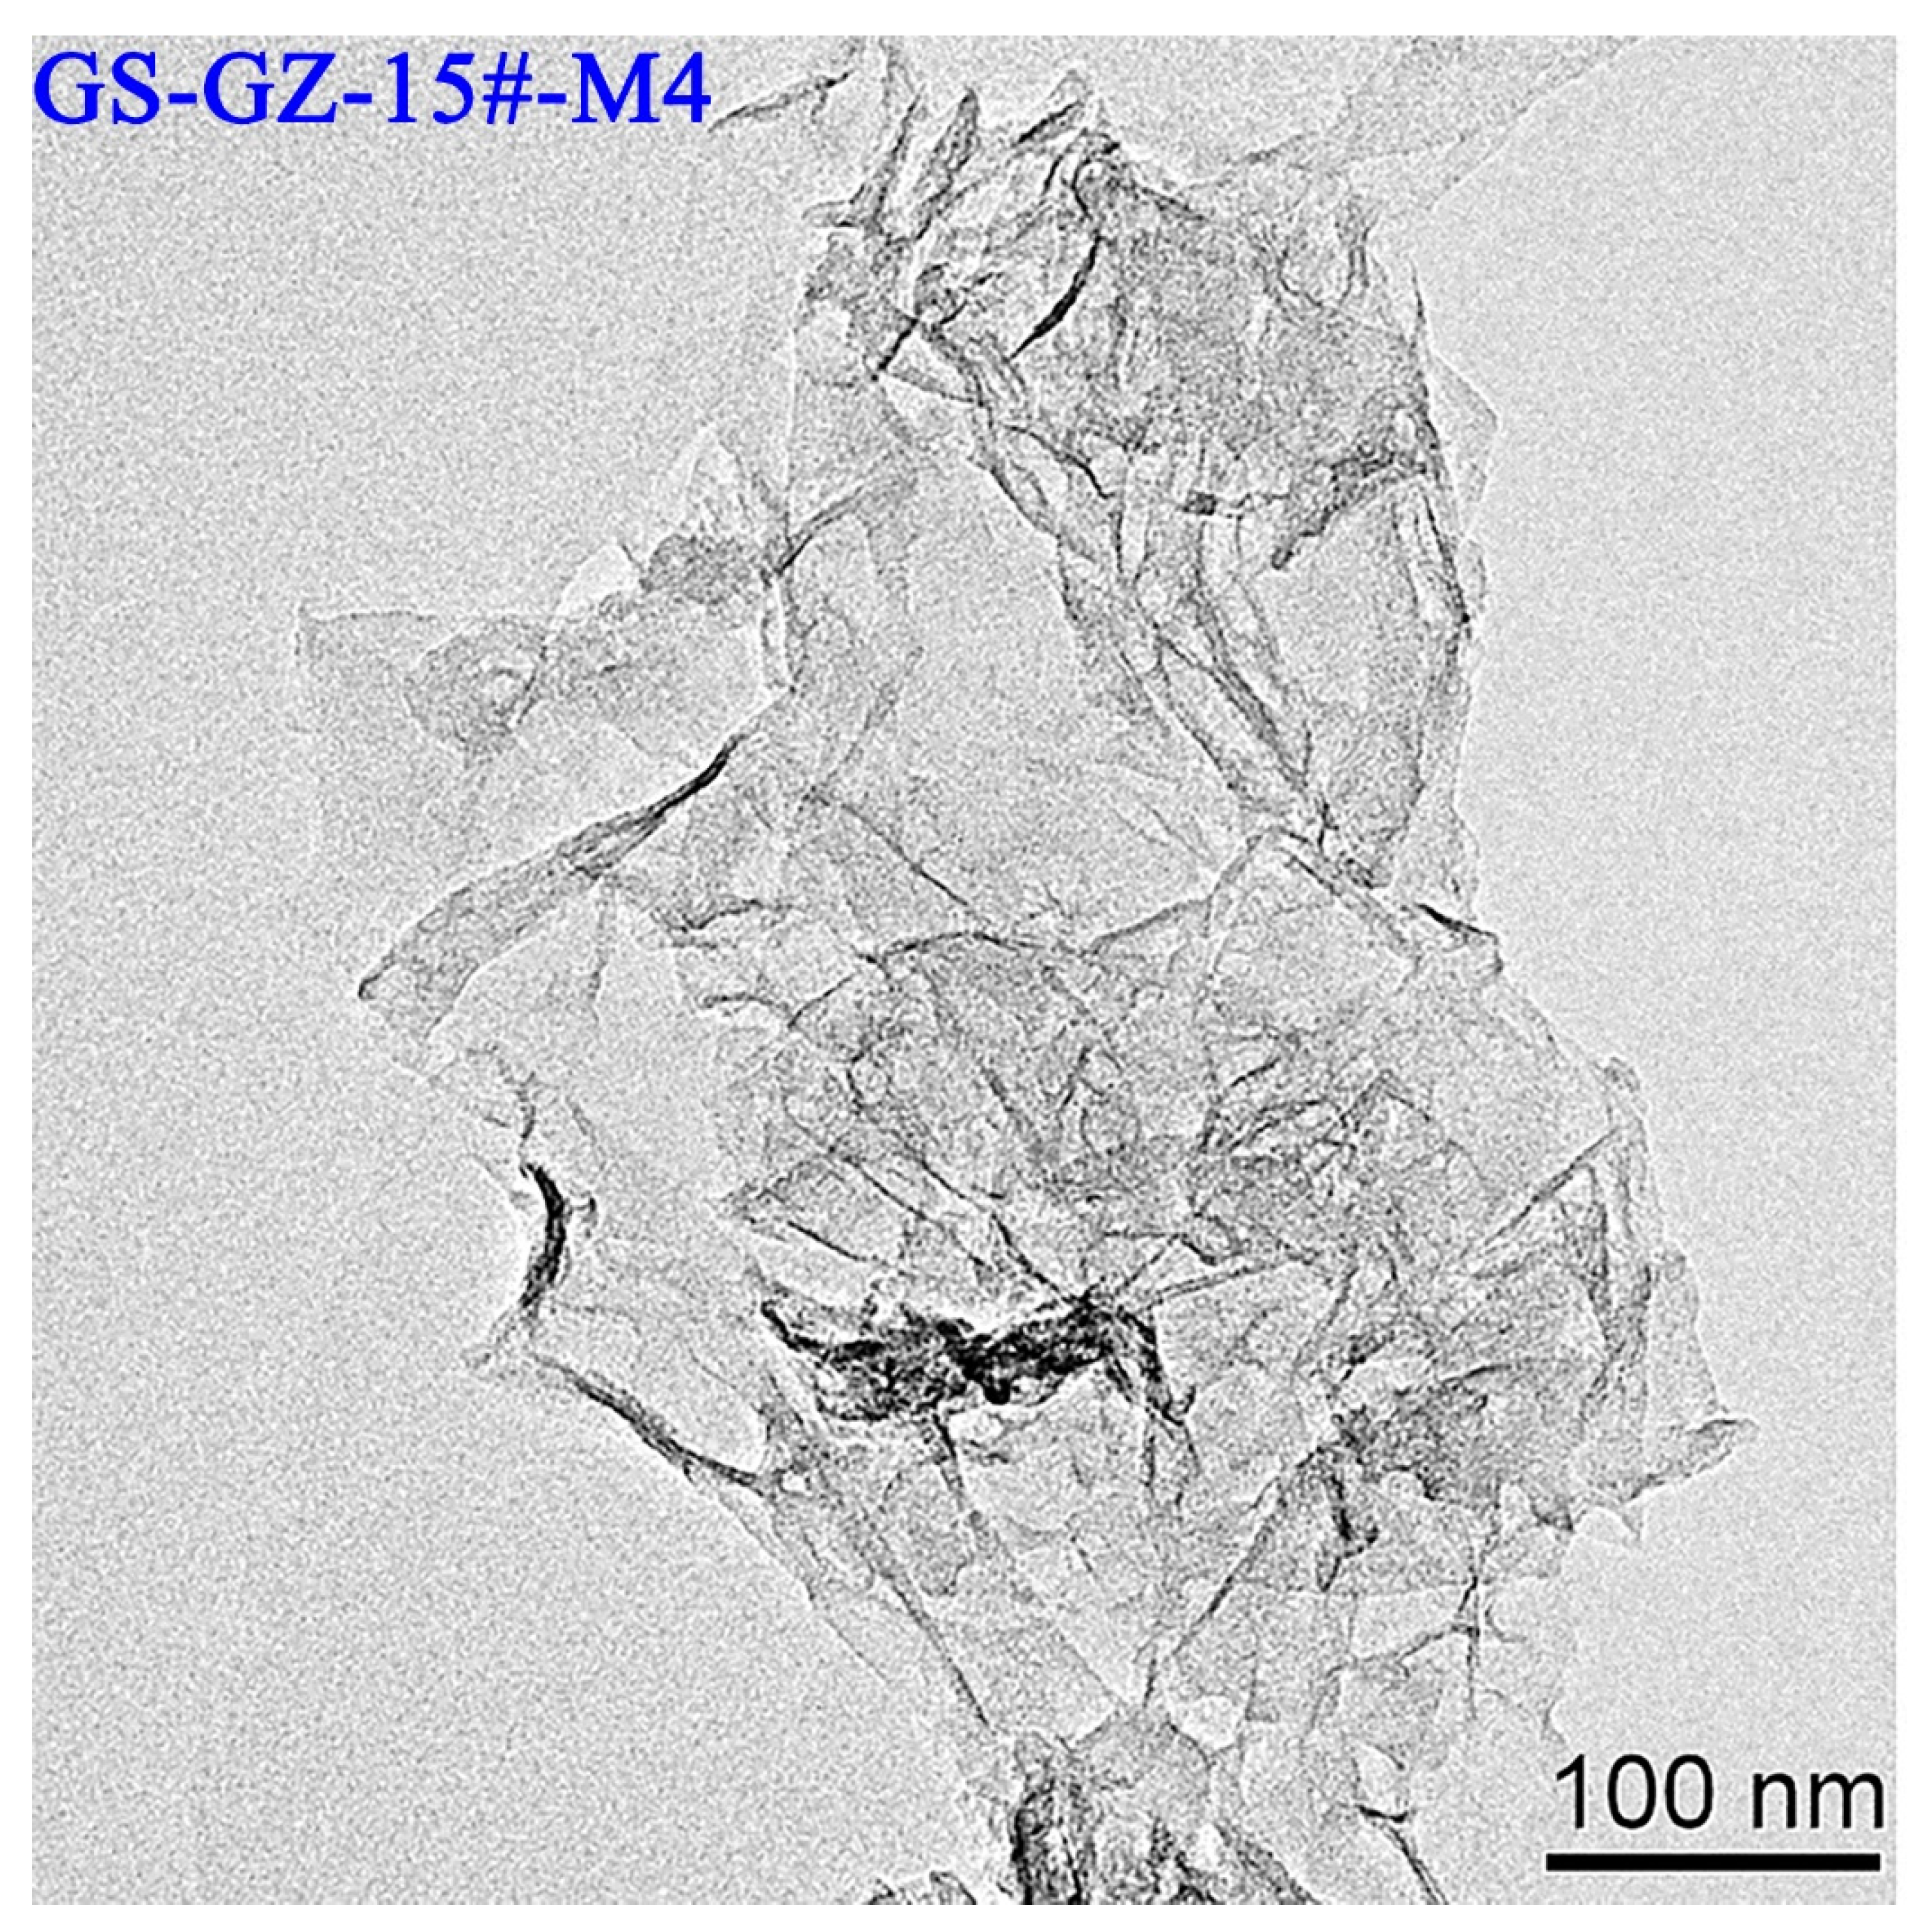
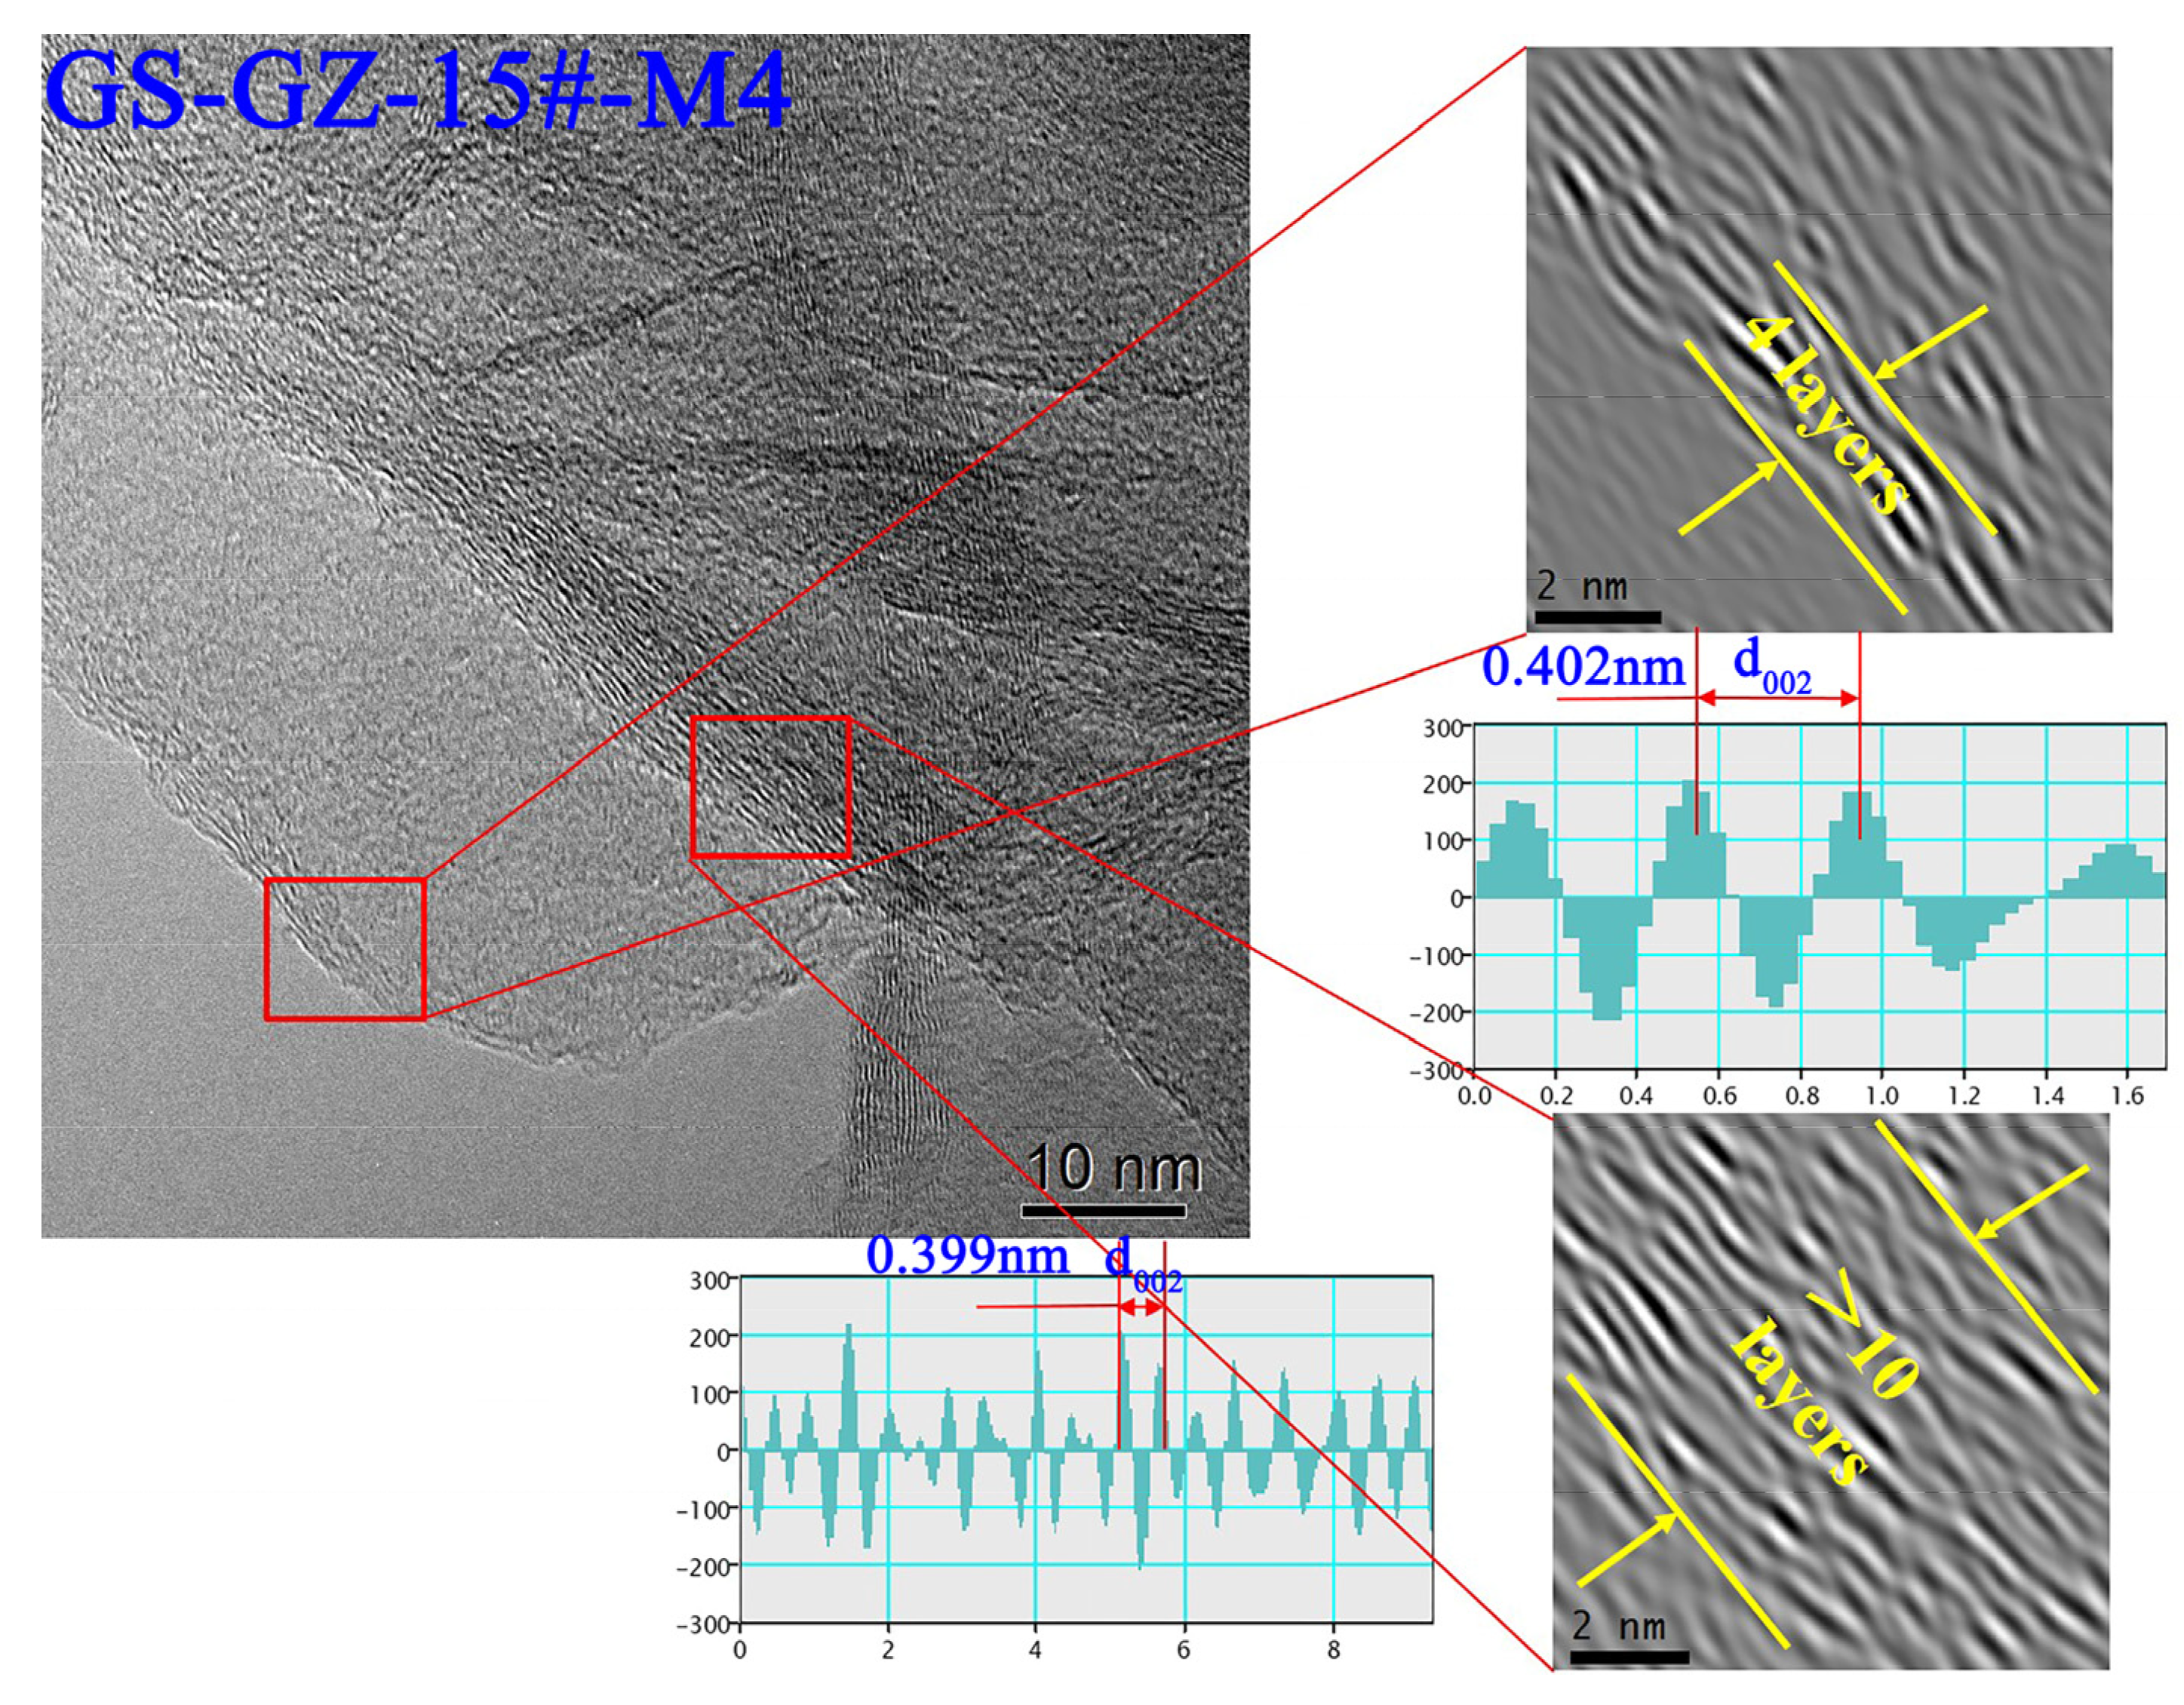
It can be observed from Figure 16 that the prepared Qinshui-coal-based graphene had good light transmittance and was in the shape of a thin layer. The folds and superposition inside the graphene layers are clearly visible in the image, which is consistent with the morphological characteristics of few layers of graphene (less than 10 layers) [87]. The Qinshui-coal-based GS has good integrity and no microgaps, indicating that demineralization can avoid the microgap caused by the embedding of the products of high-temperature transformation of minerals in coal into the graphene layers [57]. Generally speaking, the lower the number of Nave, the more bending is required to maintain thermodynamic stability, so graphene with fewer Nave produces more folds. Compared with the middle of the graphene layer, the interlayer spacing (d002) at the edge of the graphene sheets was large and the Nave was small (Figure 17), indicating that the peeling effect of the graphene layers at the edge was ideal.
There were still some differences in the structures of the coal-based layers prepared from the thirteen different raw coals. After fast Fourier transform (FFT) of the HRTEM images, lattice images can be obtained (as shown in Figure 18), which is convenient for measuring the Nave through line profile analysis of lattice images. In the line profile analysis, the distance between peaks represents the graphene interlayer spacing (d002). For GS-WK-15#-KC, GS-TAHX-15#-M8, and GS-WK-15#-M2, the Nave was mostly less than 5, and the d002 values were 0.457 nm, 0.433 nm, and 0.431 nm, respectively. For GS-SJZ-15#-M4, GS-XJ-8#-M6, and GS-GZ-15#-M4, the number of layers was evenly distributed, mostly 5 layers, and the d002 values were 0.514 nm, 0.422 nm, and 0.414 nm, respectively. For GS-KXYQ-15#-M5, GS-JSFH-15#-M6, GS-XJ-15#-M6, GS-XJ-3#-M6, GS-BZ-2#-KC, GS-KXYQ-9#-M1, and GS-BZ2#-M4, the number of layers was mostly distributed between 5 and 8, and the d002 values ranged from 0.392 nm–0.512 nm. Therefore, it can be concluded from the above that the higher the reflectance of the corresponding raw coal, the greater the number of coal-based graphene layers, proving that a higher reflectance is conducive to the stripping of coal-based graphene layers.
Generally speaking, in practical experiments, some samples that do not meet the target, such as non-graphene structures, are included in the XRD characterization, and the selected points cannot contain all the target samples in the HRTEM characterization. Therefore, to avoid errors, comprehensive calculation of the characterization parameters is required. It can be seen from the comparison of HRTEM and XRD parameters (Table 9) that the interlayer spacing (d002) and Nave of the coal-based GS were characterized by HRTEM, for which the collected symbolic image points were larger than those of XRD. Combining with the average values of XRD parameters and HRTEM parameters, it was calculated that the d002 value of the Qinshui-coal-based GS was about 0.401 nm, and the Nave was about 5.

4. Conclusions

Coal-based graphene was prepared from thirteen anthracites collected from Qinshui coalfield. Through the analysis of the characterization of the samples and products in the preparation process, the conclusions are as follows:
(1) After graphitization treatment, there was an obvious positive correlation between the graphitization degree and the reflectance of raw coal. In the reflectance range of the selected coal samples, the graphitization degree of coal-based graphite was positively correlated with the content of inertinite, and was negatively correlated with the content of vitrinite in the raw coal, under the conditions controlling the influence of the Ro,max variable. The graphitization degree formulas were summarized as follows: G = 29.18Ro,max − 0.27V + 10.38 (R = 0.834, P = 0.001), G = 29.63Ro,max + 0.26I − 16.36 (R = 0.810, P = 0.002), and G = 28.89Ro,max − 0.43V − 0.18I + 27.80 (R = 0.818, P = 0.004).
(2) There was a positive linear correlation of the La and Lc values of the coal-based graphite and the graphene with the reflectance of the raw coal. Moreover, the variation range of the La values of the Qinshui-coal-based graphite and the coal-based graphene was larger than that of the Lc values.
(3) Demineralization of coal has no significant effect on the ID/IG ratio but has a great influence on the FWHM-G in Raman characterization. There were negative linear correlations of the FWHM-G and ID/IG of raw coal, demineralized coal, and coal-based graphite with the reflectance of the raw coal.
(4) The higher the reflectance of the raw coal, the more ideal the micro-morphology of the coal-based graphene prepared, and the fewer the layers characterized by HRTEM. The carbon content of the produced Qinshui-coal-based graphene was more than 85% in both mass ratio and atomic ratio.
(5) In order to avoid the calculation error caused by the inclusion of non-coal-based graphene content in XRD characterization and the particularity of selected points in HRTEM characterization, the structural parameters can be calculated by combining the average values of the two. It was calculated that the interlayer spacing (d002) of the Qinshui-coal-based graphene was about 0.401 nm and, that the number of layers (Nave) was about 5.

Author Contributions

Data curation, R.L.; formal analysis, R.L.; investigation, R.L., Q.C., P.M. and P.L.; resources, X.L. and M.D.; writing—original draft preparation, R.L.; writing—review and editing, Y.T. and R.L.; supervision, Y.T. All authors have read and agreed to the published version of the manuscript.

Funding

This research was supported by the National Natural Science Foundation of China (No. 41872175), Key R&D Program of Ningxia Hui Autonomous Region (2021BEG02015), and the Geological Exploration Fund Project of Shanxi Province (2019-25).

Data Availability Statement

Not applicable.

Acknowledgments

Sincere thanks are due to the State Key Laboratory Coal Resources and Safe Mining. The authors acknowledge support for samples from the Institute of Geology and Mineral Resources of Shanxi Province.

Conflicts of Interest

The authors declare no conflict of interest.

References

  1. Lee, C.G.; Wei, X.D.; Jeffrey, W.K.; James, H. Measurement of the elastic properties and intrinsic strength of monolayer graphene. Science 2008, 321, 385–388. [Google Scholar] [CrossRef] [PubMed]
  2. Reina, A.; Jia, X.T.; Ho, J.; Nezich, D.; Son, H.; Bulovic, V.; Dresselhaus, M.S.; Kong, J. Large area, few-layer graphene films on arbitrary substrates by chemical vapor deposition. Nano Lett. 2009, 9, 30–35. [Google Scholar] [CrossRef] [PubMed]
  3. Lin, Y.-M.; Dimitrakopoulos, C.; Jenkins, K.A.; Farmer, D.B.; Chiu, H.-Y.; Grill, A.; Avouris, P. 100-GHz transistors from wafer-scale epitaxial graphene. Science 2010, 327, 662. [Google Scholar] [CrossRef] [PubMed] [Green Version]
  4. Yang, Y.; Asiri, A.M.; Tang, Z.; Dan, D.; Lin, Y. Graphene based materials for biomedical applications. Mater. Today 2013, 16, 365–373. [Google Scholar] [CrossRef]
  5. Kim, N.H.; Kuila, T.; Lee, J.H. Enhanced mechanical properties of a multiwall carbon nanotube attached pre-stitched graphene oxide filled linear low density polyethylene composite. J. Mater. Chem. A 2014, 2, 2681–2689. [Google Scholar] [CrossRef]
  6. Editorial Department of Nature. Microscopy: Graphene protects cells for imaging. Nature 2015, 522, 394–395. [Google Scholar] [CrossRef] [Green Version]
  7. An, X.H.; Simmons, T.; Shah, R.; Wolfe, C.; Lewis, K.M.; Washington, M.; Nayak, S.K.; Talapatra, S.; Kar, S. Stable aqueous dispersions of noncovalently functionalized graphene from graphite and their multifunctional high-performance applications. Nano Lett. 2010, 10, 4295–4301. [Google Scholar] [CrossRef]
  8. Li, X.; Magnuson, C.W.; Venugopal, A.; Tromp, R.M.; Harmon, J.B.; Vogel, E.M.; Colombo, L.; Ruoff, R.S. Large-area graphene single crystals grown by low-pressure chemical vapor deposition of methane on copper. J. Am. Chem. Soc. 2011, 133, 2816–2819. [Google Scholar] [CrossRef]
  9. Ramón, M.E.; Gupta, A.; Corbet, C.; Ferrer, D.A.; Movva, H.C.P.; Carpenter, G.; Colombo, L.; Bourianoff, G.; Doczy, M.; Akinwande, D. Cmos-compatible synthesis of large-area, high-mobility graphene by chemical vapor deposition of acetylene on cobalt thin films. ACS Nano 2011, 5, 7198–7204. [Google Scholar] [CrossRef]
  10. Mathews, J.P.; Chaffee, A.L. The molecular representations of coal—A review. Fuel 2012, 96, 1–14. [Google Scholar] [CrossRef]
  11. Hoang, V.C.; Hassan, M.; Gomes, V.G. Coal derived carbon nanomaterials-recent advances in synthesis and applications. Appl. Mater. Today 2018, 12, 342–358. [Google Scholar] [CrossRef]
  12. Achten, C.; Andersson, J.T. Overview of polycyclic aromatic compounds (PAC). Polycycl. Aromat. Compd. 2015, 35, 177–186. [Google Scholar] [CrossRef] [PubMed] [Green Version]
  13. Huan, X.; Tang, Y.G.; Xu, J.J.; Xu, M.X. Nano-level resolution determination of aromatic nucleus in coal. Fuel 2020, 262, 116532. [Google Scholar] [CrossRef]
  14. Wang, R.W.; Sun, R.Y.; Liu, G.J.; Yousaf, B.; Wu, D.; Chen, J.; Zhang, H. A review of the biogeochemical controls on the occurrence and distribution of polycyclic aromatic compounds (PACs) in coals. Earth Sci. Rev. 2017, 171, 400–418. [Google Scholar] [CrossRef]
  15. Hirsch, P.B. X-ray scattering from coals. Proc. R. Soc. A Math. Phys. Eng. Sci. 1954, 226, 143–169. [Google Scholar]
  16. Cartz, L.; Diamond, R.; Hirsch, P.B. New X-ray data on coals. Nature 1956, 177, 500–502. [Google Scholar] [CrossRef]
  17. Cartz, L.; Hirsch, P.B. A contribution to the structure of coals from X-ray diffraction studies. Philos. Trans. R. Soc. A Math. Phys. Eng. Sci. 1960, 252, 557–602. [Google Scholar]
  18. Radke, M.; Schaefer, R.G.; Leythaeuserv, D.; Teichmüller, M. Composition of soluble organic matter in coals: Relation to rank and liptinite fluorescence. Geochim. Cosmochim. Acta 1980, 44, 1787–1800. [Google Scholar] [CrossRef]
  19. Zhao, Z.B.; Liu, K.L.; Xie, W.; Pan, W.P.; Riley, J.T. Soluble polycyclic aromatic hydrocarbons in raw coals. J. Hazard. Mater. 2000, 73, 77–85. [Google Scholar] [CrossRef]
  20. Stach, E.; Mackowsky, M.T.; Teichmüller, M. Stach’s Textbook of Coal Petrology; Gebrüder Borntraeger: Berlin, Germany; Stuttgart, Germany, 1982. [Google Scholar]
  21. Taylor, G.H. Organic Petrology; Gebrüder Borntraeger: Berlin, Germany, 1998. [Google Scholar]
  22. Li, J.Q.; Qin, Y.; Chen, Y.L.; Song, Y.; Wang, Z.W. HRTEM observation of morphological and structural evolution of aromatic fringes during the transition from coal to graphite. Carbon 2022, 187, 133–144. [Google Scholar] [CrossRef]
  23. Yuan, L.; Liu, Q.F.; Mathews, J.P.; Zhang, H.; Wu, Y.K. Quantifying the structural transitions of Chinese coal to coal-derived natural graphite by XRD, Raman spectroscopy, and HRTEM image analyses. Energy Fuels 2021, 35, 2335–2346. [Google Scholar] [CrossRef]
  24. Diessel, C.F.K.; Brothers, R.N.; Philippa, M.B. Coalification and graphitization in high-pressure schists in New Caledonia. Contrib. Mineral. Petrol. 1978, 68, 63–78. [Google Scholar] [CrossRef]
  25. Bustin, R.M.; Rouzaud, J.N.; Ross, J.V. Natural graphitization of anthracite: Experimental considerations. Carbon 1995, 33, 679–691. [Google Scholar] [CrossRef]
  26. Oberlin, A.; Terrier, G. Graphitization studies of anthracites by high resolution electron microscopy. Carbon 1975, 13, 367–376. [Google Scholar] [CrossRef]
  27. Wertz, D.L.; Bissell, M. Relating the nonideal diffraction from the graphene layer stacking peak to the aliphatic carbon abundance in bituminous coal. Energy Fuels 1994, 8, 613–617. [Google Scholar] [CrossRef]
  28. Blanche, C.; Rouzaud, J.N.; Dumas, D. New data on anthracite graphitizibility. In Proceedings of the 22nd Biennal Carbon Conference, Extended Abstracts, American Carbon Society, San Diego, CA, USA, 16–21 July 1995; pp. 694–695. [Google Scholar]
  29. Manoj, B. Synthesis and characterization of porous, mixed phase, wrinkled, few layer graphene like nanocarbon from charcoal. Russ. J. Phys. Chem. A 2015, 89, 2438–2442. [Google Scholar] [CrossRef]
  30. Malard, L.M.; Pimenta, M.A.; Dresselhaus, G.; Dresselhaus, M.S. Raman spectroscopy in graphene. Phys. Rep. 2009, 473, 51–87. [Google Scholar] [CrossRef]
  31. Bratek, K.; Bratek, W.; Gerus-Piasecka, I.; Jasieńko, S.; Wilk, P. Properties and structure of different rank anthracites. Fuel 2002, 81, 97–108. [Google Scholar] [CrossRef]
  32. Nyathi, M.S.; Clifford, C.B.; Schobert, H.H. Characterization of graphitic materials prepared from different rank Pennsylvania anthracites. Fuel 2013, 114, 244–250. [Google Scholar] [CrossRef]
  33. Franklin, R.E. Crystallite growth in graphitizing and non-graphitizing carbons. Proc. R. Soc. A Math. Phys. Eng. Sci. 1951, 209, 196–218. [Google Scholar]
  34. Li, W.; Song, Y.; Yang, W.B.; Mathews, J.P. Structural transformations for a subbituminous coal, impact of temperature on gold-tube pyrolysis chars evaluated using HRTEM. Fuel 2022, 311, 122581. [Google Scholar] [CrossRef]
  35. Lee, S.Y.; Mahajan, R.L. A facile method for coal to graphene oxide and its application to a biosensor. Carbon 2021, 181, 408–420. [Google Scholar] [CrossRef]
  36. Pang, L.S.K.; Vassallo, A.M.; Wilson, M.A. Fullerenes from coal: A self-consistent preparation and purification process. Energy Fuels 1992, 6, 176–179. [Google Scholar] [CrossRef]
  37. Pang, L.S.K. Fullerenes from brown (lignite) coal. Fuel Process. Technol. 1993, 34, 147–155. [Google Scholar] [CrossRef]
  38. Taylor, G.H.; Gerald, J.D.F.; Pang, L.S.K.; Wilson, M.A. Cathode deposits in fullerene formation-microstructural evidence for independent pathways of pyrolytic carbon and nanobody formation. J. Cryst. Growth 1994, 135, 157–164. [Google Scholar] [CrossRef]
  39. Williams, J.H.; Eklund, P.C. Single-wall carbon nanotubes from coal. Chem. Phys. Lett. 1993, 310, 31–37. [Google Scholar] [CrossRef]
  40. Pang, L.S.K.; Wilson, M.A. Nanotubes from coal. Energy Fuels 1993, 7, 436–437. [Google Scholar] [CrossRef]
  41. Hummers, W.S.; Offeman, R.E. Preparation of graphitic oxide. J. Am. Chem. Soc. 1958, 80, 1339. [Google Scholar] [CrossRef]
  42. Zhou, Q.; Zhao, Z.B.; Zhang, Y.T.; Meng, B.; Zhou, A.N.; Qiu, J.S. Graphene sheets from graphitized anthracite coal: Preparation, decoration, and application. Energy Fuels 2012, 26, 5186–5192. [Google Scholar] [CrossRef]
  43. Zhang, Y.T.; Liu, G.Y.; Cai, J.T.; Zhou, A.N.; Zhang, X.Q.; Qiu, J.S. Preparation of graphene from Taixi anthracite and its photocatalyst performance for CO2 conversion. Proc. Inst. Mech. Eng. Part N J. Nanoeng. Nanosyst. 2013, 228, 61–64. [Google Scholar] [CrossRef]
  44. Powell, C.; Beall, G.W. Graphene oxide and graphene from low grade coal: Synthesis, characterization and applications. Curr. Opin. Colloid Interface Sci. 2015, 20, 362–366. [Google Scholar] [CrossRef]
  45. Wang, K.; Zhang, X.L.; Zhang, X.Q.; Lin, Q.L.; Huang, X.L. Preparation of fluffy graphene nanosheets from coal-tar pitch with nano-Al2O3 as filler. J. Anal. Appl. Pyrolysis 2016, 117, 354–356. [Google Scholar] [CrossRef]
  46. Huan, X.; Tang, Y.G.; Xu, J.J.; Lan, C.Y.; Wang, S.Q. Structural characterization of graphenic material prepared from anthracites of different characteristics: A comparative analysis. Fuel Process. Technol. 2019, 183, 8–18. [Google Scholar] [CrossRef]
  47. Tang, Y.G.; Xu, J.J.; Huan, X.; Wang, S.Q.; Chen, P.X. Preparation and spectroscopic characterization of coal-based graphene from anthracite in Xiaofalu, Yunnan, China. J. China Coal Soc. 2020, 45, 740–748, (In Chinese with English Abstract). [Google Scholar]
  48. Ye, R.Q.; Xiang, C.S.; Lin, J.; Peng, Z.W.; Huang, K.W.; Yan, Z.; Cook, N.P.; Samuel, E.L.G.; Hwang, C.-C.; Ruan, G.D.; et al. Coal as an abundant source of graphene quantum dots. Nat. Commun. 2013, 4, 2943. [Google Scholar] [CrossRef]
  49. Singamaneni, S.R.; Tol, J.V.; Ye, R.Q.; Tour, J.M. Magnetic defects in graphene quantum dots. In Proceedings of the APS March Meeting 2015, San Antonio, TX, USA, 2–6 March 2015. [Google Scholar]
  50. Tang, Y.G.; Huan, X.; Lan, C.Y.; Xu, M.X. Effects of coal rank and high organic sulfur on the structure and optical properties of coal-based graphene quantum dots. Acta Geol. Sin. 2018, 92, 1218–1230. [Google Scholar] [CrossRef]
  51. Aso, H.; Matsuoka, K.; Sharma, A.; Tomita, A. Evaluation of size of graphene sheet in anthracite by a temperature-programmed oxidation method. Energy Fuels 2004, 18, 1309–1314. [Google Scholar] [CrossRef]
  52. Gao, F.; Qu, J.Y.; Zhao, Z.B.; Zhou, Q.; Li, B.B.; Qiu, J.S. A green strategy for the synthesis of graphene supported Mn3O4 nanocomposites from graphitized coal and their supercapacitor application. Carbon 2014, 80, 640–650. [Google Scholar] [CrossRef]
  53. Vijapur, S.H.; Wang, D.; Botte, G.G. The growth of transparent amorphous carbon thin films from coal. Carbon 2013, 54, 22–28. [Google Scholar] [CrossRef]
  54. Vijapur, S.H.; Wang, D.; Ingram, D.C.; Botte, G.G. An investigation of growth mechanism of coal derived graphene films. Mater. Today Commun. 2017, 11, 147–155. [Google Scholar] [CrossRef] [Green Version]
  55. Savitskii, D.P. Preparation and characterization of colloidal dispersions of graphene-like structures from different ranks of coals. J. Fuel Chem. Technol. 2017, 45, 897–907. [Google Scholar] [CrossRef]
  56. Evans, E.L.; Jenkins, J.L.; Thomas, J.M. Direct electron microscopic studies of graphitic regions in heat-treated coals and coal extracts. Carbon 1972, 10, 637–642. [Google Scholar] [CrossRef]
  57. Lan, C.Y.; Tang, Y.G.; Huan, X.; Che, Q.L. Effects of minerals in anthracite on the formation of coal-based graphene. Chem. Select 2019, 19, 5937–5944. [Google Scholar] [CrossRef]
  58. Liu, L.; Du, M.L.; Li, G.; Fan, J.W.; Cai, Y.C. Pyrolysis behavior and product distribution of exinite submacerals. J. Anal. Appl. Pyrolysis 2020, 152, 104957. [Google Scholar] [CrossRef]
  59. Du, M.L.; Liu, L.; Fan, J.W.; Li, G.; Yang, J.L. Prediction and characterization of macromolecular structure of cutinite from Luquan cutinitic liptobiolith with molecular simulation. Energy Sources Part A Recovery Util. Environ. Eff. 2020, 42, 1–16. [Google Scholar] [CrossRef]
  60. Wang, L.; Zhang, H.; Li, Y. On the difference of characterization and supercapacitive performance of graphene nanosheets from precursors of inertinite- and vitrinite-rich coal. J. Alloy. Compd. 2019, 815, 152502. [Google Scholar] [CrossRef]
  61. Awasthi, S.; Awasthi, K.; Ghosh, A.K.; Srivastava, S.K.; Srivastava, O.N. Formation of single and multi-walled carbon nanotubes and graphene from Indian bituminous coal. Fuel 2015, 147, 35–42. [Google Scholar] [CrossRef]
  62. Sierra, U.; Álvarez, P.; Blanco, C.; Granda, M.; Santamaría, R.; Menéndez, R. Cokes of different origin as precursors of graphene oxide. Fuel 2016, 166, 400–403. [Google Scholar] [CrossRef]
  63. Ge, B.; Yin, G.; Li, C. A preliminary study on sedimentary environments and law of coal-bearing formation in Yangquan, Shanxi. Acta Sedimentol. Sin. 1985, 3, 33–44, (In Chinese with English Abstract). [Google Scholar]
  64. Shao, L.; Xiao, Z.; Wang, H.; Lu, J.; Zhou, J. Permo-Carboniferous coal measures in the Qinshui Basin: High-resolution sequence stratigraphy and coal accumulating models. Chin. J. Geol. 2008, 43, 777–791, (In Chinese with English Abstract). [Google Scholar]
  65. Bishop, M.; Ward, D.L. The direct determination of mineral matter in coal. Fuel 1958, 37, 191–200. [Google Scholar]
  66. Rodrigues, S.I.; Suárez-Ruiz, M.M.; Flores, D.; Camean, I.; García, A.B. Development of graphite-like particles from the high temperature treatment of carbonized anthracites. Int. J. Coal Geol. 2011, 85, 219–226. [Google Scholar] [CrossRef]
  67. Botas, C.; Pérez-Mas, A.M.; Álvarez, P.; Santamaría, R.; Menéndez, R. Optimization of the size and yield of graphene oxide sheets in the exfoliation step. Carbon 2013, 63, 576–578. [Google Scholar] [CrossRef] [Green Version]
  68. Botas, C.; Álvarez, P.; Blanco, P.; Granda, M.; Blanco, C.; Santamaría, R.; Romasanta, L.J.; Verdejo, R.; López-Manchado, M.A.; Menéndez, R. Graphene materials with different structures prepared from the same graphite by the Hummers and Brodie method. Carbon 2013, 65, 156–164. [Google Scholar] [CrossRef] [Green Version]
  69. ASTM Standard D2798-11a; Standard Test Method for Microscopical Determination of the Vitrinite Reflectance of Coal. ASTM International: West Conshohocken, PA, USA, 2011.
  70. ASTM Standard D3173-11; Test Method for Moisture in the Analysis Sample of Coal and Coke. ASTM International: West Conshohocken, PA, USA, 2011.
  71. ASTM Standard D3174-11; Test Method for Ash in the Analysis Sample of Coal and Coke from Coal. ASTM International: West Conshohocken, PA, USA, 2011.
  72. ASTM Standard D3175-11; Test Method for Volatile Matter in the Analysis Sample of Coal and Coke. ASTM International: West Conshohocken, PA, USA, 2011.
  73. ASTM Standard D3177-02; Test Method for Total Sulfur in the Analysis Sample of Coal and Coke from Coal. ASTM International: West Conshohocken, PA, USA, 2011.
  74. ASTM Standard D3177-02; Test Methods for Instrumental Determination of Carbon, Hydrogen, and Nitrogen in Laboratory Samples of Coal. ASTM International: West Conshohocken, PA, USA, 2011.
  75. International Committee for Coal and Organic Petrology. The new vitrinite classification (ICCP system 1994). Fuel 1998, 77, 349–358. [Google Scholar] [CrossRef]
  76. International Committee for Coal and Organic Petrology. The new inertinite classification (ICCP system 1994). Fuel 2001, 80, 459–471. [Google Scholar] [CrossRef]
  77. Duber, S.; Pusz, S.; Kwiecińska, B.K.; Rouzaud, J.N. On the optically biaxial character and heterogeneity of anthracites. Int. J. Coal Geol. 2000, 44, 227–250. [Google Scholar] [CrossRef]
  78. Pusz, S.; Borrego, A.G.; Alvarez, D.; Camean, I.; Cann, V.D.; Duber, S.; Kalkreuth, W.; Komorek, J.; Kus, J.; Kwiecińska, B.K.; et al. Application of reflectance parameters in the estimation of the structural order of coals and carbonaceous materials. Precision and bias of measurements derived from the ICCP structural working group. Int. J. Coal Geol. 2014, 131, 147–161. [Google Scholar] [CrossRef] [Green Version]
  79. Sheng, C.D. Char structure characterised by Raman spectroscopy and its correlations with combustion reactivity. Fuel 2007, 86, 2316–2324. [Google Scholar] [CrossRef]
  80. International Organization for Standardization. ISO 11760, Classification of Coals; ISO: Geneva, Switzerland, 2018; p. 9. [Google Scholar]
  81. Chou, C.L. Sulfur in coals: A review of geochemistry and origins. Int. J. Coal Geol. 2012, 100, 1–13. [Google Scholar] [CrossRef]
  82. Ferrari, A.C.; Meyer, J.C.; Scardaci, V.; Casiraghi, C.; Lazzeri, M.; Mauri, F.; Piscanec, S.; Jiang, D.; Novoselov, K.S.; Roth, S.; et al. Raman spectrum of graphene and graphene layers. Phys. Rev. Lett. 2006, 97, 187401–187404. [Google Scholar] [CrossRef] [PubMed] [Green Version]
  83. Lyon, L.A. Raman spectroscopy. Anal. Chem. 1998, 70, 341–361. [Google Scholar] [CrossRef] [PubMed]
  84. Pachfule, P.; Shinde, D.; Majumder, M.; Xu, Q. Fabrication of carbon nanorods and graphene nanoribbons from a metal-organic framework. Nat. Chem. 2016, 8, 718–724. [Google Scholar] [CrossRef] [PubMed]
  85. Pimenta, M.A.; Dresselhaus, G.; Dresselhaus, M.S.; Cançado, L.G.; Jorioa, A.; Saitoe, R. Studying disorder in graphite-based systems by Raman spectroscopy. Phys. Chem. Chem. Phys. 2007, 9, 1276–1291. [Google Scholar] [CrossRef]
  86. Hou, Y.G.; Zhang, K.P.; Wang, F.R.; He, S.; Dong, T.; Wang, C.; Qin, W.; Xiao, Y.; Tang, B.; Yu, R.; et al. Structural evolution of organic matter and implications for graphitization in over-mature marine shales. South China. Mar. Pet. Geol. 2019, 109, 304–316. [Google Scholar] [CrossRef]
  87. Robertson, A.W.; Bachmatiuk, A.; Wu, Y.A.; Schaffel, F.; Buchner, B.; Rummeli, M.H.; Warner, J.H. Structural distortions in few-layer graphene creases. ACS Nano 2012, 5, 9984–9991. [Google Scholar] [CrossRef]
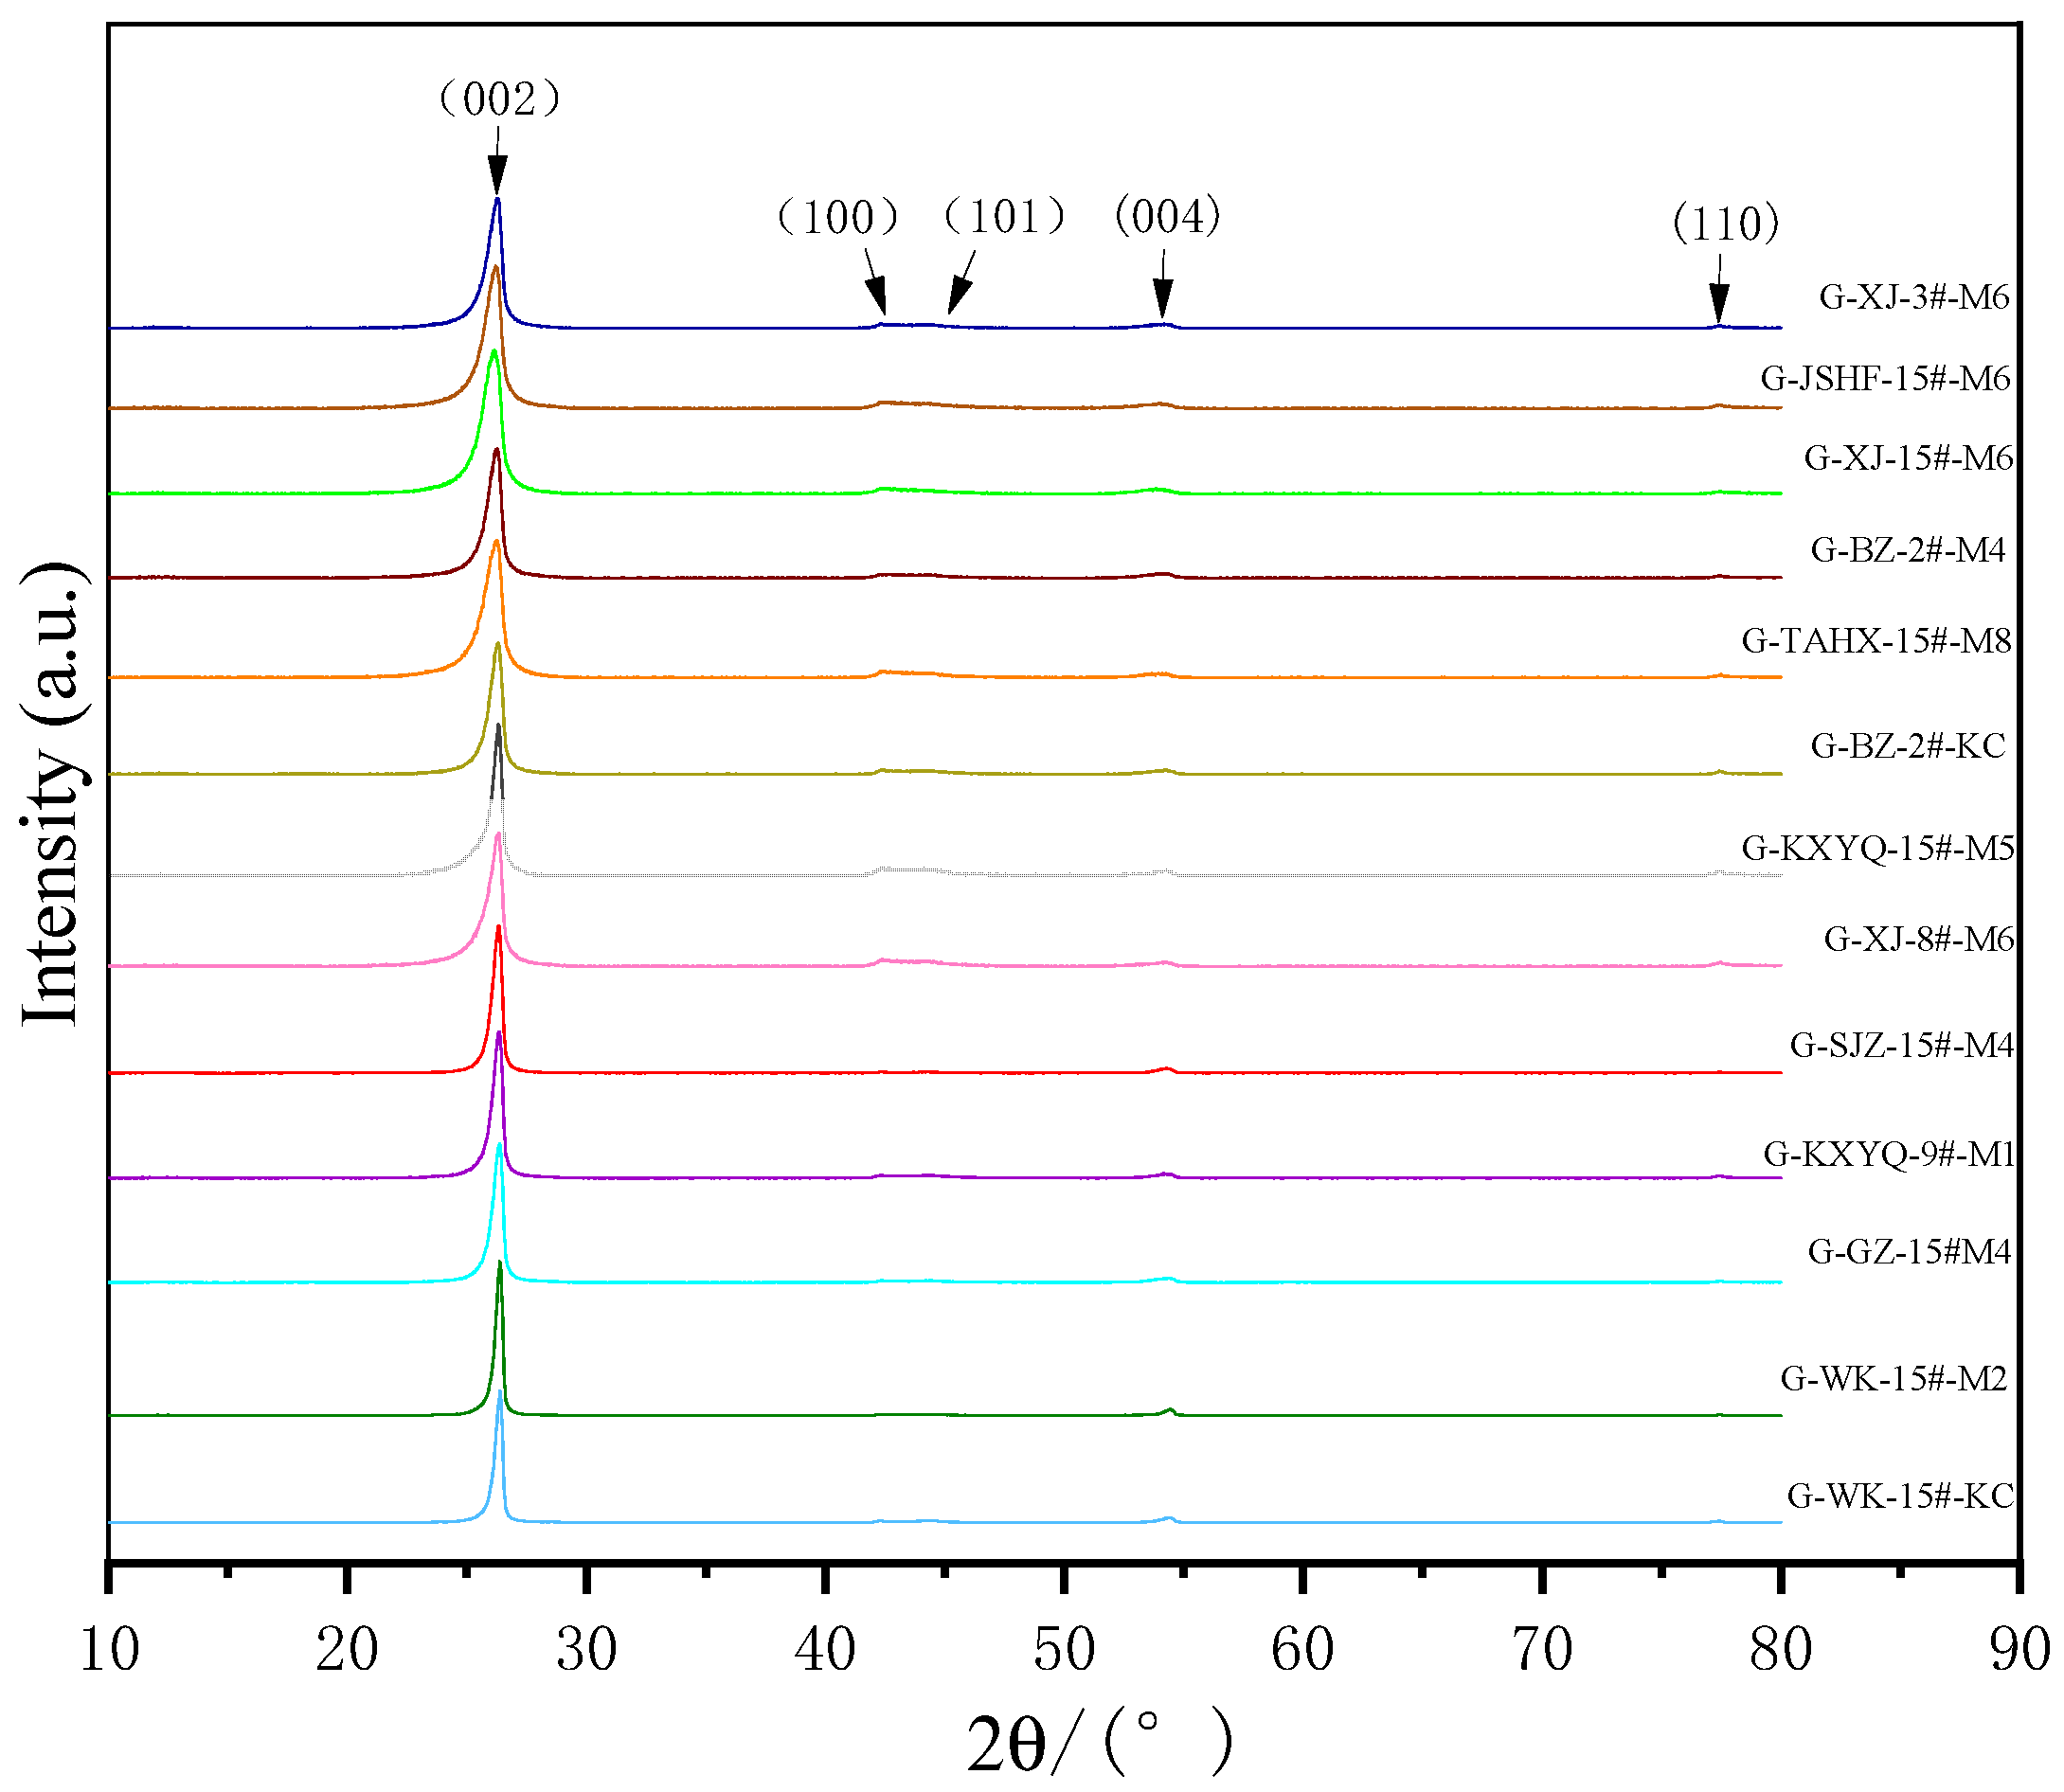
Figure 1. XRD patterns of coal-based graphite.
Minerals 12 00588 g001
Figure 2. Scatter diagram of coal-based graphitization degree (G%) and vitrinite proportion (V%).
Minerals 12 00588 g002
Figure 3. Scatter diagram of graphitization degree (G%), vitrinite proportion (V%), and inertinite proportion (I%).
Minerals 12 00588 g003
Figure 4. Scatter diagram of La and Lc of coal-based graphite.
Minerals 12 00588 g004
Figure 5. XRD patterns of coal-based graphene.
Minerals 12 00588 g005
Figure 6. Scatter diagram of La and Lc of coal-based graphene.
Minerals 12 00588 g006
Figure 7. Raman patterns of raw coal.
Minerals 12 00588 g007
Figure 8. Raman patterns of demineralized coal.
Minerals 12 00588 g008
Figure 9. Scatter diagram of FWHM-G.
Minerals 12 00588 g009
Figure 10. Scatter diagram of ID/IG.
Minerals 12 00588 g010
Figure 11. Raman patterns of coal-based graphite.
Minerals 12 00588 g011
Figure 12. Raman patterns of coal-based graphene.
Minerals 12 00588 g012
Figure 13. SEM and EDS images of coal-based graphene.
Minerals 12 00588 g013
Figure 14. Scatter diagram of carbon content of coal-based graphene.
Minerals 12 00588 g014
Figure 15. Scatter diagram of O/C of raw coal and coal-based GS.
Minerals 12 00588 g015
Figure 16. HRTEM image of coal graphene at large scale.
Minerals 12 00588 g016
Figure 17. HRTEM comparison image between the edge and middle of coal graphene layers.
Minerals 12 00588 g017
Figure 18. HRTEM images of Qinshui-coal-based graphene.
Minerals 12 00588 g018
Table 1. Description for all samples.
SampleDescriptionAgeLocation
WK-15#-M230 cm, 2nd bench sample, semi-brightTaiyuan Formation, CarboniferousNo.15 coal of Wukuang mine
WK-15#-KCchannel sampleTaiyuan Formation, CarboniferousNo.15 coal of Wukuang mine
BZ-2#-M425 cm, 4th bench sample, semi-brightShanxi Formation, PermianNo.2 coal of Buzi mine
BZ-2#-KCchannel sampleShanxi Formation, Permian,No.2 coal of Buzi mine
JSFH-15#-M626 cm, 6th bench sample, semi-brightTaiyuan Formation, CarboniferousNo.15 coal of Fenhong mine
KXYQ-9#-M130 cm, 1st bench sample, semi-dullTaiyuan Formation, CarboniferousNo.9 coal of Yunquan mine
KXYQ-15#-M523 cm, 5th bench sample, semi-brightTaiyuan Formation, CarboniferousNo.15 coal of Yunquan mine
TAHX-15#-M820 cm, 8th bench sample, brightTaiyuan Formation, CarboniferousNo.15 coal of Hongxiang mine,
GZ-15#-M425 cm, 4th bench sample, semi-brightTaiyuan Formation, CarboniferousNo.15 coal of Gaizhou mine
SJZ-15#-M430 cm, 4th bench sample, brightTaiyuan Formation, CarboniferousNo.15 coal of Shijiahzuang mine,
XJ-3#-M625 cm, 6th bench sample, brightShanxi Formation, PermianNo.3 coal of Xingjing mine
XJ-8#-M625 cm, 6th bench sample, semi-brightTaiyuan Formation, CarboniferousNo.8 coal of Xingjing mine
XJ-15#-M625 cm, 6th bench sample, semi-brightTaiyuan Formation, PermianNo.15 coal of Xingjing mine
Table 2. Basic characteristics of samples used.
SampleRo,max
(%)
Proximate Analysis
(wt%)
Ultimate Analyses
(wt%)
H/C
(Atom)
O/C
(Atom)
Maceral Composition
(vol%)
MadAdVdafSt, dCdafHdafNdafSt, dafOdaf *VIM
BZ-2#-M42.251.567.8411.130.4591.263.681.530.493.040.4840.02572.825.61.6
KXYQ-9#-M12.290.8613.349.661.9990.473.742.242.301.250.4960.01044.454.01.6
BZ-2#-KC2.321.7710.1610.410.4390.803.961.560.483.200.5230.02674.822.82.4
XJ-3#-M62.421.102.098.450.5791.954.001.380.582.090.5220.01779.215.65.2
XJ-15#-M62.421.104.287.301.9891.433.591.252.071.660.4710.01474.824.40.8
JSFH-15#-M62.531.447.615.081.7291.762.700.821.862.860.3530.02380.418.01.6
KXYQ-15#-M52.541.096.949.554.0289.063.542.084.321.000.4770.00878.020.81.2
GZ-15#-M42.551.9513.249.692.8487.553.530.993.274.660.4840.04052.834.812.4
XJ-8#-M62.672.0410.737.850.7691.343.531.350.852.930.4640.02459.835.44.8
SJZ-15#-M42.671.117.2410.090.7991.313.731.350.852.760.4900.02382.015.62.4
TAHX-15#-M82.680.8710.097.463.8989.963.261.564.330.890.4350.00777.621.21.2
WK-15#-M22.712.504.906.990.8792.213.081.340.912.460.4010.02054.844.01.2
WK-15#-KC2.722.1013.527.230.9091.713.391.391.042.470.4440.02062.834.42.8
G-LT-2.403.621.71-98.250.580.21-------
Ro,max—mean maximum reflectance of vitrinite; O—oxygen, M—moisture; A—ash yield; V—volatile matter; ad—air-dry basis; d—dry basis; daf—dry-ash-free basis; *—by difference; V—vitrinite; I—inertinite; M—minerals.
Table 3. XRD parameters of coal-based graphite.
Sample002/(°)FWHM002100/(°)FWHM100d002/nmLa/nmLc/nmNaveG
G-BZ-2#-M426.280.6342.370.990.338817.59113.52240.90760.05%
G-KXYQ-9#-M126.300.5942.330.700.338624.87614.43943.64462.99%
G-BZ-2#-KC26.290.7542.390.630.338724.64511.35934.54561.52%
G-XJ-3#-M626.250.6542.360.760.339222.91413.10539.63355.62%
G-XJ-15#-M626.280.4342.360.550.338831.66319.81159.46860.05%
G-JSFH-15#-M626.260.7342.310.930.339118.72211.66935.41357.10%
G-KXYQ-15#-M526.320.5242.390.770.338322.61916.38449.42565.93%
G-GZ-15#-M426.380.4942.370.630.337627.64317.38952.51174.72%
G-XJ-8#-M626.330.6242.350.820.338221.23713.741341.63067.40%
G-SJZ-15#-M426.340.4742.360.480.338136.28118.127254.61968.86%
G-TAHX-15#-M826.340.5042.390.630.338127.64517.039651.40168.86%
G-WK-15#-M226.380.3742.360.360.337648.37423.028369.21774.72%
G-WK-15#-KC26.390.3842.330.440.337439.57522.422867.44876.18%
G-LT26.240.4743.982.520.33936.94918.123554.40854.15%
Table 4. XRD parameters coal-based graphene.
Sample002/(°)FWHM002100/(°)FWHM100d002/nmLa/nmLc/nmNave
GS-BZ-2#-M424.5310.4043.4403.510.36264.9800.8163.251
GS-KXYQ-9#-M124.209.1543.5203.130.36755.5860.9273.523
GS-BZ-2#-KC24.599.9043.5603.820.36174.5780.8583.371
GS-XJ-3#-M624.7210.5743.5903.970.35994.4050.8043.233
GS-XJ-15#-M624.7210.3843.4903.070.35995.6950.8183.274
GS-JSFH-15#-M624.4810.5043.4003.140.36335.5660.8083.225
GS-KXYQ-15#-M524.429.2743.4403.140.36425.5670.9163.514
GS-GZ-15#-M424.498.4543.4503.020.36325.7881.0053.766
GS-XJ-8#-M624.759.7342.4703.150.35945.5310.8733.429
GS-SJZ-15#-M423.718.1343.4103.180.37495.4961.0433.781
GS-TAHX-15#-M824.318.5143.4802.950.36585.9260.9973.726
GS-WK-15#-M224.668.3243.4602.800.36076.2431.0213.829
GS-WK-15#-KC24.647.4243.4302.800.36106.2421.1444.170
GS-LT25.303.4543.163.070.35205.6802.3607.700
Table 5. Raman parameters of raw coal.
SampleD/cm−1G/cm−1G-D
(cm−1)
ID/IG
Frequency (cm−1)FWHMFrequency (cm−1)FWHM
BZ-2#-M41349.17256.391597.9766.66248.800.55
KXYQ-9#-M11345.69248.571599.2459.73253.550.53
BZ-2#-KC1347.40262.601600.5260.67253.120.53
XJ-3#-M61347.02257.071598.8661.85251.840.54
XJ-15#-M61341.25240.431598.9958.04257.740.52
JSFH-15#-M61338.98233.181601.3554.32262.370.50
KXYQ-15#-M51341.50240.131600.3658.25258.860.51
GZ-15#-M41346.69255.021599.7559.92253.060.52
XJ-8#-M61346.31254.361600.8058.42254.490.52
SJZ-15#-M41331.53210.291603.3848.50271.850.48
TAHX-15#-M81345.85233.181600.2659.91254.410.50
WK-15#-M21339.78226.381603.4751.34263.690.47
WK-15#-KC1333.46159.011601.5252.73268.060.34
Table 6. Raman parameters of demineralized coal.
SampleD/cm−1G/cm−1G-D
(cm−1)
ID/IG
Frequency (cm−1)FWHMFrequency (cm-1)FWHM
d-BZ-2#-M41360.88200.561581.8883.57221.000.64
d-KXYQ-9#-M11355.99194.401586.4295.18230.430.65
d-BZ-2#-KC1354.23279.781591.5266.66237.290.68
d-XJ-3#-M61356.57202.421588.3085.12231.730.49
d-XJ-15#-M61355.13215.171589.0083.94233.870.50
d-JSFH-15#-M61324.87158.241597.3254.13272.450.47
d-KXYQ-15#-M51350.27221.021593.0074.30242.730.47
d-GZ-15#-M41353.48203.031591.2184.03237.730.58
d-XJ-8#-M61351.49192.861589.1284.09237.630.47
d-SJZ-15#-M41334.65186.871601.6751.70267.020.39
d-TAHX-15#-M81335.81201.141592.9364.78257.120.43
d-WK-15#-M21327.86164.951597.2256.41269.360.33
d-WK-15#-KC1337.05204.881595.5660.58258.510.41
Table 7. Raman parameters of coal-based graphite.
SampleD/cm−1G/cm−1G-D
(cm−1)
ID/IG
Frequency (cm−1)FWHMFrequency (cm−1)FWHM
G-BZ-2#-M41352.5837.821583.4030.95230.820.25
G-KXYQ-9#-M11348.2142.181579.3533.57231.140.29
G-BZ-2#-KC1351.7739.301583.5634.24231.790.33
G-XJ-3#-M61351.7139.891581.1929.32229.480.19
G-XJ-15#-M61350.8843.271582.1128.08231.230.19
G-JSFH-15#-M61350.6739.931582.1729.39231.500.20
G-KXYQ-15#-M51350.4736.561580.4126.01229.940.12
G-GZ-15#-M41352.2738.481582.2927.05230.020.16
G-XJ-8#-M61353.7333.391583.0525.04229.320.10
G-SJZ-15#-M41351.0736.181580.3926.56229.320.09
G-TAHX-15#-M81350.3538.471578.8324.25228.480.08
G-WK-15#-M21352.4340.551576.2325.39223.800.06
G-WK-15#-KC1350.5034.531579.8824.82229.380.08
Table 8. Raman parameters of coal-based graphene.
SampleD/cm−1G/cm−1G-D
(cm−1)
ID/IG
Frequency (cm−1)FWHMFrequency (cm−1)FWHM
GS-BZ-2#-M41346.31116.441594.2678.54247.951.02
GS-KXYQ-9#-M11342.21143.891581.9791.98239.760.97
GS-BZ-2#-KC1342.21138.581594.2684.06252.050.99
GS-XJ-3#-M61346.31140.761602.4682.26256.150.98
GS-XJ-15#-M61338.11141.491598.3684.78260.251.00
GS-JSFH-15#-M61346.31153.071598.3687.14252.051.00
GS-KXYQ-15#-M51338.11123.161598.3679.01260.250.98
GS-GZ-15#-M41346.31149.511586.0792.83247.950.94
GS-XJ-8#-M61346.31166.671594.2690.36247.950.93
GS-SJZ-15#-M41342.21165.461594.2685.43252.050.91
GS-TAHX-15#-M81346.31154.621598.3687.15252.050.91
GS-WK-15#-KC1350.41158.961598.3683.48247.950.90
GS-WK-15#-M21354.51156.691598.3684.82243.850.90
Table 9. Comparison of XRD and HRTEM characterization parameters.
Sampled002 (nm)Nave
XRDHRTEMXRDHRTEM
GS-BZ-2#-M40.3630.4333.253.00
GS-KXYQ-9#-M10.3680.4573.524.00
GS-BZ-2#-KC0.3620.4133.374.00
GS-XJ-3#-M60.3600.5143.235.00
GS-XJ-15#-M60.3600.4223.275.00
GS-JSFH-15#-M60.3630.4143.235.00
GS-KXYQ-15#-M50.3640.4703.516.00
GS-GZ-15#-M40.3630.4253.776.00
GS-XJ-8#-M60.3590.4143.436.00
GS-SJZ-15#-M40.3750.5123.787.00
GS-TAHX-15#-M80.3660.4383.737.00
GS-WK-15#-M20.3610.3923.837.00
GS-WK-15#-KC0.3610.3944.178.00
Average0.3630.4383.555.62
0.4015.00
Publisher’s Note: MDPI stays neutral with regard to jurisdictional claims in published maps and institutional affiliations.