Article

LA-ICP-MS Mapping of Barren Sandstone from the Proterozoic Athabasca Basin (Canada)—Footprint of U- and REE-Rich Basinal Fluids

1
Department of Geology, University of Regina, Regina, SK S4S 0A2, Canada
2
Geological Survey of Canada, Ottawa, ON K1A 0E8, Canada
3
School of Earth Sciences and Resources, China University of Geosciences, Beijing 100083, China
*
Author to whom correspondence should be addressed.
Minerals 2022, 12(6), 733; https://doi.org/10.3390/min12060733
Submission received: 16 May 2022 / Revised: 2 June 2022 / Accepted: 4 June 2022 / Published: 8 June 2022
(This article belongs to the Special Issue Geochemistry, Mineral Chemistry and Geochronology of Uranium Deposits)

Abstract

:
The Proterozoic Athabasca Basin hosts a large number of high-grade, large-tonnage unconformity-related uranium (U) deposits, many of which are also enriched in rare earth elements (REE). The basin also contains hydrothermal REE mineralization unassociated with U. Previous studies postulated that U and REE were derived from either the basin or the basement; however, the exact source of the metals remains ambiguous. This study provides evidence of U- and REE-rich fluids throughout the Athabasca Basin through laser ablation-inductively coupled plasma-mass spectrometry (LA-ICP-MS) mapping of barren sandstone distal to mineralized areas. The results indicate that elevated U and REE concentrations mainly occur in the matrix; there are strong positive correlations between U and REE, Th, P and Sr, and moderate positive correlations between U and Zr, Ba, Fe, Al, K and Ca, but the few spots with the highest U are unrelated to these elements. Quantitative evaluation of the element correlations, together with scanning electron microscopy-energy dispersive spectroscopy (SEM-EDS) analysis, suggests that most of the elevated U and REE are hosted in aluminum phosphate sulfate (APS) minerals rather than apatite and monazite. As the APS minerals are of diagenetic-hydrothermal origin, the results testify to the presence of U- and REE-rich fluids within the Athabasca Basin. The elevated Th/U ratio (~10) and REE pattern (strong heavy rare earth element (HREE) depletion) are consistent with a model in which large amounts of U and REE (especially HREE) were leached from the sandstone within the Athabasca Basin and contributed to U and REE mineralization near the unconformity between the sedimentary rocks in the basin and underlying basement rocks. This study demonstrates that LA-ICP-MS mapping can be effectively used to evaluate microscale distribution of elements and their mobility in sedimentary rocks to address mineralization related problems.

1. Introduction

The Athabasca Basin in central-northern Canada (Figure 1a) is known for its rich endowment of unconformity-related uranium (URU; see the appendix for all abbreviations and acronyms used in this paper) deposits with high grades and large tonnages [1,2], which accounts for ~13% of the current global uranium production [3]. It has been shown that most of the URU deposits are also enriched in rare earth elements (REE), and there are REE occurrences within the Athabasca Basin that are unassociated with U mineralization [1,4,5,6,7,8] (Figure 1b). It is generally agreed that the U and REE mineralization is related to basinal brines from the Athabasca Basin, which were sourced from connate fluids that originated from seawater evaporation [9] and are characterized by salinities mostly between 20 wt.% and 30 wt.% NaCl equivalent and temperatures up to ~200 °C [8,10,11,12,13,14]. However, significant uncertainties exist regarding whether U was mainly derived through interaction of the basinal brines with detrital minerals in the basin [4,10,12,15,16,17,18,19] or from the underlying basement rocks [20,21,22,23,24,25], and whether or not U and REE were derived from the same sources [4,5,7,8]. These controversies are in part due to the fact most of the previous studies were conducted in mineralized zones and surrounding areas, where geochemical signatures indicative of the sources of metals may have been masked or complicated by mineralization processes involving mixing of fluids from different sources and fluid–rock reaction. Thus, in order to better understand the sources of U and REE, samples from potential source areas distal (by tens of kilometers) to known mineralization should be investigated in addition to those from the mineralized areas.
A recent study of fluid inclusions in quartz overgrowths from barren sandstone in the Athabasca Basin [10,26] indicates that diagenetic fluids enriched in U and REE were widely developed within the basin, lending support to the model in which both U and REE in the URU deposits were sourced from the basin, although this does not necessarily discount the possibility that the basement rocks also contributed significant amounts of U and REE. In light of these new findings and given the observation that the sedimentary rocks currently preserved in the Athabasca Basin have lower U and REE content than the basement rocks and crustal averages [27,28,29], it is of great interest to examine whether there are other geochemical records in the sedimentary rocks that support the presence of U- and REE-rich fluids throughout the Athabasca Basin. Major and trace elements of barren sandstones from the Athabasca have been used to examine the mobility of ore-forming elements in previous studies [27,28,29], but such studies could not provide direct evidence for U- and REE-rich fluids due to the nature of the bulk analysis.
In this study, we conducted laser ablation-inductively coupled plasma-mass spectrometry (LA-ICP-MS) mapping of a sandstone sample that contains U- and REE-rich fluid inclusions [10,26], with an aim to analyze the distribution of elements in the sandstone at a microscale and explore correlations between U, REE and other elements that may reveal the host minerals of U and REE. This was supplemented by scanning electron microscopy-energy dispersive spectroscopy (SEM-EDS) analyses to help identify fine-grained minerals in the matrix. Furthermore, the compositional data of individual LA-ICP-MS analytical spots were used to construct REE patterns and Th/U ratios indicative of the relative mobility of different elements. These data were then compared with previous studies of U- and REE-bearing minerals in the Athabasca Basin and in areas surrounding URU and REE deposits [4,5,7,15,16,30,31,32,33,34], to discuss the contribution of basin-sourced U and REE in URU and REE mineralization.
Figure 1. (a) A map of Canada indicating the location of the Athabasca Basin; (b) a geological map of the Athabasca Basin showing the distribution of unconformity-related uranium (URU) deposits and a hydrothermal REE deposit (Maw Zone). Drill holes from which the samples in this study were collected (WC-79-1 and BL-08-01) are indicated by the circles; (c) a simplified stratigraphic column of the Athabasca Basin (modified from [35]).
Minerals 12 00733 g001

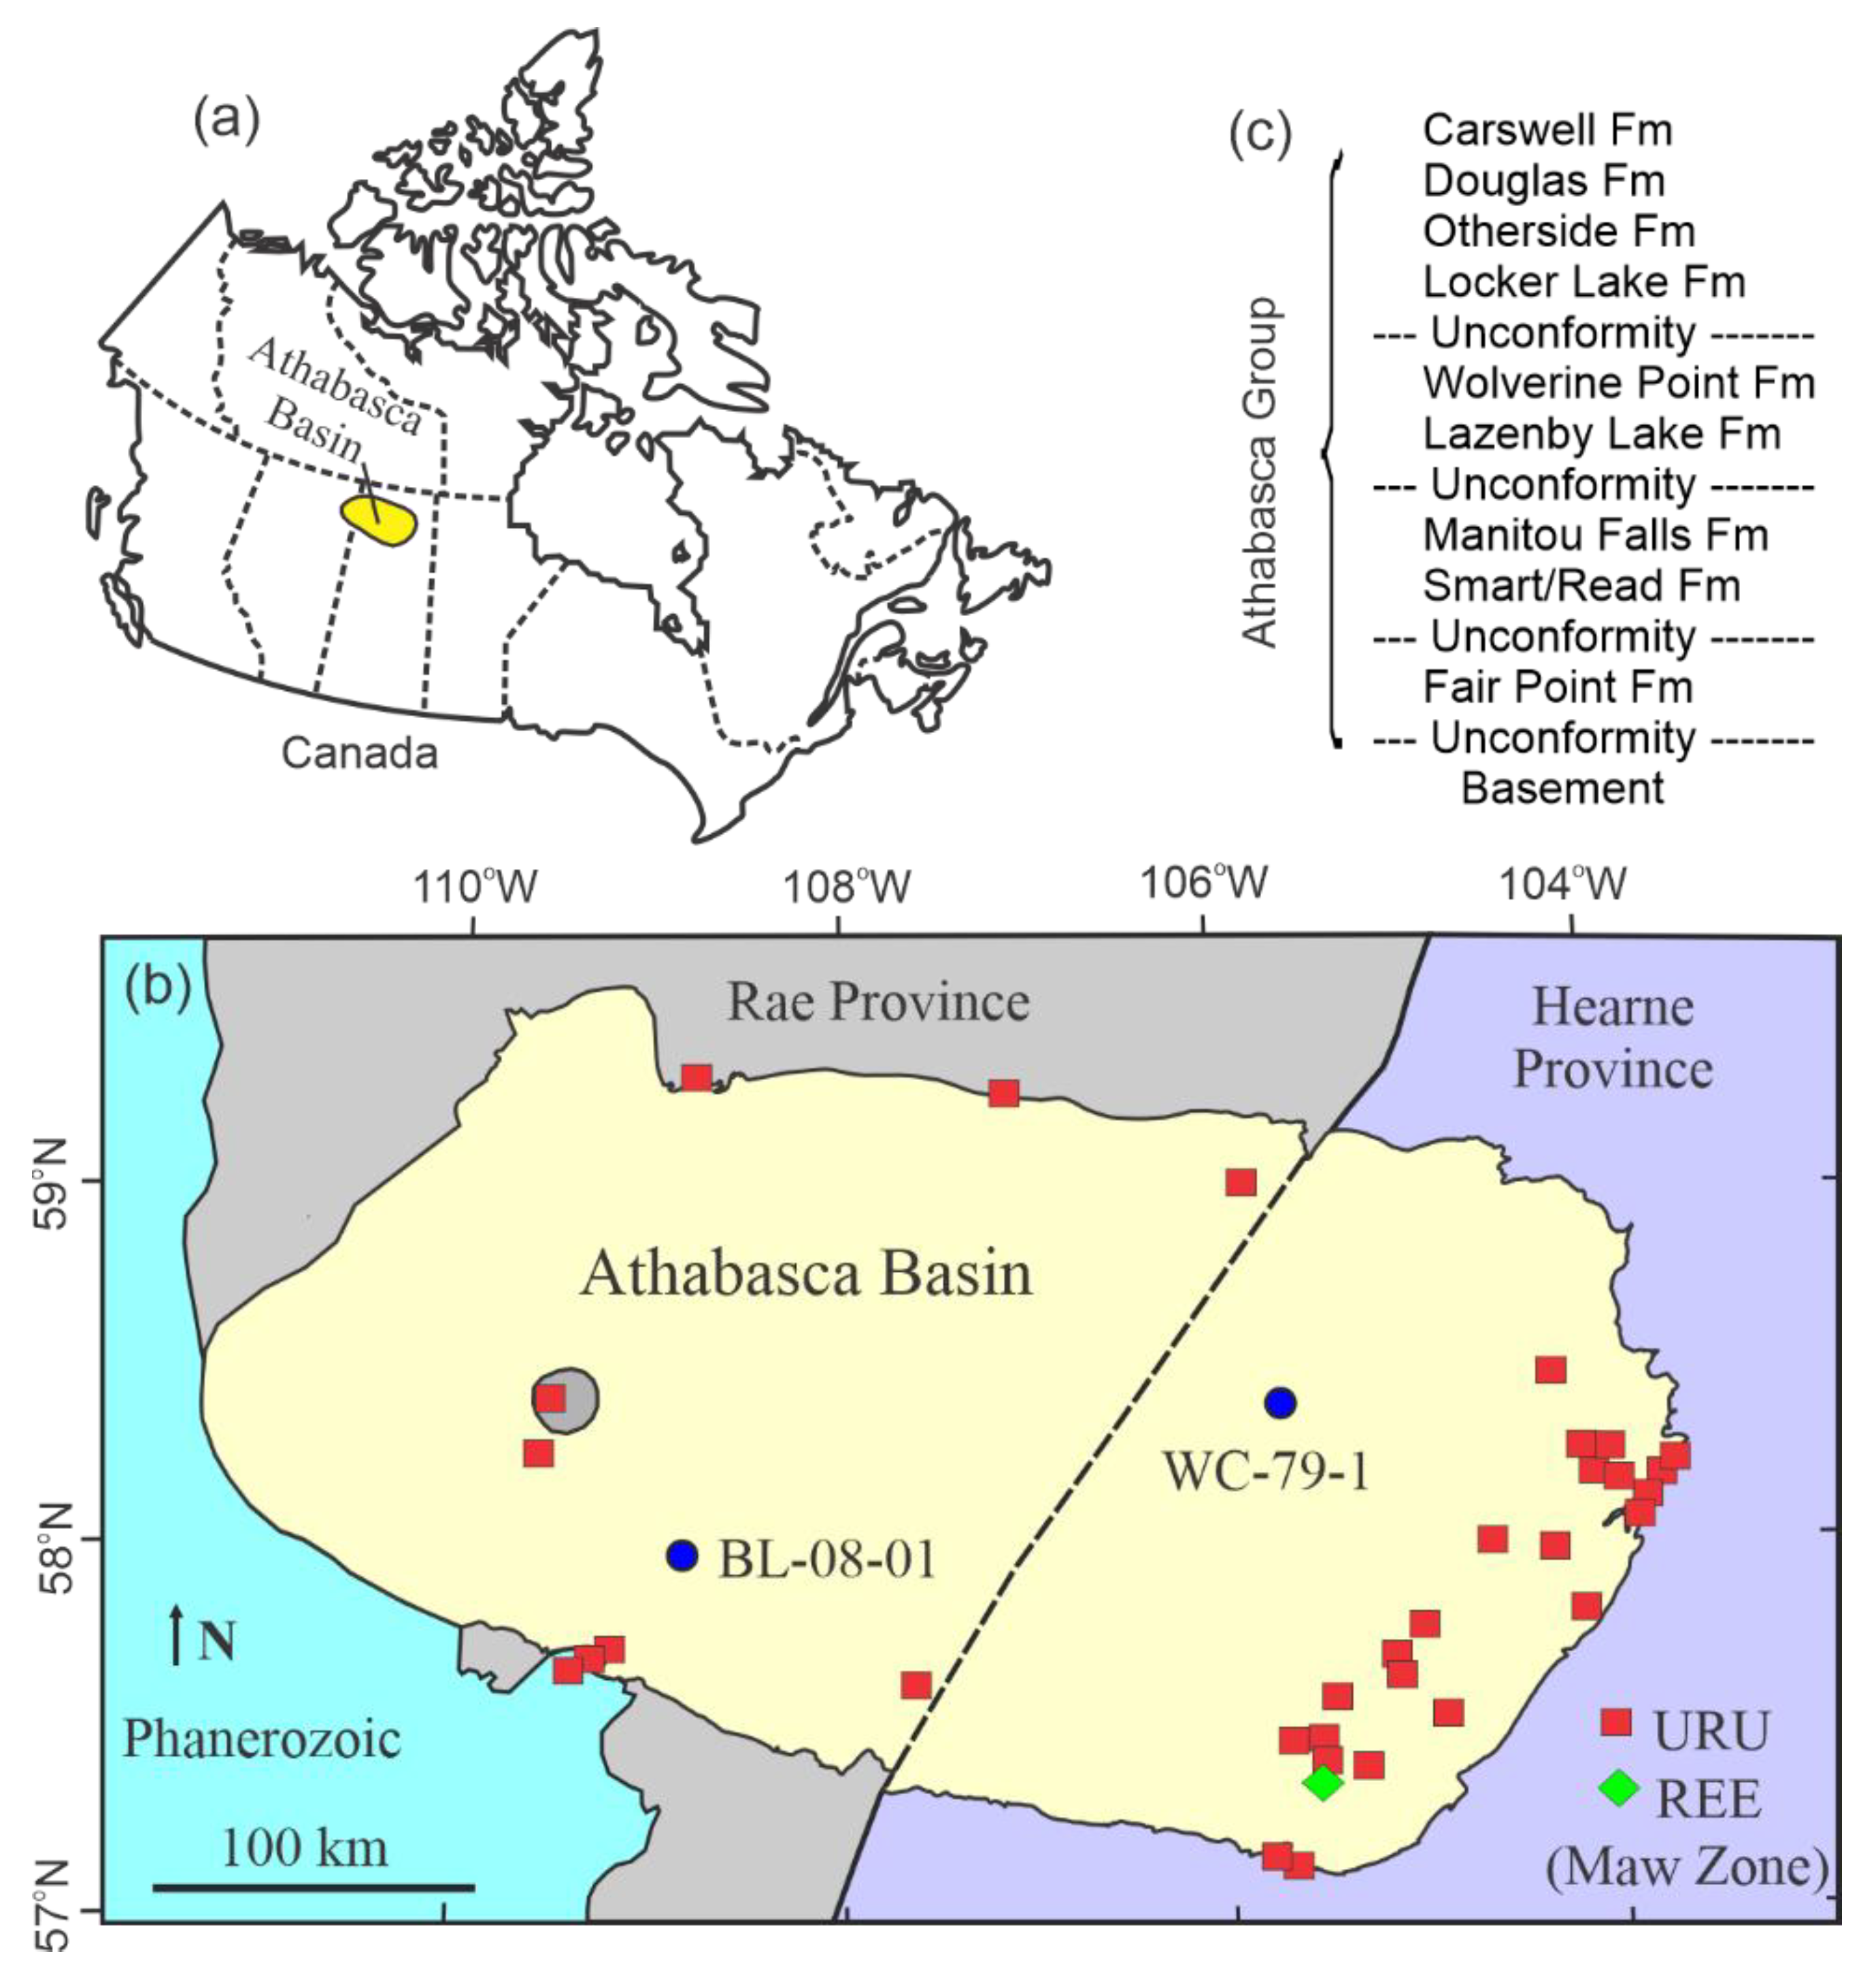
2. Geological Background

The Athabasca Basin is a Paleo- to Mesoproterozoic (ca. 1750–1500 Ma; [35]) intracratonic basin developed upon the Archean to Paleoproterozoic basement of the Rae and Hearne provinces (Figure 1b). The sedimentary rocks in the basin make up the Athabasca Group [35], which is part of the Athabasca Supergroup that includes the Paleoproterozoic Martin Group north of the Athabasca Basin [36]. The Athabasca Group consists of, from bottom to top, the Fair Point, Smart/Read, Manitou Falls, Lazenby Lake, Wolverine Point, Locker Lake, Otherside, Douglas, and Carswell formations (Figure 1c; [35]). Most of the sedimentary units consist of fluvial sandstone, with the exception of the Wolverine Point Formation (marginal marine mudstone/siltstone/sandstone), Douglas Formation (marine mudstone/siltstone/shale), and Carswell Formation (marine carbonates).
Most of the sandstones of the Athabasca Group are quartz arenite with quartz accounting for more than 99% of the framework grains and rare detrital feldspars [1,16,37,38]. Minor amounts of detrital grains of Fe–Ti oxides, muscovite, tourmaline, zircon, fluorapatite and monazite are variably present [4,7,11,15,16,28,33]. The matrix of the sandstones consists of variable amounts of kaolinite, dickite, illite, sudoite, iron oxides and hydroxides [11,16,28,39]. Diagenetic minerals include quartz (mainly as overgrowths), kaolinite, dickite, illite, hematite, anatase, fluorapatite, xenotime and aluminum phosphate sulfate (APS) minerals, especially the crandallite group [4,7,11,16,28,31,33,34].
The URU deposits are associated with reactivated basement faults crosscutting the unconformity between the basin and the basement, and can be divided into two sub-types: contact-hosted deposits located at the contact of the unconformity and mainly hosted by sandstone immediately above the unconformity, and basement-hosted deposits up to ~1 km below the unconformity [1,2,40]. Both sub-types contain elevated concentrations of total REE (ƩREE, up to ~1 wt%; [6]), but many of the contact-hosted deposits contain significant amounts of other elements including Ni, Co, As and Cu (polymetallic), whereas the basement-hosted ones are mainly composed of U (monometallic) [1,4]. The contact-hosted deposits have relatively high ƩREE and low heavy REE (HREE) to light REE (LREE) ratios (HREE/LREE~1) compared to the basement-hosted deposits [1,4,6]. A hydrothermal REE (xenotime) deposit without associated U mineralization occurs within the Athabasca Group sandstone about 150 m above the unconformity at Maw Zone, which is spatially close to a number of URU deposits along the same regional trend (Figure 1b) [6,7,8,41,42,43]. Similar REE occurrences at a much smaller scale are present elsewhere in the Athabasca Basin [6].

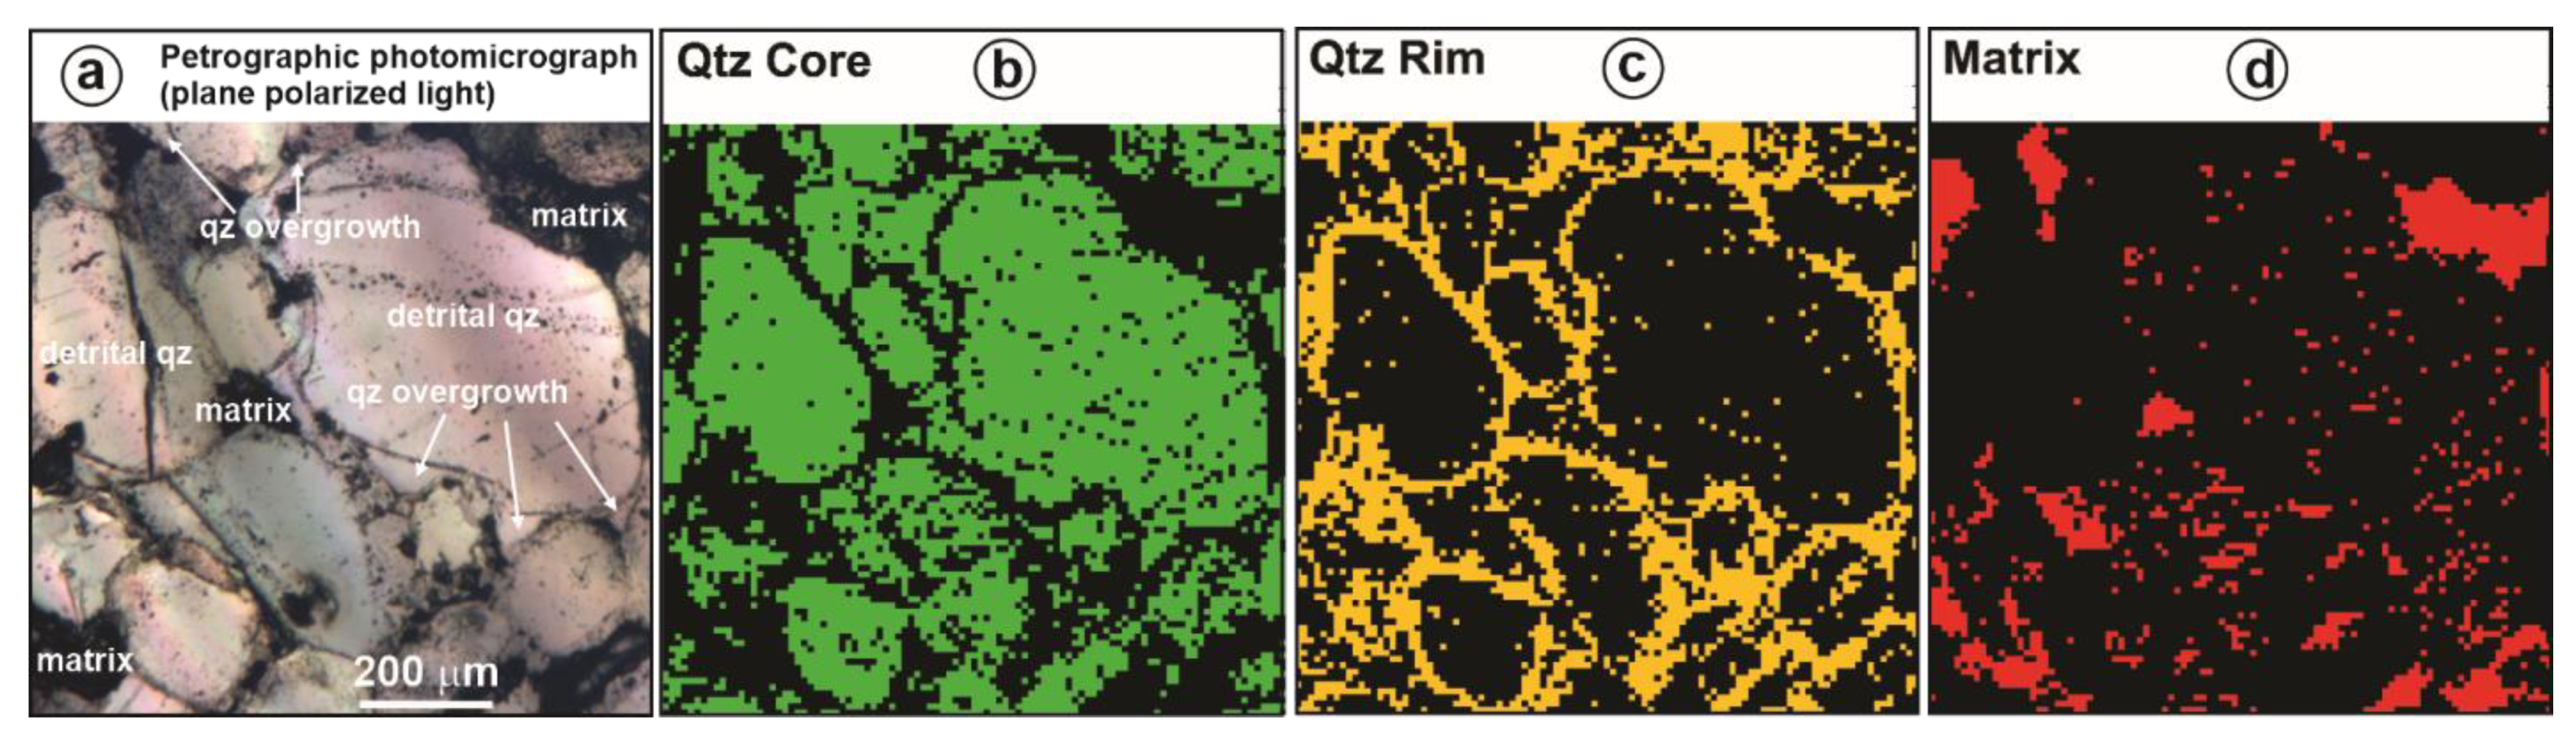
3. Samples and Methodologies
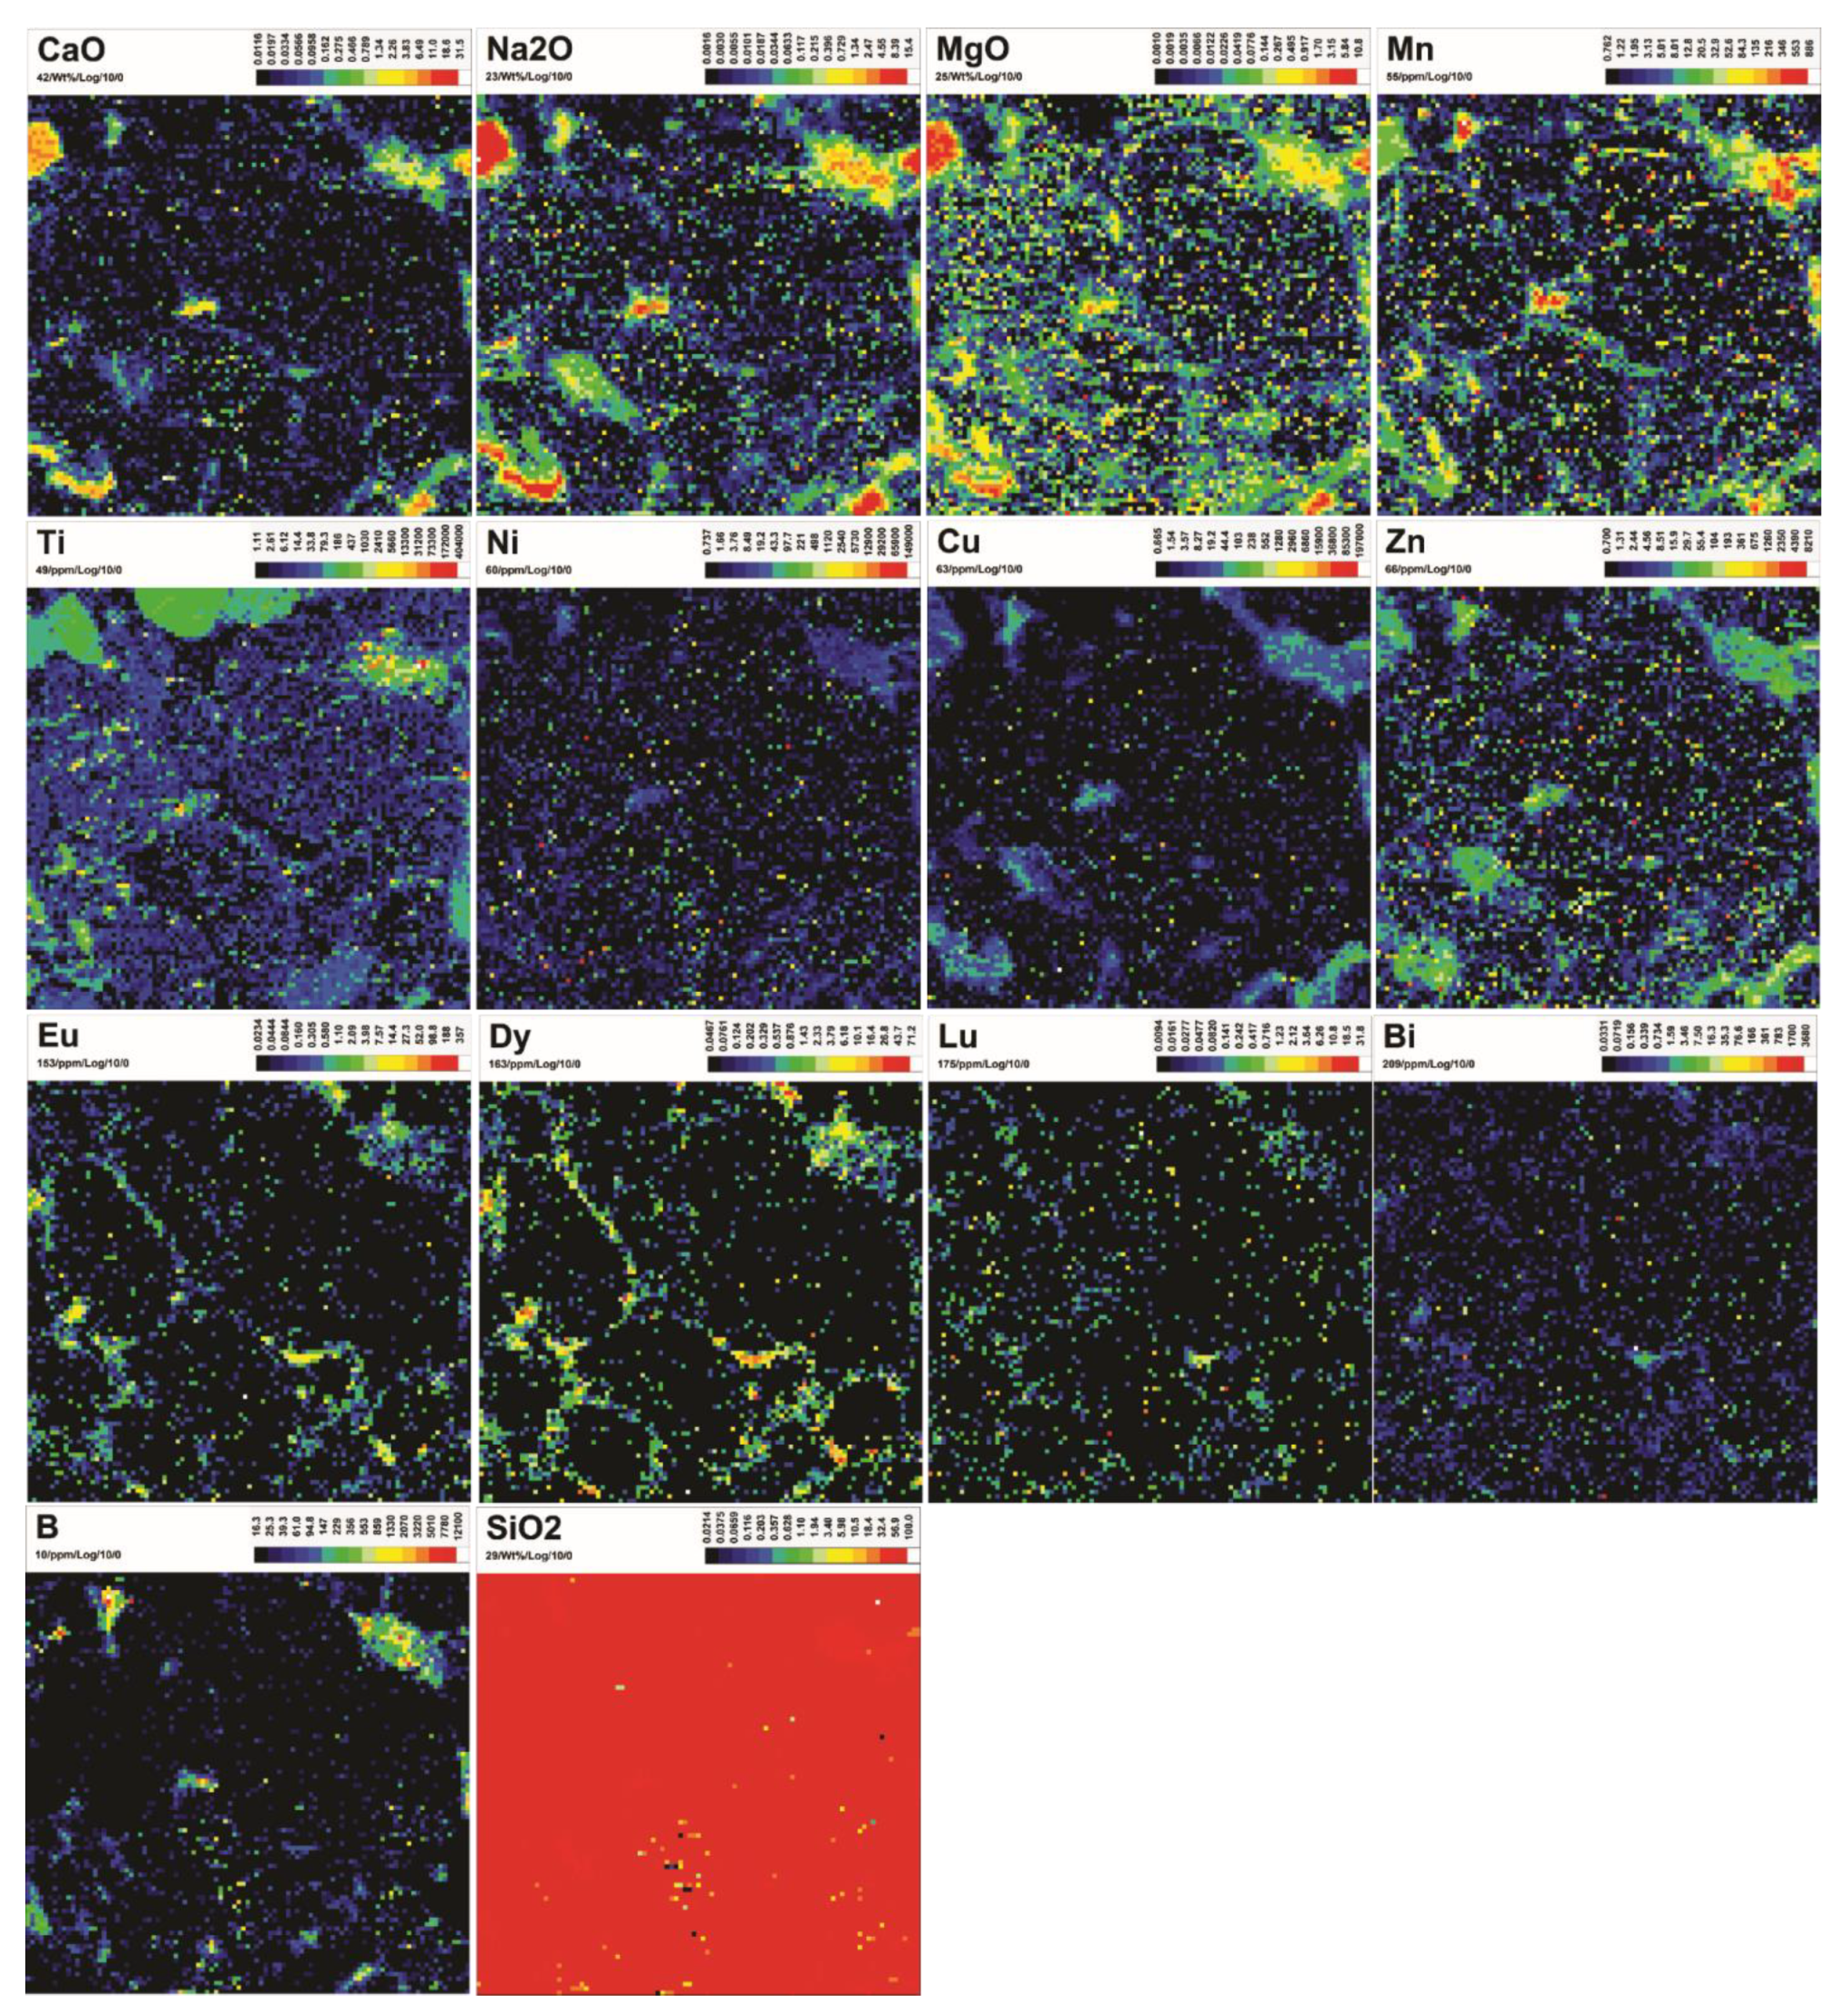
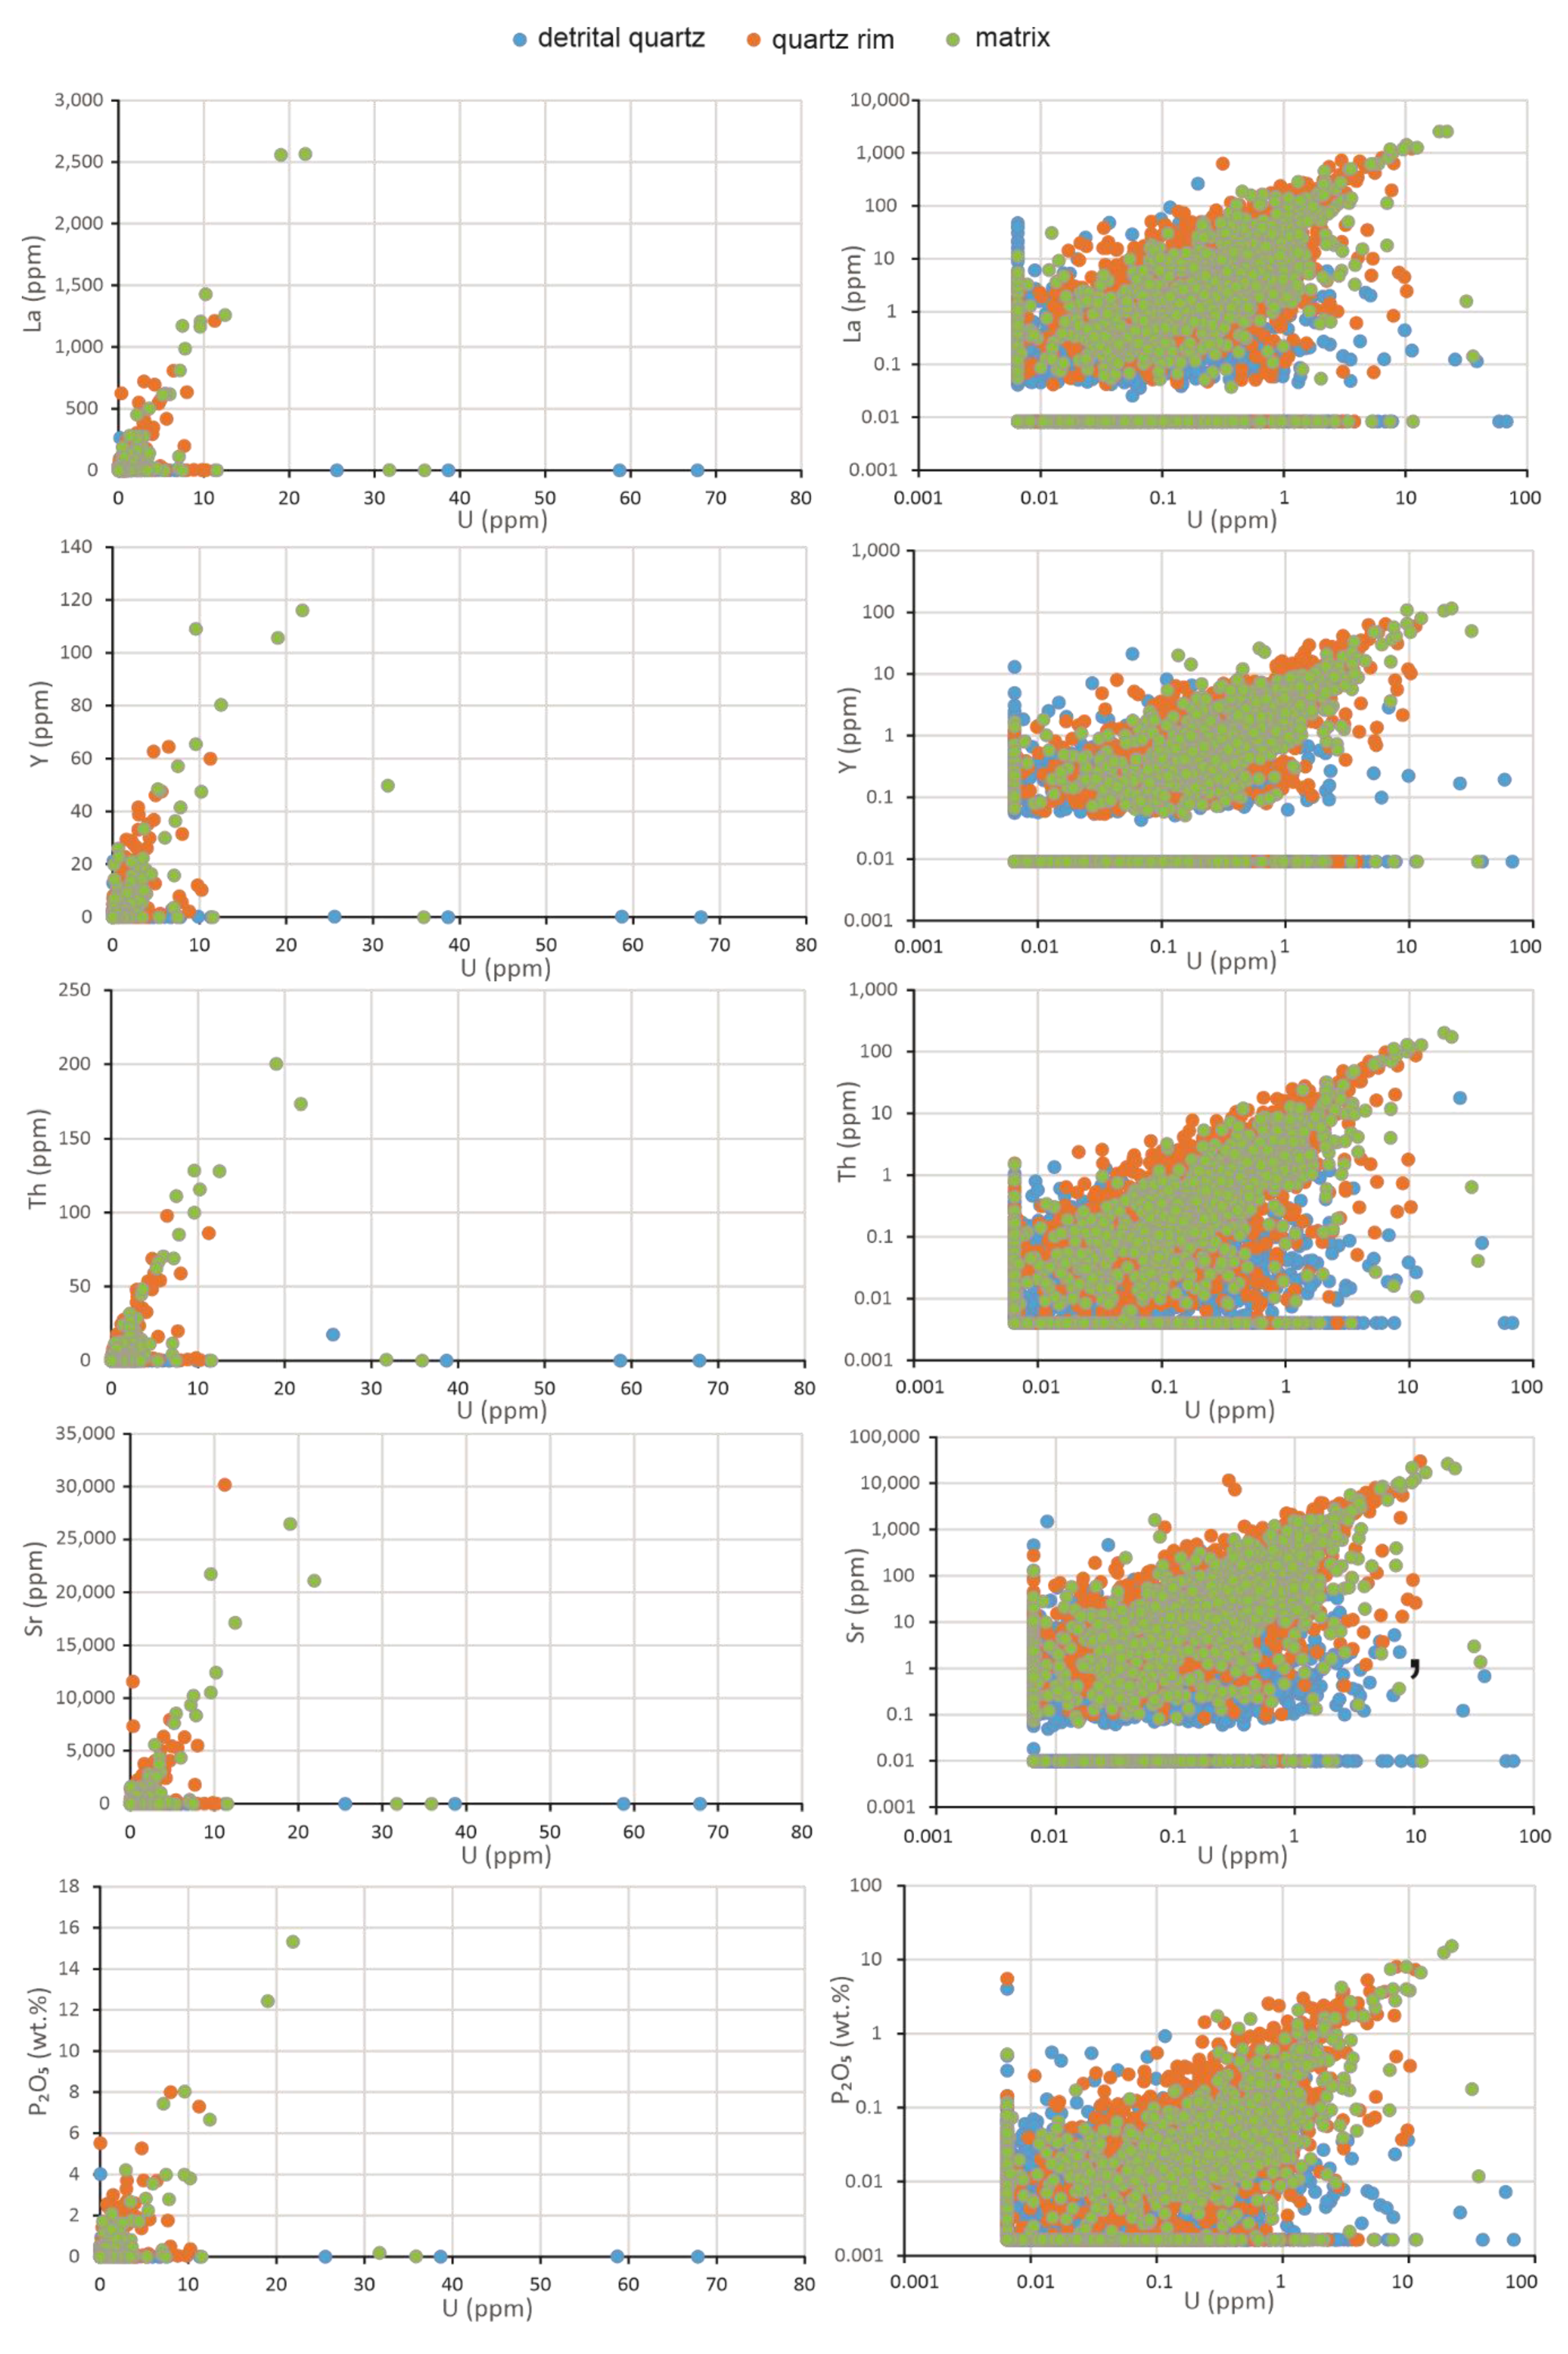
Doubly polished sections of three sandstone samples that were previously analyzed for fluid inclusions in quartz overgrowths with LA-ICP-MS [10,26] were selected for LA-ICP-MS mapping and SEM-EDS analysis. The sample for LA-ICP-MS mapping (#1425) was collected from drill hole WC-79-1 (Figure 1b), at the depth of 576.5 m, in the Manitou Falls Formation. This sample, plus one (#1428) from the same drill hole at the depth of 613.7 m (also in the Manitou Falls Formation) and another one (#1441) from drill hole BL-08-01 (Figure 1b), at the depth of 41.5 m, in the Wolverine Point Formation, were selected for SEM-EDS analysis. These samples were selected for analysis because U- and REE-rich fluid inclusions occur in the quartz overgrowths; the purpose is to examine if U- and REE-rich diagenetic minerals are preserved in addition to the fluid inclusions.
The LA-ICP-MS mapping was conducted at the Geological Survey of Canada (Ottawa, Canada) using a Photon Machines Analyte G2 193 nm laser ablation system equipped with a Helex dual-volume cell and coupled to an Agilent 7700x ICP-MS. The concentrations of trace elements are reported as part per million (ppm), and those of major elements are expressed as oxides in weight percent (wt%) converted from elemental values. The mapping work followed the methodology of Lawley [44] and is described in Chi [10]. 2D element concentration maps were prepared using a series of linescans across the sample surface, using a fluence of 8.0 J/cm2 (88.1% of 6 mJ), a spot size of 10 µm, a repetition rate of 30 Hz and a scan speed of 5 µm/s. A pre-ablation pass was completed before every analysis to clean the sample surface. The laser spot size and scan speed were optimized such that the laser would advance one equivalent spot size every 2 s. The ablation aerosol was transported out of the Helex cell using 1 L/min of helium gas and carried to the ICP-MS through 1.5 m of 2 mm (inner diameter) Teflon tubing. Prior to entering the ICP-MS, the aerosol and helium gas were mixed with ~1 L/min of argon gas. The total duty cycle time to measure all masses on the ICP-MS (in time-resolved analysis mode) was 250 ms, and utilizing a scan speed of 5 µm/s allowed for eight full scans of the mass spectrometer every 2.0 s (the equivalent of one spot diameter along the line scan). These eight scans were averaged to form one 10 µm pixel on the map.
The raw, time-resolved signals were calibrated using linescan analyses of GSE-1G for most major and trace elements [45] and internal reference materials pyrrhotite (sulfur calibration) and calcite (carbon calibration), and were normalized to 100% total element (or element oxide) concentration on a pixel-to-pixel basis. Reference materials were analyzed every 20 unknowns (approximately every hour) to account for instrument drift during the mapping run. Data reduction was performed using LAMtrace and pixeLAte (versions 410 and 152, respectively).
Because individual analytical spots may be located in the detrital quartz, quartz overgrowth or matrix, a set of criteria were established to classify each component in the map data; however, since the transitional area between the detrital quartz and matrix does not always represent quartz overgrowth, it is labelled as ‘quartz rim’ instead of quartz overgrowth. Quartz grains (including detrital quartz and quartz overgrowth) were distinguished from the matrix by the concentration of SiO2 (>80% for quartz grains and ≤80% for matrix), whereas quartz rims were distinguished from detrital quartz by the content of Ba (>5 ppm for quartz rim and ≤5 ppm for detrital quartz). The digital images of the three components based on these criteria match well with the photomicrograph (Figure 2). Each analytical spot was assigned one of the three components (detrital quartz, quartz rim, and matrix) and the analytical results were grouped accordingly, which were then used for further analysis such as bivariate diagrams and REE patterns.
SEM-EDS analyses were conducted at Saskatchewan Research Council—Geoanalytical Laboratories using an FEI Quanta 650F instrument. The voltage was set at 25 kV and the acquisition was 60 s for EDS analysis.

4. Results

The LA-ICP-MS mapping data consist of analytical results of 9306 evenly spaced spots, which are provided in Supplementary Table S1. The maps indicate that most elements (except Si) are enriched in the matrix (and quartz rim to a lesser extent) relative to the detrital quartz core (Figure 3 and Figure 4). Elements that are strongly and distinctly enriched in the matrix include Al, K, Li, Fe, Sr, Ba, Y, Zr, Hf, La, Ce, P, U, Th and Pb (Figure 3). Elements that are moderately to weakly enriched in the matrix include Ca, Na, Mg, Mn, Ti, Ni, Cu, Zn, Eu, Dy, Lu, B and Bi (Figure 4).
Bivariate diagrams show strong positive correlations between U and REE, Y, Th, Sr, and P (Figure 5). However, it is notable that the few spots that contain the highest U (>25 ppm) have very low REE, Y, Th, Sr and P (Figure 5). The prominent U–Th trend defines a Th/U ratio of ~10 (Figure 5). There are generally no or poor correlations between U and the other elements, including Al, Na, K, Ca, Mg, Fe, Ti, Ba and Zr, although partial positive correlations between U and Ba, Zr, Al, K, Ca and Fe may be discernable (Figure 6).
Phosphorus (P) shows positive correlations with La, Th, Sr and Y, partial positive correlations with Ba and Ca and poor correlations with Al (Figure 7).
The detrital quartz has generally low REE contents that are close to or below detection limits, whereas the quartz rim and matrix show variable REE concentrations with prominent LREE-enriched patterns (Figure 8a,b). Many of the analytical spots, especially those in the matrix, are one to two orders of magnitude more enriched in REE (especially LREE), and have much higher LREE/HREE ratios than the Athabasca sandstone, average crustal sandstone and basement gneisses, which are in sharp contrast with the URU ores and REE-mineralized sandstone characterized by bell-shaped REE patterns with HREE enrichment (Figure 8).
The SEM-EDS analyses indicate the presence of detrital zircon (Figure 9a) and titanium oxide, as well as diagenetic APS (Figure 9b) and barite (Figure 9c), in addition to clay minerals in the matrix.

5. Discussion

Previous LA-ICP-MS analyses of fluid inclusions in quartz overgrowths in the Athabasca Basin sandstone indicate that U- and REE-rich fluids developed from connate fluids in the Athabasca Basin, which suggests that basinal fluids were an important source of these metals for URU and REE mineralization, despite low present-day concentrations in the sedimentary rocks [10,26]. The results of this study further support these findings and the notion that the sediments in the Athabasca Basin represent an important source of U and REE for the URU and REE mineralization, as discussed below.
Although the U and REE concentrations in the Athabasca sandstone are generally lower than average crustal abundances as well as the basement rocks [4,27,28,29], a significant number of data (~4%) in the present study, especially in the matrix and to a lesser extent in the quartz rim, yield U concentrations between 2 and 20 ppm (Figure 5 and Figure 6), which are comparable with or higher than basement rocks. These high U values show no or poor correlations with Ti, Fe and Al (Figure 6), suggesting that Ti–Fe oxides and clay minerals are not the major carriers of U. In contrast, the strong positive correlations between U and REE, Y, Th, Sr, and P suggest that monazite, apatite and/or APS might be the host minerals for both U and REE. However, the highest U data (>25 ppm U) are unrelated to any other elements and most of them are located within detrital quartz (Figure 5 and Figure 6), which may be attributed to fluid inclusions or nanoscale uraninite inclusions in the detrital quartz.
In order to evaluate potential P-bearing minerals, the concentrations of Ca, P, REE + Y and Al were converted to molar values and plotted in bivariate diagrams including Ca vs. P, REE + Y vs. P, and Al vs P (Figure 10). The main P-bearing minerals considered were apatite (Ca10(PO4)6(OH,F,Cl)2), monazite (REEPO4), xenotime (YPO4) and APS minerals (AB3(XO4)2(OH)6), where the A-site contains Na, K, Ca, Ba, Sr, Ag, Pb, U and REE, the B-site can be Al, Fe, Cu and Zn, and the X-site is either P or S. There is a positive correlation between P and REE + Y and a partial positive correlation between P and Ca, but the P/(REE + Y) and P/Ca ratios do not fit those expected for monazite–xenotime and apatite (Figure 10a,b), indicating that these minerals are not the P and REE carriers. The most likely minerals hosting P and REE are APS minerals, which were detected by SEM-EDS in this study (Figure 9b) and have been widely reported in the Athabasca sandstones in previous studies [4,7,11,15,16,28,29,31,33,41]. The poor correlation between Al and P (Figure 10c) is most likely due to the small grain sizes of the APS minerals and contamination by the clay minerals that are ubiquitously associated with the APS minerals.
One important point from the above discussion is that the major P and REE carriers in the sandstone (mainly in the matrix) are not apatite or monazite, which may be detrital, but rather APS minerals, which are diagenetic-hydrothermal. Furthermore, these APS minerals are also the major U and REE carriers based on the positive correlations between U, REE and P (Figure 5). Thus, these APS minerals provide additional indicators of U- and REE-rich fluids in the Athabasca Basin in addition to the fluid inclusions in the quartz overgrowths [10,26]. The leaching of U from the detrital materials in the basin is supported by higher Th/U ratios (~10) in the sandstone as revealed in this study (Figure 5) than average arenites (~3.3), shales (~2.9) and granites (~3.3) [48]. The leaching of the REE is reflected by the REE patterns, as discussed below.
The overall higher ƩREE contents in the unconformity contact-hosted URU deposits, which are associated with egress fluid flow from the basement into the basin, than in the basement-hosted URU deposits associated with ingress fluid flow from the basin into the basement [4], imply that more REE may have been derived from the basement than from the basin. However, the major overlap between the ingress- and egress-style URU deposits in terms of ƩREE [6] suggests that both basinal fluids and basement fluids (including those initially from the basin, but significantly modified through extensive fluid–rock interactions in the basement) can carry significant amounts of REE. The REE patterns of the Athabasca sandstone obtained in this study show significant HREE depletion (Figure 8a,b), indicating more significant leaching of HREE than LREE in the basin. This is also reflected by the whole-rock REE patterns of the sandstone in the Manitou Falls and Lazenby Lake formations, which are significantly more HREE-depleted than the overlying, less permeable Wolverine Point Formation and the average crustal sandstone (Figure 8c). The preferential leaching of HREE in the sandstone may explain why the ingress-style URU deposits have higher HREE/LREE ratios (> 1) than the egress-style URU deposits [1,4,6], the former being represented by the McArthur River deposit and the latter by the Cigar Lake deposit (Figure 8c). It may also be partially responsible for the HREE enrichment in the REE mineralization within the basin (Maw Zone; Figure 8c).
There may be two main reasons why HREE could have been preferentially leached in the Athabasca Basin. First, a number of studies, including the present one (Figure 9a), have shown that detrital zircon grains were widely present in the Athabasca sandstones [4,7,11,15,28,33]. The dissolution of zircon, which is enriched in U and HREE, could produce a U- and HREE-rich fluid [4,7,15]. Secondly, it has been shown that at temperatures ~150 °C, the solubilities of REE-chloride complexes are similar between LREE and HREE, in contrast to preferential dissolution of LREE at higher temperatures [49,50]. Since the concentrations of HREE were originally much lower than LREE in continental rocks such as average crustal sandstone (Figure 8c), removal of equal amounts of LREE and HREE would result in more significant depletion of HREE than LREE. The development of basinal brines [11,12,13] in conjunction with basin-scale fluid convection [51] and fluid–rock interaction enhanced by an elevated geothermal gradient [51,52], facilitated the leaching of U and REE in the Athabasca Basin. The overall lower temperatures in the basin than the basement favor relatively high HREE leaching in the basin compared to the basement.

6. Conclusions

The LA-ICP-MS mapping of barren sandstone from the Athabasca Basin indicates that more detailed information about major and trace element concentrations and distribution can be obtained from such studies than from bulk analyses, and the results have important implications on mobility of metals, in this case U and REE, and their mineralization in the basin. This study indicates that U and REE are concentrated in the matrix of Athabasca sandstone and there are strong positive correlations between U, REE, Y, Th, Sr and P. Molar ratios of these elements indicate that APS minerals, rather than monazite and apatite, are the most important carriers of U and REE. As the APS minerals are of diagenetic to hydrothermal origin, the enrichment of U and REE in them represents an indicator of U- and REE-rich fluids in the basin, which reinforces the model in which significant amounts of U and REE were leached from the Athabasca Basin sediments and contributed to URU and REE mineralization. This notion is further supported by the high Th/U ratios (~10) revealed by the Th–U correlation and by the REE patterns showing strong HREE depletion, which explains the enrichment of REE in the URU and REE deposits in the basin.

Supplementary Materials

The following supporting information can be downloaded at: https://www.mdpi.com/article/10.3390/min12060733/s1, Table S1: Analytical results of individual spots of LA-ICP-MS mapping of a barren sandstone from the Athabasca Basin (#1425).

Author Contributions

This paper was conceived by G.C. and in part by E.G.P. and D.C.P. The samples were prepared by H.C., and the analytical work was conducted by D.C.P. and S.J. The manuscript was drafted by G.C., and reviewed/revised by all coauthors. All authors have read and agreed to the published version of the manuscript.

Funding

This research was funded by NSERC-DG grant (RGPIN-2018-06458 to G.C.) and in part by GSC-TGI-5 (to E.G.P.; NRCan contribution number 20220111).

Acknowledgments

We would like to thank Steven Creighton of the Saskatchewan Research Council for the SEM-EDS analysis. Constructive reviews by Chris Lawley of Geological Survey of Canada, two anonymous reviewers and Special Issue Editor David Quirt improved the paper.

Conflicts of Interest

The authors declare no conflict of interest.

Abbreviations

APSAluminum phosphate sulfate
FmFormation
HREEHeavy rare earth elements
IAEAInternational Atomic Energy Agency
LA-ICP-MSLaser ablation-inductively coupled plasma-mass spectrometry
LREELight rare earth elements
NEANuclear Energy Agency
REERare earth elements
ƩREETotal rare earth elements
SEM-EDSScanning electron microscopy-energy dispersive spectroscopy
URUUnconformity-related uranium

References

  1. Jefferson, C.W.; Thomas, D.J.; Gandhi, S.S.; Ramaekers, P.; Delaney, G.; Brisbin, D.; Cutts, C.; Portella, P.; Olson, R.A. Unconformity-related U deposits of the Athabasca basin, Saskatchewan and Alberta. Geol. Surv. Can. Bull. 2007, 588, 23–67. [Google Scholar]
  2. Kyser, K.; Cuney, M. Chapter 8: Basins and U and Deposits; Short Course Series; Mineralogical Association of Canada: Québec, QC, Canada, 2015; Volume 46, pp. 225–304. [Google Scholar]
  3. NEA-IAEA. Uranium 2020: Resources, Production and Demand; NEA-IAEANo. 7551; NEA: Paris, France, 2020; p. 484. [Google Scholar]
  4. Fayek, M.; Kyser, T.K. Characterization of multiple fluid-flow events and rare-earth element mobility associated with formations of unconformity-type U deposits in the Athabasca Basin, Saskatchewan. Can. Mineral. 1997, 35, 627–658. [Google Scholar]
  5. Mercadier, J.; Cuney, M.; Lach, P.; Boiron, M.-C.; Bonhoure, J.; Richard, A.; Leisen, M.; Kister, P. Origin of uranium deposits revealed by their rare earth element signature. Terra Nova 2011, 23, 264–269. [Google Scholar] [CrossRef]
  6. Normand, C. Rare Earths in Saskatchewan: Mineralization Types, Settings, and Distributions; Report 264; Saskatchewan Ministry of the Economy, Saskatchewan Geological Survey: Regina, SK, Canada, 2014; p. 105. [Google Scholar]
  7. Quirt, D.; Kotzer, T.; Kyser, T.K. Tourmaline, Phosphate Minerals, Zircon and Pitchblende in the Athabasca Group: Maw Zone and McArthur River Areas: Saskatchewan Geological Survey; Report 91.4; Saskatchewan Geological Survey: Regina, SK, Canada, 1991; pp. 181–191. [Google Scholar]
  8. Rabiei, M.; Chi, G.; Normand, C.; Davis, W.J.; Fayek, M.; Blamey, N.J. Hydrothermal rare earth element (xenotime) mineralization at Maw Zone, Athabasca Basin, Canada, and its relationship to unconformity-related uranium deposits. Econ. Geol. 2017, 112, 1483–1507. [Google Scholar] [CrossRef]
  9. Richard, A.; Banks, D.A.; Mercadier, J.; Boiron, M.-C.; Cuney, M.; Cathelineau, M. An evaporated seawater origin for the ore-forming brines in unconformity-related U deposits (Athabasca Basin, Canada): Cl/Br and δ37Cl analysis of fluid inclusions. Geochim. Cosmochim. Acta 2011, 75, 2792–2810. [Google Scholar] [CrossRef]
  10. Chi, G.; Chu, H.; Petts, D.; Potter, E.G.; Jackson, S.; Williams-Jones, A.E. Uranium-rich diagenetic fluids provide the key to unconformity-related uranium mineralization in the Athabasca Basin. Sci. Rep. 2019, 9, 5530. [Google Scholar] [CrossRef]
  11. Chu, H.; Chi, G. Thermal profiles inferred from fluid inclusion and illite geothermometry from sandstones of the Athabasca basin: Implications for fluid flow and unconformity-related uranium mineralization. Ore Geol. Rev. 2016, 75, 284–303. [Google Scholar] [CrossRef]
  12. Kotzer, T.G.; Kyser, T.K. Petrogenesis of the Proterozoic Athabasca Basin, northern Saskatchewan, Canada, and its relation to diagenesis, hydrothermal U mineralization and paleohydrogeology. Chem. Geol. 1995, 120, 45–89. [Google Scholar] [CrossRef]
  13. Pagel, M.; Poty, B.; Sheppard, S.M.F. Contributions to some Saskatchewan uranium deposits mainly from fluid inclusion and isotopic data. In Uranium in the Pine Creek Geosyncline; Ferguson, S., Goleby, A., Eds.; IAEA: Vienna, Austria, 1980; pp. 639–654. [Google Scholar]
  14. Richard, A.; Cathelineau, M.; Boiron, M.-C.; Mercadier, J.; Banks, D.A.; Cuney, M. Metal-rich fluid inclusions provide new insights into unconformity-related U deposits (Athabasca Basin and Basement, Canada). Miner. Depos. 2016, 51, 249–270. [Google Scholar] [CrossRef] [Green Version]
  15. Alexandre, P.; Kyser, T.K.; Layton-Matthews, D. REE concentrations in zircon and the origin of uranium in the unconformity-related U deposits in the Athabasca Basin. In GeoCanada 2010—Working with the Earth; BMO Centre Stampede Park: Calgary, AL, Canada, 2010; p. 4. [Google Scholar]
  16. Hoeve, J.; Quirt, D.H. Mineralization and Host Rock Alteration in Relation to Clay Mineral Diagenesis and Evolution of the Middle-Proterozoic Athabasca Basin, Northern Saskatchewan, Canada; Technical Report 187; Saskatchewan Research Council: Saskatoon, SK, Canada, 1984; p. 187. [Google Scholar]
  17. Hoeve, J.; Sibbald, T. On the genesis of Rabbit Lake and other unconformity-type U deposits in northern Saskatchewan, Canada. Econ. Geol. 1978, 73, 1450–1473. [Google Scholar] [CrossRef]
  18. Komninou, A.; Sverjensky, D. Geochemical modeling of the formation of an unconformity-type U deposit. Econ. Geol. 1996, 91, 590–606. [Google Scholar] [CrossRef]
  19. Kyser, T.K.; Hiatt, E.; Renac, C.; Durocher, K.; Holk, G.; Deckart, K. Diagenetic Fluids in Paleo- and Meso-Proterozoic Sedimentary Basins and Their Implications for Long Protracted Fluid Histories; Short Course Series; Mineralogical Association of Canada: Québec, QC, Canada, 2000; Volume 28, pp. 225–262. [Google Scholar]
  20. Annesley, I.R.; Madore, C. Leucogranites and pegmatites of the sub-Athabasca basement, Saskatchewan: U protore? In Mineral Deposits: Processes to Processing; Stanley, C.J., Ed.; Taylor & Francis: Balkema, Rotterdam, 1999; pp. 297–300. [Google Scholar]
  21. Dahlkamp, F.J. Geological appraisal of the Key Lake U-Ni deposits, northern Saskatchewan. Econ. Geol. 1978, 73, 1430–1449. [Google Scholar] [CrossRef]
  22. Hetch, L.; Cuney, M. Hydrothermal alteration of monazite in the Precambrian basement of the Athabasca Basin: Implications for the genesis of unconformity-related deposits. Miner. Depos. 2000, 35, 791–795. [Google Scholar]
  23. Martz, P.; Mercadier, J.; Cathelineau, M.; Boiron, M.; Quirt, D.; Doney, A.; Gerbeaud, O.; De Wally, E.; Ledru, P. Formation of U-rich mineralizing fluids through basinal brine migration within basement-hosted shear zones: A large-scale study of the fluid chemistry around the unconformity-related Cigar Lake U deposit (Saskatchewan, Canada). Chem. Geol. 2019, 508, 116–143. [Google Scholar] [CrossRef]
  24. Mercadier, J.; Annesley, I.R.; McKechnie, C.L.; Bogdan, T.S.; Creighton, S. Magmatic and metamorphic uraninite mineralization in the western margin of the Trans-Hudson Orogen (Saskatchewan, Canada): Major protores for unconformity-related U deposits. Econ. Geol. 2013, 108, 1037–1065. [Google Scholar] [CrossRef]
  25. Richard, A.; Pettke, T.; Cathelineau, M.; Boiron, M.; Mercadier, J.; Cuney, M.; Derome, D. Brine-rock interaction in the Athabasca basement (McArthur River U deposit, Canada): Consequences for fluid chemistry and U uptake. Terra Nova 2010, 22, 303–308. [Google Scholar] [CrossRef]
  26. Chi, G.; Chu, H.; Petts, D.; Potter, E.G.; Jackson, S.; Williams-Jones, A.E. Enrichment of U-Y-Zr in basinal brines of the Athabasca Basin—Implications for U and REE mineralization. In Proceedings of the Goldschmidt 2019 Conference, Barcelona, Spain, 18–23 August 2019; p. 595. [Google Scholar]
  27. Alexandre, P. Geochemistry of the Athabasca Basin, Saskatchewan, Canada, and the unconformity-related uranium deposits hosted by it. Can. Mineral. 2021, 59, 847–868. [Google Scholar] [CrossRef]
  28. Chu, H.; Chi, G.; Bosman, S.; Card, C. Diagenetic and geochemical studies of sandstones from drill core DV10-001 in the Athabasca basin, Canada, and implications for U mineralization. J. Geochem. Explor. 2015, 148, 206–230. [Google Scholar] [CrossRef]
  29. Wright, D.M.; Potter, E.G.; Comeau, J.-S. Athabasca U Database v.2. Geological Survey of Canada Open File 7792; Natural Resources Canada: Ottawa, ON, Canada, 2015; p. 12. [Google Scholar]
  30. Adlakha, E.E.; Hattori, K. Compositional variation and timing of aluminum phosphate-sulfate minerals in the basement rocks along the P2 fault and in association with the McArthur River uranium deposit, Athabasca Basin, Saskatchewan, Canada. Am. Mineral. 2017, 100, 1386–1399. [Google Scholar] [CrossRef]
  31. Gaboreau, S.; Cuney, M.; Quirt, D.; Beaufort, D.; Patrier, P.; Mathieu, R. Significance of aluminum phosphate-sulfate minerals associated with U unconformity-type deposits: The Athabasca basin, Canada. Am. Mineral. 2007, 92, 267–280. [Google Scholar] [CrossRef]
  32. Mercadier, J.; Cuney, M.; Cathelineau, M.; Lacorde, M. U redox fronts and kaolinisation in basement-hosted unconformity-related U ores of the Athabasca Basin (Canada): Late U remobilisation by meteoric fluids. Miner. Depos. 2011, 23, 105–135. [Google Scholar] [CrossRef]
  33. Mwenifumbo, C.J.; Bernius, G.R. Crandallite-group minerals: Host of thorium enrichment in the eastern Athabasca Basin, Saskatchewan. GSC Bull. 2007, 588, 521–532. [Google Scholar]
  34. Wilson, J.A. Crandallite group minerals in the Helikian Athabasca Group in Alberta, Canada. Can. J. Earth Sci. 1985, 22, 637–641. [Google Scholar] [CrossRef]
  35. Ramaekers, P.; Jefferson, C.W.; Yeo, G.M.; Collier, B.; Long, D.G.F.; Catuneanu, O.; Bernier, S.; Kupsch, B.; Post, R.; Drever, G.; et al. Revised geological map and stratigraphy of the Athabasca Group, Saskatchewan and Alberta. Geol. Surv. Can. Bull. 2007, 588, 155–192. [Google Scholar]
  36. Bosman, S.A.; Ramaekers, P. Athabasca group + Martin group = Athabasca supergroup? Athabasca basin multiparameter drill log compilation and interpretation, with updated geological map. In Summary of Investigations 2015; Miscellaneous Report 2015, 2015–4.2, Paper A-5; Saskatchewan Ministry of the Economy, Saskatchewan Geological Survey: Regina, SK, Canada, 2015; Volume 2, 13p. [Google Scholar]
  37. Quirt, D.H. Lithogeochemistry of the Athabasca Group: Summary of Sandstone Data. In Summary of Investigations 1985; Miscellaneous Report 85–4; Saskatchewan Energy and Mines, Saskatchewan Geological Survey: Regina, SK, Canada, 1985; pp. 128–132. [Google Scholar]
  38. Sibbald, T.I.I.; Munday, R.J.C.; Lewry, J.F. The geological setting of U mineralization in northern Saskatchewan. In U in Saskatchewan; Dunn, C.E., Ed.; Special Publication; Saskatchewan Geological Society: Geological Survey of Canada Regina, SK, Canada, 1976; Volume 3, pp. 51–98. [Google Scholar]
  39. Kister, P.; Laverret, E.; Quirt, D.; Cuney, M.; Patrier Mas, P.; Beaufort, D.; Bruneton, P. Mineralogy and geochemistry of the host-rock alterations associated with the Shea Creek unconformity-type uranium deposits (Athabasca Basin, Saskatchewan, Canada). Part 2. Regional-scale spatial distribution of the Athabasca Group sandstone matrix minerals. Clays Clay Miner. 2006, 54, 295–313. [Google Scholar] [CrossRef]
  40. Potter, E.G.; Tschirhart, V.; Powell, J.W.; Kelly, C.J.; Rabiei, M.; Johnstone, D.; Craven, J.A.; Davis, W.J.; Pehrsson, S.; Mount, S.M.; et al. Targeted Geoscience Initiative 5: Integrated Multidisciplinary Studies of Unconformity-Related Uranium Deposits from the Patterson Lake Corridor, Northern Saskatchewan: Geological Survey of Canada. Bulletin 2020, 615, 37. [Google Scholar]
  41. Chen, S.; Hattori, K.; Grunsky, E.C. Multivariate statistical analysis of the REE-mineralization of the Maw Zone, Athabasca Basin, Canada. J. Geochem. Explor. 2016, 161, 98–111. [Google Scholar] [CrossRef] [Green Version]
  42. Hanly, A.J. The Mineralogy, Petrology and Rare Earth Element Geochemistry of the Maw Zone, Athabasca Basin, Canada. Master’s. Thesis, University of Missouri, Rolla, MO, USA, 2001; p. 168. [Google Scholar]
  43. MacDougall, D.G. Rare Earth Element Mineralization in the Athabasca Group—Maw Zone. Summary of Investigations; Saskatchewan Geological Survey, Saskatchewan Energy and Mines; Report 90-4; Saskatchewan Geological Survey: Regina, SK, Canada, 1990; pp. 103–105. [Google Scholar]
  44. Lawley, C.J.M.; Creaser, R.; Jackson, S.; Yang, Z.; Davis, B.; Pehrsson, S.; Dubé, B.; Mercier-Langevin, P.; Vaillancourt, D. Unravelling the Western Churchill Province paleoproterozoic gold metallotect: Constraints from Re-Os arsenopyrite and U-Pb xenotime geochronology and LA-ICP-MS arsenopyrite geochemistry at the BIF-hosted Meliadine gold district, Nunavut, Canada. Econ. Geol. 2015, 110, 1425–1454. [Google Scholar] [CrossRef]
  45. Guillong, M.; Hametner, K.; Reusser, E.; Wilson, S.A.; Günther, D. Preliminary characterisation of new glass reference materials (GSA-1G, GSC-1G, GSD-1G and GSE-1G) by laser ablation-inductively coupled plasma-mass spectrometry using 193 nm, 213 nm and 266 nm wavelengths. Geostand. Geoanalytical Res. 2005, 29, 315–331. [Google Scholar] [CrossRef]
  46. Sun, S.S.; McDonough, W.F. Chemical and Isotopic Systematics of Oceanic Basalts: Implications for Mantle Composition and Processes; Special Publications; Geological Society: London, UK, 1989; Volume 41, pp. 313–345. [Google Scholar]
  47. Turekian, K.K.; Wedepohl, K.H. Distribution of the elements in some major units of the Earth’s crust. Geol. Soc. Am. Bull. 1961, 72, 175–192. [Google Scholar] [CrossRef]
  48. Kyser, K.; Cuney, M. Chapter 3: Geochemical Characteristics of U and Thorium and Analytical Methodologies; Short Course Series; Mineralogical Association of Canada: Québec, QC, Canada, 2015; Volume 46, pp. 39–84. [Google Scholar]
  49. Migdisov, A.; Williams-Jones, A.E.; Brugger, J.; Caporuscio, F.A. Hydrothermal transport, deposition, and fractionation of the REE: Experimental data and thermodynamic calculations. Chem. Geol. 2016, 439, 13–42. [Google Scholar] [CrossRef] [Green Version]
  50. Williams-Jones, A.E.; Migdisov, A.A.; Samson, I.M. Hydrothermal mobilisation of the rare earth elements—A tale of “ceria” and “yttria”. Elements 2012, 8, 355–360. [Google Scholar] [CrossRef]
  51. Wang, Y.; Chi, G.; Li, Z.; Bosman, S. Large-scale thermal convection in sedimentary basins revealed by coupled quartz cementation-dissolution distribution pattern and reactive transport modeling—A case study of the Proterozoic Athabasca Basin (Canada). Earth Planet. Sci. Lett. 2021, 574, 117168. [Google Scholar] [CrossRef]
  52. Chi, G.; Li, Z.; Chu, H.; Bethune, K.M.; Quirt, D.H.; Ledru, P.; Normand, C.; Card, C.; Bosman, S.; Davis, W.J.; et al. A shallow-burial mineralization model for the unconformity-related uranium deposits in the Athabasca Basin. Econ. Geol. 2018, 113, 1209–1217. [Google Scholar] [CrossRef]
Figure 2. Photomicrograph of sample #1425 (a) and digitized distribution of detrital quartz (b), quartz rim (c) and matrix (d). Criteria used for the digitization are explained in the text.
Minerals 12 00733 g002
Figure 3. LA-ICP-MS mapping of elements that are strongly and distinctly enriched in the matrix and quartz rim of the sandstone sample (#1425) shown in Figure 2.
Minerals 12 00733 g003
Figure 4. LA-ICP-MS mapping of elements that are moderately to weakly enriched in the matrix and quartz rim of the sandstone sample (#1425) shown in Figure 2, except SiO2, which dominates the whole sample.
Minerals 12 00733 g004
Figure 5. Bivariate diagrams showing strong positive correlations between U and La, Y, Th, Sr and P, in both linear (left column) and log (right column) scales. However, note the low concentrations of these elements for the few spots that contain the highest U (>25 ppm).
Minerals 12 00733 g005
Figure 6. Bivariate diagrams showing poor correlations between U and Al, Na, K, Ca, Mg, Fe, Ti, Ba and Zr. Note the partial positive correlations between U and Ba, Zr, Al, K, Ca and Fe. Note also the low concentrations of these elements for the few spots that contain the highest U (>25 ppm).
Minerals 12 00733 g006
Figure 7. Bivariate diagrams showing various correlations between P and other elements, including positive correlations with La, Th, Sr and Y, partial positive correlations with Ba and Ca and poor correlations with Al.
Minerals 12 00733 g007
Figure 8. Chondrite-normalized REE patterns (chondrite values from [46]) of quartz rim (a) and matrix (b), each with 200 spots, and reference materials (c) including Athabasca sandstone [28], average crustal sandstone [47], basement gneisses [4], uraninite in unconformity-related U ores (Mercadier et al., 2011a) and REE (Y) mineralized sandstone at Maw Zone [42]. The analytical results in (a,b) are shown by the thick blue-purple lines with variable degrees of lightness to maximize the visibility of individual analyses. The REE patterns of the references are superimposed on the analytical results of this study (a,b) for direct comparison; note, however, that the REE patterns of the references (15 elements) are distorted to fit into the framework of the analyses of this study (only 6 elements).
Minerals 12 00733 g008
Figure 9. BSE images and EDS spectrums of selected spots in sandstone sample indicating zircon (a), APS (b) and barite (c).
Minerals 12 00733 g009
Figure 10. Bivariate diagrams showing relationships between molar values of P, Ca, REE + Y and Al and expected trends for apatite (Ca10(PO4)6(OH,F,Cl)2), monazite–xenotime ((REE + Y)PO4), and APS minerals (AB3(XO4)2(OH)6), where A can be Na, K, Ca, Ba, Sr, Ag, Pb, U and REE, B can be Al, Fe, Cu and Zn, and X is either P or S. An average mass of 152 was used in converting the mass concentrations to molar values for REE and Y. For the trend of APS minerals, the B-site is presumed to be dominated by Al. See the text for detailed discussion of the deviation of the trends from the expected lines of monazite (a), apatite (b) and APS minerals (c).
Minerals 12 00733 g010
Publisher’s Note: MDPI stays neutral with regard to jurisdictional claims in published maps and institutional affiliations.

