Article

Experimental Setup for Evaluating Rock Volume Alteration and Its Application for Studying Shale Rock Swelling in Various Fluids

by
Timur I. Yunusov
1,*,
Alexey V. Smirnov
1,
Elena D. Mukhina
1,
Dmitriy I. Potapenko
1,
Dinar F. Bukharov
2,
Anatoly A. Baluev
3 and
Alexey N. Cheremisin
1
1
Skolkovo Institute of Science and Technology, 121205 Moscow, Russia
2
LLC “Gazpromneft—Technological Partnership”, 190000 Saint-Petersburg, Russia
3
Department of Geology and Oil and Gas Production, Tyumen Industrial University, 625000 Tyumen, Russia
*
Author to whom correspondence should be addressed.
Minerals 2022, 12(6), 714; https://doi.org/10.3390/min12060714
Submission received: 13 April 2022 / Revised: 20 May 2022 / Accepted: 1 June 2022 / Published: 3 June 2022

Abstract

:
Rock swelling and rock disintegration in the presence of drilling, stimulation and completion fluids are considered to be the main reasons for operational and production problems for wells in clay-rich formations. The impact of these fluids on rock properties shall be established for the effective treatment design. This paper describes the development of the experimental setup for studying rock swelling in reservoir conditions and the application of this setup for the evaluation of swelling mechanisms of shale rock samples. Swelling quantification was performed using measuring piston displacement that was caused by rock swelling in a piston accumulator during pressure maintenance. We studied the interaction of the disintegrated rock samples with water-based and hydrocarbon-based fluids and supercritical CO2. It was found that alkaline water solution in reservoir conditions causes swelling of the used rock samples in the amount of 1–3% vol. with a direct correlation between the rock swelling magnitude and the total clay content. The change in the rock volume in the presence of the used hydrocarbon-based fluid depends on the content of organic matter, its distribution in the rock, and the clay content. The observed swelling degree in the hydrocarbon fluid and CO2 was significantly lower (0–0.5% vol.) than in water. The proposed methodology and obtained results can further be used for the optimization of various operations in clay-rich formations.

1. Introduction

Shale formations are a vast source of hydrocarbons [1]. The exploration of shales in the USA has overridden the balance in the world energy market since 2010 [2]. Shales are a broad class of fine-grained, organic-rich layered sedimentary rocks [3]. The mineral composition of shales is highly heterogeneous, varying from mostly silicates to mostly carbonates. Clays were shown to be the constituent determining the petrophysical properties of shale rocks [4], which are different from the properties of conventional sandstones. Low permeability [5], high hydrophobicity [6,7], and nano-scale pores [8] do not allow the performance of hydrocarbon recovery using traditional techniques. Nowadays, most of such reservoirs are developed using the combination of horizontal drilling and multi-stage hydraulic fracturing methods to enable a high inflow contact area with the reservoir. Different types of fluids are used in the treatment, including water-based fluids, hydrocarbon-based ones, CO2, foams, and others [9].
It is known that the interaction of fracturing fluids with shales may lead to the damage of the porous media, resulting in a decrease in the wells’ production performance [10]. The extent of the damage is higher in tight rocks and shales [11] Several possible mechanisms of the porous media damage include: clay swelling, solids migration, wettability alteration, minerals dissolution and precipitation, and shale softening [12]. Clay swelling is defined here as the process of increasing the volume of a rock due to the penetration of an external fluid into the rock matrix. Swelling occurs at the contact of clay-rich rocks with mostly water-based fluids [13,14]. This process may comprise two mechanisms, namely crystalline and osmotic swelling [15]. The first mechanism implies water adsorption on the basal crystal surfaces of clay minerals, which increases the clay’s structure c-spacing. The second mechanism is based on the water influx into the clay structure because of the difference in ions concentration between the pore fluid and the interlayer space in clay minerals (osmotic swelling). Both mechanisms lead to clay volume expansion. Osmotic swelling may also result in clay disintegration and fines migration. [16]. Water vapor imbibition was also found to be responsible for the decrease in the elastic modulus and compressive strength of shales, which may lead to higher rock deformation at stress and the shales’ mechanical failure [17]. Smectites and mixed-layer clays are the most water-sensitive clay types [18]. However, destabilization of other clay minerals such as illite and kaolinite may still lead to blockage of the pore throats, rock permeability impairment, and a reduction in the conductivity of the hydraulic fractures [19,20,21,22]. Clay swelling and pore plugging with migrating solids are closely related [23] as clay swelling lowers the critical retention concentration, which leads to severe permeability decline.
There are several methods that can be used to address the swelling-induced damage. The first one is based on the introduction of the clay stabilizers into the composition of fracturing fluids. Potassium salts are the most common type of clay stabilizers. K+ ions penetrate the interlayer space in clays and hold clay platelets together. [24]. However, the use of potassium salts in concentrations that are required for the stabilization of clay-rich formations is not always economical and has a certain negative impact on the properties of fracturing fluids. For instance, it may significantly increase fracturing fluid friction-pressure that will, in turn, result in a higher horsepower usage and a growth in fuel consumption. Organic shale inhibitors were introduced as alternatives to inorganic salts. Their stabilization mechanism is based on the adsorption of certain organic substances on the clay surface to prevent water from penetrating the clay structure. Examples of such compositions include organic amines, the ammonium salts of organic acids, cationic surfactants, branched polyamines, and others. [25].
An alternative methodology for reducing the negative impact of clay swelling and clay destabilization rests on using hydrocarbon-based drilling and fracturing fluids. For example, organic liquids such as diesel fuel, jet fuel, crude oil, or even liquefied natural gas [26] can be used as the liquid phase for fracturing systems. Another option considers using supercritical CO2, which, as was shown by [27], does not interact with clays. However, the presence of water in porous media may lead to the carbonate minerals’ dissolution with the subsequent solids detachment and the plugging of pores [28]. On the other hand, CO2 may also positively impact the rock permeability as a result of accompanying chemical reactions. This option can also be aligned with the utilization of industrial CO2.
Shale swelling in the presence of hydrocarbon fluids has also been reported. Its mechanism is based on the absorption of light hydrocarbons by the organic matter that presents in shales. The resulting shale rock swelling may lead to a reduction in pores’ size and the deformation of kerogen agglomerates with the subsequent changes in the rock structure. The revealed ability of shales to swell in the presence of non-aqueous fluids decreases in sequence: CO2 > CH4 > C2H6 > C3H8 [29].
All these facts are of significant importance for developing the Bazhenov formation, the shale-like formation in Western Siberia, which is a prospective source of hydrocarbons. The Bazhenov formation’s matrix permeability varies between layers and is generally less than 0.1 mD; its total porosity is up to 10–12%, but only about 25% of it may be attributed to intergranular porosity [30]; and its mineralogical composition is also very complex, varying from carbonates to silicates [31].
There are several techniques used to assess the risks that are associated with rock swelling and destabilization. One of the approaches is based on the use of the Zhigach–Yarov device, comprising a sample chamber with a piston that is connected to a displacement counter. [32,33]. Higher readings of the displacement gauge during experiments with this setup correspond to the higher volume of rock sample expansion. It is a relatively cheap and time-efficient method enabling simultaneous measurement for several samples. However, this technique does not allow the performance of measurements in reservoir conditions. Other used methods include the measurement of cation exchange capacity (CEC) and capillary suction time (CST). The CEC method is based on defining the concentration of absorbed cations in clay; lower CEC values correspond to lower clay swelling potential. The CST technique is based on water retention by swelling clays and preventing capillary suction into the filter paper, which is located below the tube with the water-clay paste. Other qualitative and semiquantitative methods include the use of in situ X-Ray diffraction with the assessment of lattice structural changes, and scanning electron microscopy of rock particles after their interaction with fracturing fluid [34]. The risks of solids migration can be assessed with roller oven tests. For this test, shale rock samples consisting of relatively large particles (>0.21 mm) and fluid are loaded into the roller oven cell. The cell is heated to reservoir temperature and is rolled to intensify the fluid-–rock interaction. After this, the obtained clays–water mixture is filtered through the screen and the fraction content of small particles (<0.21 mm) is defined. A significant content of such particles indicates a high risk of solids migration.
All the described techniques have certain drawbacks. First, the results of these tests do not always have direct relation with the actual processes that take place at the reservoir. Secondly, these tests are quite time-consuming. For example, paper [35] describes a testing procedure with a duration of 150 h. Another challenge consists in matching reservoir conditions which is not possible for most of the described testing procedures. Based on these facts, we conclude that utilization of the existing techniques for the rapid and reliable evaluation of rock swelling properties is challenging, and the development of a new methodology is required for addressing the highlighted disadvantages.
In this paper, we describe the development of a new quantitative method for studying rock swelling properties and the application of this method for the evaluation of the interaction of Bazhenov rock samples with various fluids. The obtained results allow us to conclude that the proposed method provides the quick and reliable assessment of rock properties in reservoir conditions and may become a powerful tool for engineering various operations in clay-rich formations.

2. Materials and Methods

2.1. Materials

Sodium bentonite was purchased from Alfa Aesar and used as is. Non-extracted shale rock samples were selected from the deposit of core samples for five different layers of the Bazhenov formation of the Palyanovskoe field. The corresponding depths of samples 1–2 were 2998.5–3002.5; 2994.5–2998.5; 1986.5–2994.5; 2983.0–2986.5; and 2978.0–2983.0. The matrix density and matrix porosity of the used rock samples were defined using a PIK-PP helium porosimeter. After this, the rock samples were crushed using a grinding mill and then sieved. Fraction 63–250 μm was separated and used to prepare the bulk formation samples for the swelling experiments.
Three fluids were used for the swelling experiments: 0.20% solution of sodium hydroxide in distilled water, gelled hydrocarbon-based fracturing fluid, and CO2. Distilled water was obtained by purification with Ellix, Millipore. Sodium hydroxide of ”pure“ grade was purchased from “Rushim”. Diesel of “summer” grade was purchased at a local gas station. Samples of the hydrocarbon-based fracturing fluid were prepared using diesel as a liquid phase. Other components of the hydrocarbon gel (orthophosphoric ester and aluminum organic activator) were provided by ZAO Himeko. CO2 with 99.995% purity was purchased from a Moscow gas refinery plant.

2.2. Methods

2.2.1. Pyrolysis

The rock samples were pyrolyzed with a HAWK (Wildcat technologies LLC, Humble, TX, USA) pyrolyzer using the standard procedure [36]. The program included two heating stages (in an inert gas and in the air). Generated hydrocarbons were detected using the flame-ionization detector. An infra-red detector was used for the detection of the produced CO and CO2.
Figure 1 shows an example of the dependencies that were registered during pyrolysis of one of the rock samples. In the first stage, light hydrocarbons were evaporated during the temperature increase to 90 °C (step S0), and then liquid hydrocarbons were evaporated during the subsequent temperature increase to 300 °C (step S1). High molecular weight hydrocarbons were cracked and evaporated at temperatures up to 650 °C (step S2). Tmax was defined as the temperature that corresponded to the maximum rate of hydrocarbon generation during S2 step (see Figure 1). CO2 quantities at the next pyrolysis stage (step S3), at the oxidation stage (step S4), and during the carbonates’ decomposition (step S5) periods were also recorded. The measured data were expressed in mg/g of the rock and used to calculate the total organic carbon content (TOC, % wt.). The hydrogen index (HI) was defined using the following equation:
H I = 100 × S 2 T O C
where S2 is the hydrocarbon content that was extracted during step S2 of the described pyrolysis procedure.

2.2.2. X-ray Diffractometry

The mineral composition of the rock samples was defined using an XRD DRON-3 diffractometer. The rock samples were crushed in an agate mortar, packed with an amorphous film, and loaded into the diffractometer. The Range 2ϴ during measurements was 0–100°, the used current was 30 mA, and the voltage was 40 kV. The type of each component and its content were defined using Match software. The COD-Inorg REV254652 2020.07.29 database was used for the analysis.

2.2.3. Rock Swelling Study

For characterization of the swelling properties of the studied samples, a specially engineered experimental setup was constructed. The scheme of the experimental setup is shown in Scheme 1. The setup had two piston accumulators (PA1 and PA2) connected to the high-pressure pumps LN-P. Distilled water was used as the hydraulic fluid in the pumps.
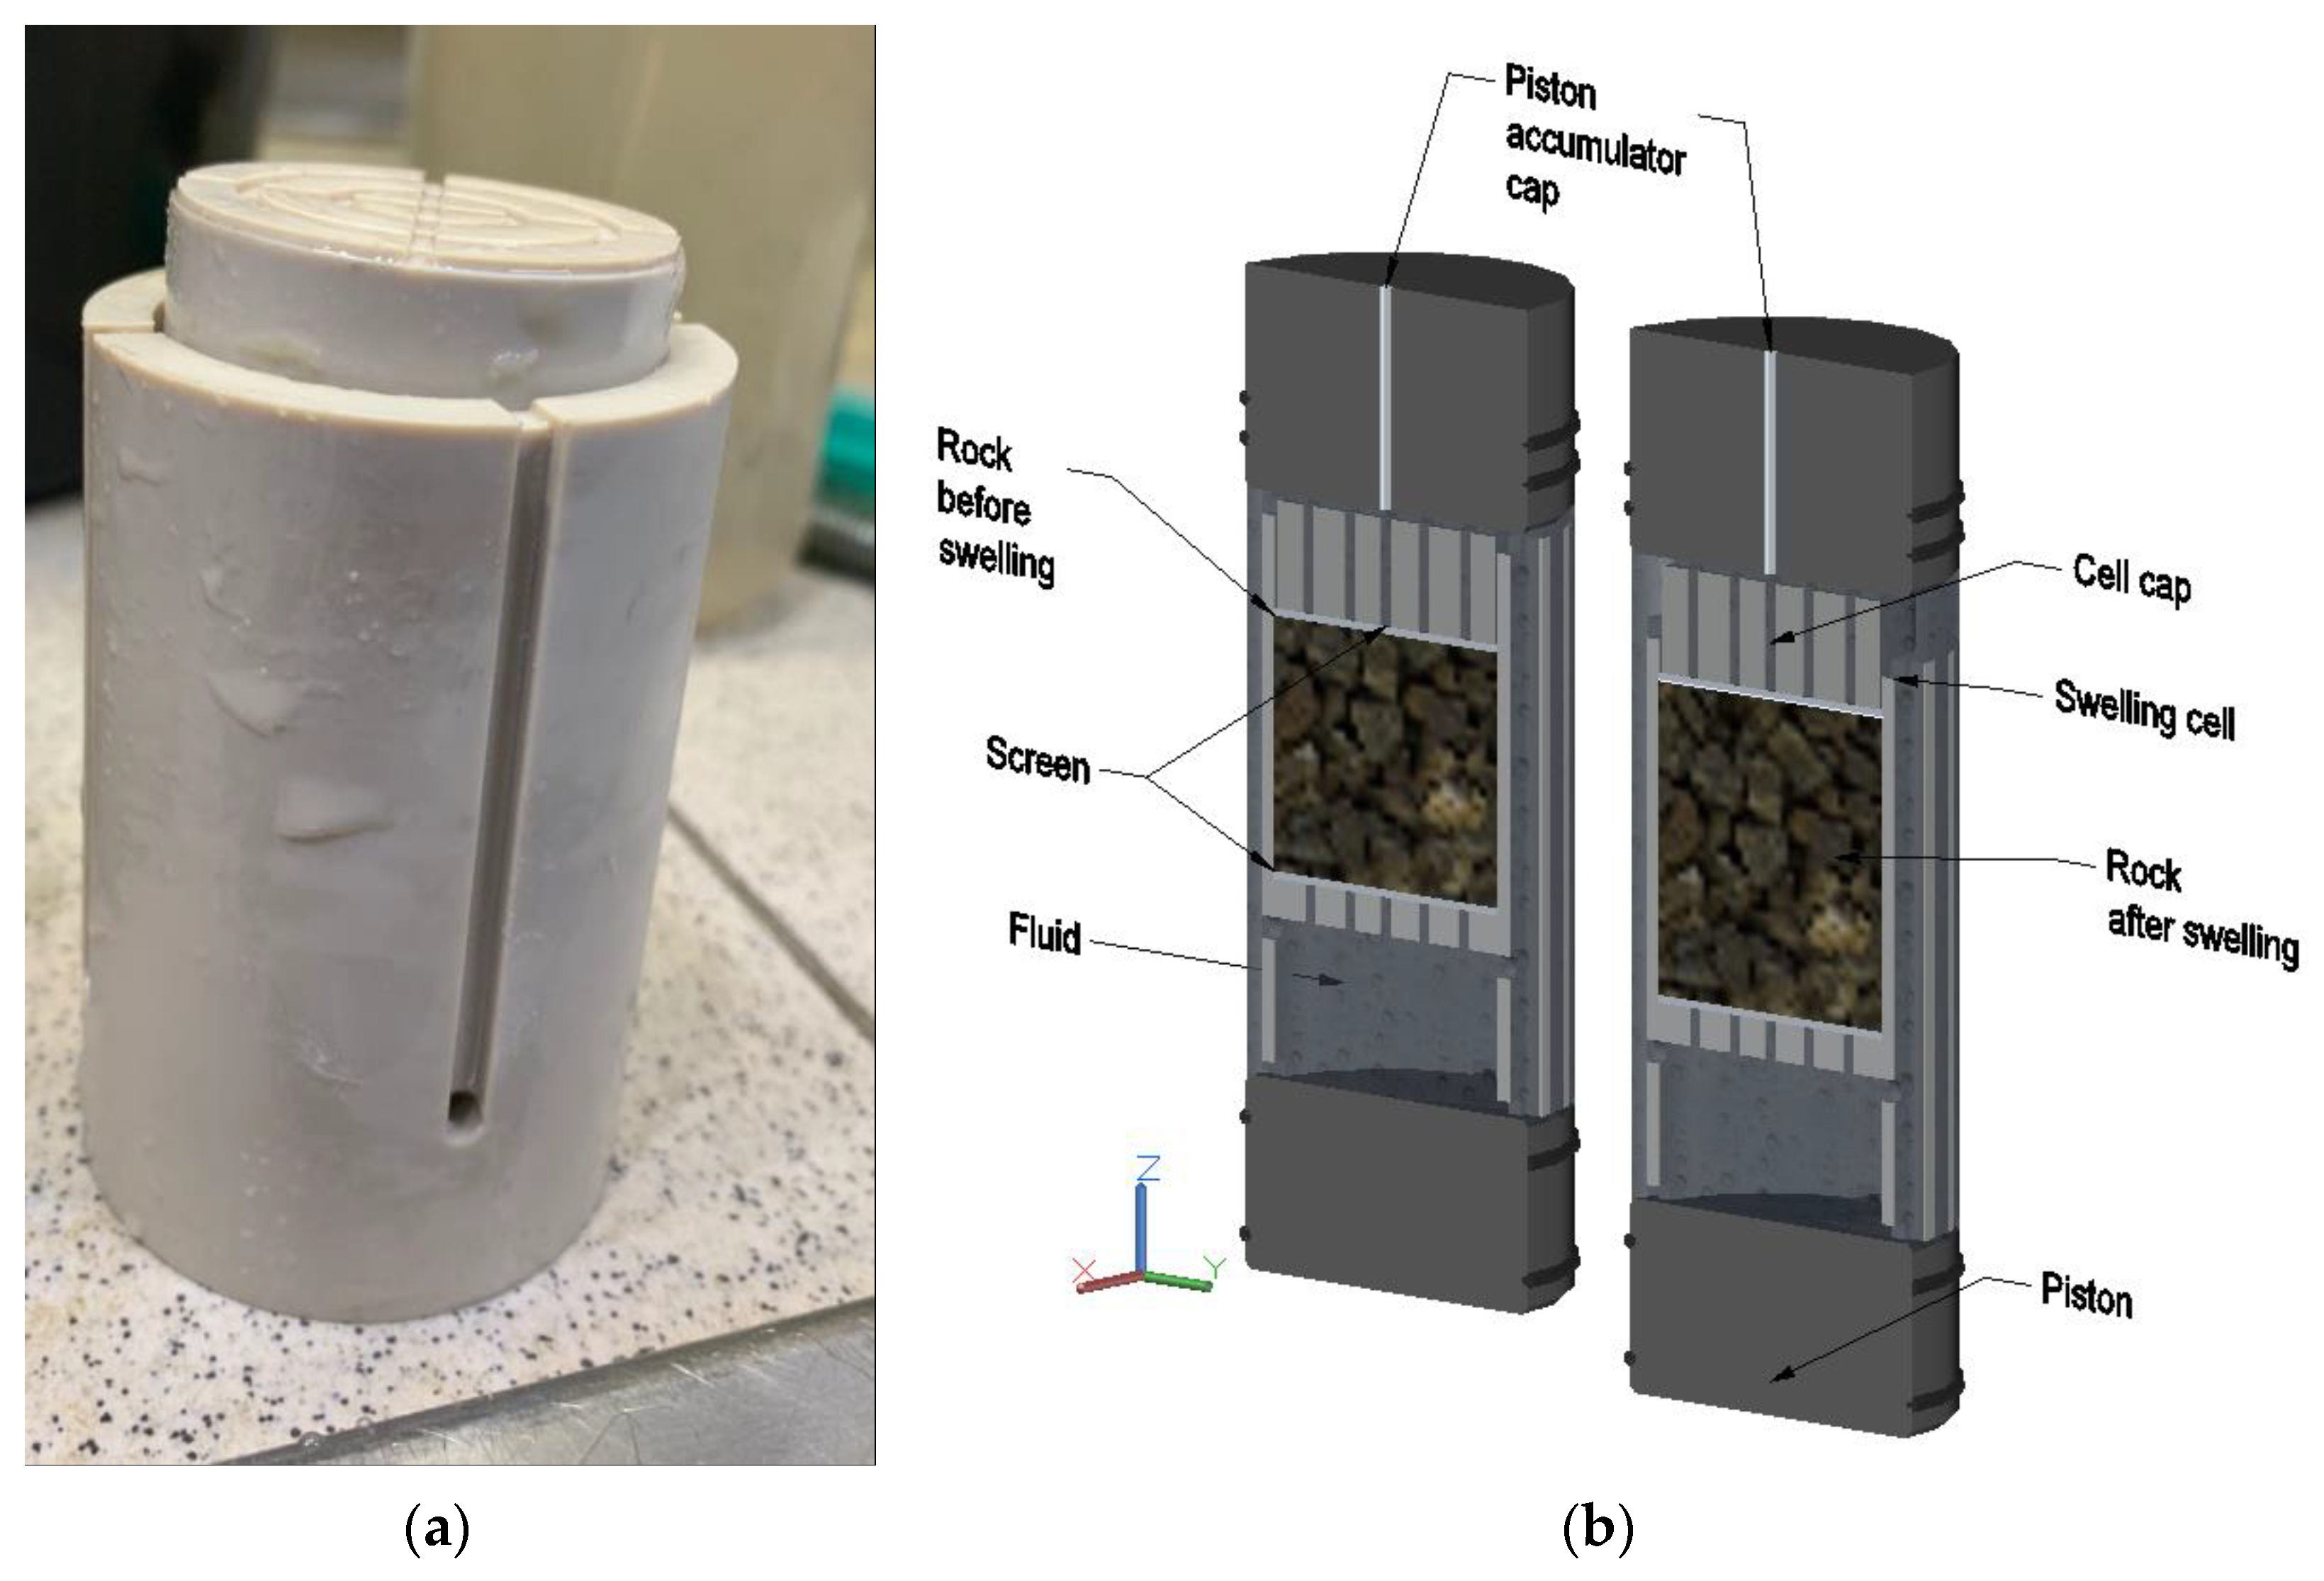
Before each experiment the crushed rock was loaded into a swelling cell made of a chemically and thermally resistant polymer, PEEK (polyetheretherketone). The cell was equipped with a moving cap and metal screens to prevent rock dissipation from the cell (Figure 2). The weight of the crushed rock was calculated as the difference between the weights of the loaded and the empty cell and it was nearly 50 g (±1 g) in all experiments. After this, the loaded cell was installed into the PA1 accumulator. The cell was positioned on the piston and was in tight contact with the accumulator cap. The evaluated fluid was loaded into the PA2 accumulator. Then, both PAs were placed into an oven and connected to the pumps. After this, the accumulators were heated to 110 °C for 12 h before the start of the experiment.
The disintegrated rock sample in the cell was vacuumed with a diaphragm vacuum pump for three hours with valves 1 and 3 opened and valve 2 closed. Then, valve 1 was shut, valve 2 was opened, and the fluid from accumulator PA1 was pumped into PA2 until the maximum pressure of 23.6 MPa. Then, pump 2 was switched to ”constant pressure“ mode to maintain 23.6 MPa. The hydraulic fluid pressure under the piston PA1 was typically 0.1–0.15 MPa lower than the pressure at pump 2. This fact can be explained by the friction between the pistons and cylinders in PA1 and PA2 (see Figure 2). After the stabilization of the pressure at pump 1, it was also switched to the “constant pressure“ mode. The pressure was maintained by controlling the pump intake rate (pump-in option for pump 1 was disabled). The rock volume increase during the rock interaction with the fluid that was loaded into the PA2 fluid caused the displacement of the PA1 piston. This displacement and the change in the rock sample volume were computed from the fluid intake volume at pump 1. The experiment was terminated when no change higher than 0.05 mL of the sample volume had been observed for 12 h.
The rock swelling was quantified using a volumetric expansion coefficient α (% vol.) and the absorbed fluid/rock mass ratio K (mg/g). These parameters were calculated using the equations below
α = Δ V V r o c k ,
where ∆V is the change in volume in the rock matrix volume, equal to the change in the pump 1 volume, and Vrock is the initial rock matrix volume defined by Equation (3)
V r o c k = m r o c k ρ r o c k ,
where mrock is the mass of the loaded rock sample and ρrock is the rock’s matrix density defined as described in Section 2.1
K = ρ f Δ V f m r o c k
where ∆Vf is the volume of fluid pumped by pump 2 into the cell after the pressure of 23.6 MPa was reached and ρf is the density of such fluid in reservoir conditions.

3. Results and Discussion

3.1. Rock Properties

Table 1 provides data for the pyrolysis of the studied rock samples.
According to [33], sample 1 corresponds to the MC3 catagenesis stage, whereas samples 2–5 correspond to the MC2 catagenesis stage. Both these stages are characterized by high rock maturity. The lowest organic content was observed in sample 1. The highest TOC was observed for samples 3–5. The highest S2 values were measured for samples 3 and 5, which indicates the significant presence of high molecular weight compounds in these samples boiling between 350 °C and 600 °C. These high-molecular polymeric structures may also swell upon contact with hydrocarbons.
Data on the mineralogical composition and the matrix density of these samples are given in Table 2. Table 2 also provides the values for the total clay content on the studied rocks that were computed using Equation (5).
ω c l a y s =   ω c l a y s m i n 1 + 1.17 T O C ,
where TOC—total organic carbon, % wt.; ωclays-min—clay content in the mineral rock matrix, % wt.; ωclays—total clay content, % wt.; 1.17 is an average coefficient between TOC and content of organic matter, which is characteristic of rocks at the MC2-MC3 catagenesis stage [37].
The main component of these rock samples is quartz and clays, which cement the materials. The samples also contain pyrite in the concentration up to 8% wt., which is typical for the Bazhenov formation [38]. The studied rock samples also demonstrate significant variability in their mineral compositions. Sample 1 consists mainly of quartz with a low total clay content, whereas samples 3–5 contain more clays. Therefore, a higher degree of swelling in water is expected for these samples. Sample 2 has transitional characteristics; however, sample 4 has the highest amount of calcite and mixed-layer clays which means that its swelling properties may be different from other samples.

3.2. Bentonite Swelling

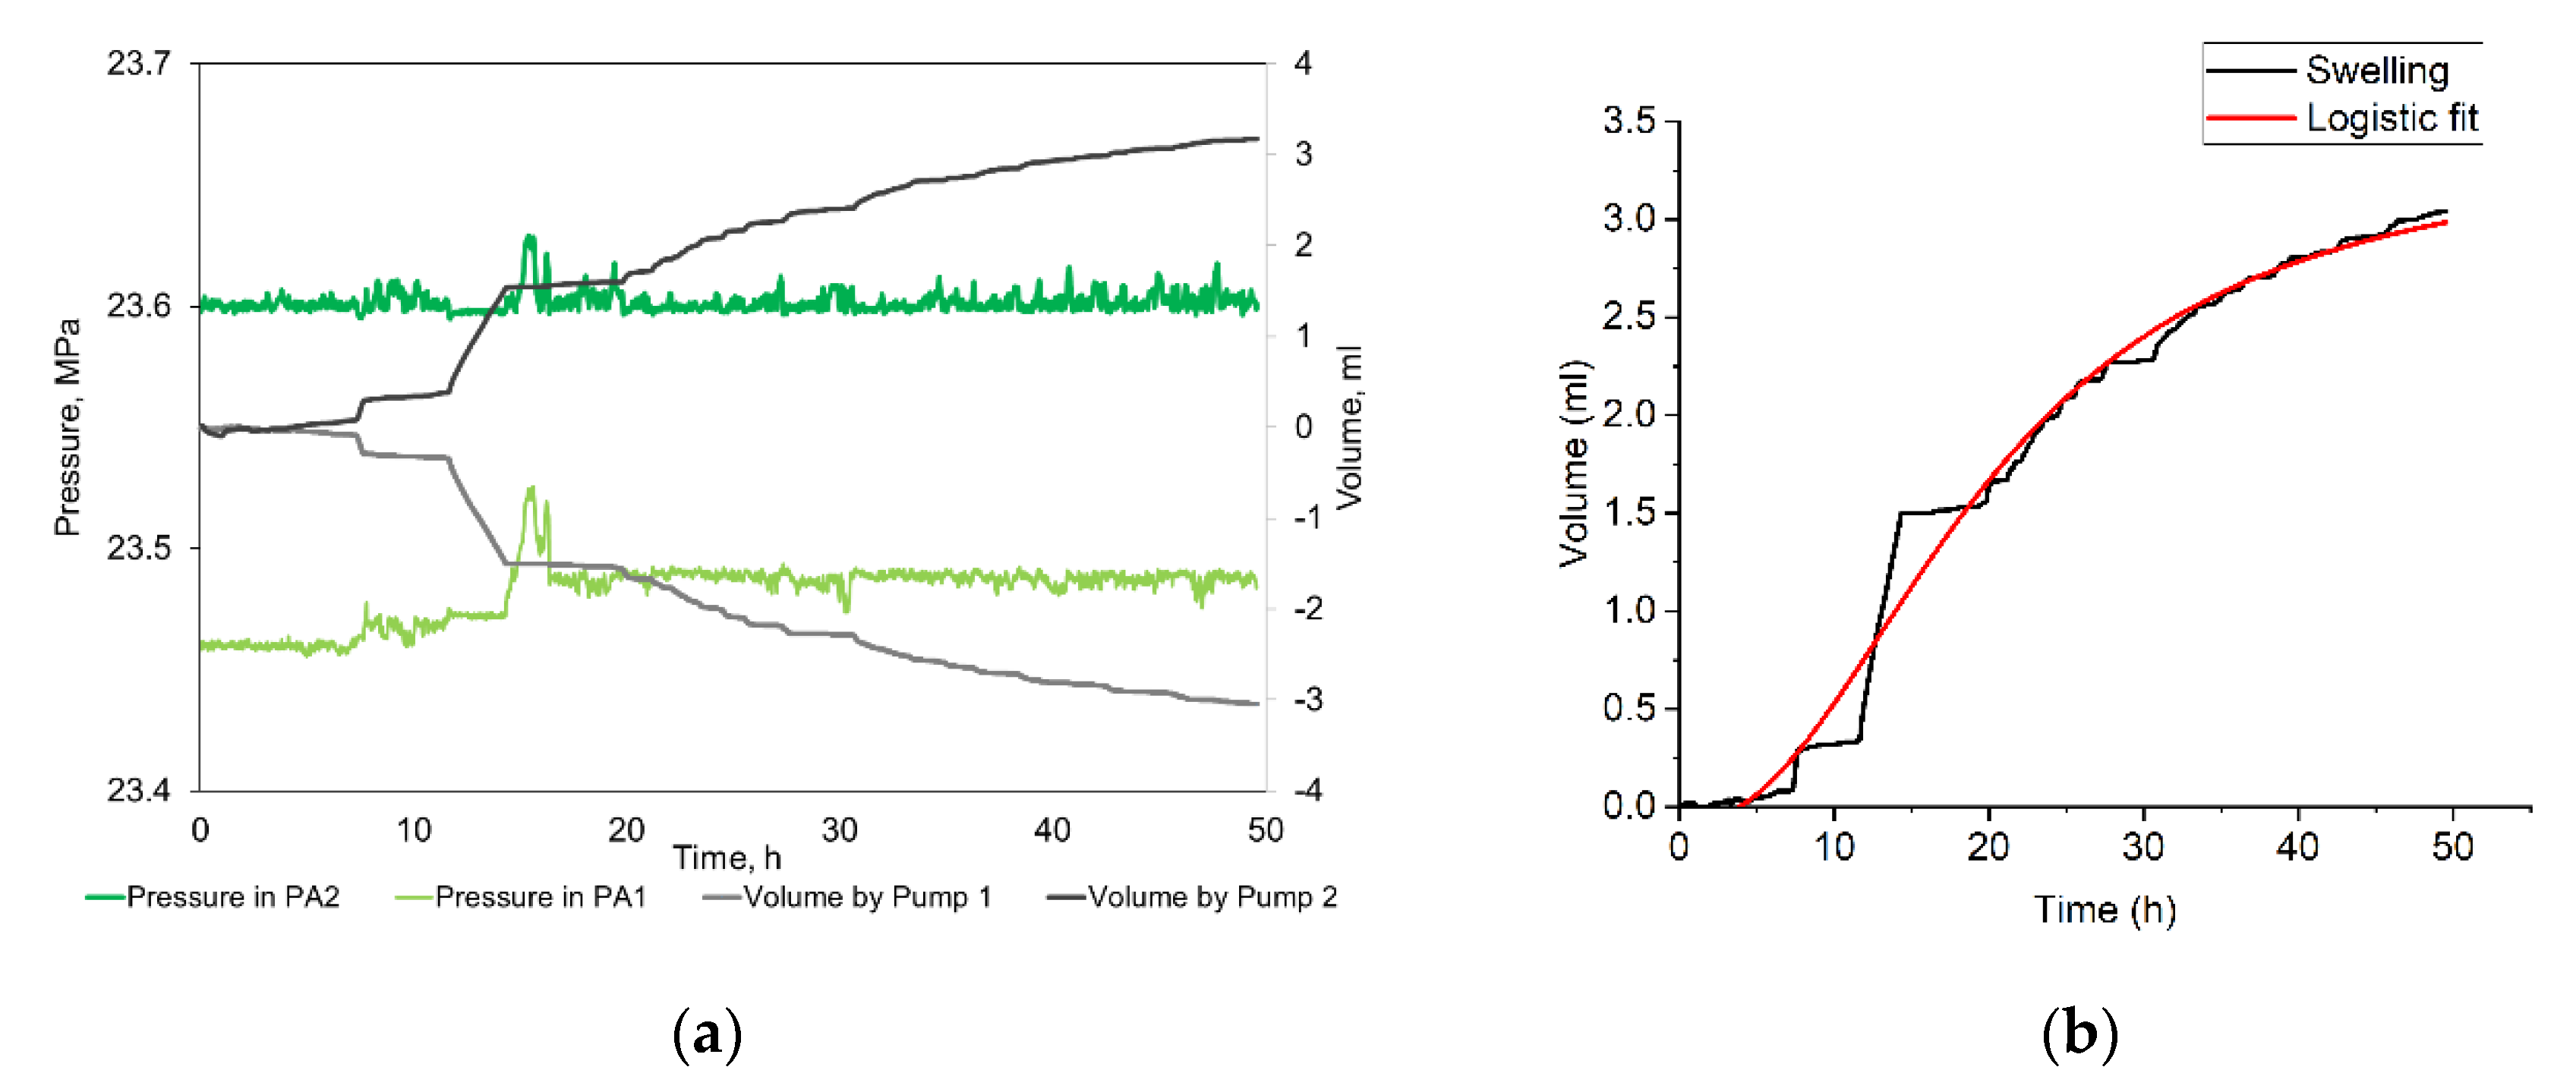
The first swelling experiment was performed with sodium bentonite to verify the functionality of the constructed experimental setup. Swelling in water is the intrinsic property of bentonite, consisting mostly of montmorillonite. The experiment was performed using 0.2% wt. NaOH solution to increase the degree of bentonite swelling [39]. Temperature and pump 2 pressure during the experiment were 110 °C and 23.6 MPa, respectively. The test results of this experiment are shown in Figure 3.
The results of the performed experiment verified the applicability of the constructed experiment setup for studying rock swelling in reservoir conditions. It was also found that the dependence of the rock volume expansion on time (see Figure 3b) can be approximated by a logistic function with satisfactory agreement (R2 = 0.99). This approximation may be included in fracturing simulation software to better predict fluid’s impact on the rock properties and treatment results.
f ( x ) = A 1 A 2 1 + ( x x 0 ) p + A 2
A2 here denotes the function upper limit and swelling rate, and A1 is calibration coefficient, while x0 and p define the swelling rate and the curve shape.
Bentonite volumetric expansion after two days was 14% vol. (see Equation (2)). The absorbed fluid/rock mass ratio calculated according to Equation (4) was 76 mg/g. The measured value of the expansion factor is significantly lower than the swelling degree of bentonite at ambient conditions [40,41], which can be explained by the difference in disjoining pressure. During swelling, disjoining pressure resulting from the electrical double layer makes clay microlayers repel each other [42], which causes clay swelling and the detachment of clay particles. From this perspective, an external hydraulic pressure of 23.6 MPa that was applied on the packed clay microlayers may decrease the swelling degree, counteracting the disjoining pressure and shrinking the electrical double layer. This explanation is consistent with the results that were obtained by Zhou et al. [35], which show a significantly lower degree of swelling in a sample consisting of 90% montmorillonite under confining pressure.

3.3. Swelling of Crushed Rock Samples in Alkaline Water Solution

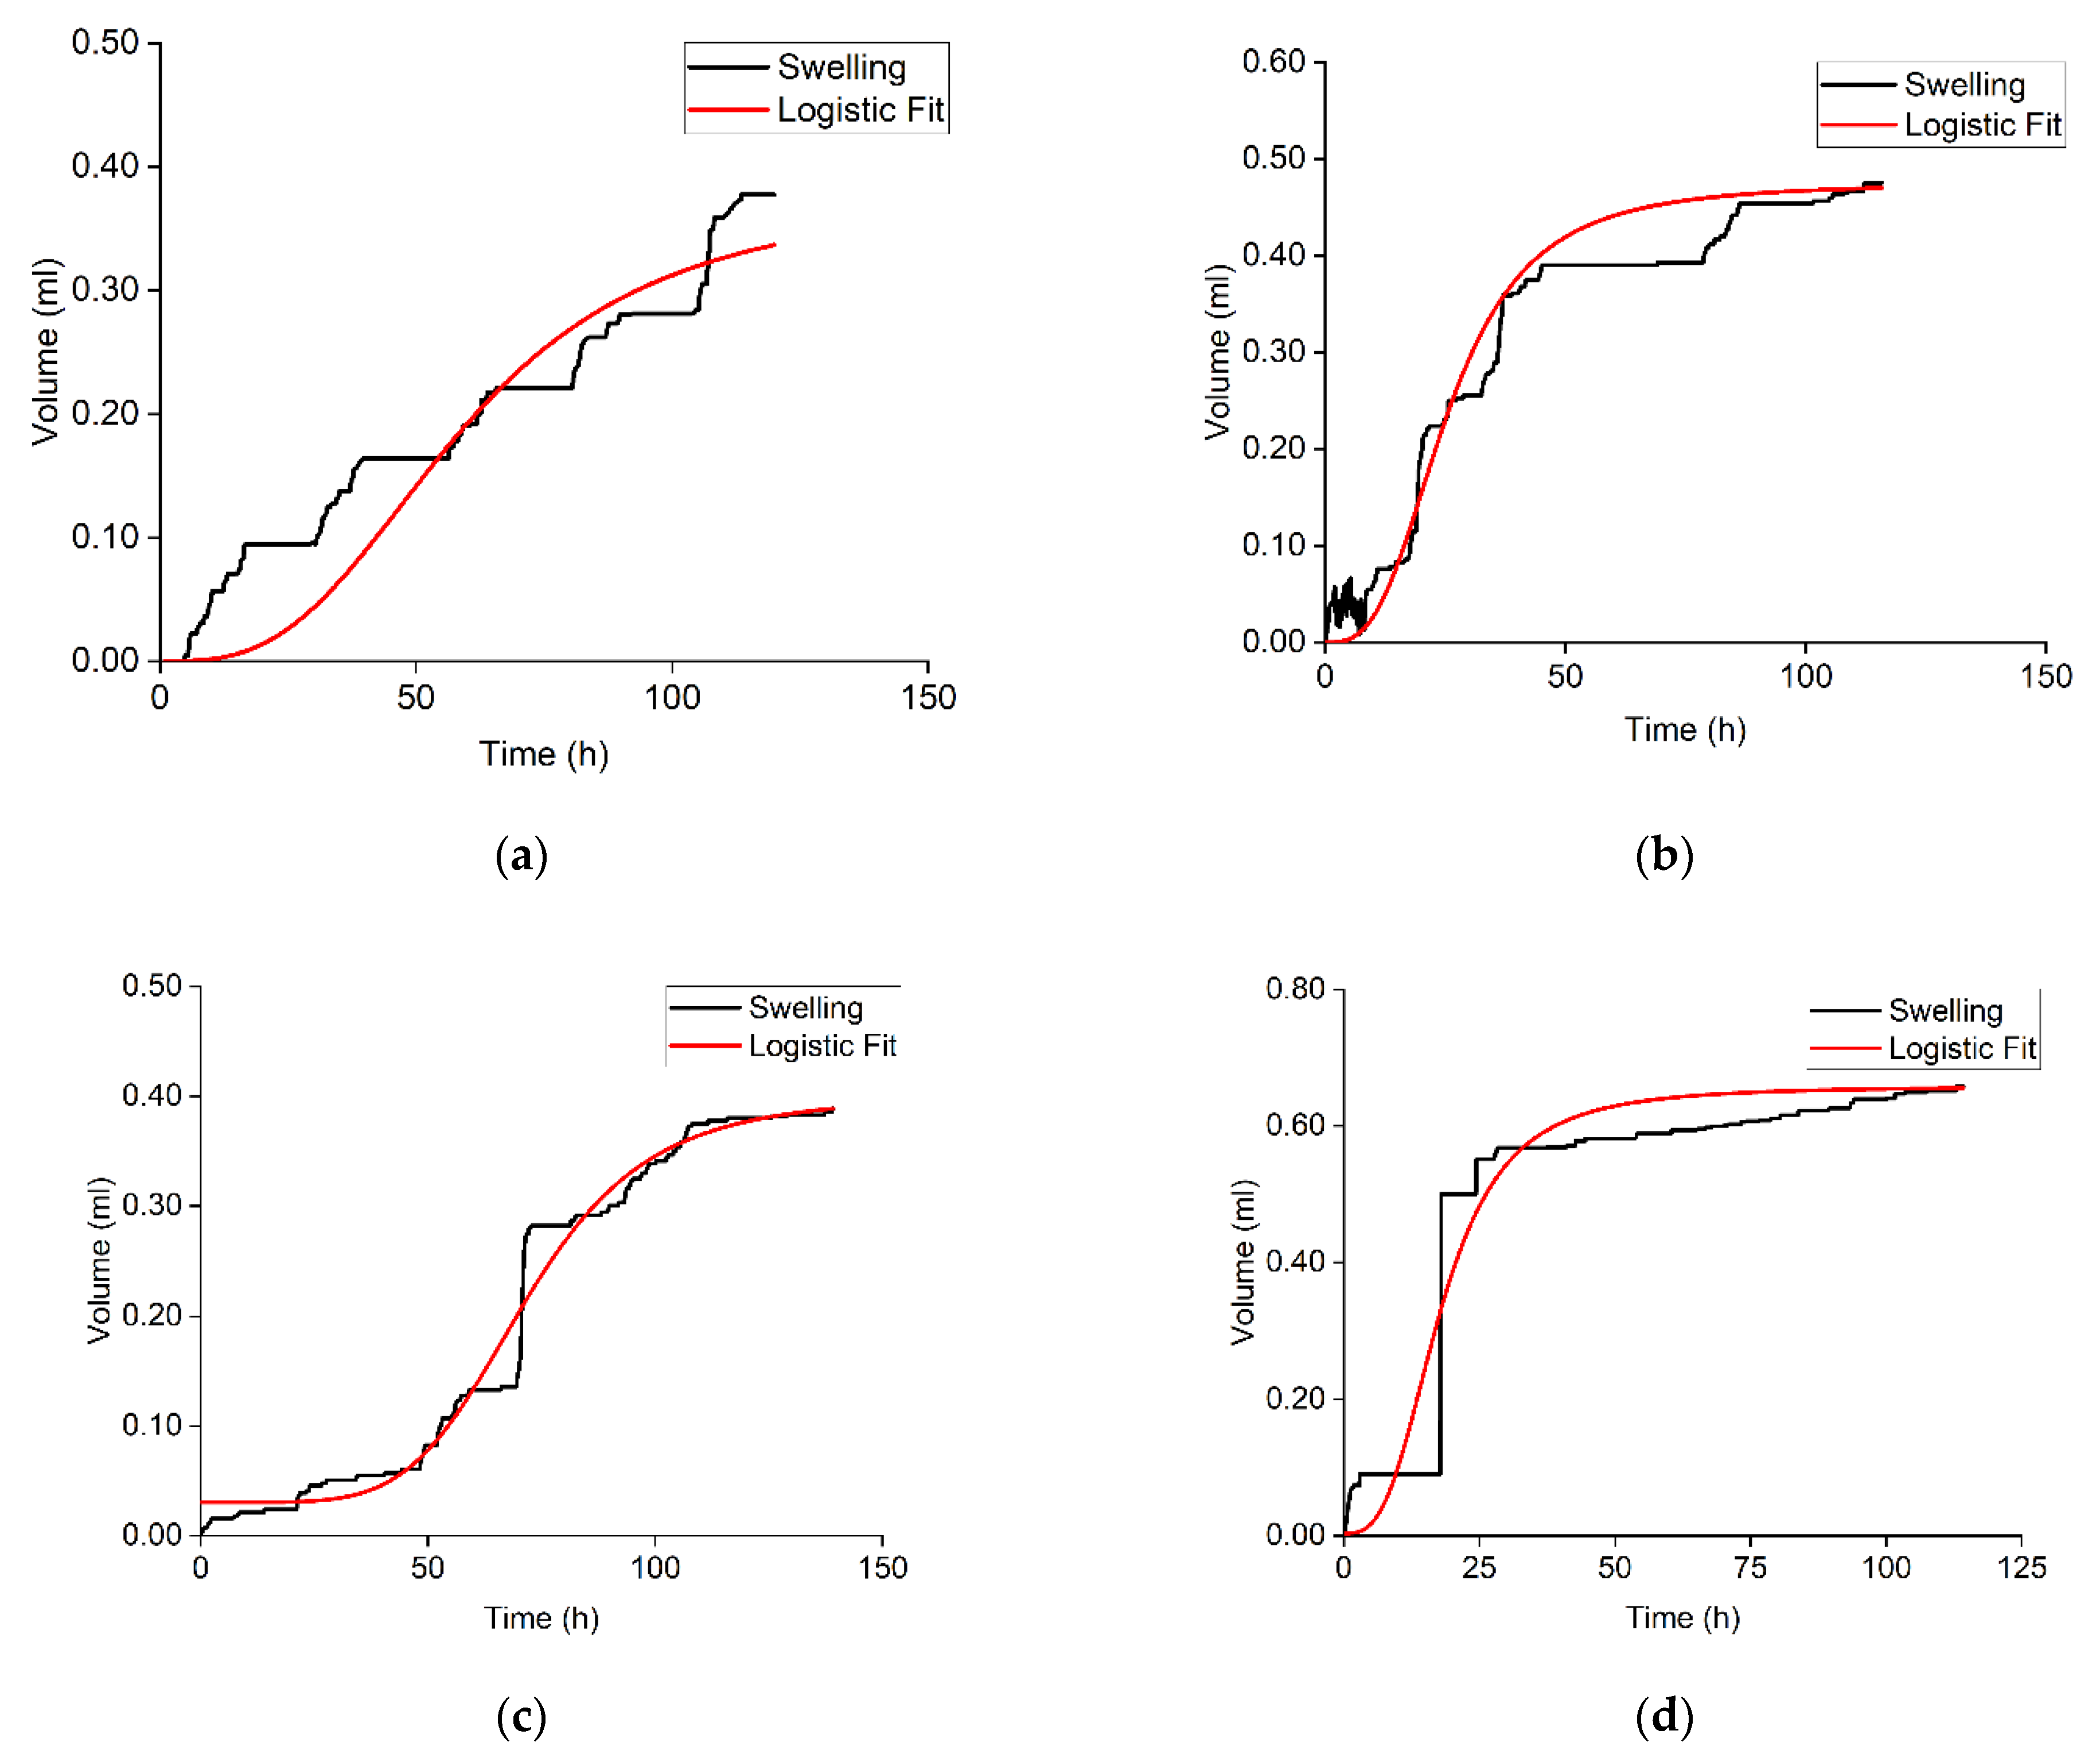
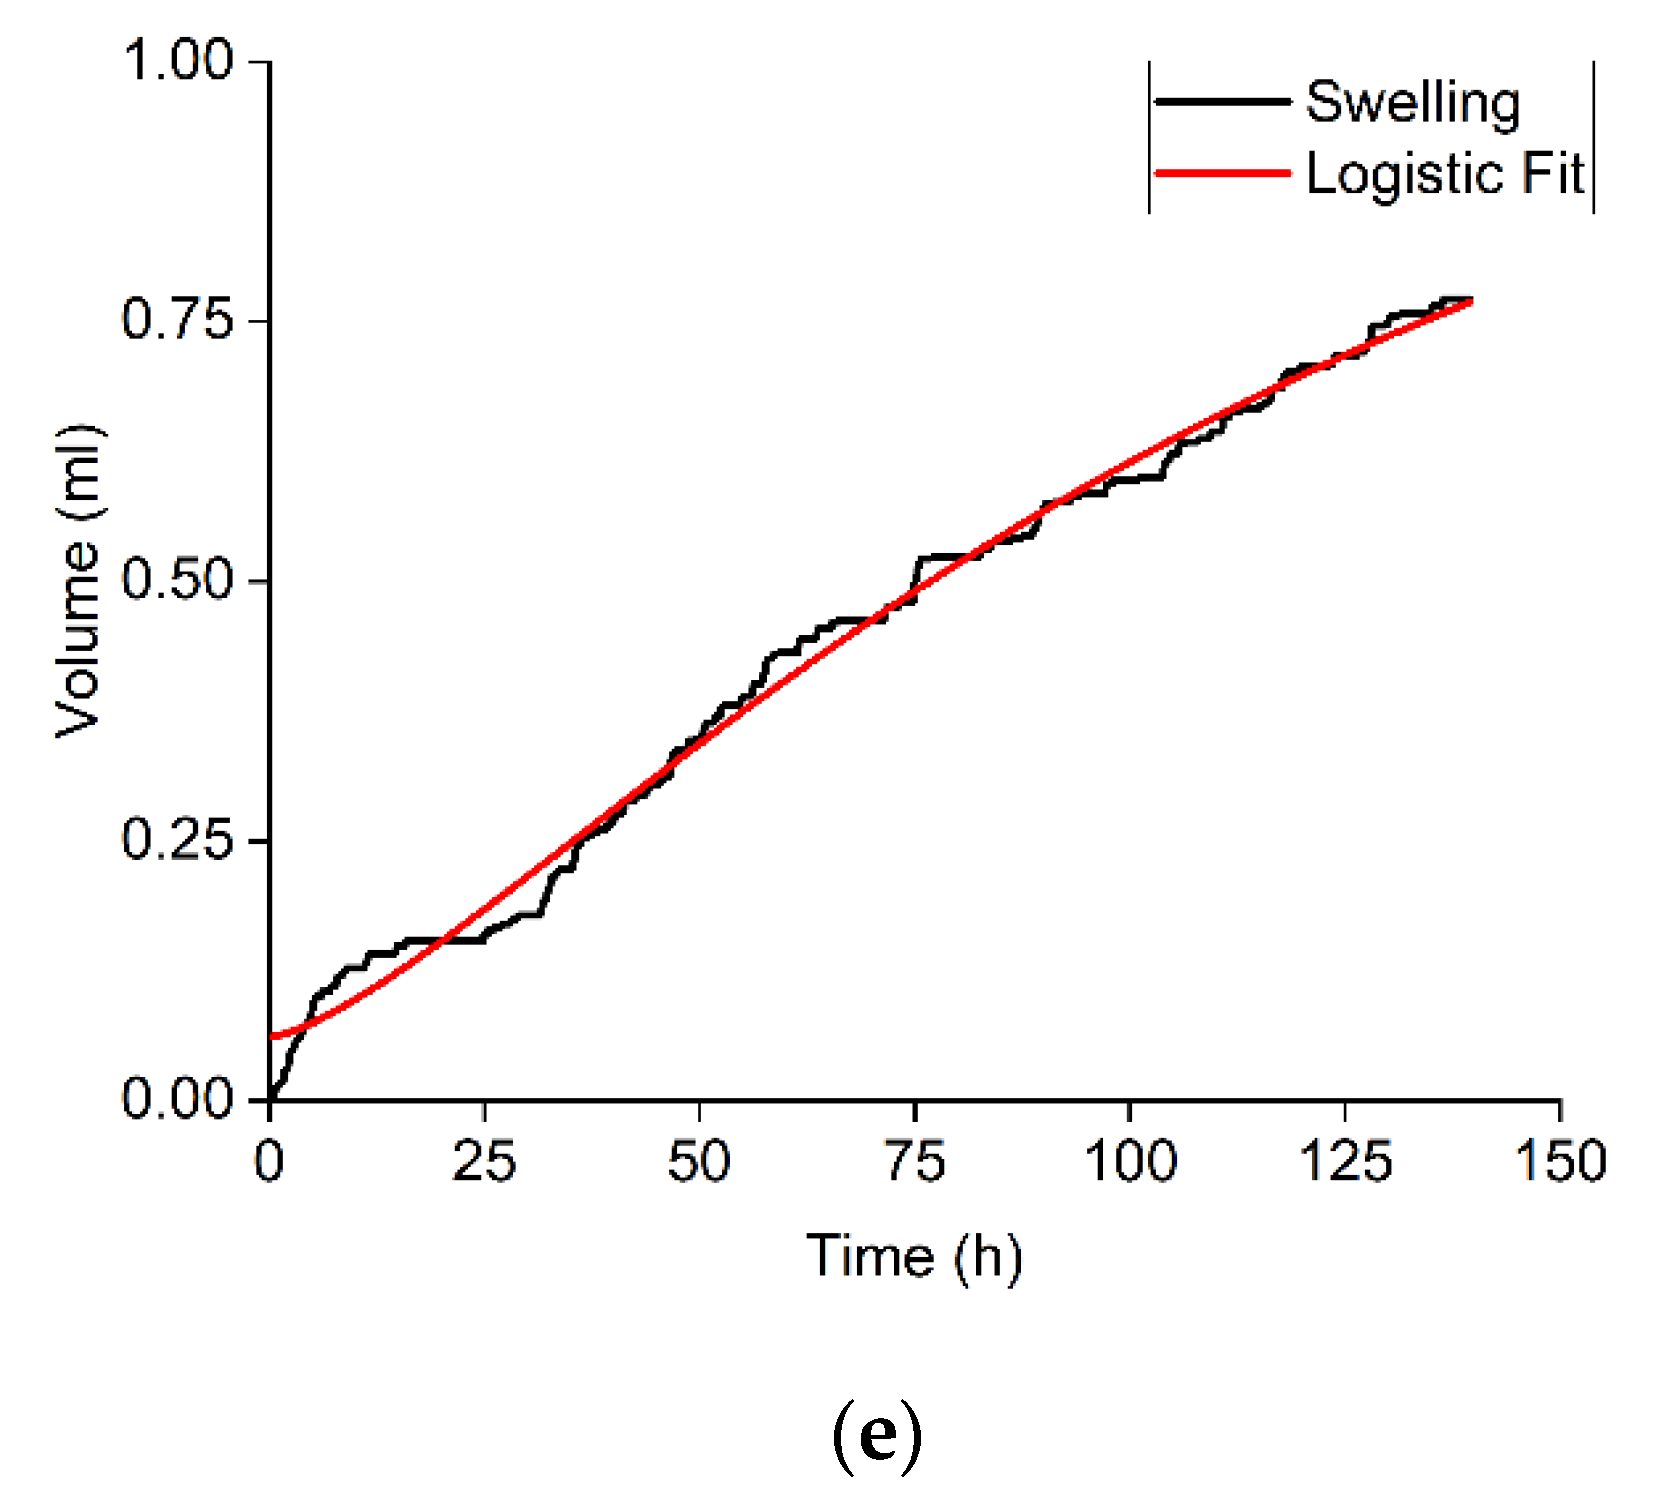
This section describes the results of applying the constructed experimental setup for studying the swelling of the rock samples in 0.2% wt. NaOH solution. Figure 4 show the dependencies that were obtained during these experiments. The defined swelling parameters for all samples are summarized in Table 3. Sudden step-like changes in volume of the samples in Figure 5 are explained by the minimal friction pressure between the call cap and the swelling cell body, as well as between the piston and the cylinder in the accumulator PA 1 (see Scheme 1 and Figure 3) which needs to be overcome to move the cap and the piston. Work on addressing these effects is currently in progress.
The volumetric expansion coefficients that were obtained in these experiments are in the range of 1.5–3% vol. This is consistent with previous studies [35] and significantly lower than the volumetric expansion coefficient that was defined for bentonite. Such relatively low values may be explained by the lower total clay content, the high content of non-swelling and low-swelling clays (illite, chlorite, and kaolinite), and the previously described impact of hydraulic pressure. Figure 5 shows the cross-plot for the volumetric expansion coefficient and the clay content. The relatively high swelling of sample 1 on this plot can be explained by the presence of anhydrite at a concentration of 2.9% wt. It is expected that anhydrite (CaSO4) may react with water and turn into gypsum (CaSO4∙2H2O). Gypsum is known to have a higher specific volume than anhydrite [43], so some additional swelling is expected. Further, the volumetric expansion of sample 4 is lower than expected because of the highest mixed-layer clay content. This phenomenon may be due to the presence of calcite, which distorts clay swelling by shielding the clay particles. As with bentonite, the change of the volumetric expansion coefficient can be approximated by a logistic function (the minimum R2 is 0.82 for the first rock sample). According to Table 3, the A2 and p values for all samples are, respectively, lower and higher than the same parameters for bentonite, indicating a lower swelling rate and lower final swelling degree of the rock samples (excepting sample 5).

3.4. Swelling of Crushed Rock Samples in Hydrocarbon-Based Fracturing Fluid

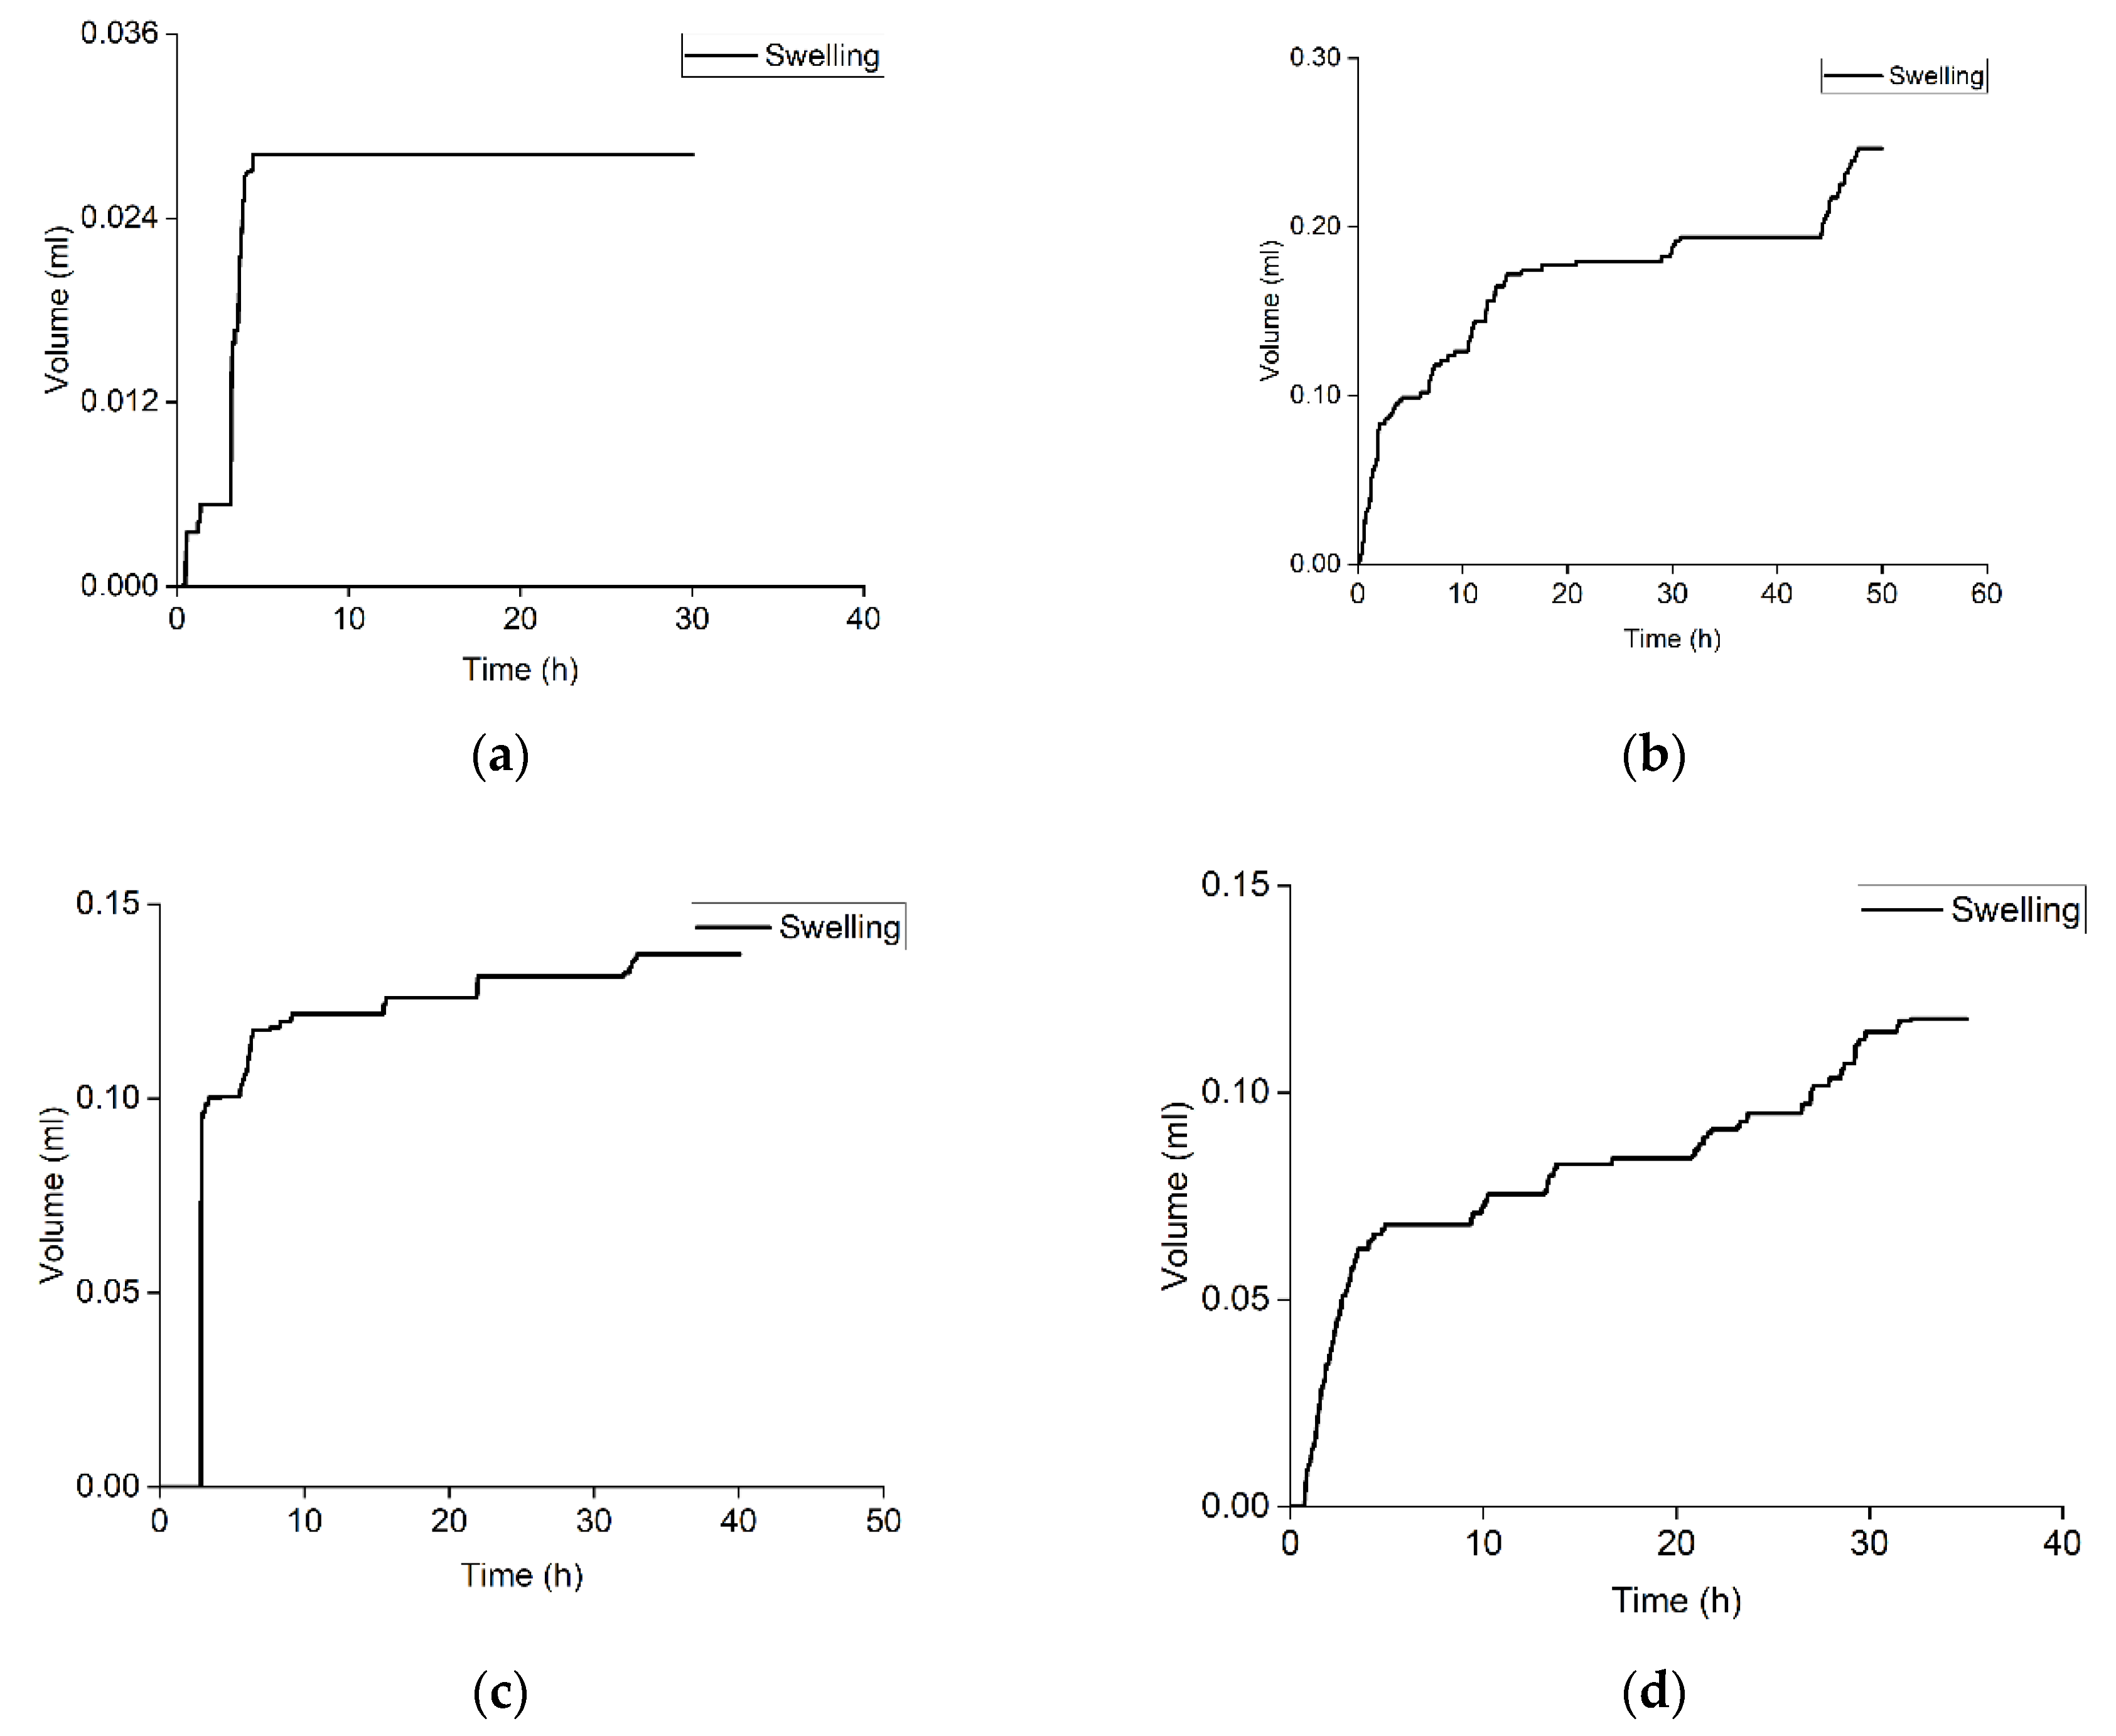
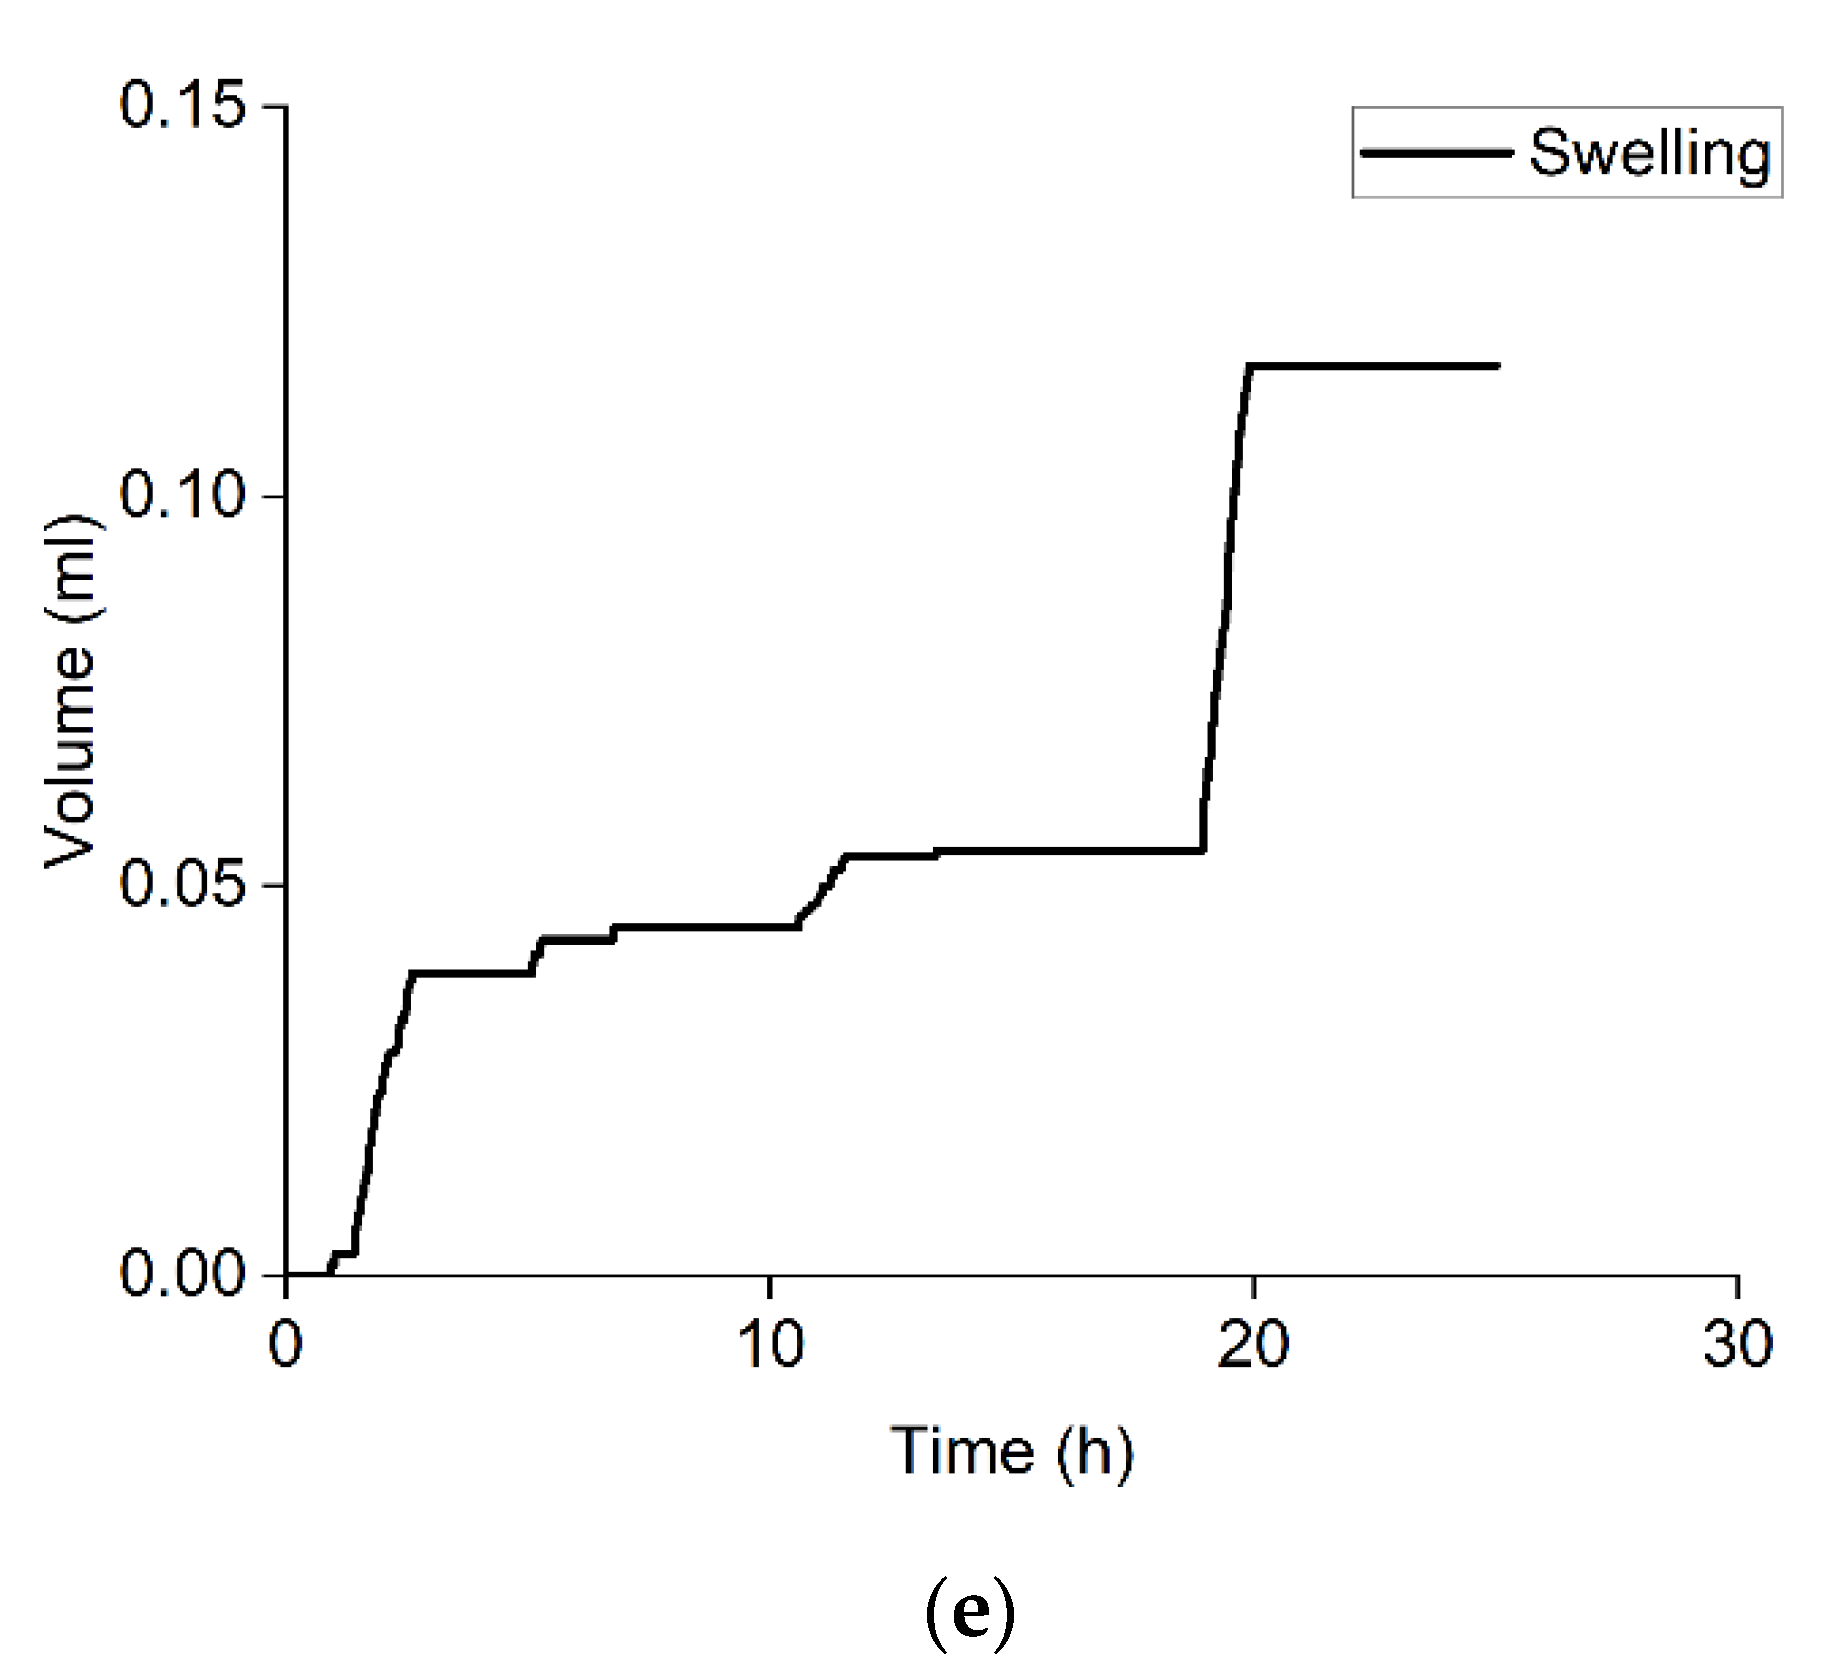
This section describes the application of the constructed experimental setup for evaluating the swelling of the studied rock samples in the hydrocarbon-based fracturing fluid, with the composition described in the Section 2.1. Figure 6 shows the dependencies that were registered during the experiments with samples 1–5. The swelling parameters that were defined for all rock samples in the hydrocarbon fluid are provided in Table 4.
The swelling of shales upon contact with hydrocarbons was described earlier [29,44]. The proposed mechanism of this process is based on the absorption of hydrocarbons by kerogen with the simultaneous change in its volume. The relatively low values of the volumetric expansion coefficients that were observed in this study are consistent with the results of computational studies [26]. We also expect that the volumetric expansion values in the presence of oil in reservoir conditions will be lower because of kerogen saturation with petroleum hydrocarbons.
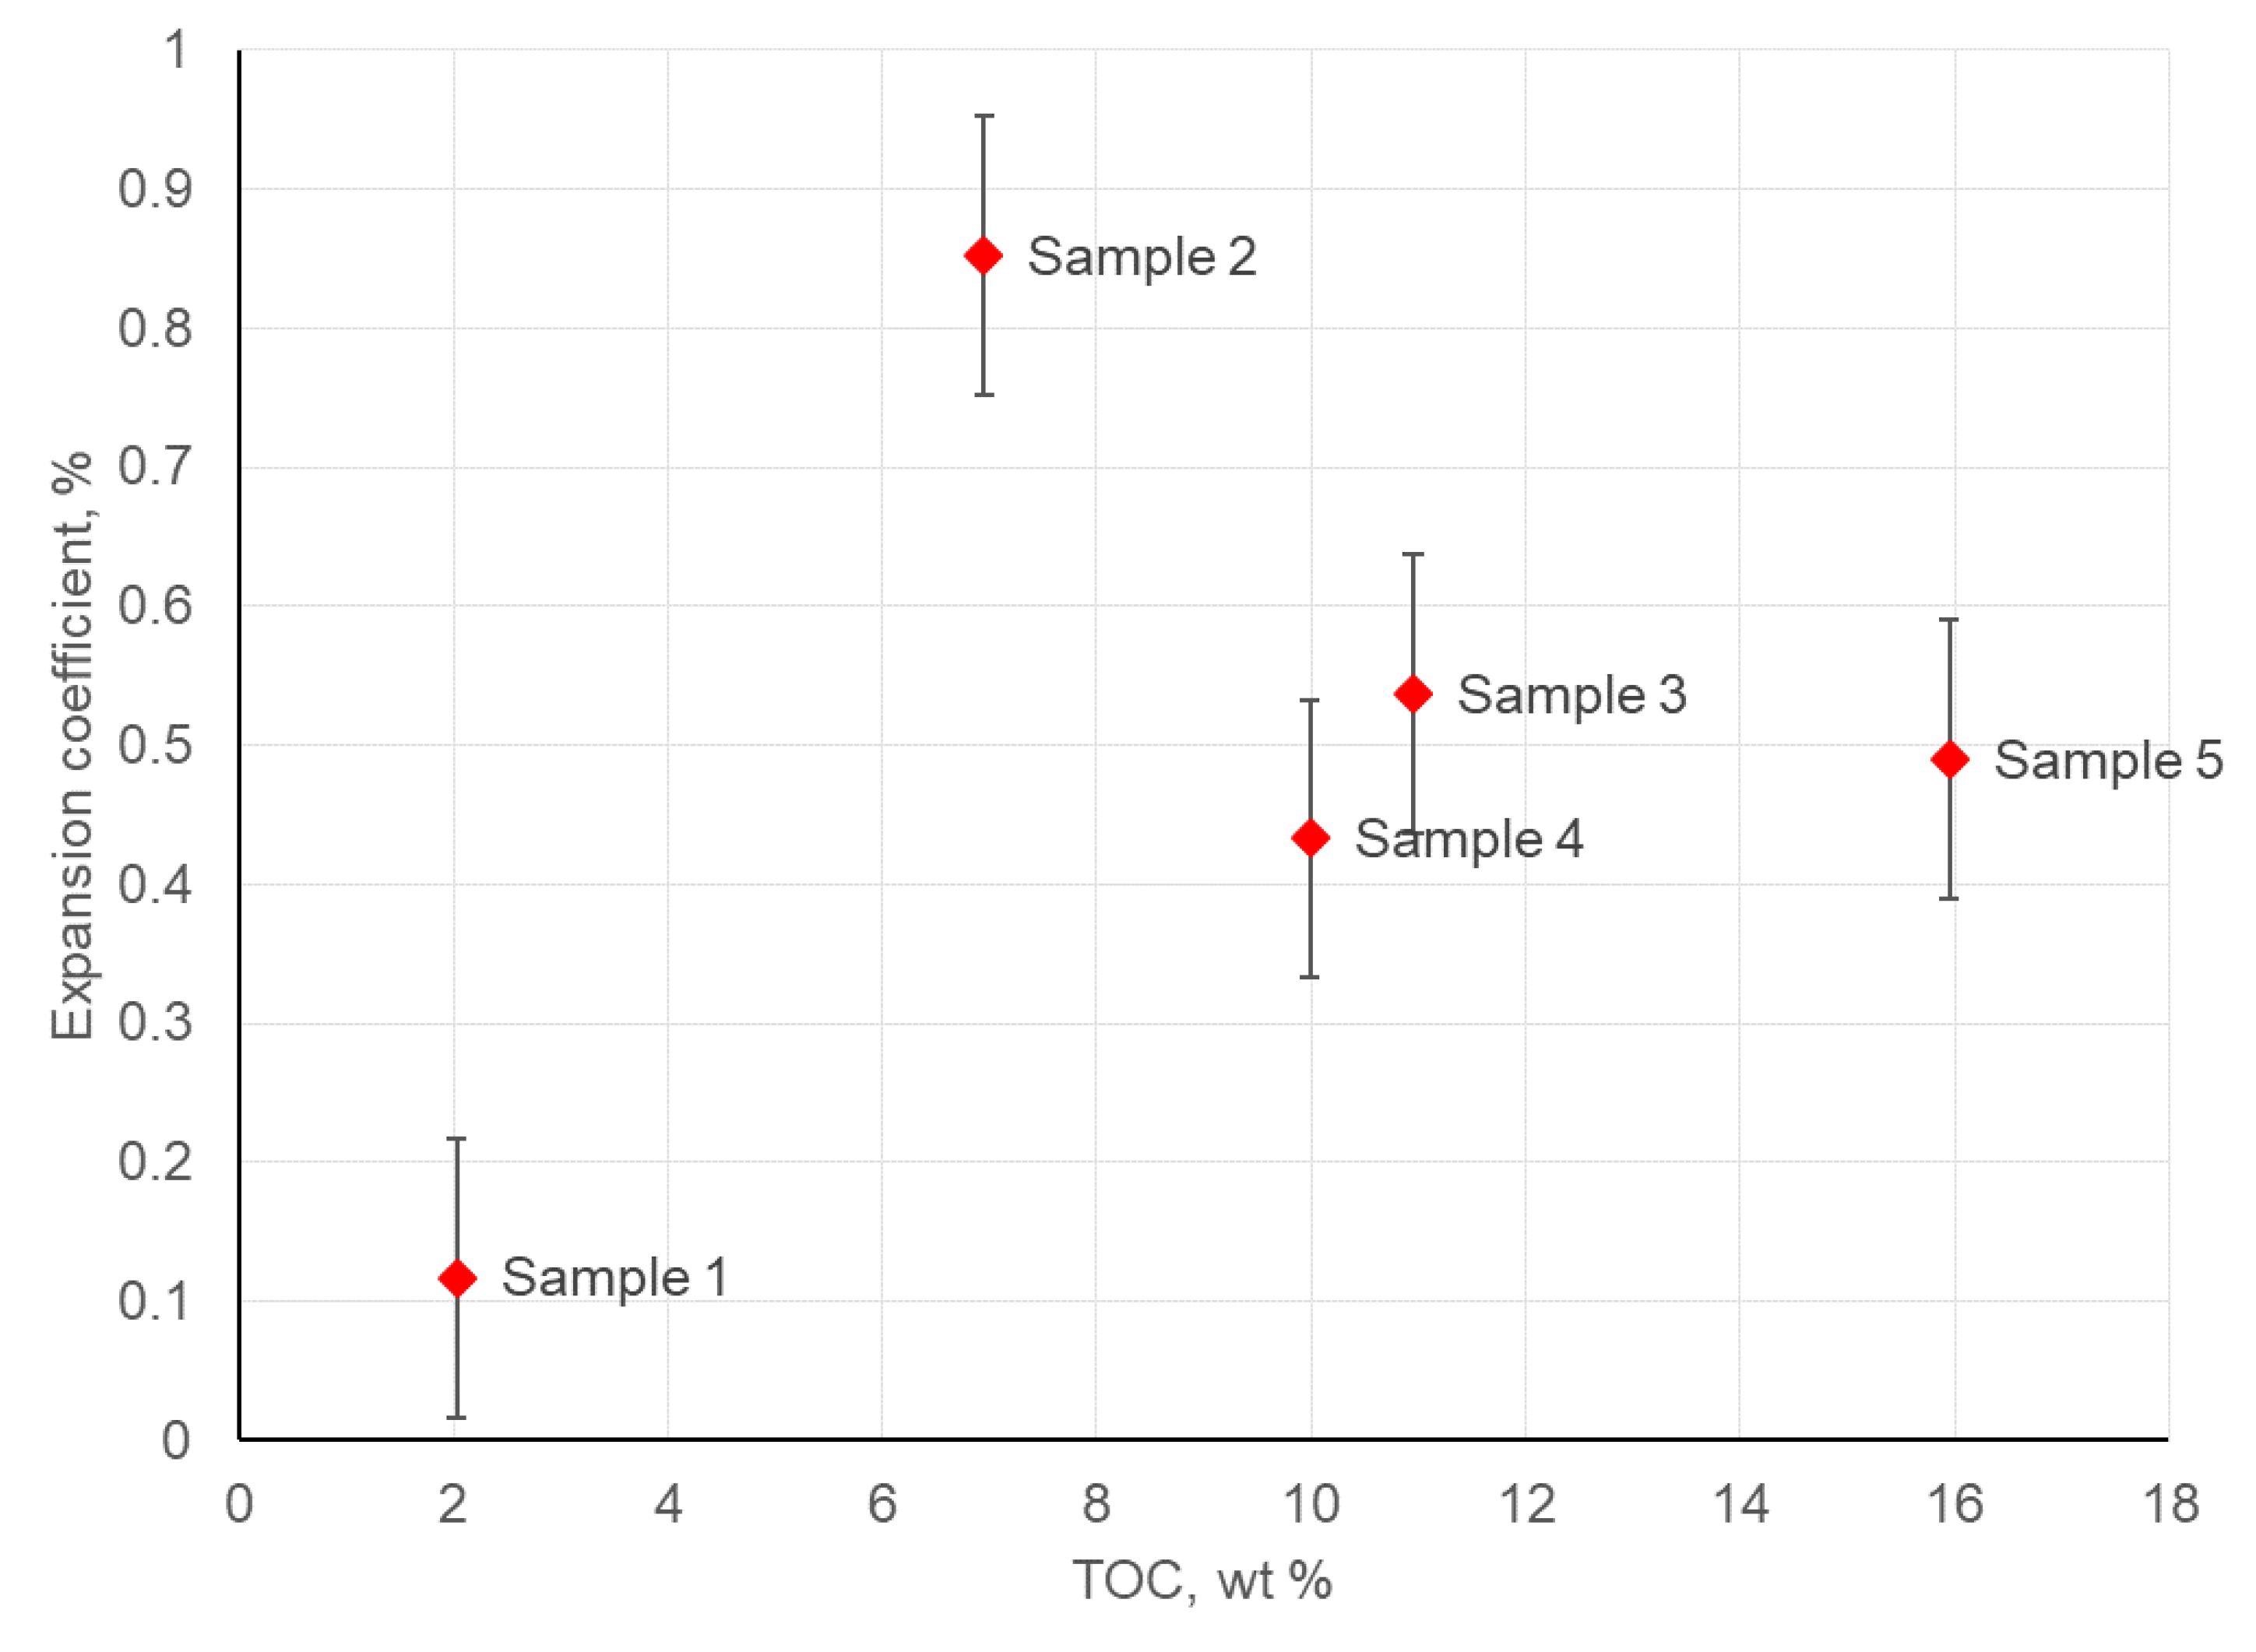
The analysis of the swelling dependencies that were obtained in the presence of the hydrocarbon fluid showed that these data cannot be approximated with sufficient accuracy using any known function. This fact highlights the complexity of the swelling process and its strong dependence on the rock samples’ nature and hydrocarbon-based fluid composition, which includes not only diesel fuel, but also orthophosporic ether and organic aluminum salts. The obtained volumetric expansion coefficients also do not correlate with the TOC values as shown in Figure 7.
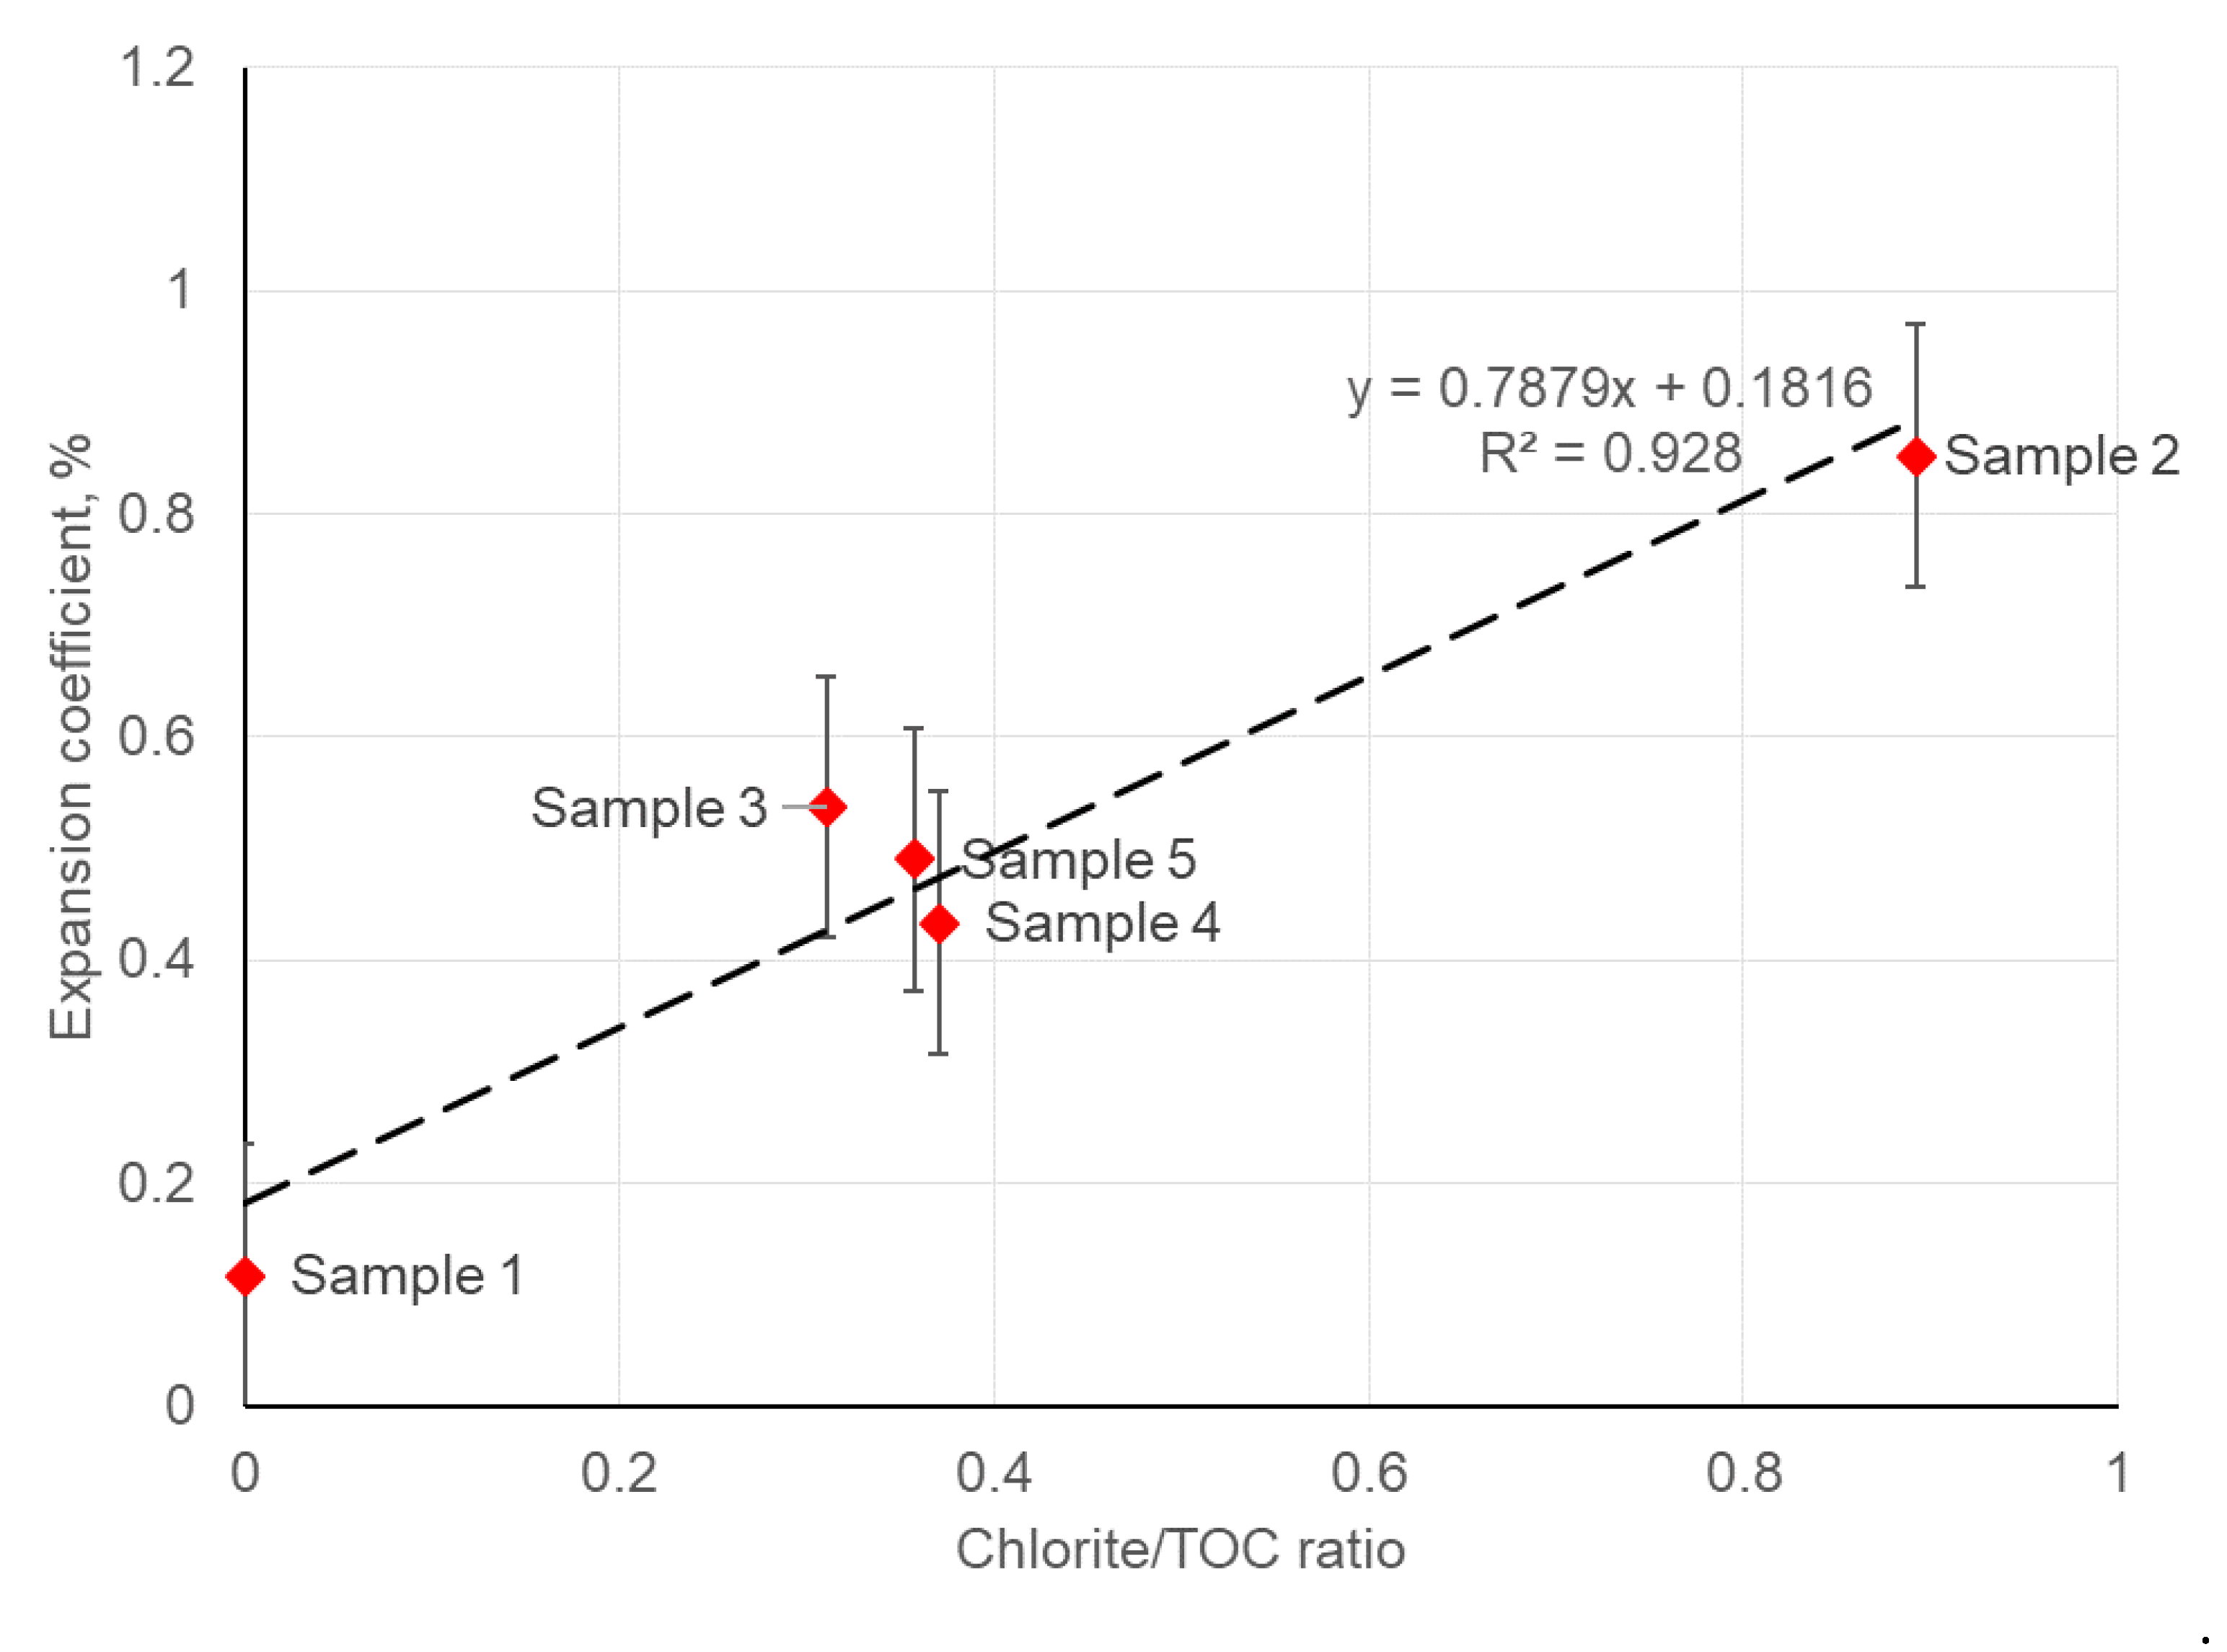
Clays have the largest surface area among all shale minerals and possess the highest lability. If the rock organic matter is predominantly deposited on certain clays, the clay/TOC ratio should indicate the accessibility of the organic matter to hydrocarbons. Indeed, a higher clay content for the same TOC will mean a lower thickness of the organic matter ”film“ on clay particles, and a higher contact area between the organic matter and hydrocarbons. This hypothesis agrees with some observations from the performed experiments. For example, the defined volume expansion coefficient in the presence of hydrocarbons for the studied samples demonstrates a reasonable correlation with the chlorite/TOC mass ratio (see Figure 8). However, because of the lack of statistical data, this dependence is not certain and is the subject of further research.
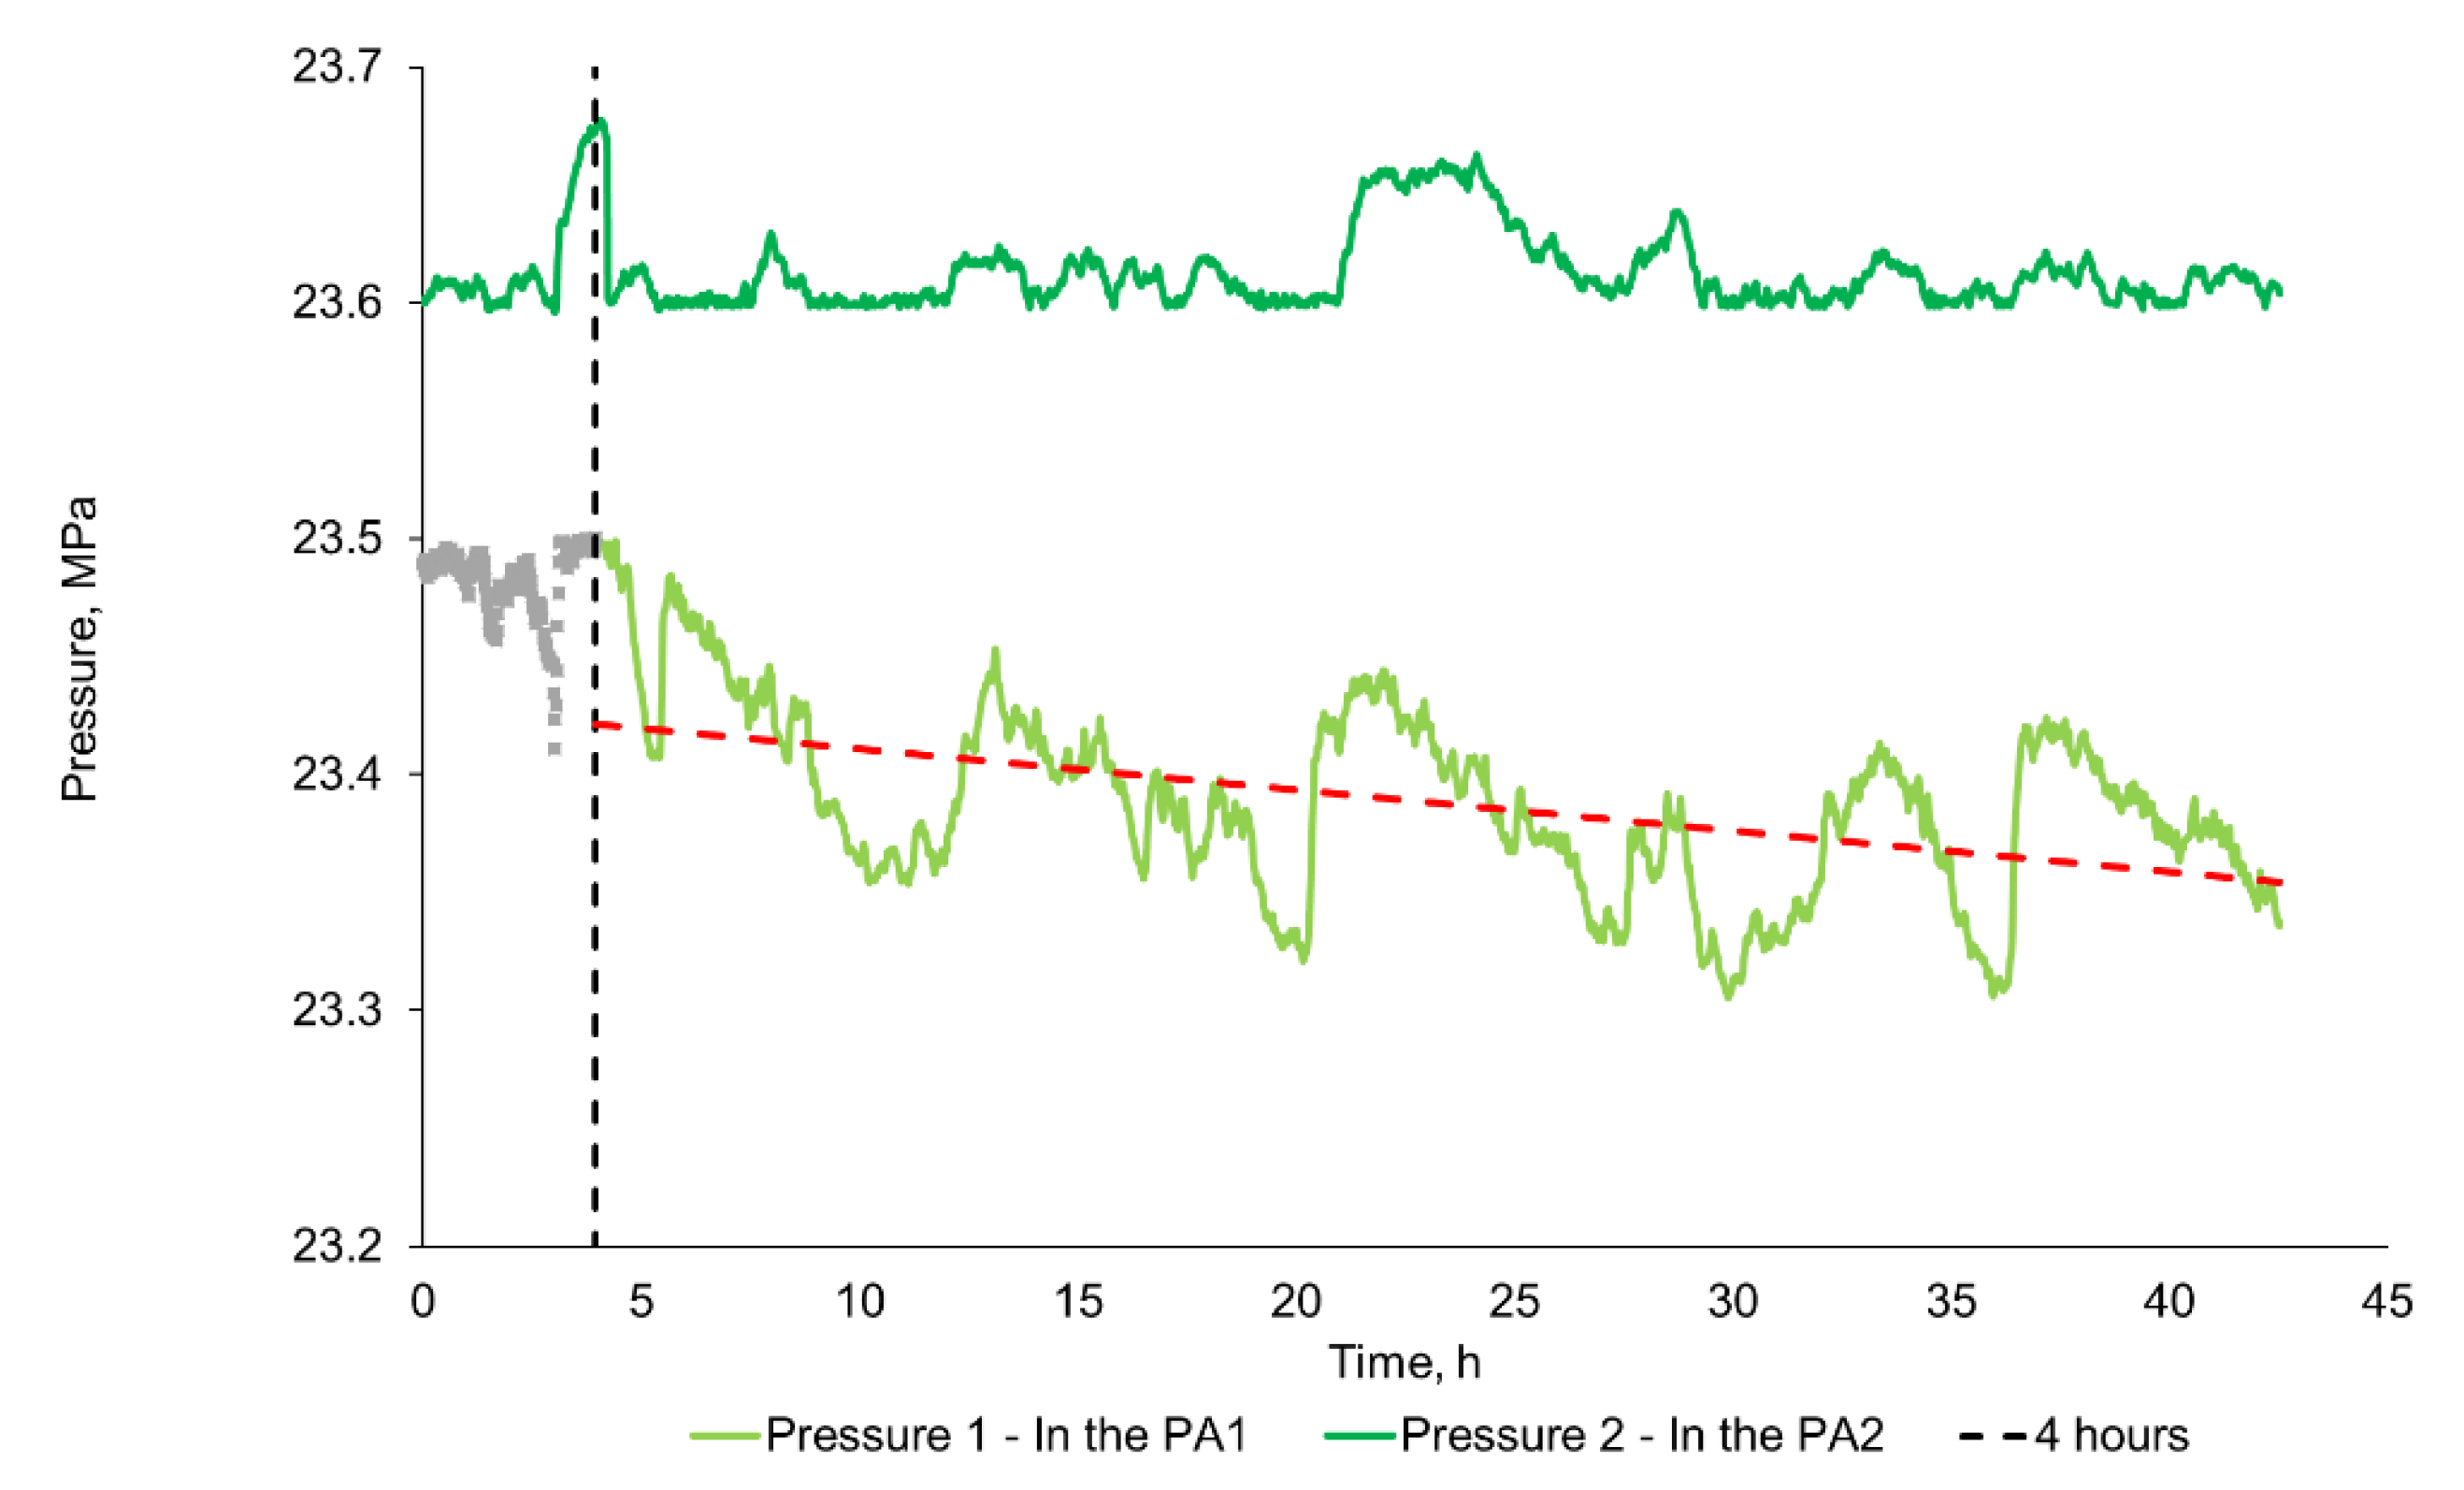
A Pressure decrease after 4 h was observed in some experiments with the hydrocarbon fluid (Figure 9). This behavior may be caused by kerogen deformation upon contact with high-molecular hydrocarbons [29]. Swelled kerogen may change its mechanical properties, leading to the rearrangement of a disintegrated rock pore structure. The detailed description of rock shrinking upon contact with fluids requires further investigation.

3.5. Rock Swelling in CO2

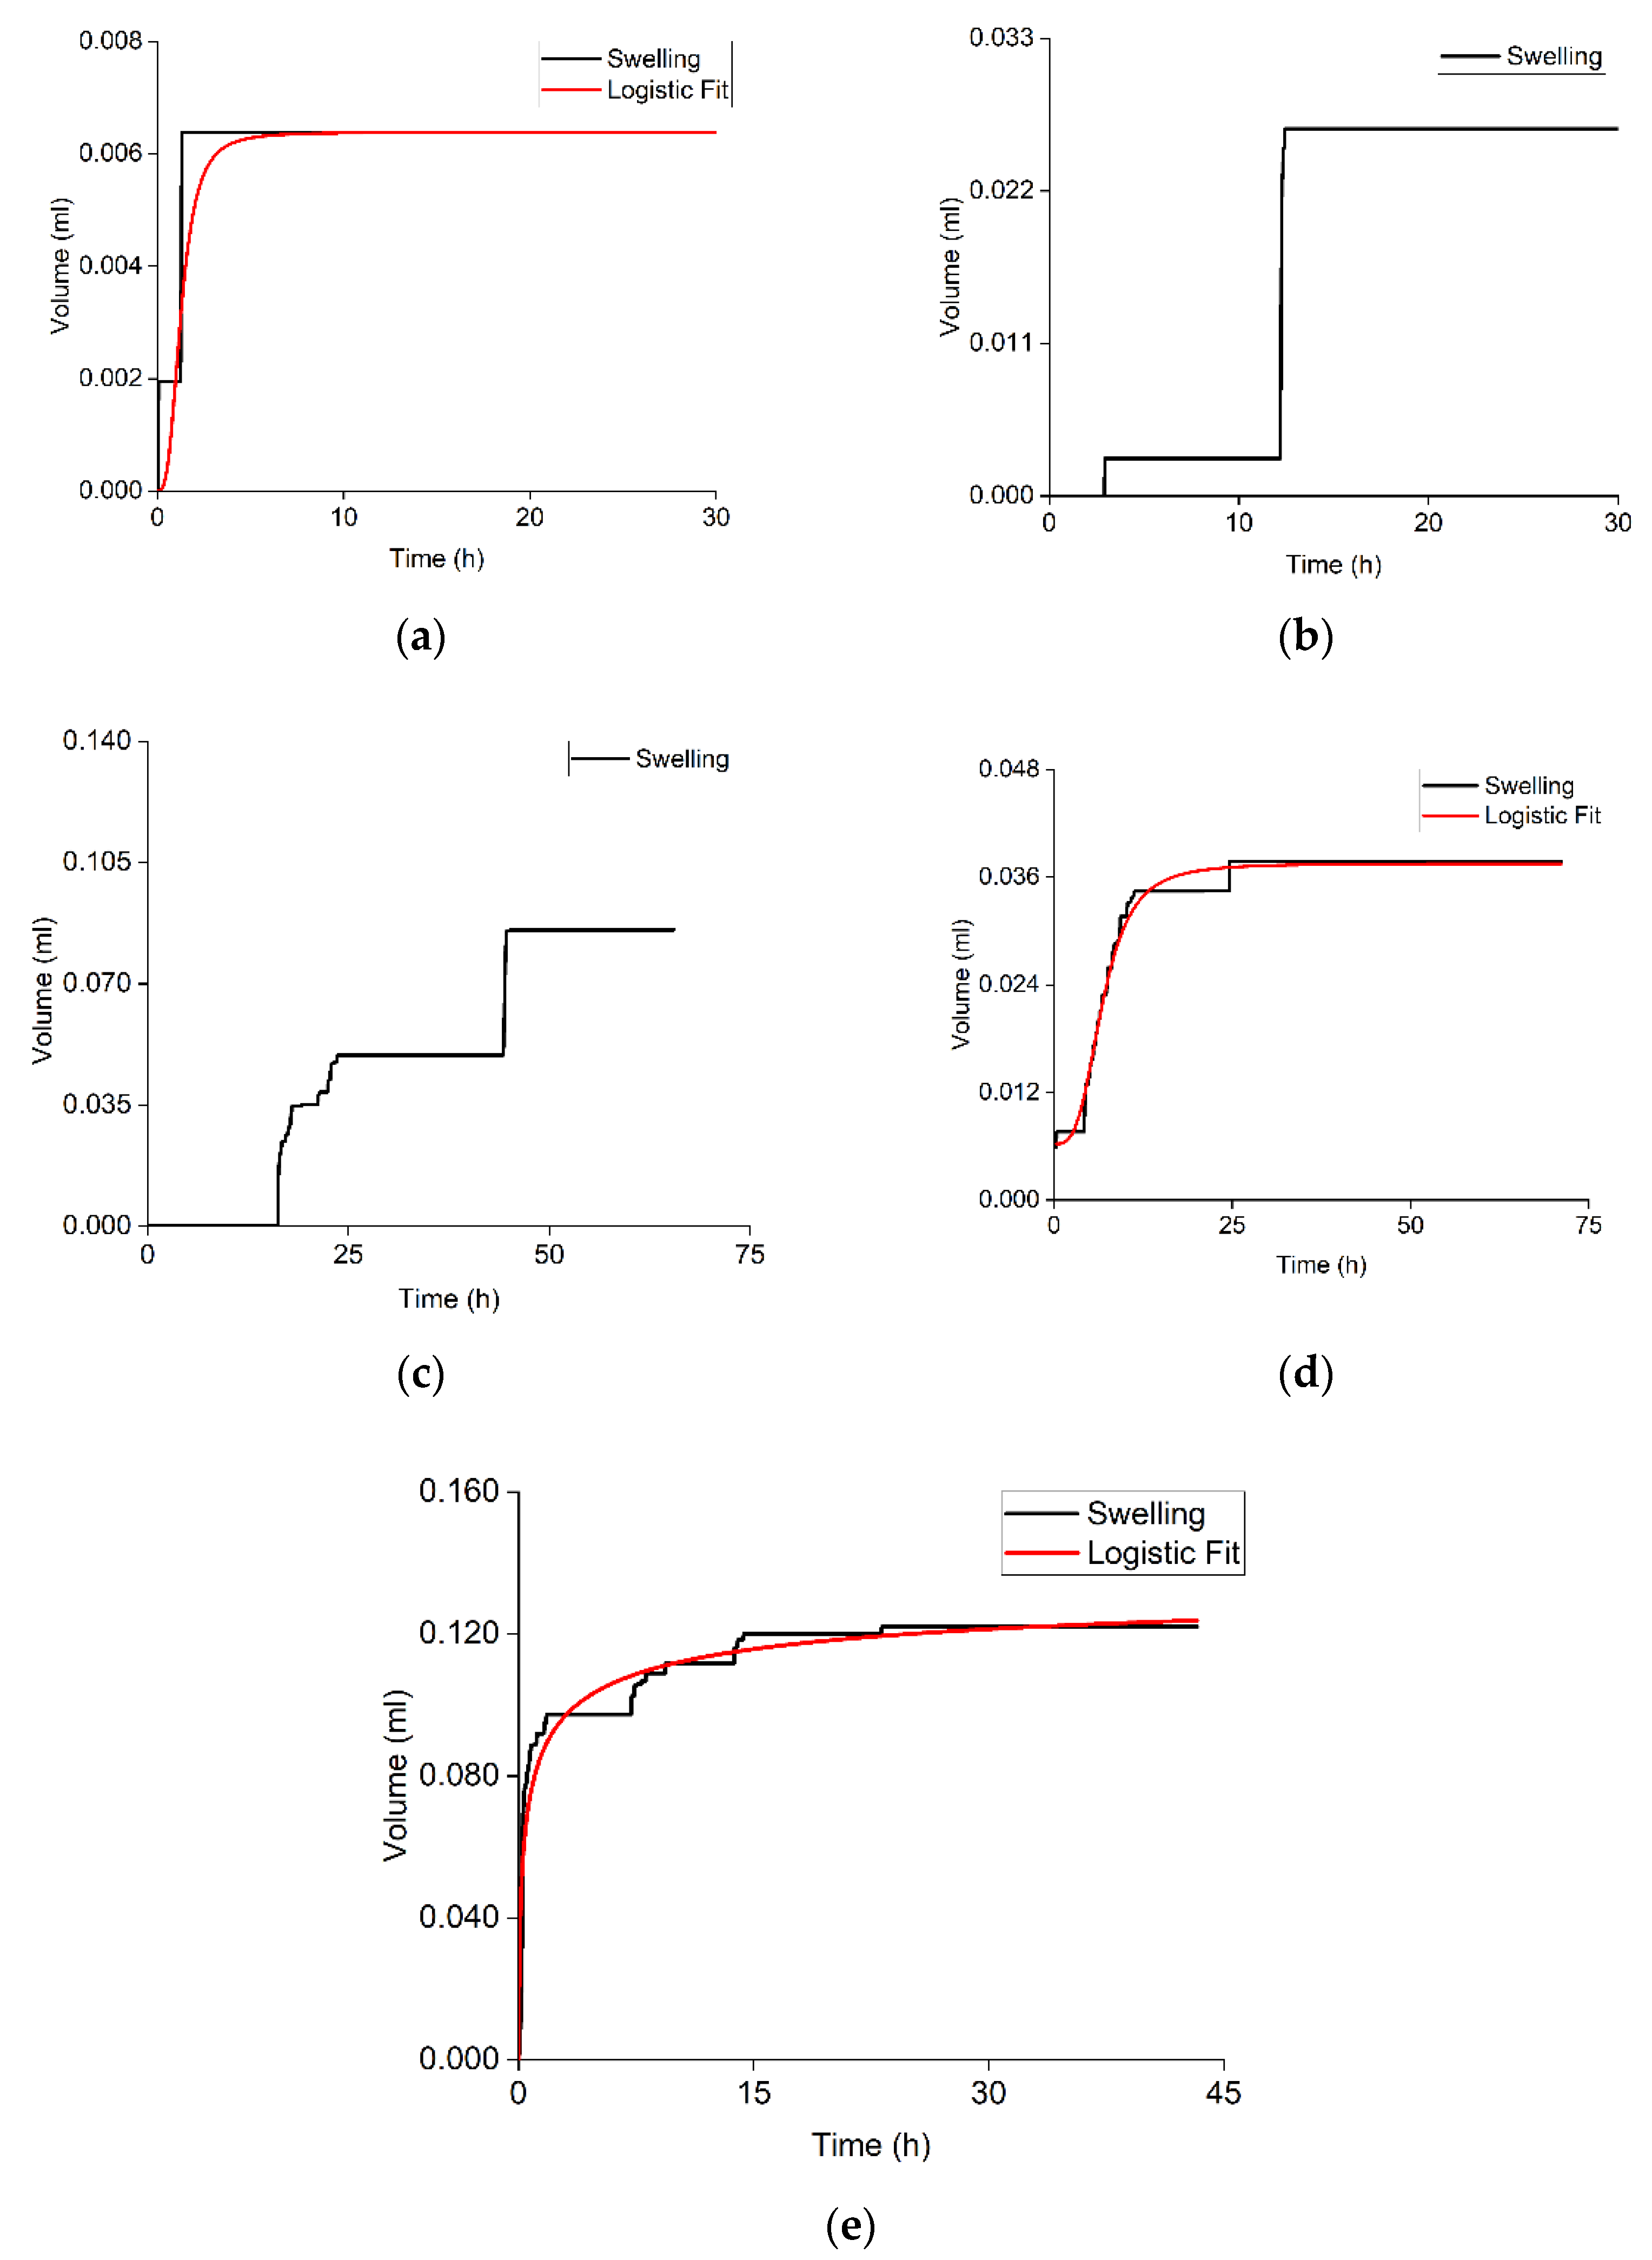
This section describes the application of the constructed experimental setup for studying swelling of the rock samples in supercritical CO2 in reservoir conditions. Figure 10 shows the dependencies that were registered during these experiments. The defined swelling parameters are listed in Table 5. The parameters of the logistic function for samples 2 and 3 were not provided because the experimental data could not be reliably approximated.
According to the obtained results, the volumetric expansion coefficients in the presence of CO2 and the hydrocarbon-based fluid are close to each other. This is consistent with results of other studies and indicates CO2 interaction with the organic matter of the rock. Further, some of obtained swelling dependences can be well approximated by logistic function (see Figure 10).
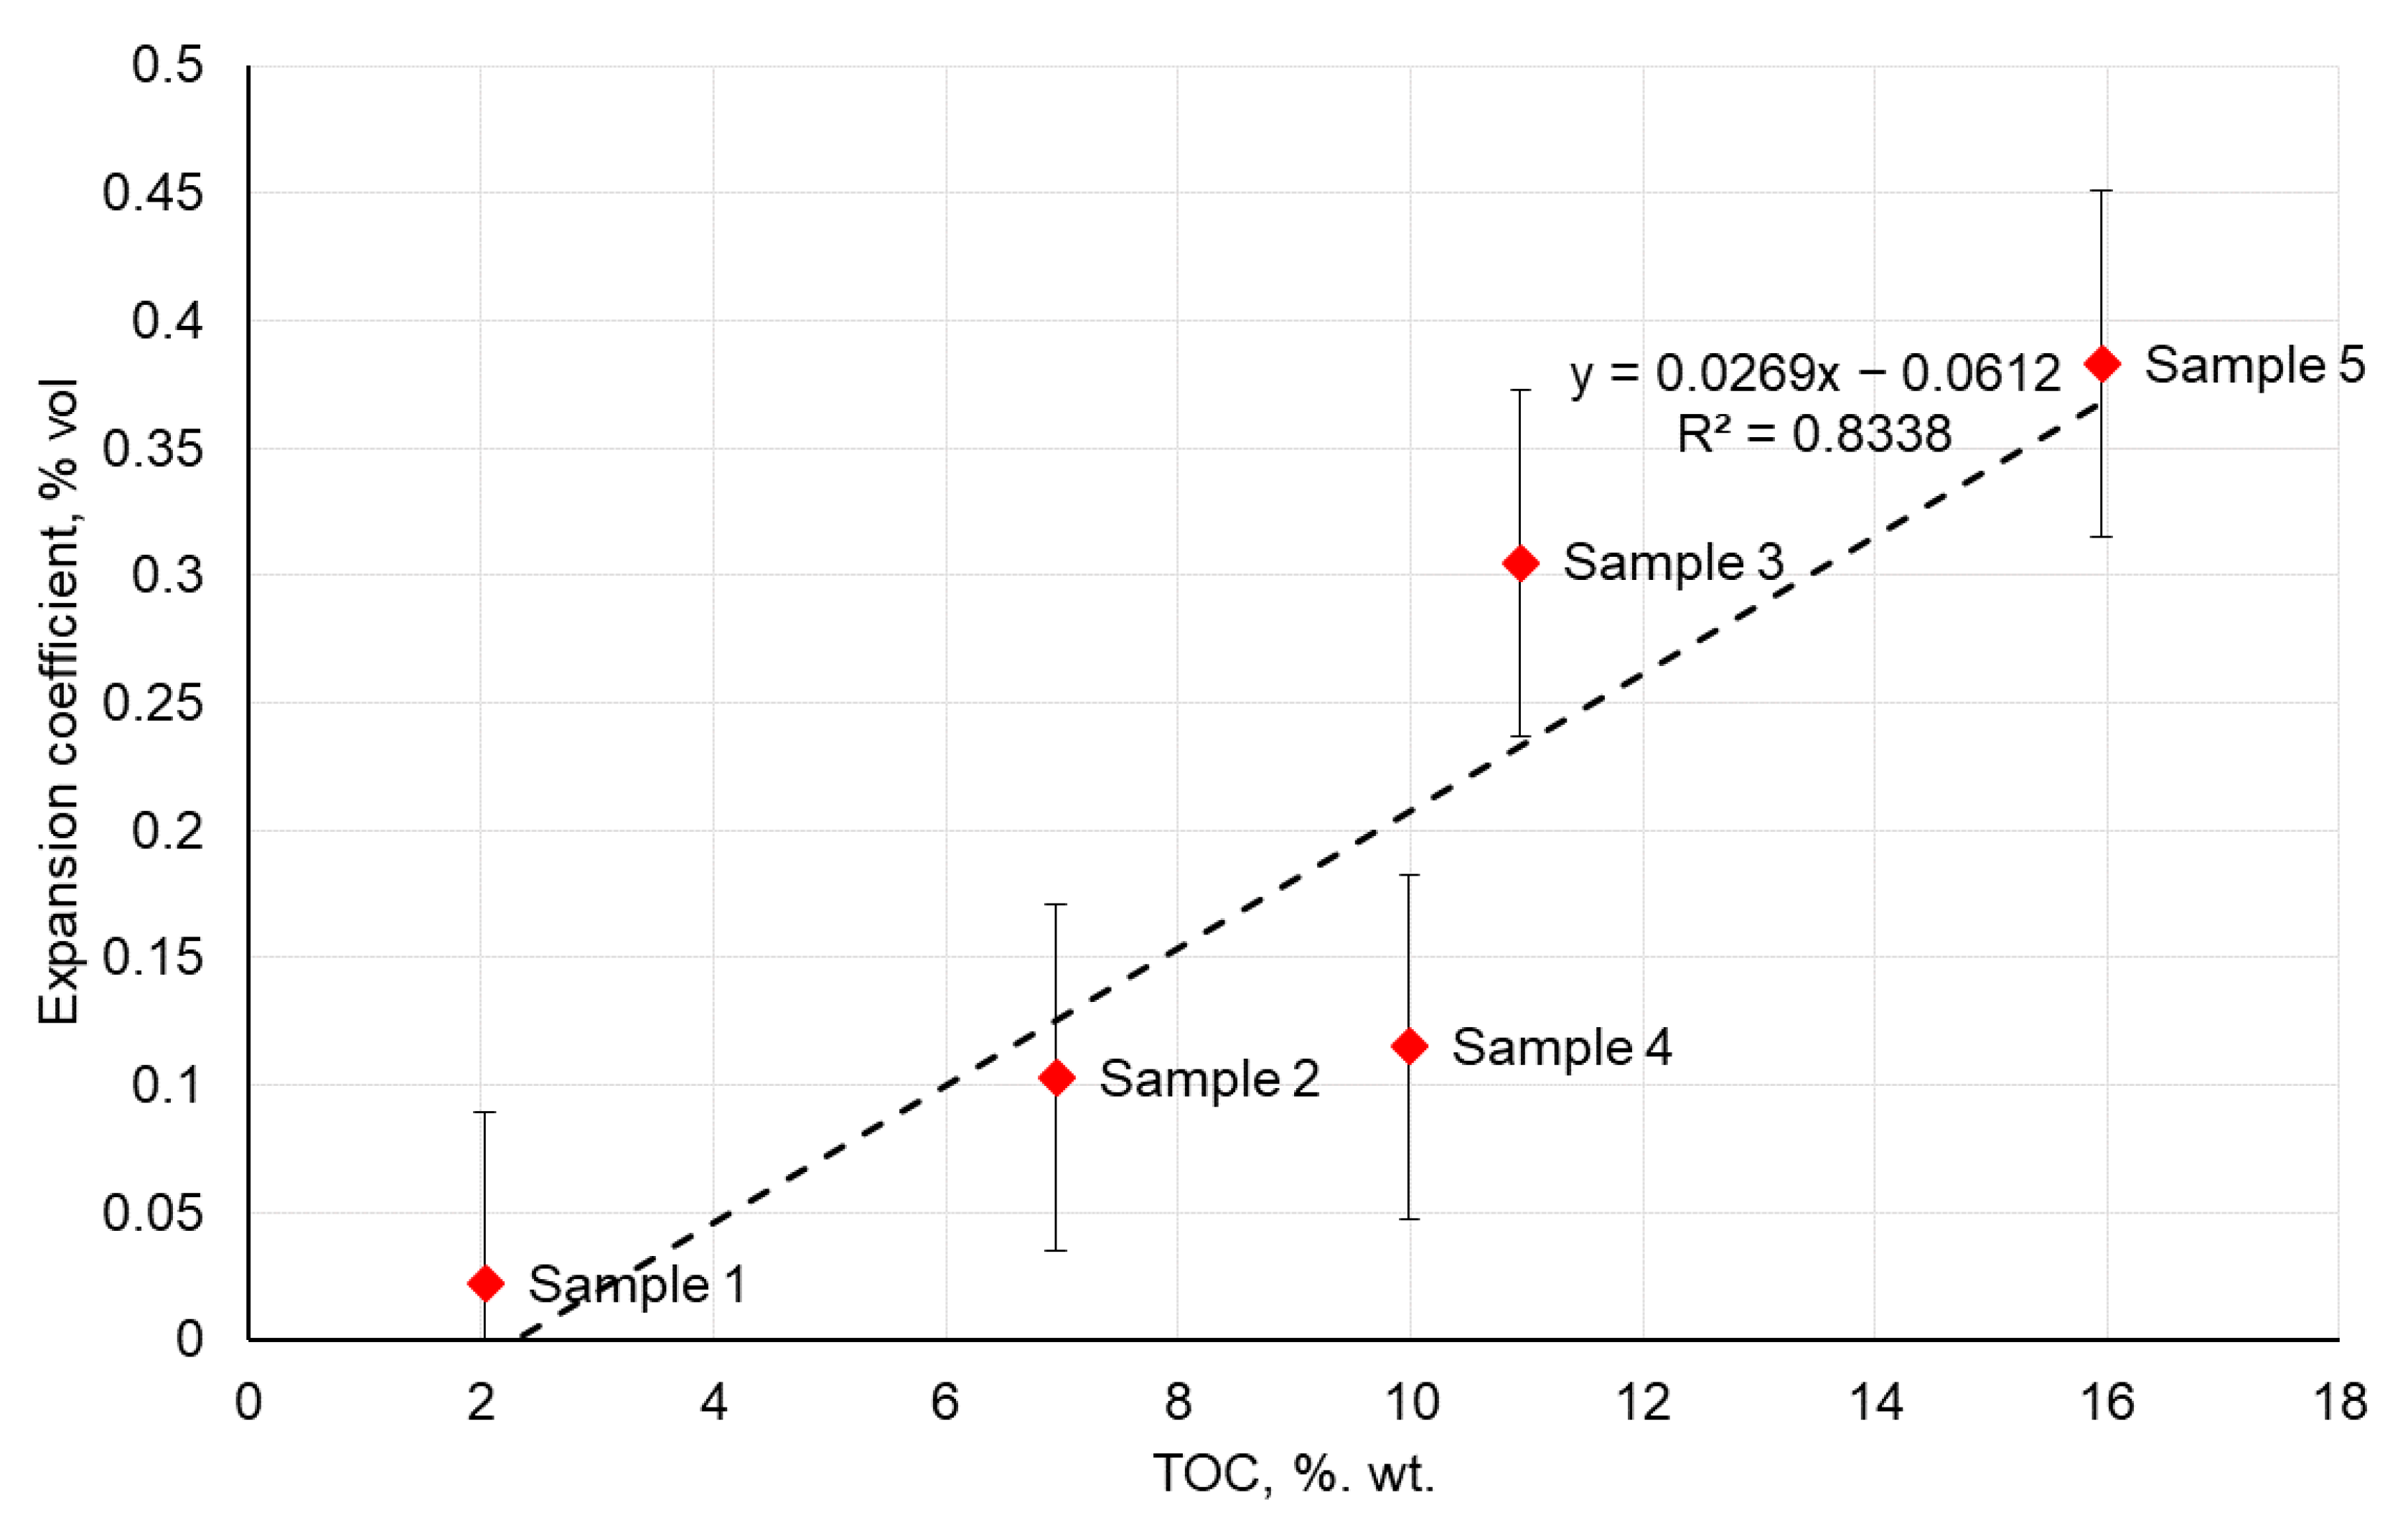
Figure 11 shows the cross-plot between the volumetric expansion coefficients that were obtained in the experiments with CO2 and TOC of the used samples. The obtained near-linear dependence can be explained by the quick penetration of the low-viscous CO2 into the rock matrix and its absorption within the volume of the agglomerates of the organic matter. However, further studies are required for validation of this hypothesis because of the insufficient amount of available statistical data.

4. Conclusions

Optimization of the composition of drilling, stimulation, and workover fluids for shale reservoirs requires the development of experimental methods for studying rock/fluid interactions in reservoir conditions. In this paper, we describe the development of a new quantitative experimental method for studying formation rock swelling in the presence of various fluids and provide the results of its practical application. The proposed experimental setup enables the continuous measurements of changes in the rock volume during rock–fluid interaction. This setup can be used to evaluate the swelling properties in reservoir conditions with different types of fluids, including gases, foams, and water-based or hydrocarbon-based fluids. The reliability of the proposed experimental methodology is proven by the results of the swelling test with bentonite, as well as during the experimental study using the rock samples from the Bazhenov formation.
The performed experiments demonstrated that water-based fluids cause swelling of the studied shale rock samples. The measured rock volume expansion factors were 1–3% vol. and they directly correlated with the clay content in each sample. These results are consistent with the previously reported data for the swelling of shale samples at a confined pressure. Such a low magnitude of rock expansion, however, may be critical in shales with ultra-low permeability. Some difference between the obtained and previously reported expansion coefficients can be explained by a difference in the rock composition and the composition of the used water-based fluids. The detailed study of the impact of these factors on rock swelling, including the impact of formation fluids on various formation layers, is the subject of our future research.
Exposure of the rock samples to a hydrocarbon-based fluid also caused rock expansion in reservoir conditions with the duration of the swelling period up to 4 h. This effect was explained by the hydrocarbons’ absorption by the organic matter of the rock. Interpretation of the experimental data indicated that further exposure of the rock samples beyond the 4 h period to the hydrocarbon-based fluid might lead to a reduction in the rock bulk volume. This can be explained by kerogen deformation upon contact with high-molecular hydrocarbons and it is the subject of further research.
Exposure of the rock samples to supercritical CO2 in reservoir conditions also caused rock swelling. The obtained swelling degree was similar to the swelling degree in the presence of the hydrocarbon-based fluid.
We conclude that the observed phenomena may lead to a permeability impairment in the near-fracture area with the subsequent reduction in a well production performance. Application of the proposed experimental methodology should resolve this problem by providing the tools for engineering the fluid composition with quantification of the fluid impact on rock properties in reservoir conditions.

Author Contributions

Conceptualization: T.I.Y., A.V.S.; methodology: T.I.Y., A.V.S., E.D.M.; investigation: T.I.Y., A.V.S.; data curation: T.I.Y., D.F.B., A.A.B.; writing—original draft preparation: T.I.Y., A.V.S., D.I.P.; writing—review and editing: E.D.M., A.N.C., D.F.B., A.A.B.; visualization: A.V.S., E.D.M.; supervision: A.N.C., E.D.M. All authors have read and agreed to the published version of the manuscript.

Funding

This research was supported by the Ministry of Science and Higher Education of the Russian Federation under Agreement No. 075-10-2022-011 within the framework of the development program for a world-class research center.

Data Availability Statement

The data presented in this study are available on request from the corresponding author. The data are not publicly available.

Acknowledgments

The authors are grateful to LLC “Gazpromneft—Technological Partnership” for the permission to publish the results that are presented in this research. We also want to express our genuine gratitude to our colleagues from the Skolkovo Institute of Science and Technology who contributed to this research: P. Zobov and P. Grishin for helping to develop the experimental setup, and E. Kozlova, P. Denisenko, and colleagues from Arctic-GERS LLC who helped with the samples analysis. This research was supported by the Ministry of Science and Higher Education of the Russian Federation under Agreement No. 075-10-2022-011 within the framework of the development program for a world-class research center.

Conflicts of Interest

The authors declare no conflict of interest.

References

  1. Omran, M.; Berg, C.F. Applying New Rock Typing Methods, and Modelling for Conventional & Unconventional Reservoirs. In Proceedings of the International Petroleum Technology Conference, Society of Petroleum Engineers, Dhahran, Saudi Arabia, 13–15 January 2020. [Google Scholar] [CrossRef]
  2. Arthur, M.A.; Cole, D.R. Unconventional Hydrocarbon Resources: Prospects and Problems. Elements 2014, 10, 257–264. [Google Scholar] [CrossRef]
  3. Ilgen, A.G.; Heath, J.E.; Akkutlu, I.Y.; Bryndzia, L.T.; Cole, D.R.; Kharaka, Y.K.; Kneafsey, T.J.; Milliken, K.L.; Pyrak-Nolte, L.J.; Suarez-Rivera, R. Shales at All Scales: Exploring Coupled Processes in Mudrocks. Earth-Sci. Rev. 2017, 166, 132–152. [Google Scholar] [CrossRef] [Green Version]
  4. Kuila, U.; Prasad, M. Surface Area and Pore-Size Distribution in Clays and Shales. In Proceedings of the SPE Annual Technical Conference and Exhibition, Society of Petroleum Engineers, Denver, CO, USA, 30 October–2 November 2011. [Google Scholar] [CrossRef]
  5. Neuzil, C.E. Permeability of Clays and Shales. Annu. Rev. Earth Planet. Sci. 2019, 47, 247–273. [Google Scholar] [CrossRef]
  6. Odusina, E.; Sondergeld, C.; Rai, C. An NMR Study on Shale Wettability. In Proceedings of the Canadian Unconventional Resources Conference, Society of Petroleum Engineers, Calgary, AB, Canada, 15–17 November 2011. [Google Scholar] [CrossRef]
  7. Xu, M.; Dehghanpour, H. Advances in Understanding Wettability of Tight and Shale Gas Formations. Energy Fuels 2014, 18, 4362–4375. [Google Scholar] [CrossRef]
  8. Chalmers, G.R.; Bustin, R.M.; Power, I.M. Characterization of Gas Shale Pore Systems by Porosimetry, Pycnometry, Surfacearea, Andfield Emission Scanning Electron Microscopy/Transmission Electron Microscopy Image Analyses: Examples from the Barnett, Woodford, Haynesville, Marcellus, And Doig Units. Am. Assoc. Pet. Geol. Bull. 2012, 96, 1099–1119. [Google Scholar] [CrossRef]
  9. Fu, C.; Liu, N. Waterless Fluids in Hydraulic Fracturing–A Review. J. Nat. Gas Sci. Eng. 2019, 67, 214–224. [Google Scholar] [CrossRef]
  10. Wang, Z.; Cao, G.; Bai, Y.; Wang, X.; Li, D. Probing the Mechanism of External Fluids Invasion of Nanopores in Fractured Tight Sandstone Reservoir. J. Dispers. Sci. Technol. 2022, 0, 1–13. [Google Scholar] [CrossRef]
  11. Liu, J.; Sheng, J.J.; Emadibaladehi, H.; Tu, J. Experimental Study of the Stimulating Mechanism of Shut-in after Hydraulic Fracturing in Unconventional Oil Reservoirs. Fuel 2021, 300, 120982. [Google Scholar] [CrossRef]
  12. Khan, H.J.; Spielman-Sun, E.; Jew, A.D.; Bargar, J.; Kovscek, A.; Druhan, J.L. A Critical Review of the Physicochemical Impacts of Water Chemistry on Shale in Hydraulic Fracturing Systems. Environ. Sci. Technol. 2021, 55, 1377–1394. [Google Scholar] [CrossRef]
  13. Lyu, Q.; Ranjith, P.G.; Long, X.; Kang, Y.; Huang, M. A Review of Shale Swelling by Water Adsorption. J. Nat. Gas Sci. Eng. 2015, 27, 1421–1431. [Google Scholar] [CrossRef]
  14. Cheng, B.; Li, J.; Li, J.; Su, H.; Tang, L.; Yu, F.; Jiang, H. Pore-Scale Formation Damage Caused by Fracturing Fluids in Low-Permeability Sandy Conglomerate Reservoirs. J. Pet. Sci. Eng. 2022, 208, 109301. [Google Scholar] [CrossRef]
  15. Anderson, R.L.; Ratcliffe, I.; Greenwell, H.C.; Williams, P.A.; Cliffe, S.; Coveney, P.V. Clay Swelling-A Challenge in the Oilfield. Earth-Sci. Rev. 2010, 98, 201–216. [Google Scholar] [CrossRef]
  16. Karpiński, B.; Szkodo, M. Clay Minerals–Mineralogy and Phenomenon of Clay Swelling in Oil & Gas Industry. Adv. Mater. Sci. 2015, 15, 37–55. [Google Scholar] [CrossRef] [Green Version]
  17. Minh, D.N.; Gharbi, H.; Rejeb, A.; Vale, F. Experimental Study of the Influence of the Degree of Saturation on Physical and Mechanical Properties in Tournemire Shale (France). Appl. Clay Sci. 2004, 26, 197–207. [Google Scholar] [CrossRef] [Green Version]
  18. Mohan, K.K.; Fogler, H.S. Colloidally Induced Smectitic Fines Migration: Existence of Microquakes. AIChE J. 1997, 43, 565–576. [Google Scholar] [CrossRef] [Green Version]
  19. Civan, F. Reservoir Formation Damage: Fundamentals, Modelling, Assessment and Mitigation; Gulf Publishing Company: Houston, TX, USA, 2000. [Google Scholar]
  20. Razzaghi-Koolaee, F.; Zargar, G.; Soltani Soulgani, B.; Mehrabianfar, P. Application of a Non-Ionic Bio-Surfactant Instead of Chemical Additives for Prevention of the Permeability Impairment of a Swelling Sandstone Oil Reservoir. J. Pet. Explor. Prod. Technol. 2021, 12, 1523–1539. [Google Scholar] [CrossRef]
  21. Tariq, Z.; Murtaza, M.; Kamal, M.S.; Muhammad, S.; Hussain, S. Clay Swelling Mitigation During Fracturing Operations Using Novel Magnetic Surfactants. In Proceedings of the International Petroleum Technology Conference, Riyadh, Saudi Arabia, 21–23 February 2022. [Google Scholar] [CrossRef]
  22. Bedrikovetsky, P.; Siqueira, F.D.; Furtado, C.A.; Souza, A.L.S. Modified particle detachment model for colloidal transport in porous media. Transp. Porous Media 2011, 86, 353–383. [Google Scholar] [CrossRef]
  23. Tangparitkul, S.; Saul, A.; Leelasukseree, C.; Yusuf, M.; Kalantariasl, A. Fines migration and permeability decline during reservoir depletion coupled with clay swelling due to low-salinity water injection: An analytical study. J. Pet. Sci. Eng. 2020, 194, 107448. [Google Scholar] [CrossRef]
  24. Shi, X.; Wang, L.; Guo, J.; Su, Q.; Zhuo, X. Effects of Inhibitor KCl on Shale Expansibility and Mechanical Properties. Petroleum 2019, 5, 407–412. [Google Scholar] [CrossRef]
  25. Fu, L.; Liao, K.; Ge, J.; He, Y.; Huang, W.; Du, E. Preparation and Inhibition Mechanism of Bis-Quaternary Ammonium Salt as Shale Inhibitor Used in Shale Hydrocarbon Production. J. Mol. Liq. 2020, 309, 113244. [Google Scholar] [CrossRef]
  26. Mojid, M.R.; Negash, B.M.; Abdulelah, H.; Jufar, S.R.; Adewumi, B.K. A State–of–Art Review on Waterless Gas Shale Fracturing Technologies. J. Pet. Sci. Eng. 2021, 196, 108048. [Google Scholar] [CrossRef]
  27. Fu, M.; Huang, Q.; Gu, Y.; Xu, L.; Chen, L. Development of Novel Silicon-Based Thickeners for a Supercritical CO2 Fracturing Fluid and Study on Its Rheological and Frictional Drag Behavior. Energy Fuels 2020, 34, 15752–15762. [Google Scholar] [CrossRef]
  28. Wang, Y.; Bedrikovetsky, P.; Yin, H.; Othman, F.; Zeinijahromi, A.; Le-Hussain, F. Analytical model for fines migration due to mineral dissolution during CO2 injection. J. Nat. Gas Sci. Eng. 2022, 100, 104472. [Google Scholar] [CrossRef]
  29. Tesson, S.; Firoozabadi, A. Deformation and Swelling of Kerogen Matrix in Light Hydrocarbons and Carbon Dioxide. J. Phys. Chem. C 2019, 123, 29173–29183. [Google Scholar] [CrossRef]
  30. Lopatin, N.V.; Zubairaev, S.L.; Kos, I.M.; Emets, T.P.; Romanov, E.A.; Malchikhina, O.V. Unconventional Oil Accumulations in the Upper Jurassic Bazhenov Black Shale Formation, West Siberian Basin: A Self-Sourced Reservoir System. J. Pet. Geol. 2003, 26, 225–244. [Google Scholar] [CrossRef]
  31. Postnikova, O.V.; Postnikov, A.V.; Zueva, O.A.; Kozionov, A.E.; Milovanova, E.V.; Savinova, L.A. Types of Void Space in the Bazhenov Reservoir Rocks. Geosciences 2021, 11, 269. [Google Scholar] [CrossRef]
  32. Palyanitsina, A.; Sukhikh, A. Peculiarities of Assessing the Reservoir Propties of Clayish Reservoirs Depending on the Water of Reservoir Pressure Maintenance System Properties. J. Appl. Eng. Sci. 2020, 18, 10–14. [Google Scholar] [CrossRef] [Green Version]
  33. Kuznetsova, A.N.; Rogachev, M.K.; Sukhih, A.S. Surfactant Solutions for Low-Permeable Polimictic Reservoir Flooding. IOP Conf. Ser. Earth Environ. Sci. 2018, 194, 042011. [Google Scholar] [CrossRef]
  34. Reynolds, M.A. A Technical Playbook for Chemicals and Additives Used in the Hydraulic Fracturing of Shales. Energy Fuels 2020, 34, 15106–15125. [Google Scholar] [CrossRef]
  35. Zhou, Z.H.; Huang, R.Z.; Chen, Y.F. Constitutive Equations of Shale and Clay Swelling. Theoretical Model and Laboratory Test under Confining Pressure. In Proceedings of the International meeting on Petroleum Engineering, Beijing, China, 24–27 March 1992. [Google Scholar] [CrossRef]
  36. Spasennykh, M.; Maglevannaia, P.; Kozlova, E.; Bulatov, T.; Leushina, E.; Morozov, N. Geochemical Trends Reflecting Hydrocarbon Generation, Migration and Accumulation in Unconventional Reservoirs Based on Pyrolysis Data (On the Example of the Bazhenov Formation). Geosciences 2021, 11, 307. [Google Scholar] [CrossRef]
  37. Bazhenova, T.K. Osnovy Regionalnoy Organicheskoy Geokhimii; GEOS: Moscow, Russia, 2020. [Google Scholar]
  38. Ivanov, K.S.; Maslennikov, V.V.; Artemyev, D.A.; Tseluiko, A.S. Highly Metalliferous Potential of Framboidal and Nodular Pyrite Varieties from the Oil-Bearing Jurassic Bazhenov Formation, Western Siberia. Minerals 2020, 10, 449. [Google Scholar] [CrossRef]
  39. Ahmed, A.A.; Saaid, I.M.; Akhir, N.A.M.; Rashedi, M. Influence of Various Cation Valence, Salinity, PH and Temperature on Bentonite Swelling Behaviour. AIP Conf. Proc. 2016, 1774, 040005. [Google Scholar] [CrossRef]
  40. Wersin, P.; Curti, E.; Appelo, C.A.J. Modelling Bentonite-Water Interactions at High Solid/Liquid Ratios: Swelling and Diffuse Double Layer Effects. Appl. Clay Sci. 2004, 26, 249–257. [Google Scholar] [CrossRef]
  41. Shirazi, S.M.; Kazama, H.; Kuwano, J.; Rashid, M.M. The Influence of Temperature on Swelling Characteristics of Compacted Bentonite for Waste Disposal. Environ. Asia 2010, 3, 60–64. [Google Scholar]
  42. Zhang, C.L.; Wieczorek, K.; Xie, M.L. Swelling Experiments on Mudstones. J. Rock Mech. Geotech. Eng. 2010, 2, 44–51. [Google Scholar] [CrossRef]
  43. Yilmaz, I. Gypsum/Anhydrite: Some Engineering Problems. Bull. Eng. Geol. Environ. 2001, 60, 227–230. [Google Scholar] [CrossRef]
  44. Wu, T.; Zhao, H.; Tesson, S.; Firoozabadi, A. Absolute Adsorption of Light Hydrocarbons and Carbon Dioxide in Shale Rock and Isolated Kerogen. Fuel 2019, 235, 855–867. [Google Scholar] [CrossRef]
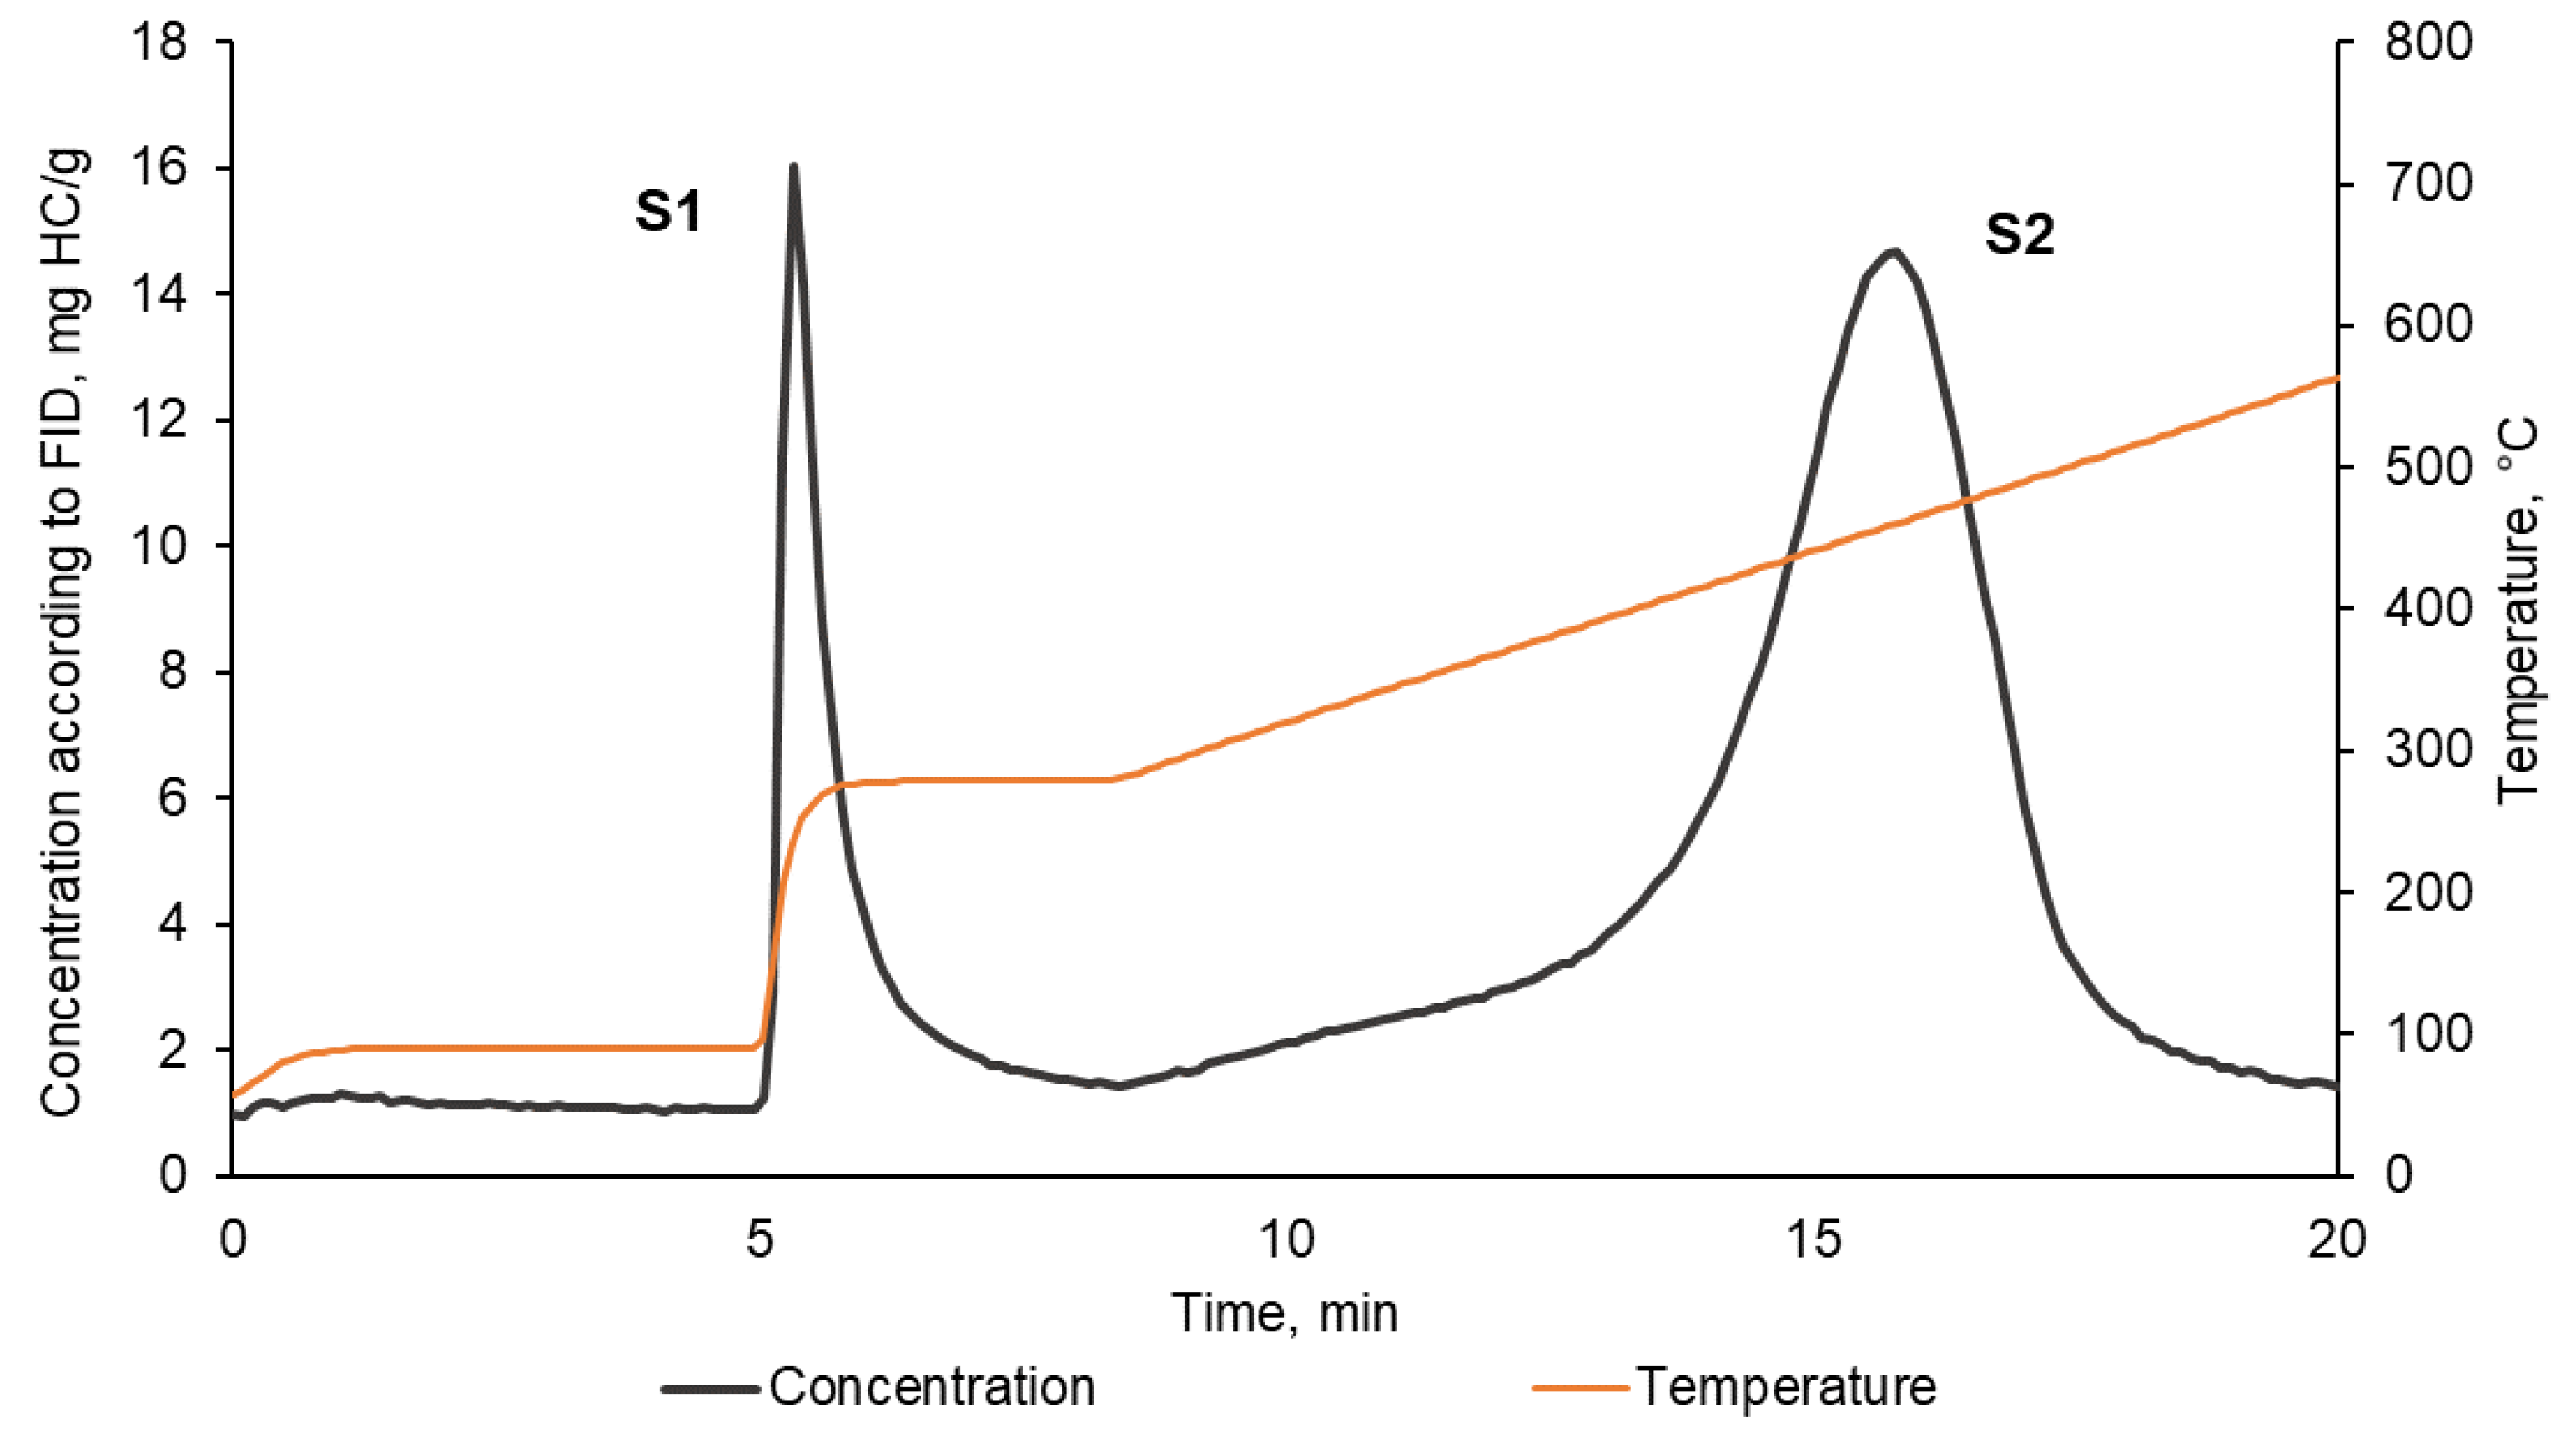
Figure 1. Example of dependencies registered during pyrolysis of a rock sample.
Minerals 12 00714 g001
Scheme 1. Experimental setup for studying rock swelling.
Minerals 12 00714 sch001
Figure 2. Rock swelling cell: (a) Photo, (b) 3D image and working principle.
Minerals 12 00714 g002
Figure 3. Results of the bentonite swelling in the presence of 0.2% wt. NaOH. (a) Measured experimental dependencies. (b) Measured sample rock volume change (black) and approximation with logistic function (red) with parameters A2 = 3.37, A1 = −0.01, x0 = 19.77, p = 2.25 (see Equation (6)).
Minerals 12 00714 g003
Figure 4. Sample rock volume change during swelling of the crushed rock samples in 0.2% NaOH solution in reservoir conditions, (ae) for samples 1–5, respectively. Black curves show experimental data. Red curves show approximation of experimental data with logistic function (see Equation (6)) with parameters listed in Table 3.
Minerals 12 00714 g004aMinerals 12 00714 g004b
Figure 5. Cross-plot linking the volumetric expansion coefficient and clay content for the swelling experiments with 0.2% wt. NaOH.
Minerals 12 00714 g005
Figure 6. Sample rock volume change during swelling of the crushed rock samples in the hydrocarbon-based fluid in reservoir conditions, (ae) for samples 1–5, respectively.
Minerals 12 00714 g006aMinerals 12 00714 g006b
Figure 7. Absence of correlation between volumetric expansion coefficient and TOC for the swelling experiments with the hydrocarbon-based fluid.
Minerals 12 00714 g007
Figure 8. Cross-plot for the volumetric expansion coefficient and chlorite/TOC mass ratio in the swelling experiments with the hydrocarbon-based fluid.
Minerals 12 00714 g008
Figure 9. Pressure decrease registered after the end of the swelling period for sample 1 (indicated by the black dashed line).
Minerals 12 00714 g009
Figure 10. Sample rock volume change during swelling of the crushed rock samples in supercritical CO2 in reservoir conditions, (ae) for samples 1–5, respectively. Black curves show measured data, red curves show approximation with logistic function (see Equation (6)).
Minerals 12 00714 g010
Figure 11. Cross-plot for the volumetric expansion coefficient and TOC in the swelling experiments with supercritical CO2.
Minerals 12 00714 g011
Table 1. Pyrolysis data for the studied rock samples.
Sample
12345
S1, mgHC/g0.680.832.302.323.74
S2, mgHC/g3.1931.3747.1137.7059.94
S3, mgCO2/g0.360.230.250.520.45
S4, mGCO/g41.99108.37184.98191.21314.01
S5, mgCO/g3.921.064.2130.192.14
TOC, % wt.2.036.9510.959.9915.95
HI, mgHC/gTOC157452430377376
Tmax, °C 441439437434435
Table 2. Mineralogical composition of the studied rock samples defined with XRD method.
MineralsSample
12345
Albite6.709.606.507.605.30
Anhydrite2.900.000.000.000.00
Calcite1.800.000.004.500.00
Pyrite0.305.302.501.608.20
Quartz85.5053.1056.7028.5024.80
Clays
Chlorite0.006.203.403.705.70
Illite2.8019.4022.3031.6029.00
Kaolinite0.006.408.609.7018.20
Mixed-layer0.000.000.0012.608.30
Matrix density, g/mL2.112.362.542.312.72
ωclays, % wt.2.7429.6030.4051.5751.58
Table 3. Results of the crushed rock swelling experiments in the presence of 0.2% wt. NaOH solution.
SampleVolumetric Expansion Coefficient, % vol.Adsorbed Water/Rock Mass Ratio, mg/gR2 for the Approximation with a Logistic FunctionParameters of the Logistic Function
A1A2x0p
11.6913.510.8200.3759.23.00
22.099.530.930.000.4725.53.00
31.5517.150.980.030.4071.75.30
42.3496.020.910.000.6617.93.00
53.2518.060.990.061.38126.71.40
Table 4. Results of the crushed rock swelling experiments in the presence of the hydrocarbon-based fracturing fluid.
SampleVolumetric Expansion Coefficient,
% vol.
Adsorbed Hydrocarbon/Rock Mass
Ratio, mg/g
10.1174.15
20.8524.02
30.5373.47
40.4333.44
50.4903.40
Table 5. Results of the crushed rock swelling experiments in the presence of supercritical CO2.
SampleVolumetric Expansion Coefficient, % vol.R2 for the Approximation with a Logistic FunctionParameters of the Logistic Function
A1A2x0p
10.0220.990.000.0061.273.00
20.103-----
30.305-----
40.1150.980.000.0376.803.3
50.3830.900.000.1400.250.4
Publisher’s Note: MDPI stays neutral with regard to jurisdictional claims in published maps and institutional affiliations.