
Identification of Radioactive Mineralized Lithology and Mineral Prospectivity Mapping Based on Remote Sensing in High-Latitude Regions: A Case Study on the Narsaq Region of Greenland

Abstract
:1. Introduction
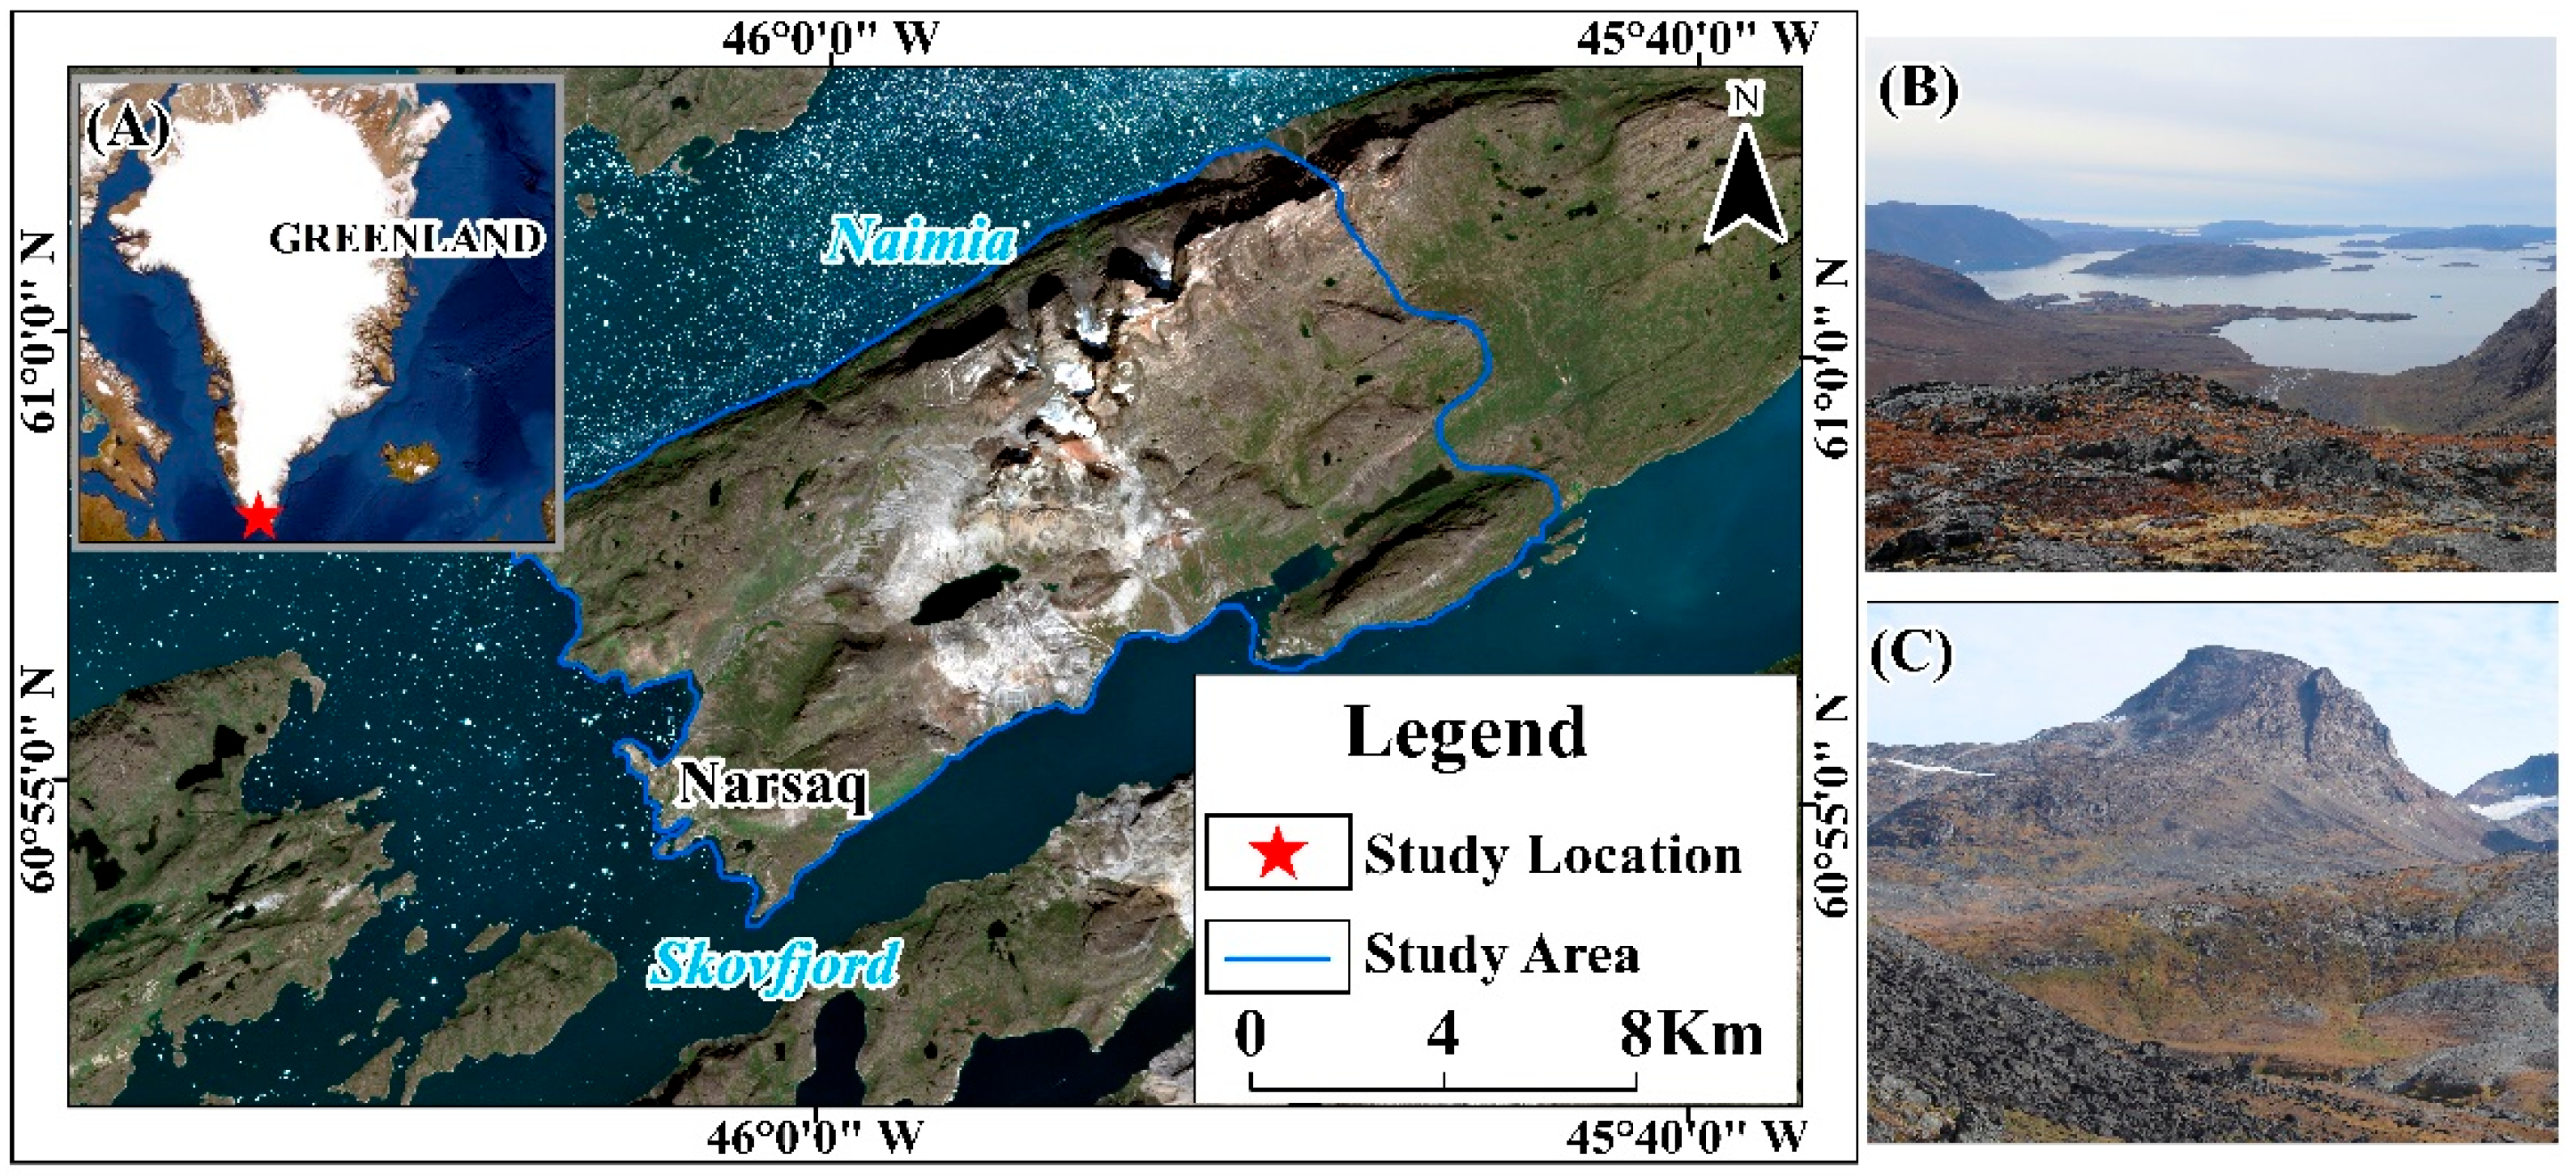
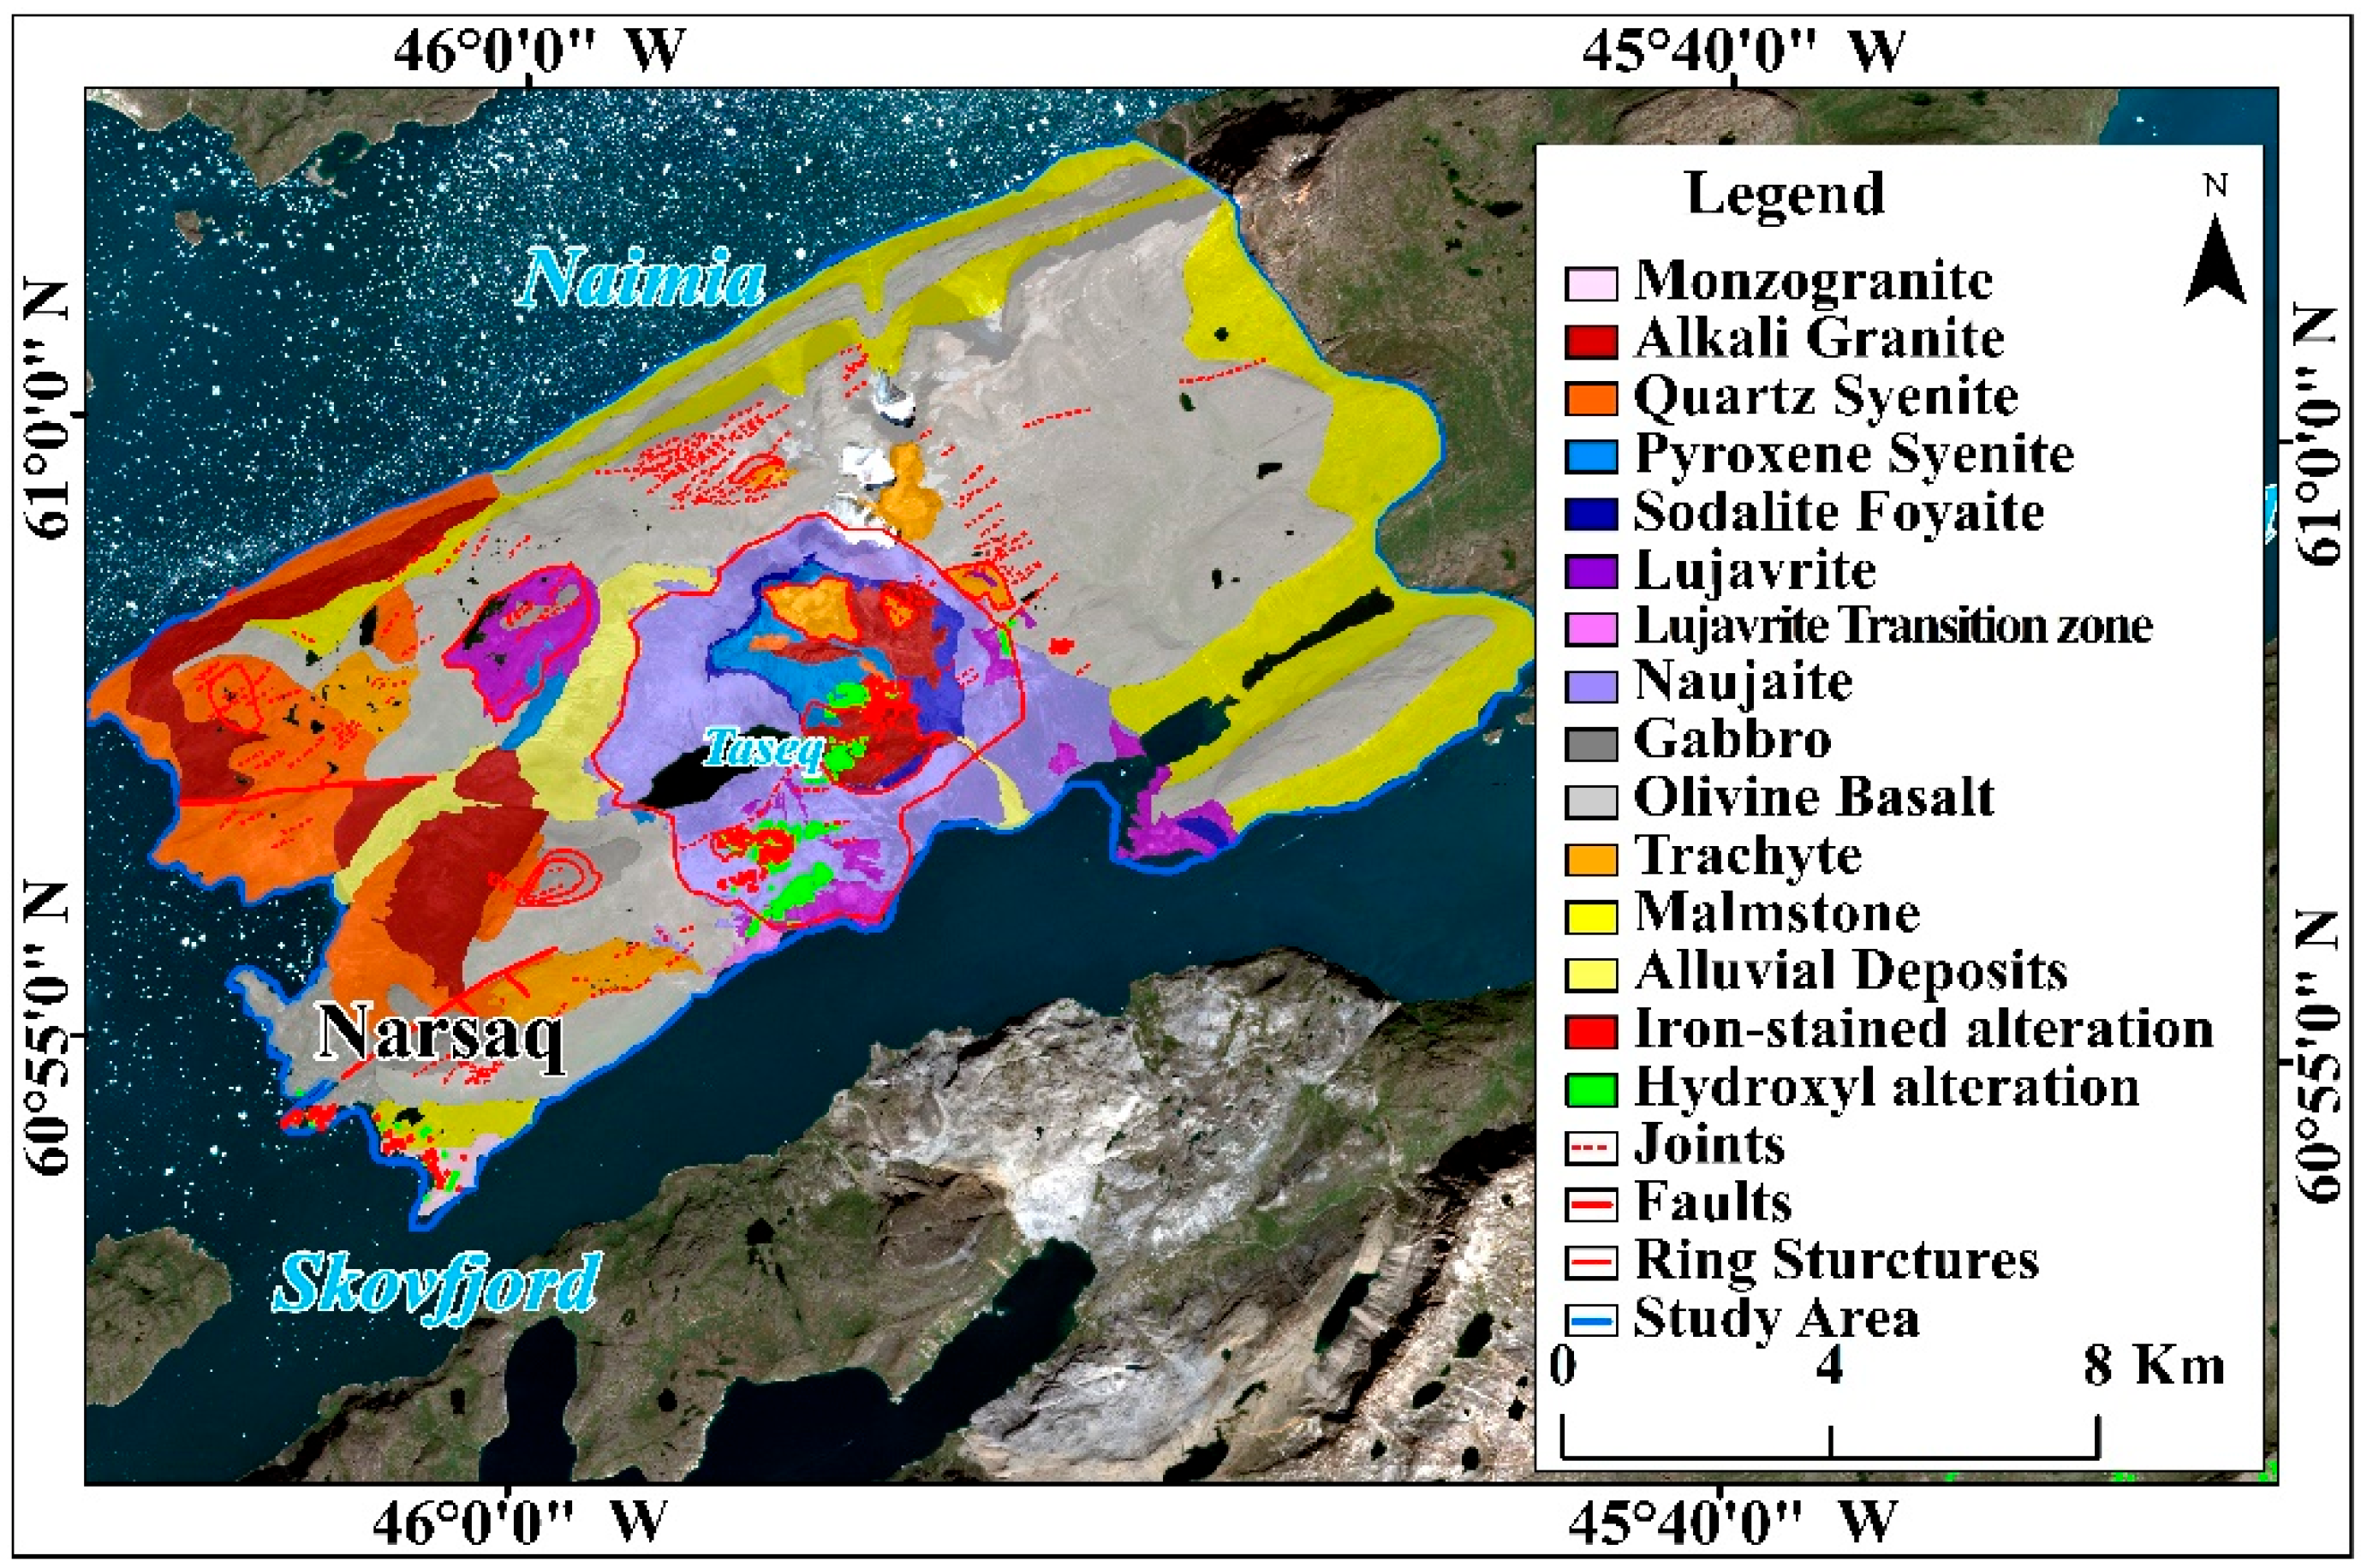
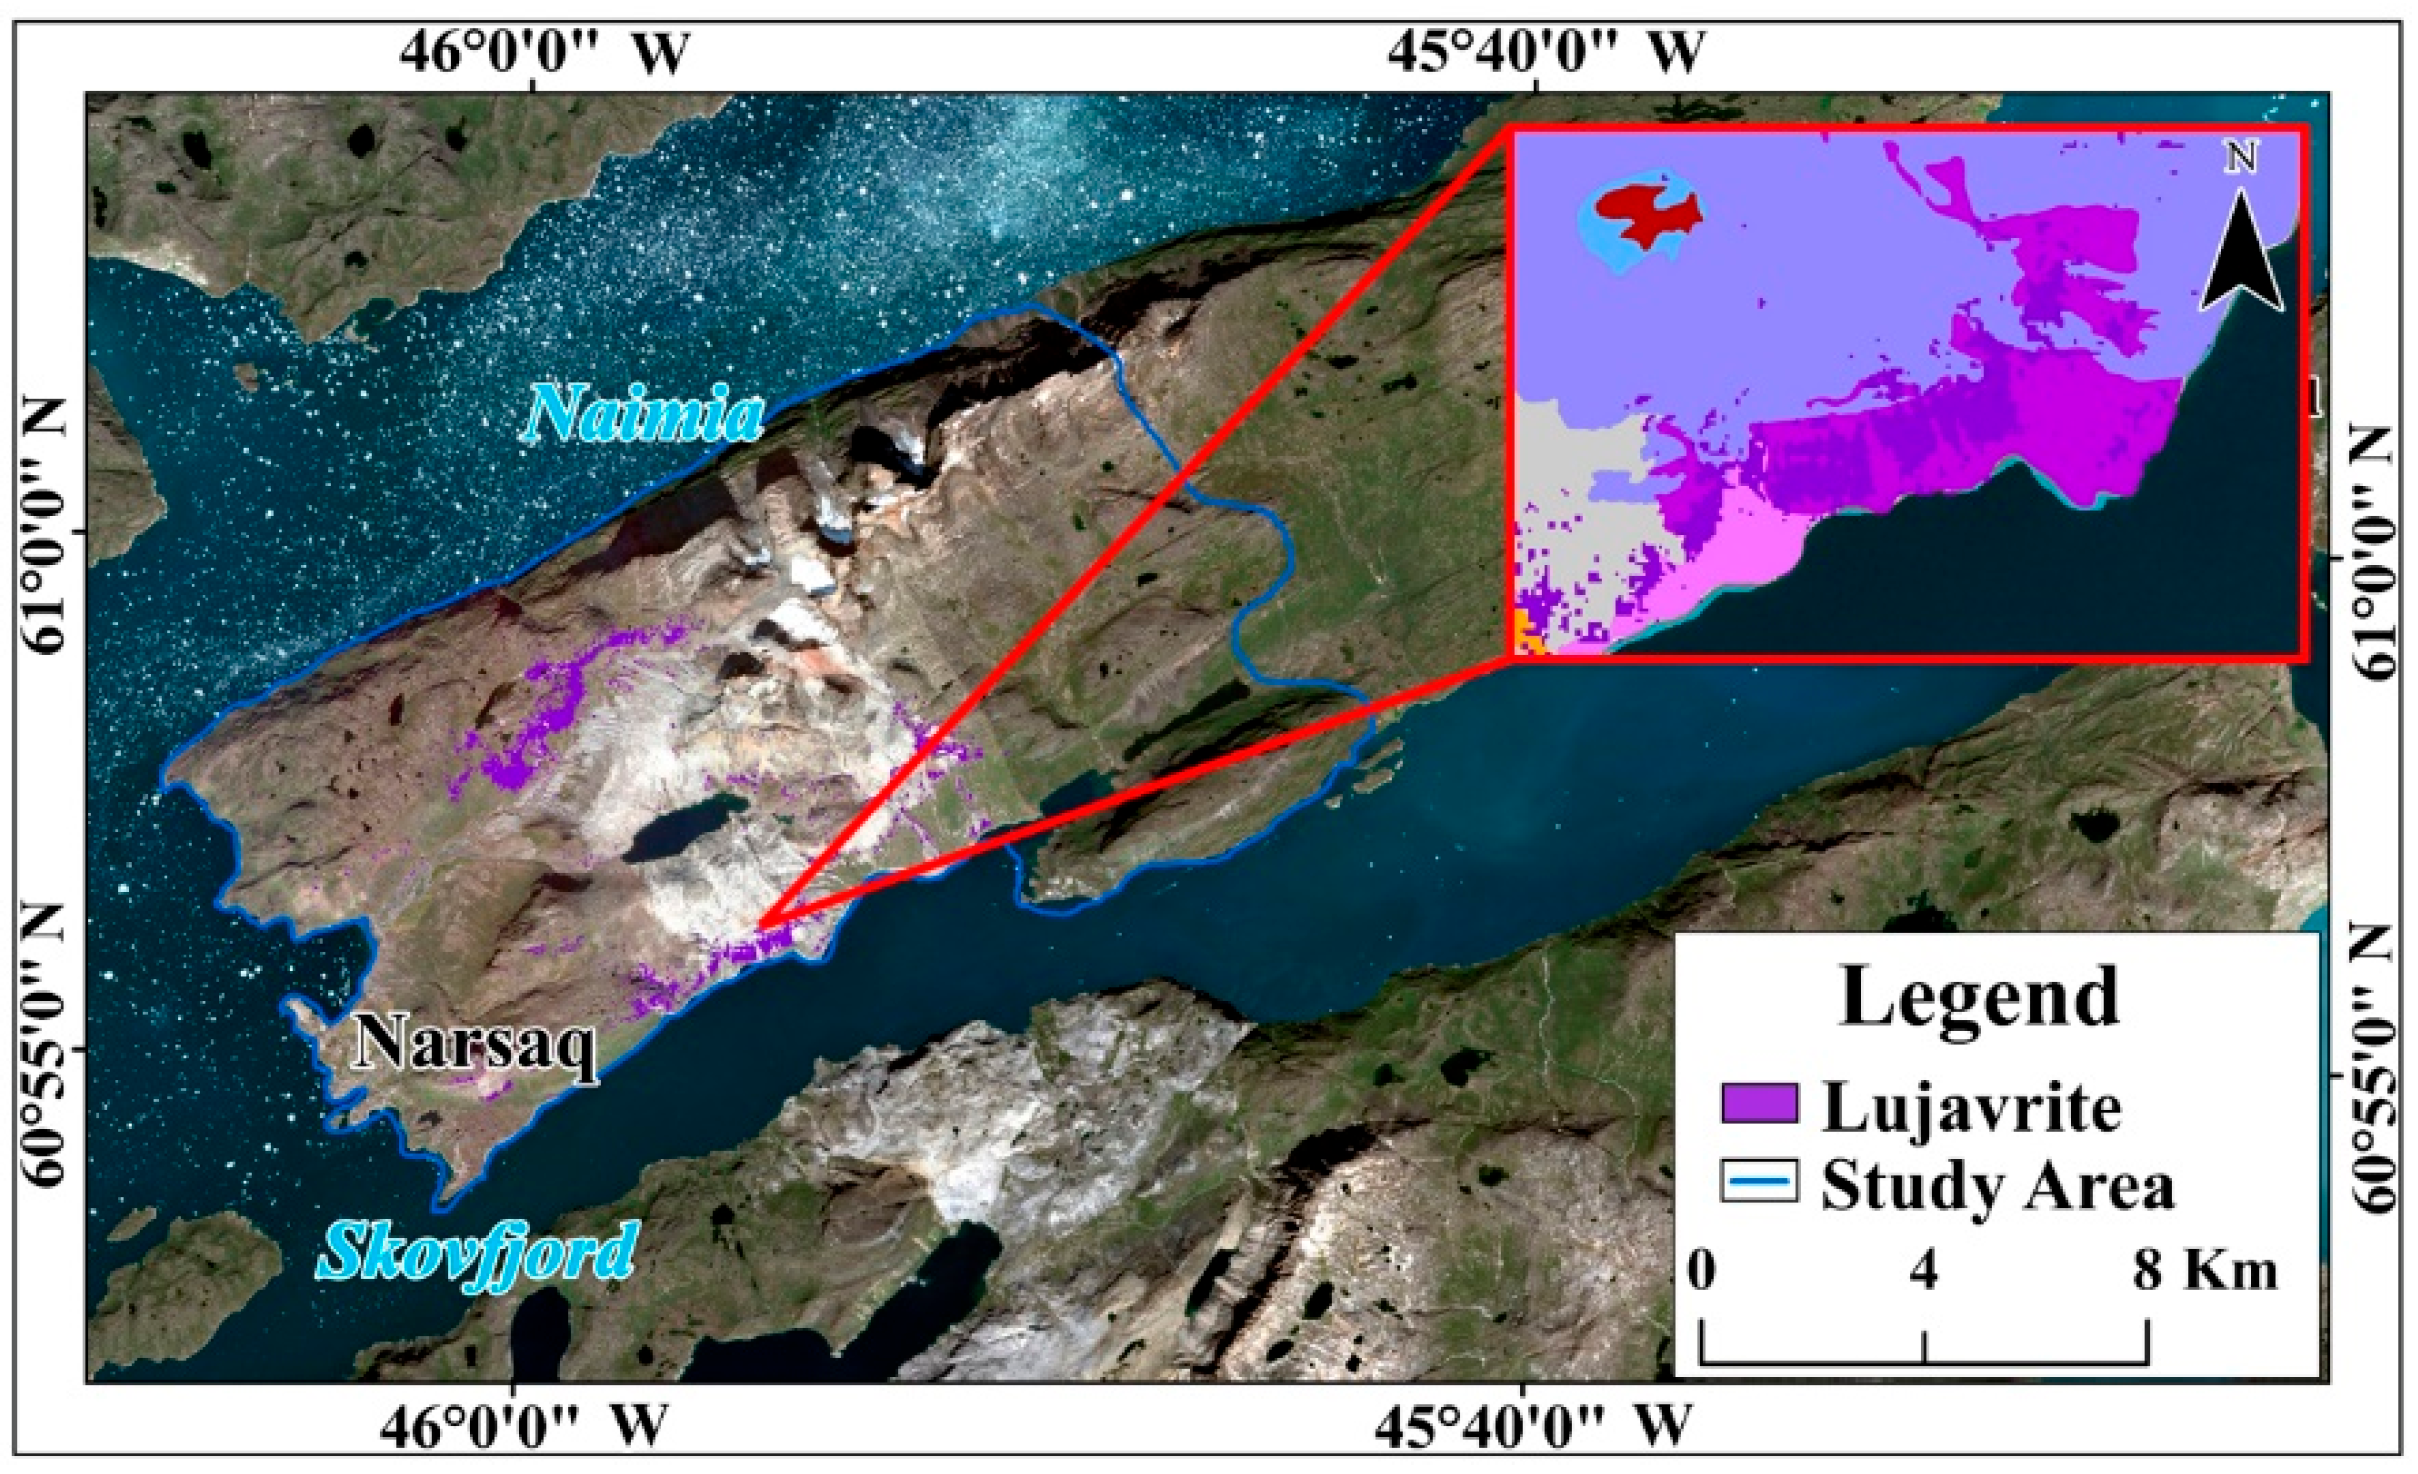
2. Study Area
2.1. Physical Geography
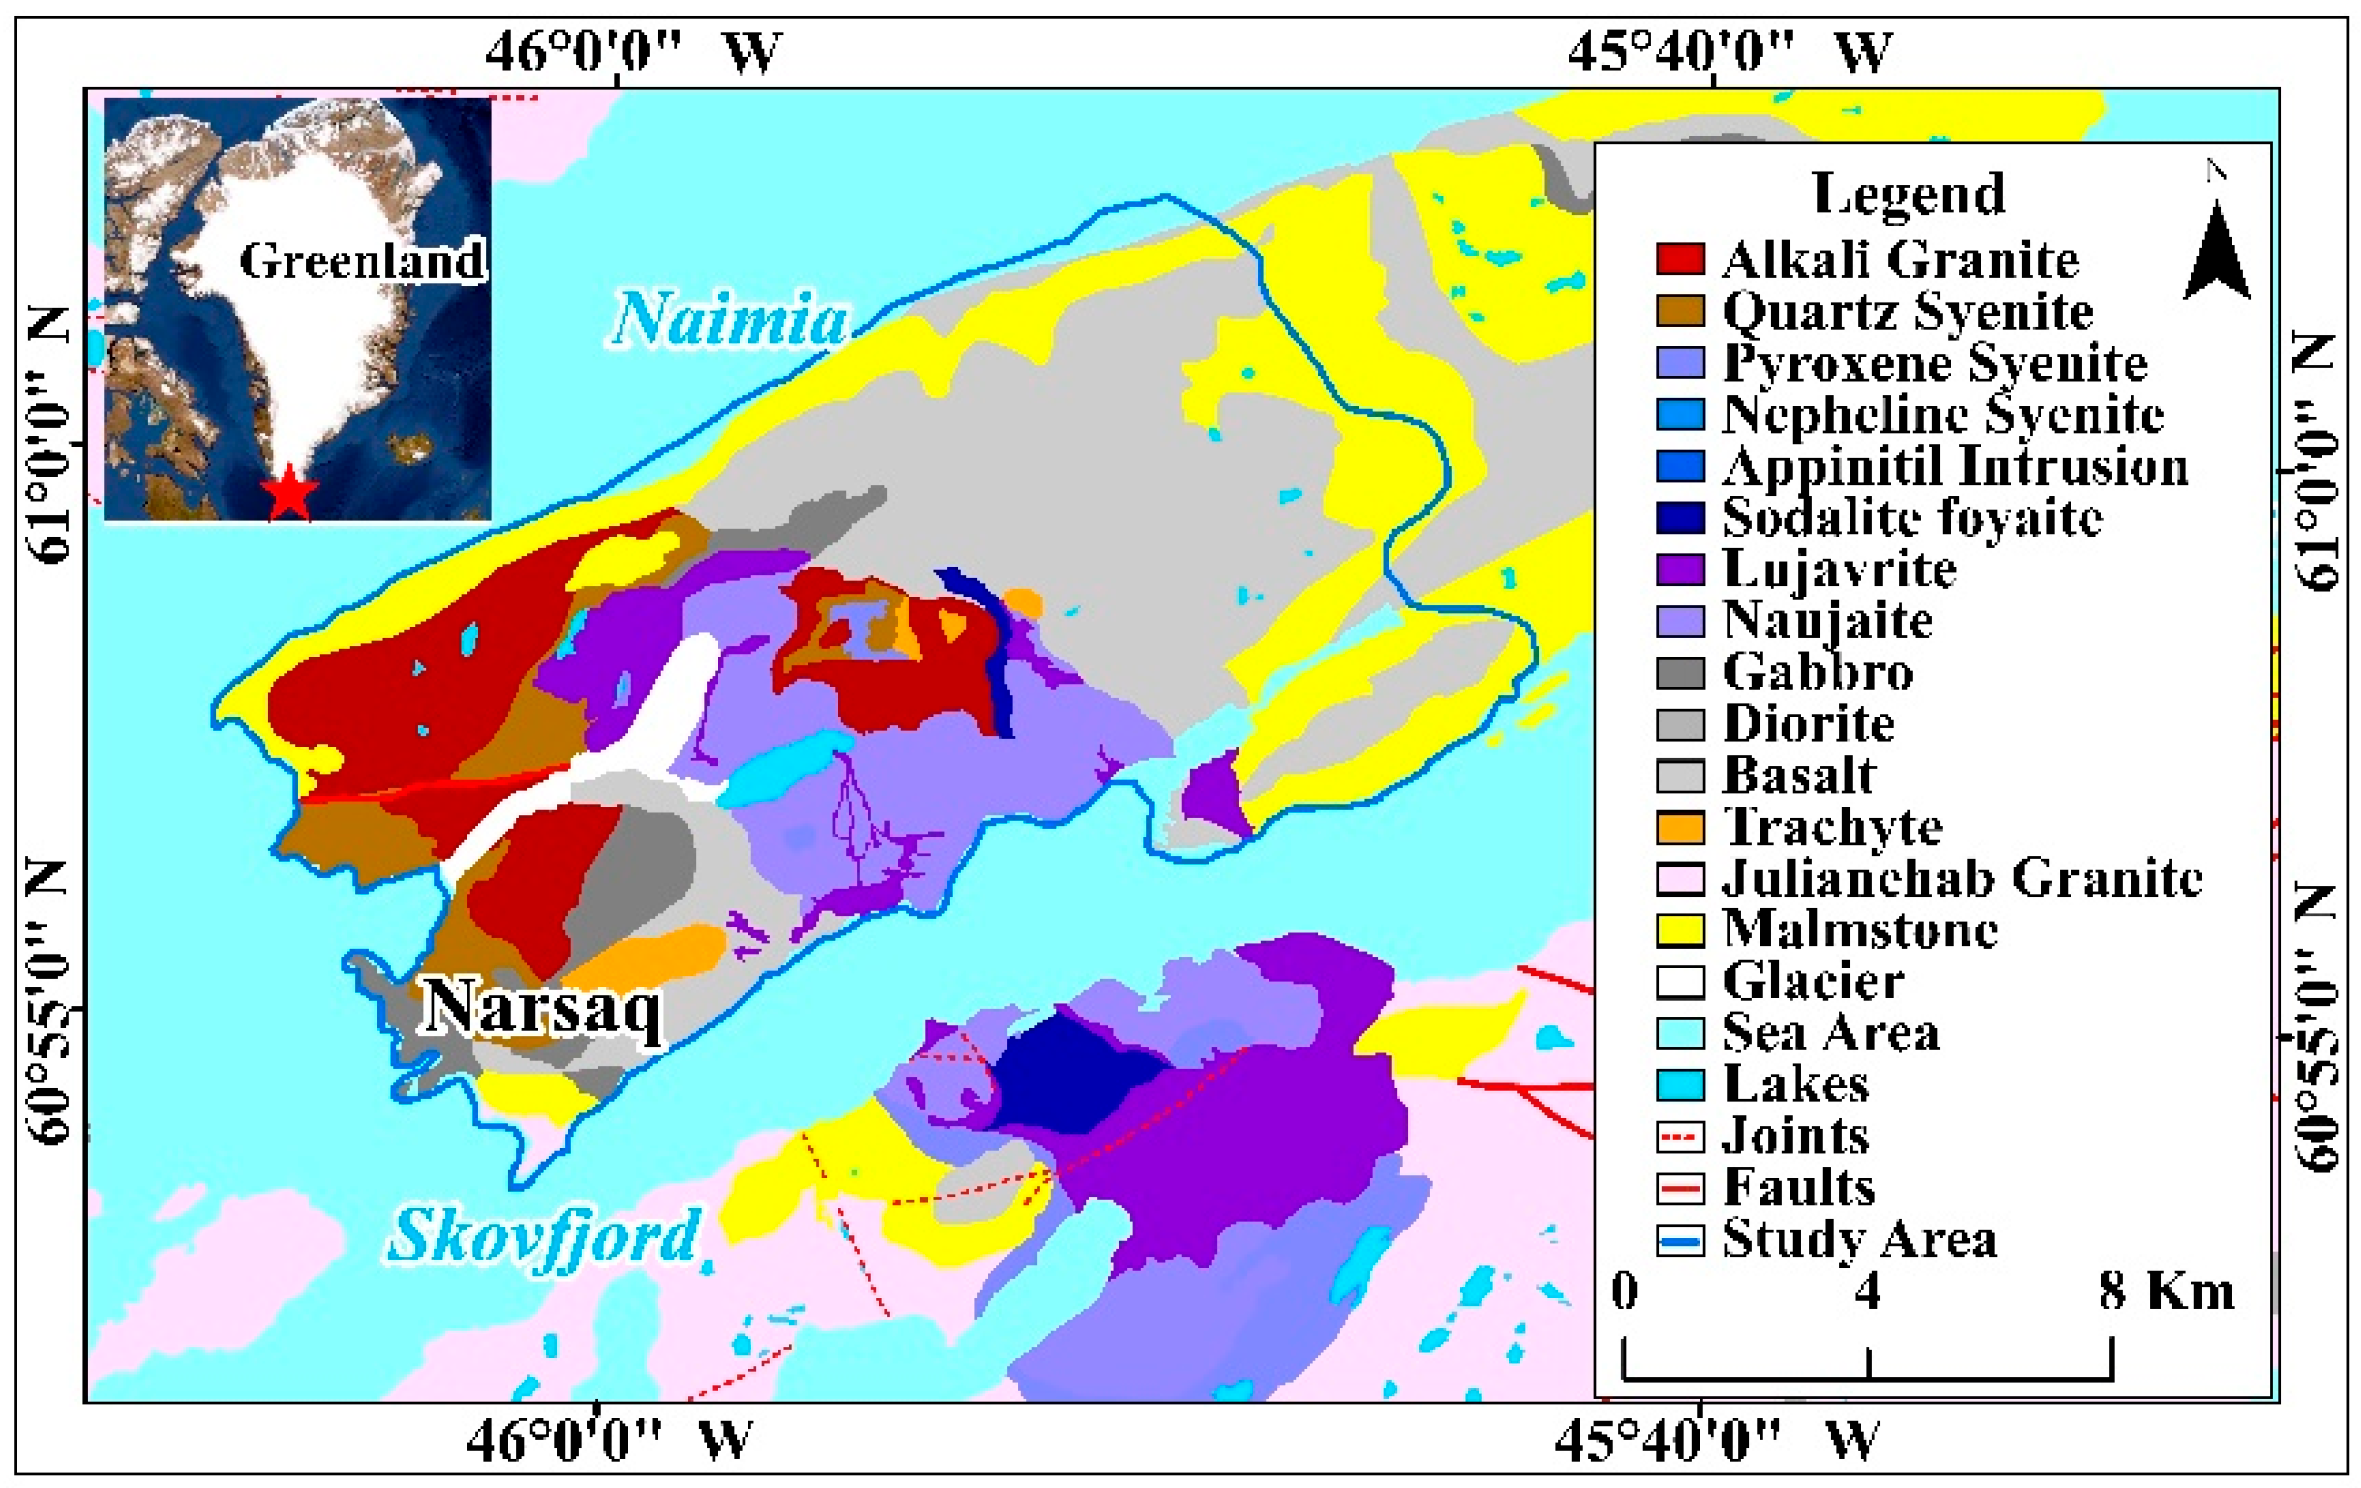
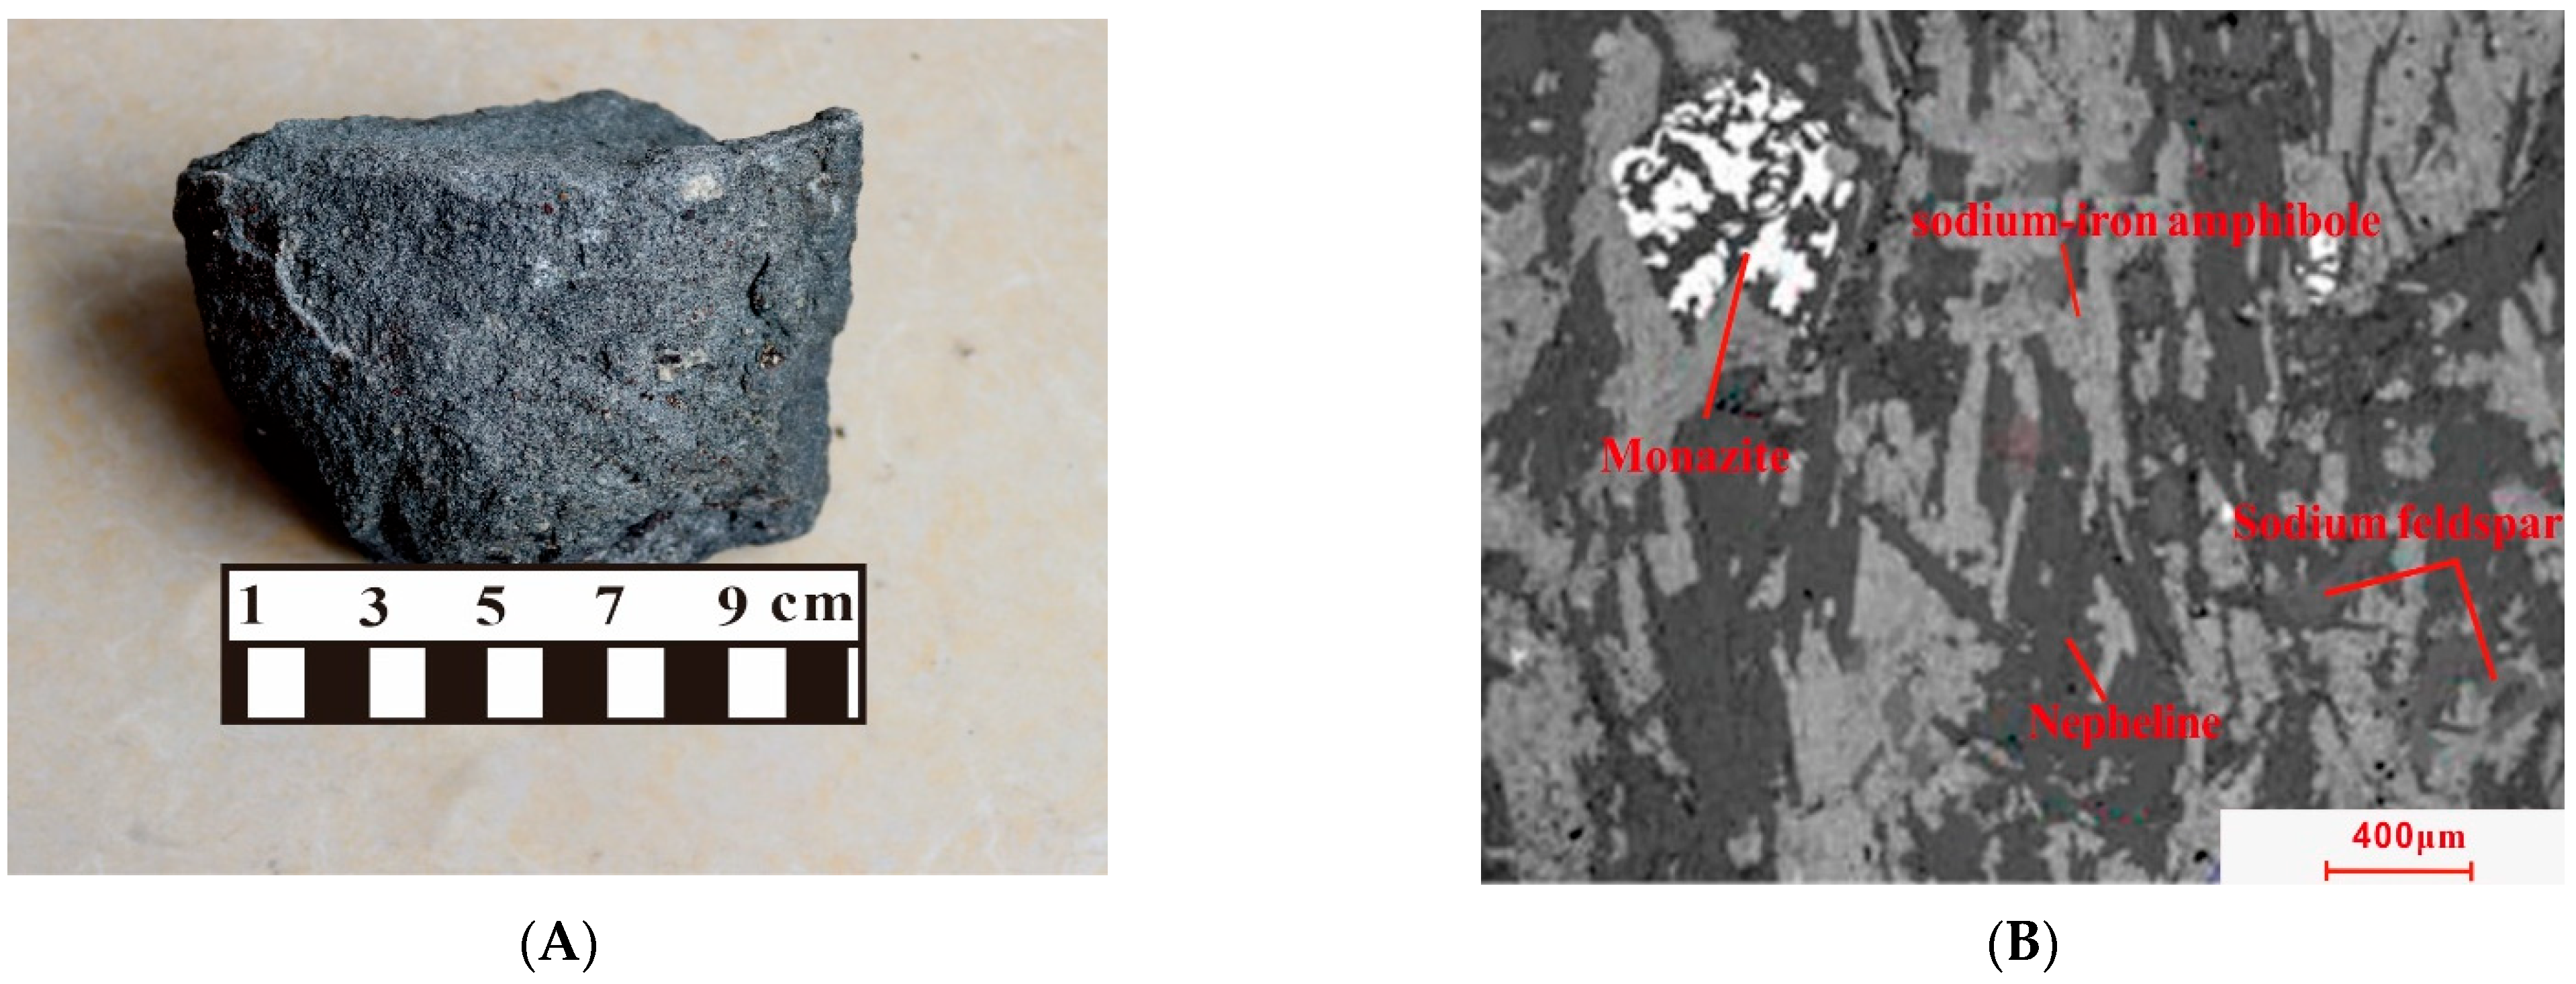
2.2. Geological Background
3. Material and Methods
3.1. Data and Pre-Processing
- Visible light near the infrared (NIR) data of the Sentinel-2AB (S2AB) satellite;
- Thermal infrared data of LANDSAT-8TIRS (LTRS) satellite;
- Visible light near the infrared data of the Worldview-2 (WV-2) satellite;
- ASTER GDEM 30 m spatial resolution ground elevation model data;
- Measured data of the SVC HR-1024i full-spectrum ground object spectrometer.
3.1.1. Visible NIR Remote Sensing Data
3.1.2. Thermal Infrared Remote Sensing Data
3.1.3. Topographic Surface Elevation Data
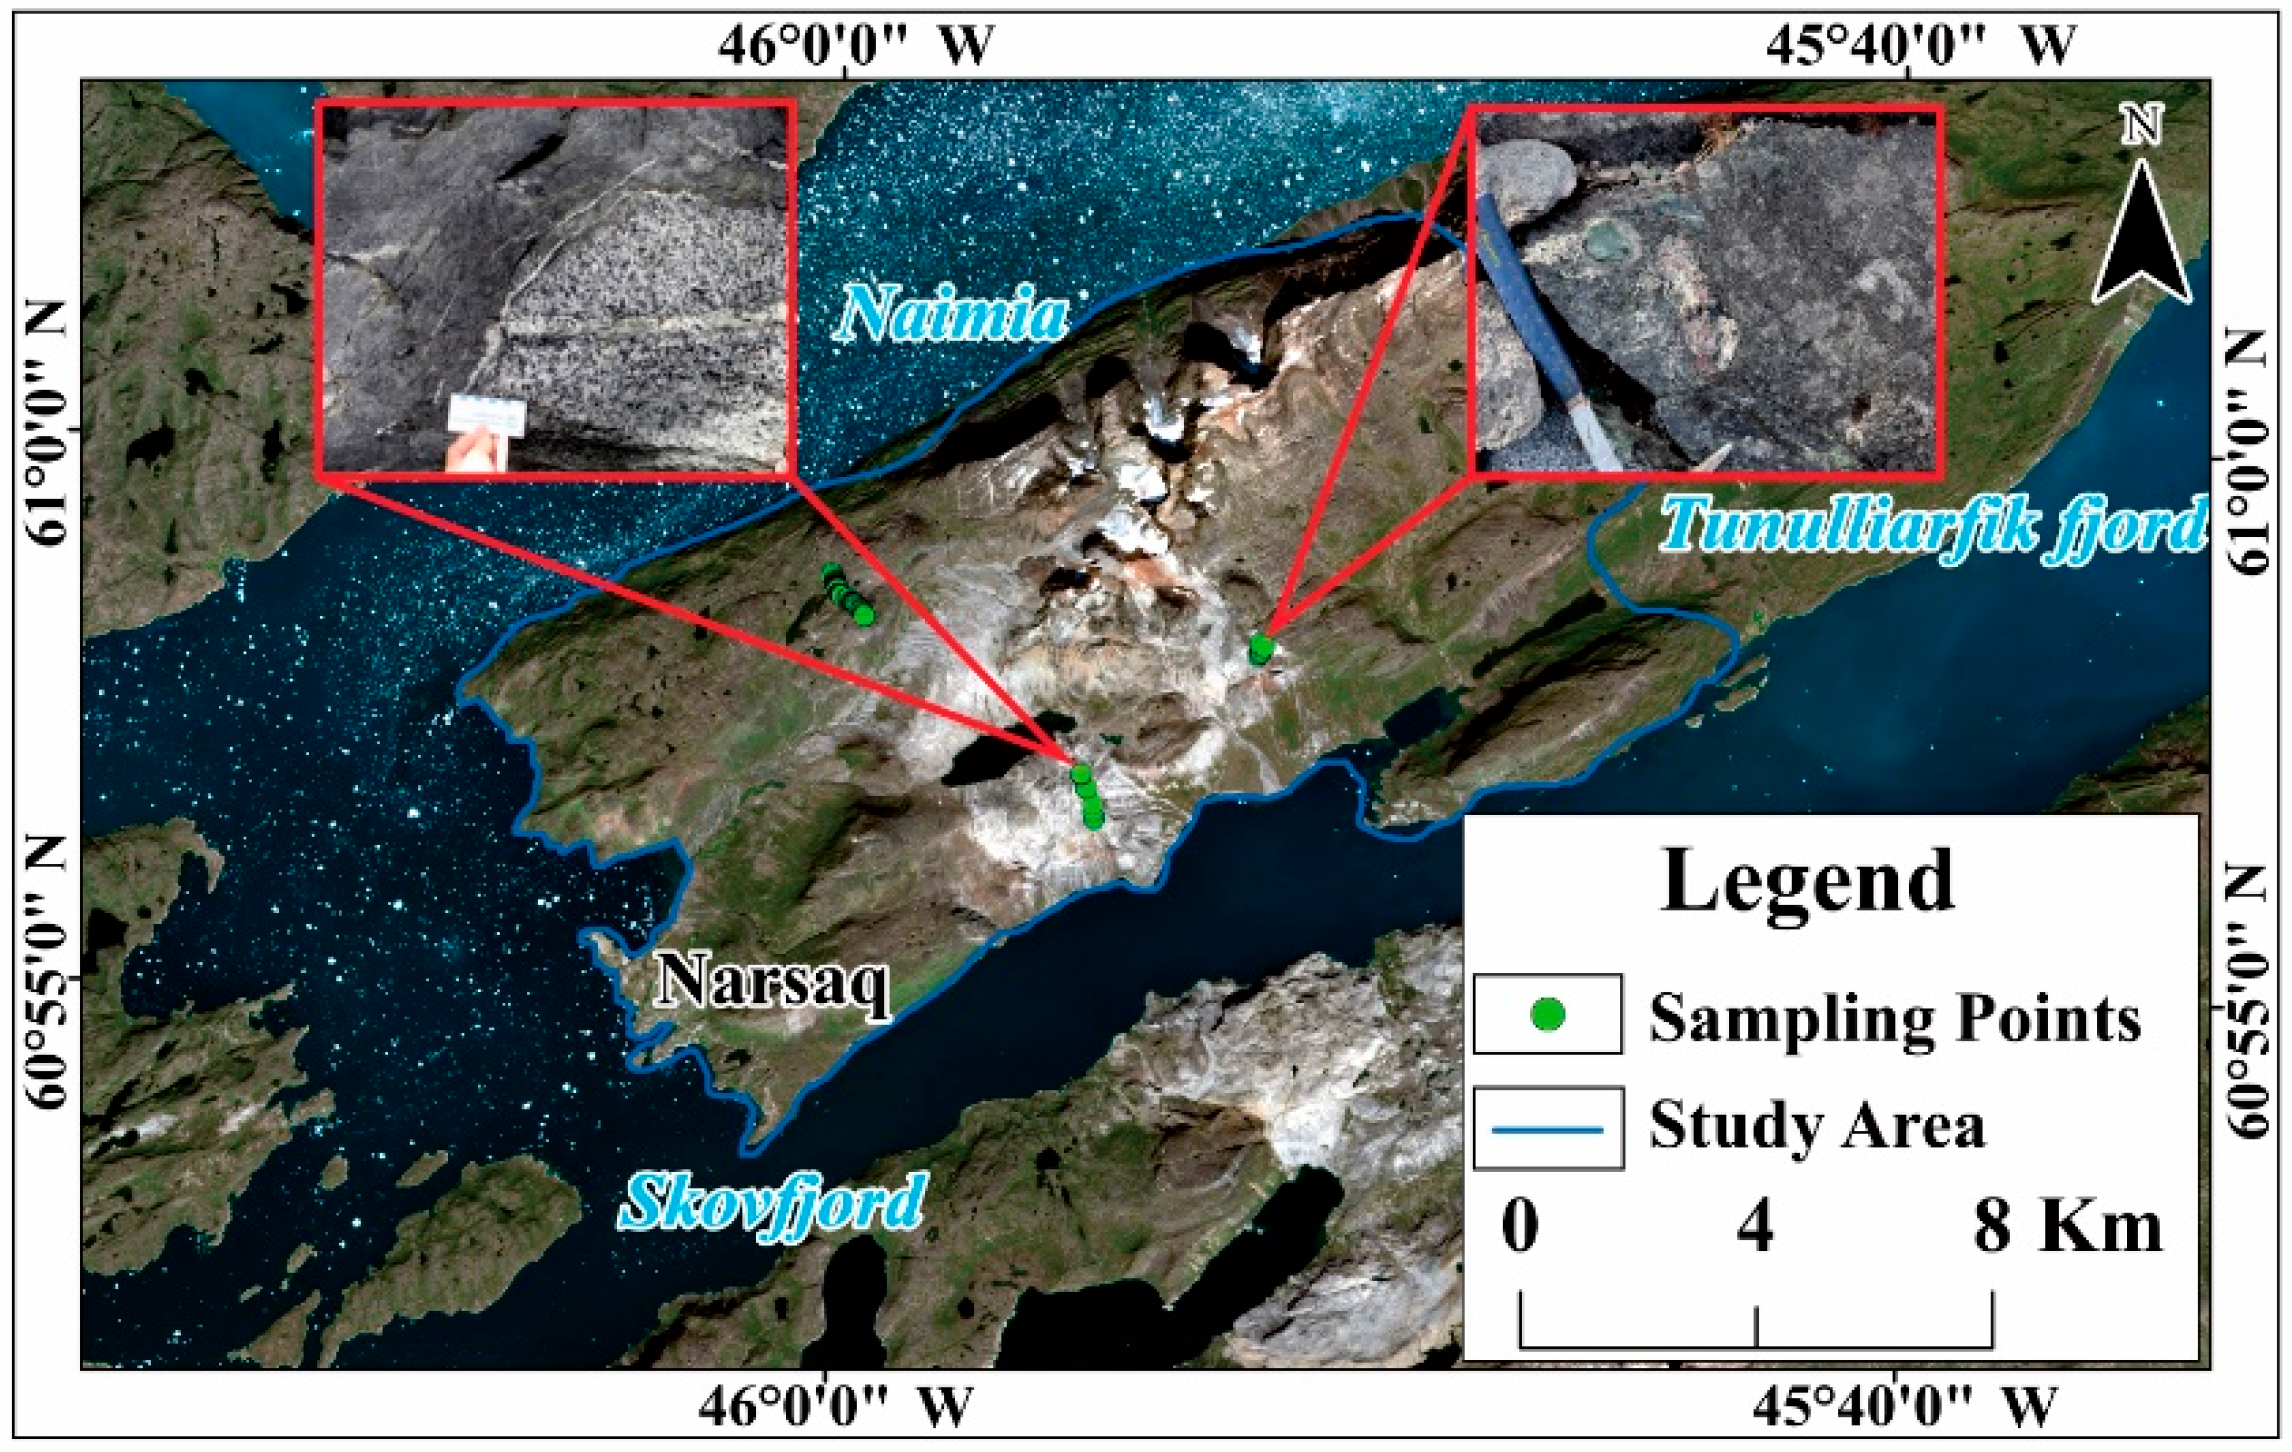
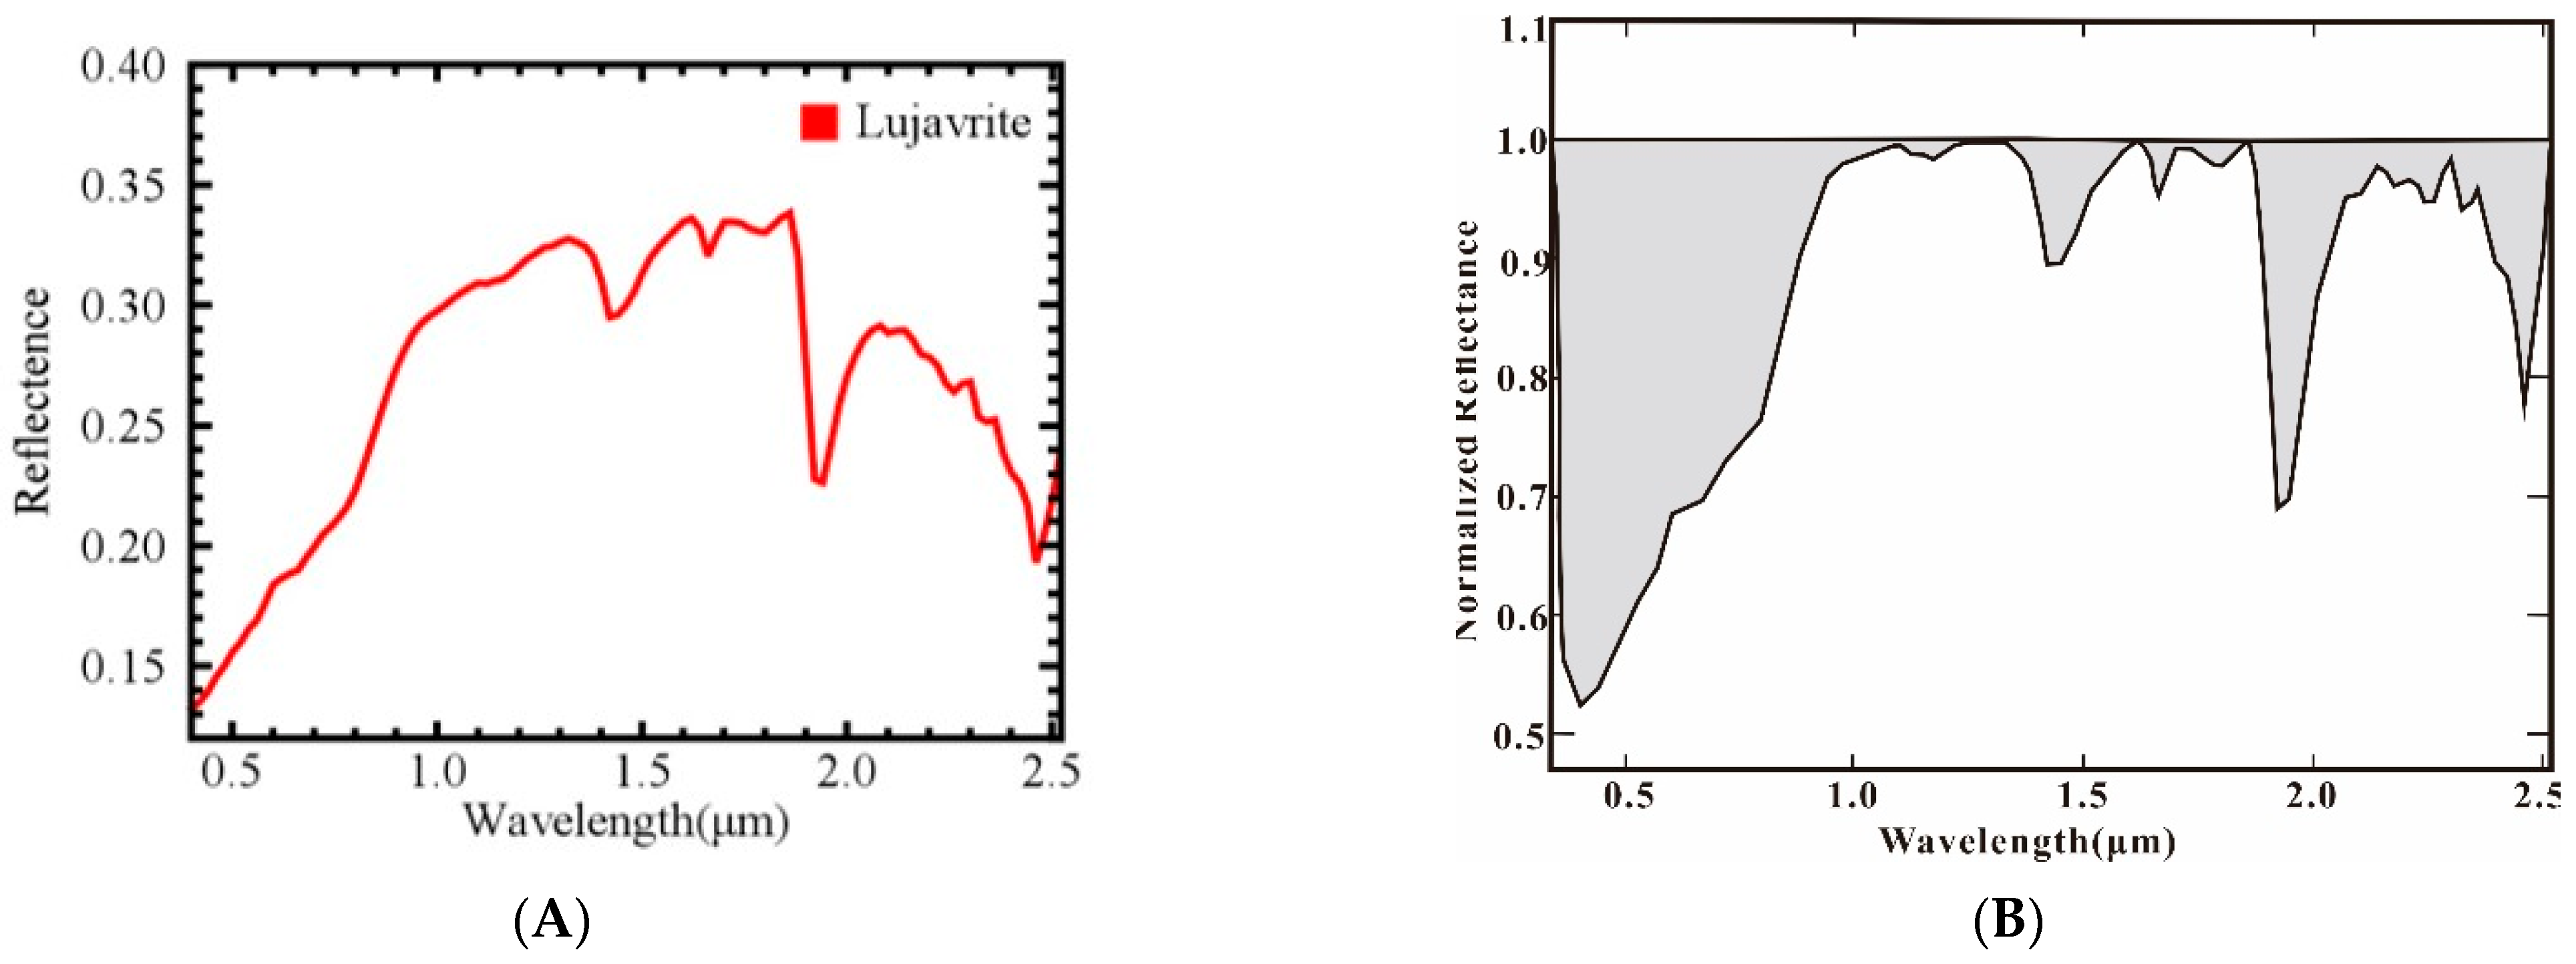
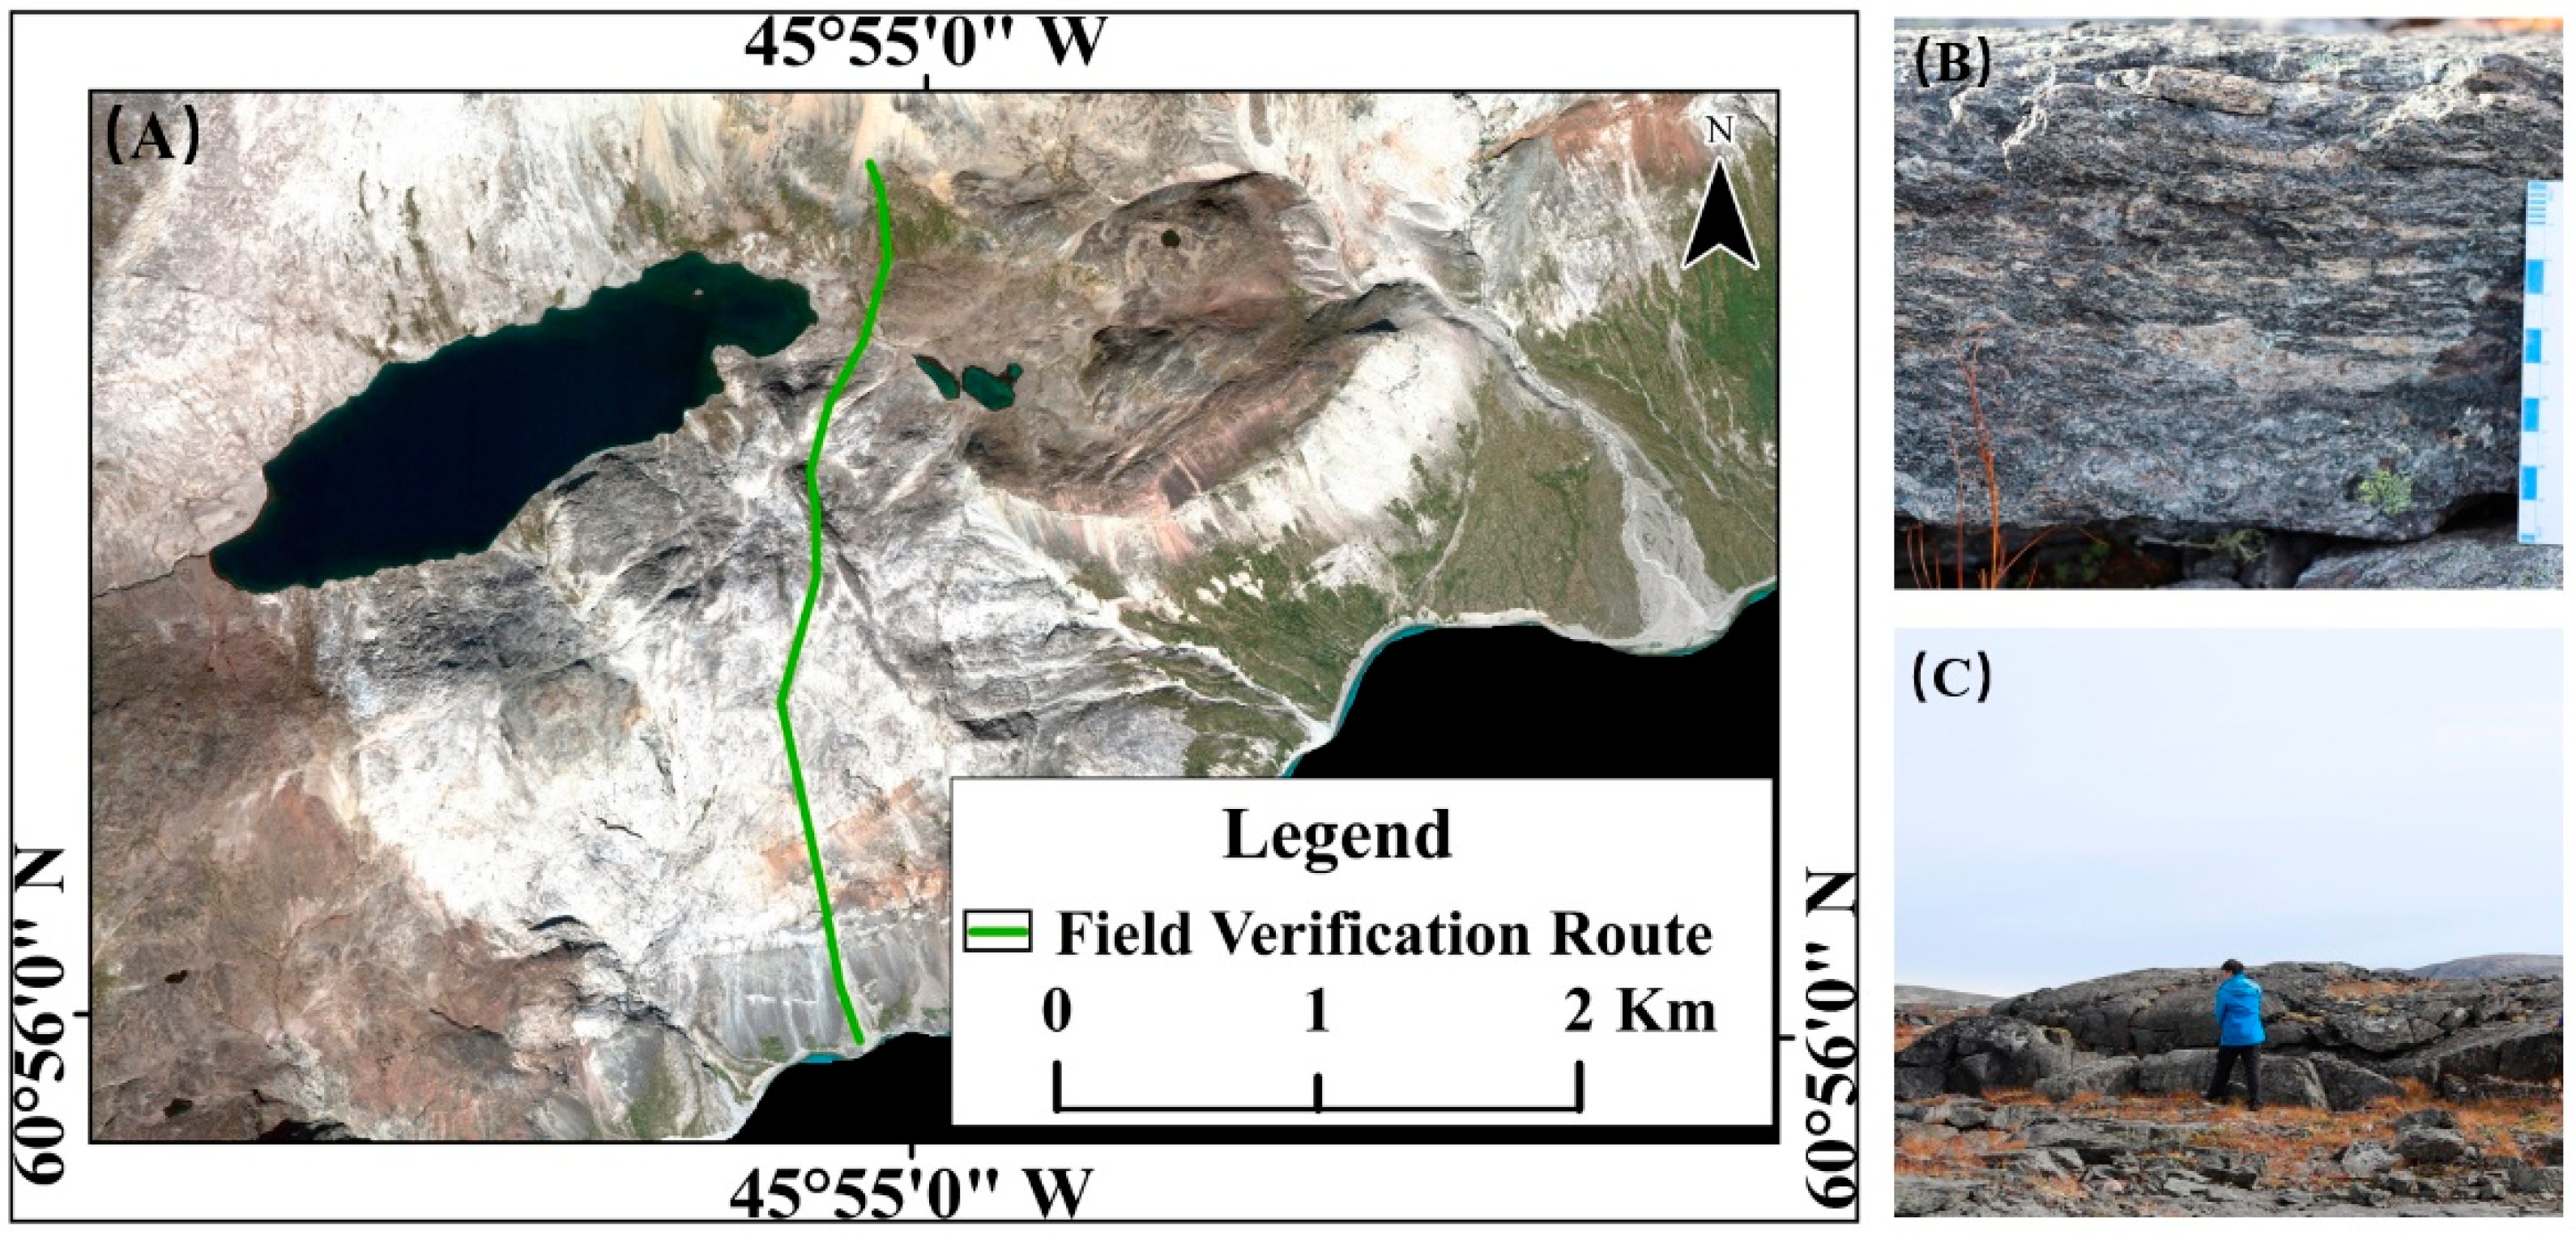
3.1.4. Field Measurements of Feature Spectral Data
3.2. Remote Sensing for Geological Background Information Extraction
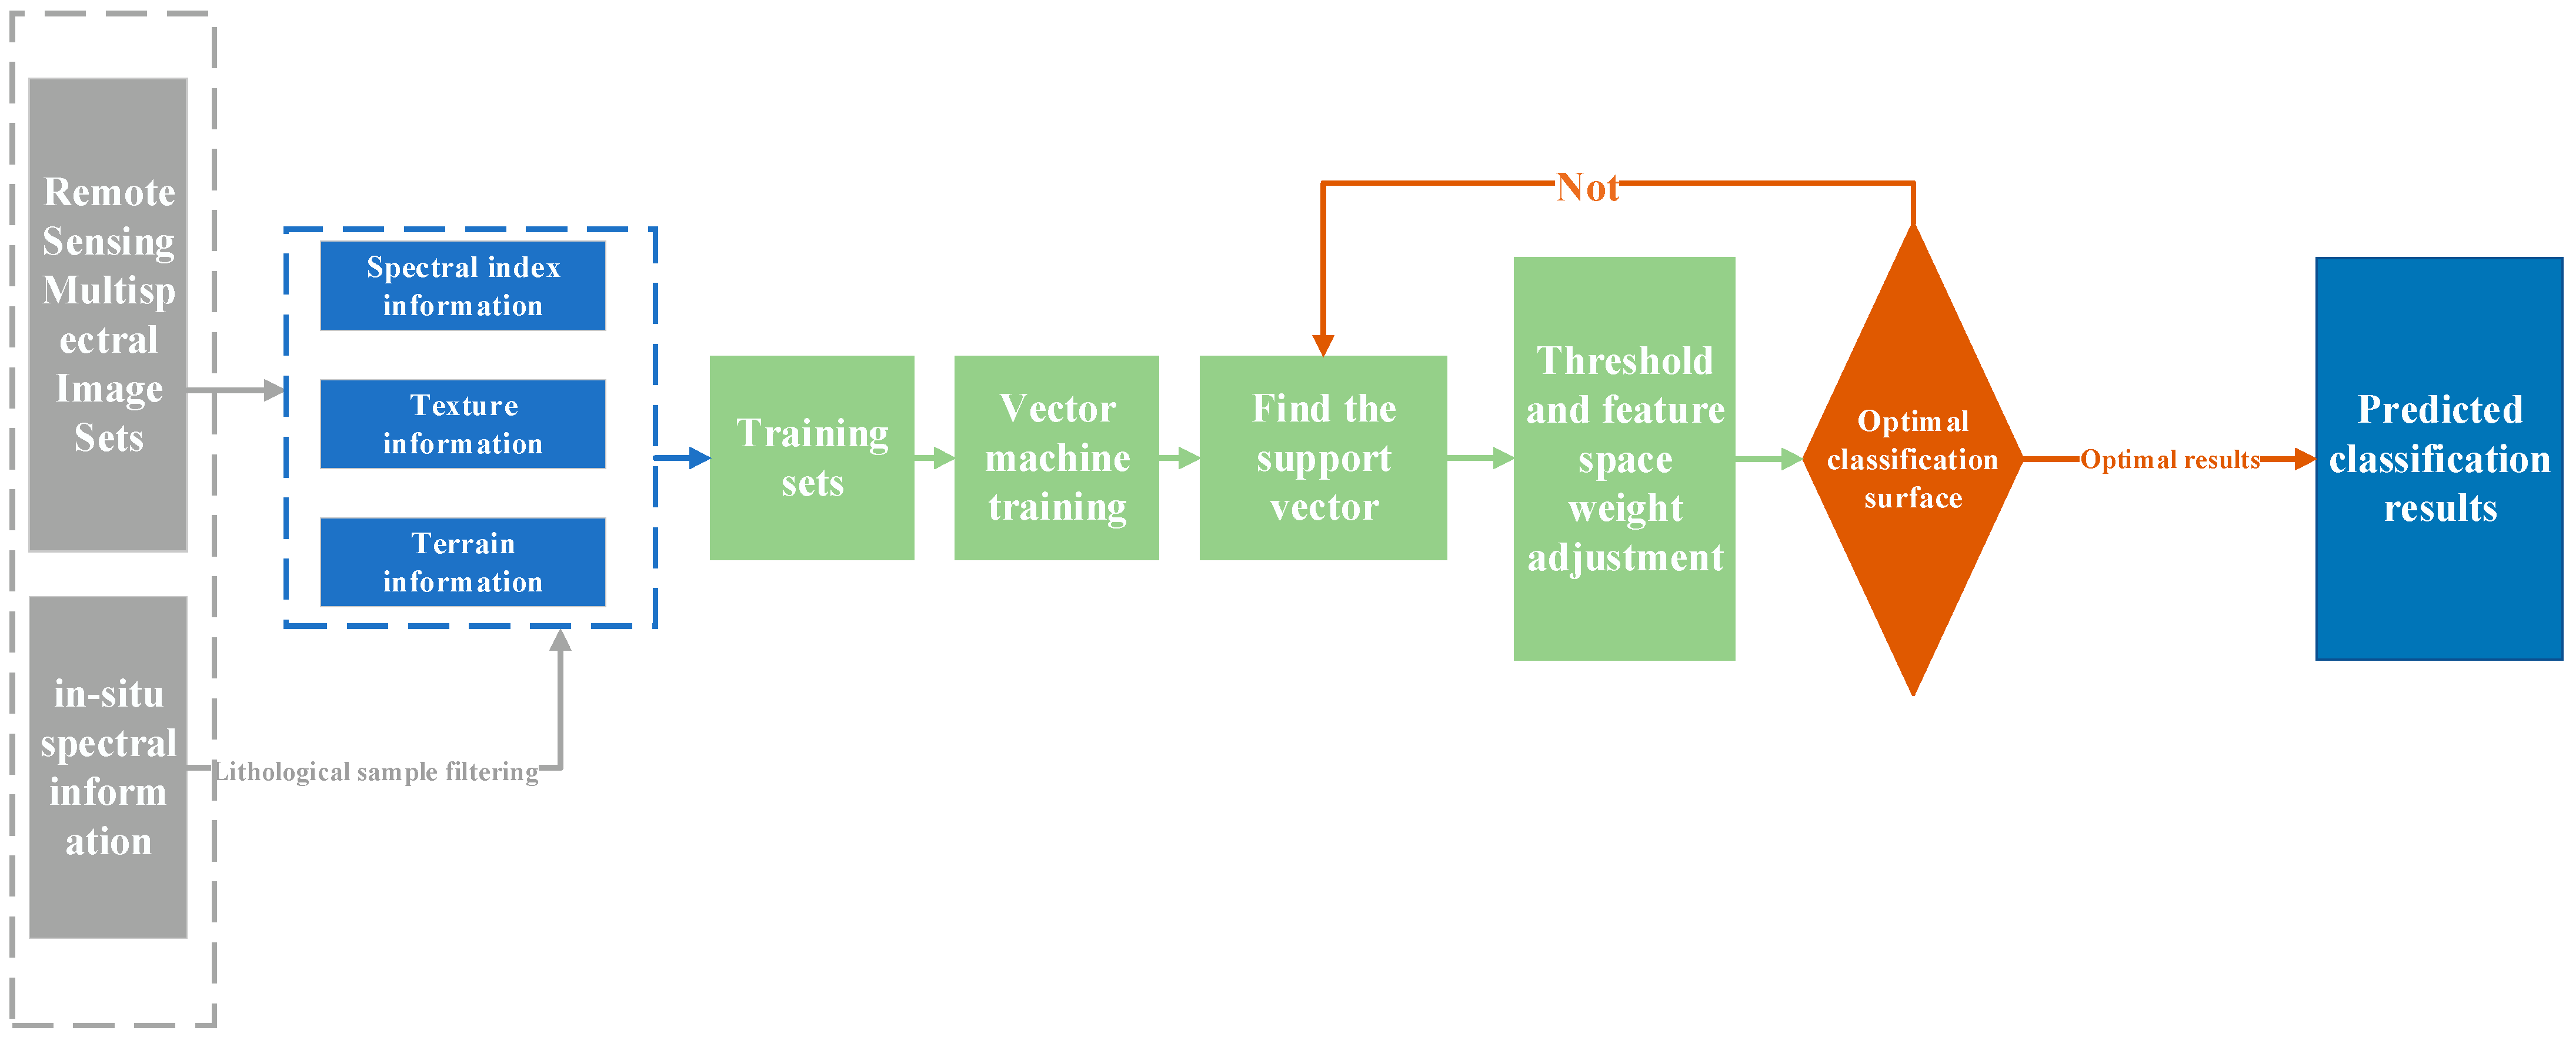
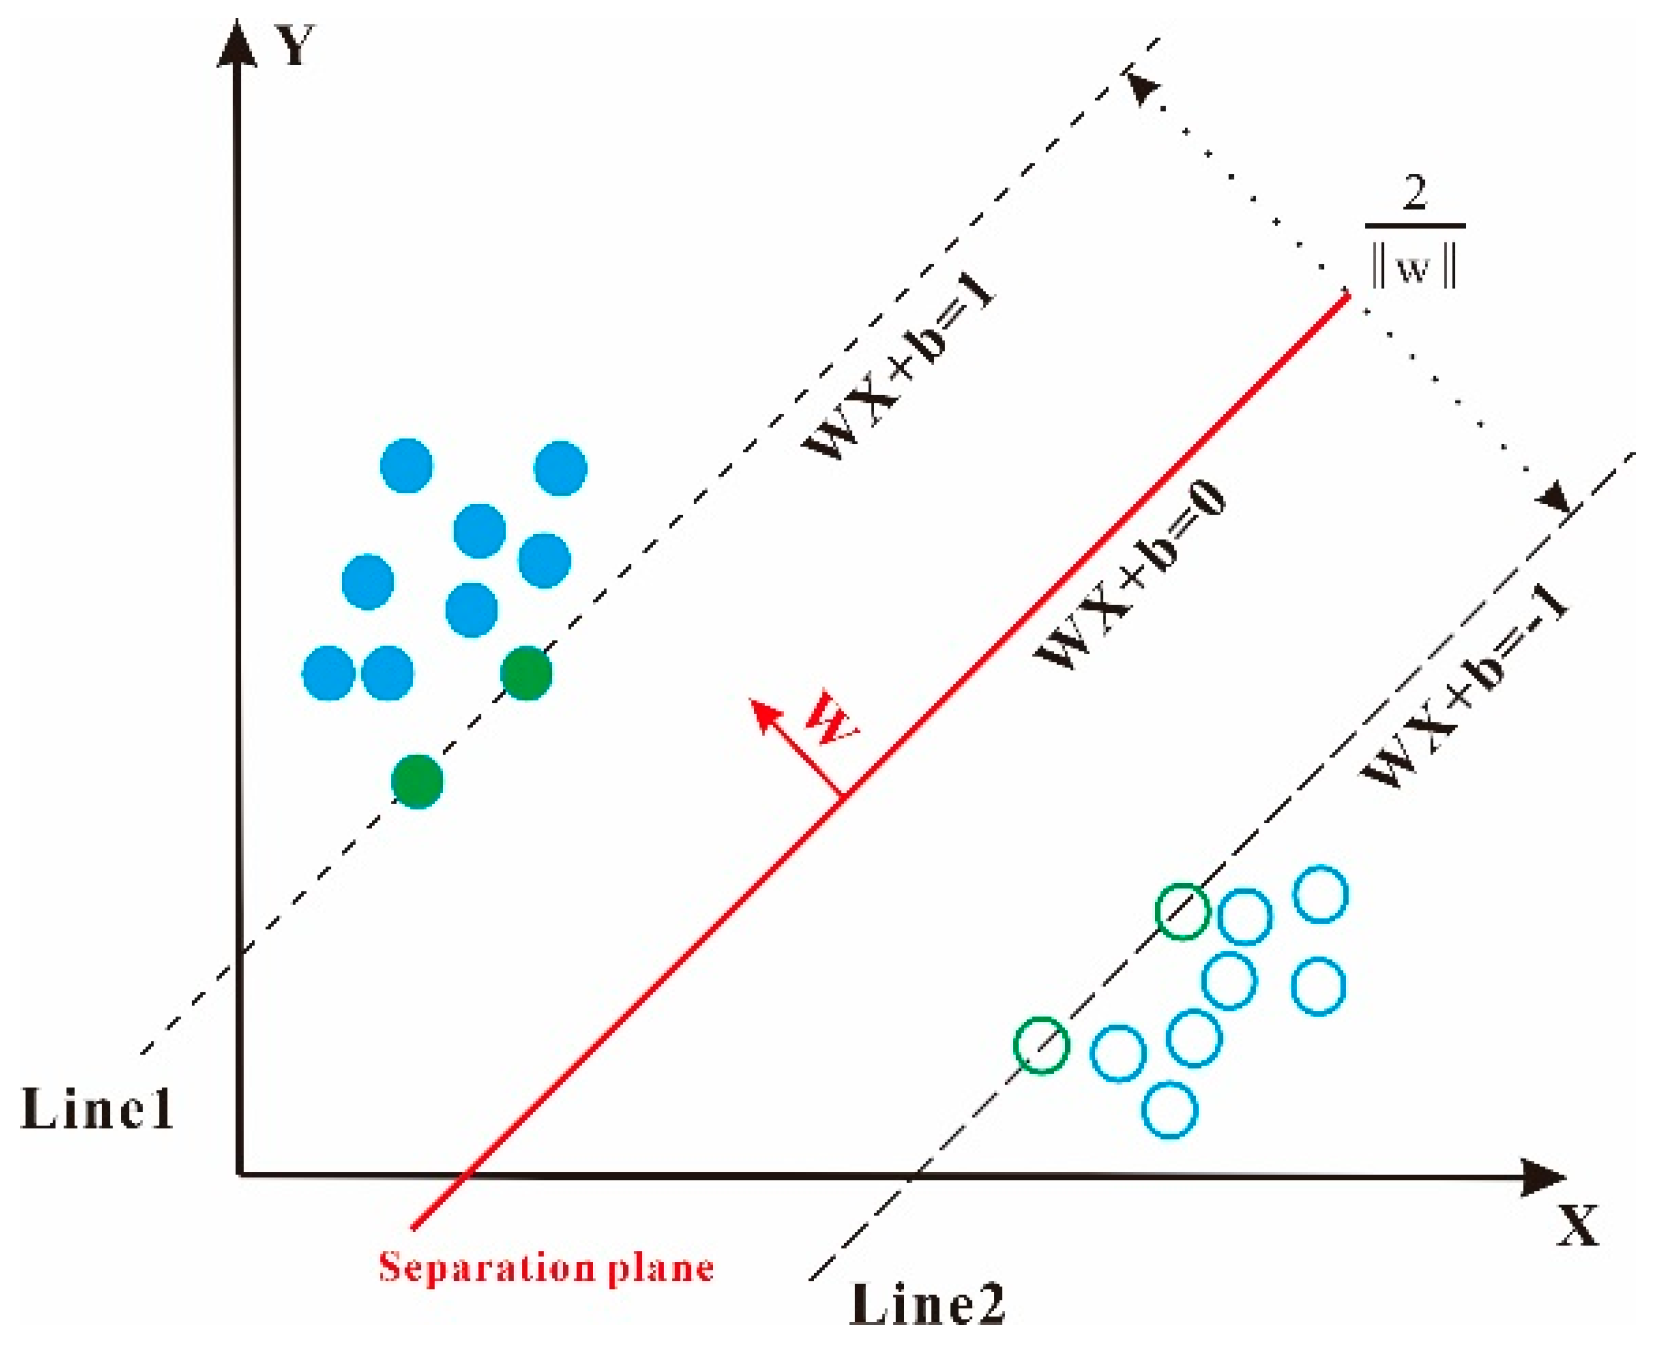
3.3. The Support Vector Machines(SVM) Lithology Extraction Technique
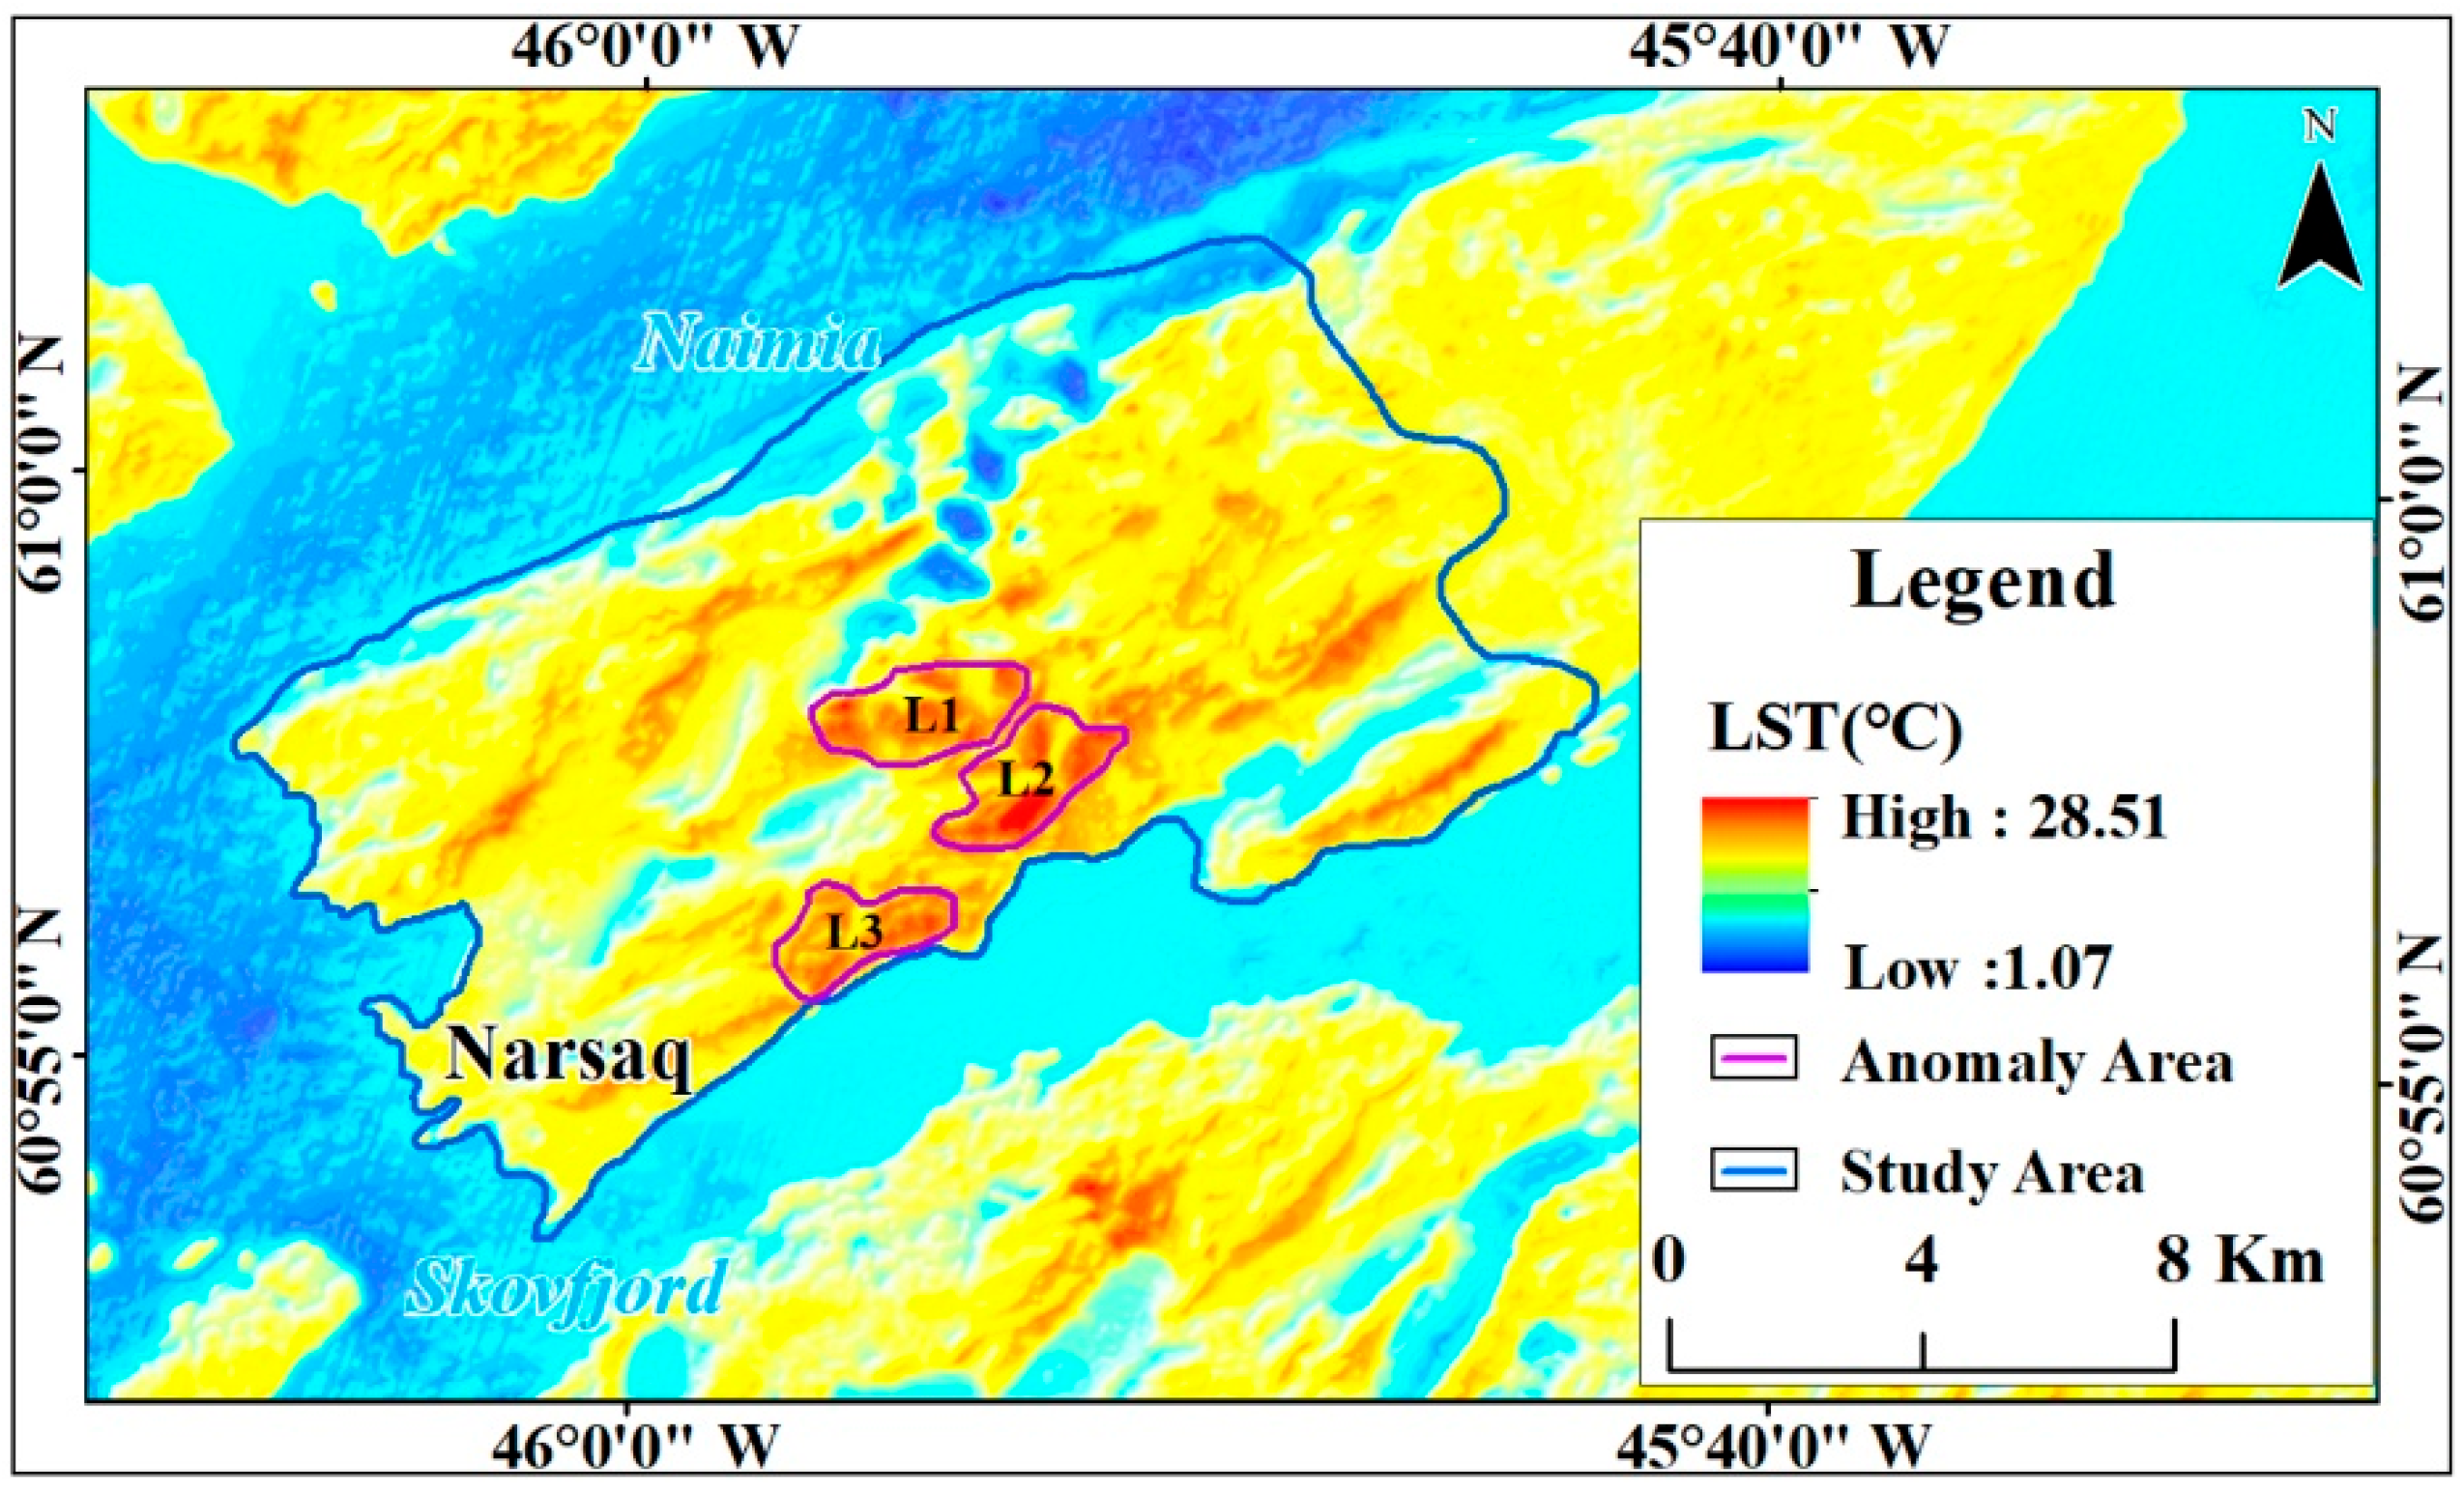
3.4. Thermal Anomaly Information Extraction
3.5. Remote Sensing Mineralization Prediction Based on the Weight of Evidence Methods
4. Results and Analysis
4.1. Remote Sensing for Geological Background Information Extraction
4.2. Lithology Extraction Based on SVM
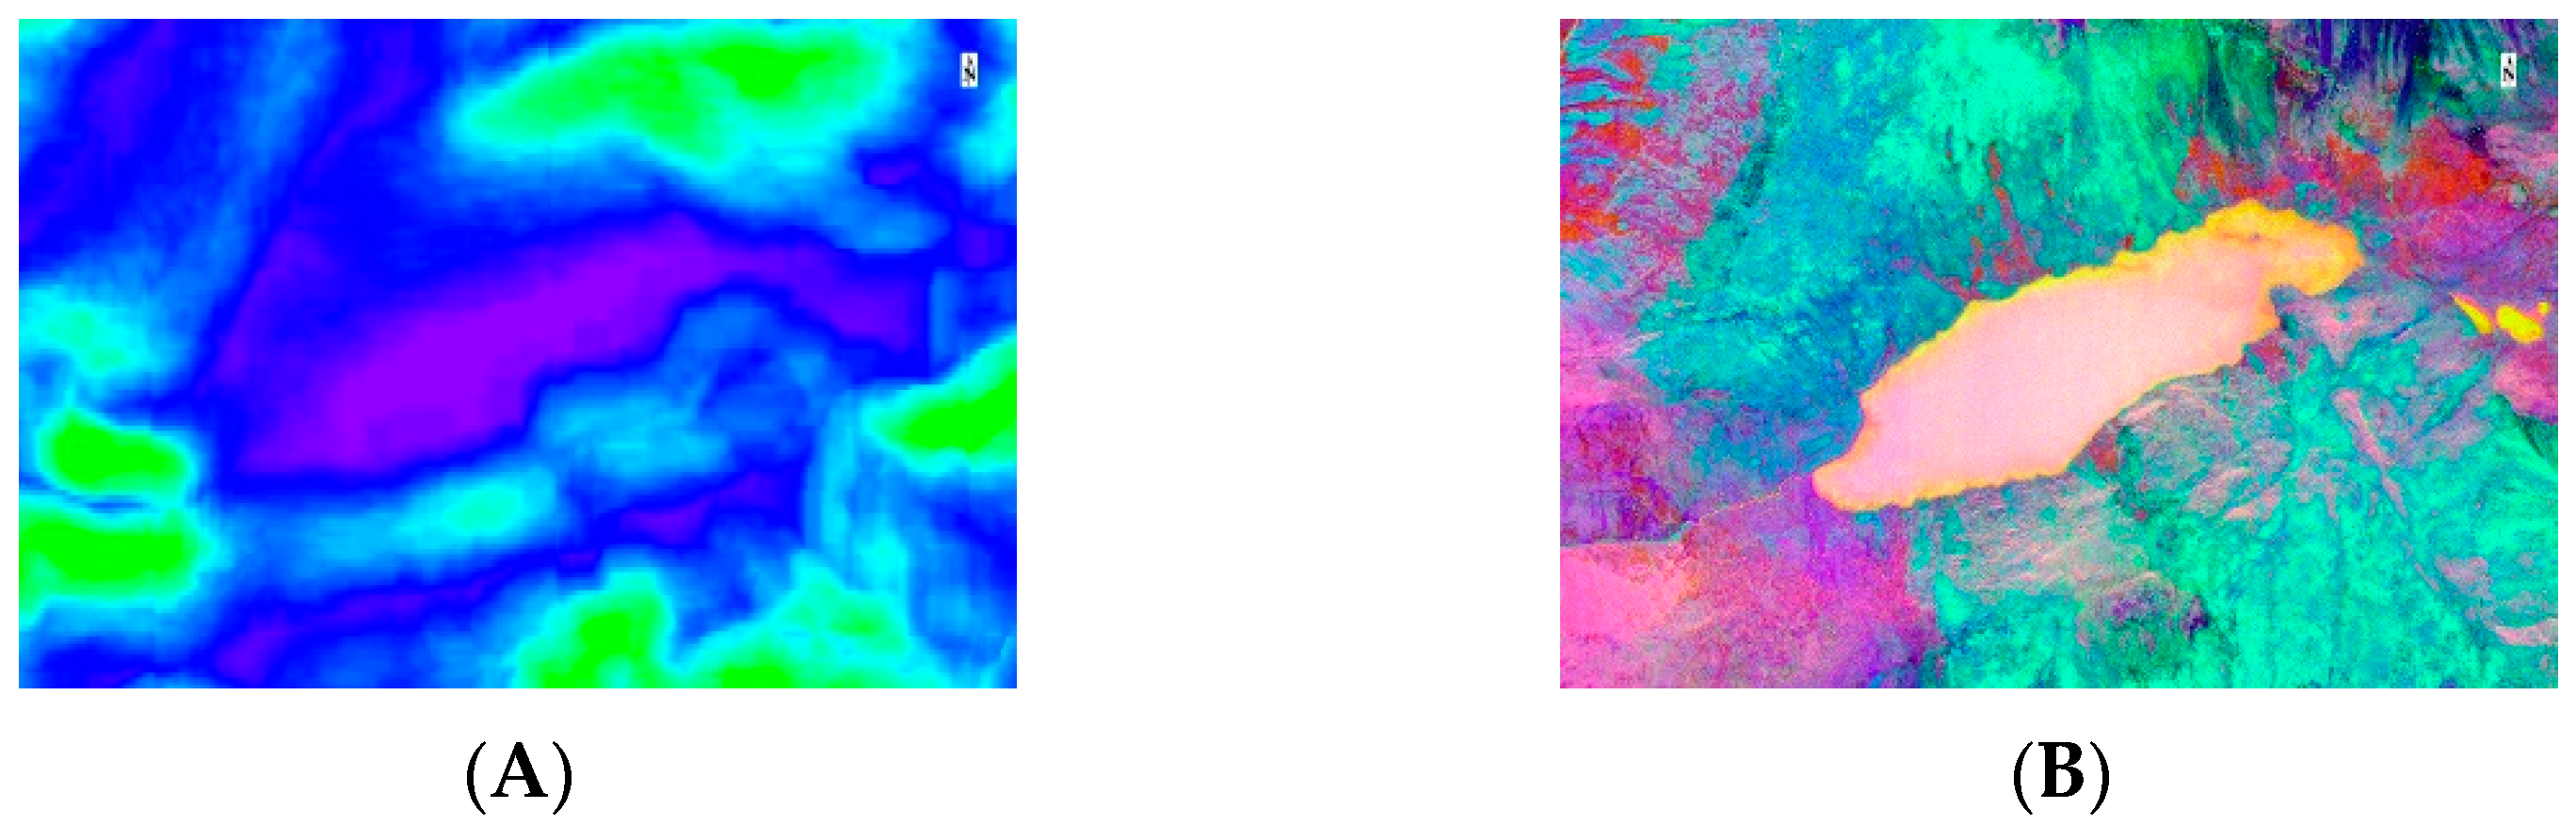
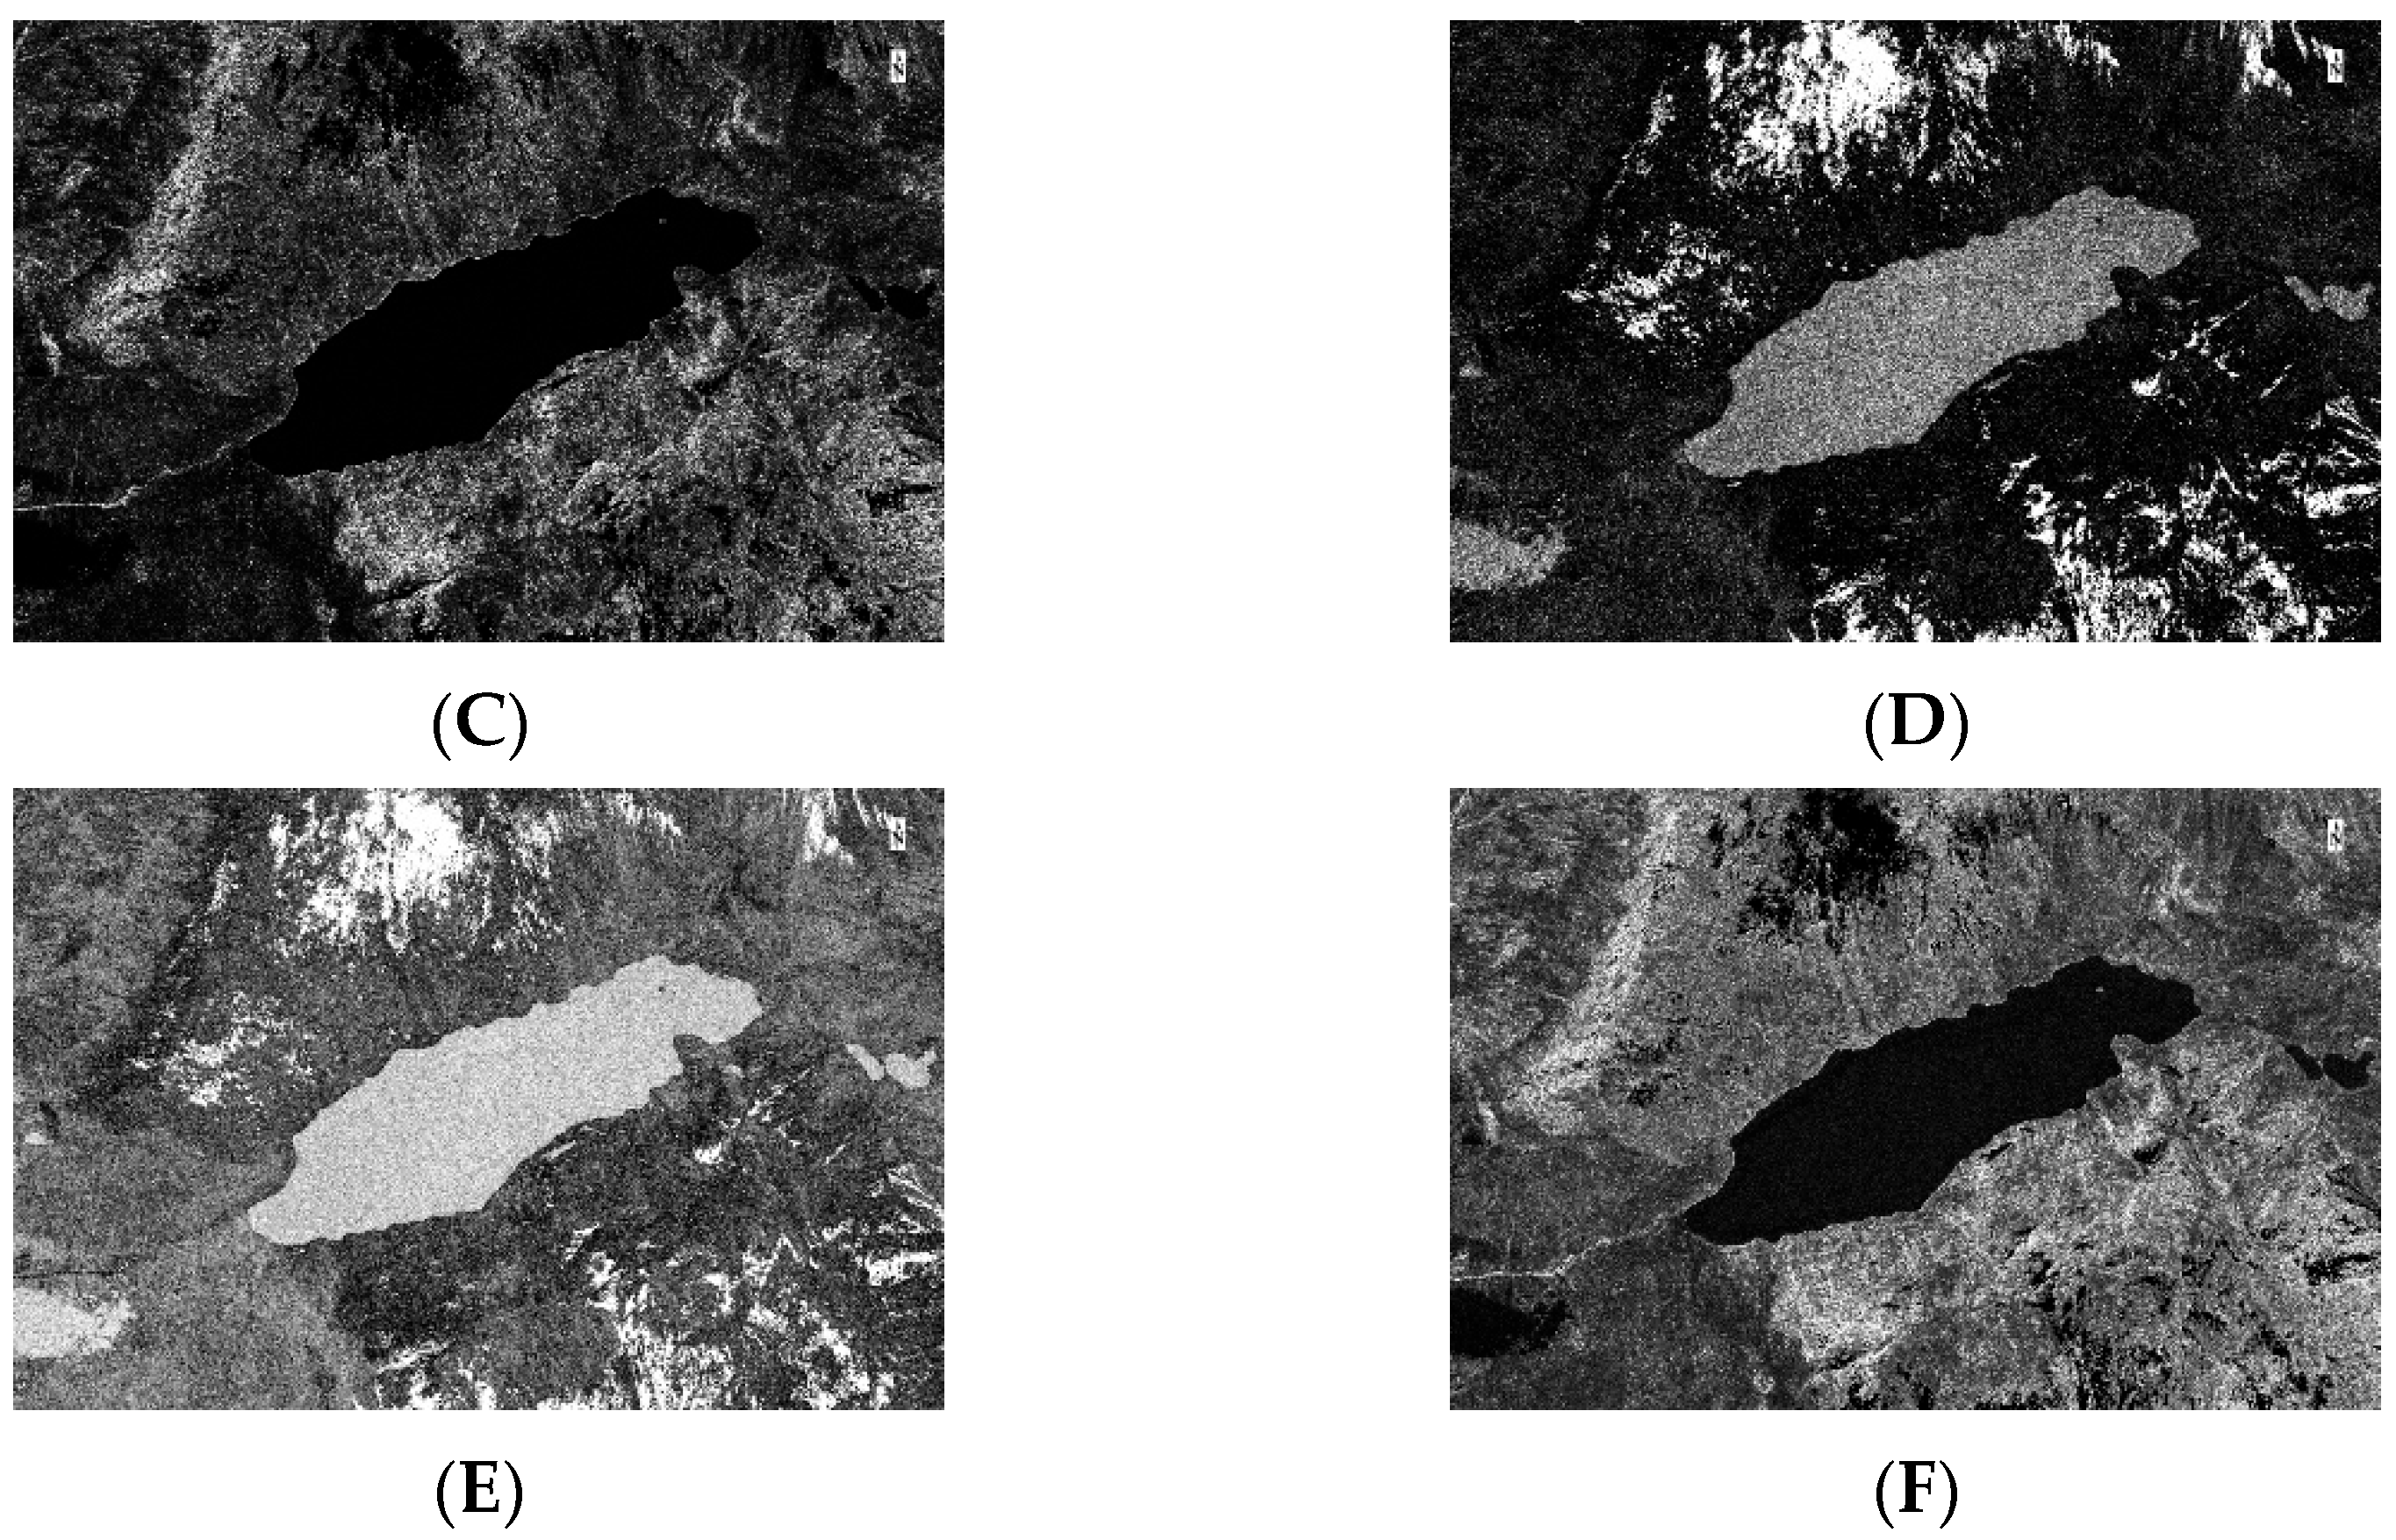
4.2.1. Lithological Information Enhancement and Analysis
4.2.2. Feature Information Extraction
4.2.3. Results of SVM Lithology Classification
4.3. Thermal Anomalies Extraction of Radioactive Minerals
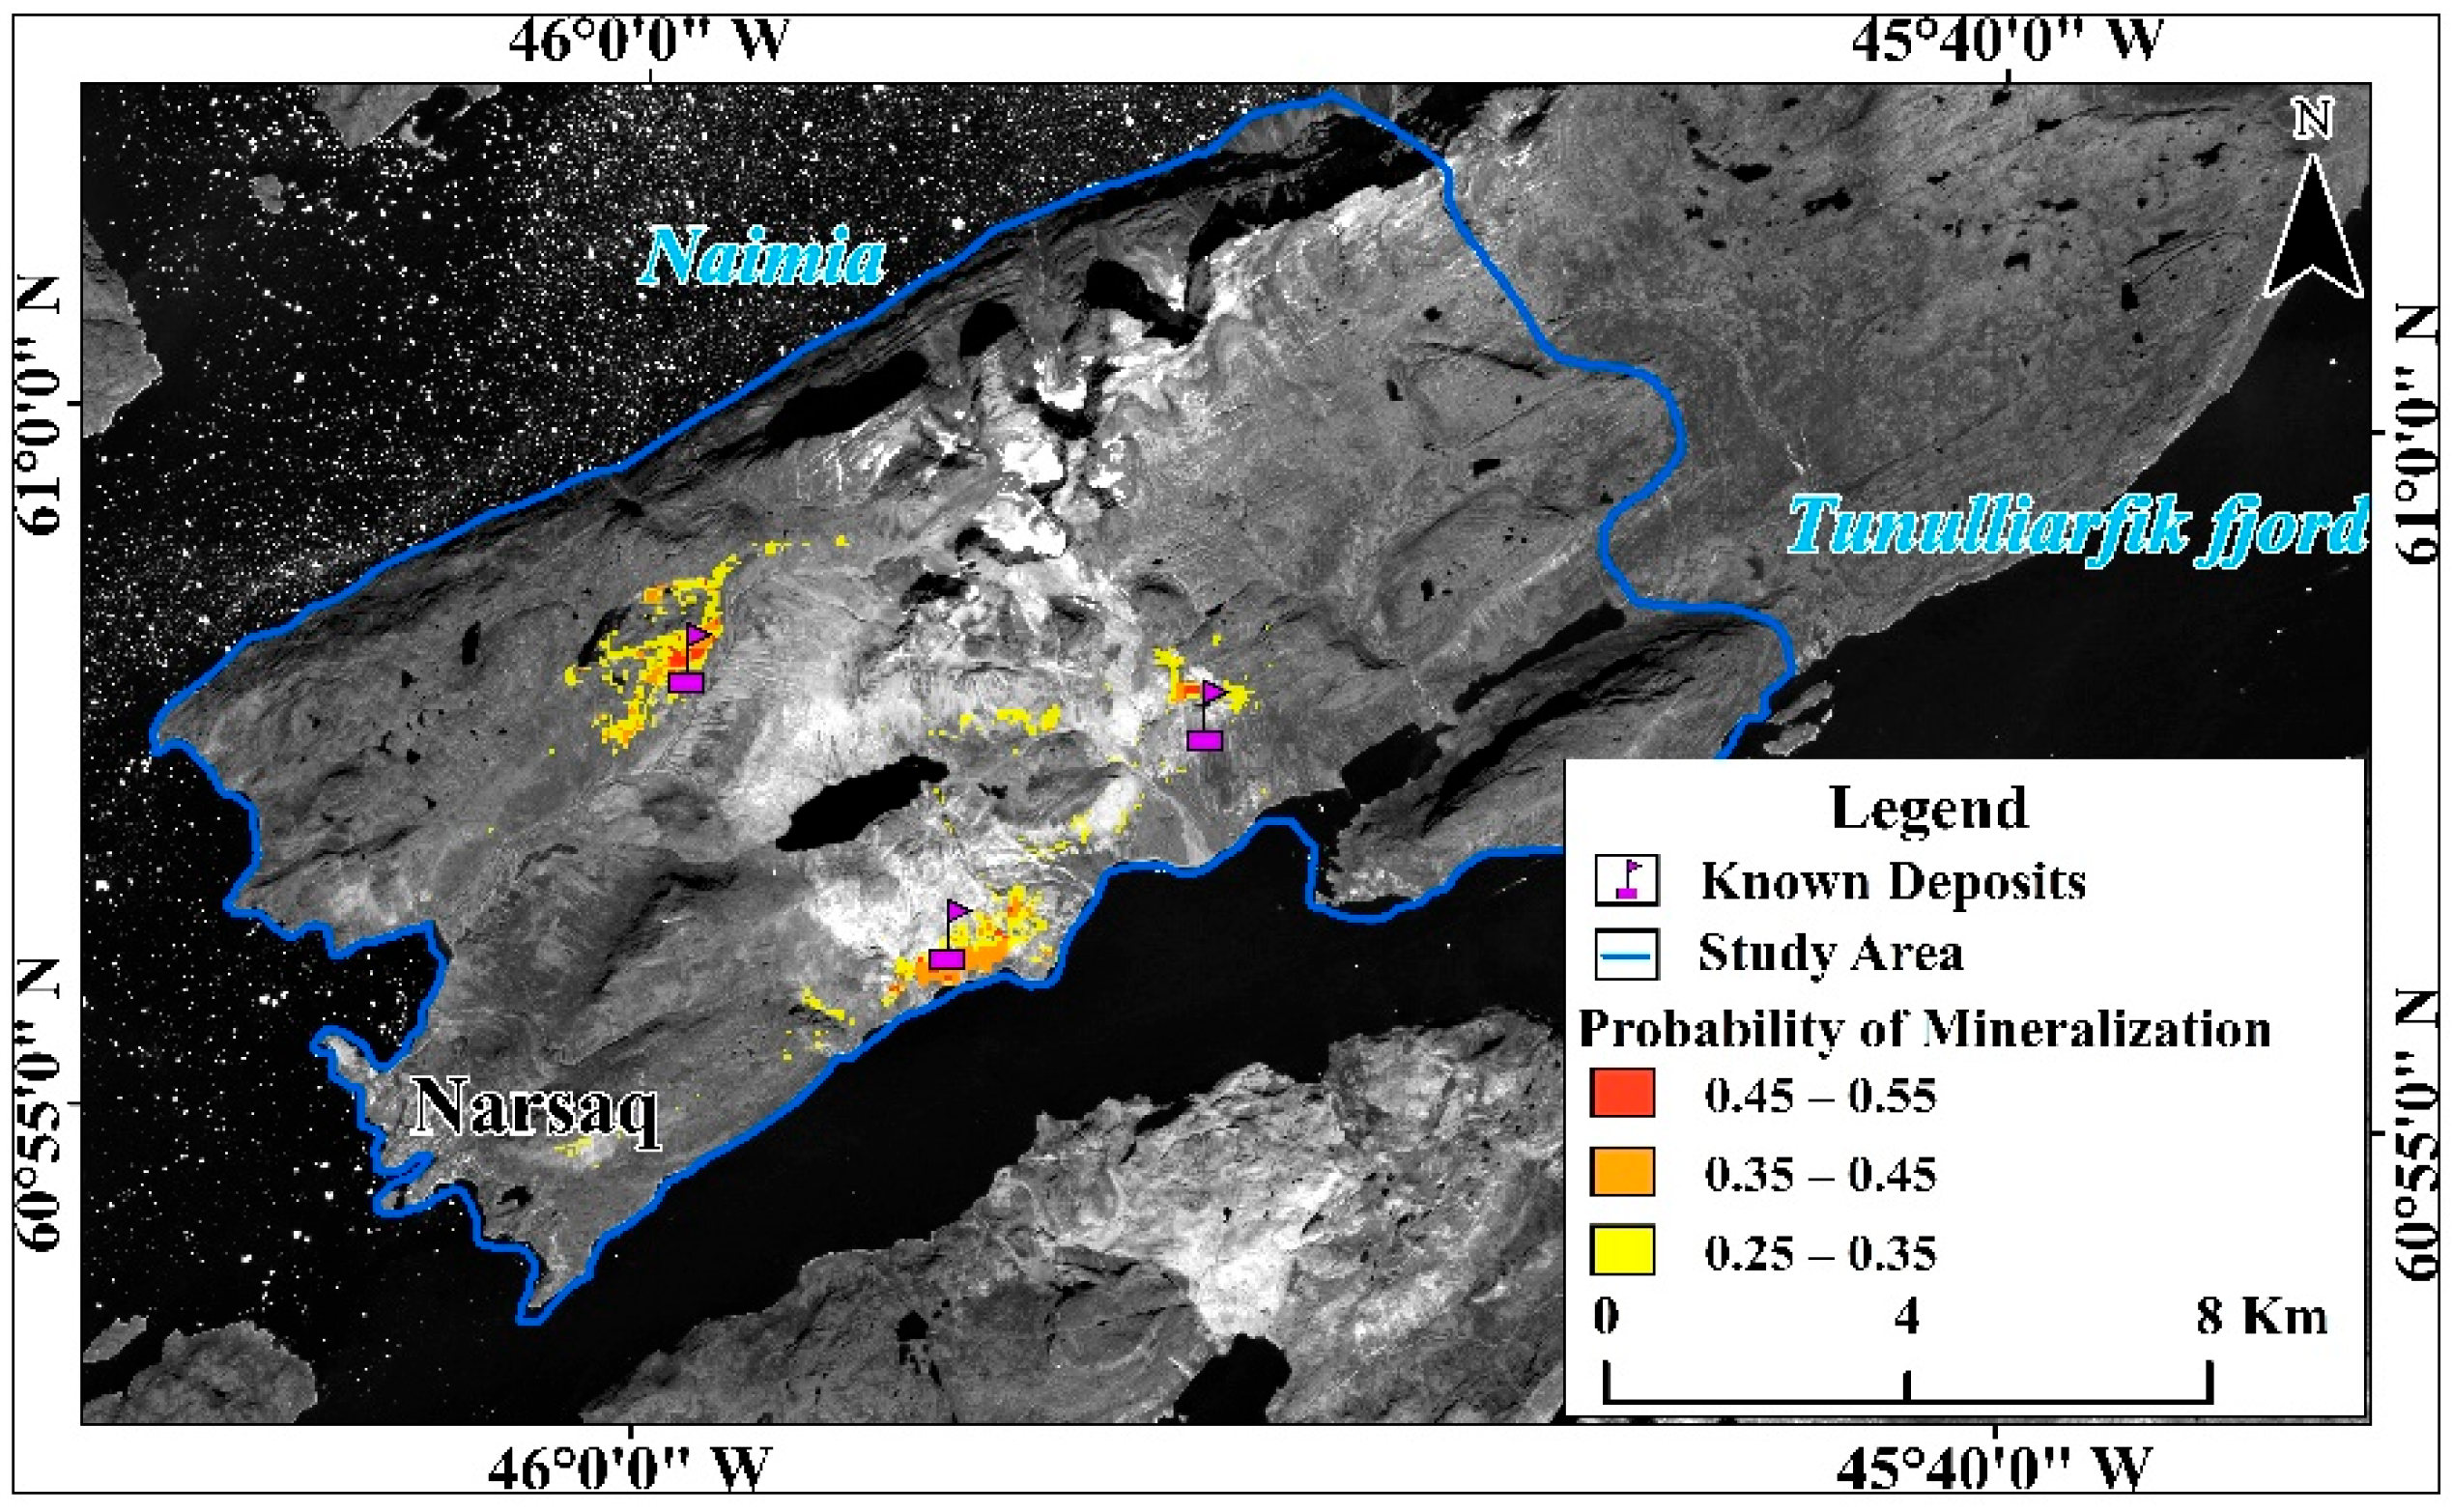
4.4. Mineral Prospectivity Mapping Based on Remote Sensing and Weight-of-Evidence Model
5. Discussions
6. Conclusions
Author Contributions
Funding
Data Availability Statement
Acknowledgments
Conflicts of Interest
References
- Hecker, C.; van Ruitenbeek, F.J.A.; van der Werff, H.M.A.; Bakker, W.H.; Hewson, R.D.; van der Meer, F.D. Spectral Absorption Feature Analysis for Finding Ore A tutorial on using the method in geological remote sensing. IEEE Geosci. Remote Sens. Mag. 2019, 7, 51–71. [Google Scholar] [CrossRef]
- Hunt, G. Spectral Signatures of Particulate Minerals in the Visible and Near Infrared. Geophysics 1977, 42, 501–513. [Google Scholar] [CrossRef] [Green Version]
- Clark, R.N.; King, T.V.V.; Klejwa, M.; Swayze, G.A.; Vergo, N. High spectral resolution reflectance spectroscopy of minerals. Int. J. Rock Mech. Min. Sci. Geomech. Abstr. 1991, 28, A217. [Google Scholar] [CrossRef] [Green Version]
- Bierwirth, P.; Huston, D.; Blewett, R. Hyperspectral mapping of mineral assemblages associated with gold mineralization in the Central Pilbara, Western Australia. Econ. Geol. Bull. Soc. Econ. Geol. 2002, 97, 819–826. [Google Scholar] [CrossRef]
- Kruse, F.A.; Perry, S.L.; Caballero, A. District-level mineral survey using airborne hyperspectral data, Los Menucos, Argentina. Ann. Geophys. 2006, 49, 83–92. [Google Scholar]
- Rockwell, B.W.; Cunningham, C.G.; Breit, G.N.; Rye, R.O. Spectroscopic mapping of the White Horse alunite deposit, Marysvale Volcanic Field, Utah: Evidence of a magmatic component. Econ. Geol. 2006, 101, 1377–1395. [Google Scholar] [CrossRef]
- Abulghasem, Y.A.; Akhir, J.B.M.; Hassan, W.F.W.; Samsudin, A.; Youshah, B.M. The use of remote sensing technology in geological investigation and mineral detection in Wadi shati, Libya. Electron. J. Geotech. Eng. 2012, 17, 1279–1291. [Google Scholar]
- Amer, R.; Kusky, T.; Ghulam, A. Lithological mapping in the Central Eastern Desert of Egypt using ASTER data. J. Afr. Earth Sci. 2010, 56, 75–82. [Google Scholar] [CrossRef]
- Xu, Y.; Chen, J.; Meng, P. Detection of alteration zones using hyperspectral remote sensing data from Dapingliang skarn copper deposit and its surrounding area, Shanshan County, Xinjiang Uygur autonomous region, China. J. Vis. Commun. Image Represent. 2019, 58, 67–78. [Google Scholar] [CrossRef]
- Milovsky, G.A.; Makarov, V.P.; Troitsky, V.V.; Lyamin, S.M.; Orlyankin, V.N.; Shemyakina, E.M.; Gil, I.G. Use of Remote Sensing to Find a Localization Pattern of Gold Mineralization in the Central Part of the Ayan-Yuryakh Anticlinorium, Magadan Oblast. Izv. Atmos. Ocean. Phys. 2019, 55, 1389–1394. [Google Scholar] [CrossRef]
- Yamaguchi, Y.; Kahle, A.B.; Tsu, H.; Kawakami, T.; Pniel, M. Overview of advanced spaceborne thermal emission and reflection radiometer (ASTER). IEEE Trans. Geosci. Remote Sens. 1998, 36, 1062–1071. [Google Scholar] [CrossRef] [Green Version]
- Dehnavi, A.G.; Sarikhani, R.; Nagaraju, D. Image Processing and Analysis of Mapping Alteration Zones in environmental research, East of Kurdistan, Iran. World Appl. Sci. J. 2010, 11, 278–283. [Google Scholar]
- Gupta, P.; Venkatesan, M. Mineral Identification Using Unsupervised Classification from Hyperspectral Data; Springer: Singapore, 2020. [Google Scholar]
- Shayeganpour, S.; Tangestani, M.H.; Gorsevski, P.V. Machine learning and multi-sensor data fusion for mapping lithology: A case study of Kowli-kosh area, SW Iran. Adv. Space Res. 2021, 68, 3992–4015. [Google Scholar] [CrossRef]
- Liu, Z.; Cao, J.; You, J.; Chen, S.; Lu, Y.; Zhou, P. A lithological sequence classification method with well log via SVM-assisted bi-directional GRU-CRF neural network. J. Pet. Sci. Eng. 2021, 205, 108913. [Google Scholar] [CrossRef]
- Gu, Y.; Zhang, D.; Bao, Z.; Guo, H.; Zhou, L.; Ren, J. Lithology prediction of tight sandstone formation using GS-LightGBM hybrid machine learning model. Bull. Geol. Sci. Technol. 2021, 40, 224–234. [Google Scholar]
- Mou, D.; Zhang, L.; Xu, C. Comparison of Three Classical Machine Learning Algorithms for Lithology Identification of Volcanic Rocks Using Well Logging Data. J. Jilin Univ. Earth Sci. Ed. 2021, 51, 951–956. [Google Scholar]
- Kumar, C.; Chatterjee, S.; Oommen, T.; Guha, A. Automated lithological mapping by integrating spectral enhancement techniques and machine learning algorithms using AVIRIS-NG hyperspectral data in Gold-bearing granite-greenstone rocks in Hutti, India. Int. J. Appl. Earth Obs. Geoinf. 2020, 86, 15. [Google Scholar] [CrossRef]
- Duan, Y.; Zhao, Y.; Ma, C.; Jiang, W. Lithology Identification Method Based on Multi -layer Ensemble Learning. J. Data Acquis. Process. 2020, 35, 572–581. [Google Scholar]
- Han, Q.; Zhang, X.; Shen, W. Application of Support Vector Machine Based on Decision Tree Feature Extraction in Lithology Classification. J. Jilin Univ. Earth Sci. Ed. 2019, 49, 611–620. [Google Scholar]
- Hutchison, W.; Finch, A.A.; Borst, A.M.; Marks, M.A.W.; Upton, B.G.J.; Zerkle, A.L.; Stueken, E.E.; Boyce, A.J. Mantle sources and magma evolution in Europe’s largest rare earth element belt (Gardar Province, SW Greenland): New insights from sulfur isotopes. Earth Planet. Sci. Lett. 2021, 568, 117034. [Google Scholar] [CrossRef]
- Steenfelt, A.; Kolb, J.; Thrane, K. Metallogeny of South Greenland: A review of geological evolution, mineral occurrences and geochemical exploration data. Ore Geol. Rev. 2016, 77, 194–245. [Google Scholar] [CrossRef]
- Aydar, E.; Diker, C. Carcinogen soil radon enrichment in a geothermal area: Case of Guzelcamli-Davutlar district of Aydin city, western Turkey. Ecotoxicol. Environ. Saf. 2021, 208, 111466. [Google Scholar] [CrossRef] [PubMed]
- Cui, Y.; Zhu, C.; Qiu, N.; Tang, B.; Guo, S. Radioactive Heat Production and Terrestrial Heat Flow in the Xiong’an Area, North China. Energies 2019, 12, 4608. [Google Scholar] [CrossRef] [Green Version]
- Li, Q. The Study of Deep Geothermal Features in Sichuan Basin; Chengdu University of Technology: Chengdu, China, 1992. [Google Scholar]
- Qing-yang, L.I.; Hui-rong, C.A.I.; Yan, C. The study and application of the relationship between the geothermal field and the deep uranium ore deposit. Geol. China 2010, 37, 198–203. [Google Scholar]
- Wang, J.-h.; Zhang, J.-l.; Liu, D.-C. Discussion on the application potential of thermal infrared remote sensing technology in uranium deposits exploration. World Nucl. Geosci. 2011, 28, 32–41. [Google Scholar]
- Salawu, N.B.; Fatoba, J.O.; Adebiyi, L.S.; Eluwole, A.B.; Olasunkanmi, N.K.; Orosun, M.M.; Dada, S.S. Structural geometry of Ikogosi warm spring, southwestern Nigeria: Evidence from aeromagnetic and remote sensing interpretation. Geomech. Geophys. Geo-Energy Geo-Resour. 2021, 7, 26. [Google Scholar] [CrossRef]
- Gemitzi, A.; Dalampakis, P.; Falalakis, G. Detecting geothermal anomalies using Landsat 8 thermal infrared remotely sensed data. Int. J. Appl. Earth Obs. Geoinf. 2021, 96, 102283. [Google Scholar] [CrossRef]
- Rodriguez-Gomez, C.; Kereszturi, G.; Reeves, R.; Rae, A.; Pullanagari, R.; Jeyakumar, P.; Procter, J. Lithological mapping of Waiotapu Geothermal Field (New Zealand) using hyperspectral and thermal remote sensing and ground exploration techniques. Geothermics 2021, 96, 102195. [Google Scholar] [CrossRef]
- Xin, L.; Liu, X.; Zhang, B. Land surface temperature retrieval and geothermal resources prediction by remote sensing image: A case study in the Shijiazhuang area, Hebei province. J. Geomech. 2021, 27, 40–51. [Google Scholar]
- Saibi, H.; Mia, M.B.; Bierre, M.; El Kamali, M. Application of remote sensing techniques to geothermal exploration at geothermal fields in the United Arab Emirates. Arab. J. Geosci. 2021, 14, 1251. [Google Scholar] [CrossRef]
- Goldstein, B.A.; Hill, A.J.; Long, A.; Budd, A.R.; Holgate, F.; Malavazos, M. Hot dry rock geothermal exploration in Australia. ASEG Ext. Abstr. 2004, 2004, 1–4. [Google Scholar]
- Wyborn, D.; Somerville, M. Prospective hot-dry-rock geothermal energy in Australia. GA Publication Research Newsletter. 1994. Available online: https://d28rz98at9flks.cloudfront.net/90424/ResearchNews_21_p001.pdf (accessed on 25 May 2022).
- Coolbaugh, M.F.; Kratt, C.; Fallacaro, A.; Calvin, W.M.; Taranik, J.V. Detection of geothermal anomalies using Advanced Spaceborne Thermal Emission and Reflection Radiometer (ASTER) thermal infrared images at Bradys Hot Springs, Nevada, USA. Remote Sens. Environ. 2007, 106, 350–359. [Google Scholar] [CrossRef]
- Aita, S.K.; Omar, A.E. Exploration of uranium and mineral deposits using remote sensing data and GIS applications, Serbal area, Southwestern Sinai, Egypt. Arab. J. Geosci. 2021, 14, 2214. [Google Scholar] [CrossRef]
- Yousefi, M.; Tabatabaei, S.H.; Rikhtehgaran, R.; Pour, A.B.; Pradhan, B. Application of Dirichlet Process and Support Vector Machine Techniques for Mapping Alteration Zones Associated with Porphyry Copper Deposit Using ASTER Remote Sensing Imagery. Minerals 2021, 11, 1235. [Google Scholar] [CrossRef]
- Marks, M.A.W.; Hettmann, K.; Schilling, J.; Frost, B.R.; Markl, G. The Mineralogical Diversity of Alkaline Igneous Rocks: Critical Factors for the Transition from Miaskitic to Agpaitic Phase Assemblages. J. Petrol. 2011, 52, 439–455. [Google Scholar] [CrossRef] [Green Version]
- Steenfelt, A. High-technology metals in alkaline and carbonatitic rocks in greenland—Recognition and exploration. J. Geochem. Explor. 1991, 40, 263–279. [Google Scholar] [CrossRef]
- Zhao, Y.; Lu, W.; Wang, A.; Lu, W. Research Progress on the Ilimaussaq Nb-Ta-U-REE Deposit, Greenland. Geol. Sci. Techol. Inf. 2013, 32, 9–17. [Google Scholar]
- van der Werff, H.; van der Meer, F. Sentinel-2A MSI and Landsat 8 OLI Provide Data Continuity for Geological Remote Sensing. Remote Sens. 2016, 8, 883. [Google Scholar] [CrossRef] [Green Version]
- Drusch, M.; Del Bello, U.; Carlier, S.; Colin, O.; Fernandez, V.; Gascon, F.; Hoersch, B.; Isola, C.; Laberinti, P.; Martimort, P.; et al. Sentinel-2: ESA’s Optical High-Resolution Mission for GMES Operational Services. Remote Sens. Environ. 2012, 120, 25–36. [Google Scholar] [CrossRef]
- Updike, T.; Comp, C. Radiometric use of WorldView-2 imagery. DigitalGlobe. 2010, p. 1. Available online: https://www.yumpu.com/en/document/read/43552535/radiometric-use-of-worldview-2-imagery-technical-note-pancroma (accessed on 25 May 2022).
- Irons, J.R.; Dwyer, J.L.; Barsi, J.A. The next Landsat satellite: The Landsat Data Continuity Mission. Remote Sens. Environ. 2012, 122, 11–21. [Google Scholar] [CrossRef] [Green Version]
- Jimenez-Munoz, J.C.; Sobrino, J.A.; Skokovic, D.; Mattar, C.; Cristobal, J. Land Surface Temperature Retrieval Methods From Landsat-8 Thermal Infrared Sensor Data. IEEE Geosci. Remote Sens. Lett. 2014, 11, 1840–1843. [Google Scholar] [CrossRef]
- Abrams, M.; Crippen, R.; Fujisada, H. ASTER Global Digital Elevation Model (GDEM) and ASTER Global Water Body Dataset (ASTWBD). Remote Sens. 2020, 12, 1156. [Google Scholar] [CrossRef] [Green Version]
- Jing, C.; Bokun, Y.; Runsheng, W.; Feng, T.; Yingjun, Z.; Dechang, L.; Suming, Y.; Wei, S. Regional-scale mineral mapping using ASTER VNIR/SWIR data and validation of reflectance and mineral map products using airborne hyperspectral CASI/SASI data. Int. J. Appl. Earth Obs. Geoinf. 2014, 33, 127–141. [Google Scholar] [CrossRef]
- Pour, A.B.; Hashim, M. The application of ASTER remote sensing data to porphyry copper and epithermal gold deposits. Ore Geol. Rev. 2012, 44, 1–9. [Google Scholar] [CrossRef] [Green Version]
- Brown, M.; Lewis, H.G.; Gunn, S.R. Linear spectral mixture models and support vector machines for remote sensing. IEEE Trans. Geosci. Remote Sens. 2000, 38, 2346–2360. [Google Scholar] [CrossRef] [Green Version]
- Brown, M.; Gunn, S.R.; Lewis, H.G. Support vector machines for optimal classification and spectral unmixing. Ecol. Model. 1999, 120, 167–179. [Google Scholar] [CrossRef]
- Brown, M.; Lewis, H. Support vector machines and linear spectral unmixing for remote sensing. In Proceedings of the International Conference on Advances in Pattern Recognition (ICAPR 98), Plymouth, UK, 23–25 November 1998; pp. 395–404. [Google Scholar]
- Lackner, M.; Conway, T.M. Determining land-use information from land cover through an object-oriented classification of IKONOS imagery. Can. J. Remote Sens. 2008, 34, 77–92. [Google Scholar] [CrossRef]
- Tsang, I.W.; Kwok, J.T.; Cheung, P.M. Core vector machines: Fast SVM training on very large data sets. J. Mach. Learn. Res. 2005, 6, 363–392. [Google Scholar]
- Xiao, A.; Zhao, W.; Hu, D.; Liu, L.; Li, J. Remote sensing information extraction based on object-oriented and support vector machines. Sci. Surv. Mapp. 2010, 35, 154–157. [Google Scholar]
- Pasolli, E.; Melgani, F.; Tuia, D.; Pacifici, F.; Emery, W.J. SVM Active Learning Approach for Image Classification Using Spatial Information. IEEE Trans. Geosci. Remote Sens. 2014, 52, 2217–2233. [Google Scholar] [CrossRef]
- Cortes, C.; Vapnik, V. Support-vector networks. Mach. Learn. 1995, 20, 273–297. [Google Scholar] [CrossRef]
- Room, C.A.o.S.G. Introduction to Mine Geothermal; China Coal Industry Publishing House: Beijing, China, 1981. [Google Scholar]
- Duan, S.; Ru, C.; Li, Z.; Wang, M.; Xu, H.; Li, H.; Wu, P.; Zhan, W.; Zhou, J.; Zhao, W.; et al. Reviews of methods for land surface temperature retrieval from Landsat thermal infrared data. J. Remote Sens. 2021, 25, 1591–1617. [Google Scholar]
- Sekertekin, A.; Bonafoni, S. Land Surface Temperature Retrieval from Landsat 5, 7, and 8 over Rural Areas: Assessment of Different Retrieval Algorithms and Emissivity Models and Toolbox Implementation. Remote Sens. 2020, 12, 294. [Google Scholar] [CrossRef] [Green Version]
- Bonham-Carter, G.F.; Agterberg, F.P.; Wright, D.F. Weight of evidence modeling: A new approach to mapping mineral potential. In Statistical Applications in the Earth Sciences; Wiley: Hoboken, NJ, USA, 1989; pp. 171–183. [Google Scholar]
- Riisager, P.; Rasmussen, T.M. Aeromagnetic survey in south-eastern Greenland: Project Aeromag 2013. Geol. Surv. Den. Greenl. Bull. 2014, 31, 63–66. [Google Scholar] [CrossRef] [Green Version]
- Armour-Brown, A.; Tukiainen, T.; Wallin, B. South Greenland Uranium Exploration Programme; Final Report; Groenlands Geologiske Undersoegelse: Copenhagen, Denmark, 1982; Volume 14. [Google Scholar]
- Xiaoliang, F.; Mingjie, W.; Chengmin, W.E.N.; Huihua, Z. The preliminary study of the exploration potential of the Liwu copper deposit and its surrounding areas, western Sichuan. Sediment. Geol. Tethyan Geol. 2007, 27, 9–13. [Google Scholar]
- Petersen, O.V.; Gault, R.A.; Balic-Zunic, T. Odintsovite from the Ilimaussaq alkaline complex, South Greenland. Neues Jahrb. Mineral.-Mon. 2001, 235–240. [Google Scholar]
- Petersen, O.V. List of all minerals identified in the Ilímaussaq alkaline complex, South Greenland. Geol. Greenl. Surv. Bull. 2001, 190, 25–33. [Google Scholar] [CrossRef]
- Petersen, O.V.; Johnsen, O.; Micheelsen, H.I. Turkestanite from the Ilimaussaq alkaline complex, South Greenland. Neues Jahrb. Mineral.-Mon. 1999, 424–432. [Google Scholar]
- Quan, X.; Liu, C.; Zhao, Y. The evaluation of uranium mineral resources potential in Greenland. Geol. Bull. China 2019, 38, 1071–1079. [Google Scholar]
- Peleli, S.; Kouli, M.; Marchese, F.; Lacava, T.; Vallianatos, F.; Tramutoli, V. Monitoring temporal variations in the geothermal activity of Miocene Lesvos volcanic field using remote sensing techniques and MODIS—LST imagery. Int. J. Appl. Earth Obs. Geoinf. 2021, 95, 102251. [Google Scholar] [CrossRef]
- Hewson, R.; Mshiu, E.; Hecker, C.; van der Werff, H.; van Ruitenbeek, F.; Alkema, D.; van der Meer, F. The application of day and night time ASTER satellite imagery for geothermal and mineral mapping in East Africa. Int. J. Appl. Earth Obs. Geoinf. 2020, 85, 101991. [Google Scholar] [CrossRef]
- Sanchez-Aparicio, M.; Andres-Anaya, P.; Del Pozo, S.; Laguela, S. Retrieving Land Surface Temperature from Satellite Imagery with a Novel Combined Strategy. Remote Sens. 2020, 12, 277. [Google Scholar] [CrossRef] [Green Version]
- Romaguera, M.; Vaughan, R.G.; Ettema, J.; Izquierdo-Verdiguier, E.; Hecker, C.A.; van der Meer, F.D. Detecting geothermal anomalies and evaluating LST geothermal component by combining thermal remote sensing time series and land surface model data. Remote Sens. Environ. 2018, 204, 534–552. [Google Scholar] [CrossRef]
- Crosta, A.P.; De Souza, C.R.; Azevedo, F.; Brodie, C. Targeting key alteration minerals in epithermal deposits in Patagonia, Argentina, using ASTER imagery and principal component analysis. Int. J. Remote Sens. 2003, 24, 4233–4240. [Google Scholar] [CrossRef]
- Chen, C.; Leng, C.; Si, G. Comprehensive Metallogenic Prediction Based on GIS and Analytic Hierarchy Process: A Case Study of Kumishi Region in Xinjiang. Gold Sci. Technol. 2020, 28, 213–227. [Google Scholar]

| Data Type | Maximum Spatial Resolution (m) | Acquisition Time |
|---|---|---|
| Worldview-2 | 0.5 | 29 August 2017 |
| Landsat 8 TIRS | 15 | 29 July 2018, 7 August 2018, 26 August 2019 |
| Sentinel-2 | 10 | 10 August 2019, 6 April 2020 |
| ASTER GDEM V3 | 30 | August 2019 |
| SVC HR-1024i | - | July 2019 |
| Data Type | Imaging Time | Atmospheric Transmissivity τ | Atmospheric Upward Radiation L↑(w/m2/sr/μm) | Atmospheric Downward Radiance L↓(w/m2/sr/μm) |
|---|---|---|---|---|
| Landsat TIRS10 | 7 August 2018 | 0.95 | 0.30 | 0.53 |
| 29 July 2018 | 0.92 | 0.51 | 0.87 | |
| 26 August 2019 | 0.96 | 0.24 | 0.42 |
| Wavelength (μ) | Depth | Wide | Area | Asymmetry |
|---|---|---|---|---|
| 0.40 | 47.87 | 0.37 | 18.02 | 0.78 |
| 1.92 | 30.84 | 0.20 | 6.41 | 0.84 |
| 1.42 | 10.72 | 0.12 | 1.31 | 0.61 |
| 1.66 | 4.80 | 0.07 | 0.37 | 0.81 |
| 1.28 | 0.20 | 0.02 | 0.004 | 1 |
| Lithological Category | Lithological Category (Ground Truth Data) | |||||
|---|---|---|---|---|---|---|
| Gabbro | Lujavrite | Basalt | Naujaite | Total | User Accuracy | |
| Gabbro | 134 | 4 | 9 | 8 | 155 | 86.45% |
| Lujavrite | 4 | 189 | 1 | 17 | 211 | 89.57% |
| Basalt | 13 | 0 | 94 | 9 | 116 | 81.03% |
| Naujaite | 4 | 10 | 1 | 156 | 171 | 91.23% |
| Total | 155 | 203 | 105 | 190 | 653 | |
| Producer accuracy | 86.45% | 93.10% | 89.52% | 82.11% | ||
| Abnormal Area | Maximum Surface Temperature | Minimum Surface Temperature | Average Surface Temperature |
|---|---|---|---|
| L1 | 28.51 | 15.70 | 23.85 |
| L2 | 27.08 | 14.59 | 22.76 |
| L3 | 26.32 | 16.64 | 23.24 |
| Study area | 28.51 | 1.07 | 16.85 |
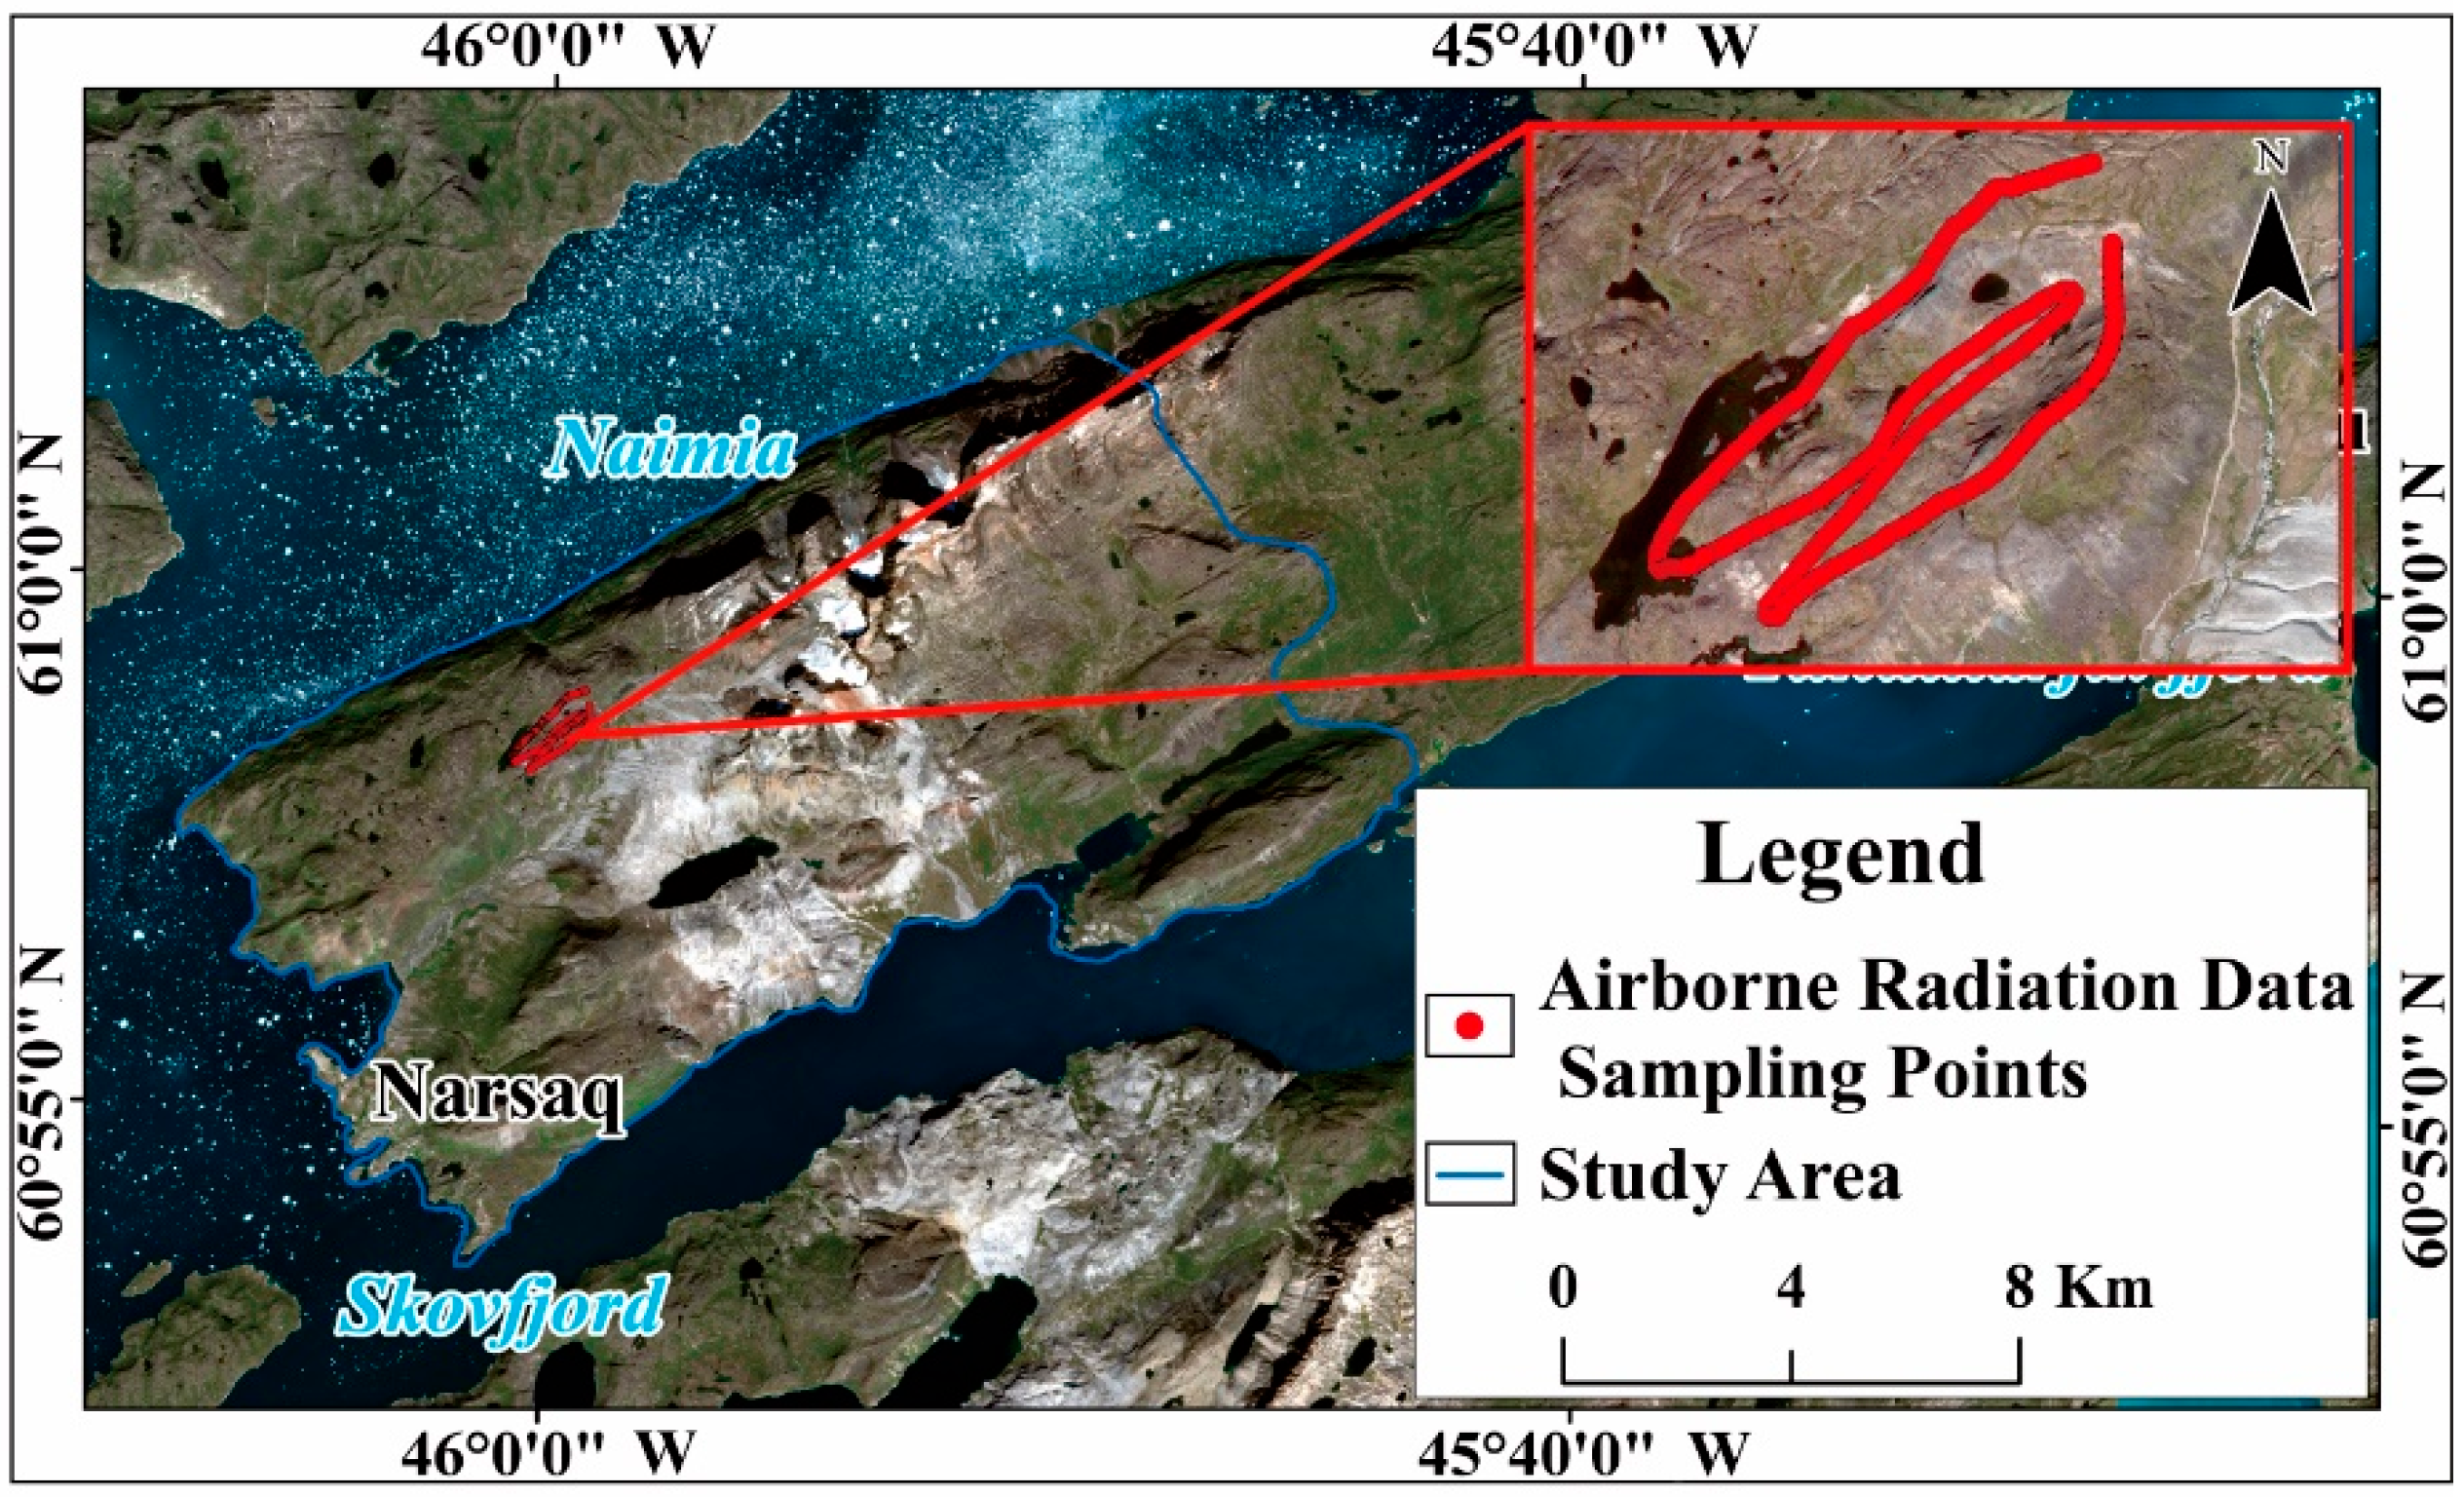
| Types | Spearman’s Correlation Coefficient |
|---|---|
| Total uranium gamma radiation | 0.63 |
| U ppm | 0.60 |
| Th ppm | 0.65 |
| Evaluation Index Layer | W+ | σ(W+) | W− | σ(W−) | C | SI | W |
|---|---|---|---|---|---|---|---|
| Thermal anomalies | 4.44 | 1.05 | −0.82 | 0.38 | 5.26 | 4.69 | 4.44 |
| SVM | 4.33 | 1.06 | −0.68 | 0.36 | 5.01 | 4.47 | 4.33 |
| Hydrothermal alteration | 3.35 | 1.15 | −0.20 | 0.28 | 3.55 | 2.98 | 3.35 |
| Structural density | 0.59 | 0.30 | −1.07 | 0.58 | 1.67 | 2.52 | 0.59 |
Publisher’s Note: MDPI stays neutral with regard to jurisdictional claims in published maps and institutional affiliations. |
© 2022 by the authors. Licensee MDPI, Basel, Switzerland. This article is an open access article distributed under the terms and conditions of the Creative Commons Attribution (CC BY) license (https://creativecommons.org/licenses/by/4.0/).
Share and Cite
He, L.; Lyu, P.; He, Z.; Zhou, J.; Hui, B.; Ye, Y.; Hu, H.; Zeng, Y.; Xu, L. Identification of Radioactive Mineralized Lithology and Mineral Prospectivity Mapping Based on Remote Sensing in High-Latitude Regions: A Case Study on the Narsaq Region of Greenland. Minerals 2022, 12, 692. https://doi.org/10.3390/min12060692
He L, Lyu P, He Z, Zhou J, Hui B, Ye Y, Hu H, Zeng Y, Xu L. Identification of Radioactive Mineralized Lithology and Mineral Prospectivity Mapping Based on Remote Sensing in High-Latitude Regions: A Case Study on the Narsaq Region of Greenland. Minerals. 2022; 12(6):692. https://doi.org/10.3390/min12060692
Chicago/Turabian StyleHe, Li, Pengyi Lyu, Zhengwei He, Jiayun Zhou, Bo Hui, Yakang Ye, Huilin Hu, Yanxi Zeng, and Li Xu. 2022. "Identification of Radioactive Mineralized Lithology and Mineral Prospectivity Mapping Based on Remote Sensing in High-Latitude Regions: A Case Study on the Narsaq Region of Greenland" Minerals 12, no. 6: 692. https://doi.org/10.3390/min12060692
APA StyleHe, L., Lyu, P., He, Z., Zhou, J., Hui, B., Ye, Y., Hu, H., Zeng, Y., & Xu, L. (2022). Identification of Radioactive Mineralized Lithology and Mineral Prospectivity Mapping Based on Remote Sensing in High-Latitude Regions: A Case Study on the Narsaq Region of Greenland. Minerals, 12(6), 692. https://doi.org/10.3390/min12060692