Article

Depositional Environment and Hydrocarbon Distribution in the Silurian–Devonian Black Shales of Western Peninsular Malaysia Using Spectroscopic Characterization

by
Monera Adam Shoieb
1,
Haylay Tsegab Gebretsadik
1,*,
Syed Muhammad Ibad
1 and
Omeid Rahmani
2
1
Southeast Asia Clastic and Carbonate Research Laboratory, Geoscience Department, Universiti Teknologi PETRONAS (UTP), Seri Iskandar 32610, Perak, Malaysia
2
Department of Natural Resources Engineering and Management, School of Science and Engineering, University of Kurdistan Hewlêr (UKH), Erbil 44001, Kurdistan Region, Iraq
*
Author to whom correspondence should be addressed.
Minerals 2022, 12(12), 1501; https://doi.org/10.3390/min12121501
Submission received: 28 September 2022 / Revised: 17 November 2022 / Accepted: 22 November 2022 / Published: 24 November 2022

Abstract

:
The present study aimed to evaluate the hydrocarbon functional groups, aromaticity degree, and depositional environment in the Silurian–Devonian Kroh black shales of western peninsular Malaysia. Fourier transform infrared spectroscopy (FTIR) was applied to measure the hydrocarbon functional groups in the sedimentary succession and associated organic matter of the black shale samples. The results showed that aromatic C=C stretching, aromatic C-H out-of-plane, aromatic C-H in-plane, and aliphatic =C–H bending are the major hydrocarbon functional groups in the Kroh shales. Also, ultraviolet-visible spectroscopy (UV-Vis) was used to evaluate the type of humic substance and analyze the sample extract ratios of E4/E6. It was revealed that the methanol-treated Kroh shale samples ranged from 0.00048 to 0.12 for E4 and 0.0040 to 0.99 for E6. The lower E4/E6 ratio (>5) indicates the dominance of humic acid over fulvic acid in the Kroh shales. The Kroh shale samples’ total organic carbon content (TOC) ranges from 0.33 to 8.5 wt.%, analyzed by a multi-N/C 3100 TOC/TNb analyzer. The comparison study revealed that the TOC content of the Kroh shale has close obtainable values for the Montney shales of Canada. Furthermore, both hydrocarbon functional groups from FTIR, and the E4/E6 ratio from UV-Vis show no correlation with TOC content. It is revealed that humic acid, aromatic, and aliphatic hydrocarbons are not the controlling factors of the enrichment of organic matter in the Kroh shales. Conversely, a positive correlation between aliphatic and aromatic hydrocarbons in the Kroh shales indicated that organic matter is thermally overmatured. The presence of humic acid and enrichment of aromatic hydrocarbons in the Kroh shales demonstrated that the organic matter in these shales contains plant-derived hydrophilic minerals, i.e., terrestrial in origin. These findings may provide clues on the depositional and thermal maturation of organic matter for the exploration efforts into the pre-Tertiary sedimentary successions of the peninsular.

1. Introduction

Many studies have shown that the characterization of organic-rich sedimentary successions is a must-have step in looking into the fundamental properties affecting the concentration of aromatic hydrocarbons and their correlation with the total organic carbon (TOC) content of the sediments [1,2,3]. Fourier transform infrared spectroscopy (FTIR) is a frequently used technique to differentiate the hydrocarbon functional groups in shale and coal [4]. The functional groups of aromatic and aliphatic hydrocarbons are potent tools for evaluating the origin, richness, and for interpretation of depositional environments. The aromatic and aliphatic hydrocarbons are determined through the vibrational characteristics of their structural and chemical bonds. The use of Attenuated Total Reflection (ATR) accessories to enhance the surface sensitivity by using tough crystals (such as germanium, silica, zinc selenide, and diamond) characterized by their range of hardness values and optical properties has further advanced the use of FTIR in soils, shale, and coal materials [5]. Dilution with KBr is no longer necessary, reproducibility is increased, and the non-destructive nature of this analysis allows the sample to be re-used for other analyses. Like FTIR, UV-Vis is increasingly employed for in-field applications [6], for laboratory studies of crude oils, and in determining the type of humic substance [7]. For the organic chemist, UV-Vis is mainly concerned with conjugated systems with electronic transitions; the intensities and positions of the absorption band largely depend on the specific system under consideration [8].
Alkyl naphthalenes are widespread and constitute geological and geochemical materials. They are commonly found in oil and several types of sedimentary rocks, including shales and coals [9]. It has been suggested that alkyl naphthalenes are derived mainly from the de-functionalization of terpenoids; hence, they have the potential to provide information about their precursor, as well as the depositional environment [10].
Spectroscopic methods such as ATR-FTIR and UV-Vis have been used to evaluate the liquid petroleum yield of hydrocarbon source rocks for correlation of source and tracing migration paths [11,12]. Therefore, in this study, FTIR and UV-Vis are used to identify aromatic hydrocarbons such as alkyl naphthalenes, aliphatic hydrocarbons, and humic substances of Silurian–Devonian Kroh shales from peninsular Malaysia. The spectroscopic analysis is used to evaluate the origin of organic matter in the source or reservoir rocks, which have received little attention to date. Therefore, the objective of the present study is to use spectroscopic analysis to obtain the hydrocarbon distribution and humic substance type, which will determine the shale’s source and depositional environment of organic matter. Furthermore, the effect of TOC on hydrocarbon functional groups and humic acid is also being investigated to determine the controlling factor for the enrichment of the organic matter in the Kroh shales from western peninsular Malaysia.

2. Study Area

Peninsular Malaysia is situated at the southernmost tip of the Asian mainland, and it shares borders with Thailand in the north, Singapore in the south, the South China Sea in the east, and the Straits of Malacca in the west (Figure 1). The peninsula covers a total area of 130, 268 km2, and forms part of Sundaland and the shallow seas from which several smaller islands emerge. It is elongated in an NNW-SSE direction and characterized by a dense network of streams and rivers that expose Paleozoic rocks [13,14].
Most of Malaysia’s Paleozoic rocks are in peninsular Malaysia and account for about 25% of the land-based portion [15]. The Kroh Formation is situated in the Western Belt of peninsular Malaysia, about 34 kilometers north of Gerik along the Malaysia-Thailand frontier (Figure 2). The locality has three main formations: the Kroh, the Kati, and the Nenering Tertiary. The Kroh Formation is widespread in north Perak and extensively accessible in Pengkalan Hulu, Kelian Intan, and Kerunai. It is comprised of black shale, sub-mature arenite, chert, limestone, and calcareous shale (Figure 1). This study is mainly focused on shale samples of the Kroh Formation. They date to the upper Silurian lower Devonian period. The samples were obtained from seven outcrops in the Gerik area (Figure 2).
Figure 1. Simplified geological map of peninsular Malaysia; adopted from [16] with Elsevier’s License Number 5397511182486.
Minerals 12 01501 g001

3. Materials and Methods

3.1. Sampling

Seventy-three representative samples were taken from the Gerik area, upper Perak (Figure 2). The outcrop samples were obtained using a channel-profile sampling strategy, and freshly exposed faces were chosen to prevent inclusion of weathered and oxidized materials. All shale samples were analyzed for TOC, while fifty-six were studied for hydrocarbon functional groups. Thirty-three samples were analyzed for humic and fulvic acid content.

3.2. Fourier-Transform Infrared Spectroscopy (FTIR)

Infrared (IR) is part of the electromagnetic radiation between the visible region’s high-frequency end and the microwave region’s low-frequency end. FTIR is based on the principle that covalent bonds have resonating frequencies in the mid-infrared region (4000 cm−1 to 400 cm−1) at which they vibrate, and these frequencies depend on the bond type and the bonded atoms [18]. For the past few decades, FTIR has been extensively used to assess hydrocarbon bonds in geological samples such as shale, coal, silicate glass, and microfossils to identify and characterize clays and other minerals [19,20]. The spectra generated from the FTIR analysis in this study were interpreted based on studies by Coates [21] and Stuart [22].
FTIR was used to determine the distribution of hydrocarbon functional groups and the differences in the composition of the studied shale samples. The Kroh shale samples were analyzed using Shimadzu 8400S Fourier-transform infrared (FTIR) spectroscopy (Shimadzu, Kyoto, Japan). An Attenuated Total Reflection (ATR) was attached to the machine, allowing the sample to be analyzed quickly and directly. About 2 mg of the samples were scanned over a wavelength of 400–4000 cm−1, collecting 32 scans at a resolution of 8 cm−1. The limit of detection of the instrument was 0.08%. Background scans were collected using the same settings as the sample analyses. Replicate spectra collected on selected samples showed consistent peak positions and absorbance intensities. The data collected was further analyzed using Essential FTIR software (Monona, WI, USA). The area percentage of hydrocarbon functional groups was calculated by summing the absorbance intensities between the respective wavelengths [23]. The absorbance of hydrocarbon functional groups in all Kroh shale samples has been calculated by using Essential FTIR software.

3.3. Ultraviolet-Visible Spectroscopy (UV-Vis)

The Ultraviolet-Visible Spectrum (UV-Vis) is obtained using a diluted sample solution in a glass tube (cuvette). The sides of the cuvette are 1 cm, and the overall volume is 2–3 cm3. UV or visible light should pass through the sample, and the transmitted light intensity is recorded across the wavelength spectrum of the instrument. The UV-Vis analysis for this study focused primarily on the E4/E6 ratio. The ratio of optical densities or absorbance of dilute aqueous humic acid and fulvic acid solutions using the UV-Vis techniques at 465 nm and 665 nm is commonly used in the characterization of organic matter in soil science [24]. UV-Vis spectroscopy (Chongqing Gold Mechanical & Electrical Equipment Co. Ltd., Chongqing, China) was used to analyze the sample extracts to identify their E4/E6 ratios. Two fundamental wavelengths widely used to describe the humic matter for one-dimensional UV-Vis are 465 nm and 665 nm [7,24,25].
Each black shale sample weighed two grams and was put into a glass flask with a cap. The samples were then subjected to three consecutive extractions using 8 mL of methanol, 3 min of ultrasonic stirring by Thornton Unique 1450USC ultrasonic cleaner (Santa Cruz County, CA, USA), and 5 min of centrifugation at 2500 rpm by Janetzk T23 centrifuge (Hein Janetzk KG, Engelsdorf Leipzig, Germany). The methanol extract solution was analyzed using a Lambda 750 UV Vis Spectrophotometer (Perkin Elmer, NJ, USA) with liquid samples placed in quartz cells. This spectrophotometer is equipped with a tungsten lamp and a D2 lamp to provide the radiation source. The scanning wavelength ranged from 200–800 nm.

3.4. Total Organic Carbon (TOC)

Total organic carbon (TOC in wt. %) content is a significant parameter that has been used to assess the amount of organic matter and hydrocarbon generation potential of the source rock [26]. Representative black shale samples were analyzed using a Multi N/C 3100 TOC/TNb analyzer (Analytik Jena GmbH, Jena, Germany) at Core Laboratories Malaysia Sdn Bhd (Perak, Malaysia), using the direct approach suggested by Dow and Pearson [27]. The TOC measurement was performed on fresh near-surface samples, implying a loss of organic content due to thermal degradation; weathering; and biodegradation. The samples have been pulverized using an automated grinding machine. About 3 g of each pulverized sample was pre-treated with a concentration of 37% hydrochloric acid by 10% to remove the inorganic carbon fraction from the samples, which might have come from carbonate minerals. It was then left for 12 h in the fume chamber before being rinsed three times with reverse osmosis water and then dried for 24 h in the oven at 60 °C. 60 mg of the sample was weighed after drying and placed on a ceramic boat. Measurements were run in duplicate, and the results were averaged. The residual material was heated to temperatures exceeding 850 °C to determine the TOC by combustion analysis. Analysis of the organic matter content in this study has been used as an implication for petroleum exploration.

4. Results

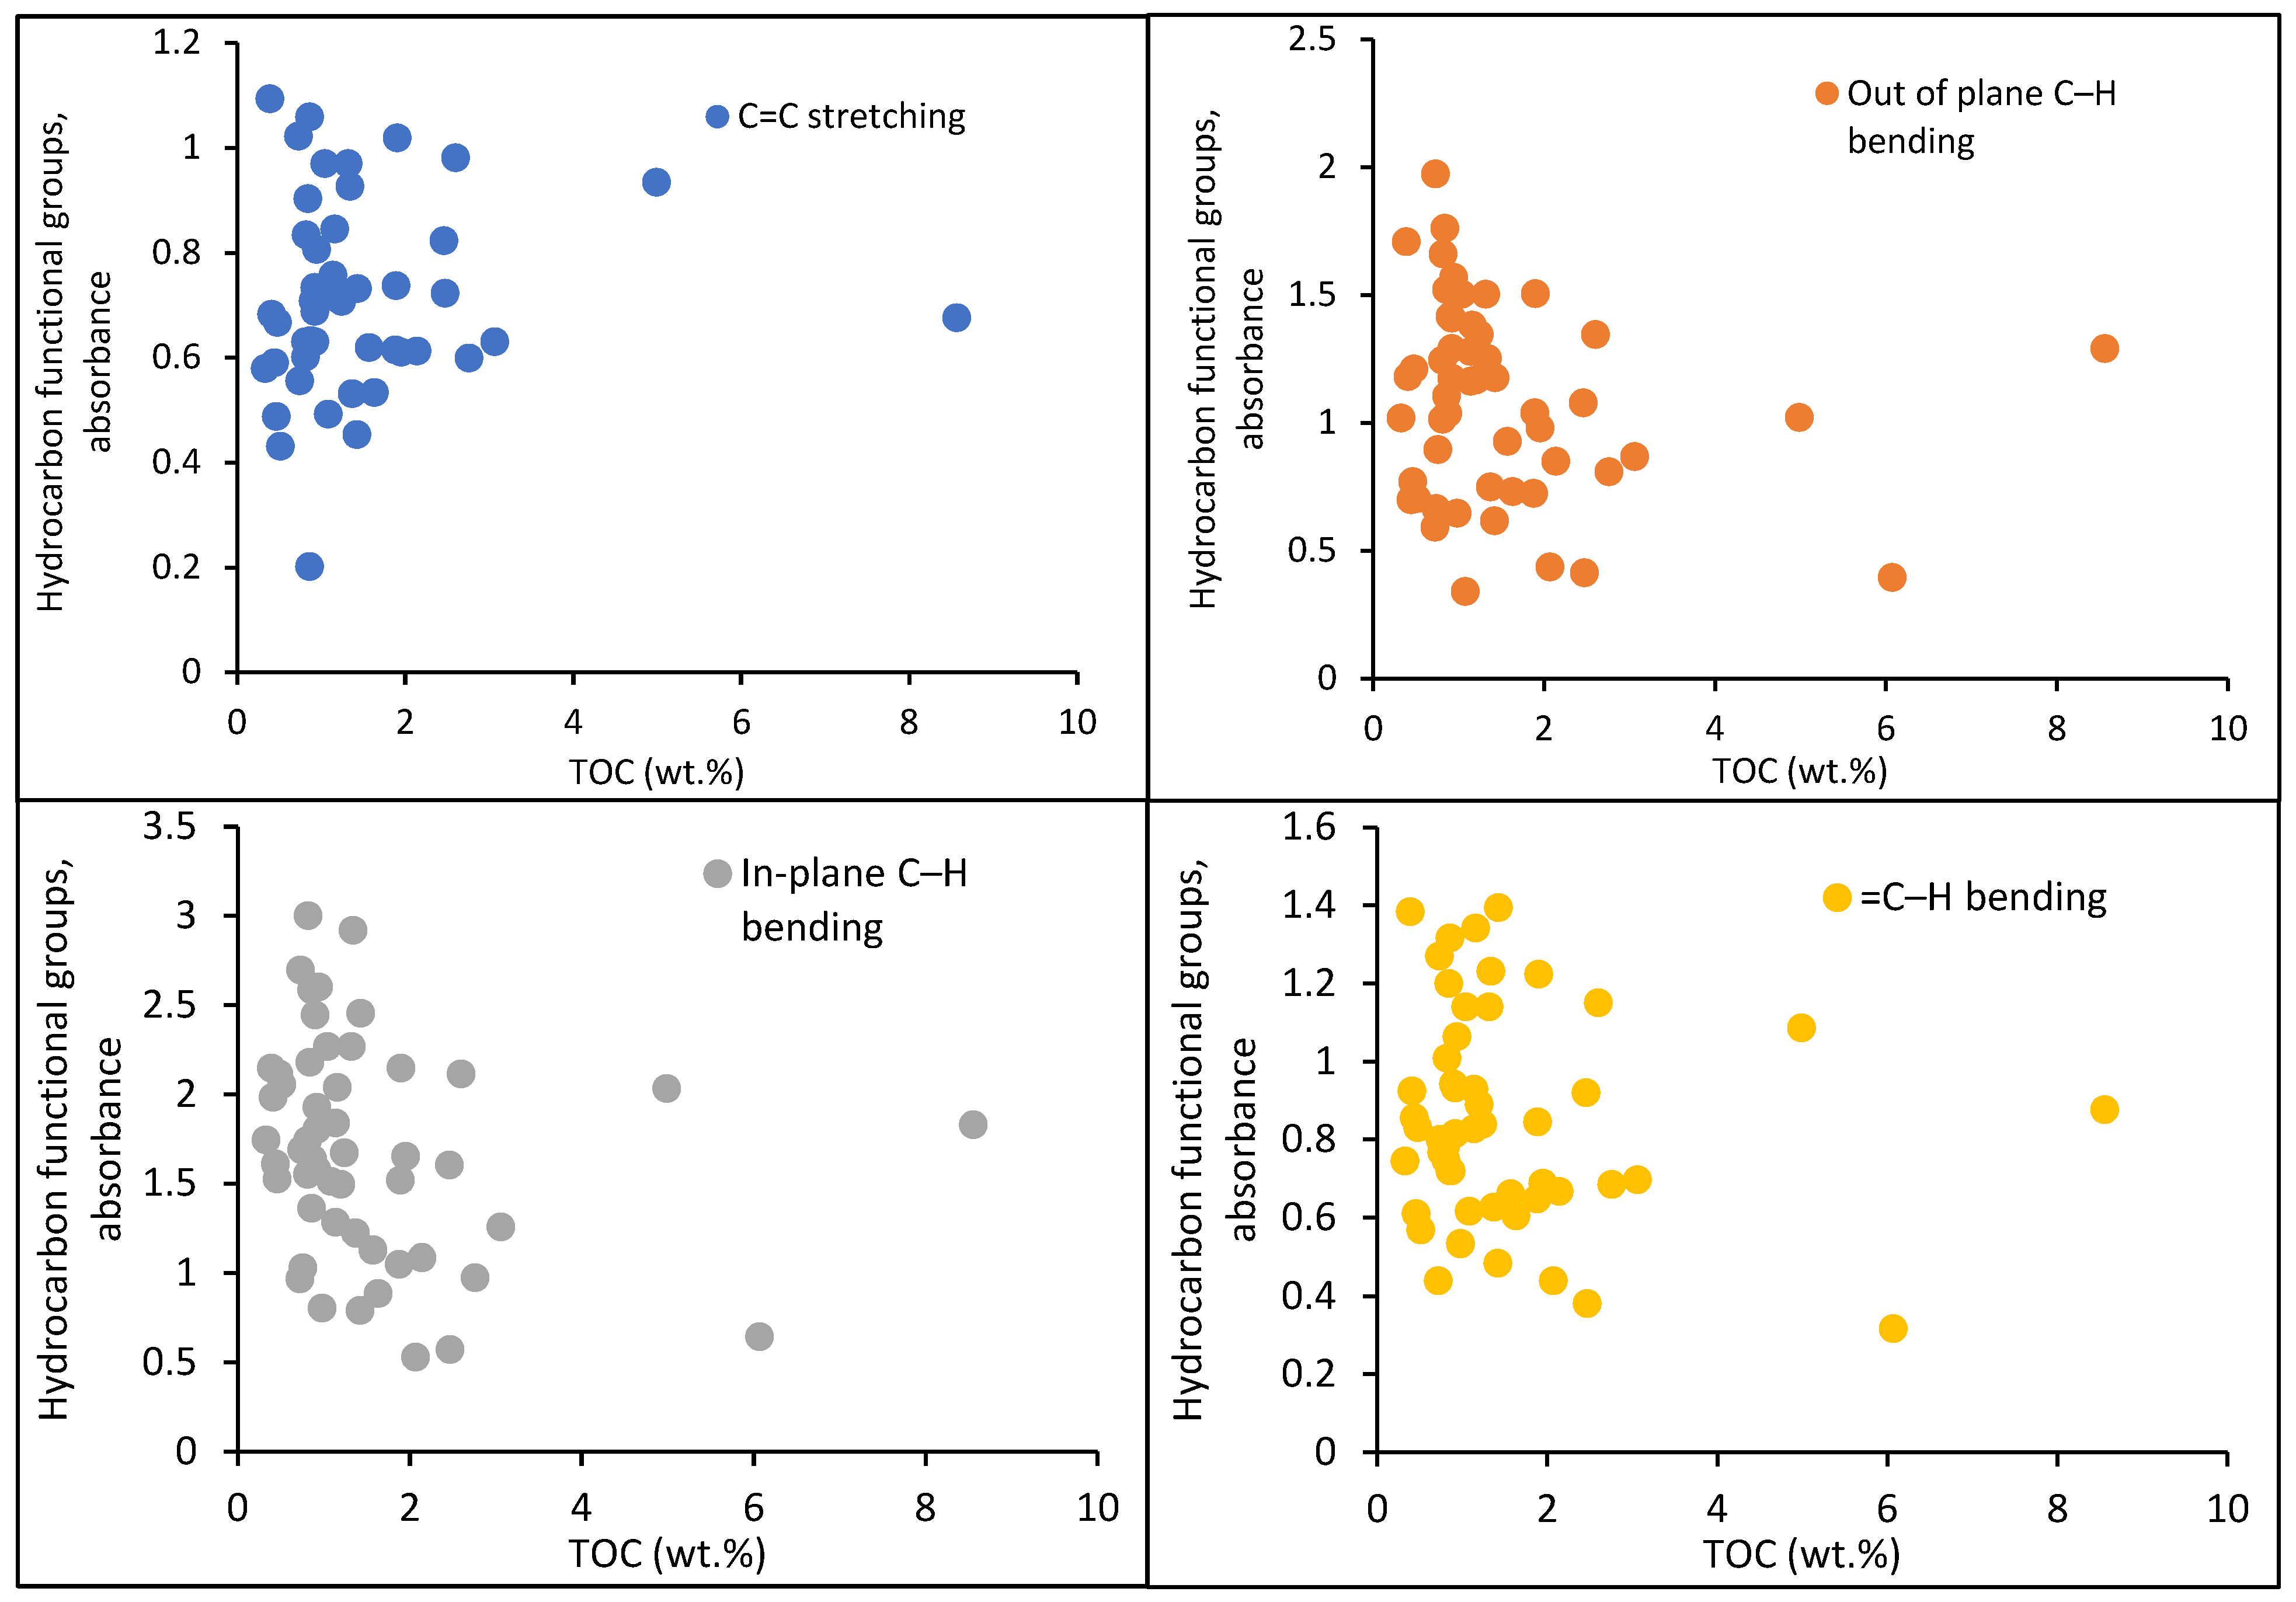
4.1. Hydrocarbon Functional Groups

The infrared spectral analysis of the samples was obtained using the method described in Section 3.1. Figure 3 shows the absorption spectra from the representative shale samples, and each absorption band represents the presence of a functional group. As shown in Figure 3, six aromatic hydrocarbon peaks are observed in the 500–2000 cm−1 absorption band. There are four additional peaks in the range of 670–900 cm−1, which are representative of aromatic C-H out-of-plane bend, and the other two peaks in the absorption band of 950–1225 cm−1 are assigned as aromatic C-H in-plane bend. Alkyl naphthalenes (pentylnaphthalenes) are also confirmed by the presence of two strong and two weak bands in the C-H out-of-plane bend (700–900 cm−1) vibration region [28]. These are 694 cm−1 (w), 779 cm−1 (s), 797 cm−1 (s), and 827 cm−1 (w). One aliphatic hydrocarbon peak is detected in the 600–700 cm−1, region, which is representative of alkyne =C–H bending. Two ATR diamond peaks are observed at 2300–2400 cm−1, while two peaks of OH compounds are found at 3600–3800 cm−1.
Table 1 and Figure 4 represent hydrocarbon functional groups (avg.) from an FTIR analysis for each shale sample.

4.2. Distribution of E4 and E6

The ratio of aliphatic to aromatic compounds in the rocks has been determined by calculating the E4/E6 ratio of extracts from the samples. E4 was determined at an absorption frequency of 465 nm and E6 at 665 nm. Figure 5 represents the spectroscopic UV-visible ratio (E4/E6) results of Kroh black shale samples. The E4 treated with methanol ranges from 0.00048 to 0.12, while the value of E6 ranges from 0.0040 to 0.99 in the Kroh black shale samples. The E4/E6 values range from 0.008 to 8.1, while 3.4 is the average for the studied samples.

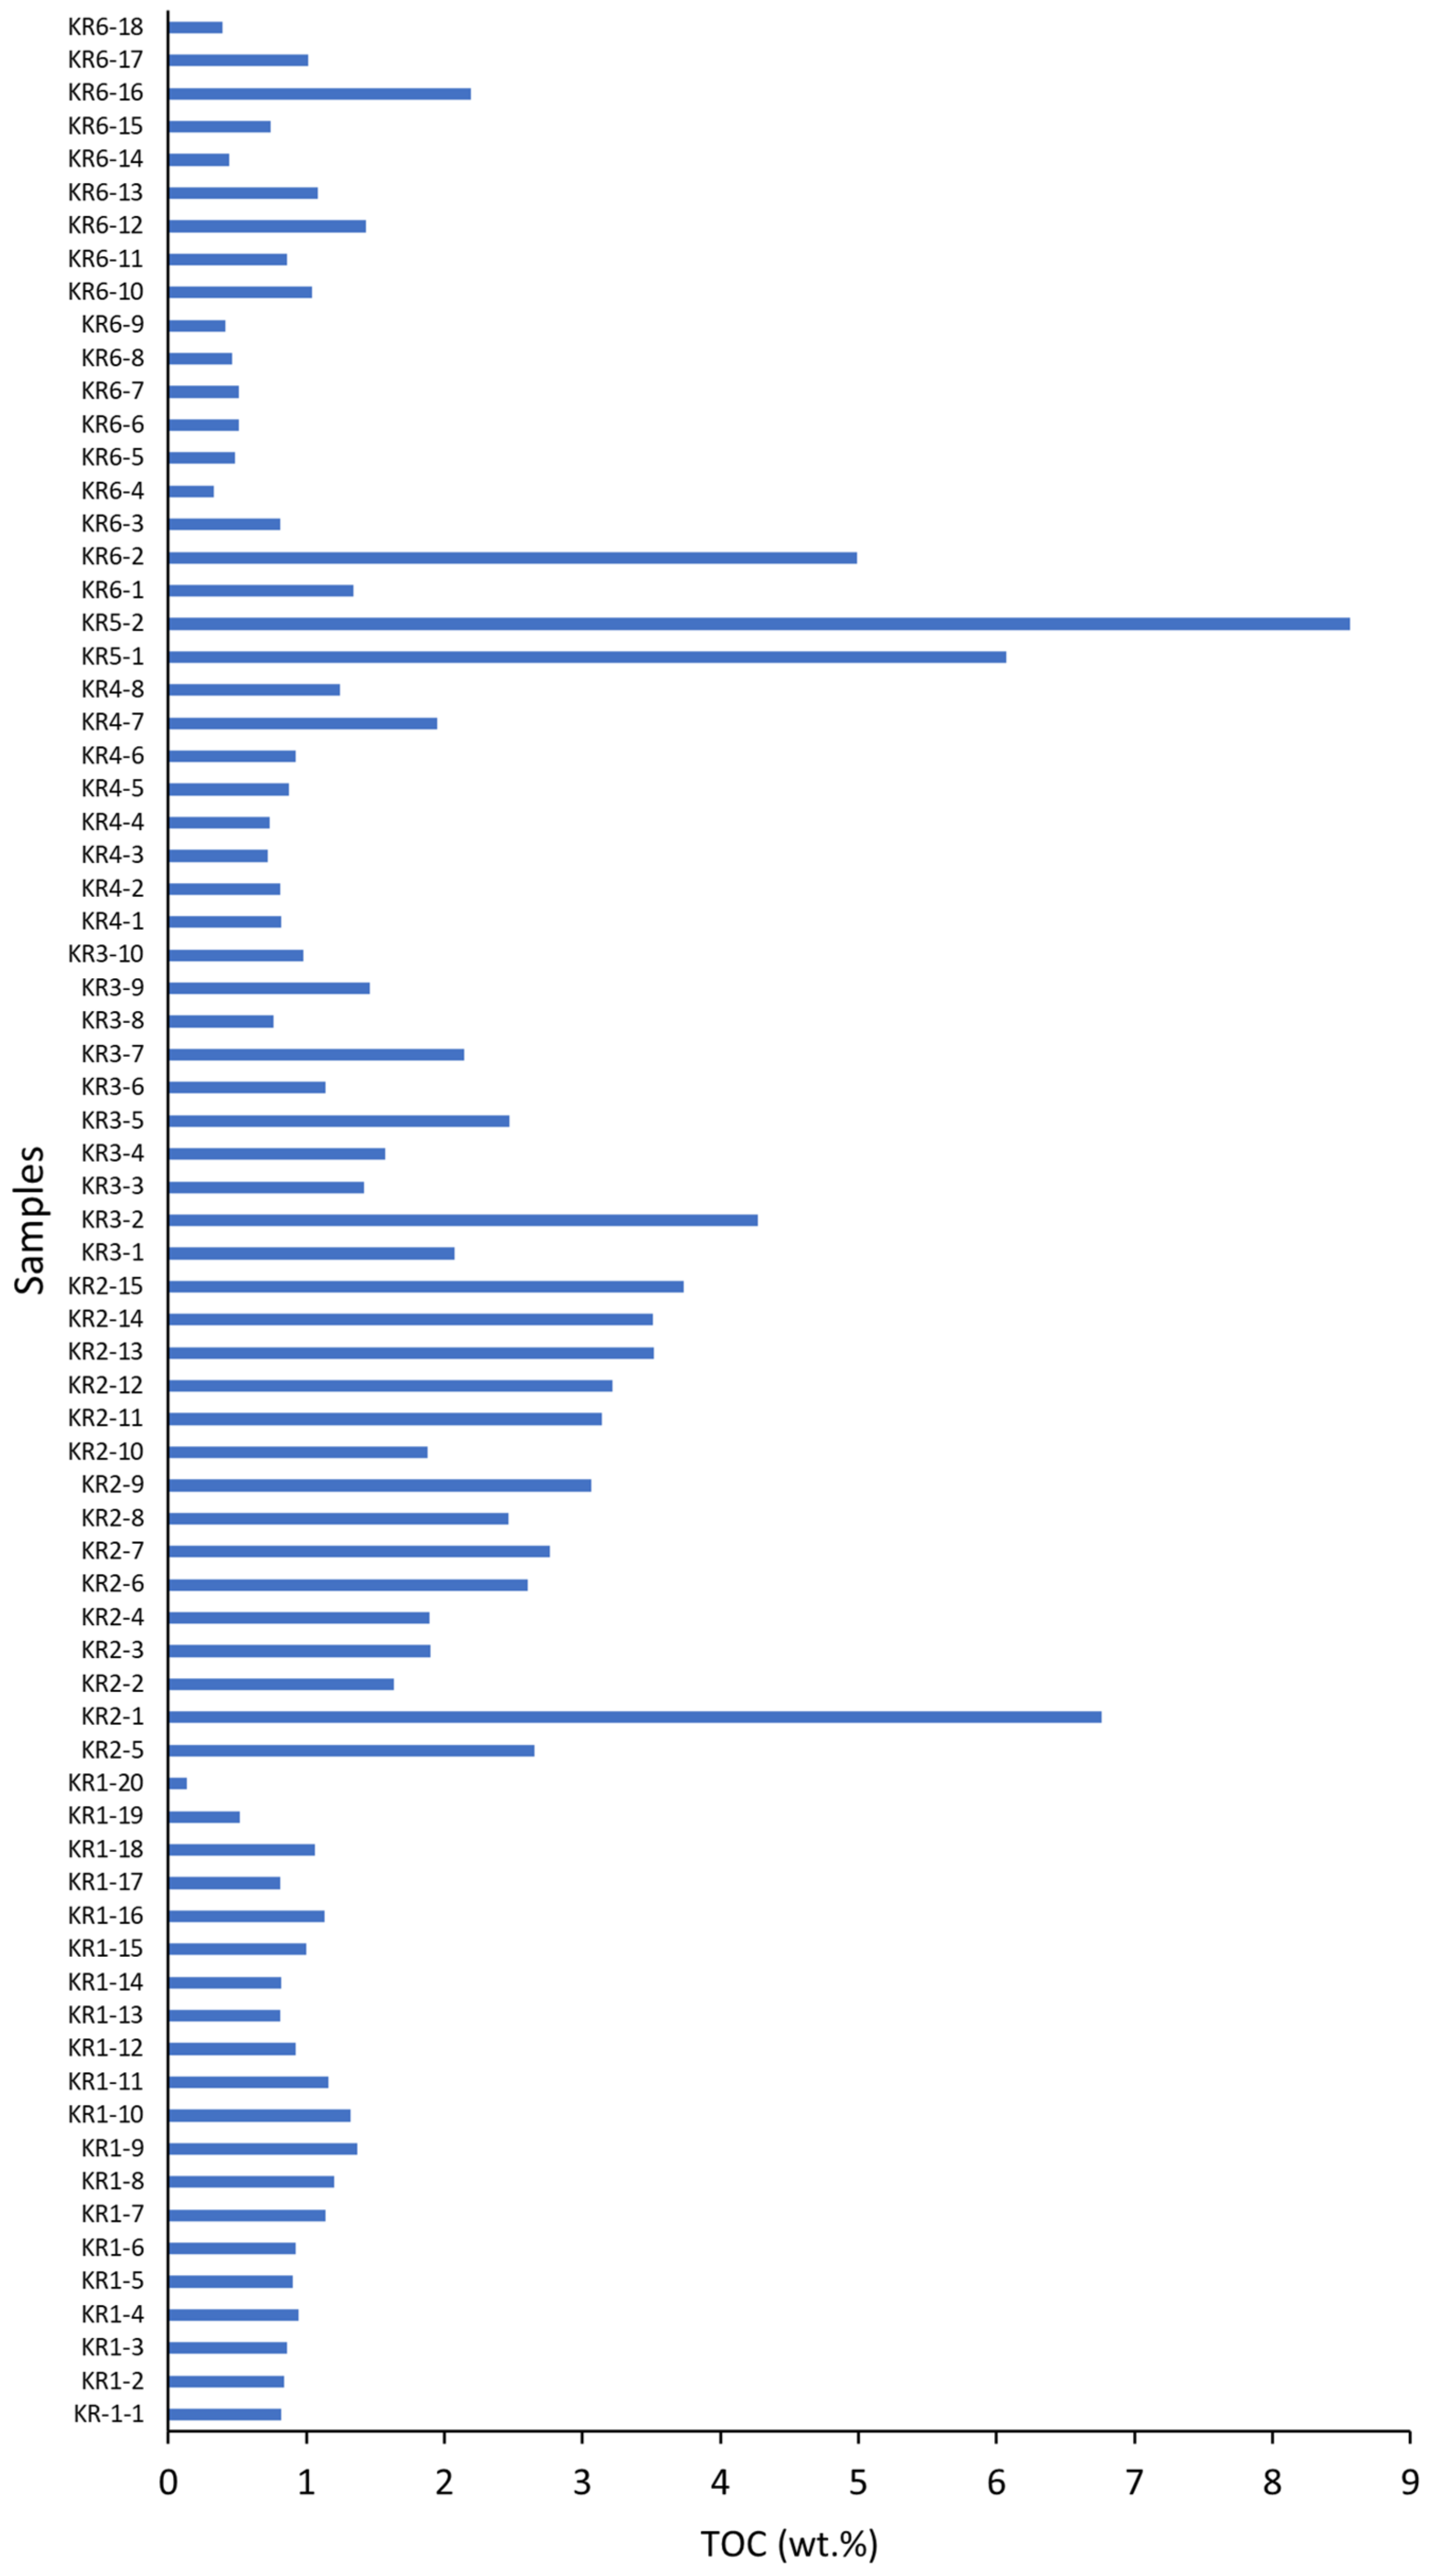
4.3. Total Organic Carbon (TOC)

Representative samples from the seven different outcrops in the Kroh Formation were analyzed using a total organic carbon analyzer. Figure 6 presents the measured total organic carbon (TOC) values of the analyzed samples of black shale. The TOC present in black shale samples is high, ranging from 0.33 wt.% to 8.58 wt.%, with an average of 1.71 wt.%.

5. Discussion

5.1. Hydrocarbon Functional Groups Distribution

The FTIR analysis was conducted to determine the compositional variations in hydrocarbon functional groups in the black shale. Under IR radiation, the absorbency of molecular vibrations was proportional to the abundance of the functional groups. The maximum height frequently determines the integrated area between the baseline and a peak or the absorbance for each band of molecular vibration. In geology, FTIR deals with the MIR (mid-infrared region) of light between 4000 cm−1 to 500 cm−1. Under the radiation of IR, the molecular vibration absorbances were proportional to the functional group’s abundance. The maximum height is determined by the integrated area between the baseline and a peak or the absorbance for each band of molecular vibration.
The FTIR spectra of different shale exhibited similar absorption bands and characteristic absorption peaks based on the vibration of the atoms in a molecule. The spectrum obtained depends on the fraction of the incident radiation absorbed in particular energy. The C-H functional group for aromatic compounds appears to be different in its absorption, with different members suggesting the different concentrations of these compounds in the samples. According to Stuart [22], the differences in peak absorbance were a sign of the variation in the available group quantity, and higher peak intensities display a higher amount in the samples. There was no dominant peak in the 2800–3200 cm−1 range in the Kroh shale FTIR spectra (Figure 3), which is associated with an aliphatic hydrocarbon functional group [21]. It was observed that all Kroh shale samples had a high concentration of aromatic C-H out-of-plane and C-H in-plane compared to aromatic C=C stretching and aliphatic =C–H bending (see Table 1 and Figure 4).
The processes controlling the level of aromatic and aliphatic hydrocarbons in shales are complex. Key factors that may influence it are: (1) the sediment’s composition, i.e., clay and TOC content; (2) patterns of the sedimentary depositional environment; and (3) the chemical properties of the compounds, particularly their water solubility [29,30].
We have investigated the effect of the aliphatic hydrocarbon functional group on aromatic hydrocarbon functional groups. As shown in Figure 7, the aliphatic hydrocarbons of shale samples from the Kroh Formation display a strong positive relationship (i.e., R2 = 0.82) with all three aromatic hydrocarbon functional groups. The relative increase in the proportion of naphthenic and aliphatic hydrocarbons to aromatic hydrocarbons might have happened because of organic matter thermal maturity. Similar findings were reported by [31,32]. Our recent study also supports this interpretation of thermal over-maturity by employing Rock-Eval pyrolysis and vitrinite reflectance of the Kroh shale samples [15].

5.2. Relationship of TOC with Functional Groups

Total organic carbon (wt.%) content is a significant parameter used to assess the amount of organic matter and hydrocarbon generation potential of source rocks [26]. Analysis of the organic matter content in this study has been used as an implication for petroleum exploration. The TOC values of Silurian–Devonian Kroh shales (TOC = 1.71 wt.%) are remarkable and similar to hot shales from China (Longmaxi shale, TOC = 2.32 wt.%) and Canada (Montney shales, TOC = 2.64 wt.%), and close to Muskwa, Besa and Fort Simpson Canada (Devonian–Mississippian shales, TOC = 1.39 wt.%) and El Sebaiya Egypt (Duwi Formation, TOC = 1.4 wt.%) (Table 2).
Many studies have shown that TOC is one of the critical properties affecting the concentration of aromatic hydrocarbons in sediments [40]. They have shown a positive correlation between aromatic hydrocarbons and total organic carbon (TOC) content in sediments [41]. Therefore, the effect of TOC on aromatic and aliphatic hydrocarbons was investigated in this study. The absorbance of aromatic C=C stretching, aromatic C-H out-of-plane, aromatic C-H in-plane, and aliphatic =C–H bending was plotted vs. TOC to find any existing relationship (Figure 8). There was no correlation found between TOC and hydrocarbon functional groups, as the Kroh shale is overmature and its organic matter content has been exhausted due to the thermal maturity and the generation of hydrocarbons [42]. This might suggest that black shale, which is enriched in organic matter and mature enough to produce conventional oil and gas, has a more powerful absorption of aromatic hydrocarbon functional groups. Further investigation could be initiated with high TOC shale samples to understand this relationship better.

5.3. Hydrocarbon Compound Characterization Using E4/E6

The E4/E6 ratio is inversely related to the degree of condensation and the aromaticity of the humic substances and their degree of humification [43]. It is suggested that the values of the relationship E4/E6 for humic acid are smaller than 5.0 and between 6.0 and 8.0 for fulvic acids [43]. Most of the Kroh shale samples show an E4/E6 ratio lower than 5, indicating that the presence of humic acid dominates organic matter in the Kroh shale.
The E4 versus E6 plot for samples from the Kroh Formation black shales shows a weak relationship between the two parameters (Figure 9A). This correlation between E4 and E6 indicates that the supply of organic matter is not consistent in the environment throughout the deposition phase. A lower E4/E6 ratio evidenced a higher degree of aromaticity of humic acid in shale averaging 3.4 in the Kroh Formation. The E4/E6 ratio indicates the type and quality of humic matter [24]. The effect of TOC on the E4/E6 ratio was also investigated (Figure 9B). As humic acid is one of the components of organic matter, there might be a possibility that the abundance of humic acid could control the organic matter present in the Kroh shale. However, no correlation existed between the TOC and E4/E6 ratio (Figure 9B), indicating that humic acid alone is not the controlling factor of organic matter in the Kroh shale. Some other organic matter constituents also control the organic matter richness.

5.4. Depositional Environment of Organic Matter

Humic acid is one of the organic constituents of oil shale. It has been a major kerogen precursor, which can be a significant petroleum precursor. A large amount of humic acid was deposited in shale by the death of thick growth of vegetation; it then accumulated in large piles, which were then buried by rock and mudflows, as well as deposits of sand and silt. The weight of the overflow compacted or compressed out all of the moisture, and what remains today is a deposit of dried, prehistoric plant derivatives. As discussed in Section 4.2, only seven samples (21%) showed an E4/E6 ratio greater than 5 out of 33 studied samples, which showed the abundance of humic acid. Therefore, the presence of humic acid in the Kroh shale indicates that these shales contain plant-derived hydrophilic minerals which are exceedingly small compared to metallic minerals from the ground-up rocks and soil.
Some of the aromatic compounds found in crude oil and sediments are believed to have been derived from a modification of biologically produced compounds such as steroids and terpenoids. Steroids give rise to substituted phenanthrenes, and terpenoids produce alkyl naphthalenes. The processes by which higher plant triterpenoids in sediments are converted into aromatic hydrocarbons have been proposed to commence with the loss of the C-3 oxygen functionality, followed by sequential aromatization from the A ring through to the E ring. Therefore, this process’s ultimate products would be tetracyclic and pentacyclic aromatic hydrocarbons [44]. Alkyl naphthalenes are derived from various precursor compounds, and their composition changes with increasing thermal maturity [45,46,47]. However, alkyl naphthalenes are often abundant in oils and sedimentary organic matter that have undergone biodegradation or thermal cracking. Alkyl naphthalenes occur in terrestrial oils and rocks in higher concentrations than in marine oils and rocks, suggesting that their sourcing is mainly from terrestrial organic matter [48]. As discussed in Section 4.1, the Kroh shale samples comprise alkyl naphthalenes, which shows that the organic matter in these samples belongs to the terrestrial source. This interpretation is also supported by the presence of humic acid in the Kroh shales, as discussed above.

6. Conclusions

The FTIR spectra results of the Kroh shale samples exhibited aromatic C=C stretching, aromatic C-H out-of-plane, aromatic C-H in-plane, and aliphatic =C–H bending hydrocarbon functional groups. The increment of the aliphatic hydrocarbon functional group with the aromatic hydrocarbon functional group indicates that the shale samples are thermally overmature. The absence of a correlation between TOC, aromatic, and aliphatic hydrocarbon functional groups indicates that the organic matter content of the Kroh shale has been exhausted due to thermal maturity and the generation of hydrocarbons in the past. The E4, E6, and E4/E6 ratios indicate that organic matter in the Kroh shale is rich in humic acid as compared to fulvic acid. The relationship of TOC with the E4/E6 ratio indicates that the enrichment of organic matter in the Kroh shale was not controlled by humic acid alone; however, it might be influenced by other constituents of organic matter for the organic matter richness. The depositional environment of organic matter in the Kroh shale was also investigated by hydrocarbon functional groups and the E4/E6 ratio. The abundance of aromatic hydrocarbon functional groups such as alkyl naphthalenes and humic acid indicates that the organic matter in these shales is terrestrial and contains plant-derived hydrophilic minerals.

Author Contributions

All authors have contributed to writing and editing this article. Writing original draft preparation, M.A.S. and H.T.G.; supervision, H.T.G.; writing—review and editing, O.R. and S.M.I.; Visualization, O.R. All authors have read and agreed to the published version of the manuscript.

Funding

The authors would like to acknowledge the financial support the PRF (Petroleum Research Fund) project “Advanced shale Gas Extraction Technology Using Electrochemical Methods” with Research Grant: (0153AB-A33) and Research Grant: YUTP-FRG (015LC0-325).

Data Availability Statement

Not applicable.

Conflicts of Interest

The authors declare no conflict of interest.

References

  1. Myers, K.J.; Wignall, P.B. Understanding Jurassic organic-rich mudrocks—New concepts using gamma-ray spectrometry and palaeoecology: Examples from the Kimmeridge Clay of Dorset and the Jet Rock of Yorkshire. In Marine Clastic Sedimentology; Leggett, J.K., Zuffa, G.G., Eds.; Springer: Dordrecht, The Netherlands, 1987. [Google Scholar] [CrossRef]
  2. Owusu, E.B.; Tetteh, G.M.; Asante-Okyere, S.; Tsegab, H. Error correction of vitrinite reflectance in matured black shales: A machine learning approach. Unconv. Resour. 2022, 2, 41–50. [Google Scholar] [CrossRef]
  3. Tourtelot, H.A. Black shale—Its deposition and diagenesis. Clays Clay Miner. 1979, 27, 313–321. [Google Scholar] [CrossRef]
  4. Naumann, D.; Meyers, R. Encyclopedia of Analytical Chemistry; John Wiley Sons: Chichester, UK, 2000; pp. 102–131. [Google Scholar]
  5. Artz, R.R.E.; Chapman, S.J.; Robertson, A.H.J.; Potts, J.M.; Laggoun-Défarge, F.; Gogo, S.; Comont, L.; Disnar, J.-R.; Francez, A.-J. FTIR spectroscopy can be used as a screening tool for organic matter quality in regenerating cutover peatlands. Soil Biol. Biochem. 2008, 40, 515–527. [Google Scholar] [CrossRef]
  6. Yokota, T.; Scriven, F.; Montgomery, D.S.; Strausz, O.P. Absorption and emission spectra of Athabasca asphaltene in the visible and near ultraviolet regions. Fuel 1986, 65, 1142–1149. [Google Scholar] [CrossRef]
  7. Evdokimov, I.N.; Losev, A.P. Potential of UV-visible absorption spectroscopy for characterizing crude petroleum oils. Oil Gas Bus. 2007, 1, 1–21. [Google Scholar]
  8. Eglinton, G. Applications of infrared spectroscopy to organic chemistry. In An Introduction to Spectroscopic Methods for the Identification of Organic Compounds: Nuclear Magnetic Resonance and Infrared Spectroscopy; Pergamon: Oxford, UK, 1970; pp. 123–143. [Google Scholar] [CrossRef]
  9. Radke, M.; Rullkötter, J.; Vriend, S.P. Distribution of naphthalenes in crude oils from the Java Sea: Source and maturation effects. Geochim. Cosmochim. Acta 1994, 58, 3675–3689. [Google Scholar] [CrossRef]
  10. Bastow, T.P.; Alexander, R.; Fisher, S.J.; Singh, R.K.; van Aarssen, B.G.K.; Kagi, R.I. Geosynthesis of organic compounds. Part V—Methylation of alkylnaphthalenes. Org. Geochem. 2000, 31, 523–534. [Google Scholar] [CrossRef]
  11. Evdokimov, I.N.; Eliseev, N.Y.; Akhmetov, B.R. Assembly of asphaltene molecular aggregates as studied by near-UV/visible spectroscopy: II. Concentration dependencies of absorptivities. J. Pet. Sci. Eng. 2003, 37, 145–152. [Google Scholar] [CrossRef]
  12. Maciel, G.E.; Bartuska, V.J.; Miknis, F.P. Correlation between oil yields of oil shales and 13C nuclear magnetic resonance spectra. Fuel 1978, 57, 505–506. [Google Scholar] [CrossRef]
  13. Hutchison, C.S.; Tan, D.N.K. Geology of Peninsular Malaysia; The University of Malaya, The Geological Society of Malaysia: Kuala Lumpur, Malaysia, 2009; p. 479. [Google Scholar]
  14. Gebretsadik, H.T.; Sum, C.W.; Talib, J.A. Lithostratigraphy of Paleozoic Carbonates in the Kinta Valley, Peninsular Malaysia: Analogue for Paleozoic Successions; ICIPEG 2016; Springer: Singapore, 2017; pp. 559–567. [Google Scholar]
  15. Shoieb, M.A.; Gebretsadik, H.T.; Rahmani, O.; Ismail, M.S.; Ibad, S.M. Geochemical characteristics of the Silurian-Devonian Kroh black shales, Peninsular Malaysia: An implication for hydrocarbon exploration. J. Geochem. Explor. 2022, 232, 106891. [Google Scholar] [CrossRef]
  16. Metcalfe, I. Tectonic evolution of the Malay Peninsula. J. Asian Earth Sci. 2013, 76, 195–213. [Google Scholar] [CrossRef]
  17. Group, M.-T.W. Geology of the Pengkalan Hulu-Betong transect area along the Malaysia-Thailand border. Geol. Pap. 2009, 7, 1–84. [Google Scholar]
  18. Griffiths, P.R. Fourier transform infrared spectrometry. Science 1983, 222, 297–302. [Google Scholar] [CrossRef] [Green Version]
  19. Chen, Y.; Zou, C.; Mastalerz, M.; Hu, S.; Gasaway, C.; Tao, X. Applications of micro-fourier transform infrared spectroscopy (FTIR) in the geological sciences—A review. Int. J. Mol. Sci. 2015, 16, 30223–30250. [Google Scholar] [CrossRef]
  20. McKelvy, M.L.; Britt, T.R.; Davis, B.L.; Gillie, J.K.; Lentz, L.A.; Leugers, A.; Nyquist, R.A.; Putzig, C.L. Infrared spectroscopy. Anal. Chem. 1996, 68, 93–160. [Google Scholar] [CrossRef]
  21. Coates, J. Interpretation of infrared spectra, a practical approach. In Encyclopedia of Analytical Chemistry; John Wiley & Sons, Ltd.: Hoboken, NJ, USA, 2006. [Google Scholar] [CrossRef]
  22. Stuart, B.H. Infrared Spectroscopy: Fundamentals and Applications, Analytical Techniques in the Sciences; Wiley: Hoboken, NJ, USA, 2004. [Google Scholar] [CrossRef]
  23. Washburn, K.E.; Birdwell, J.E. Multivariate analysis of ATR-FTIR spectra for assessment of oil shale organic geochemical properties. Org. Geochem. 2013, 63, 1–7. [Google Scholar] [CrossRef]
  24. Chen, Y.; Senesi, N.; Schnitzer, M. Information provided on humic substances by E4/E6 ratios. Soil Sci. Soc. Am. J. 1977, 41, 352–358. [Google Scholar] [CrossRef]
  25. Schnitzer, M. Soil organic matter—The next 75 years. Soil Sci. 1991, 151, 41–58. [Google Scholar] [CrossRef]
  26. Peters, K.E.; Cassa, M.R. Applied source rock geochemistry: Chapter 5: Part II. Essential elements. In The Petroleum System—From Source to Trap; American Association of Petroleum Geologists, AAPG: Tulsa, OK, USA, 1994; Volume 60, pp. 93–120. [Google Scholar]
  27. Dow, W.G.; Pearson, D.B. Organic matter in Gulf Coast sediments. In Proceedings of the Offshore Technology Conference, Houston, TX, USA, 4 May 1975; pp. 85–94. [Google Scholar] [CrossRef]
  28. Wiberley, S.E.; Gonzalez, R.D. Infrared spectra of polynuclear aromatic compounds in the CH stretching and out-of-plane bending regions. Appl. Spectrosc. 1961, 15, 174–177. [Google Scholar] [CrossRef]
  29. Ibad, S.M.; Padmanabhan, E. Exploring the relationship between hydrocarbons with total carbon and organic carbon in black shale from Perak, Malaysia. Pet. Coal 2017, 59, 933–943. [Google Scholar]
  30. Yang, G.-P. Polycyclic aromatic hydrocarbons in the sediments of the South China Sea. Environ. Pollut. 2000, 108, 163–171. [Google Scholar] [CrossRef] [PubMed]
  31. Helgeson, H.C.; Richard, L.; McKenzie, W.F.; Norton, D.L.; Schmitt, A. A chemical and thermodynamic model of oil generation in hydrocarbon source rocks. Geochim. Cosmochim. Acta 2009, 73, 594–695. [Google Scholar] [CrossRef]
  32. Tissot, B.P.; Welte, D.H. Petroleum Formation and Occurrence; Springer: Berlin/Heidelberg, Germany, 1984. [Google Scholar] [CrossRef]
  33. Tan, J.; Horsfield, B.; Mahlstedt, N.; Zhang, J.; Boreham, C.J.; Hippler, D.; van Graas, G.; Tocher, B.A. Natural gas potential of Neoproterozoic and lower Palaeozoic marine shales in the Upper Yangtze Platform, South China: Geological and organic geochemical characterization. Int. Geol. Rev. 2015, 57, 305–326. [Google Scholar] [CrossRef]
  34. Ross, D.J.K.; Bustin, R.M. Characterizing the shale gas resource potential of Devonian–Mississippian strata in the Western Canada sedimentary basin: Application of an integrated formation evaluation. Am. Assoc. Pet. Geol. Bull. 2008, 92, 87–125. [Google Scholar] [CrossRef]
  35. Jarvie, D.M.; Hill, R.J.; Ruble, T.E.; Pollastro, R.M. Unconventional shale-gas systems: The Mississippian Barnett Shale of north-central Texas as one model for thermogenic shale-gas assessment. Am. Assoc. Pet. Geol. Bull. 2007, 91, 475–499. [Google Scholar] [CrossRef]
  36. Du, X.; Song, X.; Zhang, M.; Lu, Y.; Lu, Y.; Chen, P.; Liu, Z.; Yang, S. Shale gas potential of the Lower Permian Gufeng Formation in the western area of the Lower Yangtze Platform, China. Mar. Pet. Geol. 2015, 67, 526–543. [Google Scholar] [CrossRef]
  37. Egbobawaye, I.E. Petroleum Source-Rock Evaluation and Hydrocarbon Potential in Montney Formation Unconventional Reservoir, Northeastern British Columbia, Canada, Natural Resources. Nat. Resour. 2017, 8, 716. [Google Scholar] [CrossRef]
  38. Ibad, S.M.; Padmanabhan, E. Methane sorption capacities and geochemical characterization of Paleozoic shale Formations from Western Peninsula Malaysia: Implication of shale gas potential. Int. J. Coal Geol. 2020, 224, 103480. [Google Scholar] [CrossRef]
  39. Abou El-Anwar, E.; Salman, S.; Mousa, D.; Aita, S.; Makled, W.; Gentzis, T. Organic Petrographic and Geochemical Evaluation of the Black Shale of the Duwi Formation, El Sebaiya, Nile Valley, Egypt. Minerals 2021, 11, 1416. [Google Scholar] [CrossRef]
  40. Li, B.; Feng, C.; Li, X.; Chen, Y.; Niu, J.; Shen, Z. Spatial distribution and source apportionment of PAHs in surficial sediments of the Yangtze Estuary, China. Mar. Pollut. Bull. 2012, 64, 636–643. [Google Scholar] [CrossRef]
  41. Wu, F.; Xu, L.; Sun, Y.; Liao, H.; Zhao, X.; Guo, J. Exploring the relationship between polycyclic aromatic hydrocarbons and sedimentary organic carbon in three Chinese lakes. J. Soils Sediments 2012, 12, 774–783. [Google Scholar] [CrossRef]
  42. González-Vila, F.J.; Amblès, A.; del Rıo, J.C.; Grasset, L. Characterisation and differentiation of kerogens by pyrolytic and chemical degradation techniques. J. Anal. Appl. Pyrolysis 2001, 58, 315–328. [Google Scholar] [CrossRef]
  43. Cunha, T.J.F.; Novotny, E.H.; Madari, B.E.; Martin-Neto, L.; Rezende, M.O.d.O.; Canelas, L.P.; Benites, V.d.M. Spectroscopy characterization of humic acids isolated from Amazonian Dark Earth Soils (terra preta de Índio). In Amazonian Dark Earths: Wim Sombroek’s Vision; Springer: Berlin/Heidelberg, Germany, 2009; pp. 363–372. [Google Scholar] [CrossRef] [Green Version]
  44. Strachan, M.G.; Alexander, R.; Kagi, R.I. Trimethyl naphthalenes in crude oils and sediments: Effects of source and maturity. Geochim. Cosmochim. Acta 1988, 52, 1255–1264. [Google Scholar] [CrossRef]
  45. Volkman, J.K.; Alexander, R.; Kagi, R.I.; Rowland, S.J.; Sheppard, P.N. Biodegradation of aromatic hydrocarbons in crude oils from the Barrow Sub-basin of Western Australia. Org. Geochem. 1984, 6, 619–632. [Google Scholar] [CrossRef]
  46. Wang, X.; Cai, T.; Wen, W.; Ai, J.; Ai, J.; Zhang, Z.; Zhu, L.; George, S.C. Surfactin for enhanced removal of aromatic hydrocarbons during biodegradation of crude oil. Fuel 2020, 267, 117272. [Google Scholar] [CrossRef]
  47. Cheng, X.; Hou, D.; Mao, R.; Xu, C. Severe biodegradation of polycyclic aromatic hydrocarbons in reservoired crude oils from the Miaoxi Depression, Bohai Bay Basin. Fuel 2018, 211, 859–867. [Google Scholar] [CrossRef]
  48. Asahina, K.; Suzuki, N. Alkyl naphthalenes and tetralins as indicators of source and source rock lithology–Pyrolysis of a cadinane-type sesquiterpene in the presence and absence of montmorillonite. J. Pet. Sci. Eng. 2016, 145, 657–667. [Google Scholar] [CrossRef]
Figure 2. A locational map of the study area, changed from [17], with the prominent outcrops (in purple circles) where the samples were taken from.
Minerals 12 01501 g002
Figure 3. FTIR spectra of the represented shale sample showing hydrocarbon functional groups in the wavenumber range from 500 to 4000 cm−1. ATR: attenuated total reflectance.
Minerals 12 01501 g003
Figure 4. Hydrocarbon functional groups in the Kroh shales.
Minerals 12 01501 g004
Figure 5. Distribution of E4 and E6 in the Kroh shales.
Minerals 12 01501 g005
Figure 6. TOC (wt.%) of shale samples from the Kroh Formation.
Minerals 12 01501 g006
Figure 7. Relationship of aliphatic and aromatic (=C–H bending) hydrocarbon functional groups in the Kroh shales.
Minerals 12 01501 g007
Figure 8. Relationship of TOC with hydrocarbon functional groups in the Kroh shales.
Minerals 12 01501 g008
Figure 9. Relationship between (A) E4 and E6, (B) TOC and E4/E6.
Minerals 12 01501 g009
Table 1. Hydrocarbon functional groups in the Kroh shale samples.
SamplesAromatic HydrocarbonAliphatic
Hydrocarbon
700–600
C–H Bending
Absorbance
1600–1430
C=C Stretching
Absorbance
900–690
Out of Plane C-H
Bending
Absorbance
1275–1000
In-Plane C–H
Bending
Absorbance
KR1-20.9031.7612.181.2
KR1-3N.A1.1051.3610.72
KR1-40.8061.572.6021.064
KR1-50.7081.4162.4430.943
KR1-60.7341.4081.8040.932
KR1-70.7451.2791.8380.929
KR1-80.7121.1671.4940.89
KR1-90.5310.7491.2240.627
KR1-100.971.5032.2671.14
KR1-110.8451.3812.041.342
KR1-120.631.1731.9280.815
KR2-20.5340.730.8870.604
KR2-31.0191.5052.1481.224
KR2-40.7371.0381.5180.846
KR2-60.9811.3442.1131.151
KR2-80.5990.8090.9740.685
KR2-90.8231.0771.6020.92
KR2-120.630.8681.2570.698
KR2-140.6150.7241.0490.648
KR3-1N.A0.4360.5290.44
KR3-30.4530.6170.7930.485
KR3-40.6190.9271.1290.661
KR3-5N.A0.4130.5730.381
KR3-60.7571.1631.2840.827
KR3-70.6130.8491.0860.668
KR3-8N.A0.8951.030.767
KR3-10N.A0.6460.8060.535
KR3-13N.A1.3281.3280.94
KR4-10.8341.66131.008
KR4-20.631.2441.5520.748
KR4-3N.A0.5910.9670.44
KR4-41.0231.9742.6981.27
KR4-50.6331.0361.6360.72
KR4-60.6891.291.5780.816
KR4-70.610.981.6510.689
KR4-80.7071.3461.6730.84
KR5-1N.A0.3950.6430.318
KR5-20.6761.291.8290.877
KR6-10.9271.2512.921.232
KR6-2N.A1.0212.0311.086
KR6-30.6021.0141.740.784
KR6-40.5791.0191.7440.745
KR6-50.6671.2112.1130.831
KR6-60.4310.7032.0550.568
KR6-80.4880.7691.5240.611
KR6-90.6831.1811.9820.925
KR6-100.971.5032.2671.14
KR6-111.0591.5212.5851.317
KR6-120.7321.1752.4551.395
KR6-13N.A0.3411.5110.617
KR6-140.5910.6981.610.856
KR6-150.5560.6651.690.801
KR6-181.0941.7092.1481.384
KR6-19N.A1.2672.1871.385
KR6-20N.A1.0381.9281.174
KR7-11.0981.952.4551.395
N.A: not applicable.
Table 2. Comparing the TOC content of Paleozoic Kroh black shales with other worldwide shale gas rocks.
FormationAgeTOC (wt.%)Average TOC (wt.%)Reference
Longmaxi, ChinaLower Silurian0.44–42.32[33]
Niutitang, ChinaLower Cambrian0.39–10.25.26[33]
Muskwa, Besa & Fort Simpson, CanadaDevonian–
Mississippian
0.18–4.721.39[34]
Barnett shale, USAMississippian2.62–11.474.66[35]
Gufeng, ChinaLower Permian0.04–22.13.4[36]
Montney, CanadaLower Triassic0.03–8.22.64[37]
Baling and Bendang Riang, MalaysiaSilurian–Devonian0.73–24.66.71[38]
Kubang Pasu, MalaysiaLower Permian1.01–19.655.74[38]
Duwi Formation, El Sebaiya, EgyptLate Campanian–early Maastrichtian0.21–2.771.4[39]
Kroh shale, MalaysiaSilurian–Devonian0.13–8.561.71Current study
Publisher’s Note: MDPI stays neutral with regard to jurisdictional claims in published maps and institutional affiliations.

