
Heating Pre-Treatment of Copper Ores and Its Effects on the Bond Work Index

 , , , ,
Abstract
:1. Introduction
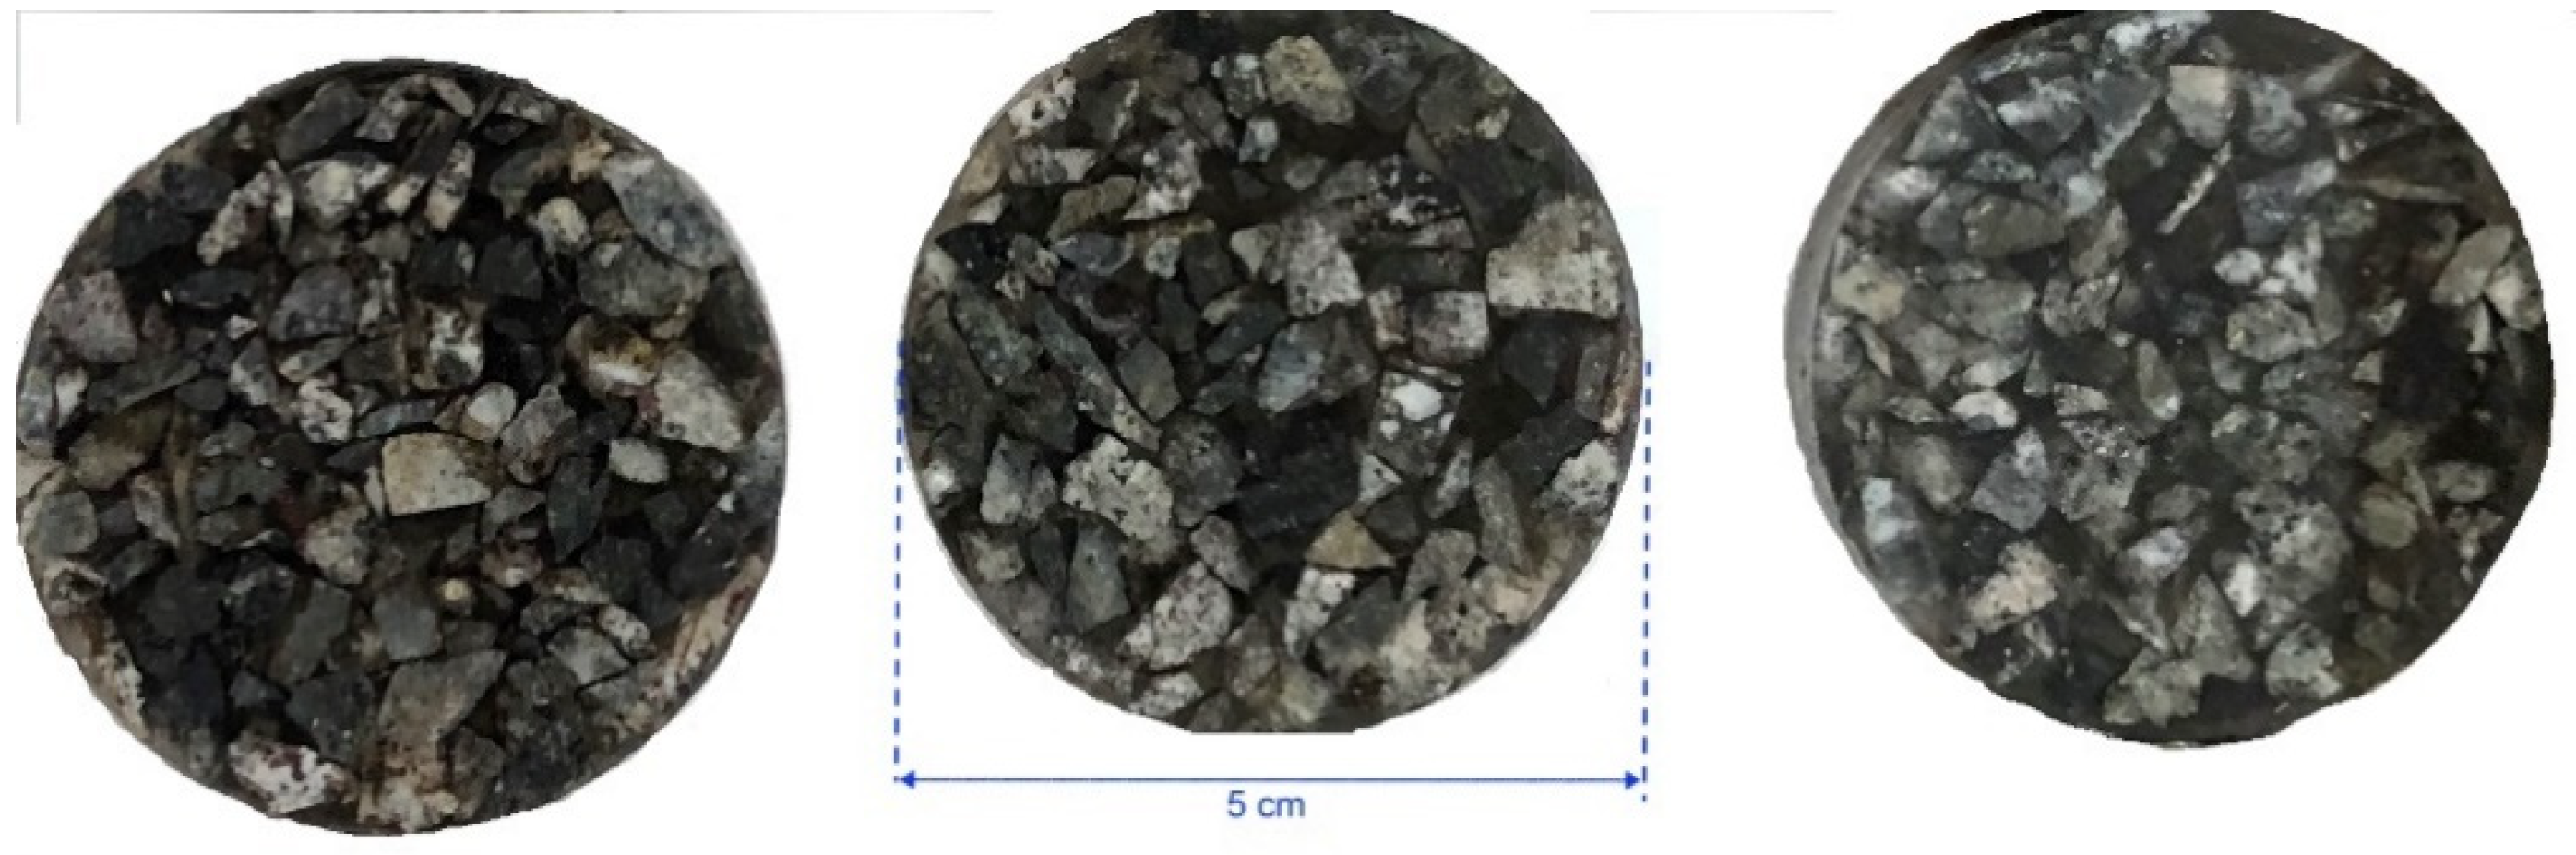
2. Materials and Methods
3. Results
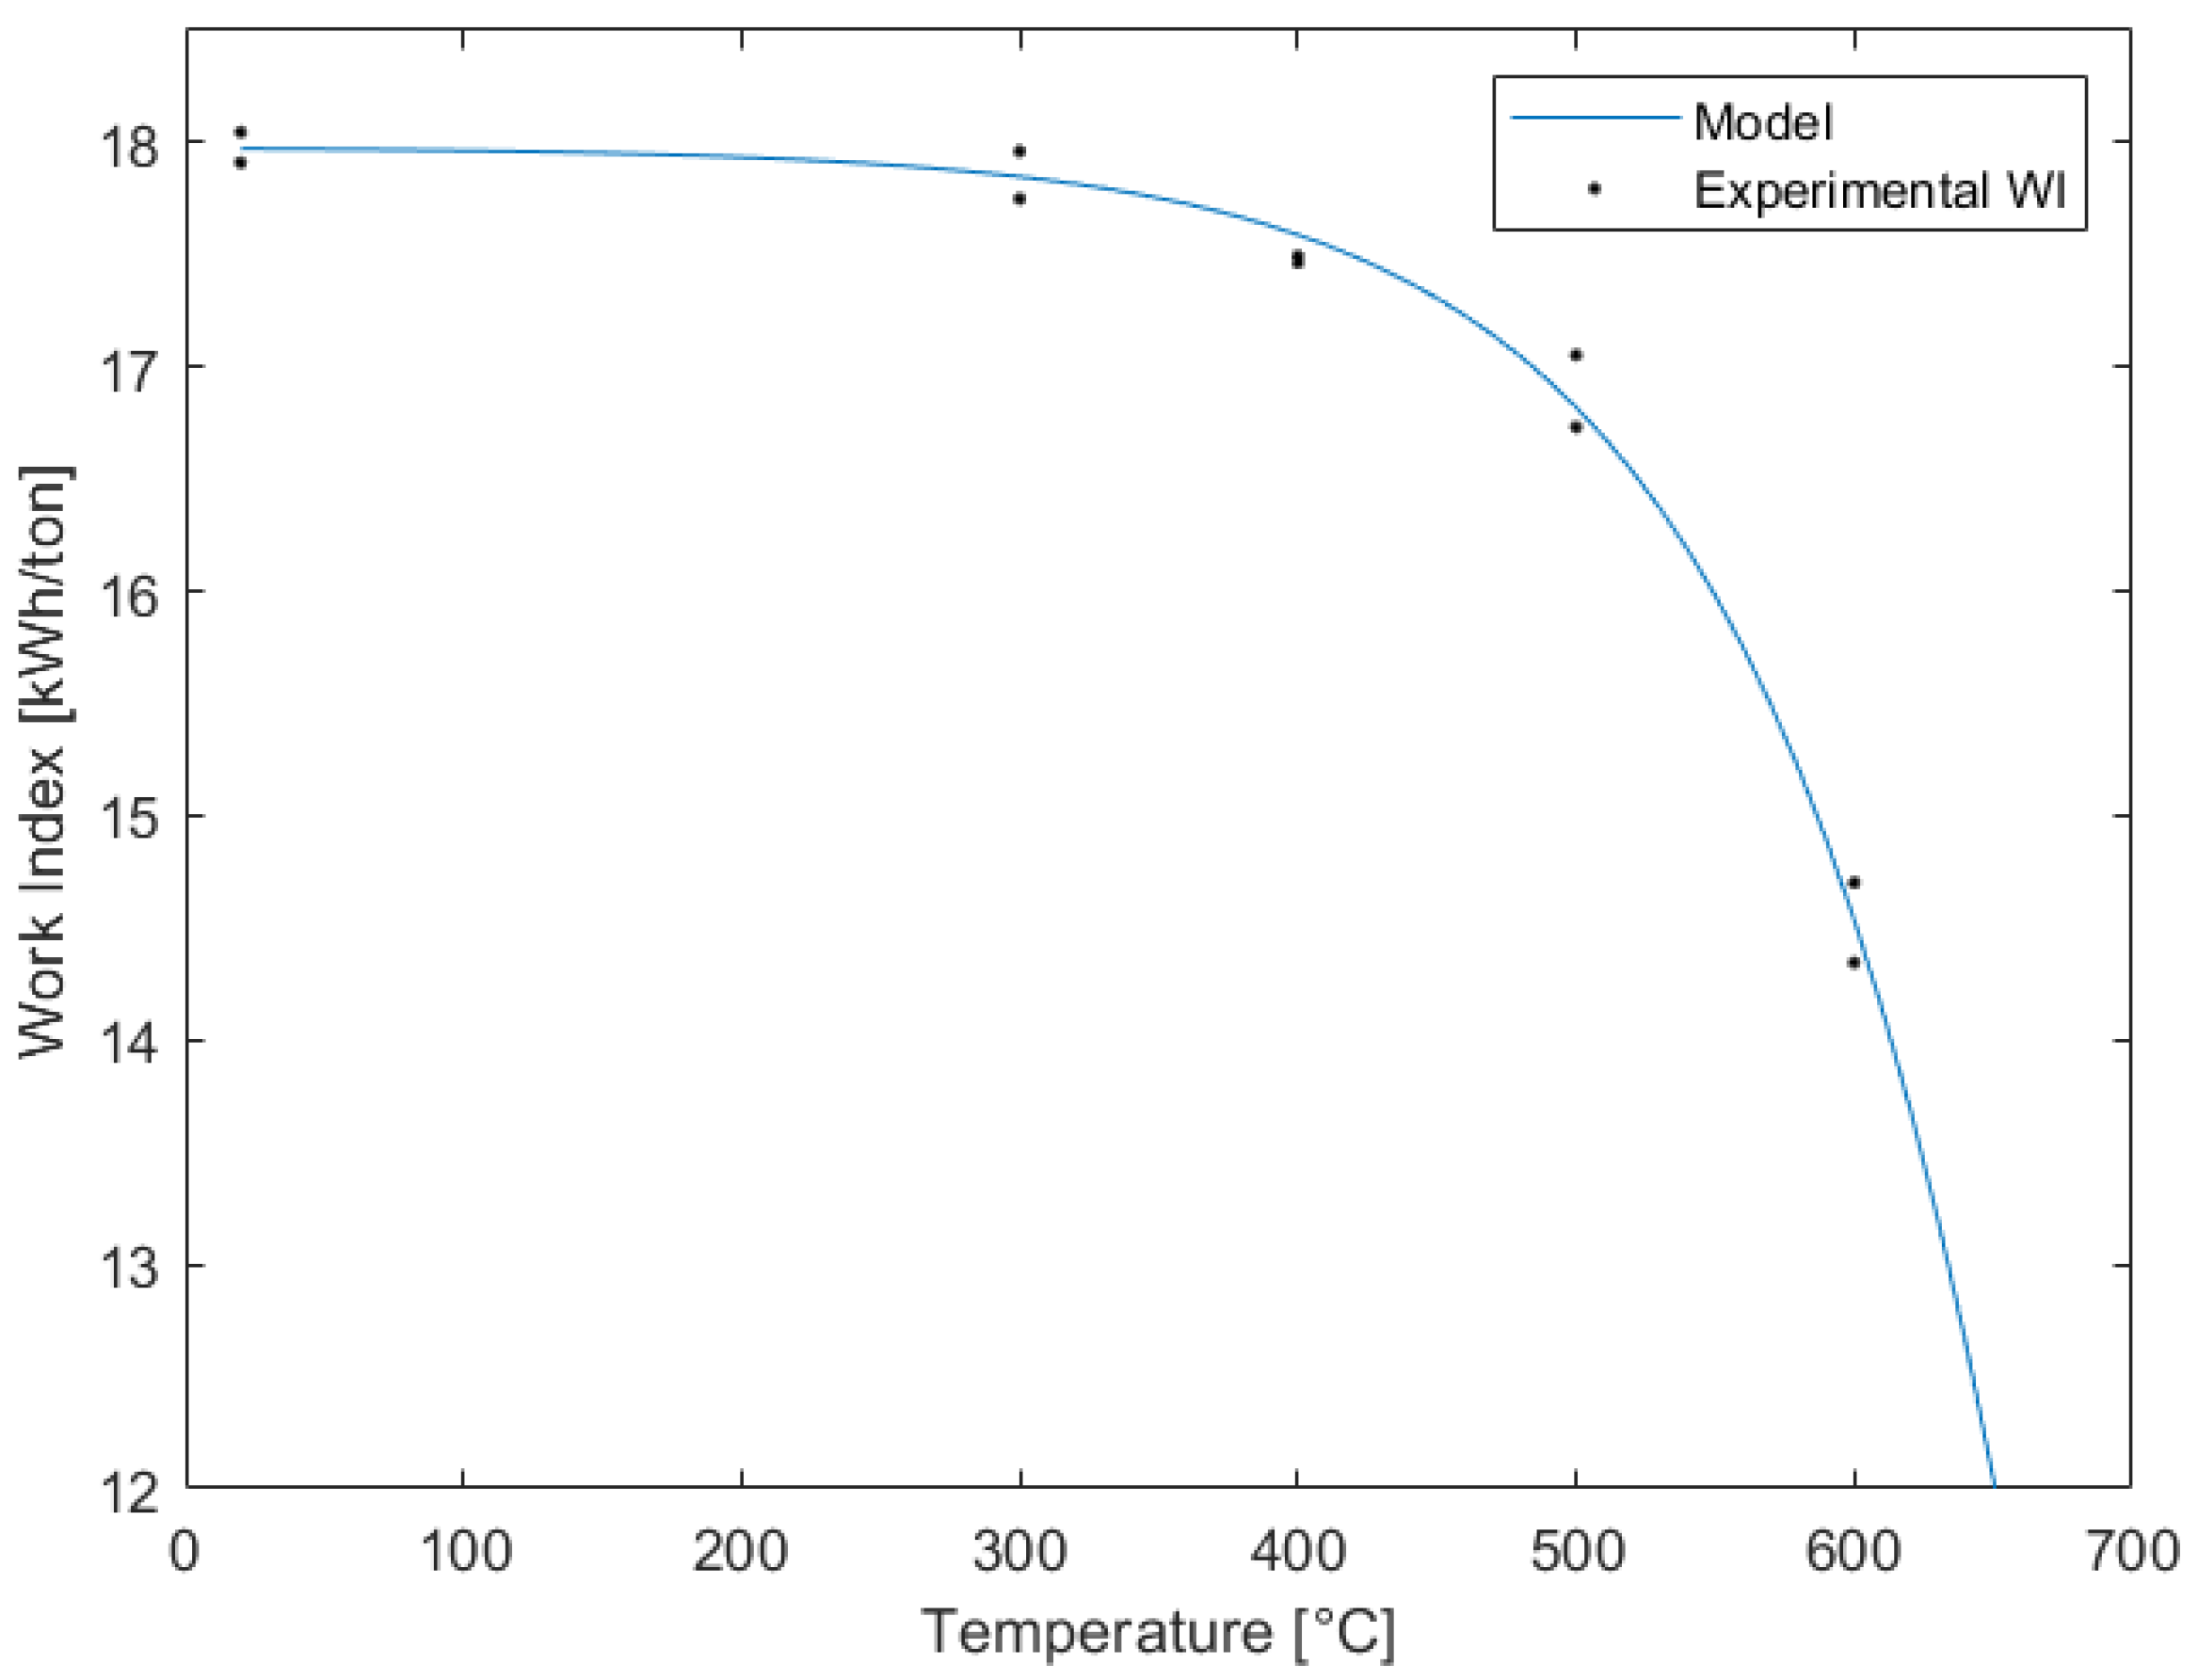
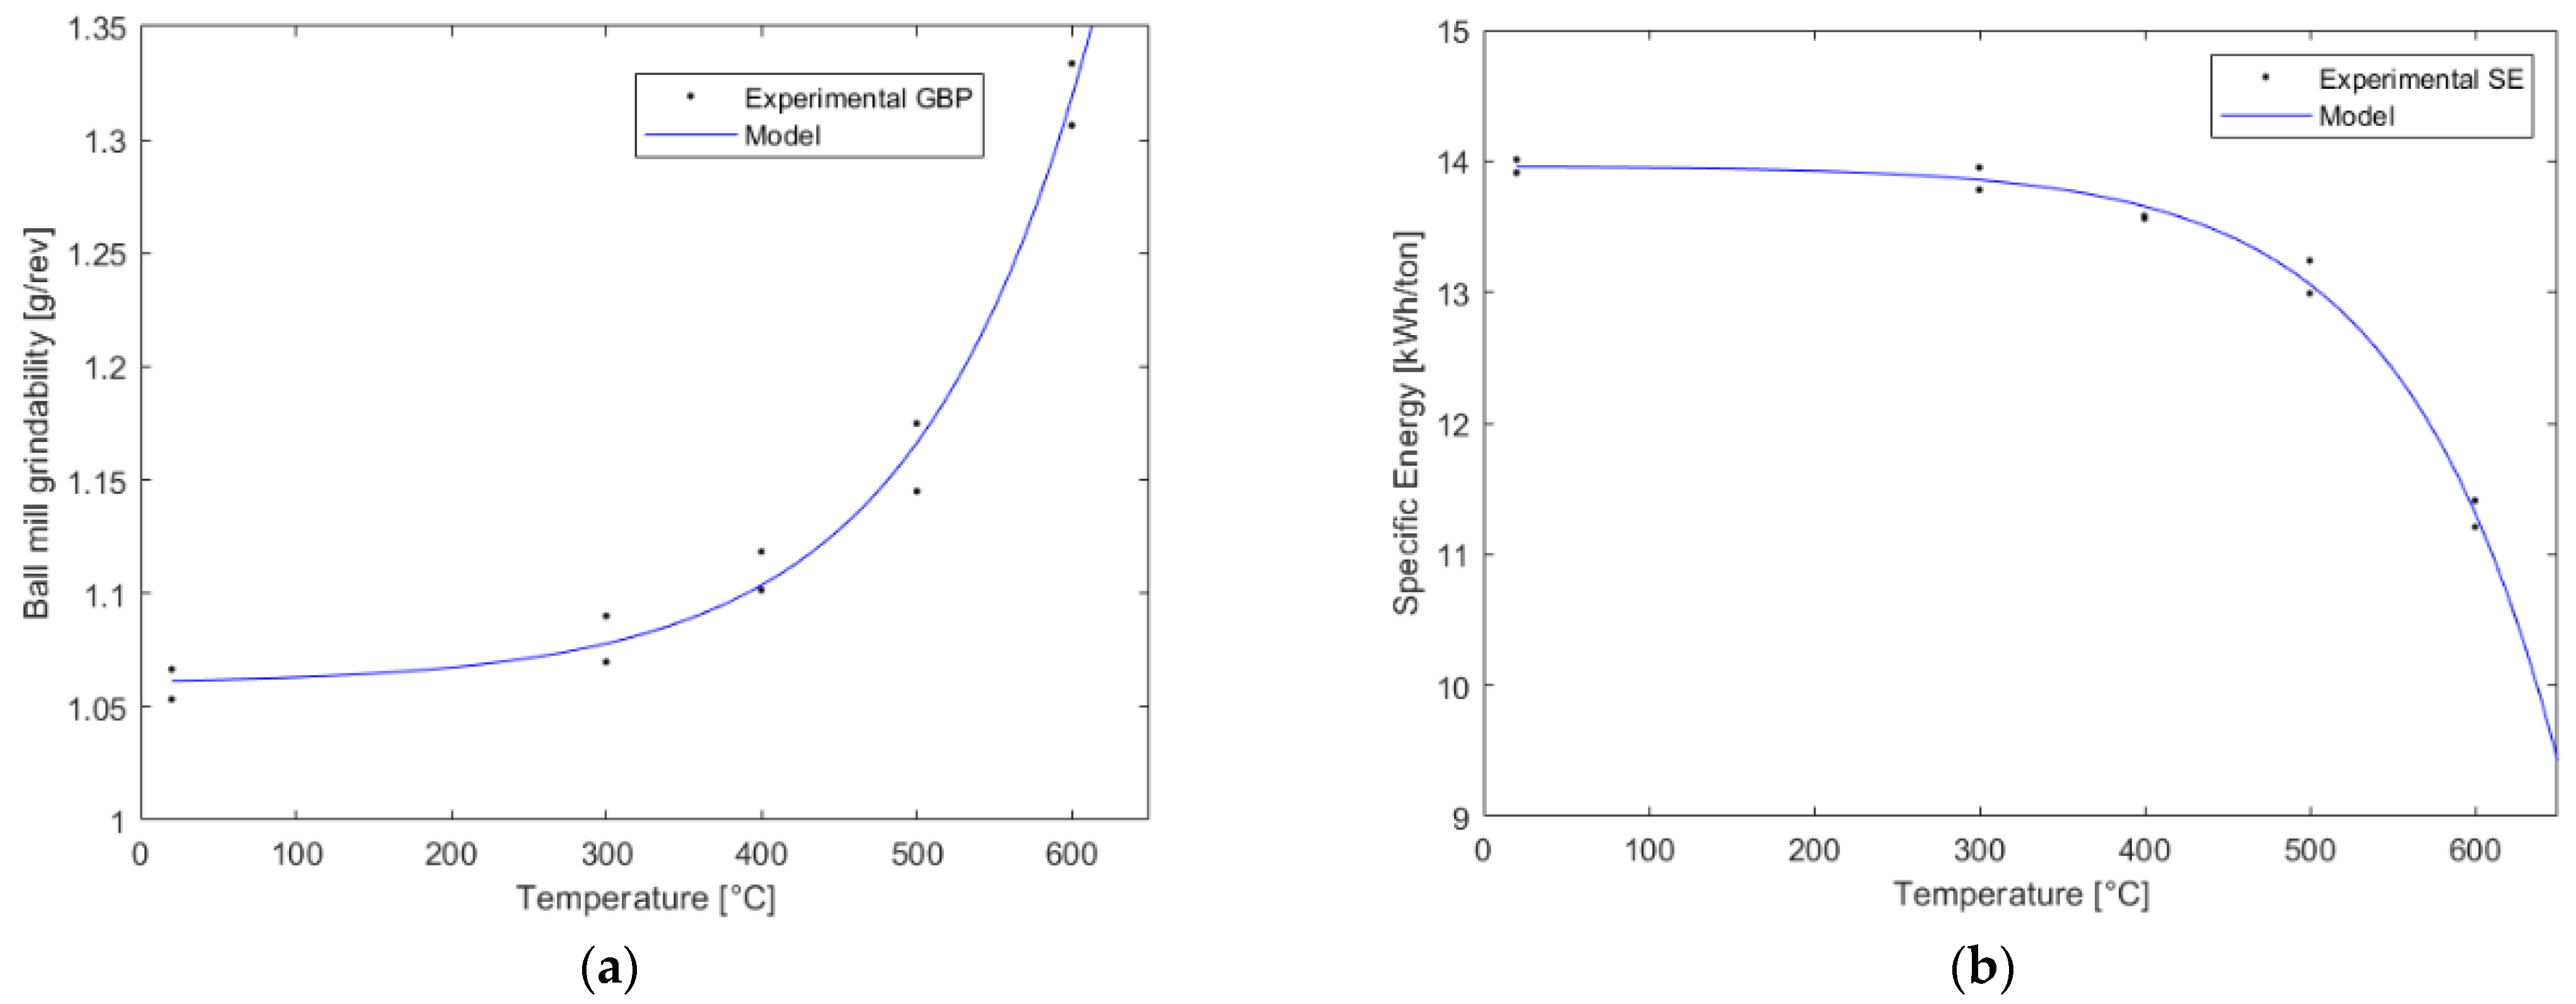
3.1. Bond Tests
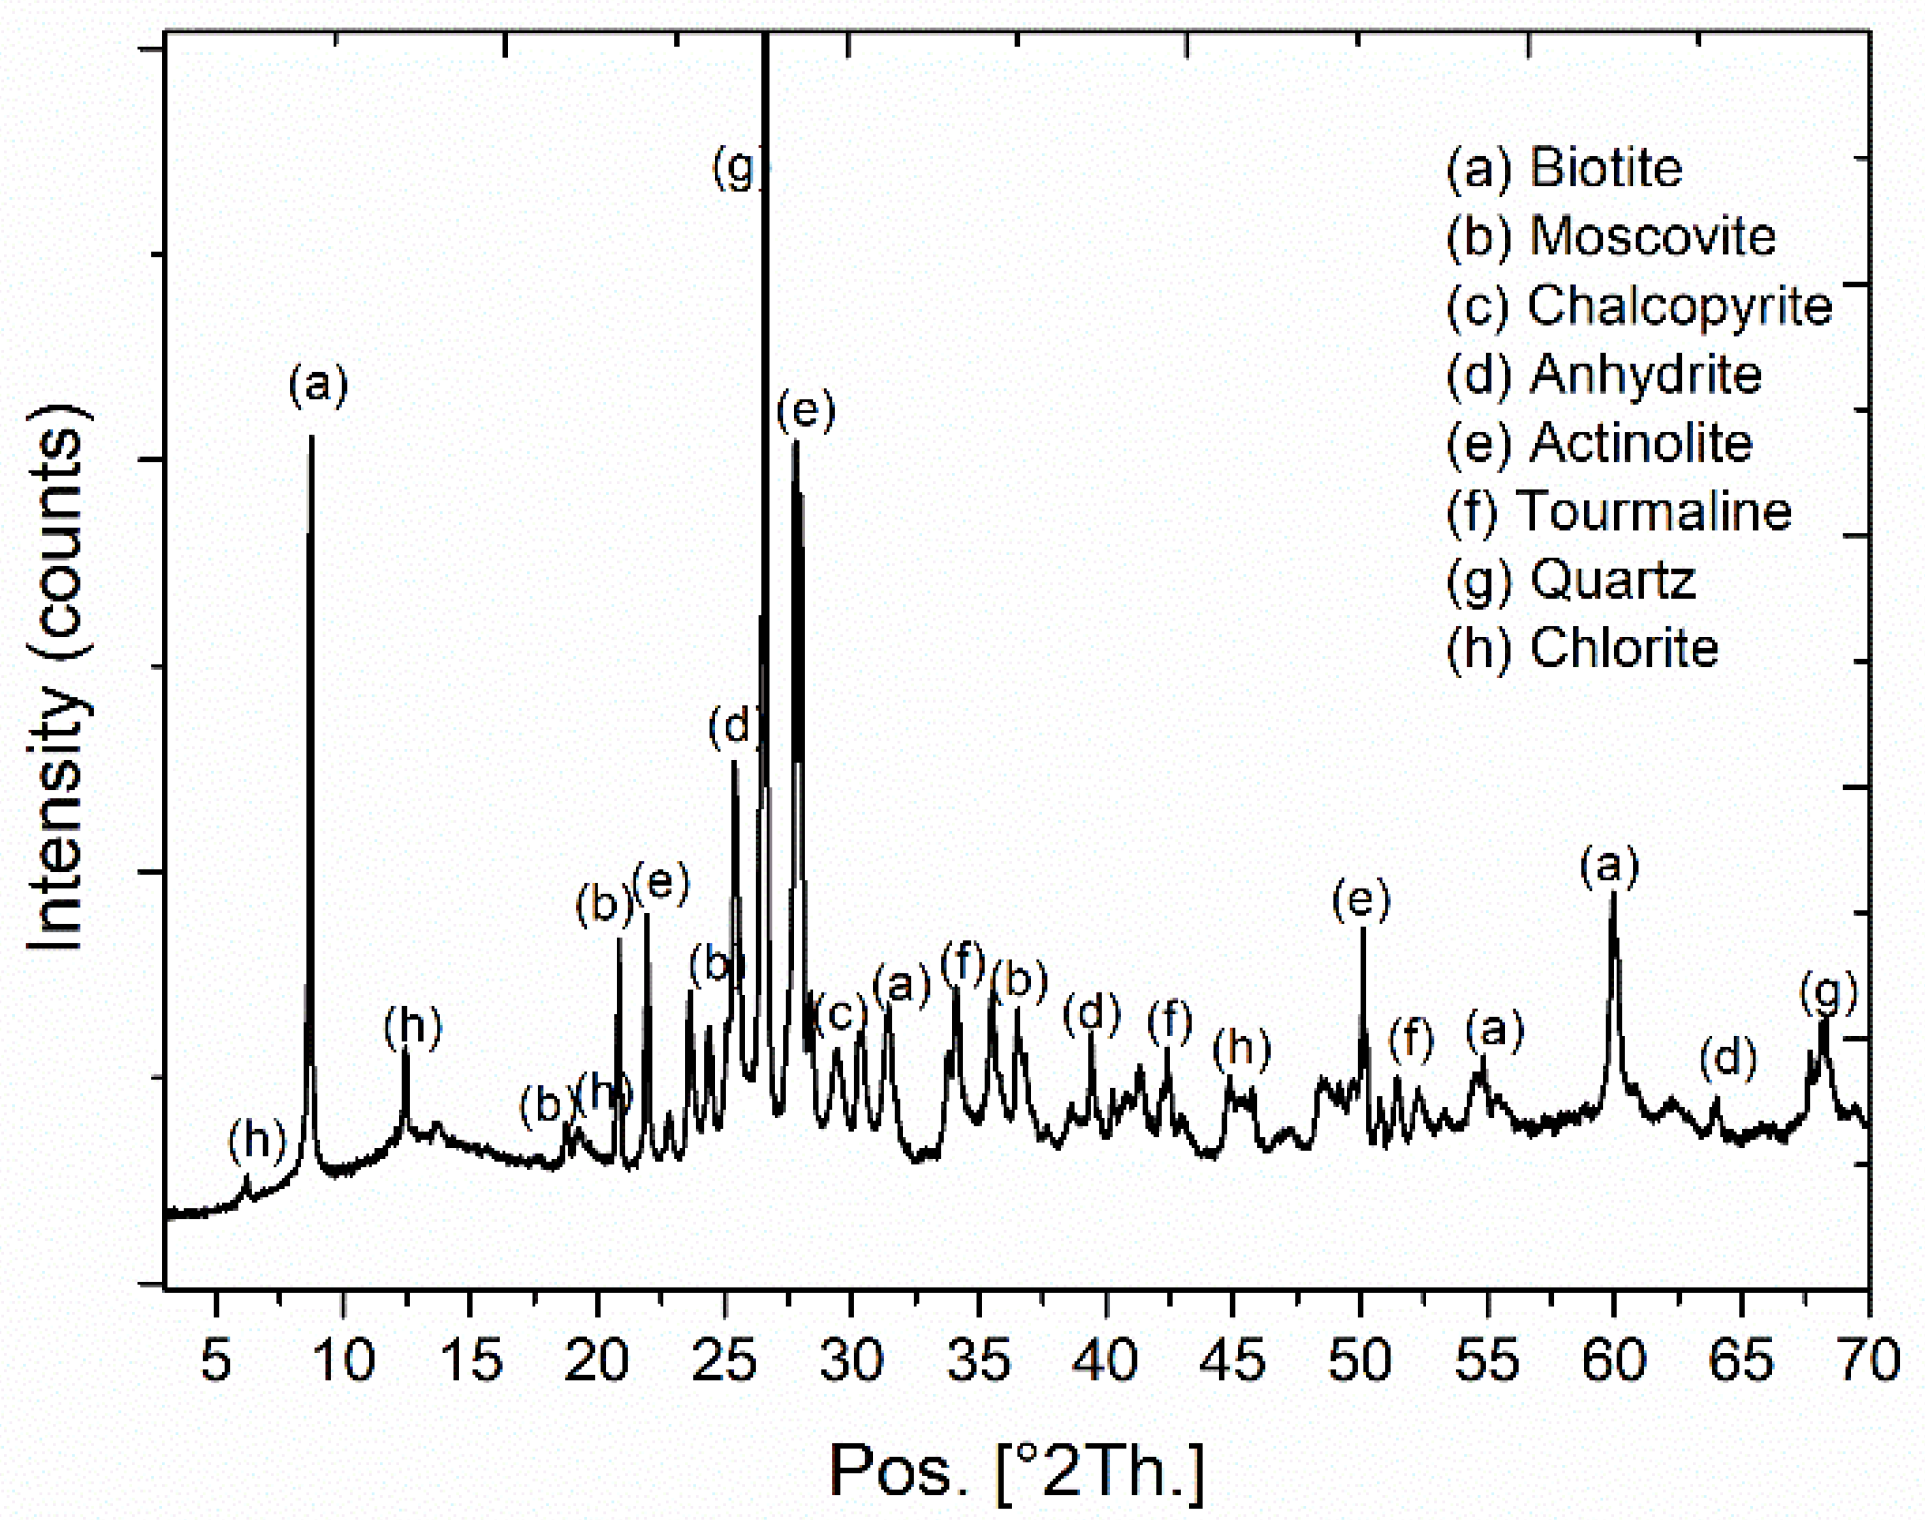
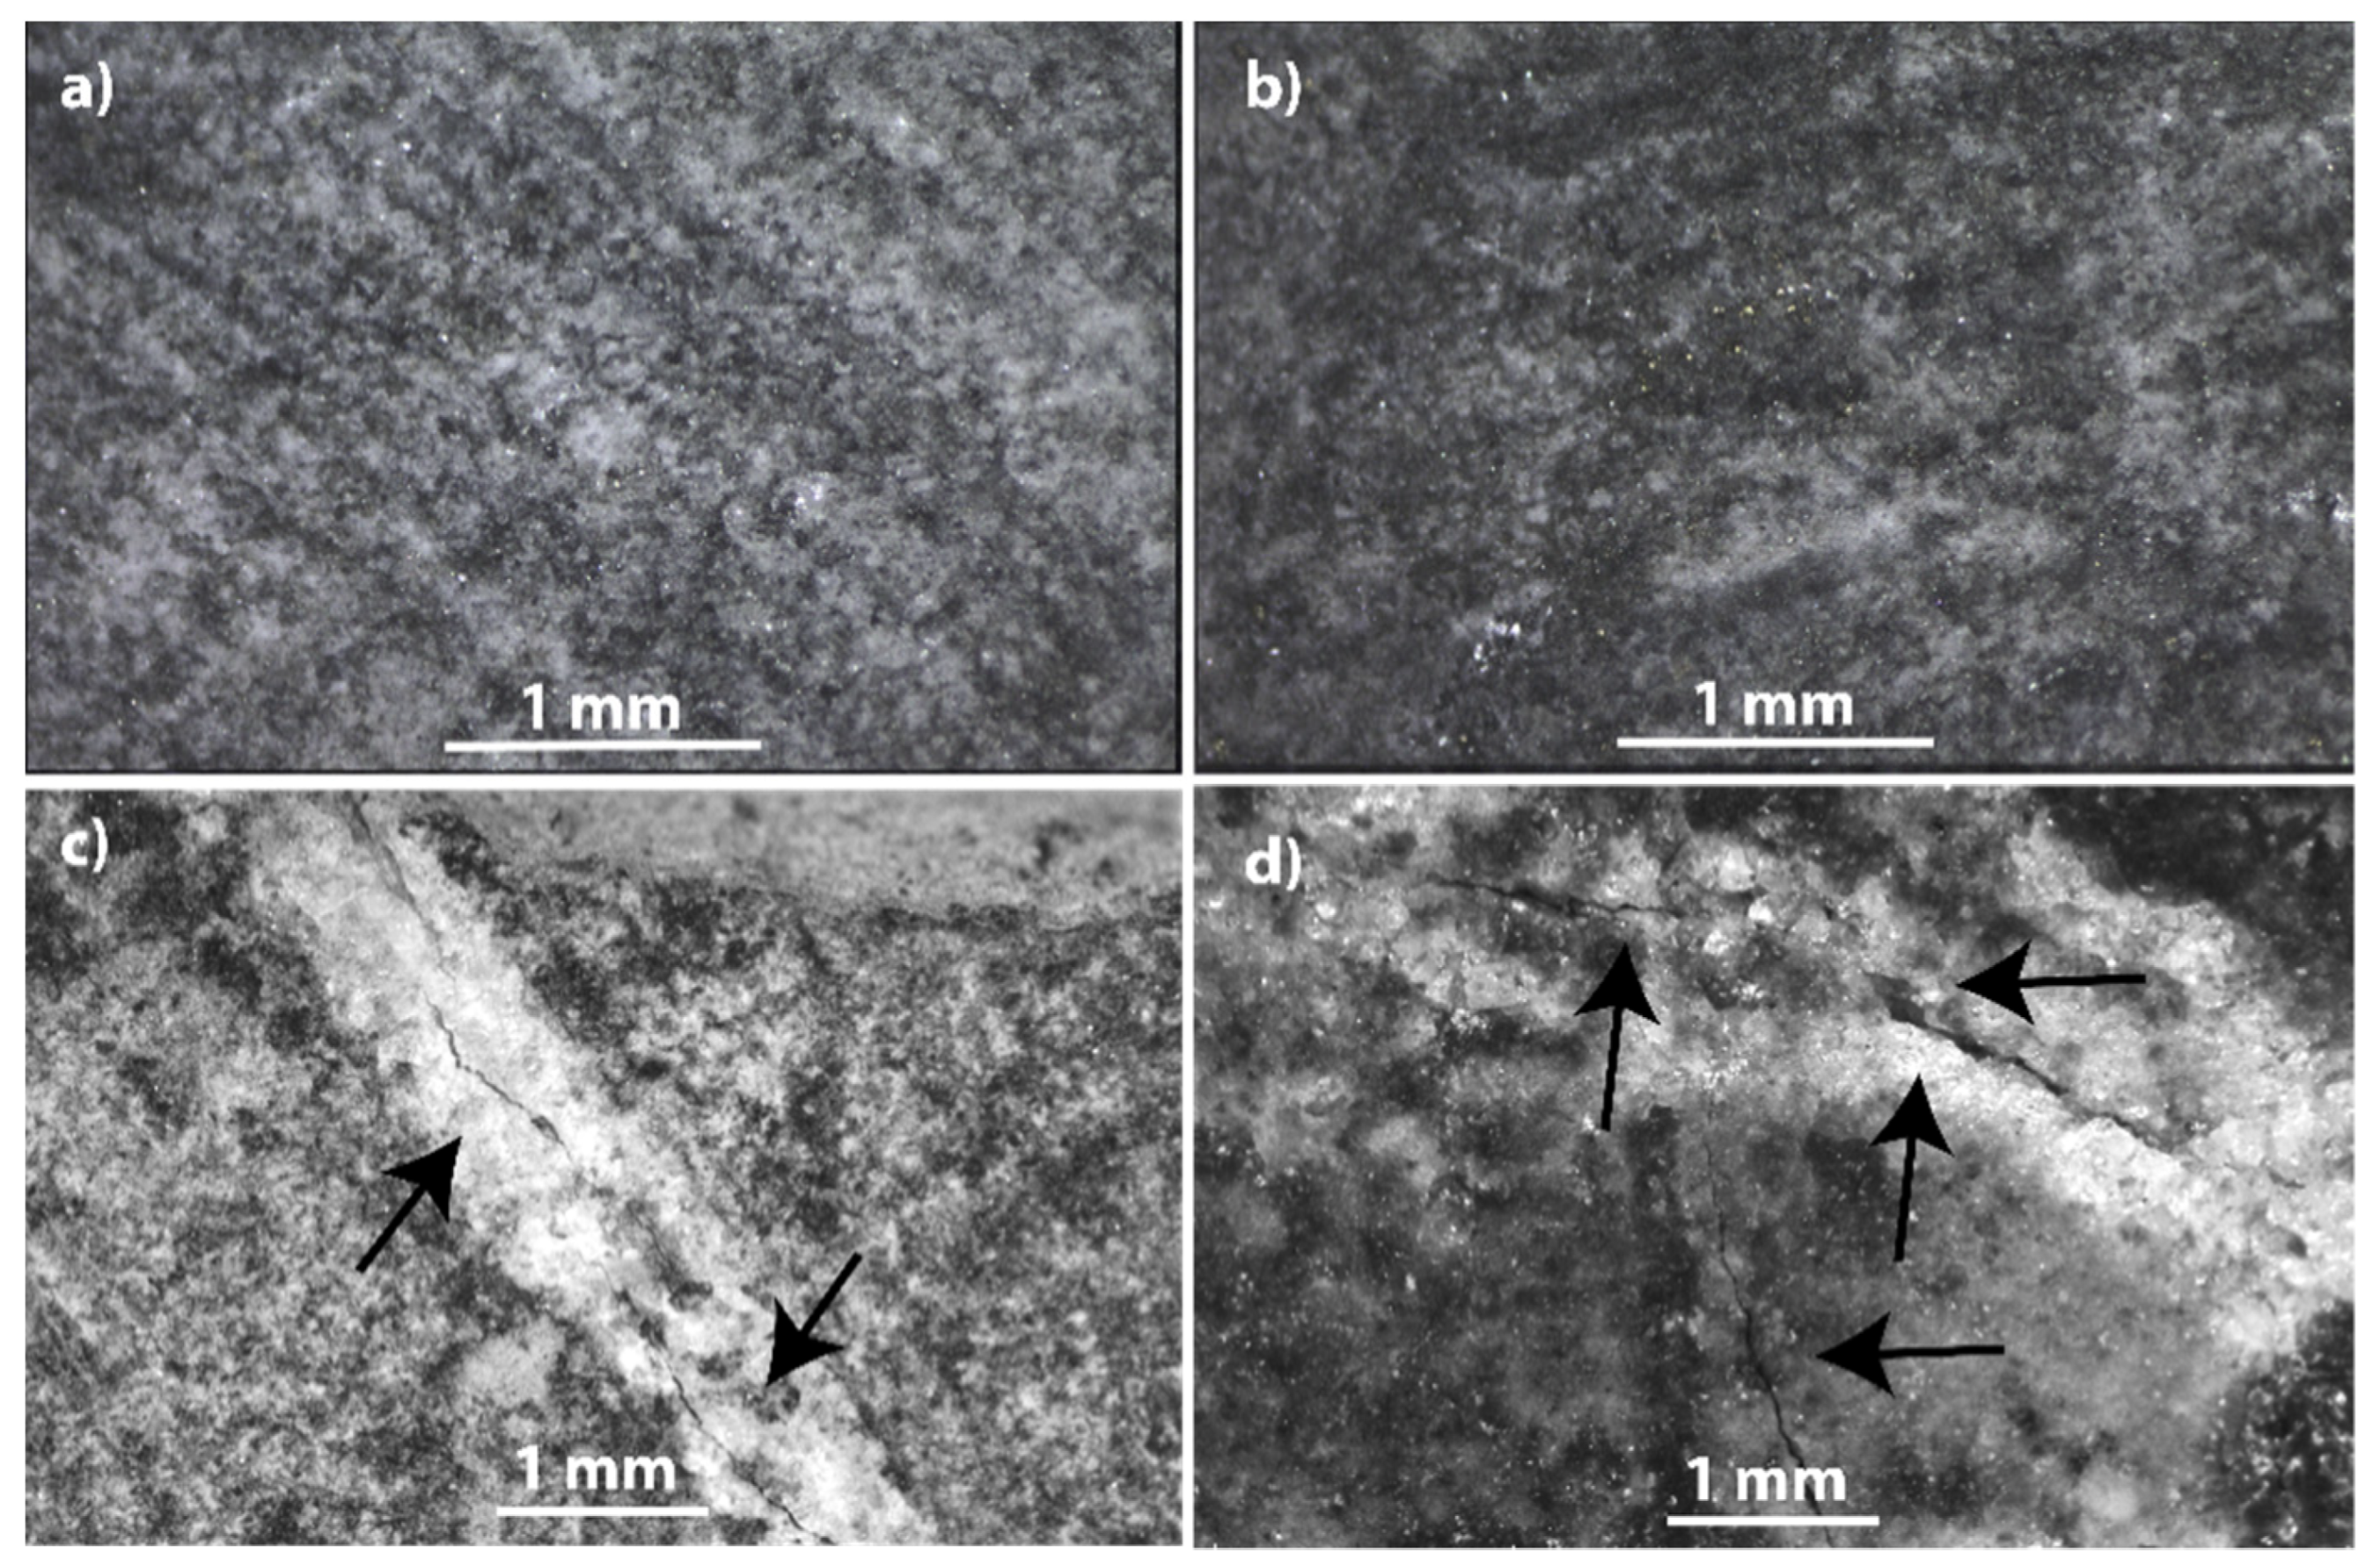
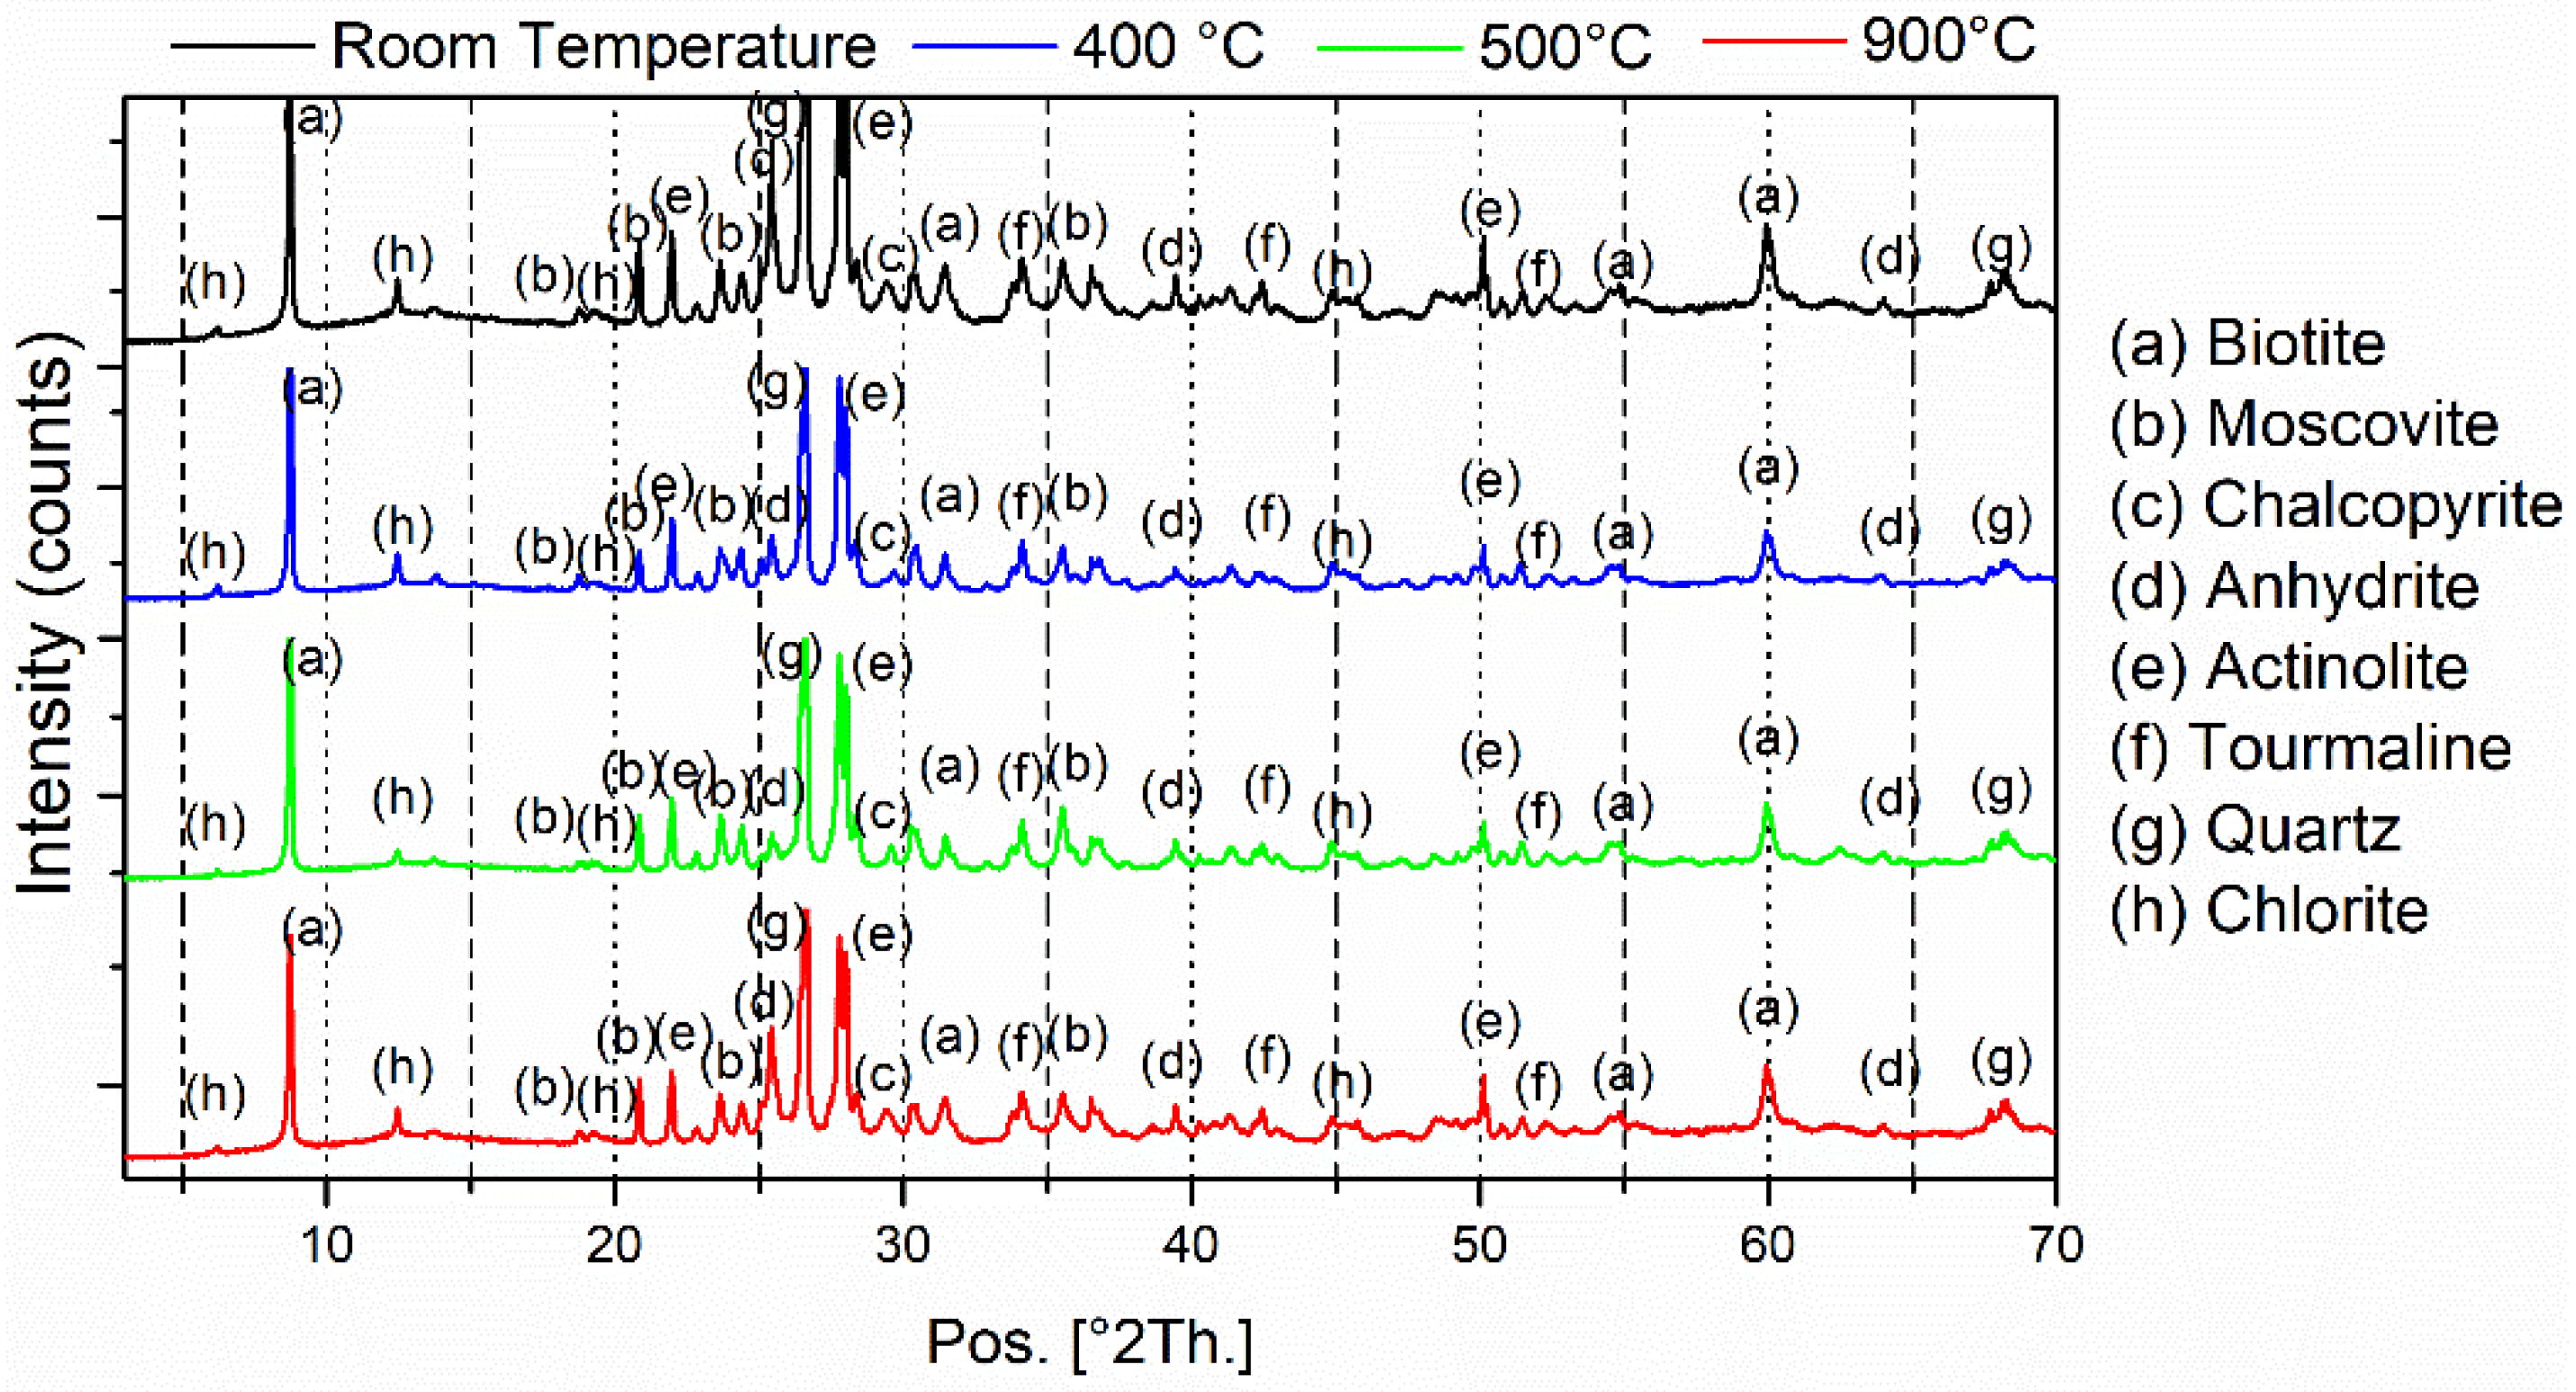
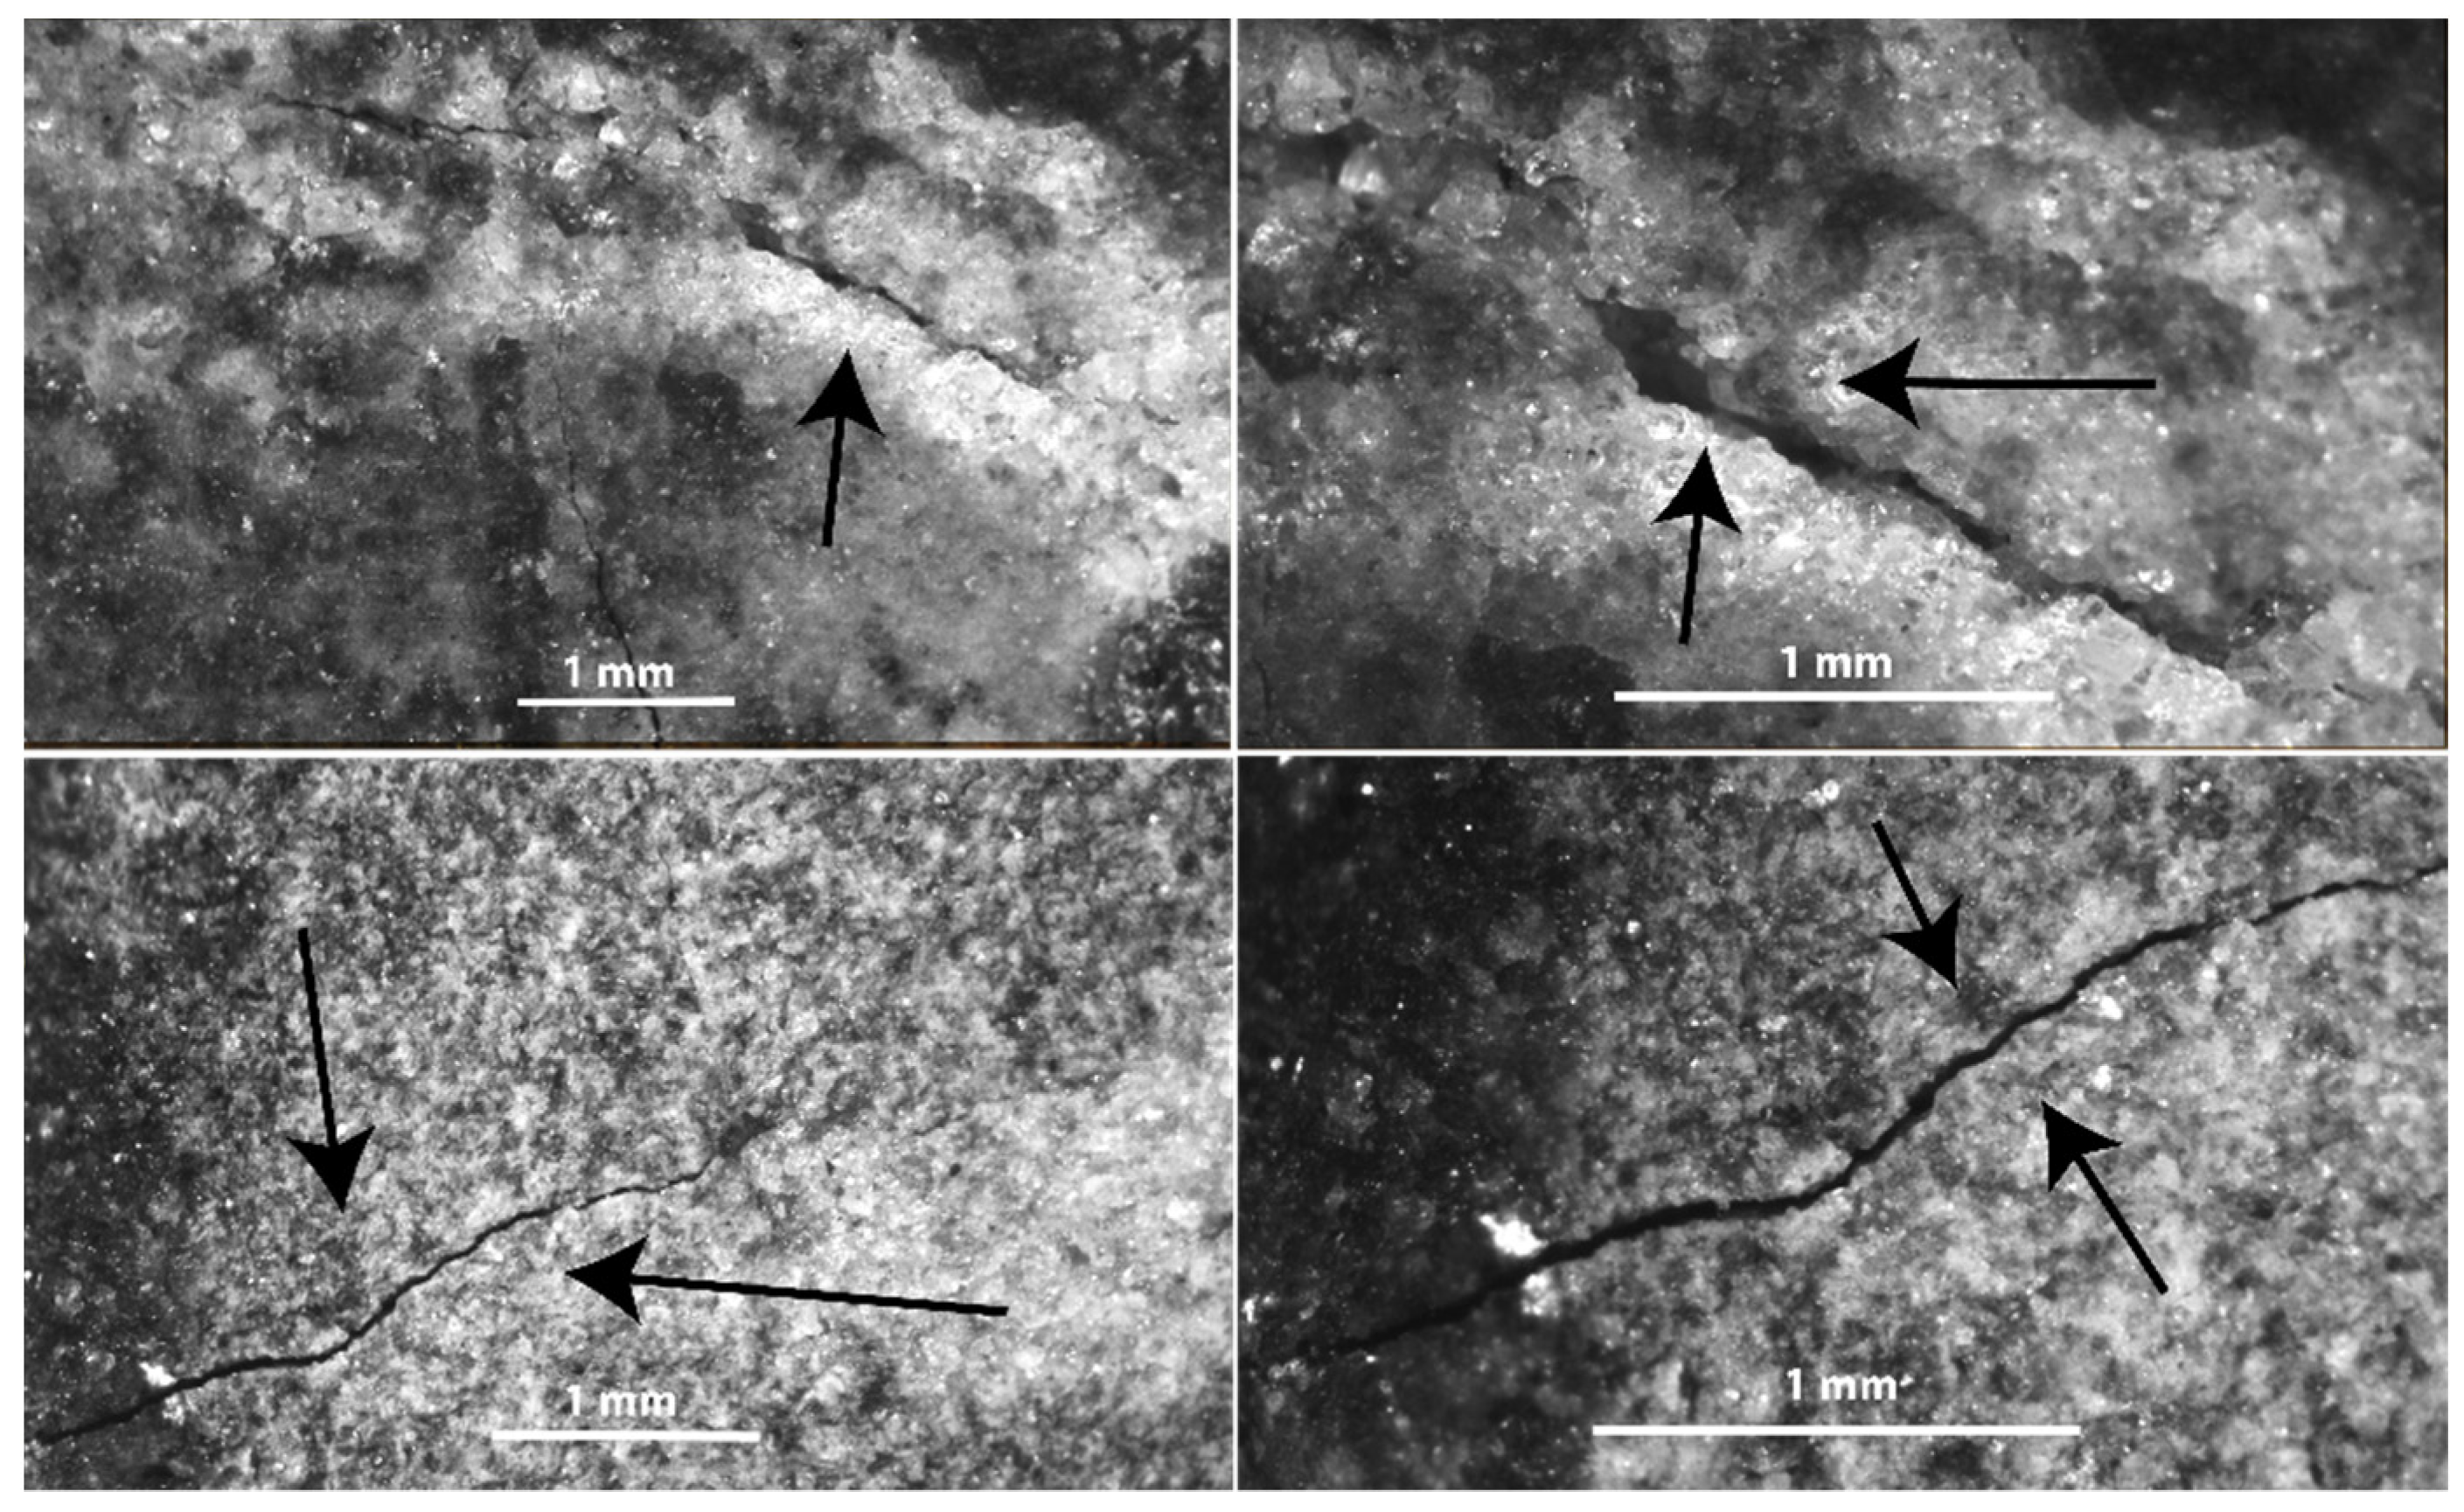
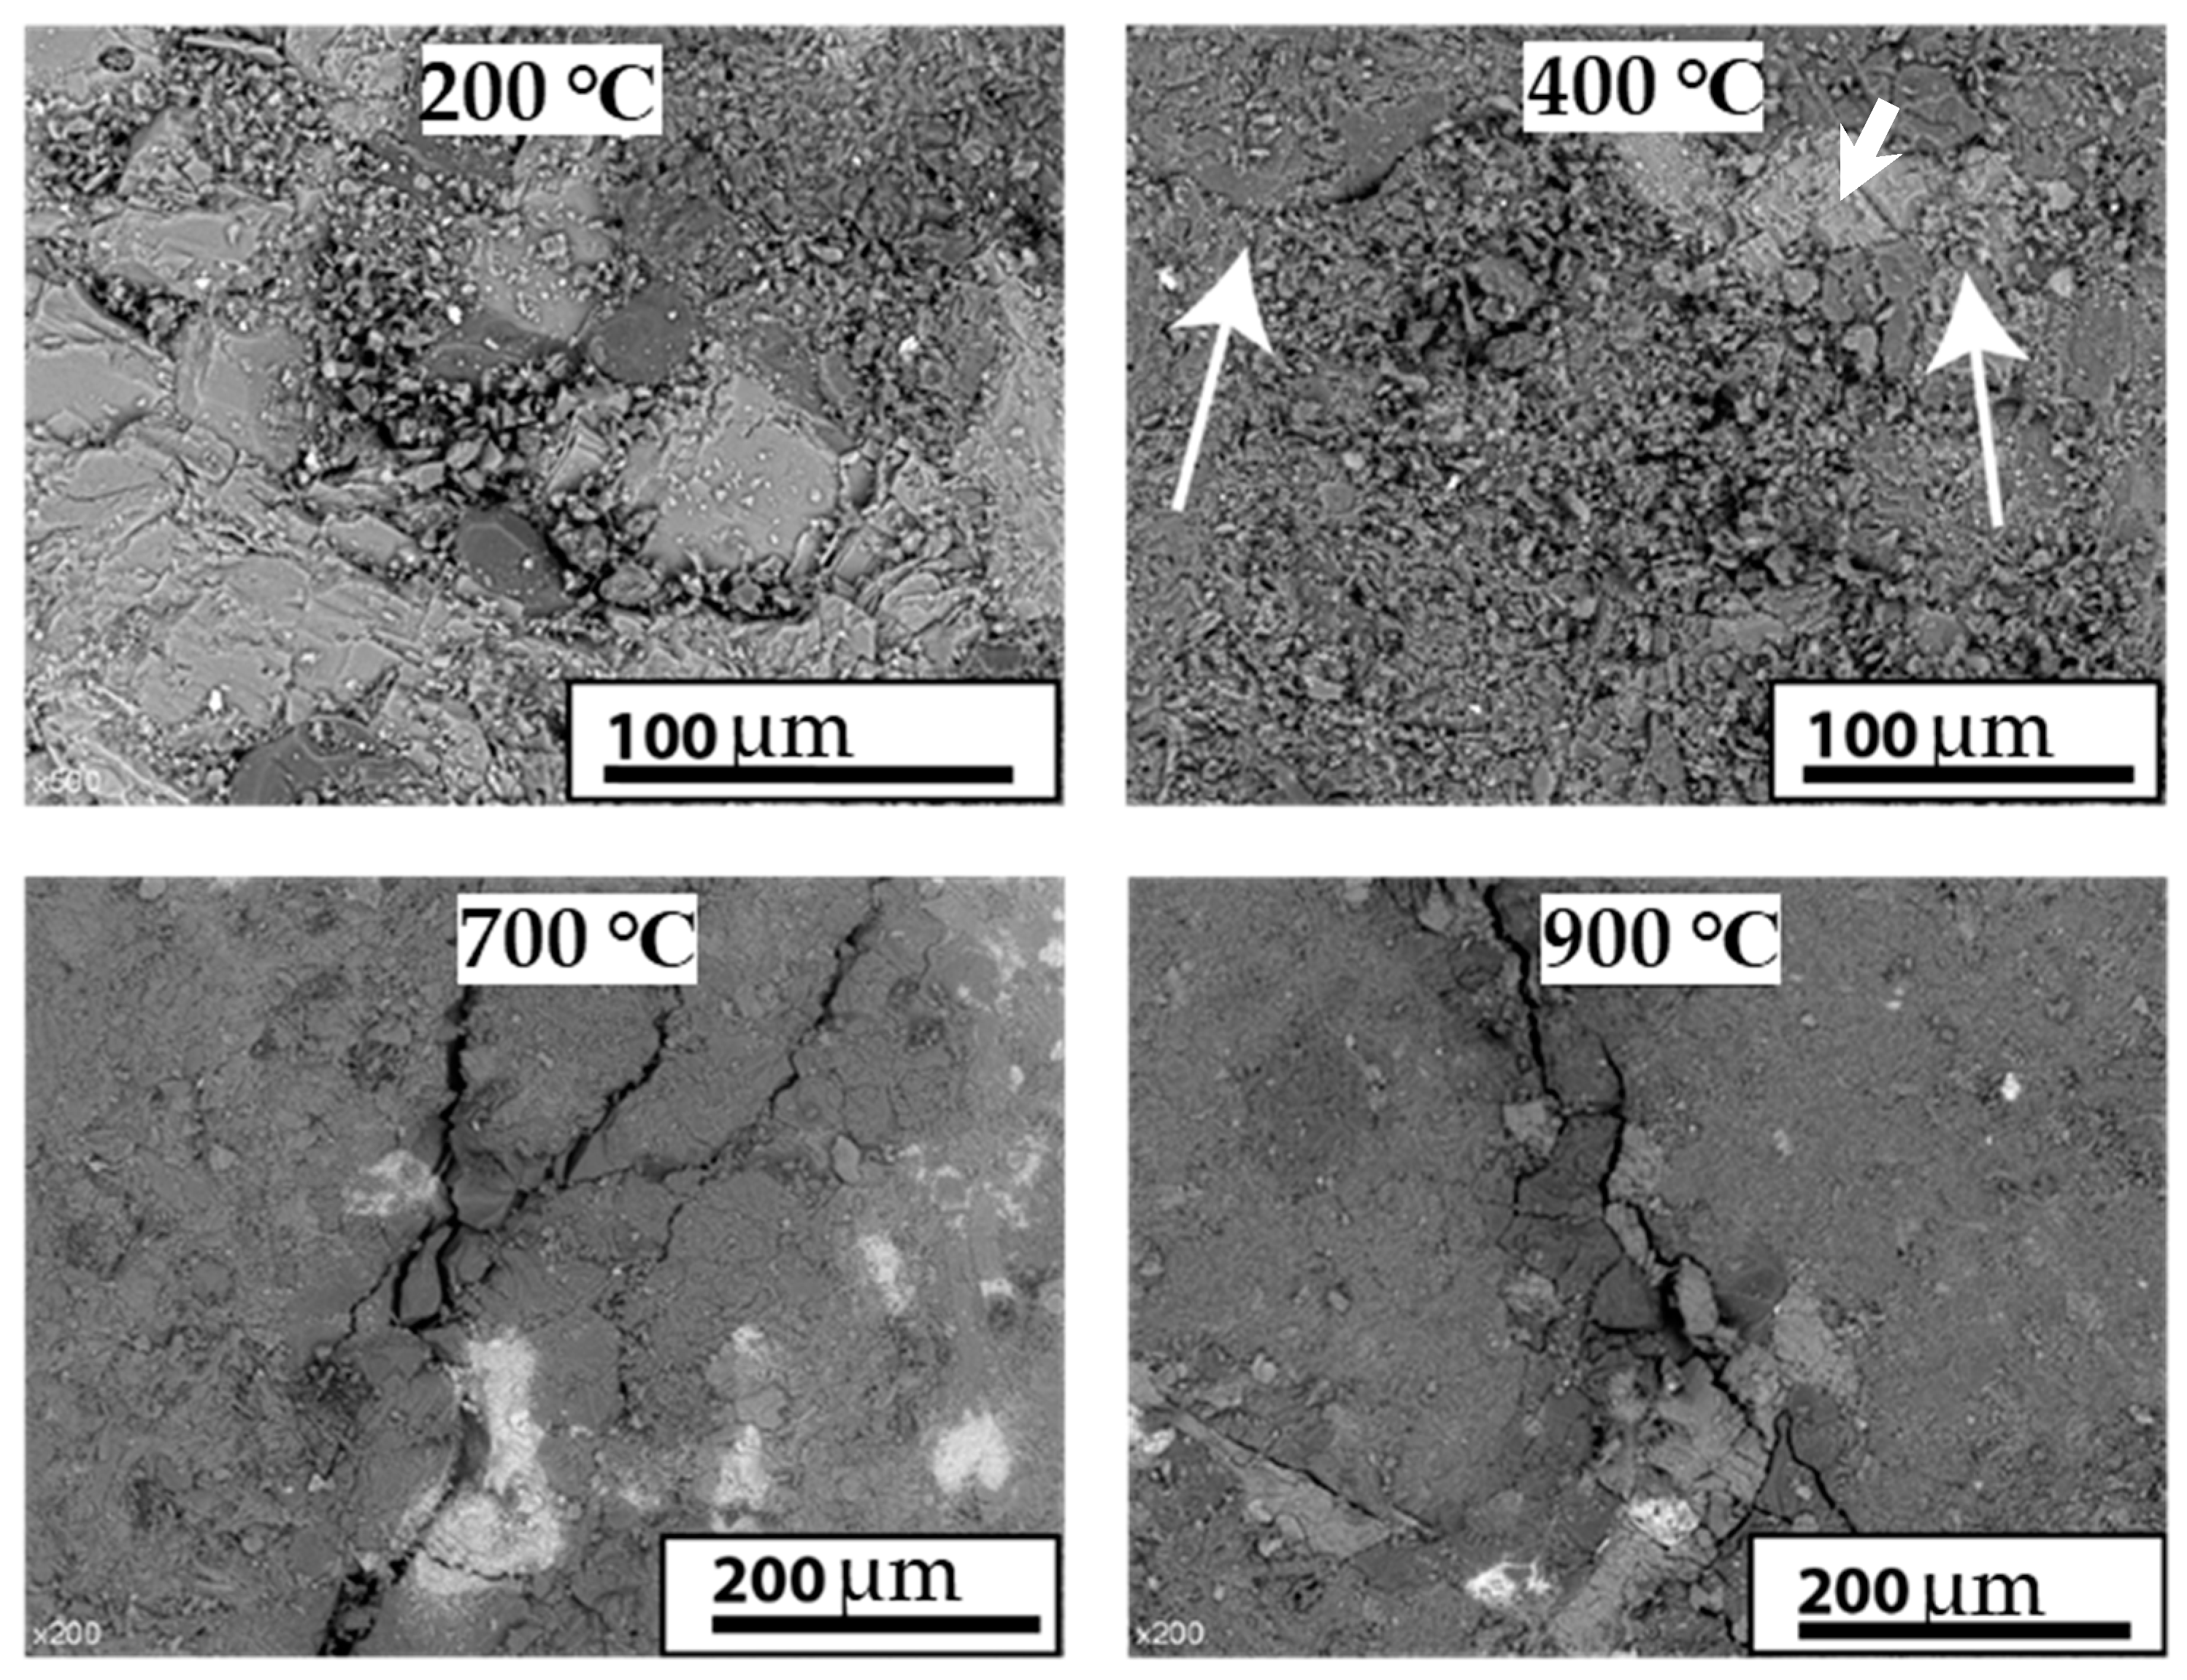
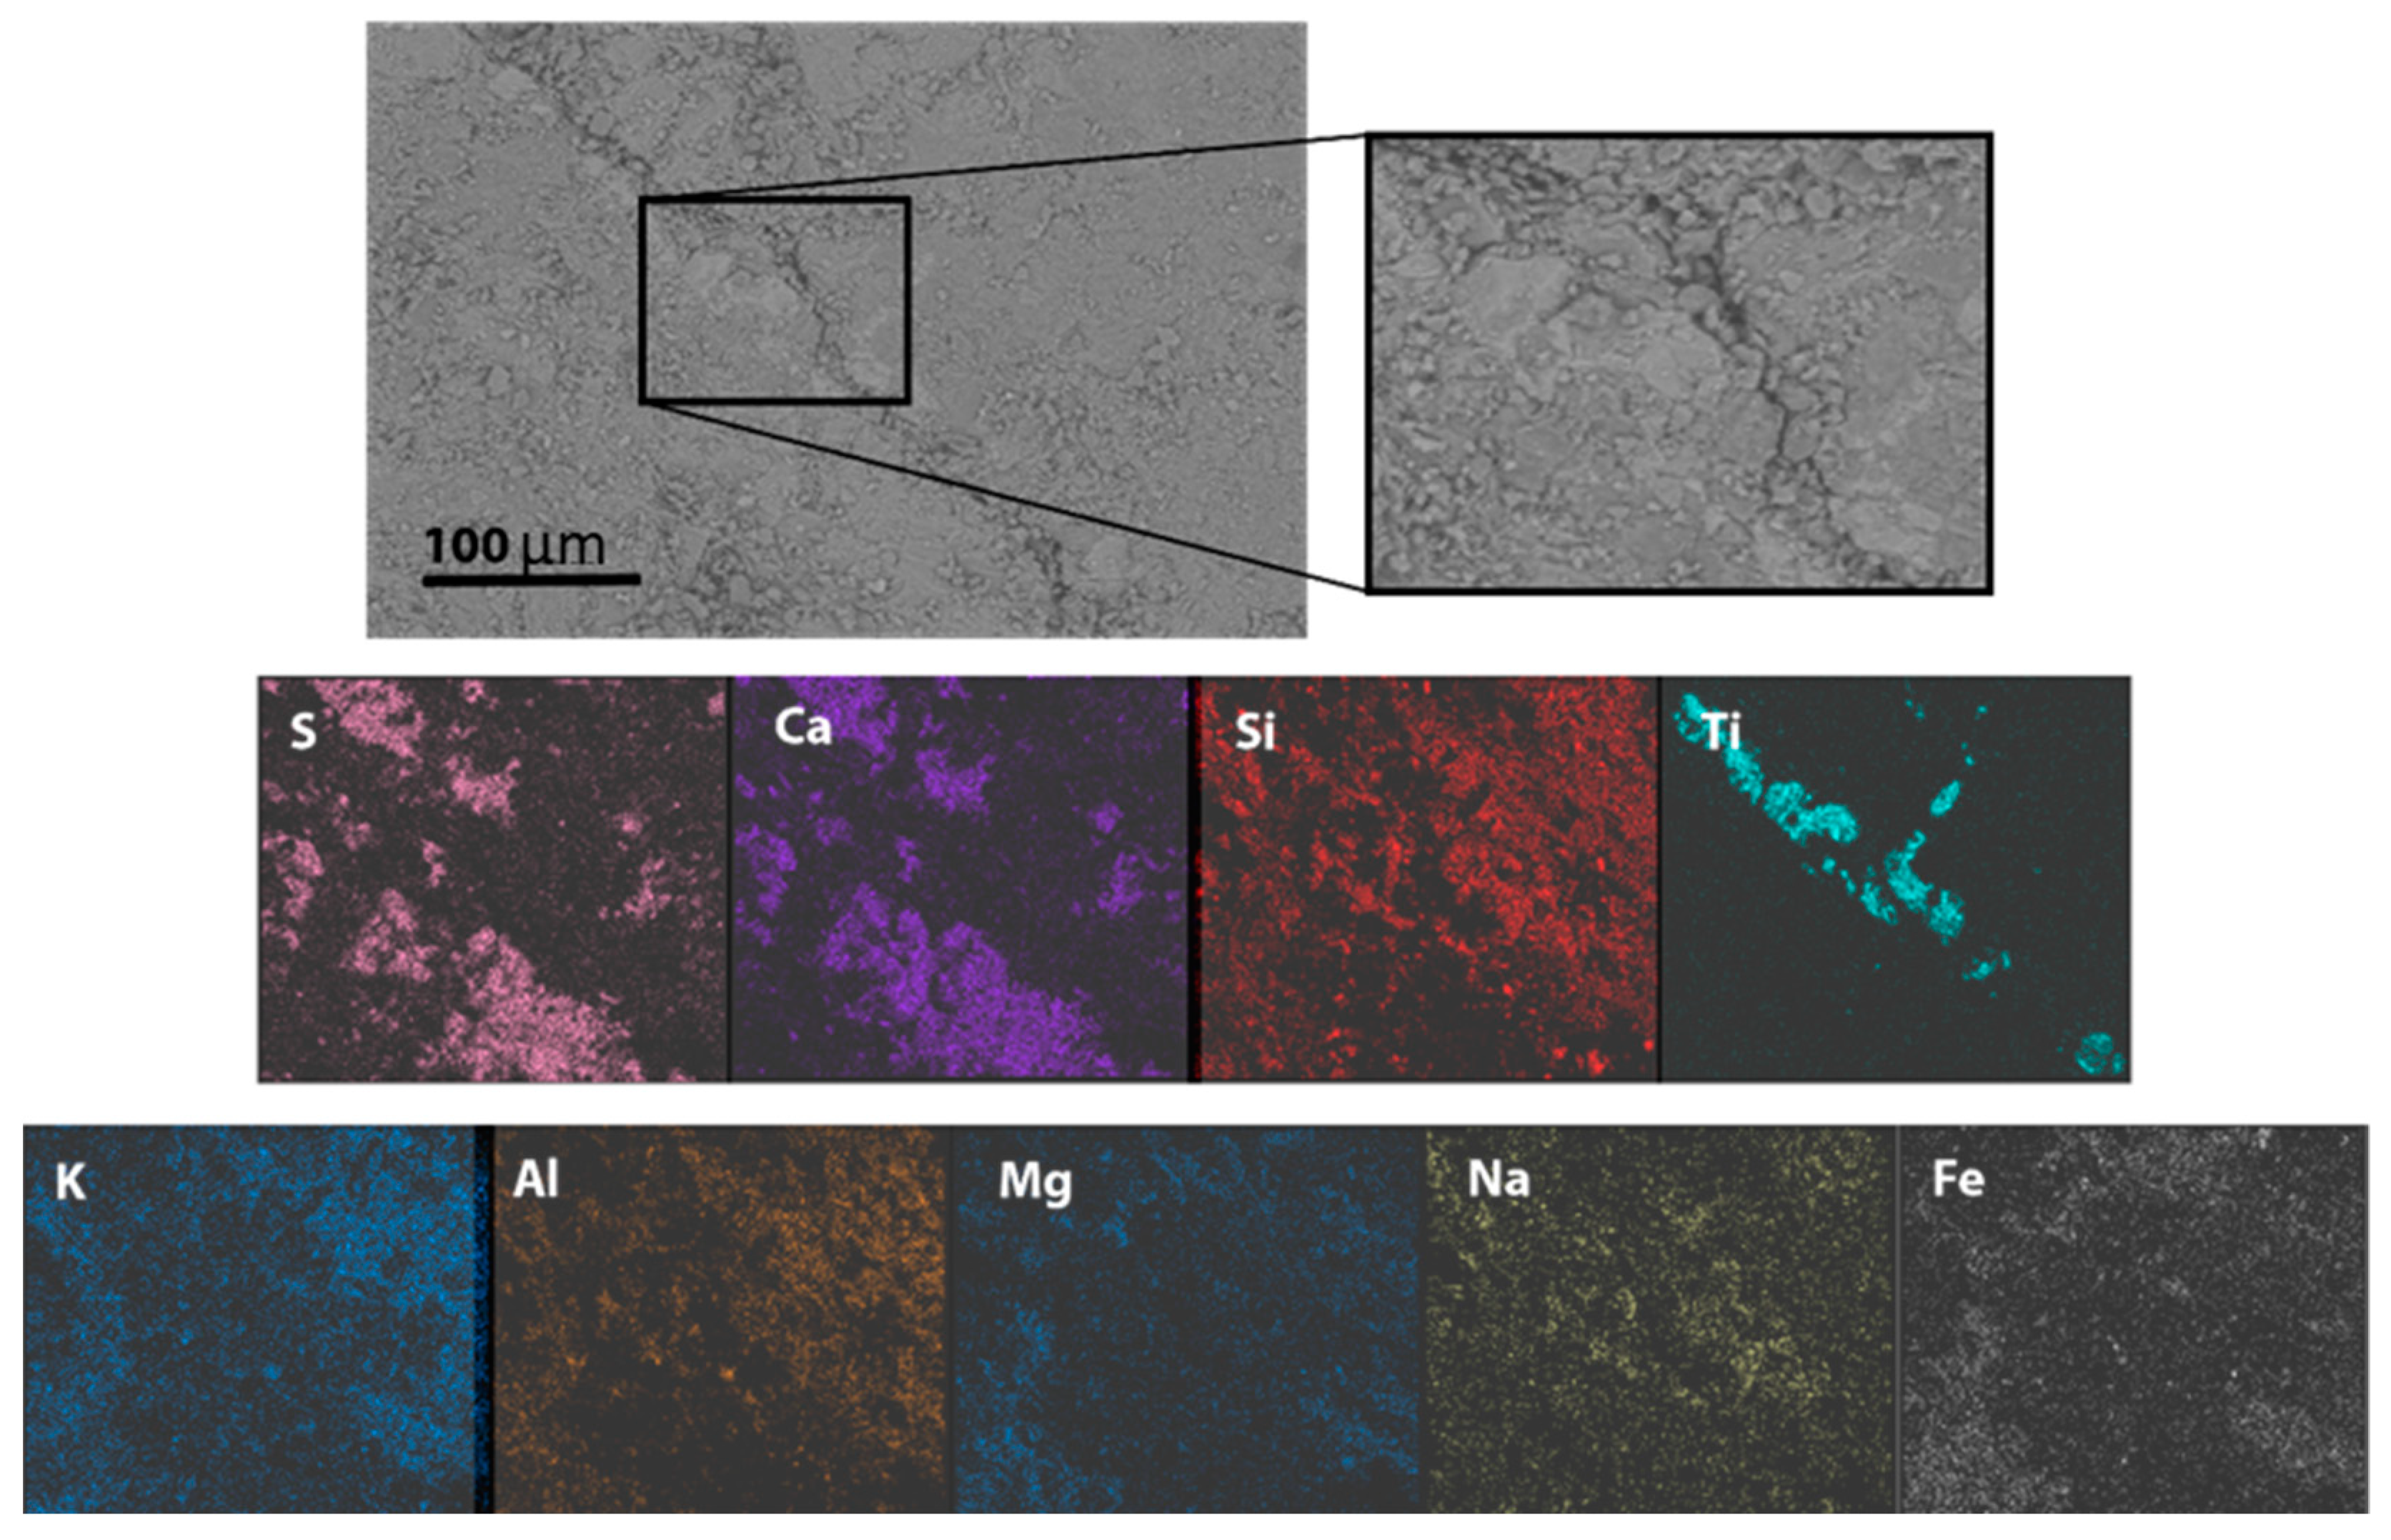
3.2. Microstructural Analysis
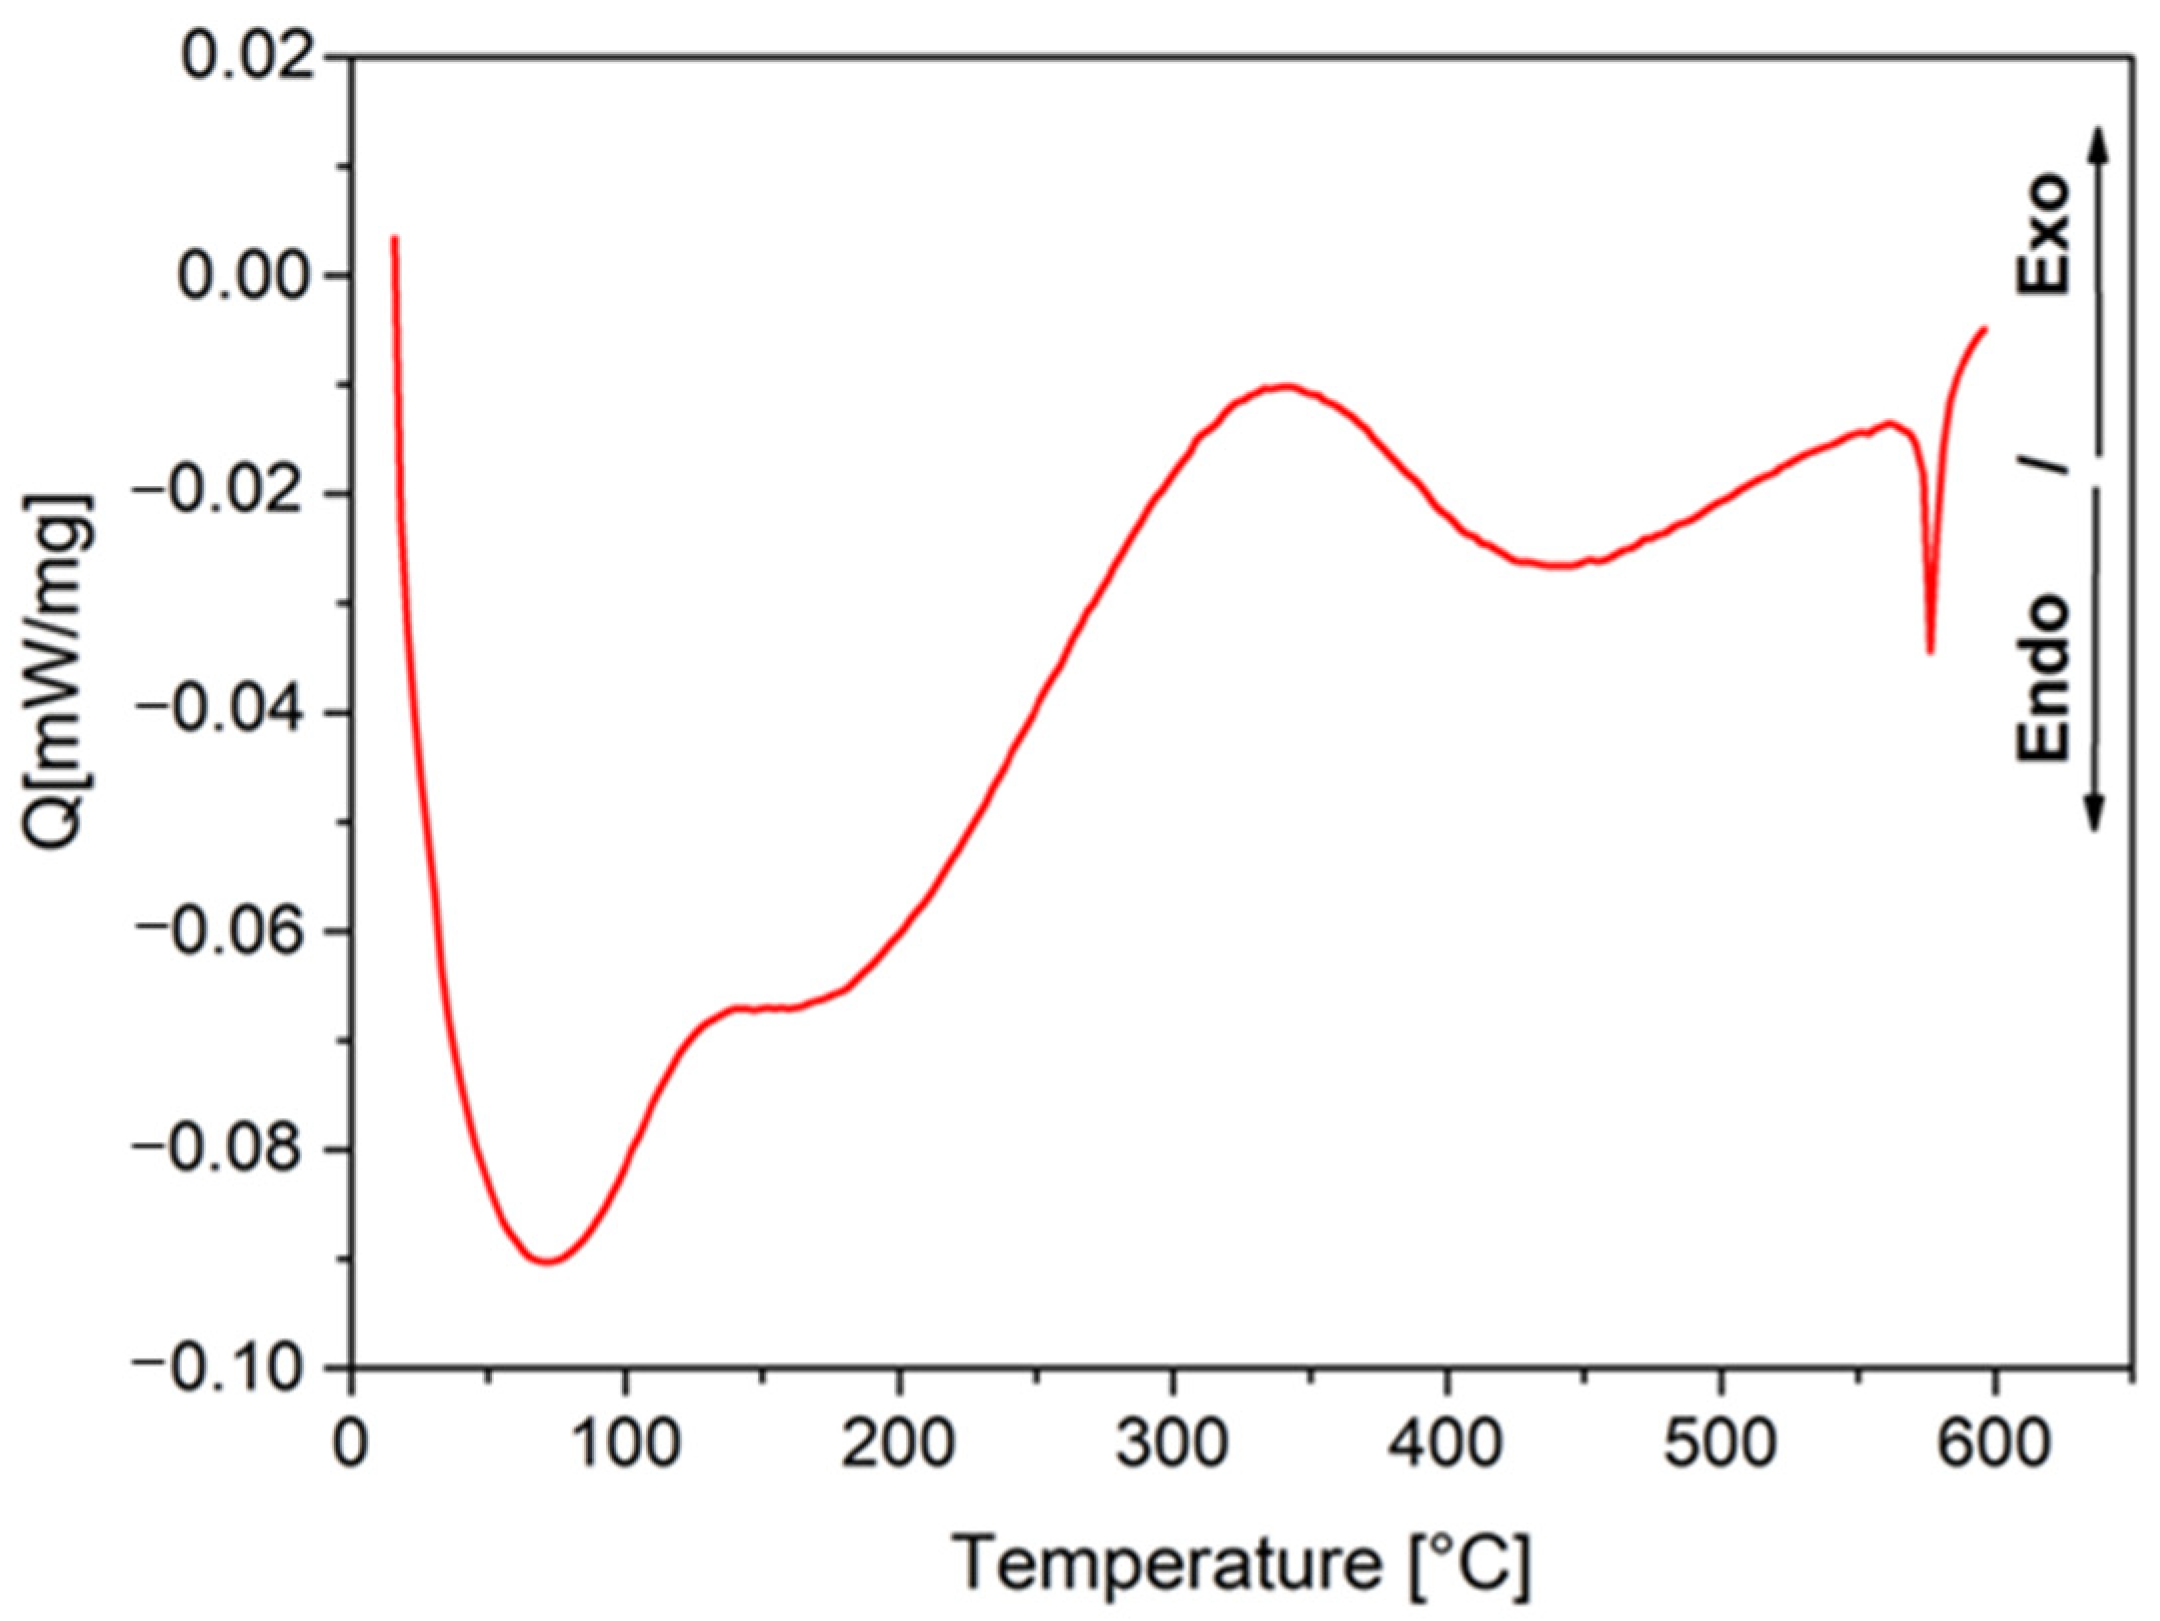
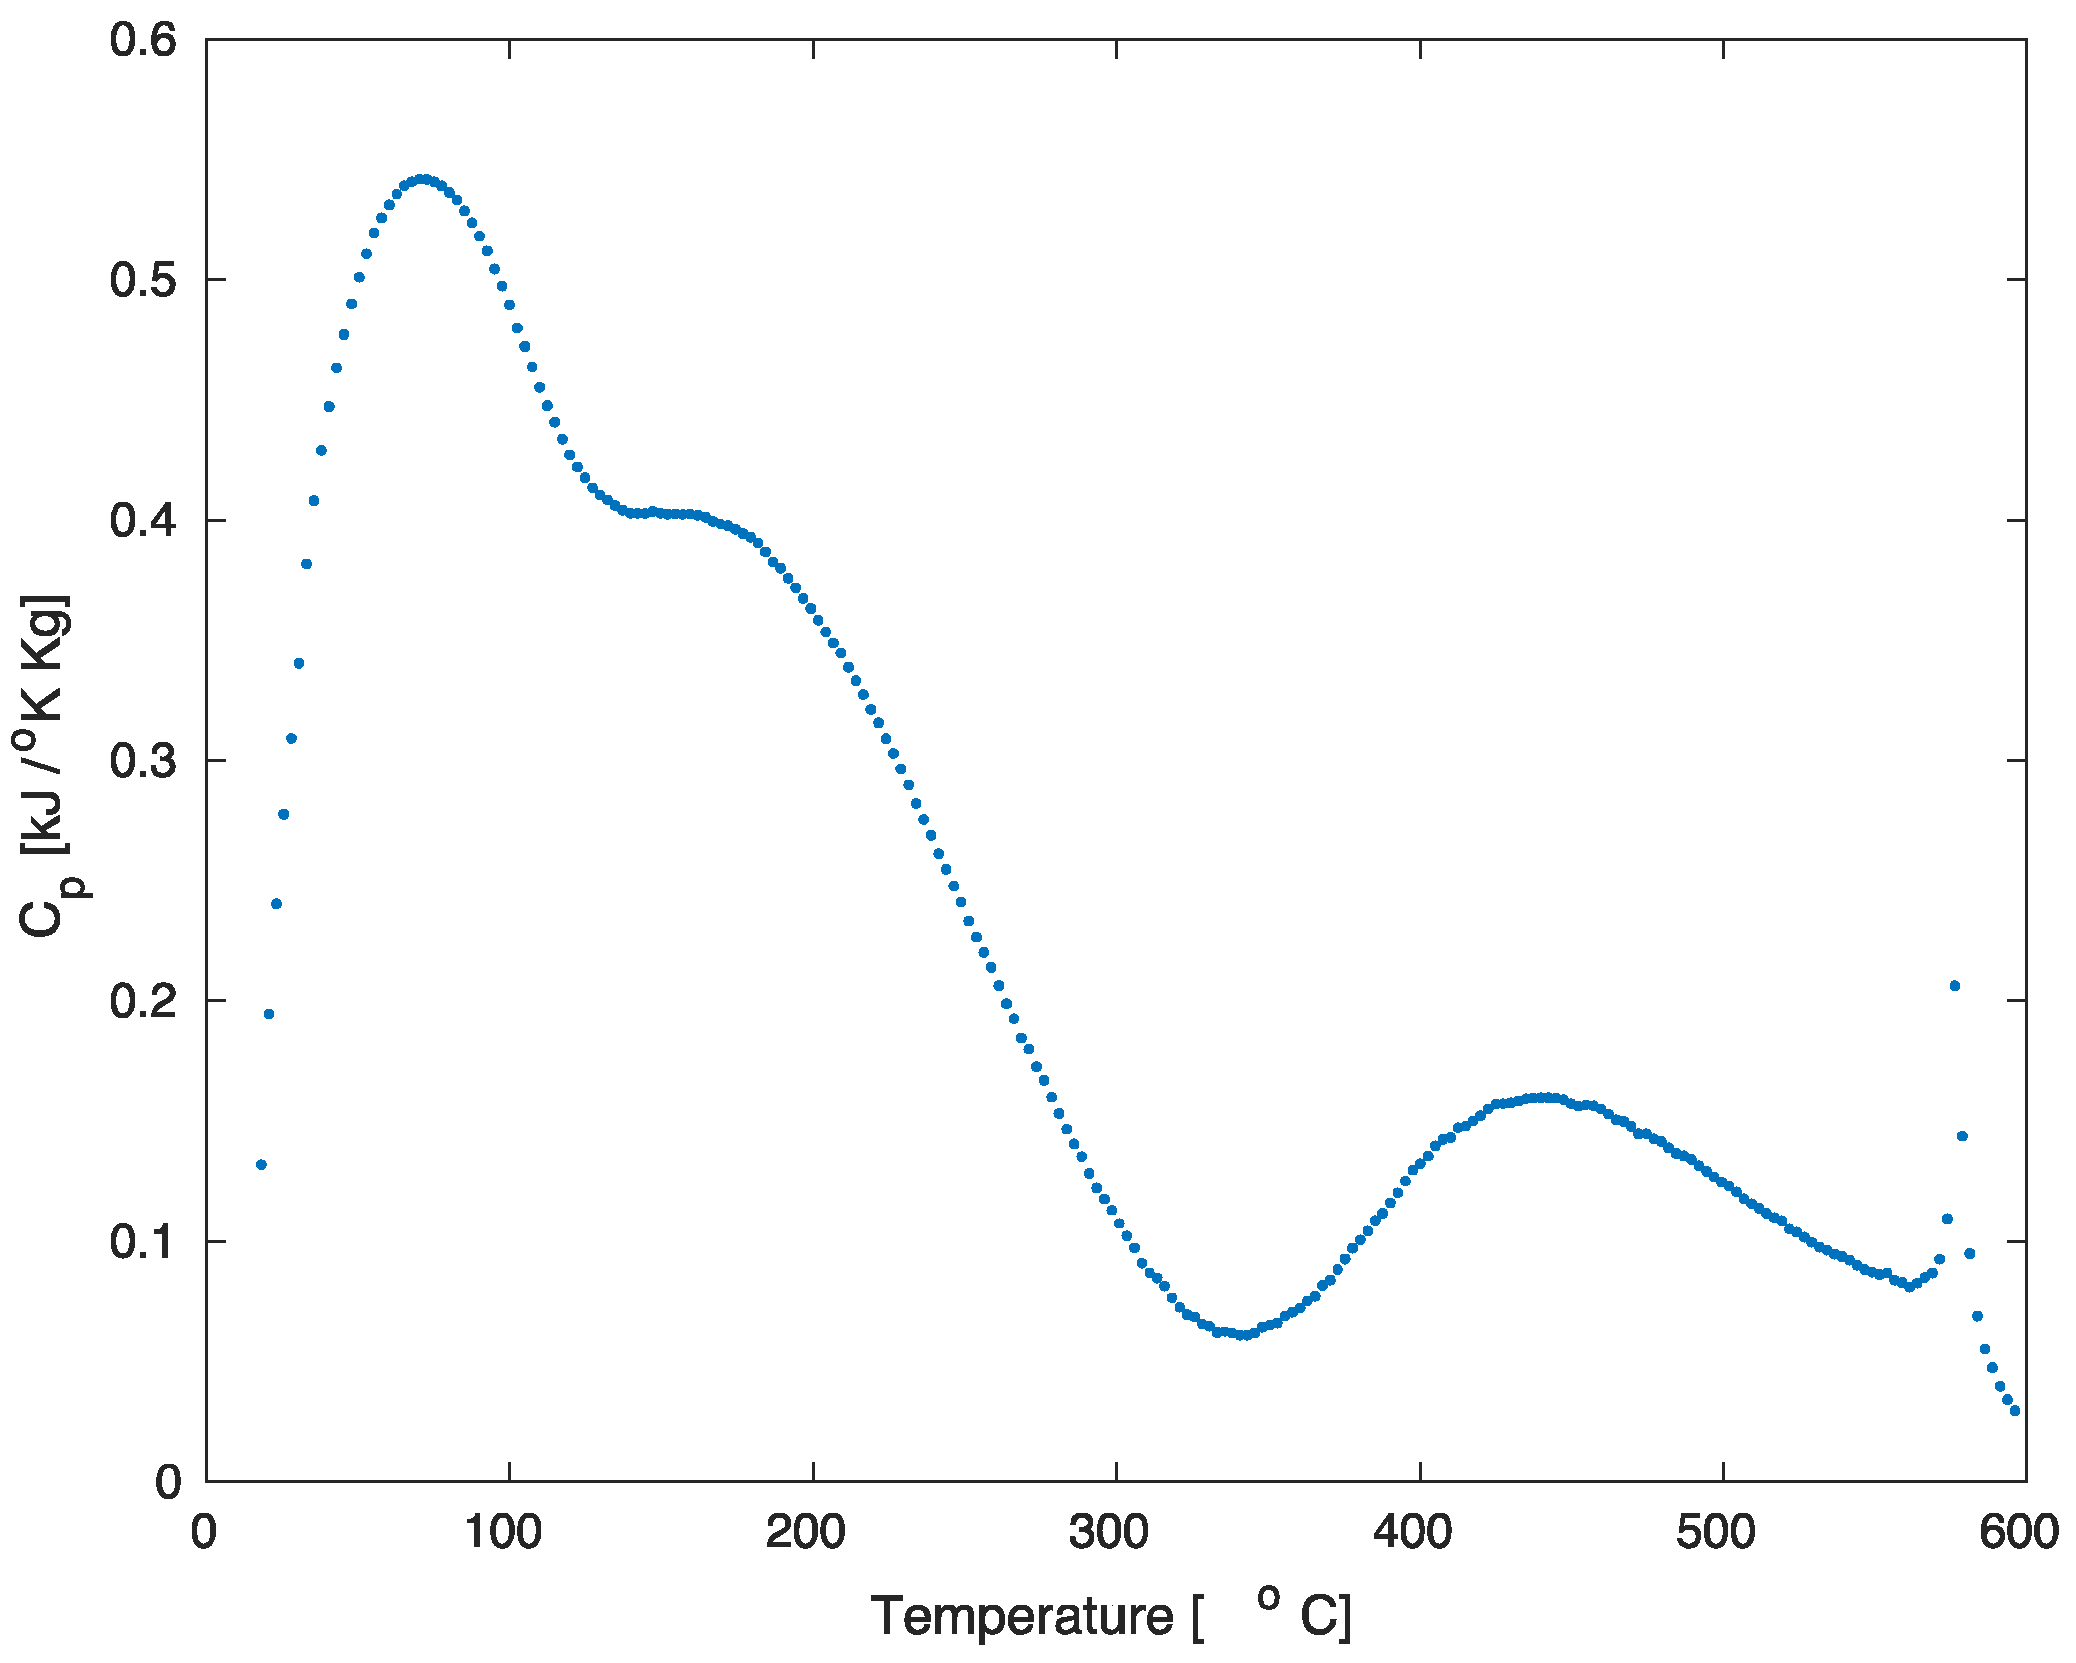
3.3. Aparent Specific Heat Capacity
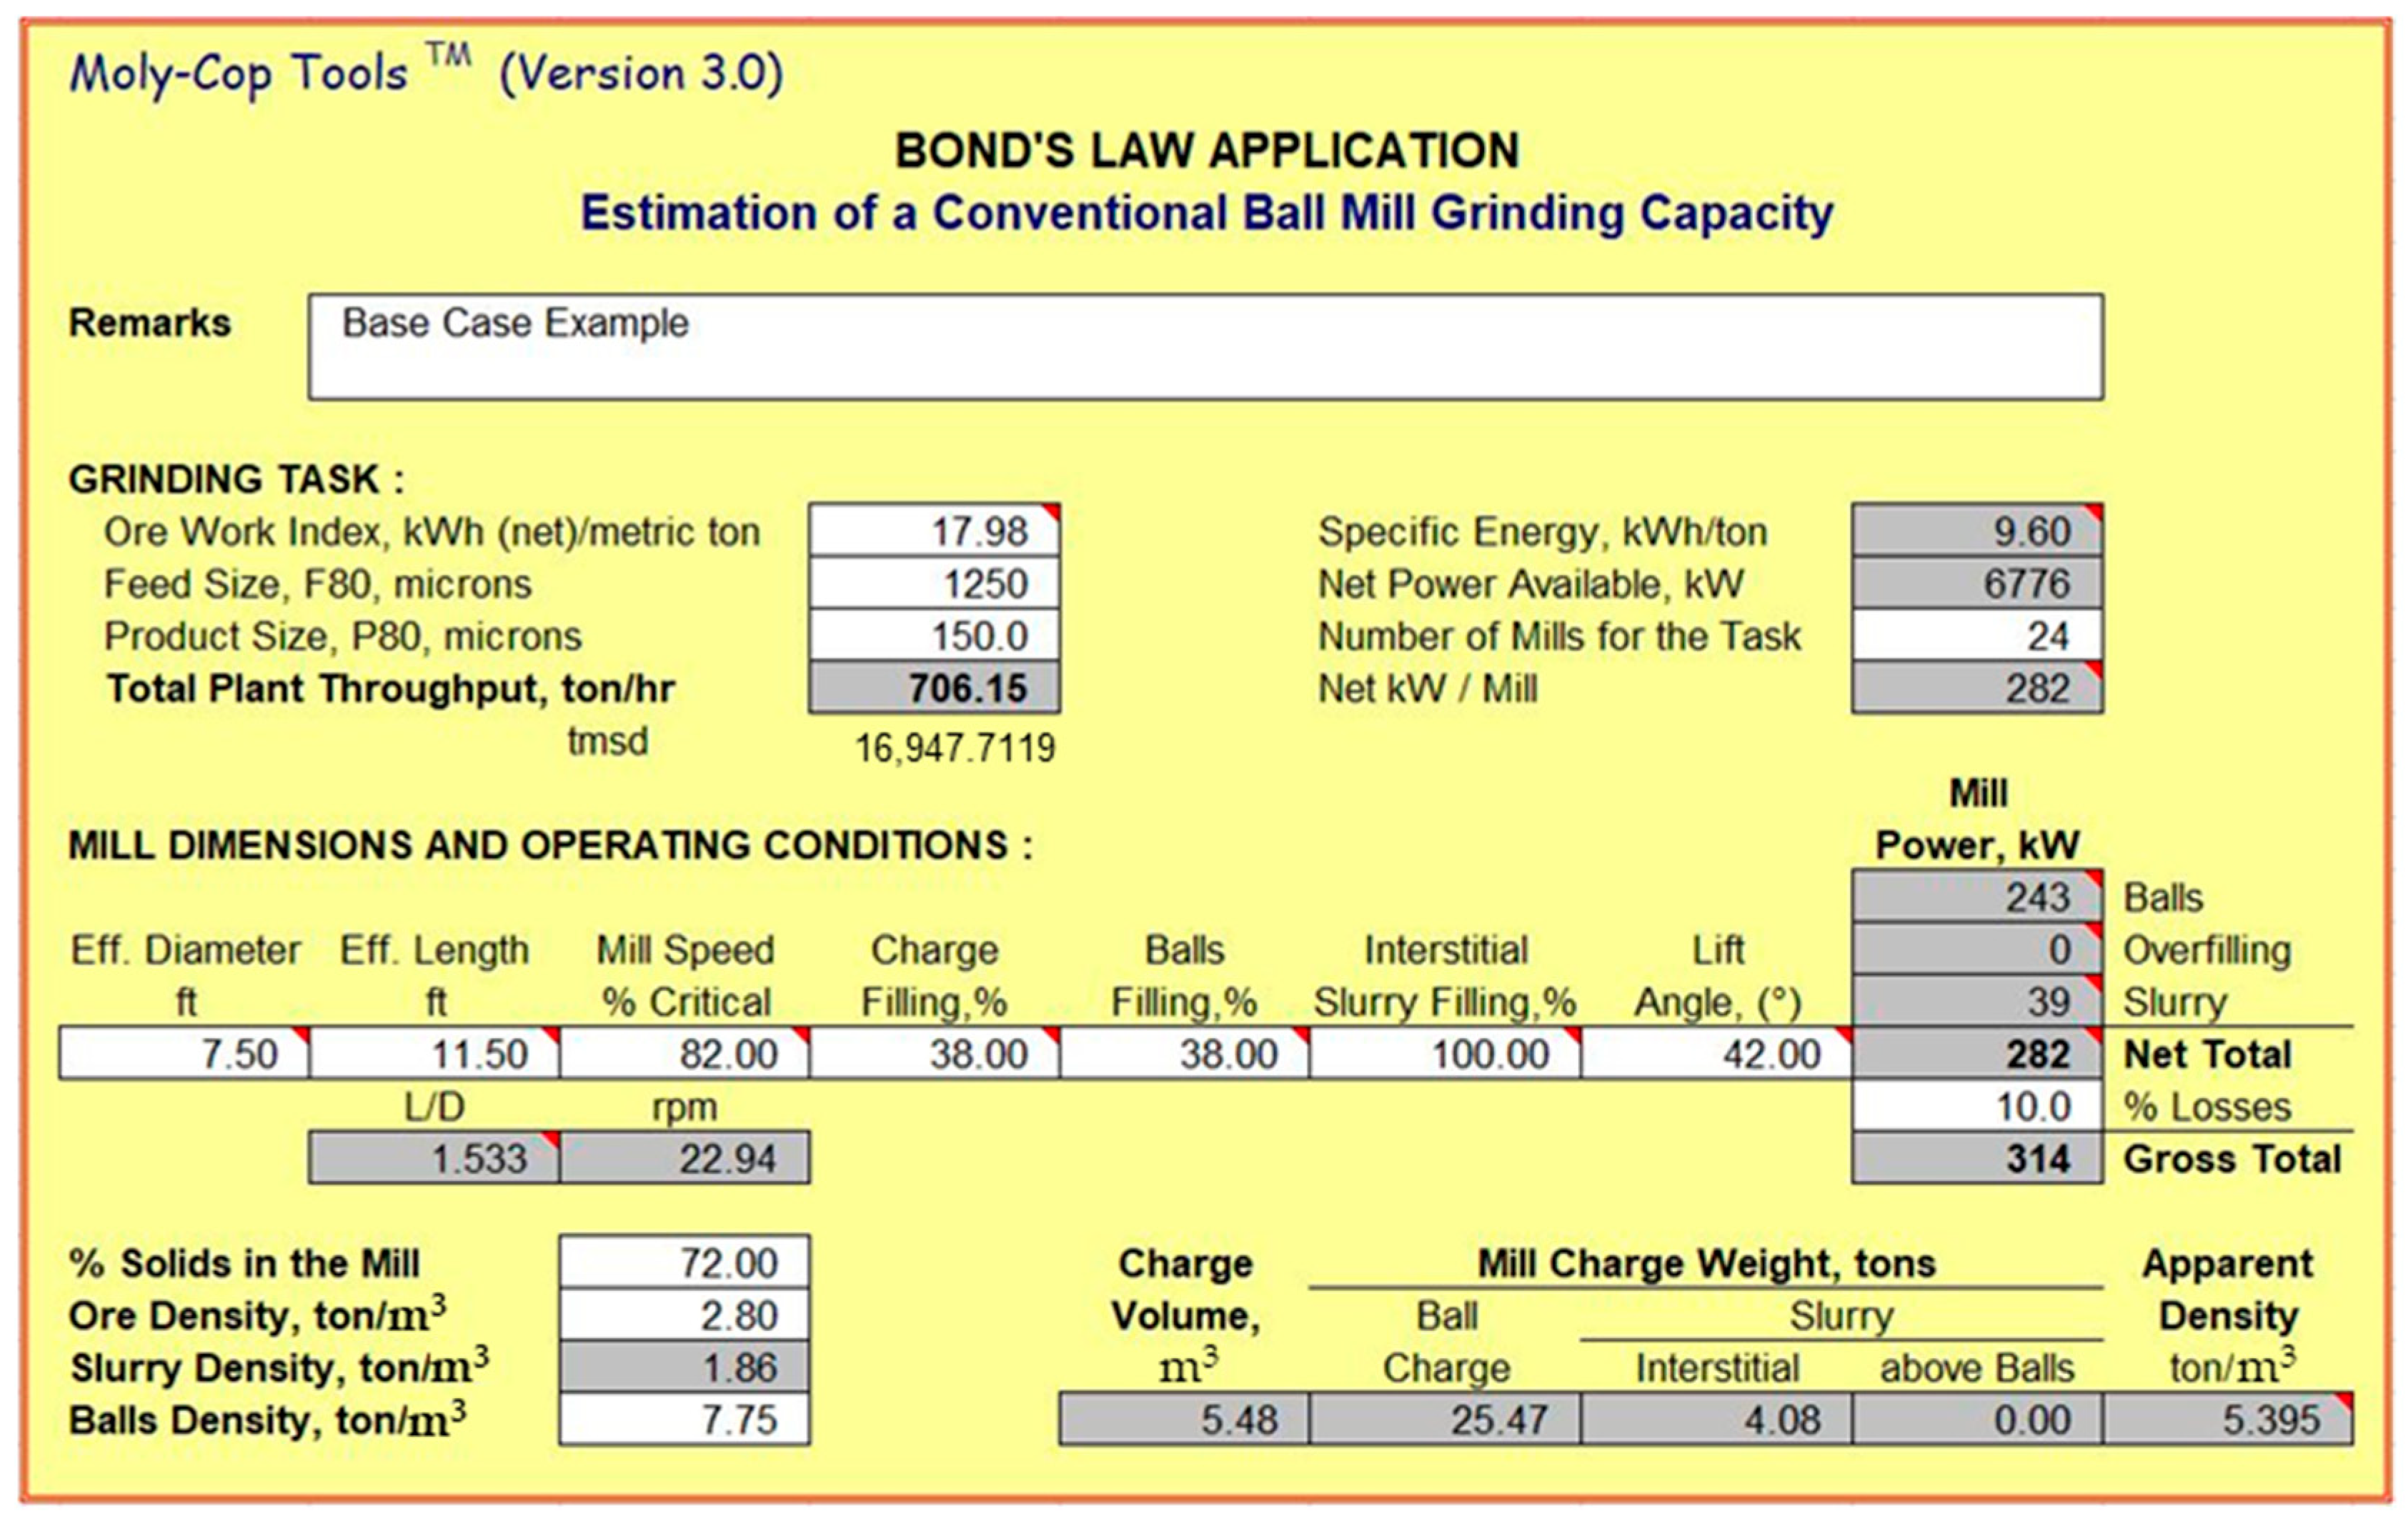
3.4. Potential Economic and Operational Impacts
4. Conclusions
Author Contributions
Funding
Conflicts of Interest
References
- Informe de Actualización del Consume Energético de la Minería del Cobre al Año 2017. Available online: https://www.cochilco.cl/Mercado%20de%20Metales/Informe%20de%20Consumo%20de%20Energ%C3%ADa%202017%20final.pdf (accessed on 11 April 2022).
- Heiskari, H.; Kurki, P.; Luukkanen, S.; Sinche, G.M.; Lehto, H.; Liipo, J. Development of a comminution test method for small ore samples. Miner. Eng. 2019, 130, 5–11. [Google Scholar] [CrossRef]
- Fuerstenau, D.F.; Abouzeid, M.A.-Z. The energy efficiency of ball milling in comminution. Int. J. Miner. Process. 2002, 67, 161–185. [Google Scholar] [CrossRef]
- Pamparana, G.; Kracht, W.; Haas, J.; Díaz-Ferrán, G.; Palma-Behnke, R.; Román, R. Integrating photovoltaic solar energy and a battery energy storage system to operate a semi-autogenous grinding mill. J. Clean. Prod. 2017, 165, 273–280. [Google Scholar] [CrossRef]
- Aditya, S.; Tapas, K.N.; Samir, K.P.; Arun, K.M. Pre-treatments of rocks prior to comminution—A critical review. Int. J. Min. Sci. Technol. 2017, 27, 339–348. [Google Scholar]
- Singh, V.; Dixit, P.; Venugopal, R.; Bhanu, V.K. Ore Pretreatment Methods for Grinding: Journey and Prospects. Min. Process. Extr. Metall. Rev. 2018, 40, 1–15. [Google Scholar] [CrossRef]
- Batchelor, A.R.; Buttress, A.J.; Jones, D.A.; Katrib, J.; Way, D.; Chenje, T.; Stoll, D.; Dodds, C.; Kingman, S.W. Towards large scale microwave treatment of ores: Part 1—Basis of design, construction and commissioning. Min. Eng. 2017, 109, 169–183. [Google Scholar]
- Batchelor, A.R.; Buttress, A.J.; Jones, D.A.; Katrib, J.; Way, D.; Chenje, T.; Stoll, D.; Dodds, C.; Kingman, S.W. Towards large scale microwave treatment of ores: Part 2—Metallurgicaltesting. Min. Eng. 2017, 111, 5–24. [Google Scholar] [CrossRef]
- Teipel, T.; Leisinger, K.; Mikonsaari, I. Comminution of crystalline material by ultrasonics. Int. J. Min. Process. 2004, 74, S183–S190. [Google Scholar] [CrossRef]
- Dmitrievna, S.L.; Germanovna, L.I.; Andreevich, C.R. Intensification of Cement Grinding with Apply Grinding Aids with Modify Effect. Mod. App. Sci. 2014, 8, 296–305. [Google Scholar]
- Singh, V.; Saxena, V.K.; Raj, R.; Venugopal, R. Artificial weathering of coal to enhance milling performance. Fuel 2015, 142, 117–120. [Google Scholar] [CrossRef]
- Pocock, J.; Veasey, T.J.; Tavares, L.M.; King, R.P. The effect of heating and quenching on grinding characteristics of quartzite. Powder Technol. 1998, 95, 137–142. [Google Scholar] [CrossRef]
- Tavares, L.M.; King, R.P. Evaluation of thermally-assisted fracture of particles using microscale fracture measurements. KONA Powder Part. J. 1999, 17, 163–172. [Google Scholar] [CrossRef] [Green Version]
- Fitzgibbon, K.E.; Veasey, T.J. Thermally assisted liberation—A review. Min. Eng. 1990, 3, 185–191. [Google Scholar] [CrossRef]
- Feng, G.; Kang, Y.; Meng, T.; Hu, Y.; Li, X. The influence of temperature on mode I francture toughness and fracture characteristics of sandstone. Rock Mech. Rock Eng. 2017, 50, 2007–2019. [Google Scholar] [CrossRef]
- He, C.; Zhao, J.; Su, X.; Ma, S.; Fujita, T.; Wei, Y.; Yang, J.; Wei, Z. Thermally Assisted Grinding of Cassiterite Associated with Pollimetallic Ore: A Comparison between Microwave and Conventional Furnaces. Minerals 2021, 11, 768. [Google Scholar] [CrossRef]
- Zuo, J.P.; Xie, H.P.; Dai, F.; Ju, Y. Three-point bending test investigation of the fracture behavior of siltstone after thermal treatment. Int. J. Rock Mech. Min. Sci. 2014, 70, 133–143. [Google Scholar] [CrossRef]
- Yin, T.; Li, X.; Xia, K.; Huang, S. Effect of thermal treatment on the dynamic fracture toughness of laurentian granite. Rock Mech. Rock Eng. 2012, 45, 1087–1094. [Google Scholar] [CrossRef]
- Molina, A.; Falvey, M.; Rondanelly, R. A solar radiation database for Chile. Sci. Rep. 2017, 7, 14829. [Google Scholar] [CrossRef]
- Skewes, M.A.; Arévalo, A.; Floody, R.; Zuñiga, P.H.; Stern, C.R. The Giant El Teniente Breccia Deposit: Hypogene Copper Distribution and Emplacement, Integrated Methods for Discovery: Global Exploration in the Twenty-First Century; Goldfarb, R.J., Nielsen, R.L., Eds.; Society of Economic Geologists: Littleton, CO, USA, 2002; Volume 9, Chapter 9. [Google Scholar] [CrossRef]
- Deniz, V.; Ozdag, H. A new approach to Bond grindability and work index: Dynamic elastic parameters. Min. Eng. 2003, 16, 211–217. [Google Scholar] [CrossRef]
- Omran, M.; Fabritius, T.; Mattila, R. Thermally assisted liberation of high phosphorus oolitic iron ore: A comparison between microwave and conventional furnaces. Power Technol. 2015, 269, 7–14. [Google Scholar] [CrossRef]
- Rojas Churkovic, I.P. Reología y Fábrica de Mineralización Primaria, Yacimiento el Teniento. Bachelor’s Thesis, Universidad de Chile, Santiago, Chile, 2014. [Google Scholar]
- Xia, M. Thermo-mechanical coupled particle model for rock. Trans. Nonferrous Met. Soc. China 2015, 25, 2367–2379. [Google Scholar] [CrossRef]
- Kostova, B.; Petkova, V.; Kostov-Kytin, V.; Tzvetanova, T.; Avdeev, G. TG/DTG-DSC and high temperature in-situ XRD analysis of natural thaumasite. Thermochim. Acta 2021, 697, 178863. [Google Scholar] [CrossRef]
- Martin, C.; Bonk, A.; Braun, M.; Odenthal, C.; Bauer, T. Investigation of the long-term stability of quartzite and basalt for a potential use as filler materials for a molten-salt based thermocline storage concept. Sol. Energy 2018, 171, 827–840. [Google Scholar] [CrossRef]
- Aneesuddin, M.; Char, P.; Hussain, M.; Saxena, E. Studies on thermal oxidation of chalcopyrite from Chitradurga, Karnataka State, India. J. Therm. Anal. 1983, 26, 205–215. [Google Scholar] [CrossRef]
- Carvalho, M.; Leles, M.; Tubino, R. TG and DSC studies on plaster residues as recycled material. J. Therm. Anal. Calorim. 2008, 91, 621–625. [Google Scholar] [CrossRef]
- Moly-Cop. Moly-Cop Tools. 2022. Available online: https://molycop.com/what-we-do/molycop-tools/ (accessed on 24 August 2021).
- Segura, J. Optimization of Transfer Sizes in Sewell Crushing and Grinding by Means of Process Simulation. Bachelor’s Thesis, Codelco El Teniente Division, Pontificia Universidad Católica de Valparaíso, Valparaíso, Chile, 2016. Available online: http://opac.pucv.cl/pucv_txt/txt-5500/UCD5763_01.pdf (accessed on 11 April 2022). (In Spanish).
- Invest.com. Copper Future Historical Prices. Available online: https://www.investing.com/commodities/copper-historical-data (accessed on 24 August 2021).
- Corporacion Chilena del Cobre. Analisis Histórico de los Precios de la Energía Eléctrica en Minería y su Impacto en Competitividad. 2014. Available online: https://www.cochilco.cl/Listado%20Temtico/Analisis%20Historico%20de%20Precios%20de%20EE%2024-12-2014%20vf.pdf (accessed on 11 April 2022).


| Quantity of Balls | Size (mm) |
|---|---|
| 43 | 36.8 |
| 67 | 29.72 |
| 10 | 25.40 |
| 71 | 19.05 |
| 94 | 15.49 |
| Work Index (kWh/ton) | Tonnage (tmsd) | Difference Copper Ton/Day | Incremental Income (USD/Day) |
|---|---|---|---|
| 17.98 | 16,947.63 | - | - |
| 17.85 | 17,071.22 | 0.6943 | 6499 |
| 17.48 | 17,432.41 | 2.7231 | 25,530 |
| 16.89 | 18,041.52 | 6.1445 | 57,600 |
| 14.52 | 20,986.32 | 22.6855 | 212,684 |
Publisher’s Note: MDPI stays neutral with regard to jurisdictional claims in published maps and institutional affiliations. |
© 2022 by the authors. Licensee MDPI, Basel, Switzerland. This article is an open access article distributed under the terms and conditions of the Creative Commons Attribution (CC BY) license (https://creativecommons.org/licenses/by/4.0/).
Share and Cite
Cisternas, N.; Tobosque, P.; Sbarbaro, D.; Munnier, C.; Kracht, W.; Carrasco, C. Heating Pre-Treatment of Copper Ores and Its Effects on the Bond Work Index. Minerals 2022, 12, 593. https://doi.org/10.3390/min12050593
Cisternas N, Tobosque P, Sbarbaro D, Munnier C, Kracht W, Carrasco C. Heating Pre-Treatment of Copper Ores and Its Effects on the Bond Work Index. Minerals. 2022; 12(5):593. https://doi.org/10.3390/min12050593
Chicago/Turabian StyleCisternas, Nataly, Pablo Tobosque, Daniel Sbarbaro, Carlos Munnier, Willy Kracht, and Claudia Carrasco. 2022. "Heating Pre-Treatment of Copper Ores and Its Effects on the Bond Work Index" Minerals 12, no. 5: 593. https://doi.org/10.3390/min12050593
APA StyleCisternas, N., Tobosque, P., Sbarbaro, D., Munnier, C., Kracht, W., & Carrasco, C. (2022). Heating Pre-Treatment of Copper Ores and Its Effects on the Bond Work Index. Minerals, 12(5), 593. https://doi.org/10.3390/min12050593