Article

In Situ FIB-TEM-TOF-SIMS Combination Technique: Application in the Analysis of Ultra-Light and Trace Elements in Phyllosilicates

1
State Key Laboratory of Continental Dynamics, Department of Geology, Northwest University, Xi’an 710069, China
2
Lunar and Planetary Sciences Research Center, Institute of Geochemistry, Chinese Academy of Sciences, Guiyang 550081, China
3
Center for Excellence in Comparative Planetology, Chinese Academy of Sciences, Hefei 230026, China
4
College of Earth and Planetary Sciences, University of Chinese Academy of Sciences, Beijing 100049, China
5
School of Metallurgical and Energy Engineering, Kunming University of Science and Technology, Kunming 650093, China
6
Geological and Mineral Exploration Institute, Non-Ferrous Metals and Nuclear Industry Geological Exploration Bureau of Guizhou, Guiyang 550005, China
7
College of Earth Sciences, Guilin University of Technology, Guilin 541006, China
*
Authors to whom correspondence should be addressed.
Minerals 2022, 12(5), 562; https://doi.org/10.3390/min12050562
Submission received: 4 March 2022 / Revised: 26 April 2022 / Accepted: 28 April 2022 / Published: 29 April 2022
(This article belongs to the Special Issue Recent Advances in Clay-Based Nanocomposites)

Abstract

:
At present, a single technical method has difficulty in obtaining microscopic data of ultra-light elements, trace elements, and crystal structures in samples simultaneously. This work combined an in situ focused ion beam—transmission electron microscopy—time of flight secondary ion mass spectrometry (FTT) technique and analyzed the composition and crystal structure of four phyllosilicate samples. These materials were comprised of antigorite, clinochlore, and cookeite phases. An FIB sample preparation technique was found to provide a sample thickness suitable for TEM observations and a degree of surface roughness appropriate for TOF-SIMS analysis. In addition, the relative amounts and distributions of various elements could be obtained, as well as crystal structure data, such that the composition and crystal structure of each specimen were determined. The in situ FTT method demonstrated herein successfully combines the advantages of all three analytical techniques and offers unique advantages with regard to analyzing ultra-light and trace elements as well as the structural data of phyllosilicates.

1. Introduction

Phyllosilicates are silicate minerals with a layered structure. Because the individual Si-O tetrahedra in these structures form layers based on the sharing of 3/4 corners, there exists an unbalanced charge of O as a result of the unshared tetrahedra. Such O atoms readily combine with cations or anions to form various phyllosilicates or clay minerals. As an example, serpentine minerals can be categorized as lizardite, antigorite, or chrysotile polymorphs. In addition, chrysotile can have ortho or clino structures [1,2]. The exact types of phyllosilicates can be determined by assessing the metal cations and H atoms present in the material as well as the crystal structure. Light elements are the components in the chemical formula of layered silicate minerals. When conducting a preliminary mineralogical analysis of layered silicate minerals, it is necessary to determine which light elements are present in the minerals to determine their types. Meanwhile, the trace elements in layered silicate minerals may reflect the geological process during their formation.
Elements present at low levels in phyllosilicates have previously been assayed using X-ray fluorescence (XRF), inductively coupled plasma—mass spectrometry (ICP-MS), ICP—optical emission spectrometry (ICP-OES), atomic absorption spectroscopy (AAS), electron energy loss spectroscopy (EELS), nano-scale secondary ion MS (nano-SIMS), and time of flight SIMS (TOF-SIMS). Among these techniques, sample processing of XRF, ICP-MS, and ICP-OES is destructive, and its spatial variability is lost, thus they cannot be used for in situ characterization [3,4,5,6,7,8,9,10]. In addition, although AAS can provide high sensitivity and accuracy, it is difficult to determine multiple elements simultaneously using this technique [11]. The disadvantage of EELS is that light elements with less than 1% content as well as noble gases cannot be detected [12]. In addition, Li+, which has only one layer of out-of-nucleus electrons, and H+, which has no layer of out-of-nucleus electrons, cannot make interlayer leaps of electrons, and cannot be detected with EELS [13,14]. Both nano-SIMS and TOF-SIMS can directly observe the distributions of trace elements, although the former can provide quantitative data but needs to follow strict sample preparation rules and requires a relatively long analysis time, whereas the latter can only assess the relative amounts of elements [12,15,16,17].
The analysis of ultra-light elements (defined herein as elements with atomic numbers less than or equal to 3, including H, and Li, except for He) will require the use of high-performance instrumental techniques. The main technique currently employed to analyze ultra-light elements in phyllosilicates is focused ion beam (FIB)-TOF-SIMS. As an example, this instrumentation was previously used to determine the spatial distributions of H, Li, and B via a multi-angle analysis [18]. However, this prior work did not provide structural information.
Therefore, it appears that elucidating both the composition and crystal structure of phyllosilicates will require a combination of suitable instruments. On this basis, the present work experimented with the use of in situ FIB-transmission electron microscopy (TEM)-TOF-SIMS (abbreviated herein as FTT) to examine serpentine and clay samples containing Li. Results show that this technique successfully provided the relative amounts and distributions of ultra-light and trace elements and allowed an assessment of the crystal structure of phyllosilicates, under the premise of solving the roughness and thickness of the experimental sample. This work demonstrates the advantages of in situ FTT when analyzing ultra-light and trace elements as well as crystal structure in phyllosilicates.

2. Experimental

2.1. Samples

A serpentine sample and three other Li-bearing phyllosilicates were used in this work. The serpentine was obtained from Xiuyan in Liaoning province, China. This material had an overall translucent appearance with a greenish coloration, contained Mg2+ as the primary metal ion [19,20], and had the theoretical formula (Mg, Fe)6 [Si4O10] (OH)8. The Li-containing samples were taken from a newly discovered deposit in the Yunnan-Guizhou region of China and were primarily comprised of clay minerals such as montmorillonite, chlorite, and illite [21,22,23].

2.2. Instrumentation and Operating Condition

After cutting specimens from each sample into a centimeter size suitable for placement in the electron microscope, each specimen was polished with silicon carbide sandpaper (2000 mesh), washed with ethanol, and dried in an oven at 80 °C for 12 h. The samples were subsequently coated with gold, after which they were examined using scanning electron microscopy (SEM), employing an FEI Scios dual-beam instrument operated in the backscatter mode. The serpentine samples were each found to have a homogeneous composition, while the Li-bearing minerals were heterogeneous. The latter materials are designated herein as ZK 1526h1, ZK 1522h1-1, and ZK 1522h1-2, respectively.
FIB analyses were performed using the FEI Scios dual-beam SEM instrument at the Institute of Geochemistry, Chinese Academy of Sciences (CAS) in Guiyang, China. The areas to be examined were cut from the specimens at a distance of 7 mm using a 15 kV Ga+ ion beam, and cross-sections having dimensions of 12 μm × 12 μm × 2 μm were extracted and welded to Cu grids using Pt. The sections were thinned at angles at 52° ± 2° and 52° ± 1.5° to thicknesses of approximately 100 nm, such that they were suitable for analysis by TEM [24]. This unique FIB-based thinning method provided a less degree of surface roughness for TOF-SIMS analysis.
The micron crystal structure and composition of each specimen were examined by TEM, employing an FEI Talos F200X field emission instrument at the Suzhou Institute of Nanotechnology and Bionics, CAS. Structural data regarding submicron and nano-sized particles were obtained by operating the instrument in the selected area electron diffraction (SAED), and Fast Fourier transform (FFT) image of high-resolution transmission electron microscopy (HRTEM) mode, respectively. In addition, the high angle annular dark-field (HAADF) mode, together with energy dispersive spectrometry (EDS), was used to map out the distributions of elements (atomic number greater than or equal to 5, inaccurate when measuring atomic number less than 11 and measuring noble gases) present at concentrations greater than 0.1% in the samples. Of note, because the TEM analyses slightly damaged the samples, we can get the most information such as major elements and crystal structure information first, and then get more detailed information such as ultra-light elements and trace elements, since TEM was typically performed before TOF-SIMS assessments.
TOF-SIMS is a technique in which masses of ions generated by an ionization beam are determined based on differences in flight times and is well suited to the analysis of solid samples with well-polished surfaces that are not limited by electrical conductivity. In the present work, ultra-light and trace elements in the samples were assayed on a TOF.SIMS 5-100 instrument at Tsinghua University, Beijing, China. Following the TEM analysis of each sample, the Cu grid holding the FIB specimen was fixed horizontally on a sample tray and then placed in the sample compartment and held under a vacuum of 8.8 × 10⁻⁹ mbar for approximately 12 h. During the analysis of the serpentine specimens, a primary Bi3+ ion beam was employed while the secondary ion beam contained both positive and negative particles with masses in the range of 0 to 900 amu. The assessment of the Li-bearing minerals used a primary Bi+ ion beam and the secondary ion beam comprised solely negative ions in the mass range of 0 to 900 amu. In each case, the primary ion beam was generated at 30 keV and 216 nA and was incident at an angle of 45° over a scanning area of 15 μm × 15 μm (equivalent to 256 × 256 pixels), with a scanning time of 360 s. A 1 keV O2+ ion beam was used for sputtering with an angle of incidence of 45° and a sputtering rate of 0.15 nm/s. The sputtering time varied from 360 to 600 s depending on the quality of the data. The results obtained from both the primary and secondary ion beams provided information regarding the sample surfaces, whereas the results generated by sputtering provided data regarding the material, down to depths from 54 to 90 nm. The variations of pixels in the resulting TOF-SIMS data indicated the distributions of various ions, whereas the image colors showed the relative amounts (from high to low concentration: white, yellow, orange, red, and black, with black pixels not being observable). Note that the results presented herein are not definitely primary ion beams or sputtered ion beams but rather were selected to provide the most informative and clear data. In addition, we did not prepare standard samples, so the intensity of the ions obtained in the figure has no practical significance and cannot be used for comparison between different ions. The TOF-SIMS technique provided less spatial resolution than TEM but allowed the analysis of ultra-light elements (an atomic number less than 4, except for He element), trace elements detection (in the ppm-ppb range), as well as the detection of isotopes and depth profiling based on layer-by-layer exfoliation [14,25]. The ability of this technique to detect ultra-light and trace elements made it suitable for the assessment of phyllosilicates.

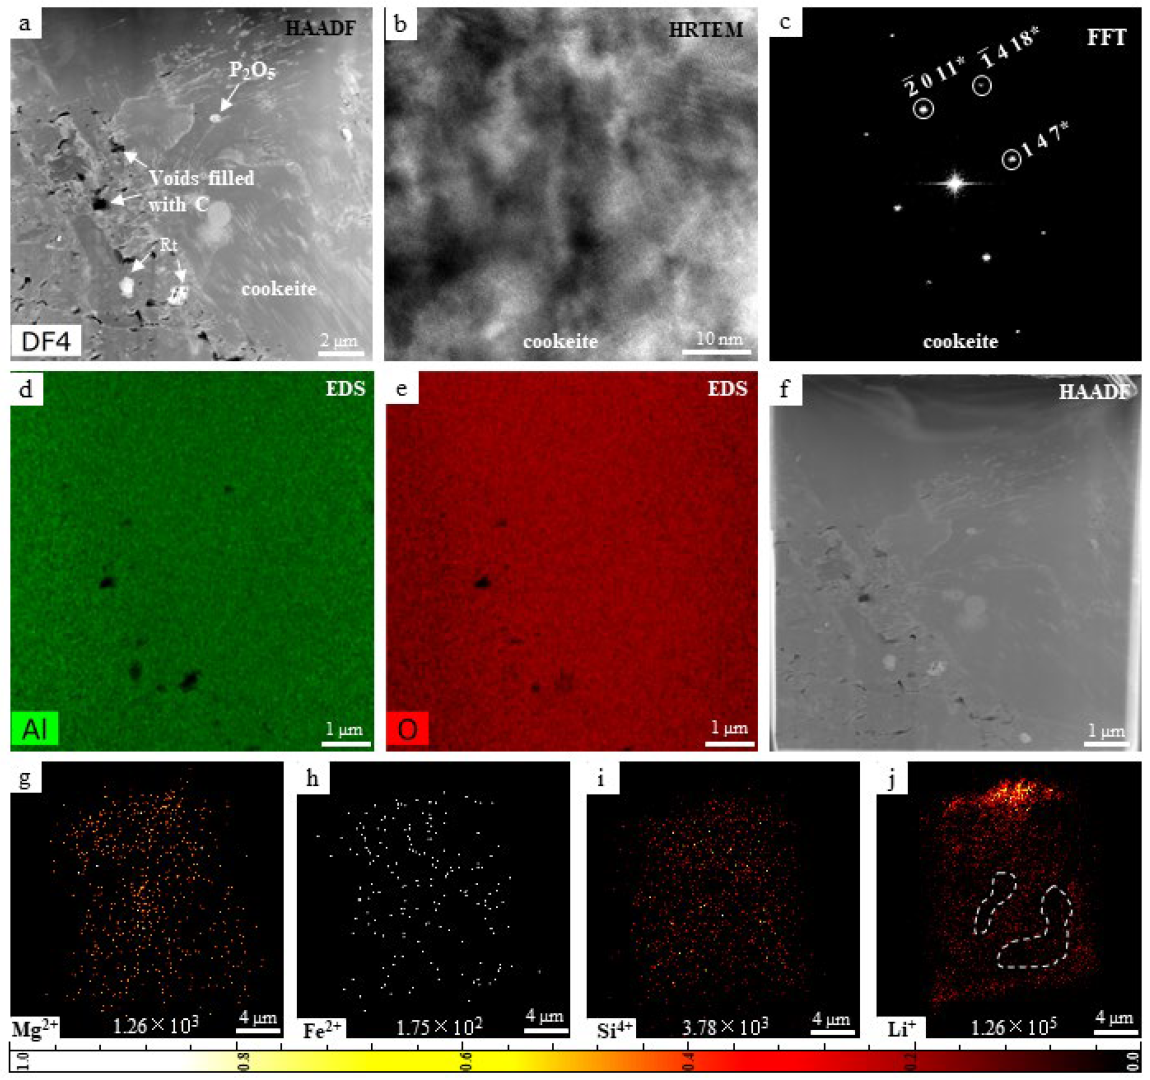
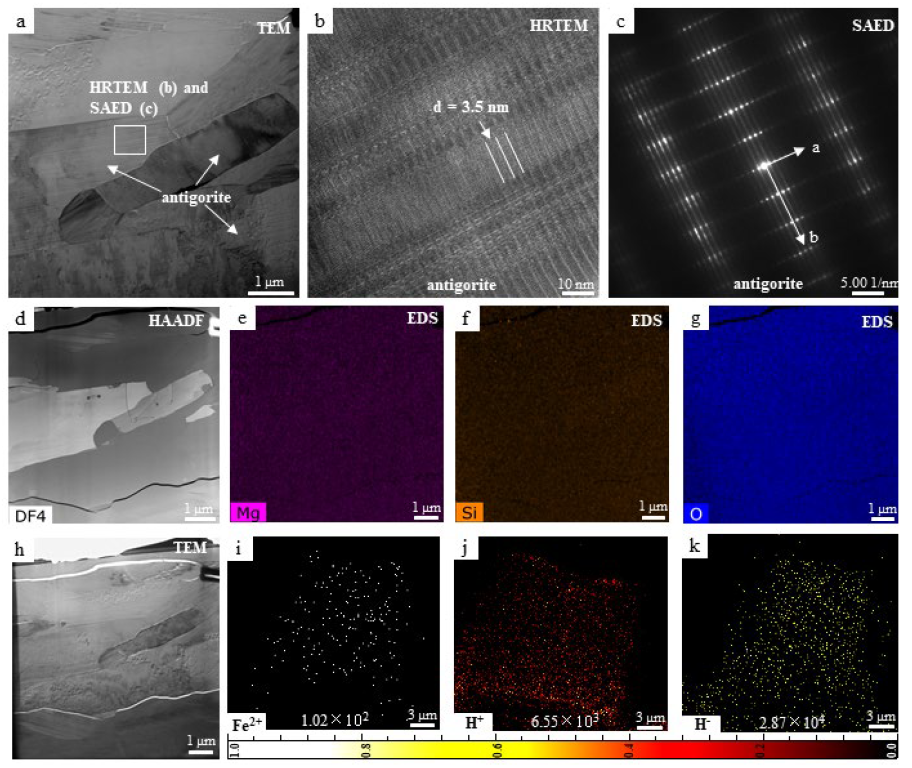
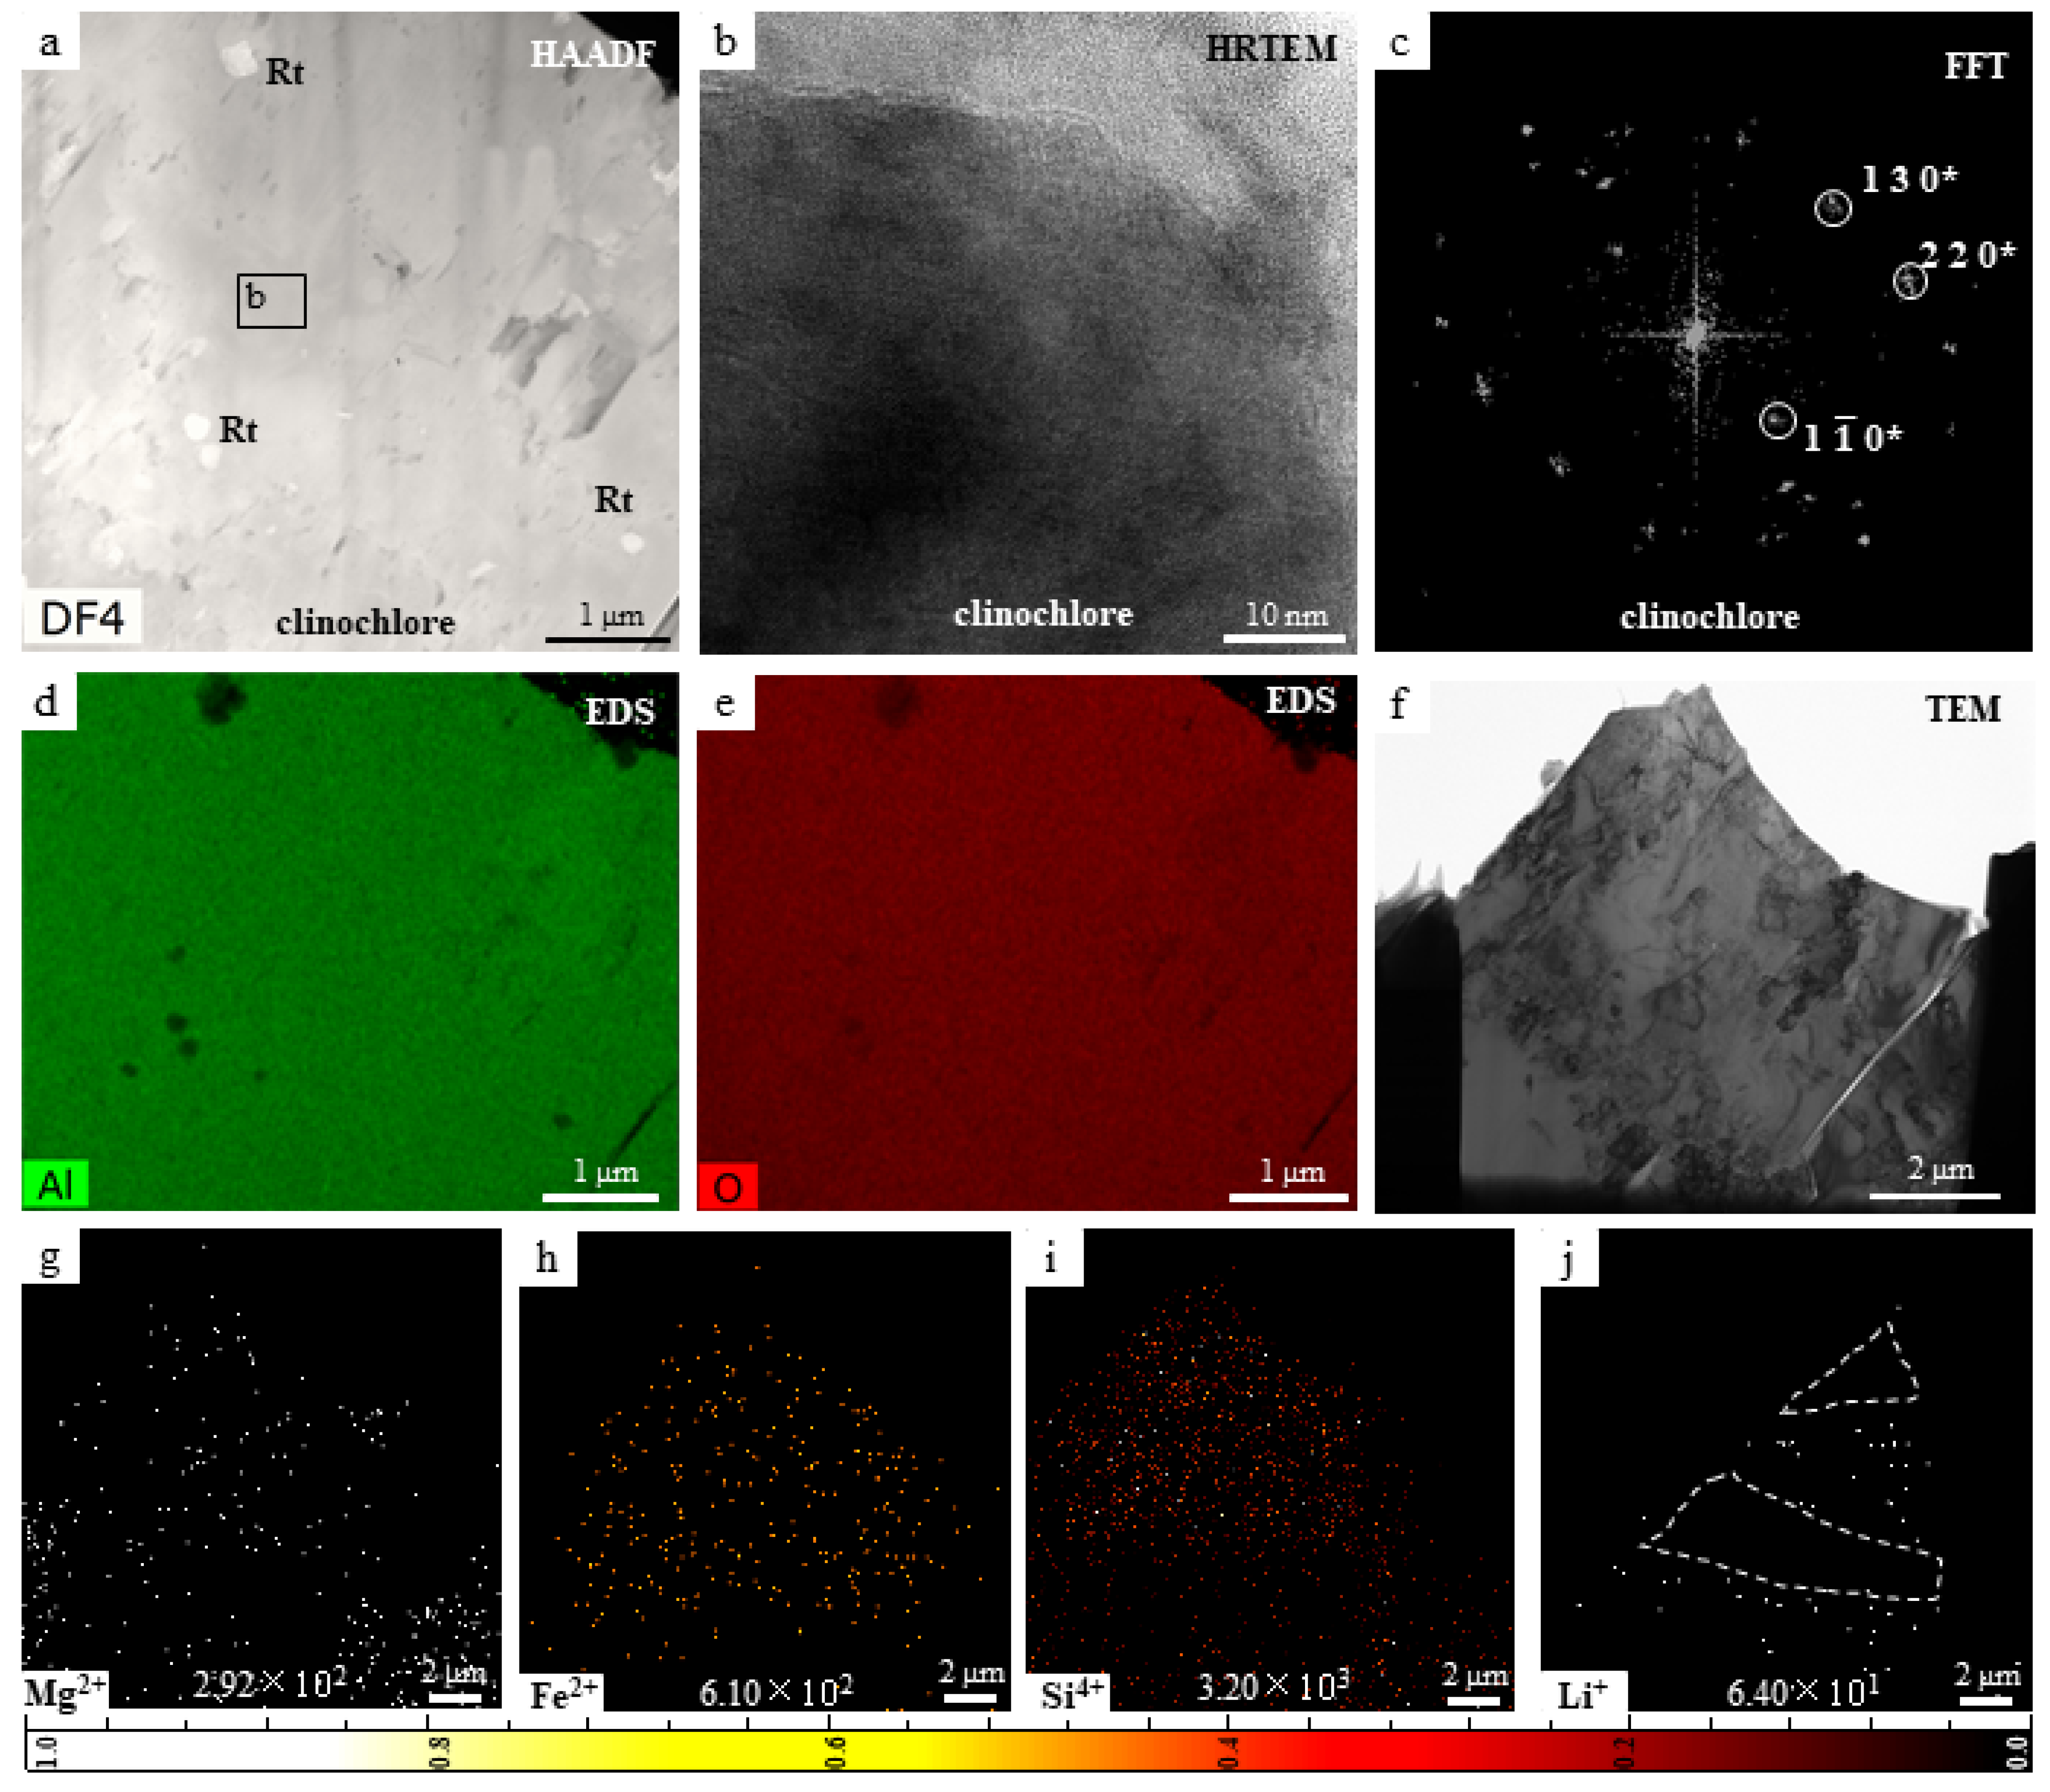
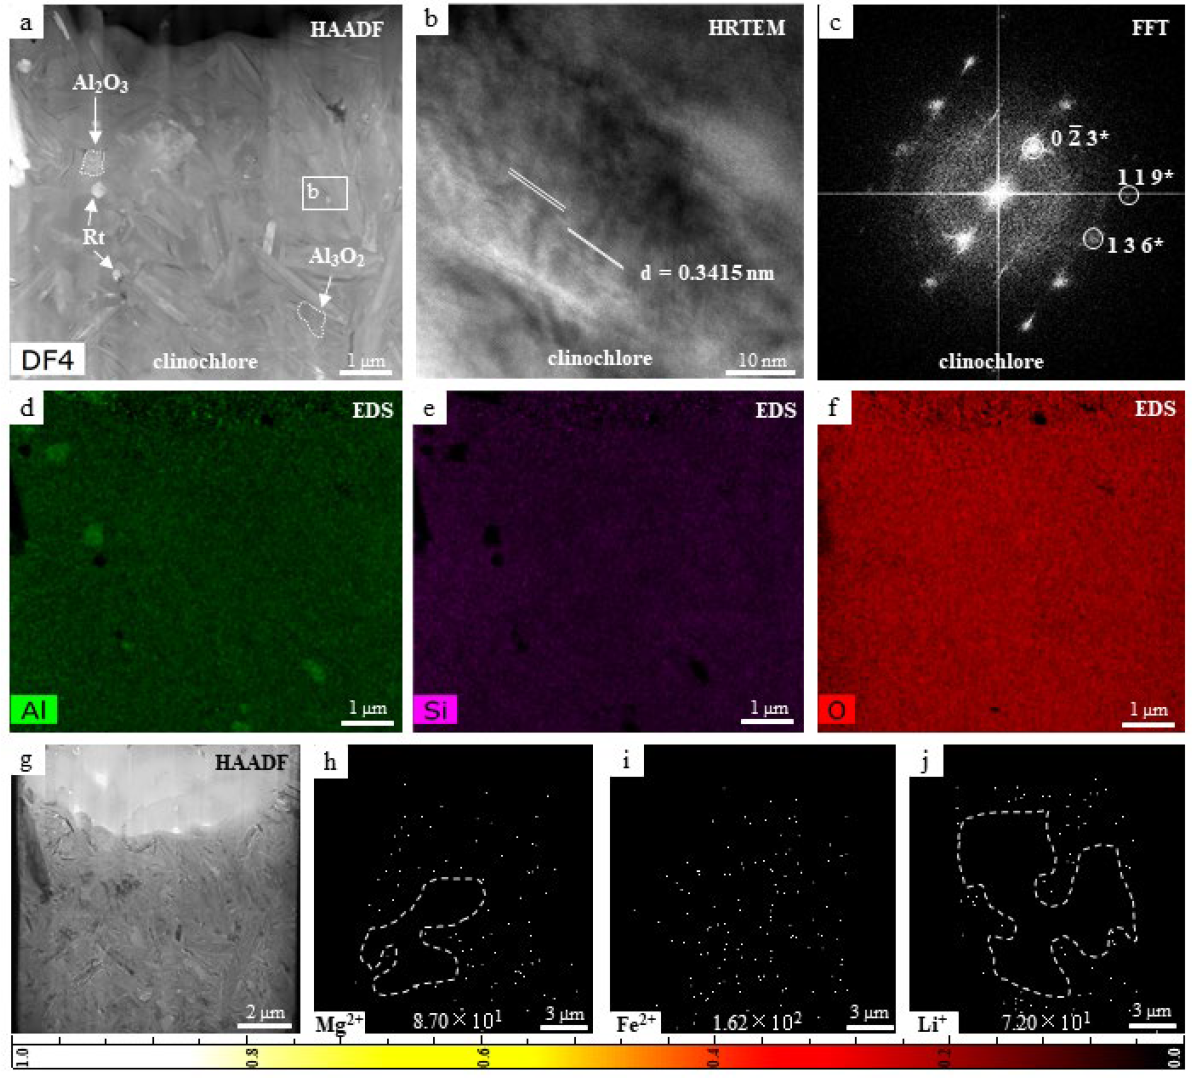
3. Results and Discussion

The TEM images of the serpentine sample showed variations in contrast (Figure 1a), whereas the EDS mapping results (Figure 1e–g) indicated no significant distribution changes in either cations or anions, presumably due to the different crystal phase densities. Mg distributions were determined by TEM (which provided a lower limit of detection (LOD)), whereas Fe2+ was assessed using TOF-SIMS. These analyses indicated that the primary metal cation in the serpentine was Mg2+. The TOF-SIMS data showed uniform distributions of both positive and negative H ions in the serpentine (Figure 1j,k). Based on the combined structural data obtained by SAED and the elemental data generated by the TEM and TOF-SIMS analyses, the serpentine sample was identified as antigorite.
The HAADF analysis of the ZK 1526h1 indicated the same contrast in the matrix (Figure 2a). The sample was also found to have uniform distributions of Al and O based on TEM assessments (Figure 2d,e) whereas TOF-SIMS showed the presence of Mg2+, Fe2+, and Si4+ along with a lesser amount of Li+ (Figure 2g–j), where the distribution of Li+ appears to be uneven. The fast Fourier transform (FFT) pattern of the ZK 1526h1 identified this material as clinochlore, which was consistent with the compositional data. The ZK 1522h1-1 exhibited variable contrast in its HAADF image (Figure 3a), whereas the EDS mapping of the sample showed no changes in cation or anions (Figure 3d–f). Other metal cations were assessed using TOF-SIMS and small amounts of Mg2+ and Fe2+ along with lower concentrations of Li+ were found (Figure 3g–j). Based on these combined data, the ZK 1522h1-1 was identified as clinochlore.
The ZK 1522h1-2 sample was assessed by TEM and found to contain uniformly distributed Al and O (Figure 4d,e), whereas TOF-SIMS indicated the presence of Mg2+, Fe2+, and Li+ in this material. Li+ was distributed throughout the sample at a relatively high concentration (exceeding those of the Mg2+ and Fe2+). The FFT pattern obtained from the ZK 1522h1-2 identified this material as cookeite, which was consistent with the compositional data.
The TEM and TOF-SIMS data obtained from the serpentine, ZK 1526h1, ZK 1522h1-1, and ZK 1522h1-2 provided compositional and structural information showing that these specimens were made of antigorite, clinochlore, and cookeite, respectively. As noted, the layered structure of serpentine is composed of Si-O tetrahedra, and thus the TEM analysis of the antigorite clearly indicated high levels of Si and O. TEM mapping of the antigorite detected Fe but TOF-SIMS mapping did not, while a small amount of Fe was indicated by the single-point EDS assessment. It can be concluded from these results that TOF-SIMS is extremely useful when analyzing trace element distributions. The ZK 1526h1 and ZK 1522h1-1 were both made of clinochlore, although the TEM data for these two samples showed slightly different Si concentrations. The TEM results obtained from the former material only indicated Al and O signals, whereas the analysis of the latter demonstrated the presence of Al, O, and Si, possibly because some Si in the Si-O tetrahedra of the clinochlore structure had been replaced by Al in this material. TEM was able to detect Si at relatively high levels (Figure 3e) whereas TOF-SIMS had a lower LOD for this element (Figure 2i). Based on the present data, it was assumed that the Si content in the ZK1526h1 was less than 0.1%. The TEM results for the ZK 1522h2-2 only showed the presence of Al and O in Al-O tetrahedra, whereas Mg2+, Fe2+, and Li+ were identified by TOF-SIMS along with a higher concentration of Li+. Therefore, this sample could have been a type of phyllosilicate having a high Li content. Combining the structural data with these compositional results, the ZK 1522h2-2 was evidently made of cookeite. These results confirm that it was possible to determine the specific type of phyllosilicate represented by each specimen based on combining the compositional data acquired from TEM and TOF-SIMS with the structural data from TEM analysis. These findings demonstrate the viability of the present in situ FTT combination technique in ultra-light and trace element analysis.
This method also appears to be useful in terms of sample preparation. Phyllosilicates generally have lamellar or fibrous crystalline structures that form parallel to the tetrahedral layers, which makes it difficult to prepare suitable TOF-SIMS specimens by polishing bulk samples using conventional methods. Specifically, during the TOF-SIMS analysis of samples that do not have the required roughness, fewer sputtered secondary particles are obtained, resulting in a weaker signal and less reliable experimental data [26]. The use of the FIB technique to produce fibrous samples in the present work, based on a peeling effect resulting from the powerful ion beam, allowed both transverse and longitudinal sections of the specimens to be generated. This method reduced the amount of damage to the sample and as a result provided higher-quality TOF-SIMS data. Figure 5 shows the roughness of the conventionally polished sample surface and the sample surface obtained by FIB.
It is evident that the in situ FTT technique is advantageous when analyzing phyllosilicates containing ultra-light and trace elements. This method could potentially be applied to geological samples such as Li carbonatite and extraterrestrial samples such as those obtained from Mars or carbonaceous asteroids. Phyllosilicates such as montmorillonite, chlorite, illite, and muscovite are important components of the Martian surface [27,28]. Fe-rich phyllosilicates are also well represented in the surface rocks of carbonaceous asteroids, such as Bennu and Ryugu [29,30]. The FTT technique would be a suitable method for phyllosilicates in these precious, returned samples.

4. Conclusions

An in situ FTT combination technique was examined as a means of mitigating the difficulties associated with the microscopic analysis of ultra-light and trace elements in phyllosilicates. The experimental results obtained from analyses of antigorite, clinochlore, and cookeite samples demonstrated the advantages of this technique. This method provides the appropriate sample thickness and surface roughness for TEM and TOF-SIMS, respectively. In addition, the FTT technique permits the acquisition of relative amounts and distributions of ultra-light and trace elements as well as the crystal structure of a sample. This process could potentially be applicable to the analysis of mineral samples from Mars or carbonaceous asteroids.

Author Contributions

Conceptualization, Y.L.; investigation, K.T.; formal analysis, Y.L. and K.T.; writing and original draft preparation, K.T.; supervision, S.L.; review and editing, Y.L., S.L., Z.G., C.L. and S.Z.; resources, L.D.; funding acquisition, Y.L., X.L. and J.L. All authors have read and agreed to the published version of the manuscript.

Funding

The authors would like to thank the funding support from the Strategic Priority Research Program of the Chinese Academy of Sciences grant XDB 41000000; National Natural Science Foundation of China grant 41931077; Technical Advanced Research Project of Civil Space grant D020201; Youth Innovation Promotion Association CAS grant 2020395; Key Research Program of Frontier Sciences, CAS, Grant No. ZDBS-SSW-JSC007-10 and QYZDY-SSW-DQC028; and Guangxi Scientific Base and Talent Special Projects (No. AD1850007).

Conflicts of Interest

The authors declare no conflict of interest.

References

  1. Veblen, D.R.; Buseck, P.R. Serpentine minerals: Intergrowths and new combination structures. Science 1979, 206, 1398–1400. [Google Scholar] [CrossRef] [PubMed]
  2. Grim, R.E. Crystal structures of clay minerals and their X-ray identification. Earth-Sci. Rev. 1982, 18, 84–85. [Google Scholar] [CrossRef]
  3. Webb, P.C.; Potts, P.J.; Watson, J.S. Determination of rubidium and strontium in silicate rocks by energy dispersive and wavelength dispersive X-ray fluorescence analysis: A comparative evaluation of precision. J. Anal. At. Spectrom. 1993, 8, 293–298. [Google Scholar] [CrossRef]
  4. Voegelin, A.; Weber, F.-A.; Kretzschmar, R. Distribution and speciation of arsenic around roots in a contaminated riparian floodplain soil: Micro-XRF element mapping and EXAFS spectroscopy. Geochim. Cosmochim. Acta 2007, 71, 5804–5820. [Google Scholar] [CrossRef]
  5. Castillo, S.; Moreno, T.; Querol, X.; Alastuey, A.; Cuevas, E.; Herrmann, L.; Mounkaila, M.; Gibbons, W. Trace element variation in size-fractionated African desert dusts. J. Arid Environ. 2008, 72, 1034–1045. [Google Scholar] [CrossRef]
  6. Tóth, E.; Weiszburg, T.G.; Jeffries, T.; Williams, C.T.; Bartha, A.; Bertalan, É.; Cora, I. Submicroscopic accessory minerals overprinting clay mineral REE patterns (celadonite–glauconite group examples). Chem. Geol. 2010, 269, 312–328. [Google Scholar] [CrossRef]
  7. Ndzana, G.M.; Huang, L.; Zhang, Z.; Zhu, J.; Liu, F.; Bhattacharyya, R. The transformation of clay minerals in the particle size fractions of two soils from different latitude in China. Catena 2019, 175, 317–328. [Google Scholar] [CrossRef]
  8. Hadi, J.; Wersin, P.; Serneels, V.; Greneche, J.-M. Eighteen years of steel–bentonite interaction in the FEBEX in situ test at the Grimsel Test Site in Switzerland. Clays Clay Miner. 2019, 67, 111–131. [Google Scholar] [CrossRef] [Green Version]
  9. Dill, H.G.; Kaufhold, S.; Weber, B.; Gerdes, A. Clay Mineralogy and LA–ICP–MS dating of supergene U-Cu nontronite-bearing mineralization at Nabburg-Wolsendogf, Southeastern Germany. Can. Mineral. 2010, 48, 497–511. [Google Scholar] [CrossRef]
  10. Zhu, L.; Yang, Y.; Gu, H.; Wen, H.; Du, S.; Luo, C. Mineralogical Characteristics of Two Clay-type Lithium Resources in Yuxi, China, and Nevada, the United States of America. Rock Min. Anal. 2021, 40, 532–541. [Google Scholar] [CrossRef]
  11. Viets, J.; O’Leary, R. The role of atomic absorption spectrometry in geochemical exploration. J. Geochem. Explor. 1992, 44, 107–138. [Google Scholar] [CrossRef]
  12. Stephan, T. TOF-SIMS in cosmochemistry. Planet. Space Sci. 2001, 49, 859–906. [Google Scholar] [CrossRef]
  13. Silva, S.R.P.; Stolojan, V. Electron energy loss spectroscopy of carbonaceous materials. Thin Solid Film. 2005, 488, 283–290. [Google Scholar] [CrossRef]
  14. Keast, V. Application of EELS in materials science. Mater. Charact. 2012, 73, 1–7. [Google Scholar] [CrossRef]
  15. Hagenhoff, B. High-resolution surface analysis by TOF-SIMS. Microchim. Acta 2000, 132, 259–271. [Google Scholar] [CrossRef]
  16. McLoughlin, N.; Wacey, D.; Kruber, C.; Kilburn, M.; Thorseth, I.; Pedersen, R. A combined TEM and NanoSIMS study of endolithic microfossils in altered seafloor basalt. Chem. Geol. 2011, 289, 154–162. [Google Scholar] [CrossRef]
  17. Moore, K.L.; Chen, Y.; Van de Meene, A.M.; Hughes, L.; Liu, W.; Geraki, T.; Mosselmans, F.; McGrath, S.P.; Grovenor, C.; Zhao, F.J. Combined NanoSIMS and synchrotron X-ray fluorescence reveal distinct cellular and subcellular distribution patterns of trace elements in rice tissues. New Phytol. 2014, 201, 104–115. [Google Scholar] [CrossRef]
  18. Wang, T.; Ge, X.; Fan, G.; Guo, D. Application of Combined FIB-TOF-SIMS System in Mineralogy (in Chinese). Uranium Geol. 2019, 35, 247–252. [Google Scholar] [CrossRef]
  19. Zhang, L. A study on the composition and properties of Xiuyan jade in Liaoning Province. Acta Mineral. Sin. 2002, 2, 137–142. [Google Scholar] [CrossRef]
  20. Qiu, Z.; Rang, M.; Huang, J. Mössbauer spectra study on Xiu-Yan Jade. Hyperfine Interact. 1992, 70, 1013–1016. [Google Scholar] [CrossRef]
  21. Wang, R.; Wang, Q.; Huang, Y.; Yang, S.; Liu, X.; Zhou, Q. Combined tectonic and paleogeographic controls on the genesis of bauxite in the Early Carboniferous to Permian Central Yangtze Island. Ore Geol. Rev. 2018, 101, 468–480. [Google Scholar] [CrossRef]
  22. Yu, W.; Algeo, T.J.; Yan, J.; Yang, J.; Du, Y.; Huang, X.; Weng, S. Climatic and hydrologic controls on upper Paleozoic bauxite deposits in South China. Earth Sci. Rev. 2019, 189, 159–176. [Google Scholar] [CrossRef]
  23. Wen, H.; Luo, C.; Du, S.; Yu, W.; Gu, H.; Ling, K.; Cui, Y.; Li, Y.; Yang, J. Carbonate-hosted clay-type lithium deposit and its prospecting significance. Chin. Sci. Bull. 2019, 65, 53–59. [Google Scholar] [CrossRef]
  24. Lee, M.; Bland, P.; Graham, G. Preparation of TEM samples by focused ion beam (FIB) techniques: Applications to the study of clays and phyllosilicates in meteorites. Mineral. Mag. 2003, 67, 581–592. [Google Scholar] [CrossRef]
  25. Cheng, J.; Winograd, N. Depth profiling of peptide films with TOF-SIMS and a C60 probe. Anal. Chem. 2005, 77, 3651–3659. [Google Scholar] [CrossRef] [PubMed]
  26. Sameshima, J.; Takenaka, A.; Muraji, Y.; Nakata, Y.; Yoshikawa, M. Profiling with Depth Resolution of Sub-nm for SiO2/SiC Interface by Dual-Beam TOF-SIMS Combined with Simulation. Mater. Sci. Forum 2020, 1004, 587–594. [Google Scholar] [CrossRef]
  27. Poulet, F.; Bibring, J.-P.; Mustard, J.; Gendrin, A.; Mangold, N.; Langevin, Y.; Arvidson, R.; Gondet, B.; Gomez, C. Phyllosilicates on Mars and implications for early Martian climate. Nature 2005, 438, 623–627. [Google Scholar] [CrossRef]
  28. Mustard, J.F.; Murchie, S.L.; Pelkey, S.; Ehlmann, B.; Milliken, R.; Grant, J.A.; Bibring, J.-P.; Poulet, F.; Bishop, J.; Dobrea, E.N. Hydrated silicate minerals on Mars observed by the Mars Reconnaissance Orbiter CRISM instrument. Nature 2008, 454, 305–309. [Google Scholar] [CrossRef]
  29. Hamilton, V.; Simon, A.; Christensen, P.; Reuter, D.; Clark, B.; Barucci, M.; Bowles, N.; Boynton, W.; Brucato, J.R.; Cloutis, E. Evidence for widespread hydrated minerals on asteroid (101955) Bennu. Nat. Astron. 2019, 3, 332–340. [Google Scholar] [CrossRef] [Green Version]
  30. Kitazato, K.; Milliken, R.; Iwata, T.; Abe, M.; Ohtake, M.; Matsuura, S.; Arai, T.; Nakauchi, Y.; Nakamura, T.; Matsuoka, M. The surface composition of asteroid 162173 Ryugu from Hayabusa2 near-infrared spectroscopy. Science 2019, 364, 272–275. [Google Scholar] [CrossRef]
Figure 1. Microscopic results for the serpentine sample. (a) This figure shows a TEM image of the FIB cross-section. HRTEM and SAED data were acquired from the region in the white square. (b) An HRTEM image shows continuous planes with an interplanar spacing of 3.5 nm. (c) A SAED image was acquired. (d) This HAADF image shows the location of EDS mapping. (eg) EDS mapping demonstrating uniform distributions of Mg, Si, and O. (h) This TEM image shows the area of TOF-SIMS, i.e., the entire FIB slice. (ik) TOF-SIMS results show uniform distributions of Fe2+, H+, and H throughout the sample. A color bar represents the linear scale from black (equals zero) to the white of TOF-SIMS. The number below each image is the intensity corresponding to the ion.
Minerals 12 00562 g001
Figure 2. Microscopic results for the ZK 1526h1. (a) This figure shows a HAADF image of the FIB cross-section. HRTEM data was acquired from the region in the black square. (b,c) These are the HRTEM image and its FFT image after Fourier transform performing. (d,e) EDS mapping indicating the distributions of Al and O. (f) This image shows the area of TOF-SIMS, i.e., the whole FIB slice. (gj) TOF-SIMS results show the distributions of Mg2+, Fe2+, and Si4+ along with a small amount of Li+. The white dotted areas represent the distribution of the missing Li+ here.
Minerals 12 00562 g002
Figure 3. Microscopic results for the ZK 1522h1-1 sample. (a) A HAADF image shows that the sample was composed of several needle-like crystals. This sample also contained a small amount of Al2O3 and a rutile (Rt) phase with compositional information following. (b,c) These are the HRTEM image and its FFT image after Fourier transform performed. (df) EDS mapping indicating the distributions of Al, Si, and O. (g) This image shows the area of TOF-SIMS, i.e., the whole FIB slice. (hj) TOF-SIMS results show the distributions of Mg2+, Fe2+, and a small amount of Li+. The white dotted areas represent the distribution of the missing Mg2+ and Li+.
Minerals 12 00562 g003
Figure 4. Microscopic results for the ZK1522h1-2 sample. (a) A HAADF image shows that the specimen was primarily composed of cookeite. The voids filled with C are attributed to contamination. (b,c) These are the HRTEM image and its FFT image after Fourier transformation. (d,e) EDS mapping of the sample showing the distributions of Al and O. (f) This image shows the area of TOF-SIMS, i.e., the whole FIB slice. (gj) TOF-SIMS results indicate the distributions of Mg2+, Fe2+, Si4+, and Li+. The white dotted area indicates that the Li+ ion concentration is low here.
Minerals 12 00562 g004
Figure 5. Roughness comparison figures. (a) The surface of the sample after traditional polishing can still be observed as obviously rough under SEM. (b) The samples obtained by FIB preparation can be observed as obvious smooth surfaces.
Minerals 12 00562 g005
Publisher’s Note: MDPI stays neutral with regard to jurisdictional claims in published maps and institutional affiliations.

