Article

Systematic Study of Legacy Phosphorus (P) Desorption Mechanisms in High-P Agricultural Soils

by
Kathryn Daria Szerlag
1,*,
Monica Elavarthi
2,
Matthew G. Siebecker
3,
Chunhao Gu
4,
Conner McCrone
4 and
Donald Lewis Sparks
4
1
Department of Environmental Science, Westfield State University, Westfield, MA 01086, USA
2
Department of Chemical Engineering, University of Delaware, Newark, DE 19716, USA
3
Department of Plant and Soil Science, Texas Tech University, Lubbock, TX 79409, USA
4
Department of Plant and Soil Science, University of Delaware, Newark, DE 19716, USA
*
Author to whom correspondence should be addressed.
Minerals 2022, 12(4), 458; https://doi.org/10.3390/min12040458
Submission received: 27 January 2022 / Revised: 3 April 2022 / Accepted: 6 April 2022 / Published: 8 April 2022
(This article belongs to the Special Issue Phosphorous in Soils and Sediments)

Abstract

:
Repeated manure additions containing phosphorus (P) in excess of crop needs have led to many agricultural soils with high levels of soil P (i.e., legacy P), particularly in the Delmarva region (USA). Due to the potential for P release, it is important to gain a better understanding of the mechanisms of P desorption and solubilization. Agricultural soils with high legacy P were collected from the Delmarva Peninsula, and soil P pools were determined using a suite of wet chemical and spectroscopic techniques, including a modified Hedley sequential extraction and X-ray absorption near-edge structure (XANES) spectroscopy. Five different desorption solutions were used to investigate P removal efficiency to assess release mechanisms. The results indicate that sulfate can have a stronger competition for P desorption than silicate, especially in the ditch sample with 21% labile P and 44% P adsorbed to iron and aluminum (via Hedley extraction). Additionally, linear combination fitting results of the ditch sample indicate 10.5% organic P and 73.9% P associated with iron and aluminum. This is an important finding because sulfate is a prevalent ion in sea water, and many agricultural soils with high legacy P in the Delmarva coastal area are threatened by sea level rise and inundation.

1. Introduction

Phosphorus (P) can be applied to agricultural soils in the form of animal manure or inorganic fertilizers [1]. A thriving poultry industry on the Delmarva Peninsula has led to years of poultry manure application to agricultural fields to improve soil fertility and manage poultry manure waste. Poultry manure application rates were historically based on the nitrogen (N) requirement of the crop, which resulted in P application in excess of crop needs [2,3,4,5]. The repeated addition of P above the agronomic need over many decades caused excessive P application buildup in Delmarva agricultural soils; this buildup is now termed as “legacy P” [2,6,7]. Many of these legacy P soils have high potential for P transport off the field and have become sources of P for continuous transport into the environment, resulting in eutrophication of nearby water bodies and the devastation of aquatic ecosystems [2,8,9].
Instead of acting as a sink for P, many legacy P agricultural soils have become a P source [2]. Soils with high legacy P may lead to a decrease in the soil’s ability to fix new P additions because the available P sorption sites in the soil are already occupied, leading to a larger P desorption potential [2,10,11,12,13]. The sorption sites that may be occupied within the soil include active sites for chemisorption on iron (Fe) and aluminum (Al) oxides [14] as well as binding to edge hydroxyls on aluminosilicate clays or bridging cations on organic matter [15]. Soils with excessive legacy P can release P long after the addition ceases; current models predict that soils with high legacy P may continue to release P for decades [6]. An improved understanding of the chemical sorption/desorption mechanisms that occur within these soils, contributing to P release, is crucial to decrease P transport to the environment.
Bulk wet chemical desorption experiments have been used to understand the chemical mechanisms that may be occurring with P release from soils. Phosphorus desorption solutions, such as chloride, have been shown to desorb labile and exchangeable P from mineral surfaces [16]. The effects of acid rain were examined in desorption experiments using a 0.1 M HNO3 adjusted to pH 4 [17]. Dissolved silicates compete with P for sorption sites on Fe and Al oxides and can form inner-sphere complexes [18] similar to those formed by P. This has sparked new research to consider and investigate the role of dissolved silicate in the mobilization of P [2,19,20,21,22]. Sulfate has been shown to have a similar effect as that of silicate on phosphate desorption, as it has been suggested that this sulfate also competes with phosphate by forming inner-sphere complexes with charged minerals, such as Fe oxides [23]. The amount of phosphate desorbed from soils has been found to be strongly affected by the presence of sulfate [24].
While previous studies have investigated different desorption solutions for soil P, a mechanistic understanding for how different P species are released, particularly in soils with legacy P, is still unclear. Thus, the research described here is unique in that it examines the effectiveness of many desorption solutions over a variety of soil physicochemical compositions, management histories, and total P concentrations. The purpose of this research is to characterize bulk P speciation in the soils and to assess potential mechanisms of P solubilization caused by desorption solutions to identify the major P pools. We assessed P solubilization by conducting desorption studies on a variety of legacy P agricultural soils from throughout the Delmarva region, including a multi-field transect in the Pocomoke Sound sub-watershed (Hydrologic Unit Code 02130201). We aim to address: (1) how bulk P speciation varies in legacy P agricultural soils with different physicochemical properties and management histories from throughout the Delmarva region; (2) how different extraction solutions affect P desorption and what this can tell us about P solubility; (3) differences in P speciation along a transect across fields, including into a ditch site connected directly to the Chesapeake Bay.
The hypotheses for this work are: (1) higher amounts of P will be desorbed from soils with high initial P concentrations using weak desorption solutions from soils with comparatively lower total P due to the release of weakly bound P species; (2) legacy P in agricultural fields with a history of poultry manure application management will likely be bound to calcium (Ca) due to the addition of Ca in the manure itself; and (3) P speciation will be different in the field transect than the ditch due to seasonal inundations in the ditch.

2. Materials and Methods

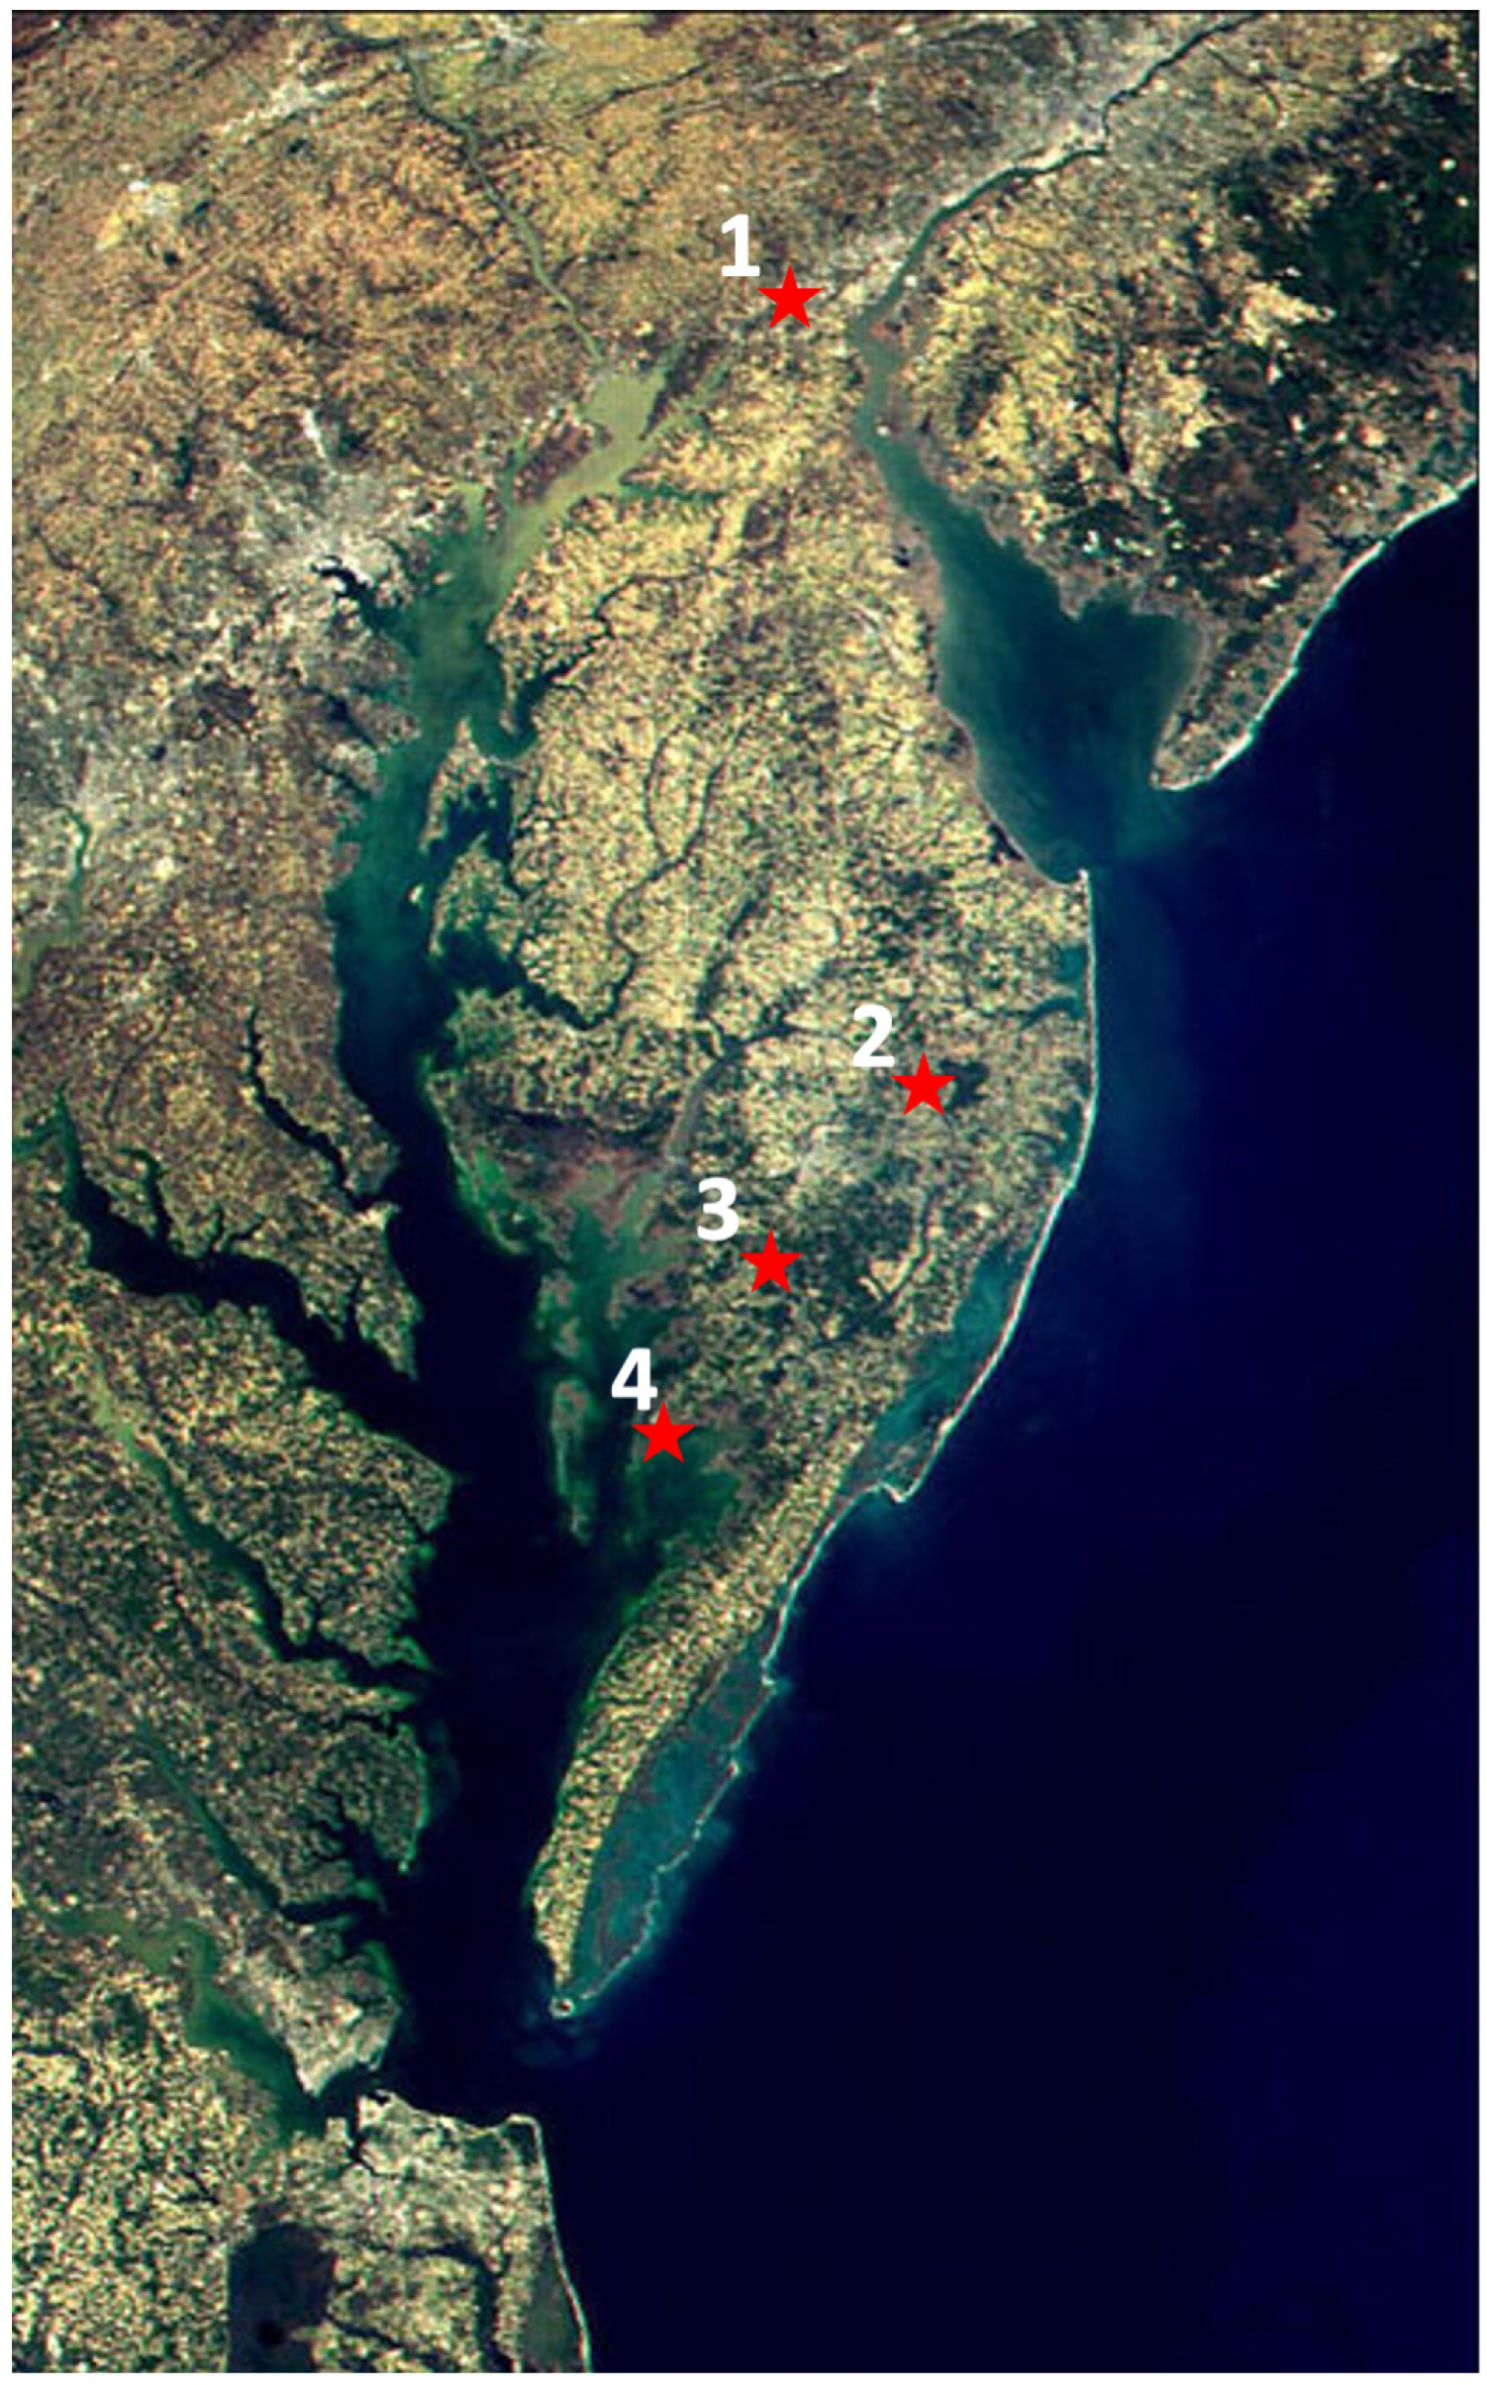
2.1. Sampling Site Descriptions

All samples were collected in 2016 from agricultural field sites located on the Delmarva Peninsula in the mid-Atlantic region of the United States (Figure 1). Delaware has a moderate climate throughout the year. The average monthly temperature in Delaware ranges from 0 °C to 24.3 °C. The annual precipitation is 114.3 cm. Because Delaware is a coastal state, its temperature is about 5.5 °C warmer in winter and cooler in summer [25]. In total, nine samples were collected at a variety of sites. The first five samples are labeled as CGAp, MS, SLF2, T1, and T2. The last four samples (CFT, MFT, EFT, and Ditch) were collected from the same field site along a transect. Below are the descriptions of each site.
A composite sample for sample “CGAp” was collected on the University of Delaware campus in Newark, DE. Since 2006, this soil has been used as a community garden, growing vegetables. During this time, no P was added to the soil. Like all soils in this study, the CGAp field site is P-limited due to the current high soil test P and is therefore not receiving P inputs under its nutrient management plan. Historically, this plot was used for dairy pasture.
The Manure Shed (“MS”) sample was collected from an agricultural field managed under a corn/full-season soybean rotation. This soil was collected from a unique site adjacent to a manure storage shed where spillage of poultry litter onto soil was frequent during cleanouts. The “SLF2” sample was collected from the same farm as MS but from a different location. This soil has a 50+ year history of poultry manure application, but manure has not been applied for several years. Like MS, SLF2 is an agricultural field with a corn/soybean rotation.
At another farm in Parsonsburg, MD, we collected samples “T1” and “T2”, which are from the same farm, although the samples were collected from different fields. Both soils have a 50+ year history of poultry manure and commercial fertilizer application. Both soils are currently managed under a corn/winter wheat/double-cropped soybean rotation.
The soils from Crisfield, MD were collected from the same farm along a transect spanning three fields and into a drainage ditch. All of the fields are cropped with a corn, winter wheat, double-cropped soybean rotation, and these soils have a long history of poultry litter application. The drainage ditch leads to a creek, which is in the Pocomoke Sound sub-watershed (Hydrologic Unit Code 02130201). The Crisfield, MD field site was chosen for the transect due to its proximity to Chesapeake Bay, high soil test P, and potential pathways for dissolved P export off the field. Samples from this site include center of the field (CFT), middle of the transect (MFT), edge of the field (EFT), and “Ditch”.

2.2. Sample Collection and Characterization

2.2.1. Delmarva Soil Samples

Five composite soil samples (10–15 subsamples per field) with a variety of physicochemical compositions and management histories were collected from agricultural fields using a 2.5 cm diameter soil probe (Ap horizon, 0–20.3 cm depth) in the Delmarva region (Figure 1). Due to a long history of poultry manure overapplication, all soils are considered to have legacy P. The soil samples were air-dried, passed through a 2 mm sieve, and characterized by the following methods at the University of Delaware Soil Testing Laboratory (UDSTL). The sample pH was determined using a 1:1 by volume soil-to-deionized water mixture and analyzed with an Accumet pH meter model: AB15 and a Thermo Scientific Orion combination flat-end pH electrode (Fisher Scientific, Pittsburgh, PA, USA) [27]. Soil organic matter was measured by loss on ignition (LOI) with a Blue-M high-temperature furnace model CW6680F (SPX Thermal Product Solutions, White Deer, PA, USA) [28]. Soil samples were subject to Mehlich III extraction and analyzed for plant available nutrients (P, Fe, Al, Ca, Mn, S, and K) using inductively coupled plasma optical emission spectroscopy (ICP-OES) with an ICAP 7600 Duo view inductively coupled plasma–optical emission spectrometer (ICP-OES) (Thermo Elemental, Madison, WI, USA) [29]. Cation exchange capacity (CEC) was completed at pH 7 by ammonium saturation with 1 N ammonium acetate, and exchangeable cations (K, Ca, Mg, and Na) were determined with ICP-OES [30]. Total sorbed metals were determined by digesting the soil samples using the EPA method 3051A with a CEM MARS5 microwave digestion system (CEM, Matthews, NC, USA). Digests were analyzed for P, Fe, Al, Ca, Mn, S, and K by ICP-OES [31]. Soil particle size was determined using a hydrometer and a modified Bouyoucos method [32]. The P saturation ratio (PSR) was also determined by the UDSTL using the Mehlich III extraction data to predict the degree of P saturation and ability of the soil to hold P, as described in [33] and [34]. The phosphorus saturation ratio involves a calculation of the ratios between Mehlich-III available P, Al, and Fe. The amount of P saturation is compared against P extracted using oxalate. This particular protocol was specifically developed for Delaware soils to predict P saturation.

2.2.2. Transect Soils

To investigate P species distribution within a field, four composite soil samples were collected from agricultural fields in Crisfield, MD. A transect was first drawn from the interior of the series of fields to the main ditch that drains directly into a creek. Three locations were chosen along the transect, and random sampling (15–20 subsamples using a 2.5 cm diameter probe, Ap horizon, 0–20.3 cm depth) was completed to obtain a composite sample within a 10 m × 10 m area for each sampling location. Sampling locations were named center of the field (CFT), middle of the transect (MFT), and edge of the field (EFT) for their locations along the transect. At the end of the field transect, one composite (15–20 subsamples) soil sample was collected from the bottom of the ditch adjacent to EFT to a depth of 2.5 cm.

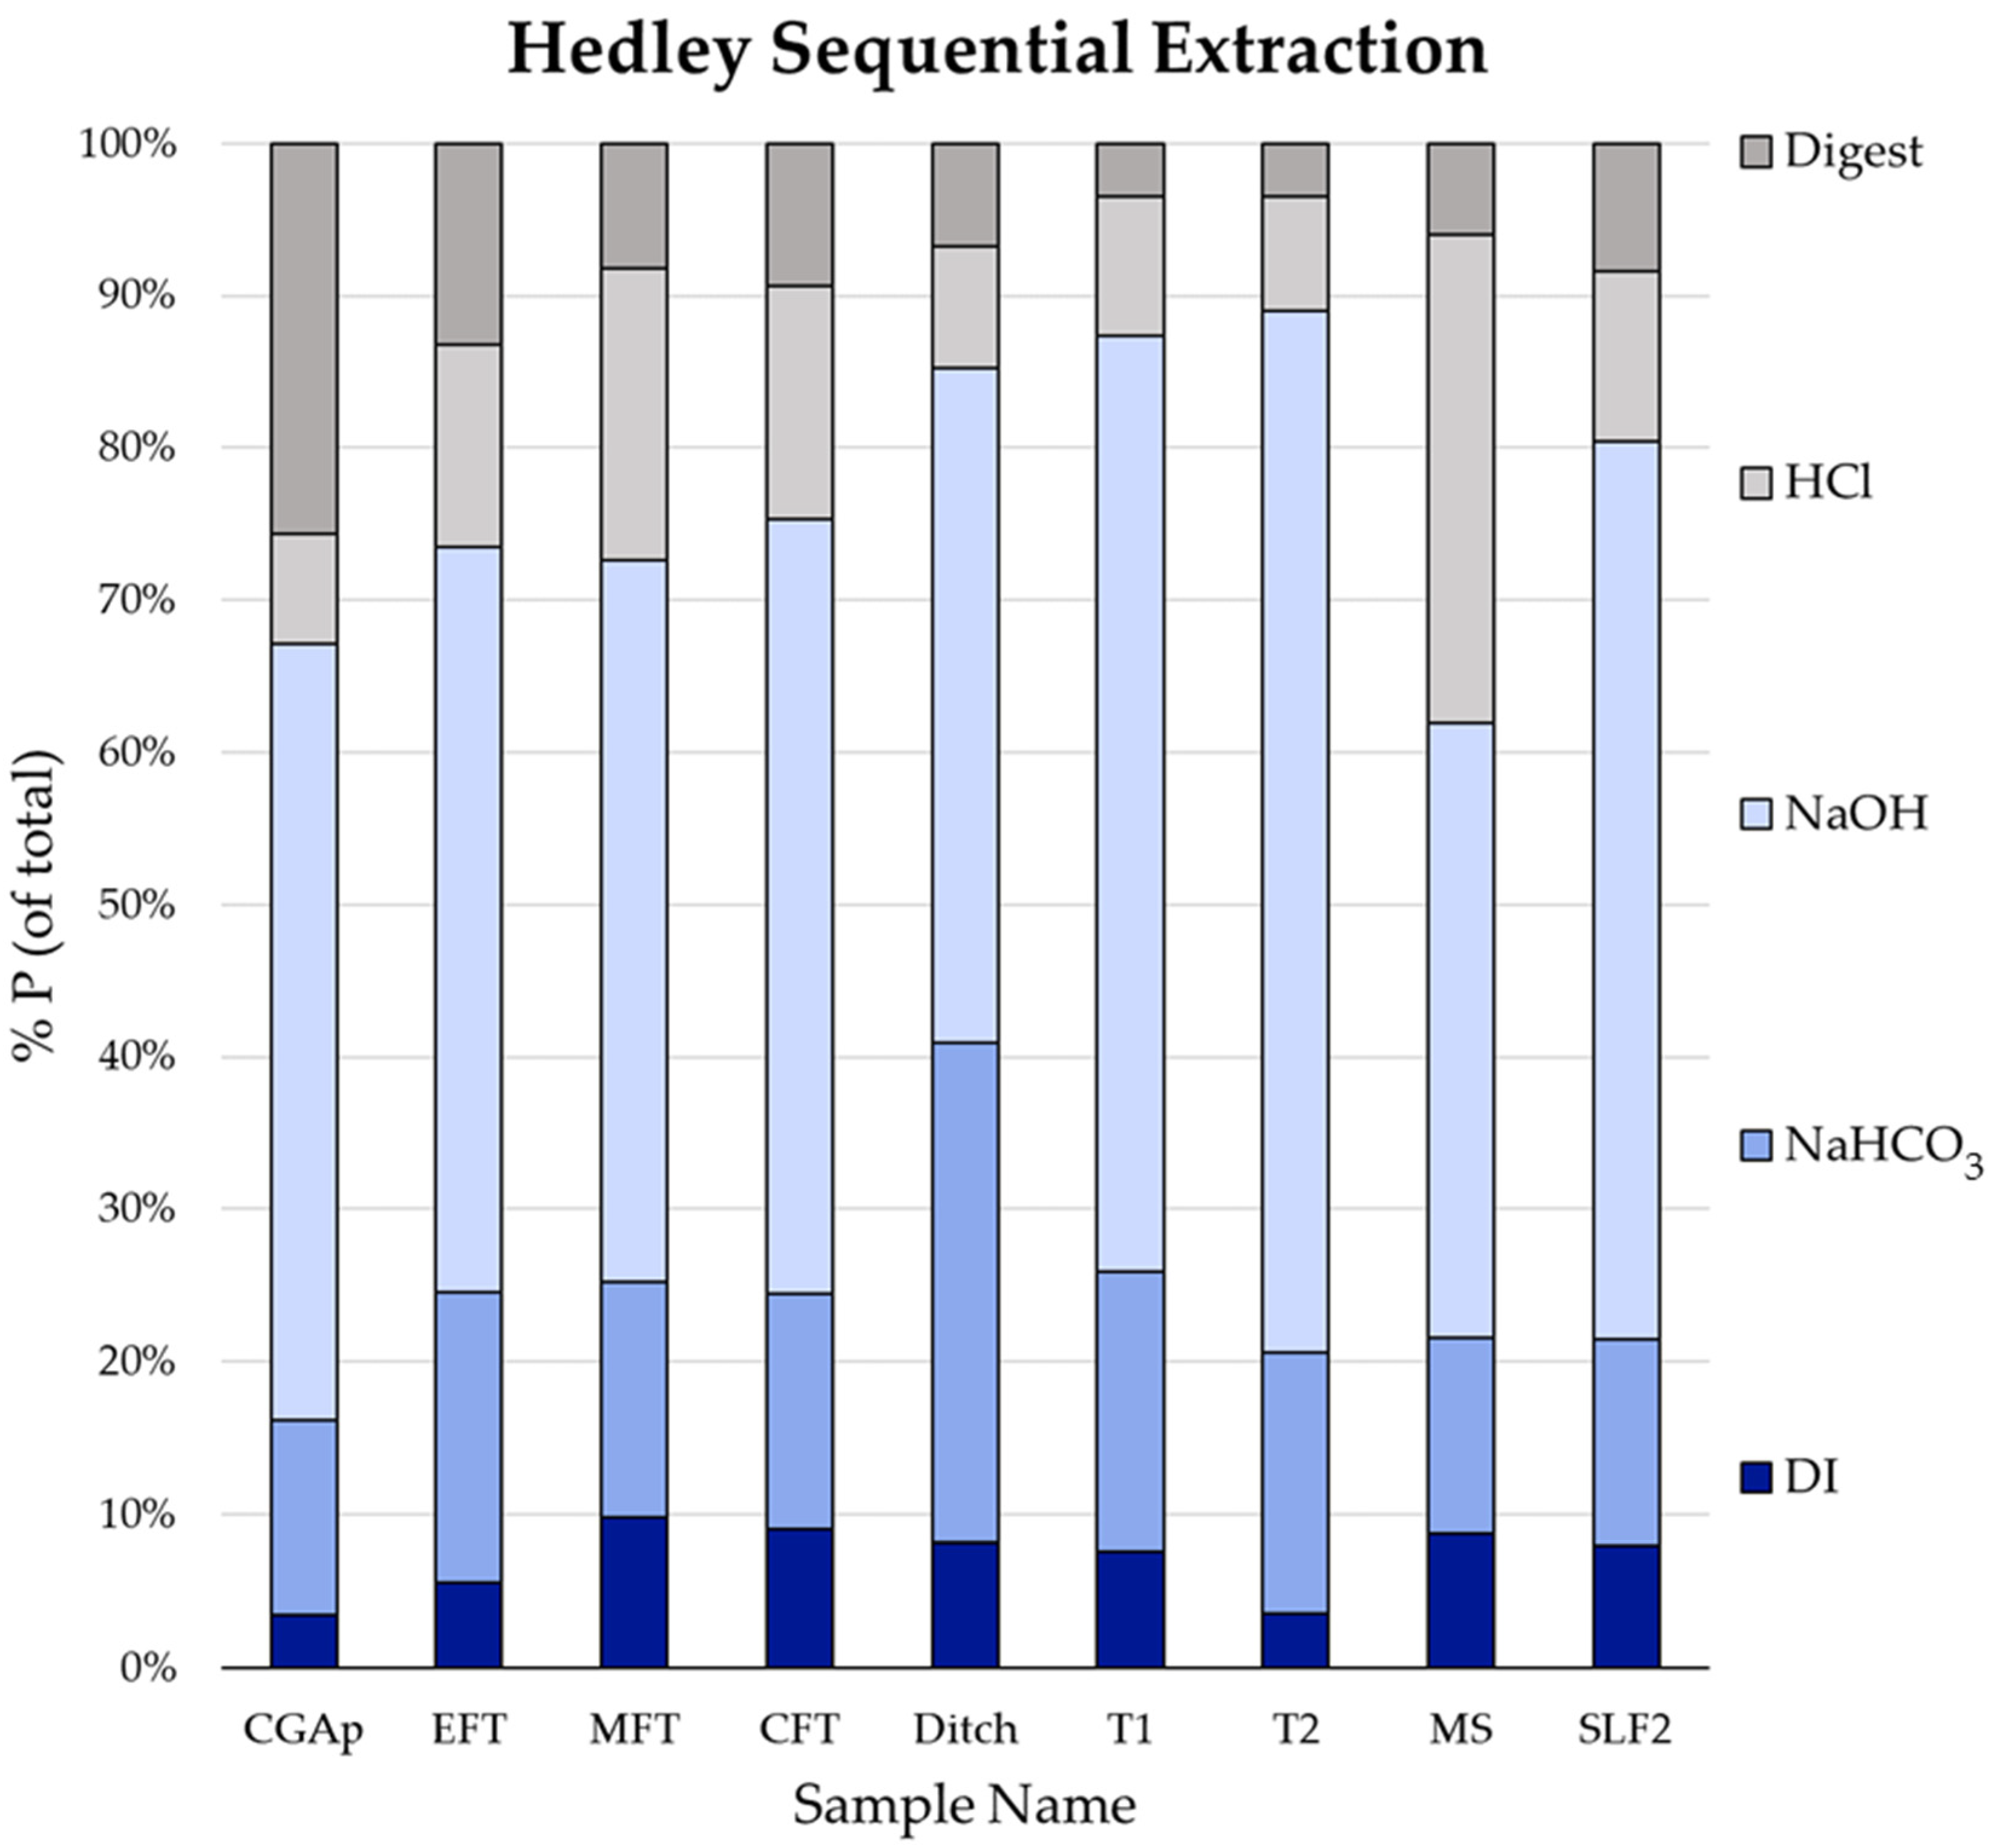
2.3. Hedley Sequential Extraction

Soils were subject to a modified Hedley sequential extraction procedure [35] to identify different P pools. In brief, 0.5 g portions of each soil were weighed in triplicate into 50 mL centrifuge tubes, to which 30 mL of deionized water was added; tubes were placed on an end-over-end shaker for 16 h at 22 rpm, then placed in the centrifuge at 10,000 g for 10 min. The supernatant was immediately decanted into a clean centrifuge tube, filtered through a 0.45 µm syringe filter, and placed in a cold room at 4 °C for storage until analysis. The soil residue was kept in the original centrifuge tube, to which 30 mL of 0.5 M NaHCO3 solution was added, followed by the same shaking, centrifugation, and decanting steps. This process was repeated two more times using 0.1 M NaOH and 1.0 M HCl as extractants. After the final HCl extraction, the samples were oven-dried at 25 °C and sent to the UDSTL for microwave-assisted acid digestion using the methods outlined for EPA 3051. The digestates and all the extraction supernatants were analyzed for total P using ICP-OES. Bioavailable P was removed using deionized water (DI) extraction [35], whereas labile P sorbed to soil surfaces was targeted using NaHCO3 extraction [36]. Next, the tightly bound P chemisorbed to Fe and Al was removed using NaOH extraction; this was followed by HCl extraction to remove apatite-like calcium phosphates [36]. Lastly, the most chemically stable P forms were removed during the acid digestion step.

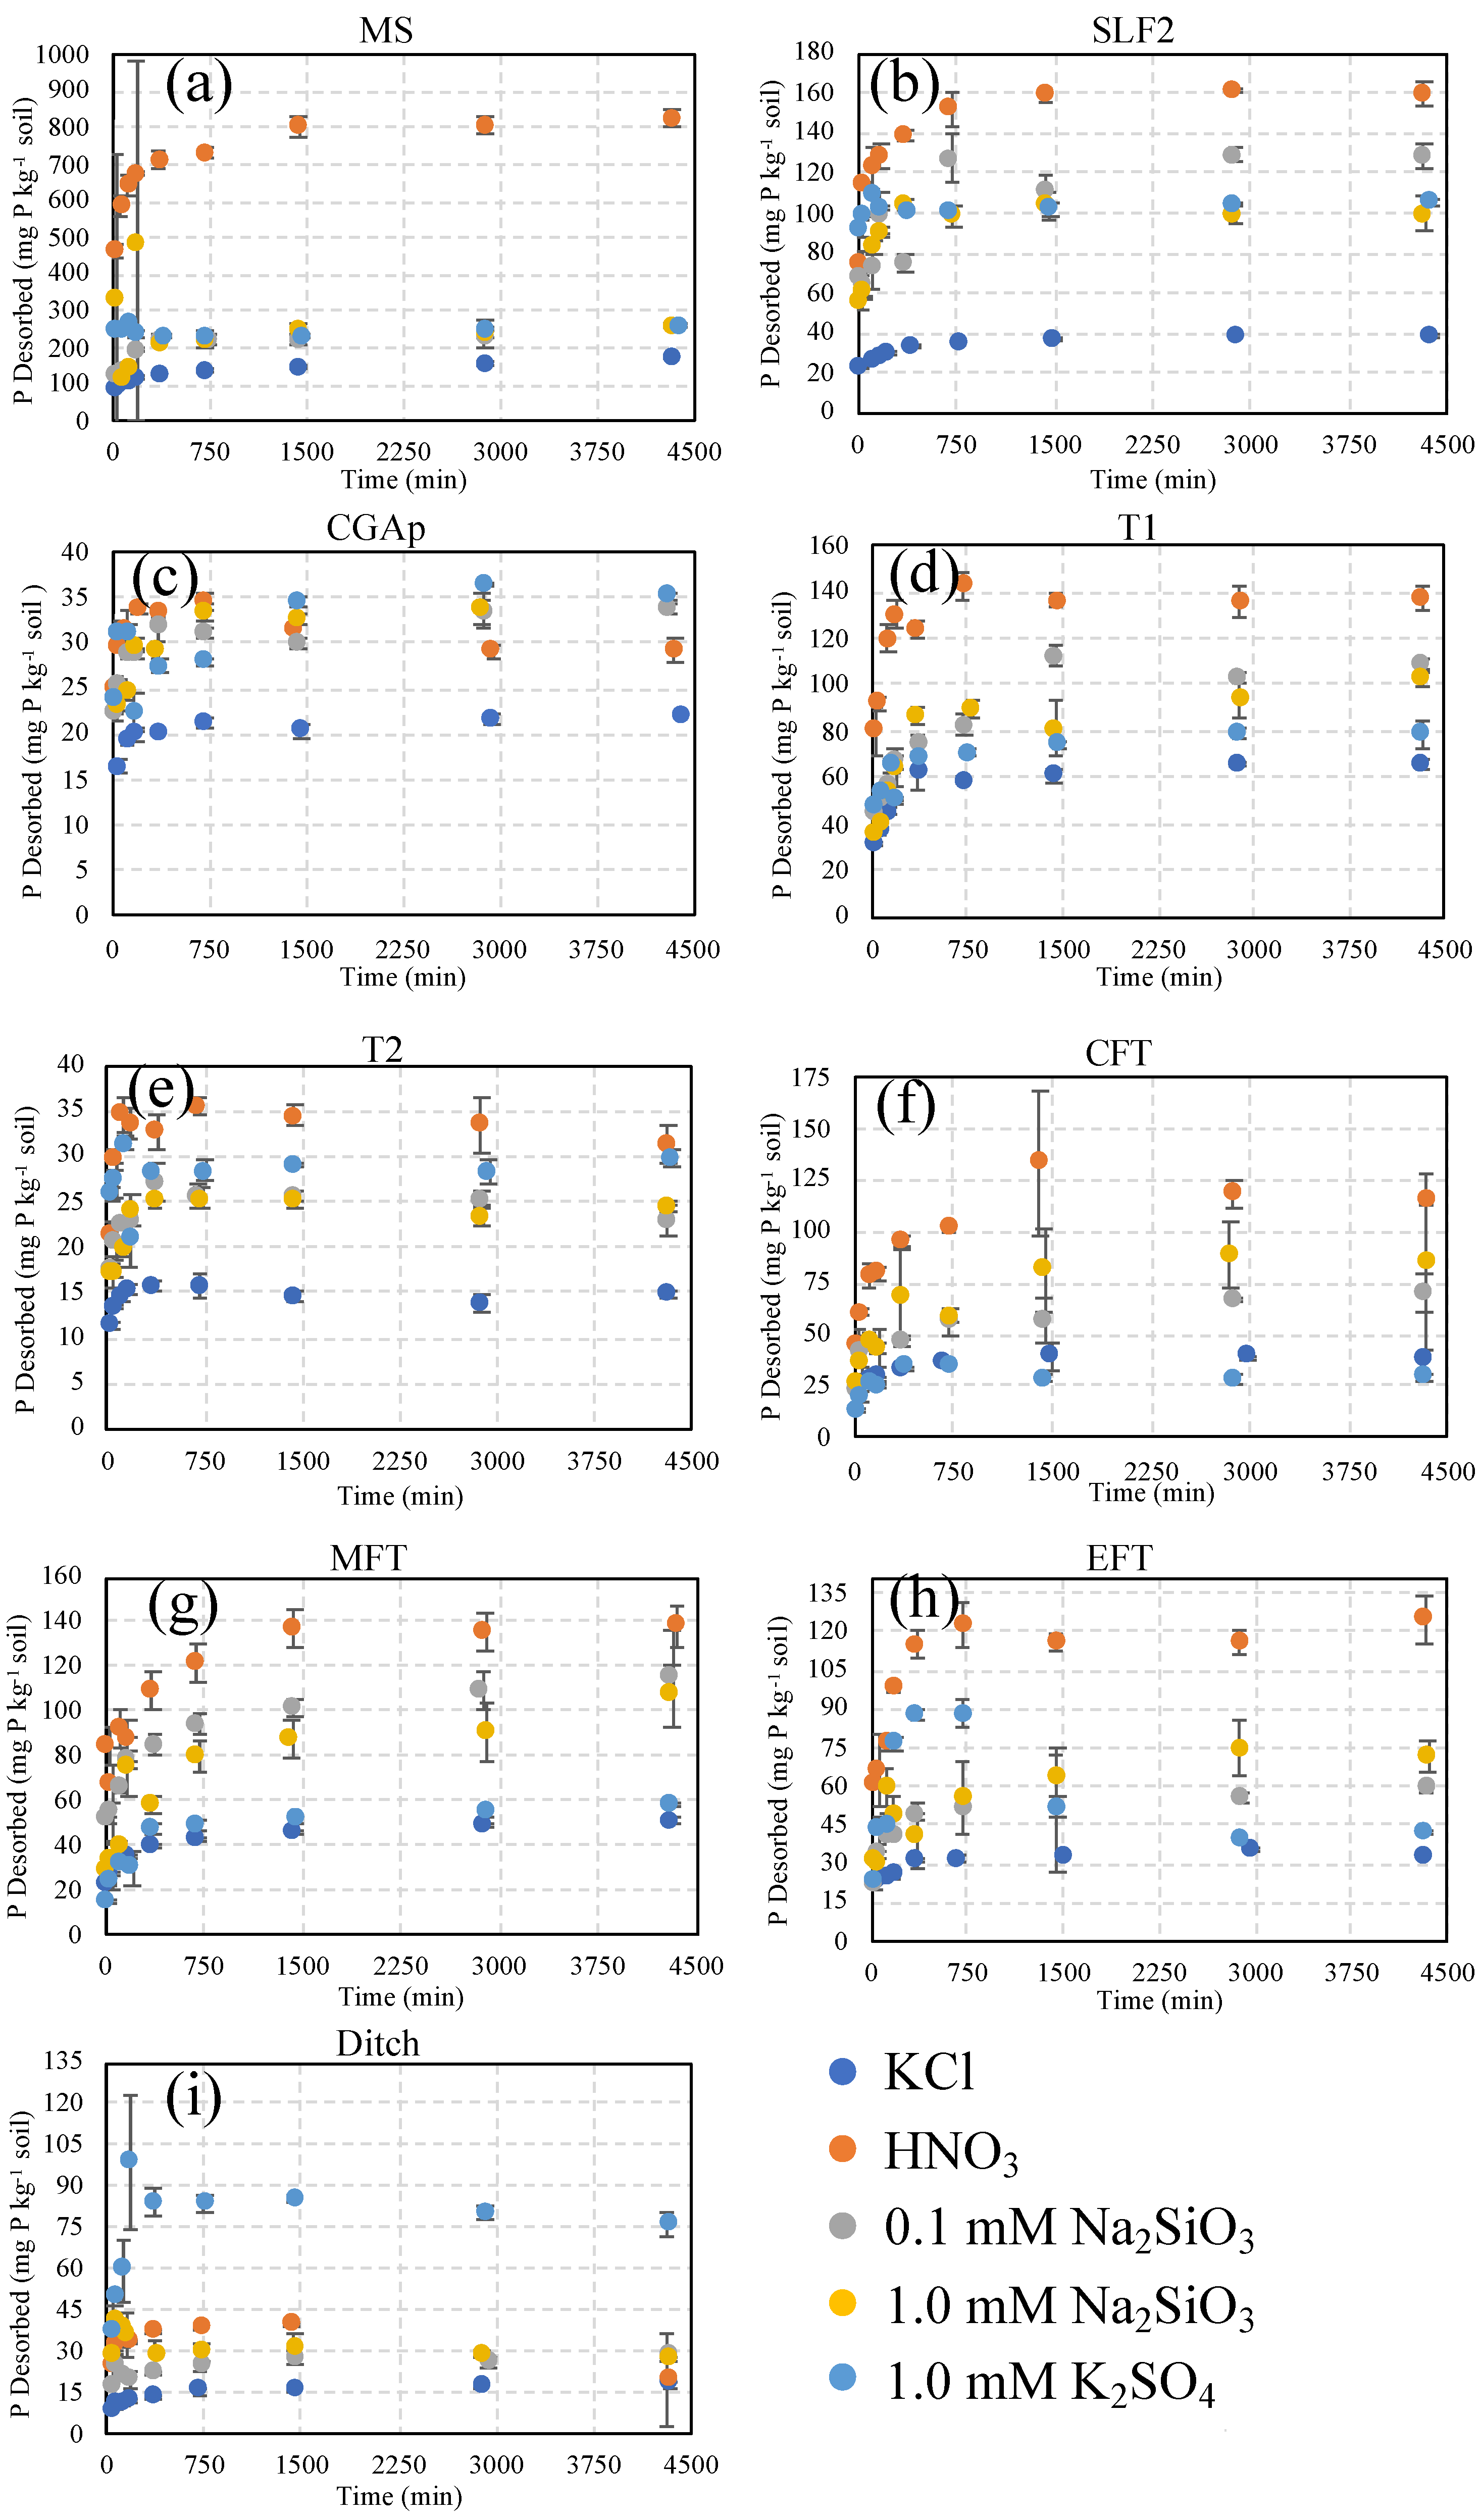
2.4. Desorption Studies

Desorption experiments with different desorption solutions were completed for all soils to investigate P desorption rates. The desorption solutions consisted of 10 mM KCl background electrolyte [17], 0.1 M HNO3 to mimic acid rain [17], 0.1 mM and 1 mM of Na2SiO3 [19], and 1 mM K2SO4 to investigate ligand exchange (desorption) mechanisms. For each experiment, 0.2 g of soil was placed into a 15 mL centrifuge tube, to which 10 mL of extracting solution was added. The experimental pH was maintained at the pH of the soil for all desorption experiments, except for the nitric acid experiments, for which pH was maintained at 4 [17]. All pH levels were adjusted using NaOH or HCl. The tubes were placed on a rotary shaker at 200 rpm, and samples were destructively sampled in triplicate at 0.5, 1, 2, 3, 6, 12, 24, 48, and 72 h. Samples were then filtered with 0.22 µm syringe filters, and the supernatant was placed in a cold room at 4 °C for storage until analysis. Supernatants were analyzed for P at the UDSTL using ICP-OES.

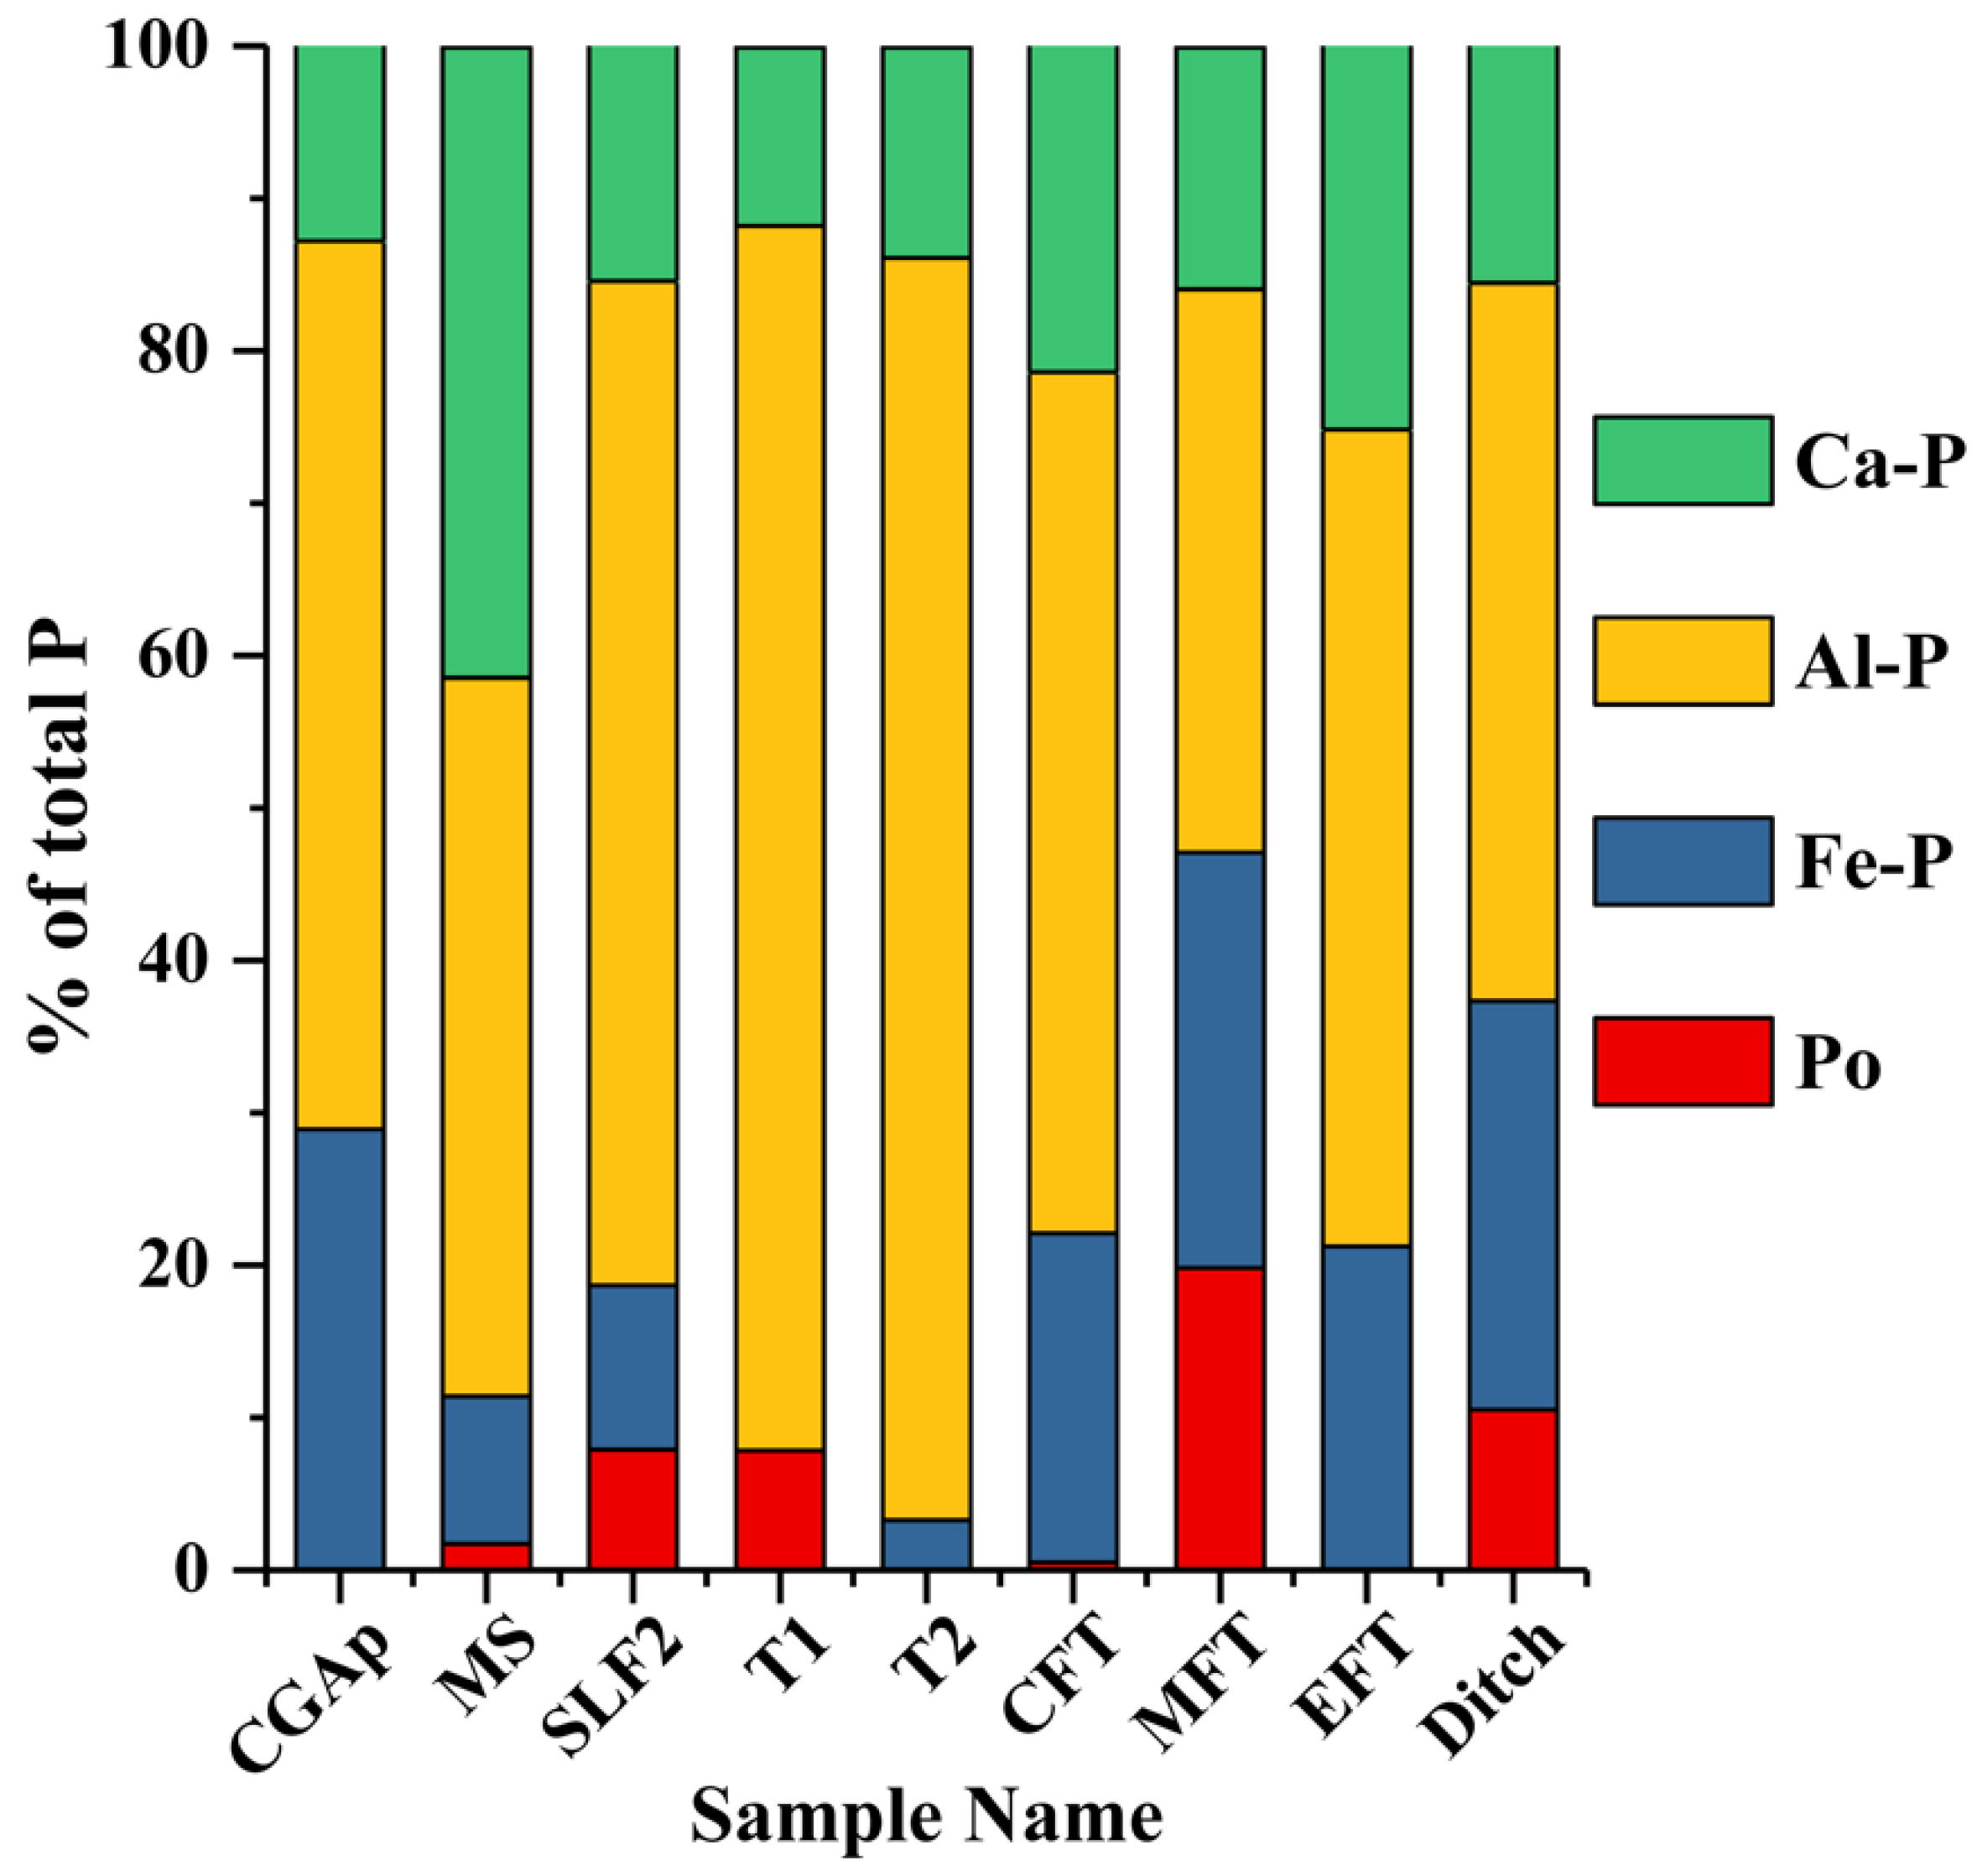
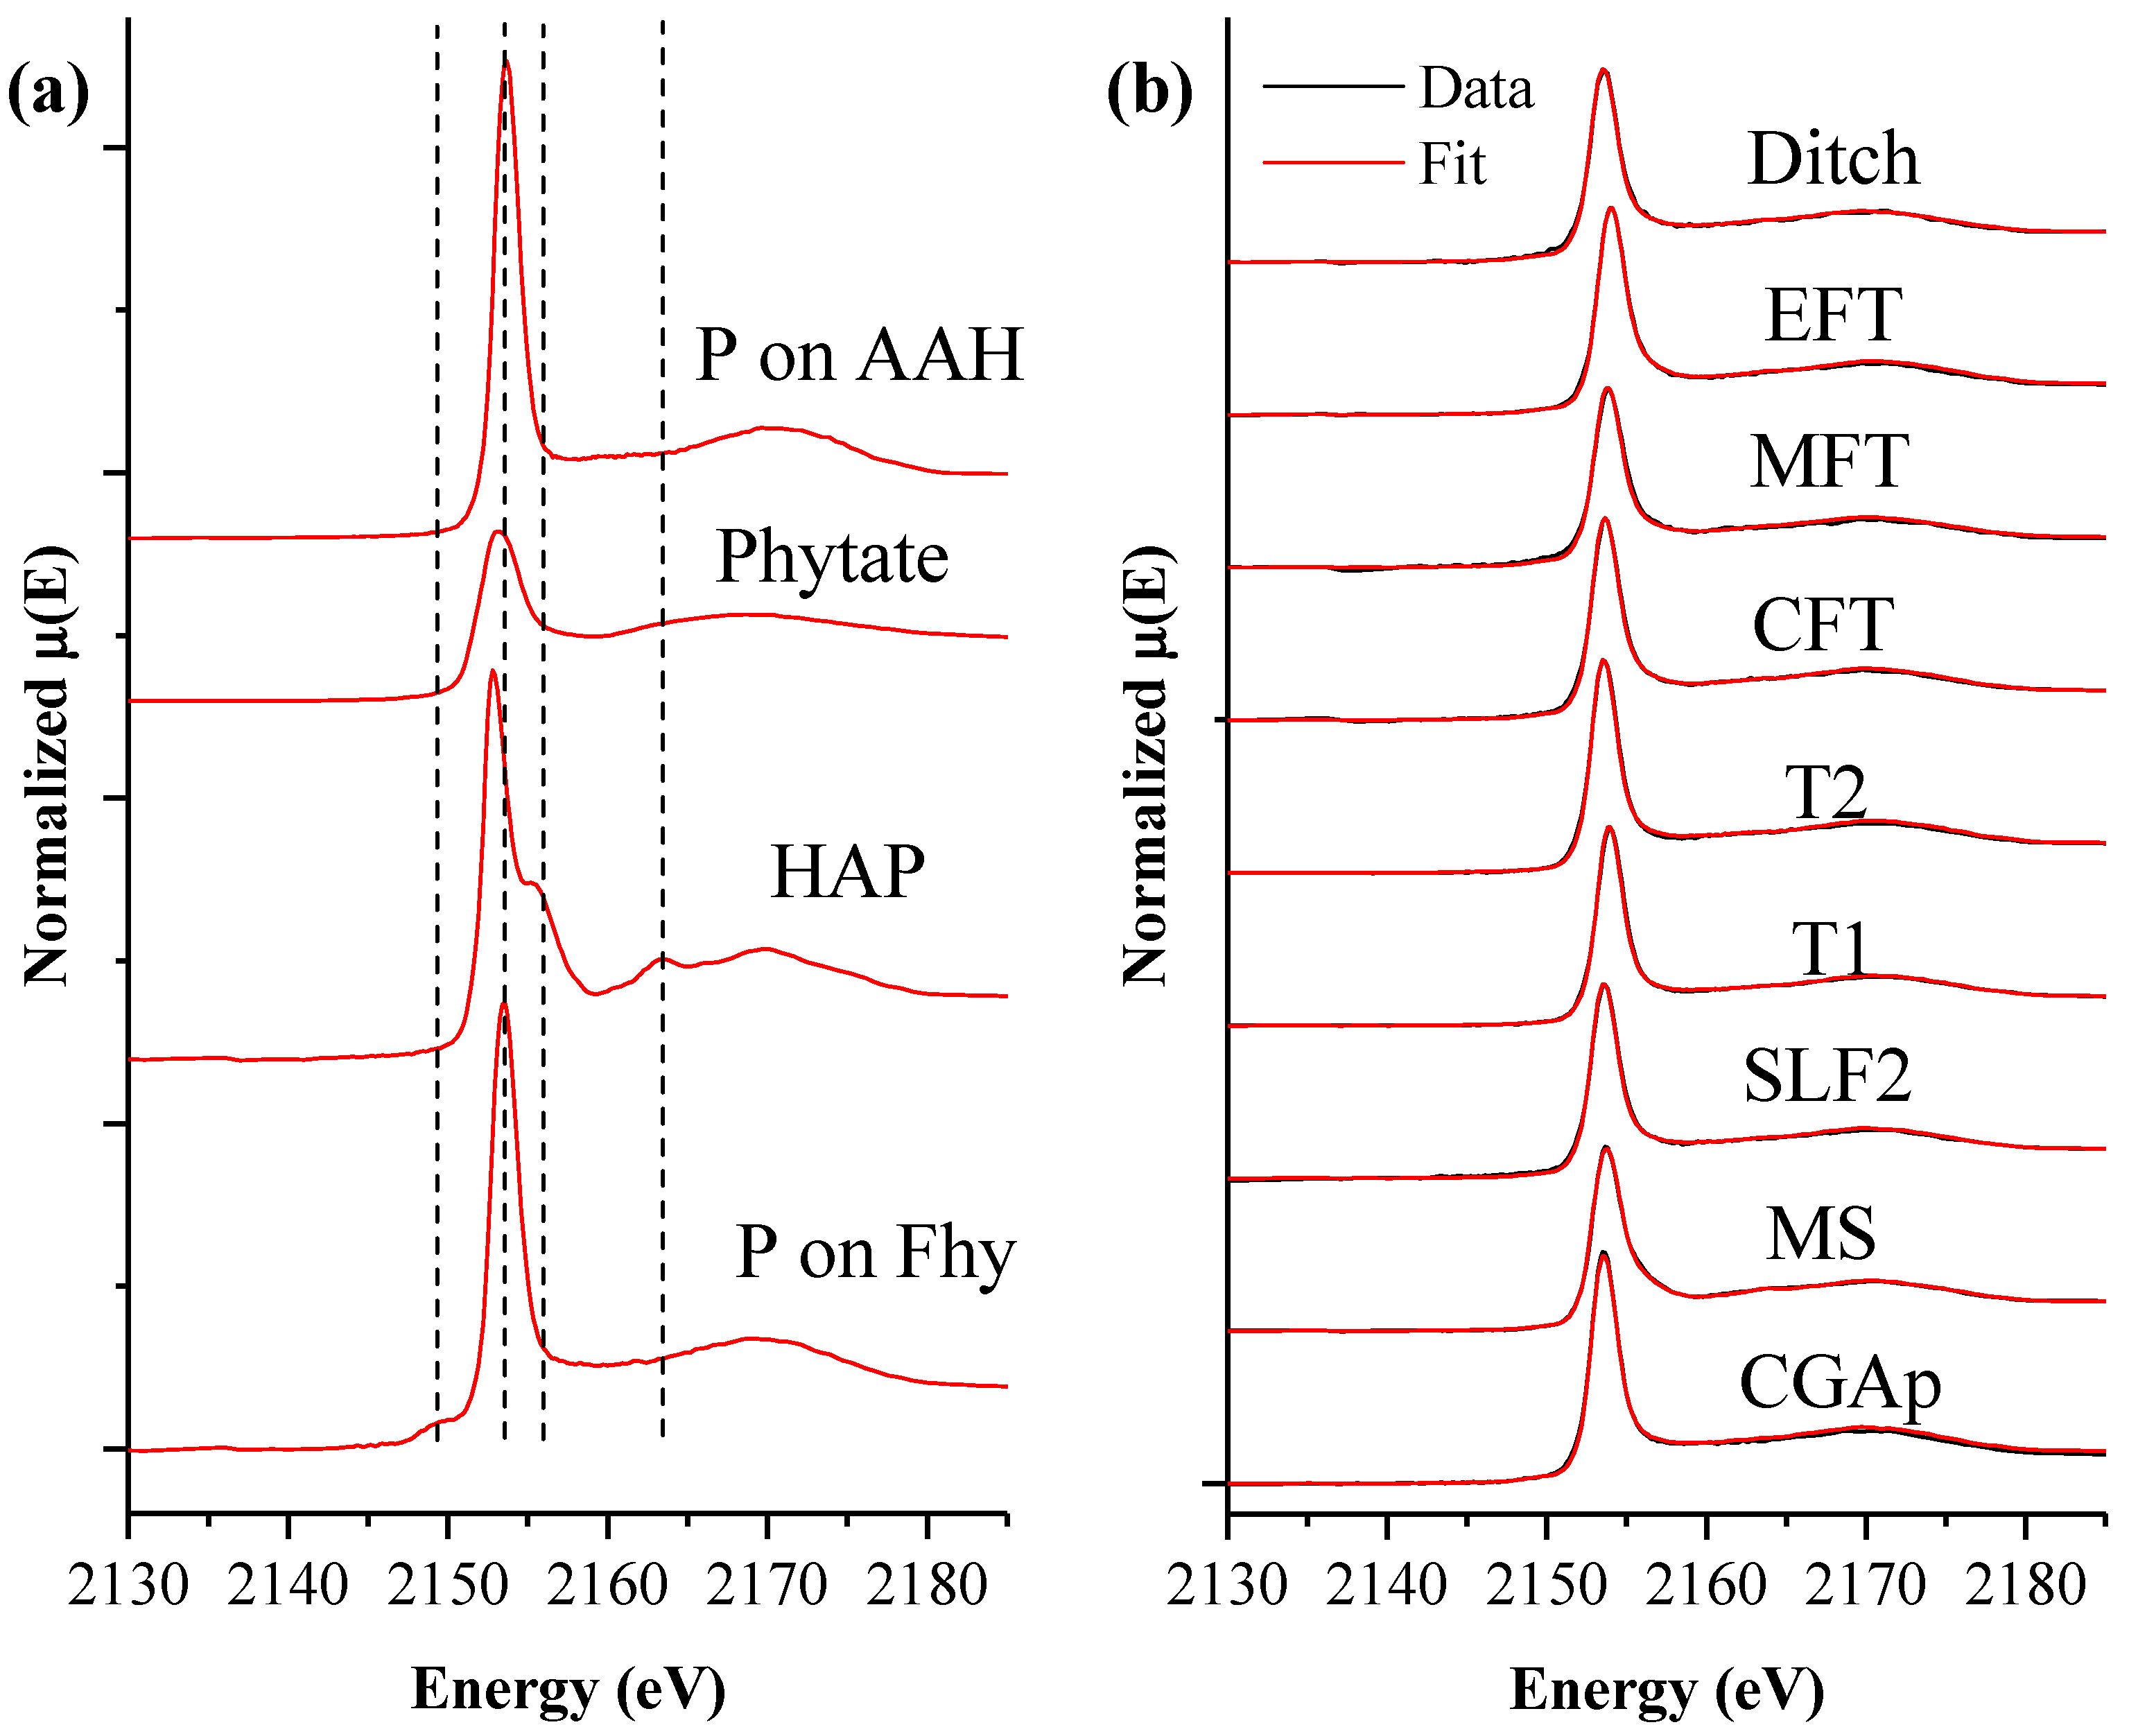
2.5. Bulk P K-Edge XANES and Linear Combination Fitting

The air-dried composite soil samples were ground to a fine powder in a mortar and pestle to homogenize the sample for X-ray absorption spectroscopy (XAS). The samples were mounted in Al sample holders by placing P-free tape along the back of the holder and then dusting a very thin, even layer of sample on the tape in the sample-holder well. Excess sample was tapped off, and sample wells were covered during sample mounting to prevent cross contamination. The bulk P K-edge XANES of samples and standards were collected on beamline 14–3 at the Stanford Synchrotron Radiation Lightsource (SSRL) in Menlo Park, CA and at beamline SXRMB at the Canadian Light Source in Saskatoon, Canada. At 14–3, bulk P K-edge XANES were collected in fluorescence mode in a helium environment with a beam size of 2.5 mm × 1 mm at a 45-degree angle to the sample using a four-element Vortex detector. Standards were diluted with boron nitride to avoid self-absorption. Four to twelve scans of each sample were completed and were plotted in Demeter software program (Version0.9.26, USA) [37], then averaged together to increase the signal-to-noise ratio.
Two of the P compounds used in the linear combination fitting (LCF) analysis were purchased from Sigma-Aldrich: sodium phytate to represent Po and hydroxyapatite (HAP) to represent Ca-P. The Fe-P and Al-P reference materials were prepared by conducting phosphate adsorption experiments on ferrihydrite and amorphous Al oxides, respectively, which can likely represent the P compounds formed on the surfaces of pedogenic Fe and Al hydroxides in soils, including adsorbed and precipitated P [38]. The Fe-P standard was prepared by shaking 0.4 g ferrihydrite with 40 mL of 250 mg P L−1 as KH2PO4 at pH 4.5 for 24 h at 200 rpm. The Fe-P was then rinsed in a 10 mM KCl solution, freeze-dried, and ground for XAS analysis. The Al-P reference spectrum was reported in [39]. Athena was used for the whole analysis, including background subtraction, normalization, and LCF, as described by Gu et al. [39]. LCF analyses were conducted over an energy range of 2130–2182 eV, with energy floating not allowed. The use of certain reference spectra, as well as goodness-of-fit, was evaluated by the R factor, with uncertainties and reduced chi-square values reported. The use of ≤4 P compounds during LCF were able to reduce LCF uncertainties. The four P reference spectra were able to represent well the major P species in our soil samples.

3. Results and Discussion

3.1. MS: Silt Loam

The proximity of this soil sample to a manure storage shed resulted in the highest Mehlich III P (1122 mg kg −1) and total P (2004 mg kg −1) values among all soil samples examined during this study (Table 1). This soil also had the highest PSR of all the soils studied, with a value of 254 (Table 1). PSR is a unitless value. For comparison, a soil considered at low–medium risk of P loss will have a PSR of <25; high risk, from 25 to 50; and very high risk, >50 [33]. Thus, the MS sample is well over “very high risk” for P, and if transport pathways off the field exist, this soil represents an extreme risk of P transport to the environment. The pH of MS was 6.7, with a CEC of 15.8 cmolc kg−1, which is higher than the other samples (Table 2). MS had the highest percentage of P extracted using HCl via Hedley sequential extraction, which suggests that it has a high amount of apatite-like P, as this extractant is known to dissolve calcium phosphates (Figure 2). The LCF results also indicate that MS has a high amount of apatite-like P, at 41.4%, the highest percentage of any of the soils (Table 3). During the desorption studies for MS, HNO3 desorbed the most P when compared with other desorption solutions (Figure 3a). This is in agreement with the Hedley extraction and LCF results, as HNO3 is known to dissolve calcium phosphate [17]. In addition to the Hedley extraction and LCF results, MS also had the highest amount of Ca (2061 mg kg−1) extracted via Mehlich III extraction (Table 1). This further supports the results from the desorption experiments, Hedley sequential extraction, and LCF, which suggest that MS is dominated by calcium phosphate.
Although MS had the highest total P of all the soils, it also had the highest percentage of extractable P during Mehlich III extraction. Mehlich III extractable P can be considered to represent the agronomically or plant-available P during the growing season [28,40]. Using the weakest desorption solution (10 mM KCl), approximately 160 mg P kg−1 soil was desorbed from MS, which is higher than the amount of P desorbed from any other soil using KCl (Figure 3). This indicates that MS has a much higher amount of highly soluble P than the other soil samples. The high amount of soluble P is likely due to the site history of manure input. Using bulk K-edge X-ray absorption near-edge structure (XANES) spectroscopy, Toor et al. found that broiler litter contained 65–76% P as dicalcium phosphate, 13–18% aqueous phosphate, and 7–20% phytic acid [41]. Given the site history of MS, the amount of P removed from the soil during the Hedley HCl extraction step, the LCF, and the HNO3 desorption treatment, in addition to the high amount of Ca in this soil sample, the major P species in MS is dominated by calcium phosphate. MS has received large manure inputs, so this finding is in line with findings from others because poultry manure can contain calcium phosphates, especially highly soluble dicalcium phosphate [41].
The fits of each soil sample, including MS, are provided in Figure 4. In addition to the soil samples, the standards used in LCF are also plotted. The vertical dashed lines plotted on the standards at 2149, 2153.5, 2156, and 2163.5 eV indicate the energy values of significant features in the data: pre-edge peak, white line, post-edge shoulder, and a peak in the HAP standard, respectively. LCF results are provided in Table 3 and are also plotted in Figure 5. In Figure 5, it can be noted that Al-P (gold) was often the dominant standard found in the soils through LCF. However, in the MS sample in particular, there is more Ca-P (green); this is likely due to the site history of this sample as a location for manure storage for at least 50 years.

3.2. SLF2: Silt Loam

SLF2 has half the Mehlich III P, total P, and P saturation ratio of MS (Table 1). Although the PSR is half that of MS at 110, it is still well over the “very high risk” category for P transport off the field. Compared to MS, the lower percentage of P extracted during Hedley HCl extraction suggests that there is a lower contribution of P associated with Ca for SLF2 (Figure 2). The LCF results support the Hedley finding that there is a lower contribution of Ca-P in SLF2, with only 15.5% (Table 3, Figure 5). Additionally, the LCF results indicate that this soil has a high percentage of Al-P at 65.9%. For SLF2, like MS, HNO3 desorbed the most P relative to the other desorption solutions (Figure 3). The KCl desorption solution desorbed the least P (Figure 3b). The Ca disparity between these two soils is likely due to the amount of poultry manure MS received over time, as the manure is high in Ca-P (Table 1) [41]. Interestingly, the K2SO4 and both of the Na2SiO3 desorption solutions removed about three times as much P as the KCl solution. This is an indication that a significant amount of P in SLF2 may be chemisorbed to Fe or Al. The LCF results indicating a high amount of Al-P further support that much of the P in this soil may be chemisorbed by Na2SiO3. Additionally, SLF2 had about 60% total P removed during NaOH extraction in the Hedley sequential extraction. With NaOH presumed to remove P chemisorbed to Fe and Al, this is further evidence that the P species are dominated by Fe and Al. SLF2 also had the highest amount of total Al out of all the soils. These data suggest that the P species found in SLF2 are primarily Fe- and Al-P.

3.3. CGAp: Silt Loam

CGAp has the highest total Fe—four times higher than the content of any other soil investigated in this study. The high Fe content contributes to low PSR (42)—the lowest of the soils studied (Table 1). A PSR value of 42 places this soil in the “high risk” category of P loss. Unlike most of the other soils, CGAp had a higher desorption of P in desorption solutions linked to possible ligand exchange reactions, such as K2SO4 and both 1.0 mM Na2SiO3 and 0.1 mM Na2SiO3 (Figure 3c). The Hedley method assumes that P chemisorbed to Fe and Al is removed during the NaOH portion of the extraction, i.e., P is removed via ligand exchange from those minerals. Thus, CGAp’s relatively large percentage (50%) of NaOH P supports possible ligand exchange mechanisms occurring during NaOH extraction (Figure 2). Additionally, the LCF coincides with these results, as they indicate primarily Fe-P (28.9%) and Al-P (58.3%) (Table 3). Furthermore, the LCF results indicate that CGAp has the highest percentage of phosphate adsorbed onto Fe among all examined soils. This is further supported by CGAp having the highest amount of Fe among all other samples, as well as elevated amounts of Al (Table 1).
Based on the HCl Hedley sequential extraction and the desorption kinetics data, comparatively, CGAp does not have much P in the form of calcium phosphates (e.g., apatite and monetite). The LCF supports this result, with Ca-P at 12.8% (Table 3, Figure 5). In terms of the desorption data, HNO3 is known to dissolve calcium phosphates, and CGAp did not have a large amount of P desorbed via HNO3. The Hedley HCl step is also known to extract calcium phosphates, and CGAp had a small amount of P (6%) extracted during this step. Of all the soil samples, CGAp had the highest percent of P removed during the digestion portion of the Hedley extraction, providing evidence that it contains a large amount of tightly bound and mineral P (residual). This is supported by the fact that CGAp had the lowest percent of P extracted (21%) from Mehlich III compared to total P (Table 1). These data collectively indicate that that the primary P-containing pools in CGAp are oxide surfaces (i.e., Fe and Al oxides), from which P can be removed via ligand exchange. After Fe and Al oxides, the next most abundant pools of P include calcium phosphate and residual P.

3.4. T1 and T2: Loamy Sand Soils

T1 and T2 were the sandiest soils investigated during this study, with 86% and 81% sand, respectively, (Table 2). Although both soils have a similar total P amount (ca. 1000 mg kg−1), both the T1 Mehlich III P content and the P saturation ratio are double those of T2 (Table 1). The first, most notable difference in P desorption between the two soils is the magnitude of desorption on the y-axis (Figure 3d,e). For both T1 and T2, HNO3 desorbed the most P among the desorption solutions, at about 140 mg P kg −1 soil and 34 mg P kg −1 soil, respectively (Figure 3d,e). Like the other soils in this study, KCl desorption was also the lowest for both soils.
Among all soils in this study, T1 had the second highest percentage of DI-extractible and NaHCO3-extractible P during Hedley sequential extraction, which suggests that it has a higher amount of labile P than most of the other soils, as these extractants are known to remove soluble and labile P (Figure 2) [35]. Although KCl removed the less P from T1 than the other desorption solutions, it still desorbed about 60 mg P kg−1 soil, offering more evidence that this soil has considerable amounts of labile P. The LCF of T1 indicates about 7.8% of the P species in this soil are organic P, whereas the LCF of T2 shows 0% organic P (Table 3, Figure 5). Therefore, some of the labile P removed from T1 may be in the form of loosely adsorbed Po. According to the Hedley sequential extraction, T1 has a low amount of P associated with Ca, whereas the HCl extraction only removed about 9% of the total P; this is low when compared to the other soils. HCl dissolves calcium phosphates [35,36]. This is supported by the low total Ca (944 mg kg−1) compared to other soils in this study (Table 1). Furthermore, the LCF of T1 had the lowest percentage of Ca-P among all examined soils, at 11.7%, which is in line with the Hedley sequential extraction. T1 and T2 have the lowest % residual P of all soils examined in this study, at 4%, which indicates that T1 and T2 have very little residual P. Thus, this field is at high risk of P loss.
T2 had the highest percentage of P extracted from the soil during the NaOH step (68%) versus any of the other Hedley sequential extraction steps or other soils, suggesting that the majority of the P in this soil is associated with Fe and Al through inner-sphere complexation (Figure 2). Furthermore, the LCF shows T1 and T2 have the highest percentages of Al-P of all soils in this study, with 80.4% and 82.8% Al-P, respectively (Table 3, Figure 5). This is further evidence that these soils are dominated by P chemisorbed to Al. For T2 in particular, both Na2SiO3 solutions and the K2SO4 desorption solution removed significantly more P than the KCl solution, which further indicates that this soil may be dominated by inner-sphere P complexes associated with Al and Fe. Interestingly, K2SO4 desorption removed slightly more P than both Na2SiO3 solutions, which may be an indication that for T2, sulfate has more of an effect on phosphate desorption. The Hedley sequential extraction also showed that T2 has one of the lowest percentages of P extracted in DI water and NaHCO3, indicating that it has low amounts of labile P (Figure 2). This is supported by the low amount of P that was extracted using Mehlich III when compared to the total P (Table 1), as well as the low P desorption in KCl compared to the other desorption agents. According to these results, T1 and T2 likely have a majority of P adsorbed to Fe and Al through inner-sphere complexation.

3.5. Transect (CFT, MFT, EFT, and Ditch): Loam and Loamy Sand

The three soils collected along the transect (CFT, MFT, and EFT) are all classified as loam, with approximately 50% sand, and the Ditch sample is a loamy sand, with 86% sand (Table 2). The difference in soil texture between the field and the ditch is expected because the ditch has been anthropogenically altered, removing most of the topsoil, and may reflect the soil conditions at that depth within the field. With the exception of the Ditch pH (6.2), the three field soils share a similar pH of about 5.3 and organic matter content of about 1.7%. Of the examined soils, the Crisfield transect field soils have the lowest pH and organic matter content.
Of the transect soils, the total P was highest for the EFT sample, at 727 mg P kg−1 soil, with the Mehlich III-extractable P removing 42% of the total P (Table 1). The percentage of total P extracted during Mehlich III extraction was 53% and 60% for CFT and MFT, respectively. The Ditch sample had a similarly high percentage of total P removed by the Mehlich III extraction, at 57%; therefore, although this sample had lower total P, most of it was easily mobilized. This is problematic, as the ditch drains into a creek that empties into Chesapeake Bay. Although EFT sample had more total P than the other soils along the transect, it had the lowest PSR of the three field soils. EFT also had the highest total Fe and Al of the samples collected at this site, which may help explain the lower P saturation ratio.
For all three field transect soils (CFT, MFT, and EFT), the HNO3 desorption solution removed the most P, indicating these soils contain calcium phosphates. Slightly more phosphorus was removed from MFT using HNO3 than CFT and EFT, at approximately 140 mg P kg−1 soil, indicating that a large portion of the P present in this soil is calcium phosphate. This is further supported by the higher percentage of total P removed during the HCl Hedley sequential extraction of MFT. This is because both acidic (HNO3 and HCl) extractions can remove Ca phosphate minerals. Additionally, the LCFs of CFT, MFT, and EFT indicate a large percentage of the P species are Ca-P, with 21.4%, 15.5%, and 25.2%, respectively. The values for EFT, MFT, and CFT determined from LCF are similar (Figure 5) except for the % contribution allocated to Po. The increase in Po in MFT is likely due to a small shoulder feature at 2161.2 eV, which pulls the LCF to a lower energy and increases the contribution of the Po standard. This shoulder feature is perhaps due to noise in the MFT spectrum.
For the three transect field soils, the desorption solutions that removed the least amounts of P were either K2SO4 or KCl (Figure 3f–h). Interestingly and unlike any other soil in this study, it appears that the 1.0 mM K2SO4 desorbed the least P for CFT. This is interesting because for all other soils in this study, the KCl desorption solution removed the least P when compared to the other desorption solutions. The difference between K2SO4 and KCl as desorption agents is that K2SO4 may remove chemisorbed P (i.e., inner-sphere bound P; [23]), whereas KCl tends to remove outer-sphere bound P. For the transect field soils, both KCl and K2SO4 desorption solutions appear to have a similarly low P-removal effectiveness. According to the Hedley sequential extraction, all three field transect soils appear to have a similar percentage of easily extractable P (DI + NaHNO3), at about 25%. However, among the three transect field soils, EFT has the lowest DI-extractable P (5%), indicating the P from this location is slightly less labile. Additionally, among all four transect soils, EFT had the highest percentage of P found in the digest (14%) during Hedley sequential extraction, which suggests that this soil has more residual P than the soil from the three other transect locations. This difference between EFT, CFT, and MFT may be due to their locations within the field; for example, EFT is located at the edge of the field site and is therefore impacted more by leaching into the ditch; thus, more labile P is removed from EFT than from the samples taken from the center portions of the field (CFT and MFT). Considering the four transect soil samples, the lowest percentage of P removed during the Mehlich III extraction in EFT is more evidence that EFT has higher residual P.
The desorption trends for both Na2SiO3 treatments appear to be similar for the three field soils in the transect. Both desorption curves for Na2SiO3 are above the KCl and K2SO4 desorption curves for all soils, meaning that Na2SiO3 is more effective at desorbing P than KCl and K2SO4. EFT had the lowest amount of P removed with Na2SiO3 among the three field transect soils, with an equilibrium concentration of about 65 mg P kg−1 soil, whereas CFT and MFT had approximately 80 and 110 mg P kg−1 soil removed, respectively (Figure 3). Because CFT and MFT have more labile P than EFT, the lower amount of P desorbed by the silicate solutions in EFT reflects that silicate may remove the labile P and P associated with Fe oxides as inner-sphere complexes. Furthermore, the LCF indicates high percentages of Fe-P for CFT, MFT, and EFT, at 21.6%, 27.3%, and 21.2%, respectively (Table 3, Figure 5). These results are further evidence of chemisorbed Fe-P that may be desorbed by silicate.
Conversely, the Ditch sample had a much different desorption trend compared to all other soils in this study. According to the Hedley sequential extraction, the Ditch had the greatest amount of soluble and labile P, which are accounted for with by DI + NaHCO3 extractions: over 40% of total P. The Ditch also had one of the lowest percentages of P removed during the Hedley HCl extraction compared to the other soils, suggesting that there is a lower amount of P in this soil associated with calcium phosphates (Figure 2). The LCF of Ditch indicates 15.5% of the P species in this soil are Ca-P, which is mid-range among the other soils in this study (Table 3). The kinetic desorption experiment also indicates that the Ditch sample has a low amount of P as calcium phosphate because the HNO3 desorption solution was not very effective (Figure 3i). Interestingly, 1.0 mM K2SO4 was the most effective desorption solution for the Ditch sample. This is evidence that sulfate may effectively compete with and replace loosely held phosphate anions. The LCF of Ditch indicates high oxide content, with Fe-P at 26.8% and Al-P at 47.1%, providing more evidence that this soil is dominated by chemisorbed P (Table 3). It seems that there may be some difference in selection for P removal, as the desorption curve for 1.0 mM K2SO4 is much higher than that of both Na2SiO3 treatments, whereas in the CGAp soil with similar Fe-P content, the desorption curves removed similar amounts of P. The key differences between these two soils are in labile P (Hedley) and Po, with the LCF Po contribution higher for Ditch, at 10.5% (Table 3).

4. Conclusions

The high amounts of P desorption from the MS sample support our first hypothesis that soils with high initial P will release higher amounts of P using weak desorption agents. The MS sample had the highest levels of P and illustrates the problems of legacy P in soils of this region. Based on the Hedley extraction results and LCF of the bulk P XANES, the presence of P bound to Ca was also identified as the primary species, which is in line with our second hypothesis that Ca would be an important contributor to P speciation. Poultry manure itself can be high in Ca-phosphate [41]. However, not all samples contained high Ca-phosphate. Furthermore, Fe-/Al-oxides continue to play an important role in P sorption. Lastly, the Ditch sample, which is exposed to more water fluctuations, also had very different P speciation than the transect samples, which confirmed our third hypothesis that P species would vary in the Ditch. It appears that the frequent inundations in the Ditch prevent the formation of tightly bound P species or recalcitrant P species. This could perhaps be due to rapidly changing redox conditions in the Ditch. Further research on this site is merited to better understand any potential temporal changes in P species with water content.
The MS sample had the highest total P and the highest PSR and is dominated by calcium phosphates. The CGAp soil had the lowest PSR and the highest residual P of all the soils in this study. There were several differences in the solubility, availability, and bulk speciation of P in the soils along the transect, for example, with the EFT sample adjacent to the ditch having the least available P. The increased P desorbed from soils using sulfate or silicate as desorbing solution indicates that P is likely less soluble, and ligand exchange may be occurring during desorption. Importantly, a comparison of the different desorption solutions indicates that in some cases, sulfate has stronger competition for phosphate desorption than sodium silicate (e.g., CGAp, T2, and Ditch samples). Most notably, the soil sample with the highest amount of labile P and P removed with sulfate was found in the Ditch sample, which is a direct pathway to the Chesapeake Bay. The finding that the Ditch sample had the most labile and highest amount of P removed with sulfate is significant because this site is directly connected to a creek that feeds into the Chesapeake Bay.
The implications for the high amounts of labile P in the Ditch sediment are important with respect to both legacy P loss into the environment and enhanced P loss due to climate change. The problem with high-legacy-P soils is that many adsorption sites are occupied by P, and therefore, they represent a significant source of P over time, even as the input of P fertilizer stops. Additionally, because there is more P in the soil, more P is released to the soil solution. This is particularly problematic for coastal soils, such as those on the Delmarva Peninsula, where poultry production and land application of poultry waste has been a common practice for decades. However, now that sea level rise is evident, particularly in the mid-Atlantic, the risk [42] the risk of P release is even greater. As sea levels rise and inundation of these soils with seawater containing sulfate continues, large initial losses of P will likely occur. Therefore, future experiments should include several variables. Firstly, higher concentrations of K2SO4 and Na2SiO3 should be used to further investigate the potential role that high anion concentration will play in P desorption. Specifically, higher levels of sulfate are important to investigate for their impact on P release with sea level rise.

Author Contributions

Conceptualization, K.D.S.; methodology, K.D.S.; formal analysis, K.D.S., M.E. and C.G.; investigation, K.D.S.; data curation, K.D.S., M.E. and C.M.; writing—original draft preparation, K.D.S. and M.G.S.; writing—review and editing, K.D.S. and M.G.S.; supervision, D.L.S.; funding acquisition, D.L.S. All authors have read and agreed to the published version of the manuscript.

Funding

This research was funded by USDA-NIFA (National Institute of Food and Agriculture), grant number 2017-67019-26333.

Data Availability Statement

The data is available upon request by contacting the corresponding author. The soil samples can be made available upon request for the next 5 years.

Conflicts of Interest

The authors declare no conflict of interest.

References

  1. Shober, A.L.; Maguire, R.O. Reference Module in Earth Systems and Environmental Sciences. In Manure Management; Elsevier: Amsterdam, The Netherlands, 2018. [Google Scholar]
  2. Qin, Z.; Shober, A.L. The challenges of managing legacy phosphorus losses from manure-impacted agricultural soils. Curr. Pollut. Rep. 2018, 4, 265–276. [Google Scholar] [CrossRef]
  3. Sharpley, A.; Jarvie, H.P.; Buda, A.; May, L.; Spears, B.; Kleinman, P. Phosphorus legacy: Overcoming the effects of past management practices to mitigate future water quality impairment. J. Environ. Qual. 2013, 42, 1308–1326. [Google Scholar] [CrossRef] [PubMed] [Green Version]
  4. Sims, J.T.; Edwards, A.C.; Schoumans, O.F.; Simard, R.R. Integrating soil phosphorus testing into environmentally based agricultural management practices. J. Environ. Qual. 2000, 29, 60–71. [Google Scholar] [CrossRef]
  5. Sims, J.T. Phosphorus soil testing: Innovations for water quality protection. Commun. Soil Sci. Plant Anal. 1998, 29, 1471–1489. [Google Scholar] [CrossRef]
  6. Jarvie, H.P.; Sharpley, A.N.; Spears, B.; Buda, A.R.; May, L.; Kleinman, P.J.A. Water quality remediation faces unprecedented challenges from “legacy phosphorus”. Environ. Sci. Technol. 2013, 47, 8997–8998. [Google Scholar] [CrossRef] [PubMed] [Green Version]
  7. Sharpley, A.N.; Kleinman, P.J.A.; Flaten, D.N.; Buda, A.R. Critical source area management of agricultural phosphorus: Experiences, challenges and opportunities. Water Sci. Technol. 2011, 64, 945–952. [Google Scholar] [CrossRef]
  8. Kleinman, P.J.A.; Sharpley, A.; Buda, A.; McDowell, R.; Allen, A. Soil controls of phosphorus in runoff: Management barriers and opportunities. Can. J. Soil Sci. 2011, 91, 329–338. [Google Scholar] [CrossRef]
  9. McDowell, R.W.; Sharpley, A.N.; Chalmers, A.T. Land use and flow regime effects on phosphorus chemical dynamics in the fluvial sediment of the Winooski River, Vermont. Ecol. Eng. 2002, 18, 477–487. [Google Scholar] [CrossRef]
  10. Bhattacharyya, P.; Nayak, A.K.; Shahid, M.; Tripathi, R.; Mohanty, S.; Kumar, A.; Raja, R.; Panda, B.B.; Lal, B.; Gautam, P.; et al. Effects of 42-year long-term fertilizer management on soil phosphorus availability, fractionation, adsorption-desorption isotherm and plant uptake in flooded tropical rice. Crop J. 2015, 3, 387–395. [Google Scholar] [CrossRef] [Green Version]
  11. Dou, Z.X.; Ramberg, C.F.; Toth, J.D.; Wang, Y.; Sharpley, A.N.; Boyd, S.E.; Chen, C.R.; Williams, D.; Xu, Z.H. Phosphorus speciation and sorption-desorption characteristics in heavily manured soils. Soil Sci. Soc. Am. J. 2009, 73, 93–101. [Google Scholar] [CrossRef] [Green Version]
  12. Jiao, Y.; Whalen, J.K.; Hendershot, W.H. Phosphate sorption and release in a sandy-loam soil as influenced by fertilizer sources. Soil Sci. Soc. Am. J. 2007, 71, 118–124. [Google Scholar] [CrossRef]
  13. Singh, V.; Dhillon, N.; Brar, B. Influence of long-term use of fertillizers and farmyard manure on the adsorption-desorption behavior and bioavailability of phosphorus in soils. Nutr. Cycl. Agroecosyst. 2006, 75, 67–78. [Google Scholar] [CrossRef]
  14. Breeuwsma, A.; Reijerink, J.G.A.; Schoumans, O.F. Impact of manure on accumulation and leaching of phosphate in areas of intensive livestock farming. In Animal Waste and the Landwater Interface; Steele, K., Ed.; Lewis Publishers: Boca Raton, FL, USA, 1995; pp. 239–249. [Google Scholar]
  15. Sample, E.C.; Soper, R.J.; Racz, G.J. Reactions of phosphate fertilizers in soils. In The Role of Phosphorus in Agriculture; Khasawneh, F.E., Sample, E.C., Kamprath, E.J., Eds.; ASA and SSSA: Madison, WI, USA, 1980; pp. 263–310. [Google Scholar]
  16. Wang, Q.; Li, Y. Phosphorus adsorption and desorption behavior on sediments of different origins. J. Soils Sediments 2010, 10, 1159–1173. [Google Scholar] [CrossRef]
  17. Gamble, A. Speciation and Reactivity of Phosphorus and Arsenic in Mid-Atlantic Soils. Ph.D. Thesis, University of Delaware, Newark, DE, USA, 2017. [Google Scholar]
  18. Violante, A. Elucidating mechanisms of competitive sorption at the mineral/water interface. Adv. Agron. 2013, 118, 111–176. [Google Scholar]
  19. Lee, Y.B.; Hoon, C.; Hwang, J.Y.; Lee, I.B.; Kim, P.J. Enhancement of phosphate desorption by silicate in soils with salt accumulation. Soil Sci. Plant Nutr. 2004, 50, 493–499. [Google Scholar] [CrossRef] [Green Version]
  20. Owino-Gerroh, C.; Gascho, G.J. Effect of silicon on low pH soil phosphorus sorption and on uptake and growth of maize. Commun. Soil Sci. Plant Anal. 2005, 35, 2369–2378. [Google Scholar] [CrossRef]
  21. Koski-Vähälä, J.; Hartikainen, H.; Tallberg, P. Phosphorus mobilization from various sediment pools in response to increased pH and silicate concentration. J. Environ. Qual. 2001, 30, 546–552. [Google Scholar] [CrossRef]
  22. Jianfeng, M.A.; Takahashi, E. Effect of silicate on phosphate availability for rice in a P-deficient soil. Plant Soil 1991, 133, 151–155. [Google Scholar] [CrossRef]
  23. Pigna, M.; Violante, A. Adsorption of sulfate and phosphate on andisols. Commun. Soil Sci. Plant Anal. 2003, 34, 2099–2113. [Google Scholar] [CrossRef]
  24. Lamers, L.P.; Tomassen, H.B.; Roelofs, J.G. Sulfate-induced eutrophication and phytotoxicity in freshwater wetlands. Environ. Sci. Technol. 1998, 32, 199–205. [Google Scholar] [CrossRef]
  25. DE.gov. Available online: https://de.gov/topics/facts/geo.shtml (accessed on 30 March 2022).
  26. MODIS. Satellite Image of the Chesapeake Bay. 2000, NASA. Available online: https://visibleearth.nasa.gov/images/54295/chesapeake-bay-from-modis (accessed on 3 October 2021).
  27. Eckert, D.; Sims, J.T. Recommended soil pH and lime requirement tests. In Recommended Soil Testing Procedures for the Northeastern United States; Sims, J.T., Wolf, A., Eds.; University of Delaware: Newark, DE, USA, 1995; pp. 11–16. [Google Scholar]
  28. Schulte, E.E. Recommended soil organic matter tests. In Recommended Soil Testing Procedures for the Northeastern United States; Sims, J.T., Wolf, A., Eds.; University of Delaware: Newark, DE, USA, 1995; pp. 47–56. [Google Scholar]
  29. Wolf, A.; Beegle, D. Recommended soil tests for macro and micronutrients. In Recommended Soil Testing Procedures for the Northeastern United States, 3rd ed.; Wolf, A., Ed.; University of Delaware: Newark, DE, USA, 2011; pp. 39–48. [Google Scholar]
  30. Ross, D. Recommended soil tests for determining soil cation exchange capacity. In Recommended Soil Testing Procedures for the Northeastern United States; Sims, J.T., Wolf, A., Eds.; University of Delaware: Newark, DE, USA, 1995; pp. 62–69. [Google Scholar]
  31. USEPA. Test Methods for Evaluating Solid Waste, 3rd ed.; National Technical Information Service: Springfield, VA, USA, 1986. [Google Scholar]
  32. Bouyoucos, G.J. Hydrometer method improved for making particle size analysis of soils. Agron. J. 1962, 54, 464–465. [Google Scholar] [CrossRef]
  33. Sims, J.; Maguire, R.O.; Leytem, A.B.; Gartley, K.L.; Pautler, M.C. Evaluation of Mehlich 3 as an Agri-Environmental Soil Phosphorus Test for the Mid-Atlantic United States of America. Soil Sci. Soc. Am. J. 2002, 66, 2016–2032. Available online: https://www.researchgate.net/publication/255643736_Evaluation_of_Mehlich_3_as_an_Agri-Environmental_Soil_Phosphorus_Test_for_the_Mid-Atlantic_United_States_of_America (accessed on 2 April 2022). [CrossRef]
  34. Sims, J.T.; Gartley, K.L. Note 18: Phosphorus management and the phosphorus saturation ratio. In Soil Test Notes; University of Delaware: Newark, DE, USA, 2001. [Google Scholar]
  35. Welsh, C.; Tenuta, M.; Flaten, D.N.; Thiessen-Martens, J.R.; Entz, M.H. High yielding organic crop management decreases plant-available but not recalcitrant phosphorus. Agron. J. 2009, 101, 1027–1035. [Google Scholar] [CrossRef]
  36. Hedley, M.J.; Stewart, J.W.B.; Chauhan, B.S. Changes in inorganic and organic soil phosphorus fractions induced by cultivation practices and by laboratory incubations. Soil Sci. Soc. Am. J. 1982, 46, 970–976. [Google Scholar] [CrossRef]
  37. Ravel, B.; Newville, M. Athena, Artemis, Hephaestus: Data analysis for X-ray absorption spectroscopy using Ifeffit. J. Synchrotron Radiat. 2005, 12, 537–541. [Google Scholar] [CrossRef] [PubMed] [Green Version]
  38. Wang, X.; Hu, Y.; Tang, Y.; Yang, P.; Feng, X.; Xu, W.; Zhu, M. Phosphate and phytate adsorption and precipitation on ferrihydrite surfaces. Environ. Sci. Nano 2017, 4, 2193–2204. [Google Scholar] [CrossRef]
  39. Gu, C.; Dam, T.; Hart, S.C.; Turner, B.L.; Chadwick, O.A.; Berhe, A.A.; Hu, Y.; Zhu, M. Quantifying uncertainties in sequential chemical extraction of soil phosphorus using XANES spectroscopy. Environ. Sci. Technol. 2020, 54, 2257–2267. [Google Scholar] [CrossRef]
  40. Weil, R.R.; Brady, N.C. The Nature and Properties of Soils; Pearson Education: London, UK, 2016. [Google Scholar]
  41. Toor, G.S.; Peak, J.D.; Sims, J.T. Phosphorus speciation in broiler litter and turkey manure produced from modified diets. J. Environ. Qual. 2005, 34, 687–697. [Google Scholar] [CrossRef] [Green Version]
  42. EPA. A Closer Look: Land Loss Along the Atlantic Coast. Available online: https://www.epa.gov/climate-indicators/atlantic-coast (accessed on 9 March 2022).
Figure 1. Modified satellite image of the Chesapeake Bay, image credit Jacques Descloitres, MODIS Land Science Team, NASA [26]. Stars indicate agricultural composite soil sampling locations on the Delmarva Peninsula. (1) Newark, Delaware: CGAp; (2) Parsonsburg, Maryland: T1 and T2; (3) Princess Anne, Maryland: Manure Shed (MS) and SLF2; (4) Crisfield, Maryland: CFT, MFT, EFT, and Ditch.
Minerals 12 00458 g001
Figure 2. Phosphorus values from modified Hedley sequential extraction for composite soil samples collected throughout the Delmarva Peninsula. Hedley sequential extraction solution contributions from the different extractions (different colors) are shown as a percentage of the total P in the sample (each complete column). CGAp is a community garden soil; MS had a manure storage shed on it; SLF2 is an agricultural field on the same farm as MS; T1 and T2 are agricultural fields from a second farm; and CFT (center field transect), MFT (middle field transect), EFT (edge field transect), and Ditch are agricultural soil samples from a third farm along a transect.
Minerals 12 00458 g002
Figure 3. Desorption experimental results for agricultural composite soil samples collected throughout the Delmarva Peninsula. Desorbing solutions were potassium chloride (KCl), nitric acid (HNO3), 0.1 mM sodium silicate (Na2SiO3), 1.0 mM sodium silicate (Na2SiO3), and 1.0mM potassium sulfate (K2SO4). CGAp is a community garden soil; MS had a manure storage shed on it; SLF2 is an agricultural field on the same farm as MS; T1 and T2 are agricultural fields from a second farm; and CFT (center field transect), MFT (middle field transect), EFT (edge field transect), and Ditch are agricultural soil samples from a third farm along a transect. (a) Desorption curves for soil MS; (b) Desorption curves for soil SLF2; (c) Desorption curves for soil CGAp; (d) Desorption curves for soil T1; (e) Desorption curves for soil T2; (f) Desorption curves for soil CFT; (g) Desorption curves for soil MFT; (h) Desorption curves for soil EFT; (i): Desorption curves for soil Ditch.
Minerals 12 00458 g003
Figure 4. Phosphorus (P) reference spectra used for linear combination fittings (LCF) (a) and P X-ray absorption near-edge structure (XANES) spectra and their linear combination fits for the soils (b). Standards are P adsorbed onto amorphous aluminum hydroxides (P on AAH), phytic acid (phytate), hydroxyapatite (HAP), and P adsorbed onto ferrihydrite (P on Fhy). CGAp is a community garden soil; MS had a manure storage shed on it; SLF2 is an agricultural field on the same farm as MS; T1 and T2 are agricultural fields from a second farm; and CFT (center field transect), MFT (middle field transect), EFT (edge field transect), and Ditch are agricultural soil samples from a third farm along a transect.
Minerals 12 00458 g004
Figure 5. Graphical representation of the linear combination fitting of the soils with phytic acid P (Po), P adsorbed to ferrihydrite (Fe-P), P adsorbed to amorphous aluminum hydroxides (Al-P), and hydroxyapatite (Ca-P). CGAp is a community garden soil; MS had a manure storage shed on it; SLF2 is an agricultural field on the same farm as MS; T1 and T2 are agricultural fields from a second farm; and CFT (center field transect), MFT (middle field transect), EFT (edge field transect), and Ditch are agricultural soil samples from a third farm along a transect.
Minerals 12 00458 g005
Table 1. Elemental concentrations of extractions and digestions.
Mehlich III Extractible EPA3051
SoilPFeAlCaMnSKP Sat.% PPFeAlCaMnSK
mg kg−1RatioRemovedmg kg−1
CGAp19927298277479925741.521.293716430143421099390165918
MS112240773720612517517253.856.0200445011254433811123251751
SLF2634292111212791215212109.557.211094037159131692512141522
T160715611176461615100110.159.310231117475894439184436
T2357273132182081810055.536.797420615655126432195359
CFT25619557880891414083.553.14821920753898529148876
MFT331302482699141312311460.05521835513488535140684
EFT3034106701063101815276.941.772748418807129951192699
Ditch18157636057810336363.456.63201922352858919238336
Note: CGAp is a community garden soil; MS had a manure storage shed on it; SLF2 is an agricultural field on the same farm as MS; T1 and T2 are agricultural fields from a second farm; and CFT (center field transect), MFT (middle field transect), EFT (edge field transect), and Ditch are agricultural soil samples from a third farm along a transect.
Table 2. Soil texture, soil pH, organic matter (OM), and cation exchange capacity (CEC) of composite agricultural soil samples collected throughout the Delmarva Peninsula.
SoilSandSiltClayTexturepHOMCEC
% %cmolc kg soil−1
CGAp136522Silt loam6.12.67.1
MS295318Silt loam6.73.115.8
SLF2176320Silt loam6.13.010.4
T186104Loamy sand5.43.47.2
T281136Loamy sand5.73.67.7
CFT433324Loam5.21.77.3
MFT522820Loam5.11.66.2
EFT512524Loam5.41.710.4
D18686Loamy sand6.21.44.2
CGAp is a community garden soil; MS had a manure storage shed on it; SLF2 is an agricultural field on the same farm as MS; T1 and T2 are agricultural fields from a second farm; and CFT (center field transect), MFT (middle field transect), EFT (edge field transect), and Ditch are agricultural soil samples from a third farm along a transect.
Table 3. Linear combination fitting (LCF) results as percentage of total P and the associated uncertainties, with the R-factor and reduced chi-square values indicating the goodness of the LCF results. The symbols on the left indicate phytic acid P (Po), P adsorbed to ferrihydrite (Fe-P), P adsorbed to amorphous aluminum hydroxides (Al-P), and hydroxyapatite (Ca-P).
P Speciation (%)CGAP±MS±SLF2±T1±T2±CFT±MFT±EFT±Ditch±
Po0.01.61.70.97.91.57.81.40.01.60.50.619.82.00.01.210.51.5
Fe-P28.93.89.72.110.83.50.03.23.33.721.63.327.34.621.23.026.83.6
Al-P58.32.947.21.665.92.680.42.482.82.856.52.536.93.553.62.347.12.8
Ca-P12.81.641.40.815.51.311.71.213.81.421.44.215.91.825.21.215.51.4
R factor0.0021 0.0008 0.0020 0.0016 0.0019 0.0017 0.0042 0.0014 0.0022
Reduced chi-square0.0053 0.0013 0.0035 0.0029 0.0040 0.0033 0.0065 0.0029 0.0038
Publisher’s Note: MDPI stays neutral with regard to jurisdictional claims in published maps and institutional affiliations.

