Article

Column-Test Data Analyses and Geochemical Modeling to Determine Uranium Reactive Transport Parameters at a Former Uranium Mill Site (Grand Junction, Colorado)

RSI EnTech, LLC, The U.S. Department of Energy Office of Legacy Management, Grand Junction, CO 81503, USA
*
Author to whom correspondence should be addressed.
Minerals 2022, 12(4), 438; https://doi.org/10.3390/min12040438
Submission received: 19 January 2022 / Revised: 25 March 2022 / Accepted: 28 March 2022 / Published: 31 March 2022
(This article belongs to the Special Issue Environmentally Sound In-Situ Recovery Mining of Uranium)

Abstract

:
The long-term release of uranium from residual sources at former uranium mill sites was often not considered in prior conceptual and numerical models, as contaminant removal focused on meeting radiological standards. To determine the reactive transport parameters, column tests were completed with various influent waters (deionized water, site groundwater, and local river water) on sediment from identified areas with elevated uranium on the solid phase in (1) vadose-zone (VZ) sediments, (2) saturated-zone sediments with higher organic carbon content, and (3) both vadose- and saturated-zone sediments with additional gypsum content. The gypsum was precipitated when low-pH, high-sulfate, tailings fluids or acidic waste disposal water were buffered by natural aquifer calcite dissolution. In general, the resulting uranium release was higher in the sediments with greater uranium concentrations. However, the addition of deionized water (DI) to the VZ sediments delayed the uranium release until higher-alkalinity groundwater was added. Higher-alkalinity river water continued to remove uranium from the VZ sediments for an extended number of pore volumes, with the uranium being above typical standards. Thus, river flooding is more efficient at removing uranium from VZ sediments than precipitation events (DI water in column tests). Organic carbon provides a stronger uranium sorption surface, which can be explained with geochemical modeling or a larger constant sorption coefficient (Kd). Without organic carbon, the typical sorption in sands and gravels is easily measurable, but sorption is stronger at lower, water-phase uranium concentrations. This effect can be simulated with geochemical modeling, but not with a constant Kd. Areas with gypsum create situations in which geochemical sorption is more difficult to simulate, which is likely due to the presence of uranium within mineral coatings. All the above mechanisms for uranium release must be considered when evaluating remedial strategies. Column testing provides initial input parameters that can be used in future reactive transport modeling to evaluate long-term uranium release rates and concentrations.

1. Objective

After solid-phase material is collected and contaminated zones are identified, column testing on contaminated sediments is an important laboratory procedure to determine ongoing contaminant release rates at former uranium mill sites. A series of sediment samples with elevated uranium concentrations were collected from areas under former tailings piles at the Grand Junction Office (GJO), Colorado site [1] and used in column tests to determine uranium release rates with various influent waters. These column tests provide empirical information on uranium release and potential uranium mobility controls that are useful for site decision making. This includes decisions on additional laboratory, field, and modeling efforts, along with overall site management and remedy selection decisions.
Concentrations of major cations, anions, and trace metals were collected to fully evaluate the resulting column effluent data and complete geochemical modeling. Geochemical modeling provides quantitative evaluations of uranium mobility controls and provides reactive transport parameters that can potentially be applied at the field scale. Site-scale reactive transport modeling requires initial input parameters, such as potential mineral precipitation/dissolution controls and uranium sorption values, that can be provided by geochemical modeling of the column data. Subsequent field-scale uranium reactive transport modeling of the site provides a predictive tool for evaluating future site conditions with remedial options that might involve a change in site geochemistry.
While this use of column testing focuses on a uranium-contaminated site, the presented techniques and procedures are applicable to multiple scenarios. This includes column testing for uranium extraction to determine the feasibility of uranium in situ recovery (ISR) techniques and for determining the best fluids for innovative post-ISR restoration. Column testing and geochemical modeling have been used to determine the uranium sorption parameters downgradient of a uranium ISR site [2]. For the GJO site, the procedures from [2] are applied to a uranium contaminated site with shallow groundwater and relatively oxic to slightly suboxic conditions [1,3], compared to the reducing conditions at ISR sites, which form uranium ore bodies. Both uranium ISR and contaminated site evaluations have the goal of determining the reactive transport parameters that influence uranium’s fate and transport in the subsurface before performing field-scale testing. Similarly, column testing and geochemical modeling can be applied to other contaminants at sites where the laboratory-scale determination of contaminants’ fate and transport parameters is a first step before completing larger-scale modeling and field-scale testing.

2. Introduction

2.1. Background

The U.S. Department of Energy (DOE) Office of Legacy Management (LM) oversees long-term surveillance and maintenance (LTS & M) at multiple legacy uranium mill sites. At several LM sites, prior mill tailings and some subpile materials were removed and placed in disposal cells (i.e., Riverton, Wyoming [3]; Monticello, Utah [4]; and Grand Junction, Colorado [5]. For additional sites, see the Uranium Mill Tailings Radiation Control Act (UMTRCA) Title I sites that are listed as processing sites at https://www.energy.gov/lm/sites/lm-sites (accessed on 27 March 2022). However, residual solid-phase uranium below the former tailings areas at concentrations above background [4,5] were not fully evaluated in the context of ongoing groundwater contamination. At these sites, conceptual and numerical models of uranium mobility considered the uranium as moving at groundwater flow rates [6] or having a retardation factor based mainly on sorption/desorption to the solid phase [3,7] without any additional uranium source terms [3,6]. Subsequent work identified elevated solid-phase uranium concentrations downgradient and below former tailings areas that could have contributed to ongoing groundwater contamination [1,8,9]. Thus, the uranium remediation time frames by monitored natural attenuation or active pumping are longer than originally predicted [1,8,9,10].
The GJO site had several uranium pilot mills operated by the U.S. Army Corps of Engineers Manhattan Engineer District from 1943 to 1958 [11]. These pilot mills were used to develop uranium extraction methods to provide uranium for the first nuclear weapons produced in the United States. Uranium tailings were deposited in low areas near the pilot mills along the Gunnison River [6] (Figure 1). The groundwater at the site is strongly controlled by the Gunnison River stage in the point bar setting shown in Figure 1, with a depth to bedrock of up to 9.8 m [12]. The uranium mill tailings were present for several decades before the majority of the material was removed between 1989 and 1994 and transferred to an engineered disposal cell [11], with the excavation of contaminated material to depths that met radiological standards—radium levels below 5 picocuries per gram (pCi/g) (plus background) in the top 15 centimeters (cm) of sediment and below 15 pCi/g (plus background) in deeper sediment. Even though radiological standards were met across the site, some areas had near-surface, solid-phase uranium concentrations that were above background [5]. Using [5] as a guide, additional solid-phase sediments were collected at multiple coring locations reaching bedrock underneath a former tailings area (Figure 1). The analyses of these sediments identified additional zones with elevated uranium concentrations [1]. The authors of [13] provide mineralogic data on the uranium associations in the solid phase for some of these coring locations. The GJO site does not have a distinct groundwater uranium plume due to the changing groundwater flow directions controlled by the Gunnison River stage and the spotty nature of uranium tailings distributed in low spots across the site [12]. Recent uranium concentrations (1996 to 2021) in the area of interest (well 8-4S in Figure 1) have ranged from 0.097 to 0.73 milligrams per liter (mg/L). A more detailed site history, relevant site documents, and LTS&M data reports can be found at https://www.energy.gov/lm/grand-junction-colorado-site (accessed on 27 March 2022).
A prior uranium transport model of the GJO site predicted uranium concentrations naturally attenuating to below site groundwater standards (0.044 mg/L) in 50 to 80 years [6]. This model did not account for retardation processes (e.g., sorption) and did not consider any ongoing source zones [6]. Thus, this previous work likely underestimated the monitored natural attenuation time frame and is reevaluated in the conclusions of this article. Preliminary column-testing procedures, data interpretations, and geochemical modeling for the GJO site were completed for one column in [1]. These same procedures, along with the subsequent application of reactive transport modeling and estimation of flushing times, were applied at the LM site in Monticello, Utah [9].

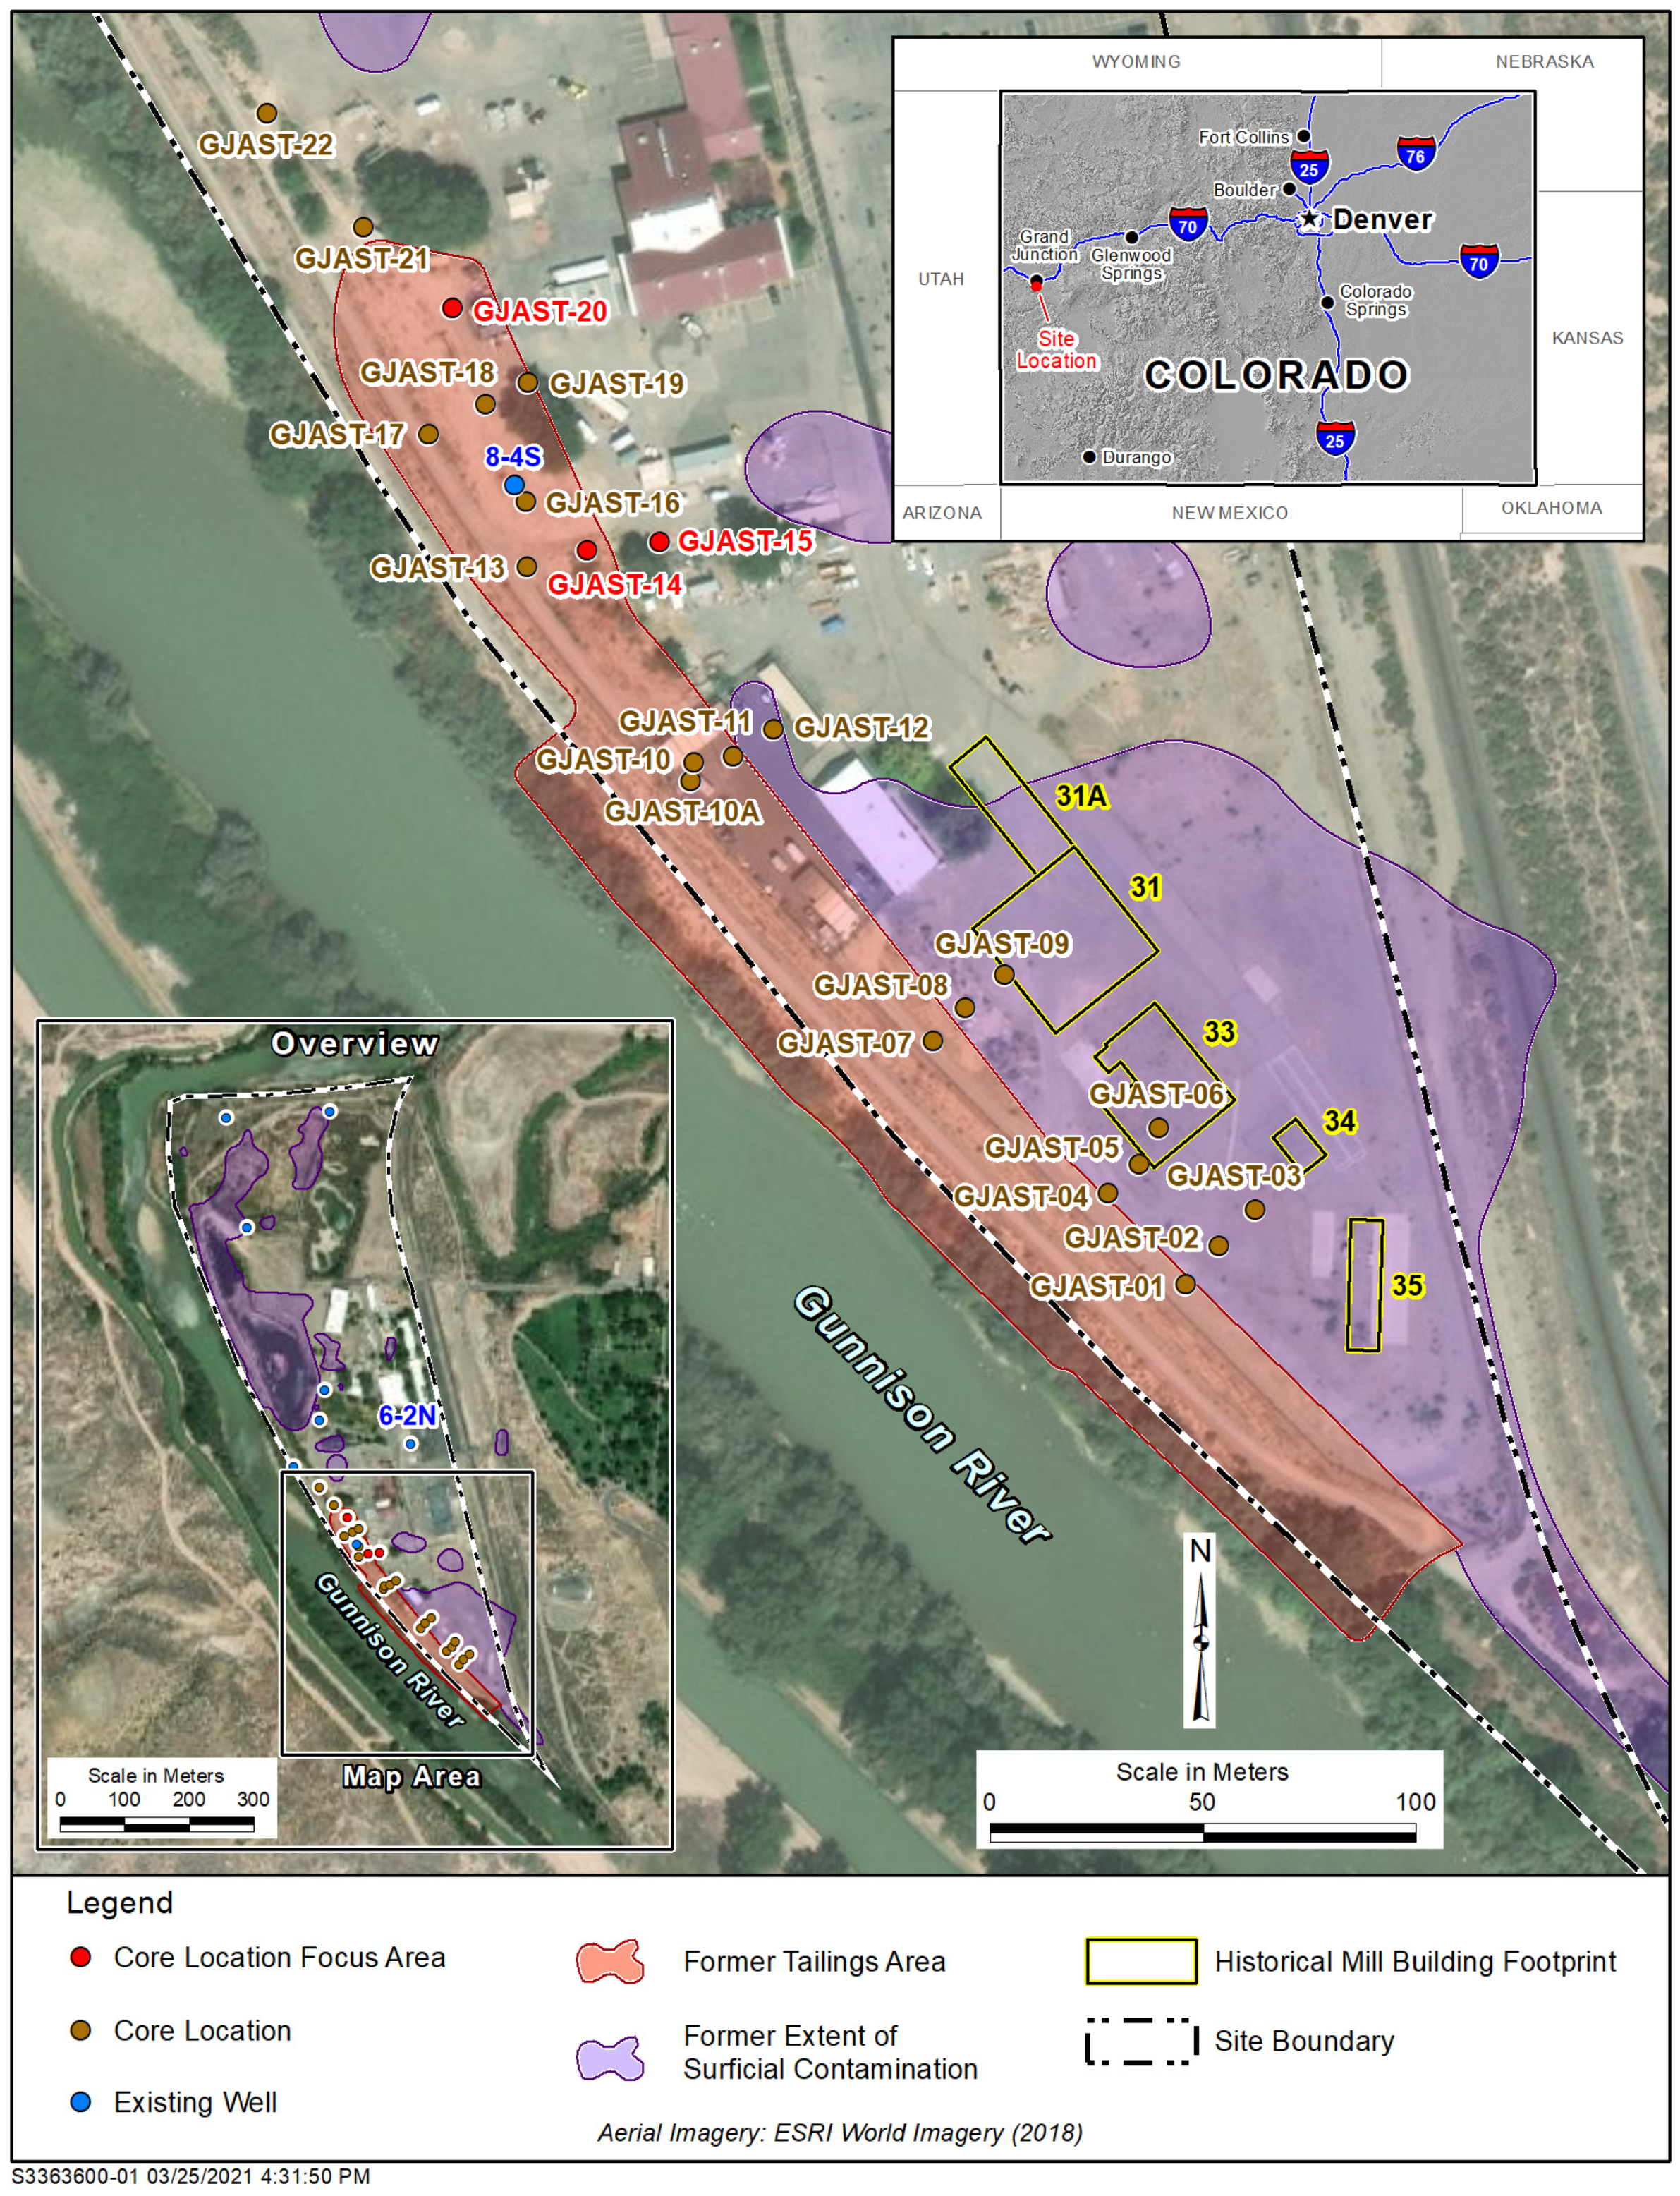
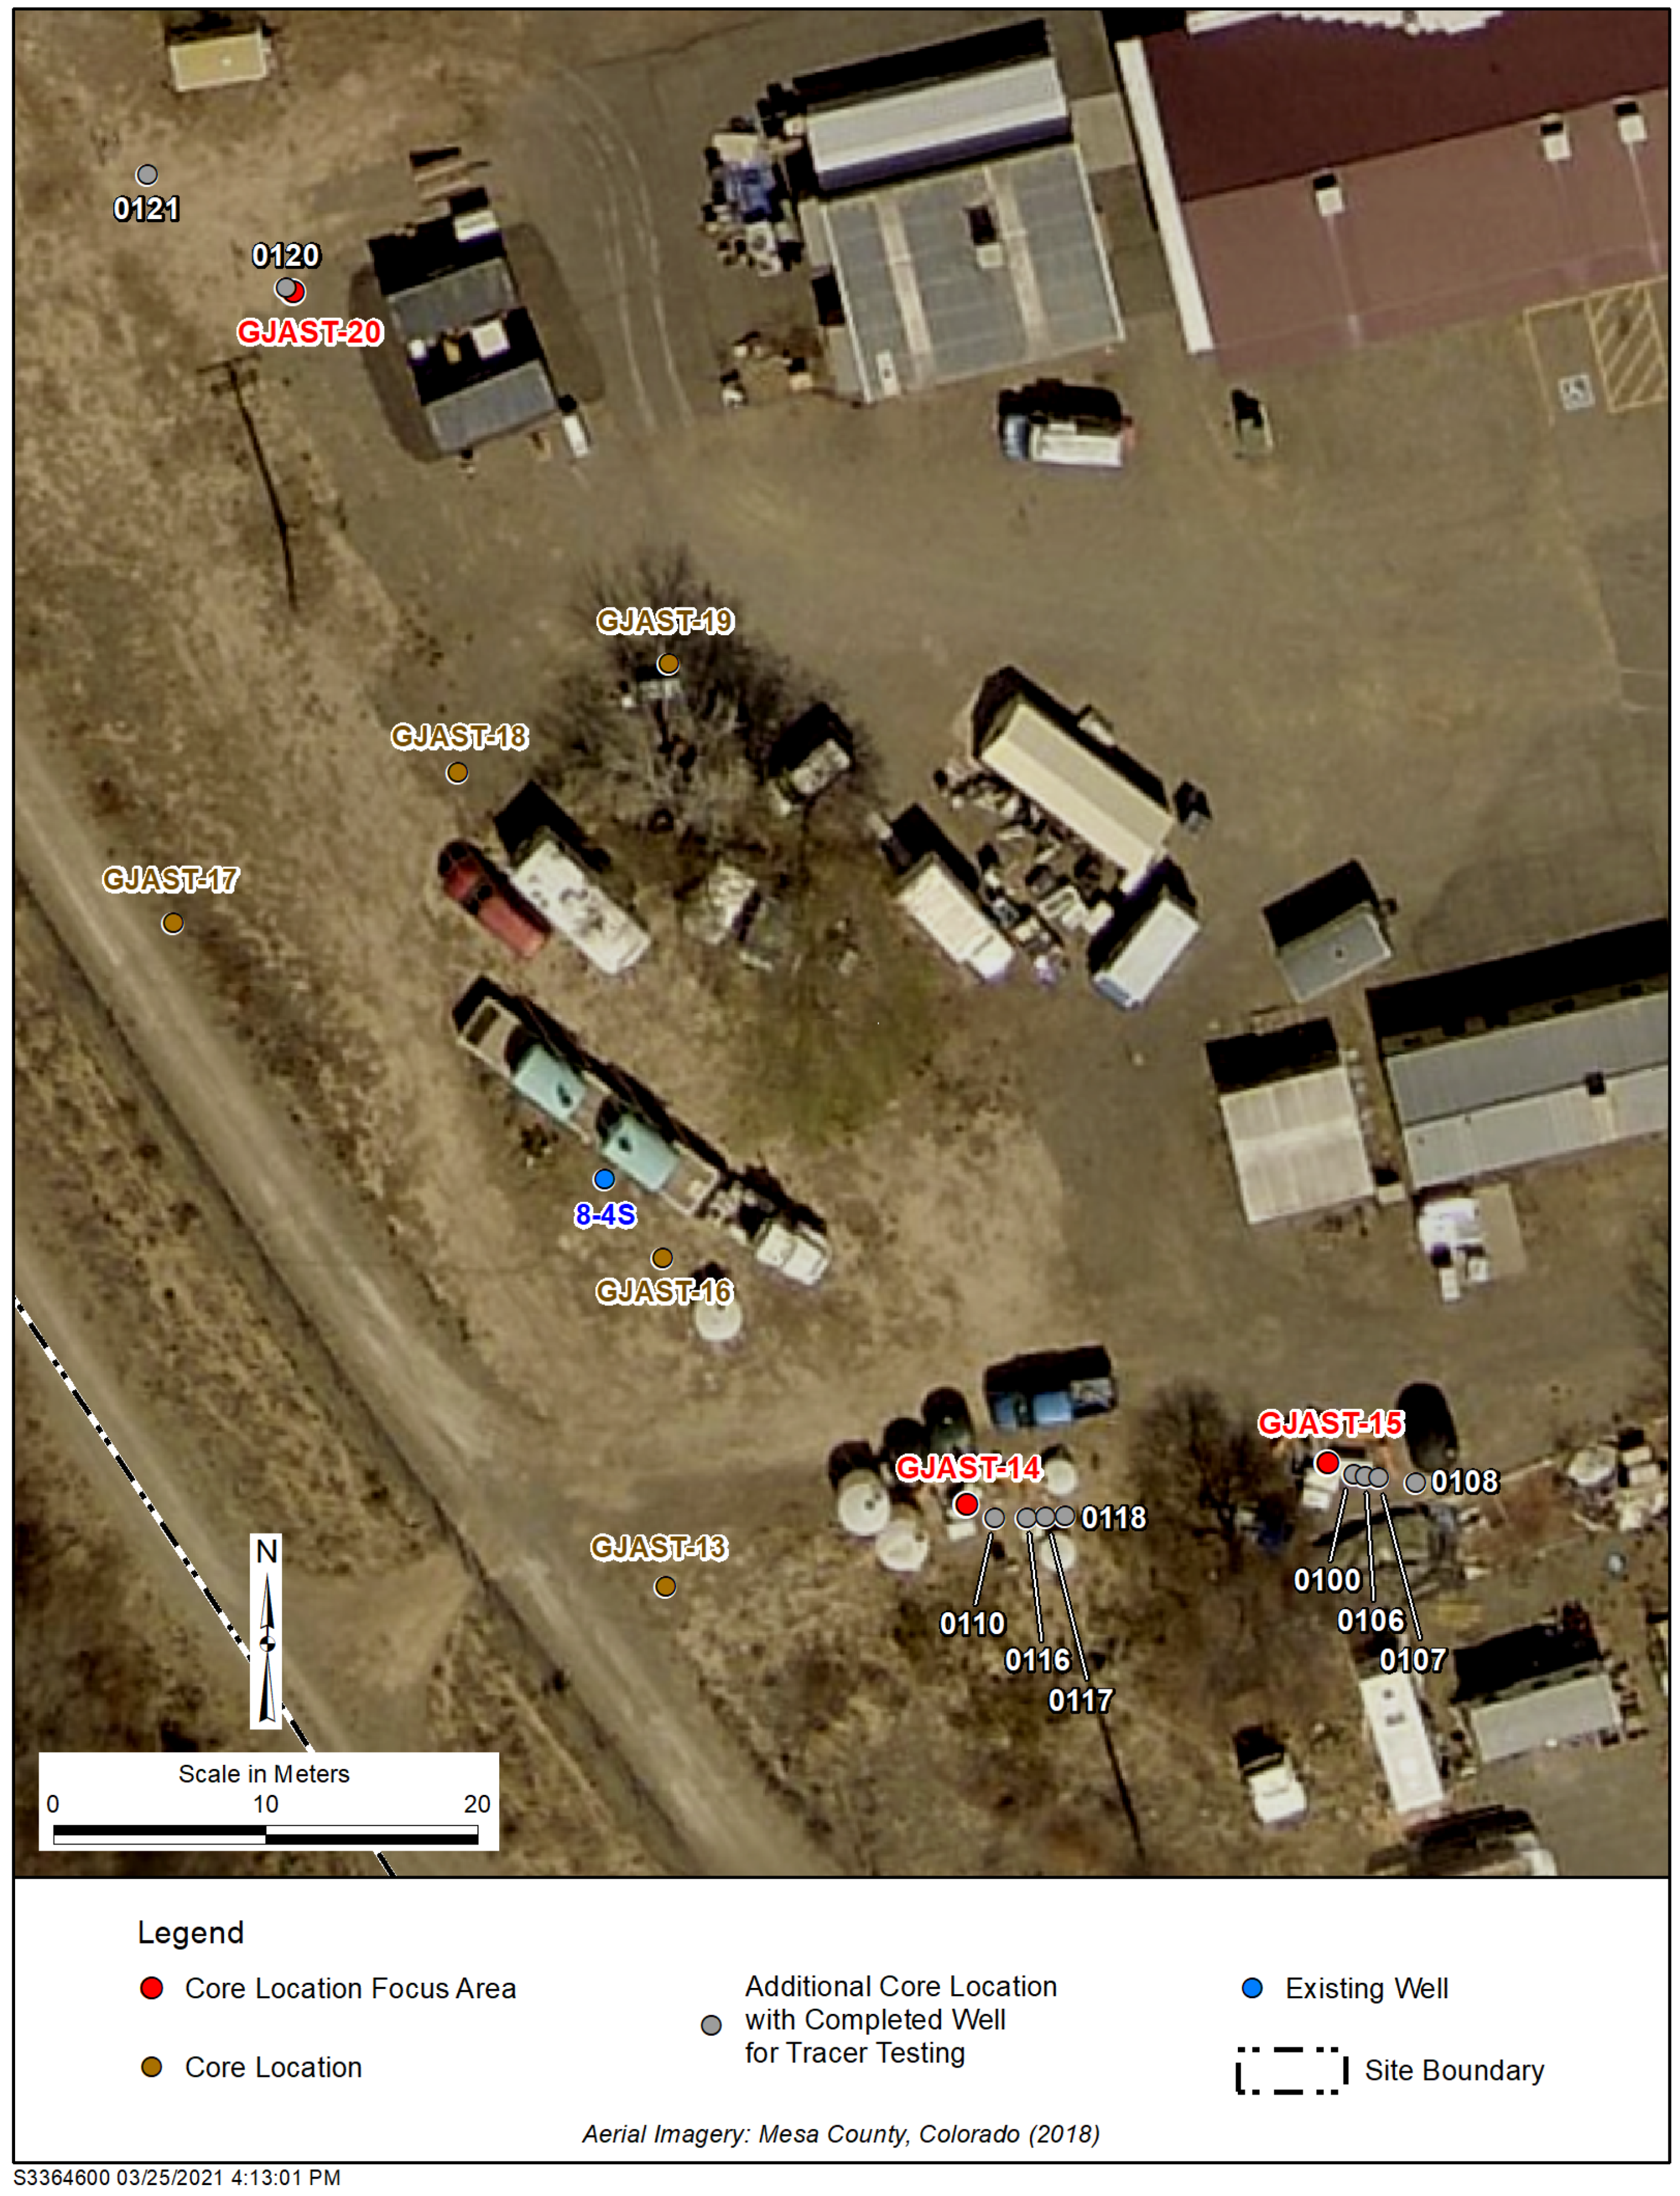
2.2. Column Testing Focus Locations

The column testing focused on the locations with the highest overall uranium concentrations [1], which were GJAST-14, -15 and -20 (locations in Figure 1; uranium concentrations with depth in Figure 2). A representative background value for solid-phase uranium concentrations is 0.62 milligrams per kilogram (mg/kg) [1,13] using the same 5% nitric acid leach solution as represented by the data in Figure 2. This concentration is similar to the samples in GJAST-14 at elevations below 1388.5 m and in GJAST-15 at elevations below 1387.5 m (Figure 2). A microwave-assisted full acid digestion of additional background samples indicated a concentration of 0.83 to 1.2 mg/kg [14]. Solid-phase characterization [1], mineralogic information [13], and groundwater tracer testing [15] at these locations consistently provide the following conceptualization:
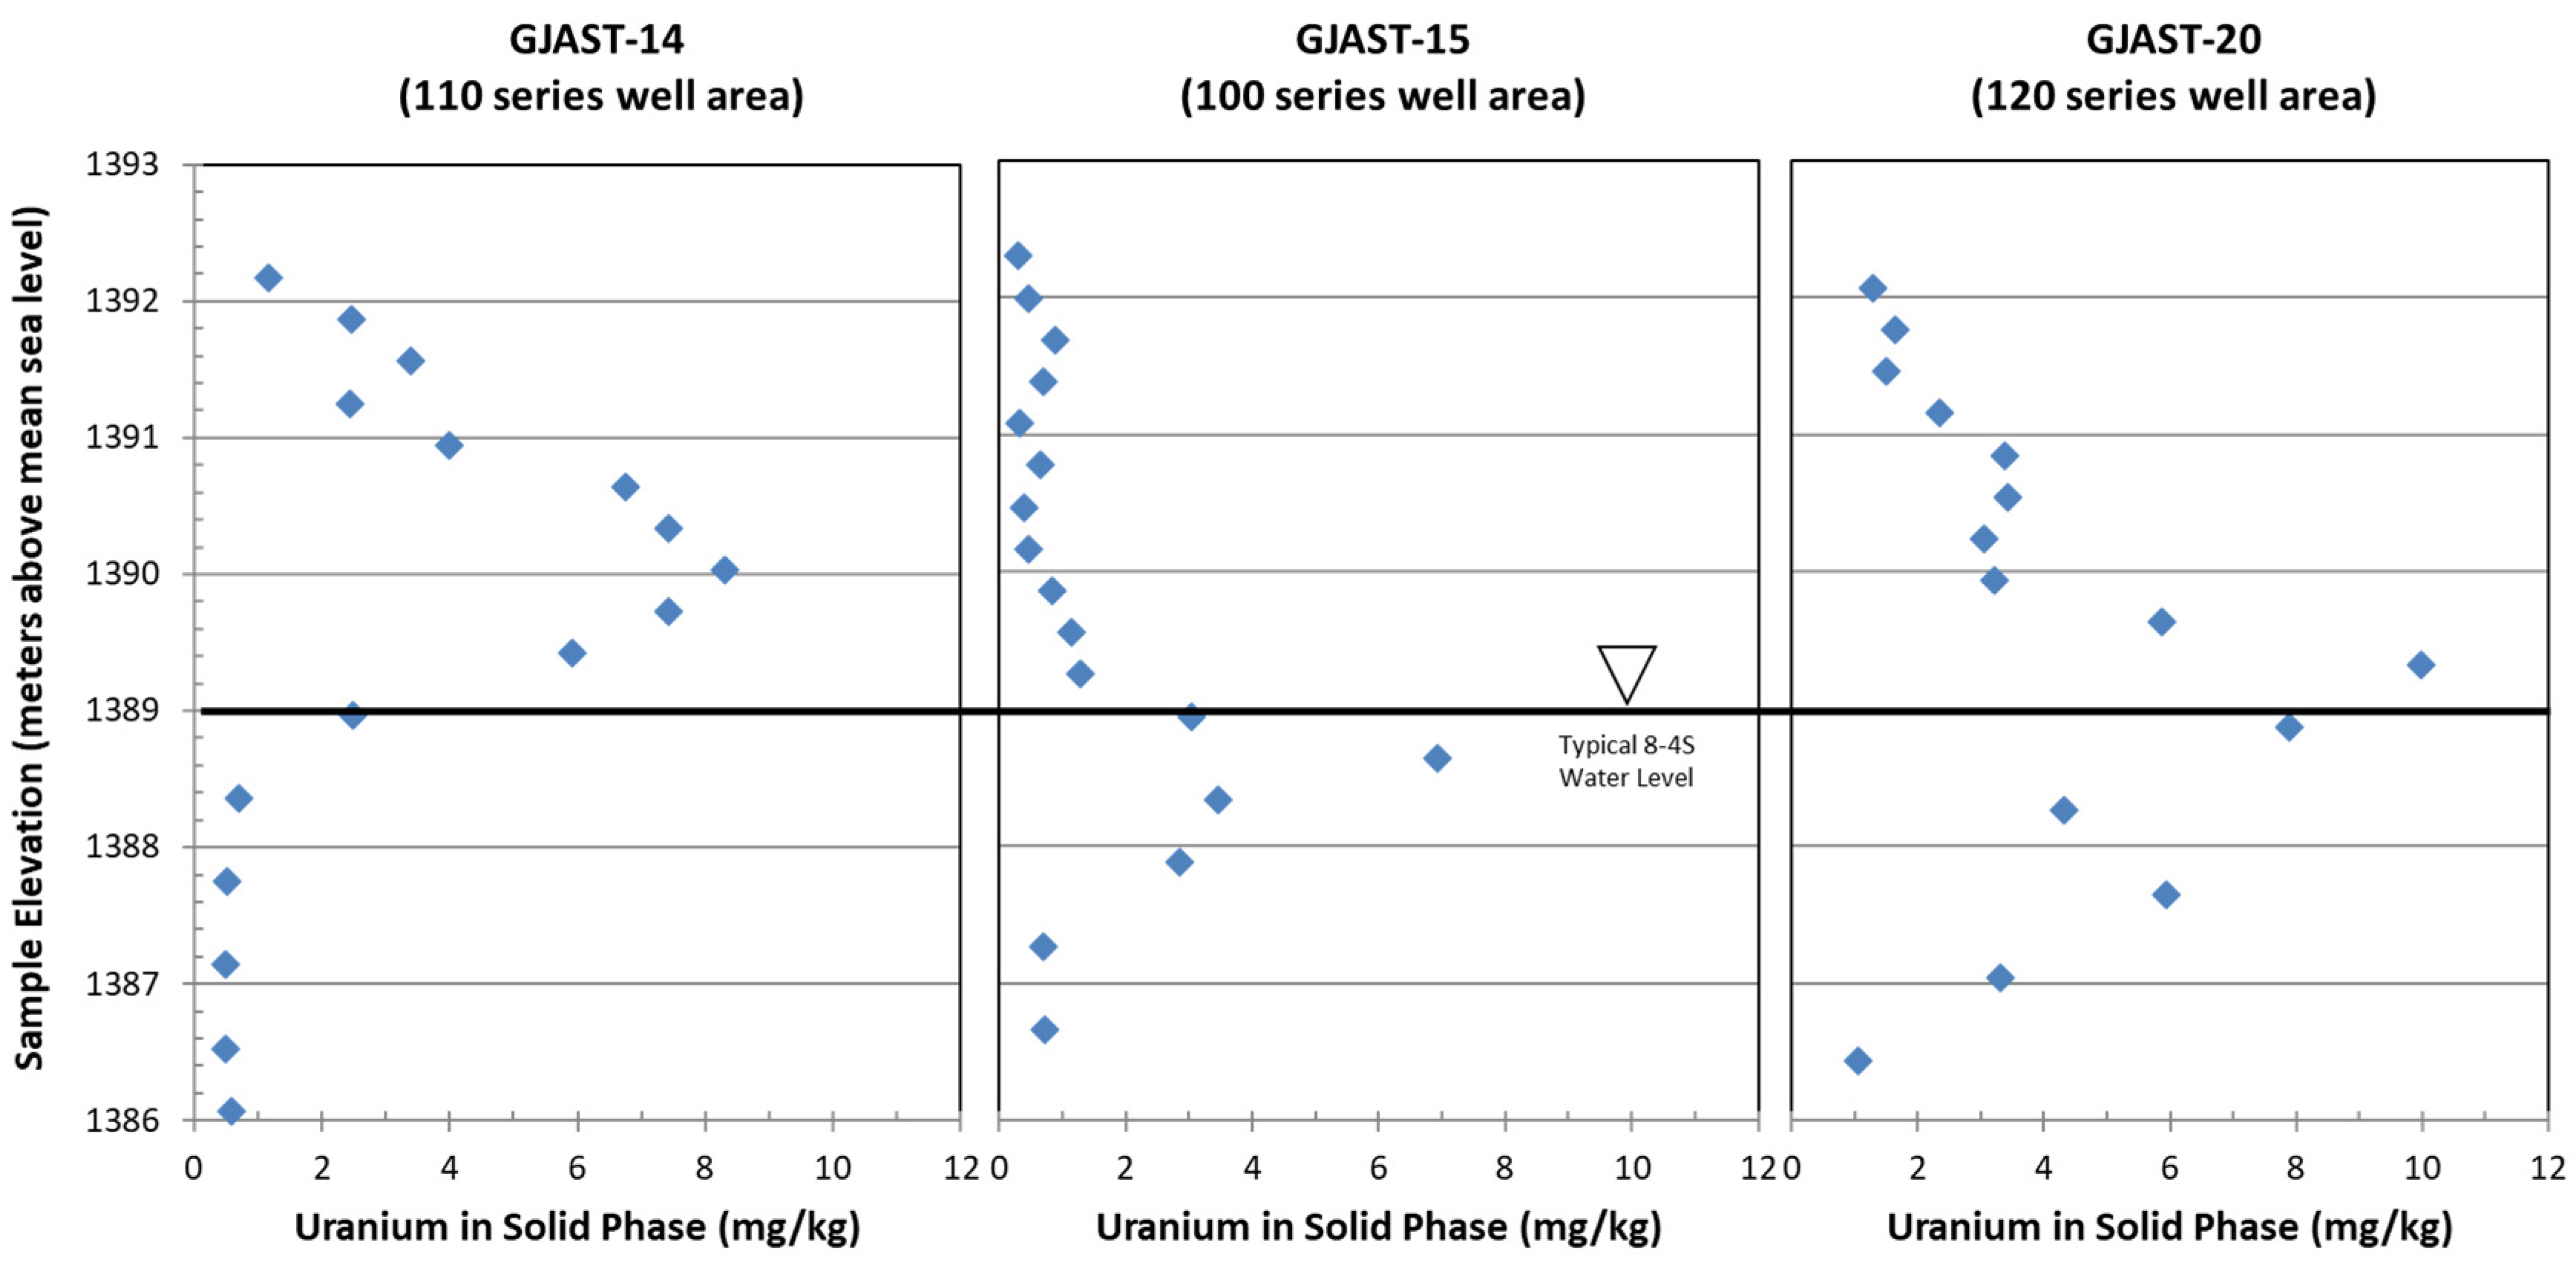
  • Solid-phase uranium at GJAST-14 is associated with VZ sediments, possibly with uranium deposited by evapotranspiration of the underlying groundwater. Solid-phase uranium in the saturated zone is characterized by lower uranium concentrations (Figure 2);
  • Solid-phase uranium at GJAST-15 is associated with higher organic content in the sediments just below the water table. Solid-phase uranium in the VZ is characterized by lower uranium concentrations (Figure 2);
  • Solid-phase uranium at GJAST-20 is associated with the presence of gypsum, which is likely precipitated when low-pH waters derived from tailings pore fluids and/or hydrofluoric acid waste disposal are buffered by naturally occurring calcite [1,13]. The solid-phase uranium in the VZ and the saturated zone is characterized by elevated uranium concentrations compared to the background values (Figure 2).

3. Materials and Methods

3.1. Column Testing: General Details

Column testing was completed on solid-phase material that was a composite of material from various boreholes and depths. Compositing was performed to obtain enough of each material type to use in multiple columns (Table 1). The boreholes and depths were selected to represent the area around 8-4S in general and the three focus areas, along with separating unsaturated zone from saturated zone materials. The largest composite sample ((sand and gravel) S&G composite, Table 1) was saturated zone material from various depths from boreholes GJAST-13, -16, -17, -18 and -19 surrounding well 8-4S, as typical S&G near this well and between the focus area locations (Figure 1 and Figure 3). Separate composite samples were created for the VZ and S&G materials at the three focus locations, GJAST-14, -15 and -20 (Figure 1 and Figure 3), which also included material from wells installed for groundwater tracer testing (Figure 3). GJAST-14 corresponds to the 110-series wells, GJAST-15 corresponds to the 100-series wells, and GJAST-20 corresponds to the 120-series wells (Figure 3). File S1 provides the compositing details with locations and depth intervals. The focus locations are referred to by the well series in subsequent tables and figures.
Column testing used slightly different techniques for the VZ versus the saturated zone (S&G sediments). The VZ columns (13 through 18, Table 1) used a stop-flow technique (24 h of no flow between filling) to represent surface infiltration that did not typically involve continuous flow, and the saturated zone columns (7 through 12 and 20, Table 1) used a continuous-flow technique to represent continuing groundwater flow or river water influx. Table 1 summarizes the various influent waters used in the column testing. For the VZ columns, the initial influent water was either DI water to represent precipitation or Gunnison River water to represent river water influx or flooding during high river stages. The initial influent water was followed by underlying groundwater (Table 1) to represent high water tables.
Saturated zone columns used contaminated groundwater as an initial influent water to equilibrate the solid phase with the influent groundwater, followed by Gunnison River water as an influent to represent river influx or flooding. This was followed by the same contaminated groundwater and then background groundwater. This influent series was used to test the influence of seasonal river stage variations on uranium mobility, followed by background groundwater influx. Groundwater from well 6-2N (Figure 1) was used as it is the most representative background well currently available at the GJO site, with groundwater flow in this area generally heading west toward the Gunnison River. Columns 1 through 6 and 19 (Table 1) used the stop-flow technique to compare results with the continuous-flow technique for the saturated zone columns (columns 7 through 12 and 20). Except for column 19, the results indicate minimal differences in effluent concentrations between the stop-flow and continuous-flow techniques (File S2) and confirm the adequacy of either technique for evaluating uranium release rates. In addition, these results indicate that the flow rates in the continuous-flow columns were slow enough to provide equilibrium conditions within the columns. Except for column 19 (which had different results for stop-flow and continuous-flow effluent), stop-flow columns 1 through 6 are not discussed in additional detail.

3.2. Sediment Collection and Processing

Core material was collected with a direct-push drilling rig strictly for coring purposes (GJAST locations, Figure 1) or for coring with subsequent well installation (100-, 110- and 120-series wells, Figure 3). Core material was air-dried in open aluminum pans in an isolated, limited-airflow room until all samples from the relevant core had no observable moisture in them (minimum of 7 days). Once dry, the sediments were sieved and placed in sealed plastic bags. The fractions that passed the No. 10 sieve (<2 millimeters (mm)) were collected separately from the remaining sediments in order to remove pebble- and gravel-sized particles. The fractions < 2 mm from different core locations and depths were composited (File S1) for subsequent use in column testing. A depth below ground surface of 3 m was used as the split between VZ and saturated zone materials. Overall, both the vadose and saturated zone materials can be considered S&Gs, but the VZ has more distinct silt layers based on visual description of the boring logs [1]. We recognize that air drying could oxidize redox sensitive uranium minerals (e.g., uraninite) and was a limitation of drying the cores in oxic conditions. However, no reduced uranium minerals have been identified at this site [13] and a major goal is testing uranium mobility under oxic conditions with river water incursion. Prior work indicates uranium mobility is mainly controlled by sorption processes and, possibly, an association with gypsum, both without redox influences [3,13,15].
Five-percent nitric acid extractions were completed on all column materials before and after the column tests (File S1), following the procedure described in [16]. This procedure used 2 g of sieved and dried solid phase rotated end-over-end with 100 milliliters (mL) of unheated 5% nitric acid extraction fluid and a contact time of 4 h, followed by a second round of 100 mL of extraction fluid for 0.5 h. Extraction fluids were analyzed for uranium, iron, manganese, and calcium using the analytical procedures for column effluent water (described in the sample collection and analyses section below). The intention behind the 5% nitric acid extraction was to remove all easily soluble uranium from the solid phase (sorbed or soluble mineral) without removing uranium inherent in mineral grains. The same procedure was completed as a separate DI extraction on split samples of all column materials before the column tests and selection of post-column material. DI extraction results are included in File S1 for reference, but only discussed in relation to postcolumn leaching of calcium for columns 19 and 20.

3.3. Column-Testing Configurations

Columns were custom built from plastic and plexiglass with a 5-centimeter inside diameter. They were dry packed in lifts of approximately 5 cm, with tamping of the material between lifts. Three different column lengths were used: 15 cm, 20 cm and 45 cm. The bottom of each column had a mesh filter disk that held the sediment in the column but allowed water to enter the column. When using the 15-centimeter and 20-centimeter columns, the columns were filled completely with sediment (they also had a top filter mesh disk) and capped on both ends, with the top cap plumbed to a fraction collector (Gilson Model 206). When using the 45-centimeter columns, there was an insufficient amount of sediment to fill them completely, so they were filled with approximately 20 cm of sediment. A piece of mesh was placed on top of the sediment with approximately 5 cm of acid-washed, 5-millimeter glass beads on top of the mesh to help hold the sediment in place. A sample collection tube was then inserted into the glass beads on the top surface of the sediment and water samples were removed from the column via a syringe. The detailed column configurations are provided in File S1.

3.4. Column-Filling Procedures

Flow was delivered via laboratory peristaltic pumps into the bottoms of the columns. Stop-flow columns were filled with one pore volume (PV) of influent water at a rate of approximately 3 milliliters per minute (mL/min). Exact filling rates with column pore volumes and porosities are provided in File S1. Stop-flow column porosities ranged from 0.32 to 0.39. Once a PV was introduced, the flow to the column was stopped and the water was allowed to equilibrate with the sediment for 24 h. The next day, another PV of water was introduced into the column, pushing the prior PV out of the sediment. This effluent PV was collected, filtered, and analyzed.
Influent water was introduced into the continuous-flow columns at a continuous 0.7 mL/min flow rate, which was the slowest constant flow rate that could be achieved with the influent pumps. This flow rate is equivalent to column-flow velocities of 130 to 170 cm/day, with porosities ranging from 0.29 to 0.36 (File S1). For comparison, the groundwater flow velocity at the site is approximately 6.1 to 9.1 cm/day (based on local gradients, hydraulic conductivity of 12 m per day [6], and an assumed effective porosity of 0.3). The first PV was allowed to equilibrate with the sediment for 24 h before the continuous flow was started. The effluent from the continuous-flow columns was collected in a fraction collector. Fraction collector vials could hold a maximum of 30 mL. The fraction collector timing was adjusted such that four vials, when filled to less than full, were equal to one PV (110 mL on average). Thus, these four vials were consolidated, filtered, and analyzed as one sample representing one PV.
The 20 different column tests used 7 different influent waters, which included 5 different groundwaters (wells 106, 110, 120, 121 and 6-2N), Gunnison River water, and DI water. All the influent waters, the order of their use, and the associated solid phase for each column are listed in Table 1. Groundwater and Gunnison River water geochemistry was analyzed in the same manner as the column effluent (discussed below), with analyses immediately upon collection and subsequent analyses after degassing (File S1). Oxygen concentrations in the influent groundwater were not controlled. Geochemical differences were minimal after degassing and exposure to oxygen, except for a pH increase due to a loss of carbon dioxide. Thus, the pH in the influent containers (sealed collapsible container to minimize degassing) were periodically checked and carbon dioxide gas was bubbled in as necessary to maintain the pH within +/− 0.2 units of the pH when the water was collected.

3.5. Column Effluent Sample Collection and Analyses

All column effluent samples were collected in one aliquot and filtered through a 0.45-micron filter. Samples from the stop-flow columns were collected immediately during pumping. Samples from the continuous-flow columns with fraction collectors were collected twice a day (multiple PVs): once in the morning after overnight pumping, and once in the evening after pumping during the day. The filtered sample was then split into two aliquots. One aliquot was immediately analyzed in the laboratory for pH, temperature, specific conductance, and alkalinity via titration. The remaining portion of this aliquot was kept at 4 °C for subsequent analyses for anions by ion chromatography (ThermoFisher Aquion) and dissolved organic carbon (DOC) (Shimadzu Total Organic Carbon-L). The other aliquot was acidified to pH < 2 with nitric acid and subsequently analyzed for cations and metals via inductively coupled plasma–optical emission spectroscopy (Perkin Elmer DV7000) and for uranium via kinetic phosphorescence (Chemchek KPA-11). The full analyte list includes pH, temperature, specific conductance, alkalinity, DOC, chloride, nitrate, sulfate, calcium, magnesium, sodium, potassium, iron, manganese, selenium, uranium, and vanadium. The concentration of total dissolved solids was not measured independently, as the analyte list included all major and minor constituents in solution. Analytical procedures followed the LM Grand Junction Environmental Sciences Laboratory Procedures Manual [16]. Analytical uncertainty based on duplicate analyses of constituent calibration standards was generally less than 5% of the reported values. Samples were rerun if duplicate-standard analyses or ionic charge balances were greater than 10%.

3.6. Geochemical Modeling Approach

To assist in interpreting the column test results, the geochemical modeling code PHREEQC [17] was used for initial geochemical evaluations of the column effluent for potential mineral dissolution or precipitation (such as calcite and gypsum), along with calculating carbon dioxide concentrations. PHREEQC input files (File S3) used column effluent concentrations to calculate the associated mineral or gas saturation indices (SI) using the minteq.v4.dat thermodynamic database (provided with the PHREEQC installation and used with no editing). Geochemical modeling assumed equilibrium conditions regardless of inflow rates, given the minimal difference between stop-flow and continuous-flow column results.
PHREEQC was used in a batch mode for the stop-flow columns and in a 1D transport mode for the continuous flow columns to simulate the geochemical reactions occurring in the columns. This evaluation used the cation exchange module and equilibrium phases module for mineral dissolution/precipitation built into PHREEQC [17]. Uranium sorption/desorption was evaluated using the generalized surface complexation modeling (GSCM) approach described in [18] with two sorption surfaces for simplicity [19]. The GSCM approach was used since sorption to individual components, such as iron oxides or clays, was not known or measured. The reaction equations (see PHREEQC input files in the supplemental data, Files S6 and S8) for the two sorption surfaces define the sorption of the uranyl cation (UO2+2) to the generalized surface. The GSCM approach allows independent variation of the sorption equilibrium constants and the site densities. To avoid parameter correlation issues [19], only the two site densities were varied, and the sorption equilibrium constants (log Ks) were not varied. The authors of [18] defined three sorption-site density parameters (weak, strong, and super-strong), which were reduced to strong and super strong (GC_s and GC_ss, respectively in PHREEQC) for this work. Log Ks were fixed at 6.798 and 5.817 for the super-strong and strong sites, respectively, based on values used in [18,19].
During model calibration, the SIs for mineral dissolution/precipitation of calcite and gypsum and carbon dioxide concentrations were fixed based on the initial PHREEQC column effluent evaluations (File S3), as this is “known” information that controls calcium, alkalinity, and pH. These fixed values were selected graphically (Files S6 and S8) by approximately matching the calculated SIs from the PHREEQC output of the column effluents. The SI values were generally fixed to one value during one type of column influent, but then changed to a new fixed value with each influent change (Files S6 and S8). Some leeway in these SIs was allowed for analytical error, in order to graphically fit the measured column effluent data for pH, calcium, sulfate, and alkalinity. In some cases, just after influent switches, when column geochemistry was not yet equilibrated, SIs were entered directly for each pore volume. The cation exchange parameter (X moles of exchange sites in PHREEQC) was varied to provide a graphical fit between modeled and measured values of calcium, sodium, magnesium, potassium, and manganese. Uranium sorption-site densities (strong and super-strong) were varied to obtain the best graphical fit between modeled and measured column effluent uranium concentrations. The PHREEQC database used for the column modeling (File S4) included the most recently updated uranium thermodynamics [20] and uranium complexation species [21]. The same column modeling approach with PHREEQC is discussed in [9] for LM’s Monticello, Utah site. A summary of surface complexation modeling approaches for uranium is provided in [22].
The model calibration to measured data was performed graphically by visually comparing the modeled and measured column effluent data for all analytes. With each change in model input parameters (uranium sorption, cation exchange, and mineral/gas SIs), graphical changes were compared by the authors to obtain the best calibration. Future efforts should include automated calibration programs, such as PEST [23], to quantify overall model fit to observed data and evaluate parameter sensitivities.

4. Results and Discussion

4.1. Vadose Zone (All Stop Flow)

4.1.1. Laboratory Results

The column-testing results from the composited solid-phase materials in the 100-series, 110-series and 120-series VZ samples (<3 m in depth) are provided in File S1. The initial column influent was either DI water or Gunnison River water, followed by groundwater from a well in each series area (wells 106, 110 and 120, respectively, Table 1 and Figure 3). The groundwater influent was then followed by another round of DI or river-water flushing. These tests were intended to simulate precipitation (DI influent) or flooding events (river influent) followed by high water tables (groundwater influents), to provide data on associated uranium release rates and concentrations. For testing purposes, these VZ column tests were completed under saturated conditions to allow more straightforward interpretations and geochemical modeling. Therefore, these laboratory conditions represent more extreme events that could release uranium to the underlying saturated zone.
The six VZ columns (13 through 18) are listed in Table 1 and the data on the uranium in the effluent are provided in Figure 4. Graphs of all the measured analytes for each column are provided in the File S5. Two of the six columns achieved uranium concentrations of 35 micrograms per liter (µg/L) or less within 14 PVs (Figure 4). For the other columns (14, 15, 16 and 18), column testing was stopped when the uranium concentration was less than 35 µg/L or 25 PVs were reached (Figure 4). The actual effluent uranium concentrations achieved before switching to a groundwater influent (Figure 4) highlight the continued release of uranium from the 110- and 120-series VZ columns with river water as the influent (columns 16 and 18, respectively). The 110- and 120-series VZ solids had more uranium than the 100-series VZ solids (Table 2), which, overall, corresponds to greater uranium concentrations in the column effluent regardless of the column influent (Figure 4). The river-water influent removed more uranium from the solid phase than the DI influent for all the columns (Table 2) and maintained higher uranium concentrations in the column effluents for more PVs (Figure 4). Overall, the use of effluent concentrations to calculate the remaining solid-phase uranium concentrations provided a reasonable match to the concentrations measured from the 5% nitric acid leaching of the postcolumn material (Table 2). It is likely that there were some additional analytical errors when using successive effluent measurements.
With the addition of contaminated groundwater as an influent, columns 13, 14, 16 and 18 showed a removal of uranium from the influent groundwater onto the solid phase (Figure 4). The exceptions were columns 15 and 17 (110 and 120 VZ solids, respectively), both with DI influent before the switch to groundwater. These columns showed a release of uranium from the solid phase to the column effluent with the switch to a groundwater influent. The release of uranium from column 15 (110 VZ solids) was almost three times greater in concentration than the influent groundwater. The final influent water switch back to DI or river water removed the uranium from the solid phase for all the columns, but the river-water influent maintained a higher column effluent uranium concentration than the DI influent (Figure 4).
Before switching to the contaminated groundwater influent, the number of PVs for the DI and river influents varied between the different VZ columns (Figure 4); thus, calcium, alkalinity, and uranium are graphed for just PVs 1 through 14 (Figure 5), and then separately for the groundwater influent and the switch back to a DI or river-water influent (Figure 6). In Figure 6, the PV just before the change to the groundwater influent is set to PV 0 for graphing purposes, in order to overlay multiple data sets. Calcium and alkalinity were selected for graphing as they highlight the potential for the formation of calcium uranium carbonate complexes that can keep uranium in solution [21]. In addition, calcium highlights gypsum dissolution. As a conservative mobility element, chloride indicated little to no dispersion within the columns, as the chloride reached equilibrium with the influent water within 1 to 2 PVs (File S5).
In general, greater concentrations of calcium and alkalinity keep more uranium in solution, although the exact amount depends on the pH and other constituents in solution, such as magnesium [21]. The column effluent data indicate that calcite was greater than or equal to its equilibrium solubility (calcite SI > 0 in Files S1 and S5) and that higher calcium concentrations (>400 mg/L) were due to the dissolution of gypsum (gypsum SI near 0 in Files S1 and S5). Gypsum dissolution, as evidenced by high calcium concentrations, was not seen in the 100-series VZ columns but was seen for about six PVs in the 110-series VZ columns and for all the PVs in the 120-series VZ columns (calcium > 400 mg/L in Figure 5).
Compared to the 100-series columns, the alkalinity in the 110- and 120-series columns was suppressed due to the calcium common ion effect reducing the solubility of the calcite (an alkalinity source) when gypsum (a source of additional calcium) was present. The alkalinity for the 110-series columns was not suppressed at eight PVs and was greater compared to the 100-series column PVs (Figure 5) when gypsum was removed from the solid phase, as evidenced by the lower calcium concentrations (Figure 5). For the 120-series columns, the alkalinity continued to be suppressed compared to the 100-series columns, with continuous gypsum dissolution, as evidenced by the continuously high calcium concentrations (Figure 5). The X-ray diffraction analyses confirmed the increasing gypsum content from the 100-series, 110-series and 120-series VZ composite materials with gypsum weight percent values of 0.84, 2.9 and 19, respectively. Similarly, the calcite weight percent values were 4.1, 3.8 and 13, respectively.
Overall, the alkalinity in the columns with the river influent was greater than the alkalinity in the columns with the DI influent, which likely explains the greater uranium concentrations in the effluent (Figure 4). In addition, the suppression of alkalinity by the gypsum dissolution appears to have suppressed the uranium release based on the lower uranium concentration trends in: (1) PVs 2 through 5 in the 110-series solids with DI influent (column 15); (2) PV 2 in the 110-series solids with river influent (column 16); (3) PVs 1 through 5 in the 120-series solids with river influent (column 18), and (4) all of the PVs in the 120-series solids with DI influent (column 17). The higher uranium release in PVs 3 through 6 in the 110-series solids with river influent (column 16), along with the continued dissolution of gypsum and suppression of alkalinity, suggests an additional uranium source, possibly the dissolving gypsum.
For the later portions of the column tests, with the groundwater influent followed by DI or river-water flushing, higher calcium concentrations persisted in the 120-series column effluent (Figure 6). This occurred due to the continued gypsum dissolution from the 120-series solid phase (gypsum SI near 0 in Files S1 and S5). Otherwise, calcium and alkalinity concentrations appear to have been controlled mainly by the column influent waters (Figure 6), albeit with a significant delay in the alkalinity equilibration after an influent water change (Figure 6). Some of this delay may reflect the presence of regions with stagnant water and, thus, added dispersion within the columns. However, the chloride concentrations (as a non-reactive element) indicate that this influence lasted for only 1 to 2 PVs (File S6).
For the uranium effluent concentrations, columns 14, 16 and 18 with the initial river water influent appeared to be influenced mainly by the influent groundwater uranium concentrations. This resulted in some uranium removal from the influent groundwater to the solid phase and then uranium release with final river water flushing (Figure 6). However, for the 110- and 120-series columns with an initial DI influent (columns 15 and 17), the change from DI influent to groundwater influent created the previously mentioned spike in uranium with a release from the solid to the water phase at concentrations above that of the influent groundwater (Figure 6). This is likely to have been due to the greater amount of uranium remaining on the solid phase with the DI influent (Table 2), which was then released with the increased alkalinity of the influent groundwater. As with the delay in the alkalinity equilibration with the influent water, the uranium increase also showed a delay of about three PVs.

4.1.2. Geochemical Modeling

The first step in modeling the VZ columns was setting the calcite, carbon dioxide, and gypsum SIs to the value calculated from the column effluent samples, as discussed in Section 3.6. As expected, this resulted in very good matches in pH, calcium, alkalinity, and sulfate concentrations (Figure 7 for 110-series calcium and alkalinity and File S6 for everything else). This approach is likely to have incorporated any kinetic effects directly (e.g., delays in alkalinity and uranium increases after influent switches, as previously discussed). This first step is necessary, as the overall column water geochemistry (especially pH and alkalinity) can control uranium sorption/desorption. These results confirm (1) the release of calcium and sulfate from gypsum and (2) the suppression of alkalinity with the common ion effect by calcium for lower calcite dissolution. In addition, the modeled concentrations of calcium, magnesium, potassium, and sodium were matched to the measured data by the addition of a small amount of cation exchange capacity (X value in PHREEQC of 0.1 to 0.3 moles of exchange sites, File S6).
For the uranium, the GSCM approach was first used to equilibrate the measured PV 1 effluent concentrations with the solid phase using the same strong and super-strong sorption site density values that were used for the whole column simulation. This approach generally explained the release of uranium based on the changing influent water, which was mainly due to alkalinity changes, including the lower uranium release when the alkalinity was suppressed due to gypsum dissolution (Figure 7 and File S6). However, the uranium release in the initial PVs (Figure 7 and File S6), especially those with gypsum dissolution, was difficult to match, with the modeled uranium concentrations generally being too low. The gypsum and other evaporite-type minerals may have contained uranium that was released by dissolution in the initial PVs in a complex interplay with the alkalinity concentrations. This initial “excess” uranium beyond straight sorption/desorption control was not accounted for when using the GSCM to equilibrate the solid-phase uranium with PV 1. The solid-phase analyses from [13] confirm the presence of uranium, calcium, and sulfate in grain coatings, especially from well 120 sediments. These coatings are mainly composed of aluminum and silica that likely precipitate along with other constituents during pH buffering below tailings or other low-pH waste sources such as, in this case, a hydrofluoric acid waste sump [13]. The addition of uranium from these grain coatings in the column modeling is beyond the scope of this paper and is a topic of ongoing research. Therefore, the uranium sorption parameters provided with the PHREEQC files in File S6 are considered preliminary.

4.2. Saturated Zone (All Continuous Flows)

4.2.1. Laboratory Results

The column-testing results for the saturated-zone columns (material that was greater than 3 m in depth below ground surface for the S&G composite, along with the composited S&G from the 100-series, 110-series and 120-series locations) are provided in File S1. Compared to the background concentrations of uranium from the solid phase (0.62 mg/kg from 5% nitric acid leach for GJAST-03), the uranium concentrations in the S&G composite material were slightly elevated, the 110-series S&G was at background, the 100-series S&G was slightly elevated, and the 120-series S&G was the most elevated in uranium (Table 3).
Columns 7 through 10 were completed on the S&G composite material with the initial column influent from wells 106, 110, 120, or 121 (Table 3), followed by Gunnison River water, returning to the well water influent before being followed, finally, by groundwater from well 6-2N (Table 1 and Figure 8). This series of columns was designed for (1) the initial equilibration with the influent groundwater; (2) the uranium release with river water; (3) recontamination with groundwater, and (4) the final uranium release with background groundwater. This same design was applied to columns 12, 11 and 20, but with 110-series, 100-series and 120-series saturated-zone solid-phase materials, respectively, in order of increasing solid-phase uranium concentration (Table 3). The influent groundwater from wells 106 and 110 had lower uranium concentrations than wells 120 and 121 (Table 3) and well 6-2N was the most representative background well onsite, although 6-2N still had slightly elevated uranium concentrations (Table 3) that are likely to have been mill-related.
The switching of influent waters occurred at 7, 22 and 30 PVs for most of the columns (File S1). However, column 10 was accidentally switched at PV 19 and column 20 had longer intervals between influent changes, with switching at 14, 32 and 42 PVs due to the higher effluent uranium concentrations (Figure 8 and File S1). In order to compare all the saturated-zone columns at once, column 10 is plotted without data for PVs 20 and 21, and the additional PVs between the switching intervals are not plotted in column 20 (Figure 8). For both columns, the effluent concentrations for all the analytes were already relatively stable at the lesser PVs (File S1). The influent waters did vary somewhat in water quality between the column tests (File S1, Table 3 and Figure 8) due to the collection of these waters at different times. The most notable difference was in the influent waters for column 20, which was completed 6 months after the prior columns. At that time, the uranium concentration in well 120 had increased (File S1) and the uranium concentration in the Gunnison River water had decreased (Table 3). Overall, the Gunnison River water influent for column 20 was more dilute (File S1 and Figure 8).
Almost all the columns showed an initial spike in constituent concentrations (generally PV 1), followed by a trend toward equilibrium with the influent groundwater (Figure 8 for the chloride, calcium, alkalinity, and uranium, and File S7 for all the other constituents), indicating minimal reactions. A notable exception was the alkalinity and calcium for column 20 (120-series solids with 120 influent), where these constituents started at lower concentrations and did not always equilibrate with the influent groundwater (Figure 8). In addition, the sulfate in column 20 had a typical initial spike in concentration, but equilibrated at a higher concentration than the influent water (nearly 2000 mg/L compared to the influent well 120 water near 1000 mg/L (File S7). For all the columns, the chloride concentrations in the effluent equilibrated with the influent water within one PV (Figure 8), indicting minor dispersion within the columns.
The effluent uranium in columns 9, 10, 11 and 12 equilibrated more quickly with the influent groundwater than columns 7, 8 and 20 (Figure 8), which likely indicates how closely the column test replicated the field conditions (the sorption to the solid phase was in equilibrium with the water phase when uranium concentrations were near 700 µg/L). Unlike any other column, column 20 had a release of uranium at concentrations much greater than the influent water for PVs 2 through 5 (Figure 8), and this column had the greatest solid-phase uranium concentration (Table 3). Column 11 (100 series S&G with 106 influent) also stands out as having had a relatively constant uranium release concentration during the river flushing step (Figure 8). Column 11 had an intermediate solid-phase uranium concentration (Table 3). Similar to the VZ columns, the use of effluent concentrations to calculate the remaining solid-phase uranium concentrations provided a reasonable match for the concentrations measured from the 5% nitric acid leaching of the postcolumn material (Table 3). These data indicate that some solid-phase uranium was removed from all the columns by the end of the column testing (Table 3), although uranium was alternately added and removed, depending on the column influent water.
The saturated-zone column data (Figure 8 and File S7) suggest that the main control on uranium mobility was a sorption/desorption reaction, with the possible exception of excess uranium related to gypsum dissolution in column 20 with the 120-series S&G solids (the same location as the VZ solids with gypsum dissolution). These data match microscopic work that determined the 110-series S&G to have minimal sorbing sediments, the 100-series S&G to have some organics that could provide added sorption, and the 120-series S&G to have unique aluminum/silica mineral coatings that incorporate uranium, calcium, and sulfate [13]. The S&G composite was not analyzed directly in [13], but the column effluent data (Figure 8) indicated that the S&G composite results were most similar to those of column 12 (110 series S&G).

4.2.2. Geochemical Modeling and Sorption Coefficients

The PHREEQC modeling of the saturated-zone, continuous-flow columns used the same approach as the VZ columns by setting the calcite, gypsum, and carbon dioxide SIs based on the column effluent first, but used PHREEQC in a 1D column mode (all the calibration graphs and model files are provided in File S8). For these continuous flow columns, open-air fraction collectors were used for the effluent samples, which allowed some carbon dioxide degassing. This was most notably seen with the second round of groundwater influent (PVs 23–30) and the 6-2N influent (PVs from 31 to the end) (File S7). With this, the last sample in the fraction collector had the most carbon dioxide, the lowest calcite SI, and the lowest pH (File S7), and it was the most representative of the actual column conditions. Thus, the 1D PHREEQC modeling of the column used the higher carbon dioxide concentrations and the lower calcite SIs calculated from the effluent waters to match the lower pH values (File S8). The calcium and alkalinity concentrations in the effluent were less affected by the carbon dioxide degassing, and the calcite SI and carbon dioxide concentrations were adjusted only slightly to provide an improvement in the matching of the calcium and alkalinity concentrations.
The matching of modeled to measured data for calcium and other cations improved with the addition of cation exchange (an exchange species X in PHREEQC with a value varying from 0.15 to 0.25 moles of exchange sites). This addition of cation exchange helped to match the inflections in calcium concentrations after the influent water changes, along with improvements in the matches to sodium and magnesium (File S8). A similar, but less dramatic, improvement in potassium and manganese matches occurred with the addition of cation exchange (File S8). Column 20 (120-series solids with 120 influent) was the only column in which gypsum was added in the PHREEQC simulations. This addition matched the column 20 effluent SIs, which indicated gypsum equilibrium and achieved a modeled match to calcium, sulfate, and alkalinity (File S8).
The uranium sorption parameters were adjusted after all of the above steps were complete and the final values showed minor variations between columns (Table 4). Figure 9 shows the measured versus the modeled uranium concentrations for columns 10, 12, 11 and 20. Column 10 is representative of columns 7, 8 and 9, which use the same solid-phase material (Table 3), and columns 12, 11 and 20 are in order of increasing uranium on the solid phase (Table 3). The final uranium sorption parameters provide a reasonable fit with the measured data (Figure 9). Although column 20 indicates the presence and dissolution of gypsum, the release of uranium incorporated in the gypsum is not suggested, as the uranium concentrations are adequately explained by using sorption parameters (unlike the early pore volumes for some of the vadose-zone columns, see columns 15 and 16 in Figure 7). While the variations in the values for the sorption site densities did not seem large (Table 4), the resulting modeled curve shapes (Figure 9) were sensitive to small variations in the GC_ss parameter. This is evident for column 11, with a slightly larger GC_ss value (Table 4) that flattened the model curve during the river water influent (Figure 9). This stronger sorption in column 11 is likely to have been due to higher carbon content.
Fitting the initial PVs was usually the most difficult, especially in the columns with initially high uranium concentrations. Because of the carbon dioxide degassing with the influent groundwater and the necessary bubbling of carbon dioxide back into that water to match the field pH values at +/− 0.2 pH units, the pH values of these waters were somewhat uncertain. When testing the sensitivity of this initial pH value, a slight influent pH change within the +/− 0.2 pH units made a dramatic difference in the modeled effluent uranium concentration. Sometimes, a slight influent pH change improved the early PV fits (as in column 12 in Figure 9), but this was not always the case (e.g., column 11 in Figure 9). However, this adjustment did not change the sorption parameters, as these were quite sensitive to fitting the uranium concentration changes after switching to river water and then back to a groundwater influent.
For added simplicity, the saturated-zone, continuous-flow columns were modeled again using only the strong-sorption-site density parameter (GC_s). The model results in Figure 9 and File S8 could be reproduced almost exactly (File S9) by increasing the GC_s values by 1.1 to 2.7 times the initial GC_s value determined using two sorption parameters. The new GC_s parameter values ranged from 2.0 × 10⁻³ to 4.2 × 10⁻³ moles/kg water compared to 1.0 × 10⁻³ to 3.5 × 10⁻³ moles/kg water (Table 4). With this in mind, future sorption modeling efforts should consider the use of only one sorption parameter.
The Kd values (Figure 9 and Table 4) provided a more intuitive representation of the uranium sorption. The value Kd is simply the solid-phase concentration divided by the water-phase concentration (assuming equilibrium and a linear sorption isotherm), which was easily calculated on the column tests based on the precolumn 5% nitric acid leaching data and the uranium concentrations throughout the tests. For this calculation, it was assumed that the 5% nitric acid leach of solid-phase material removed all the sorbed uranium, but did not remove any uranium inherent in the mineral grains, which were dissolved in a full sample digestion. For columns 7 and 8, the lower influent uranium concentrations (well 106 and 110 influent, Table 3) resulted in higher Kd values (3.4 and 3.0, respectively) and were simulated with PHREEQC by a larger GC_s sorption parameter (Table 4). Columns 9 and 10 had higher influent uranium concentrations (wells 120 and 121, Table 3), which reached equilibrium with the same solid phase more quickly and had Kd values of 1.5 and 1.6, respectively. Column 12 (110-series S&G) had a lower influent uranium concentration (well 110) along with a lower solid-phase uranium concentration, but had similar sorption parameters and a Kd value that was similar to columns 9 and 10 (Table 4). Overall, columns 9, 10 and 12 had similar uranium and Kd trends (Figure 9 and File S8) and appeared to be the most representative of the relatively clean S&Gs at the site with a lower amount of uranium sorption potential. Columns 7 and 8 used the same solid-phase material (S&G composite). Overall, they showed similar trends to columns 9, 10 and 12, but had higher initial uranium release to the water phase (early PVs) compared to the lower influent concentrations (File S8) and provided an upper bound Kd value for typical site sands and gravels.
With a slightly greater solid-phase uranium concentration and evidence of organics to provide more sorption potential [13], column 11 (100 series S&G) had an initial Kd of 5.9, which was also reflected by a larger GC_ss parameter (Table 4). This parameter provided the flatter curve for the uranium release with the river water influent (Figure 9), which was also reflected by a relatively consistent Kd value, near 14.5; this was likely due to increased uranium sorption by organic material and greater sorption with lower-alkalinity river water compared to the initial groundwater influent. For column 20 (120-series S&G with well 120 influent), the higher measured Kd value of 4.9, compared to column 9 (S&G composite with well 120 influent), before the switch to the river water influent (Table 4 and Figure 9), may have represented excess uranium bound within grain coatings [13].
Except for column 11, the other columns had strongly increasing Kd values during the river water and the final 6-2N groundwater influents (Figure 9 and File S8). Since the uranium effluent data in the stop-flow columns 1 through 6 were essentially the same as in the continuous flow columns 7 through 12 (Table 1 and File S2), it appears that uranium sorption/desorption reached equilibrium in columns 7 through 12 with the 0.7 mL/min column flow rates. Thus, except for column 11, with the introduction of more dilute waters (river water and 6-2N groundwater), Kd was not a linear function. As a result, the Kd increased as the water-phase uranium concentration declined. This nonlinearity was already accounted for in the GSCM approach when using PHREEQC (Figure 9 and File S8).
For column 20, the extremely high Kd values with river water flushing were likely due to the uranium release being from the grain coatings, thereby delaying the uranium release beyond the equilibrium sorption reactions. This is supported by the fact that the equivalent stop-flow column 19 had relatively constant uranium effluent concentrations (140 µg/L) throughout the river-water flushing (File S2) compared to the decline in uranium effluent concentrations for the continuous-flow column 20 (Figure 9 and File S2). However, column 19 did not show high calcium and sulfate concentrations as a result of gypsum dissolution, even though it used the same 120-series S&G composite material as column 20. The postcolumn DI leaching of the columns (File S1) indicated that the column 20 material had almost 40 times more calcium than column 19. Thus, it is likely that there was heterogeneity in the 120-series S&G material even after compositing, and column 20 happened to be packed with material that had more gypsum. The X-ray diffraction on the 120-series S&G material did not indicate gypsum above the detection limits (about one weight percent), but the 19 weight percent gypsum in the 120-series VZ material suggests that the presence of gypsum in the 120-series S&G material was likely.

5. Conclusions and Practical Implications

5.1. Vadose-Zone Columns

The VZ columns were designed to determine the uranium release rates and control mechanisms from the VZ during large recharge events. Assuming that the laboratory results can be applied to field conditions, the overall conclusions are as follows:
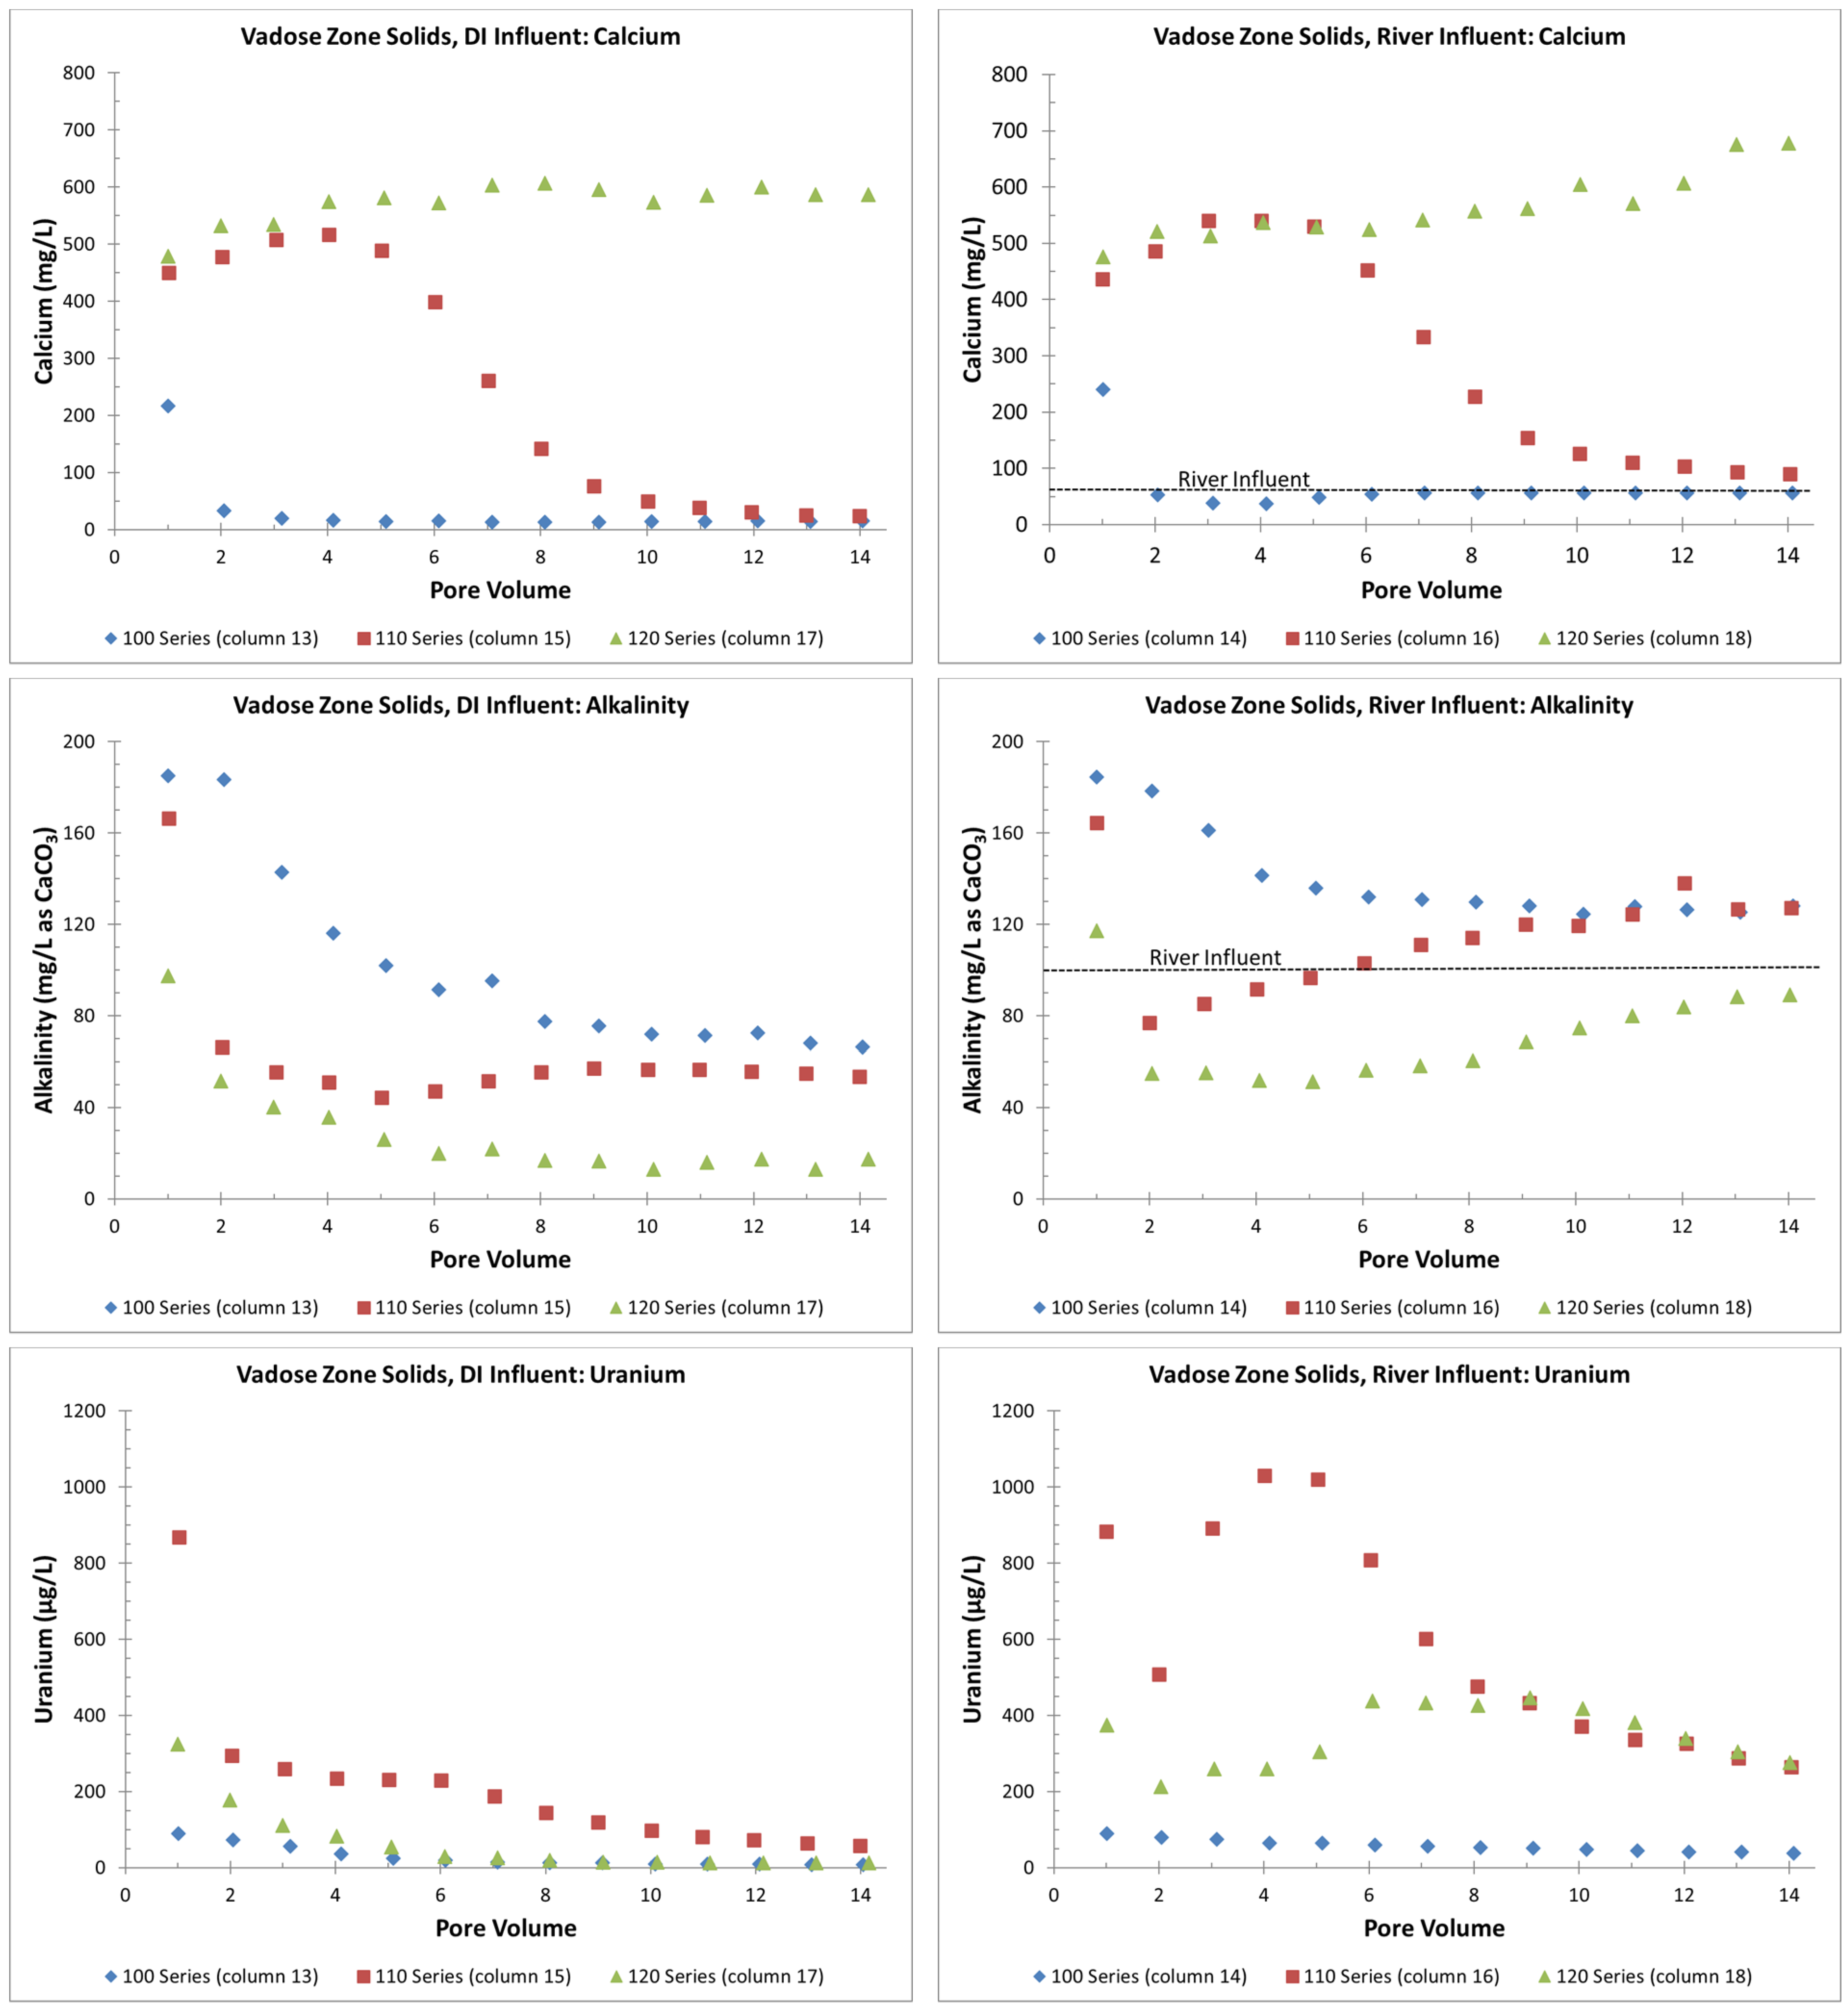
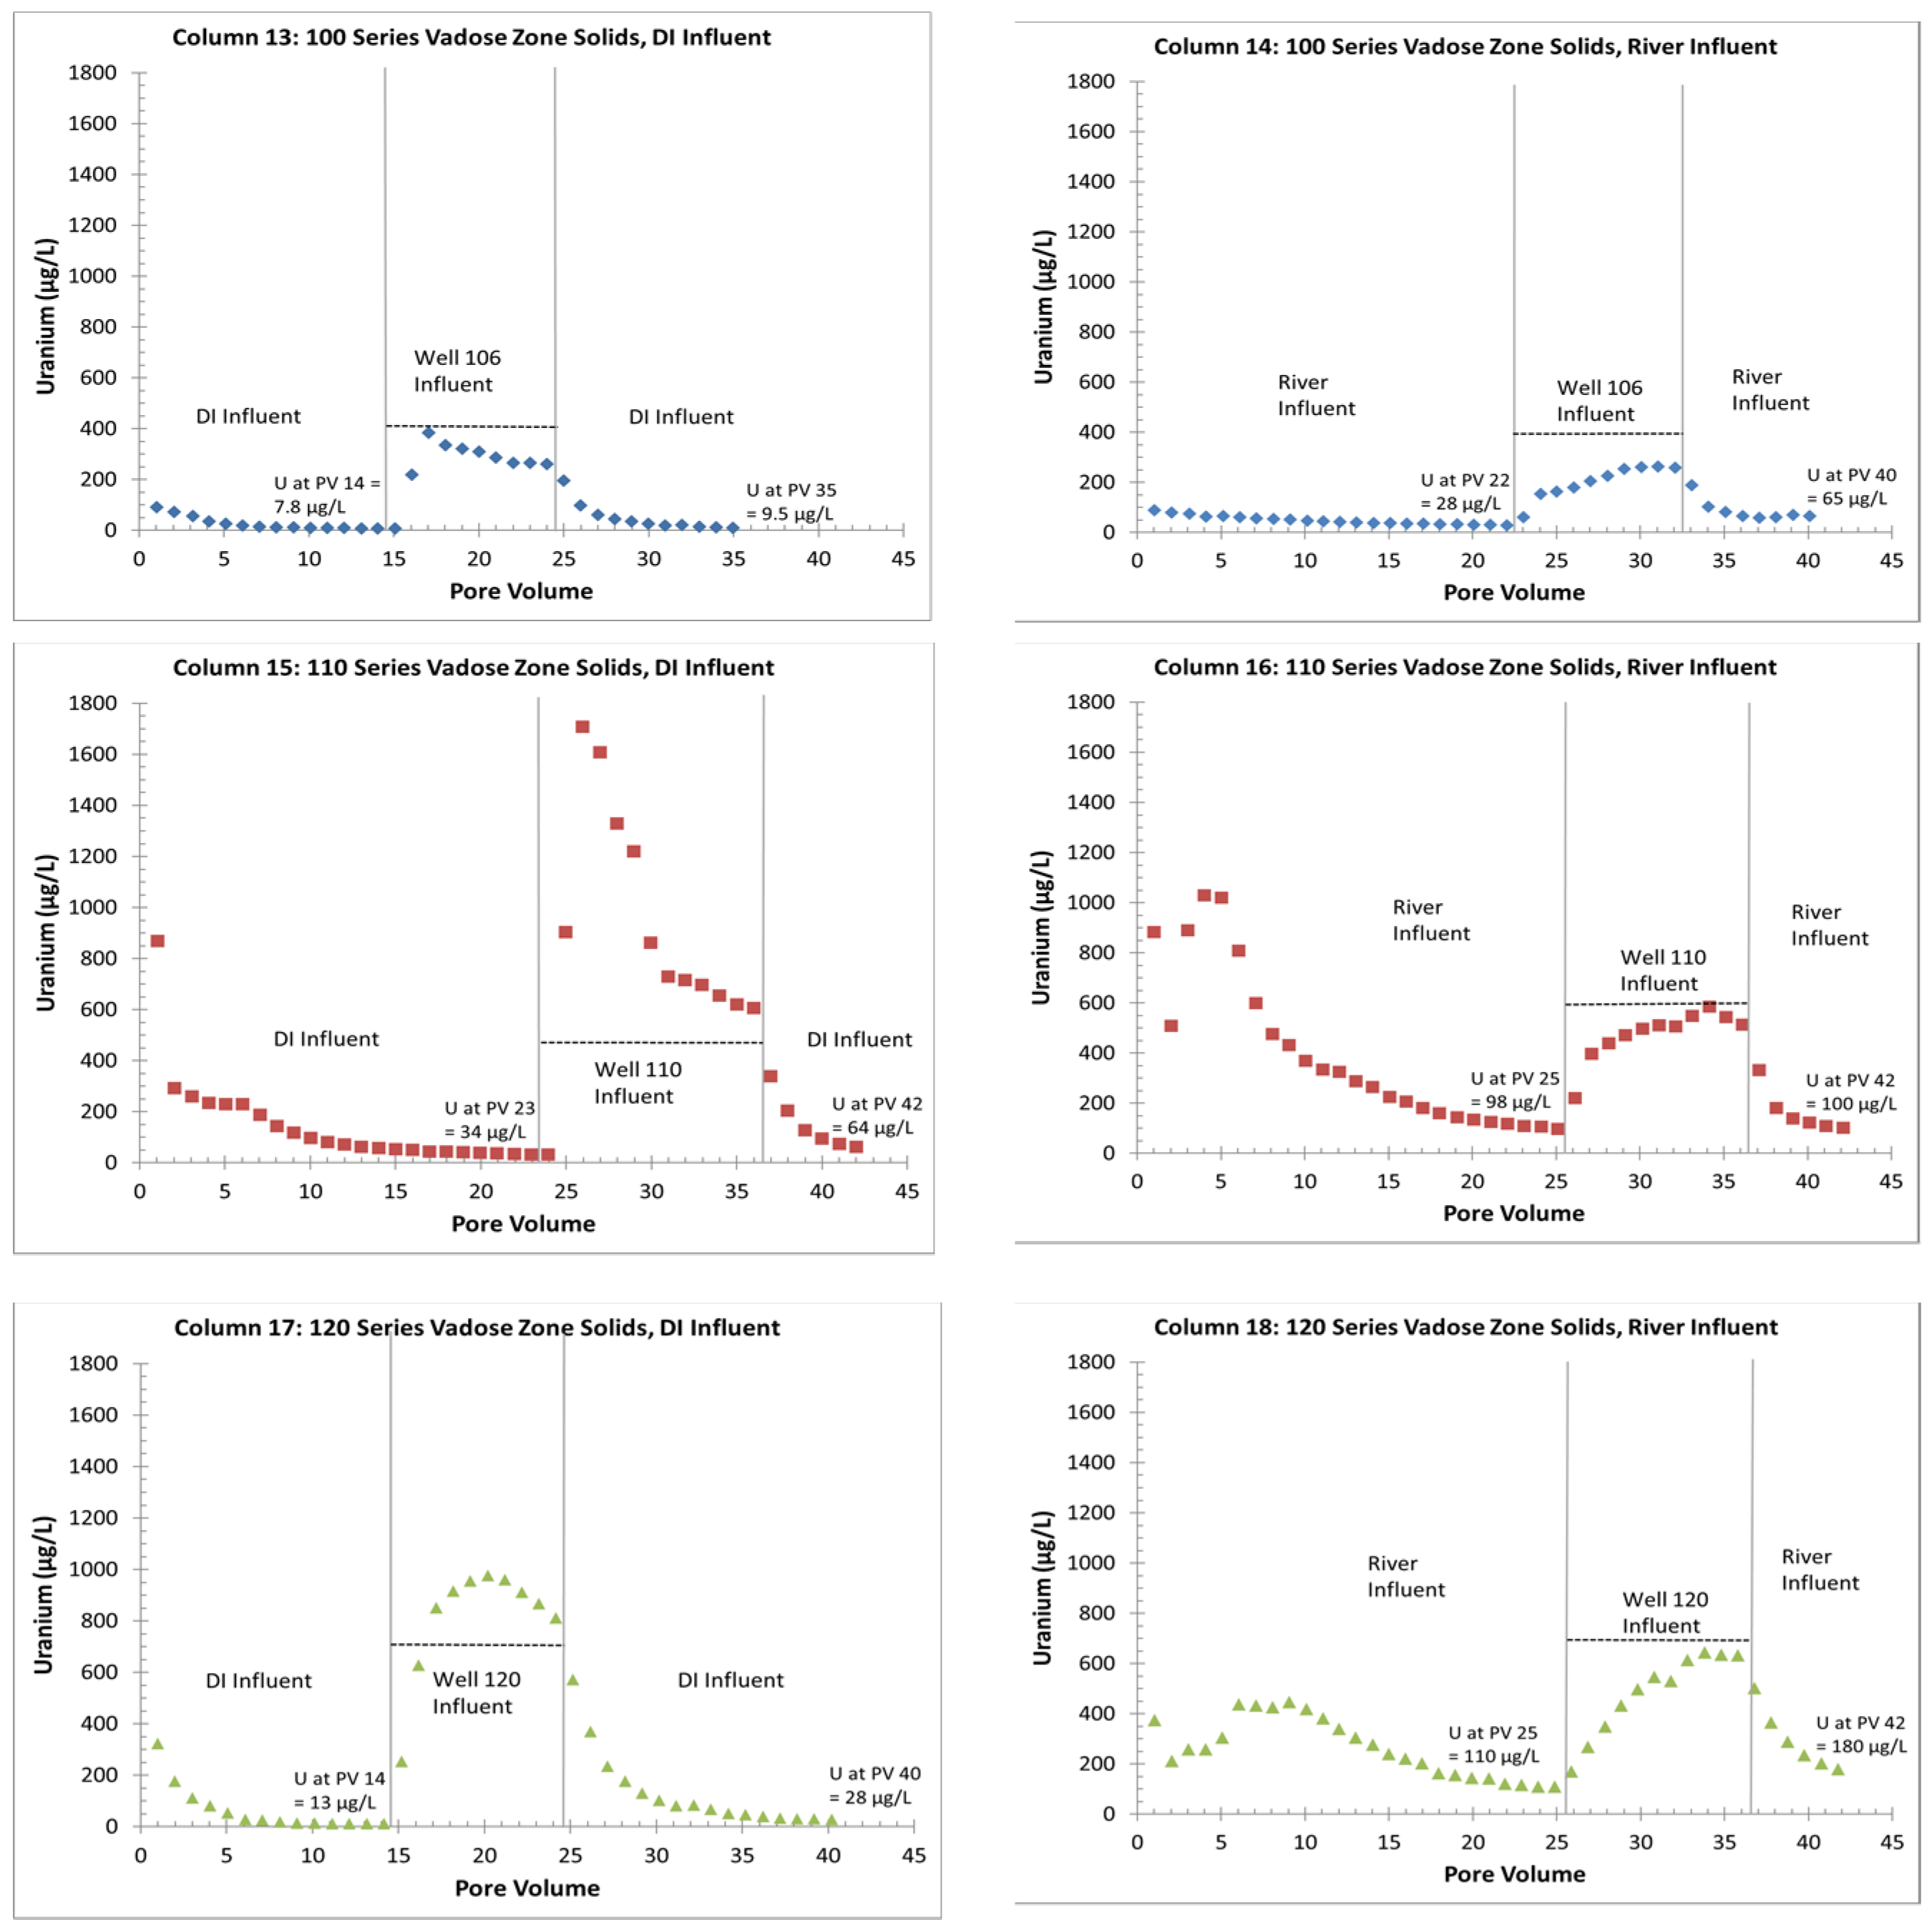
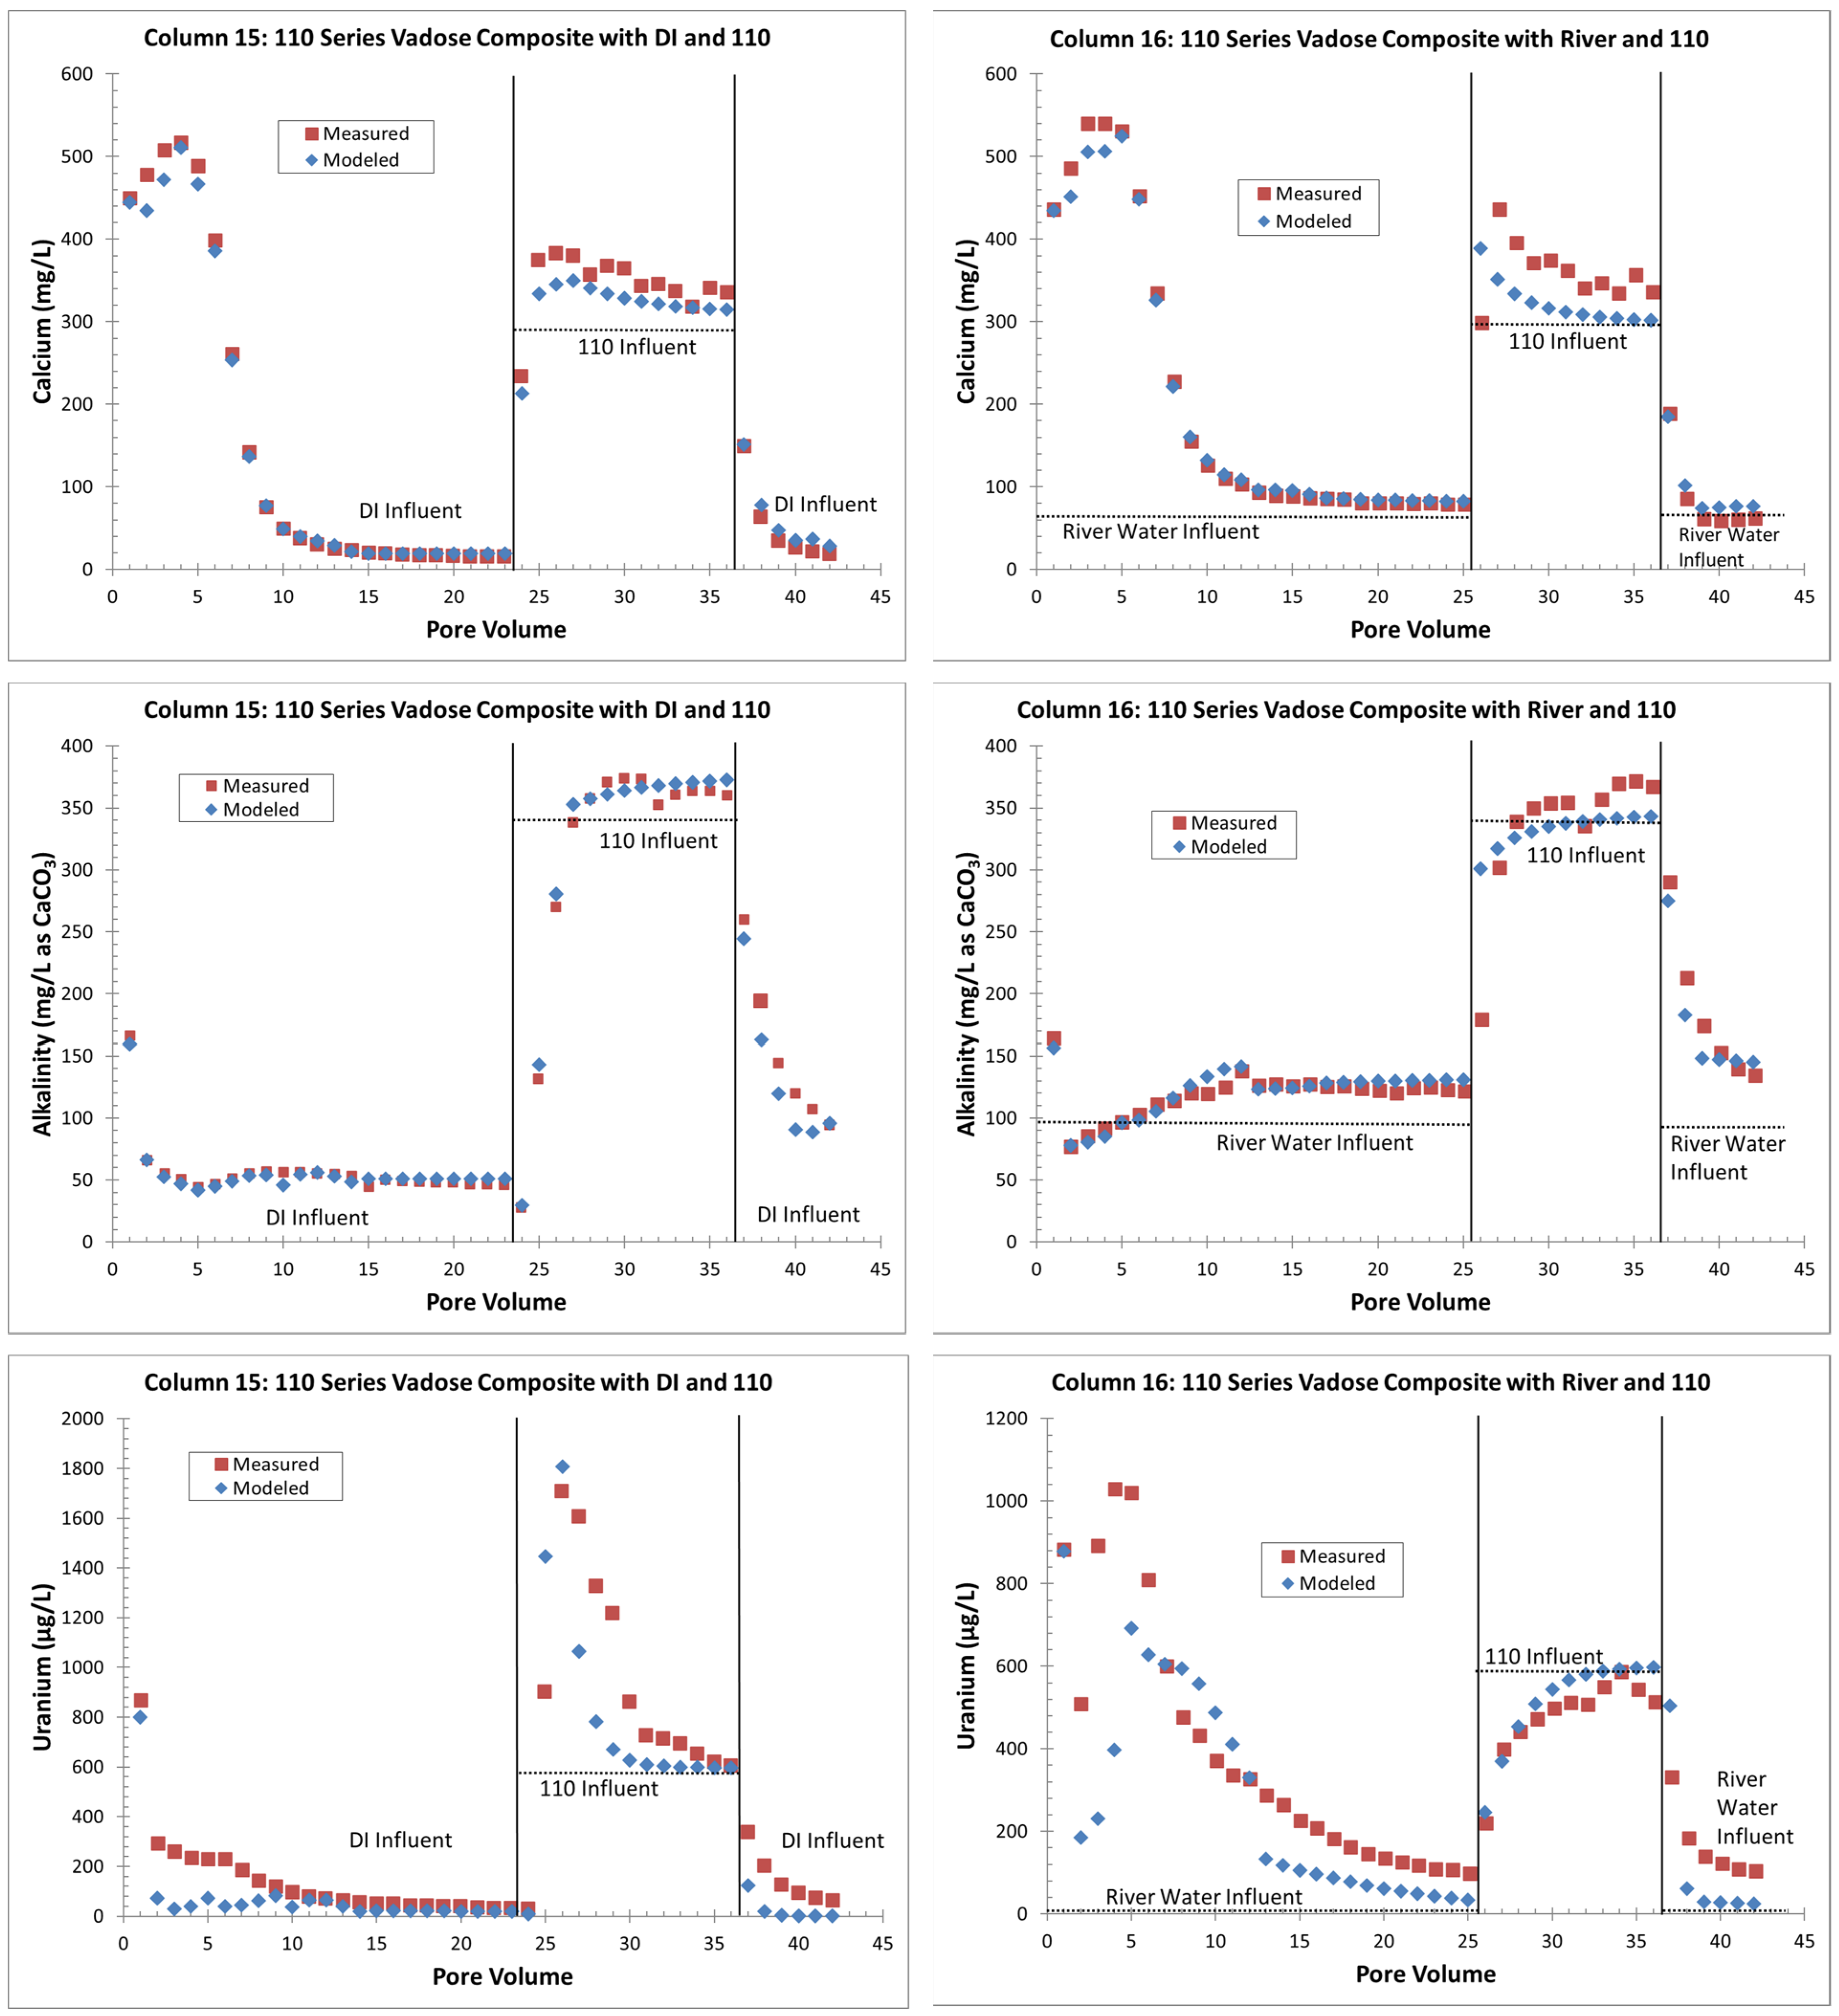
  • The uranium release concentrations from the VZ would be lower from a large precipitation event (DI water column influent) than with a flooding event (river-water column influent). Similarly, flooding events would continue to be more efficient for removing uranium for a longer time (more PVs) than precipitation events. This is based on columns with the same solid-phase material releasing more uranium with the river-water influent than with the DI influent (Figure 4 and Figure 5);
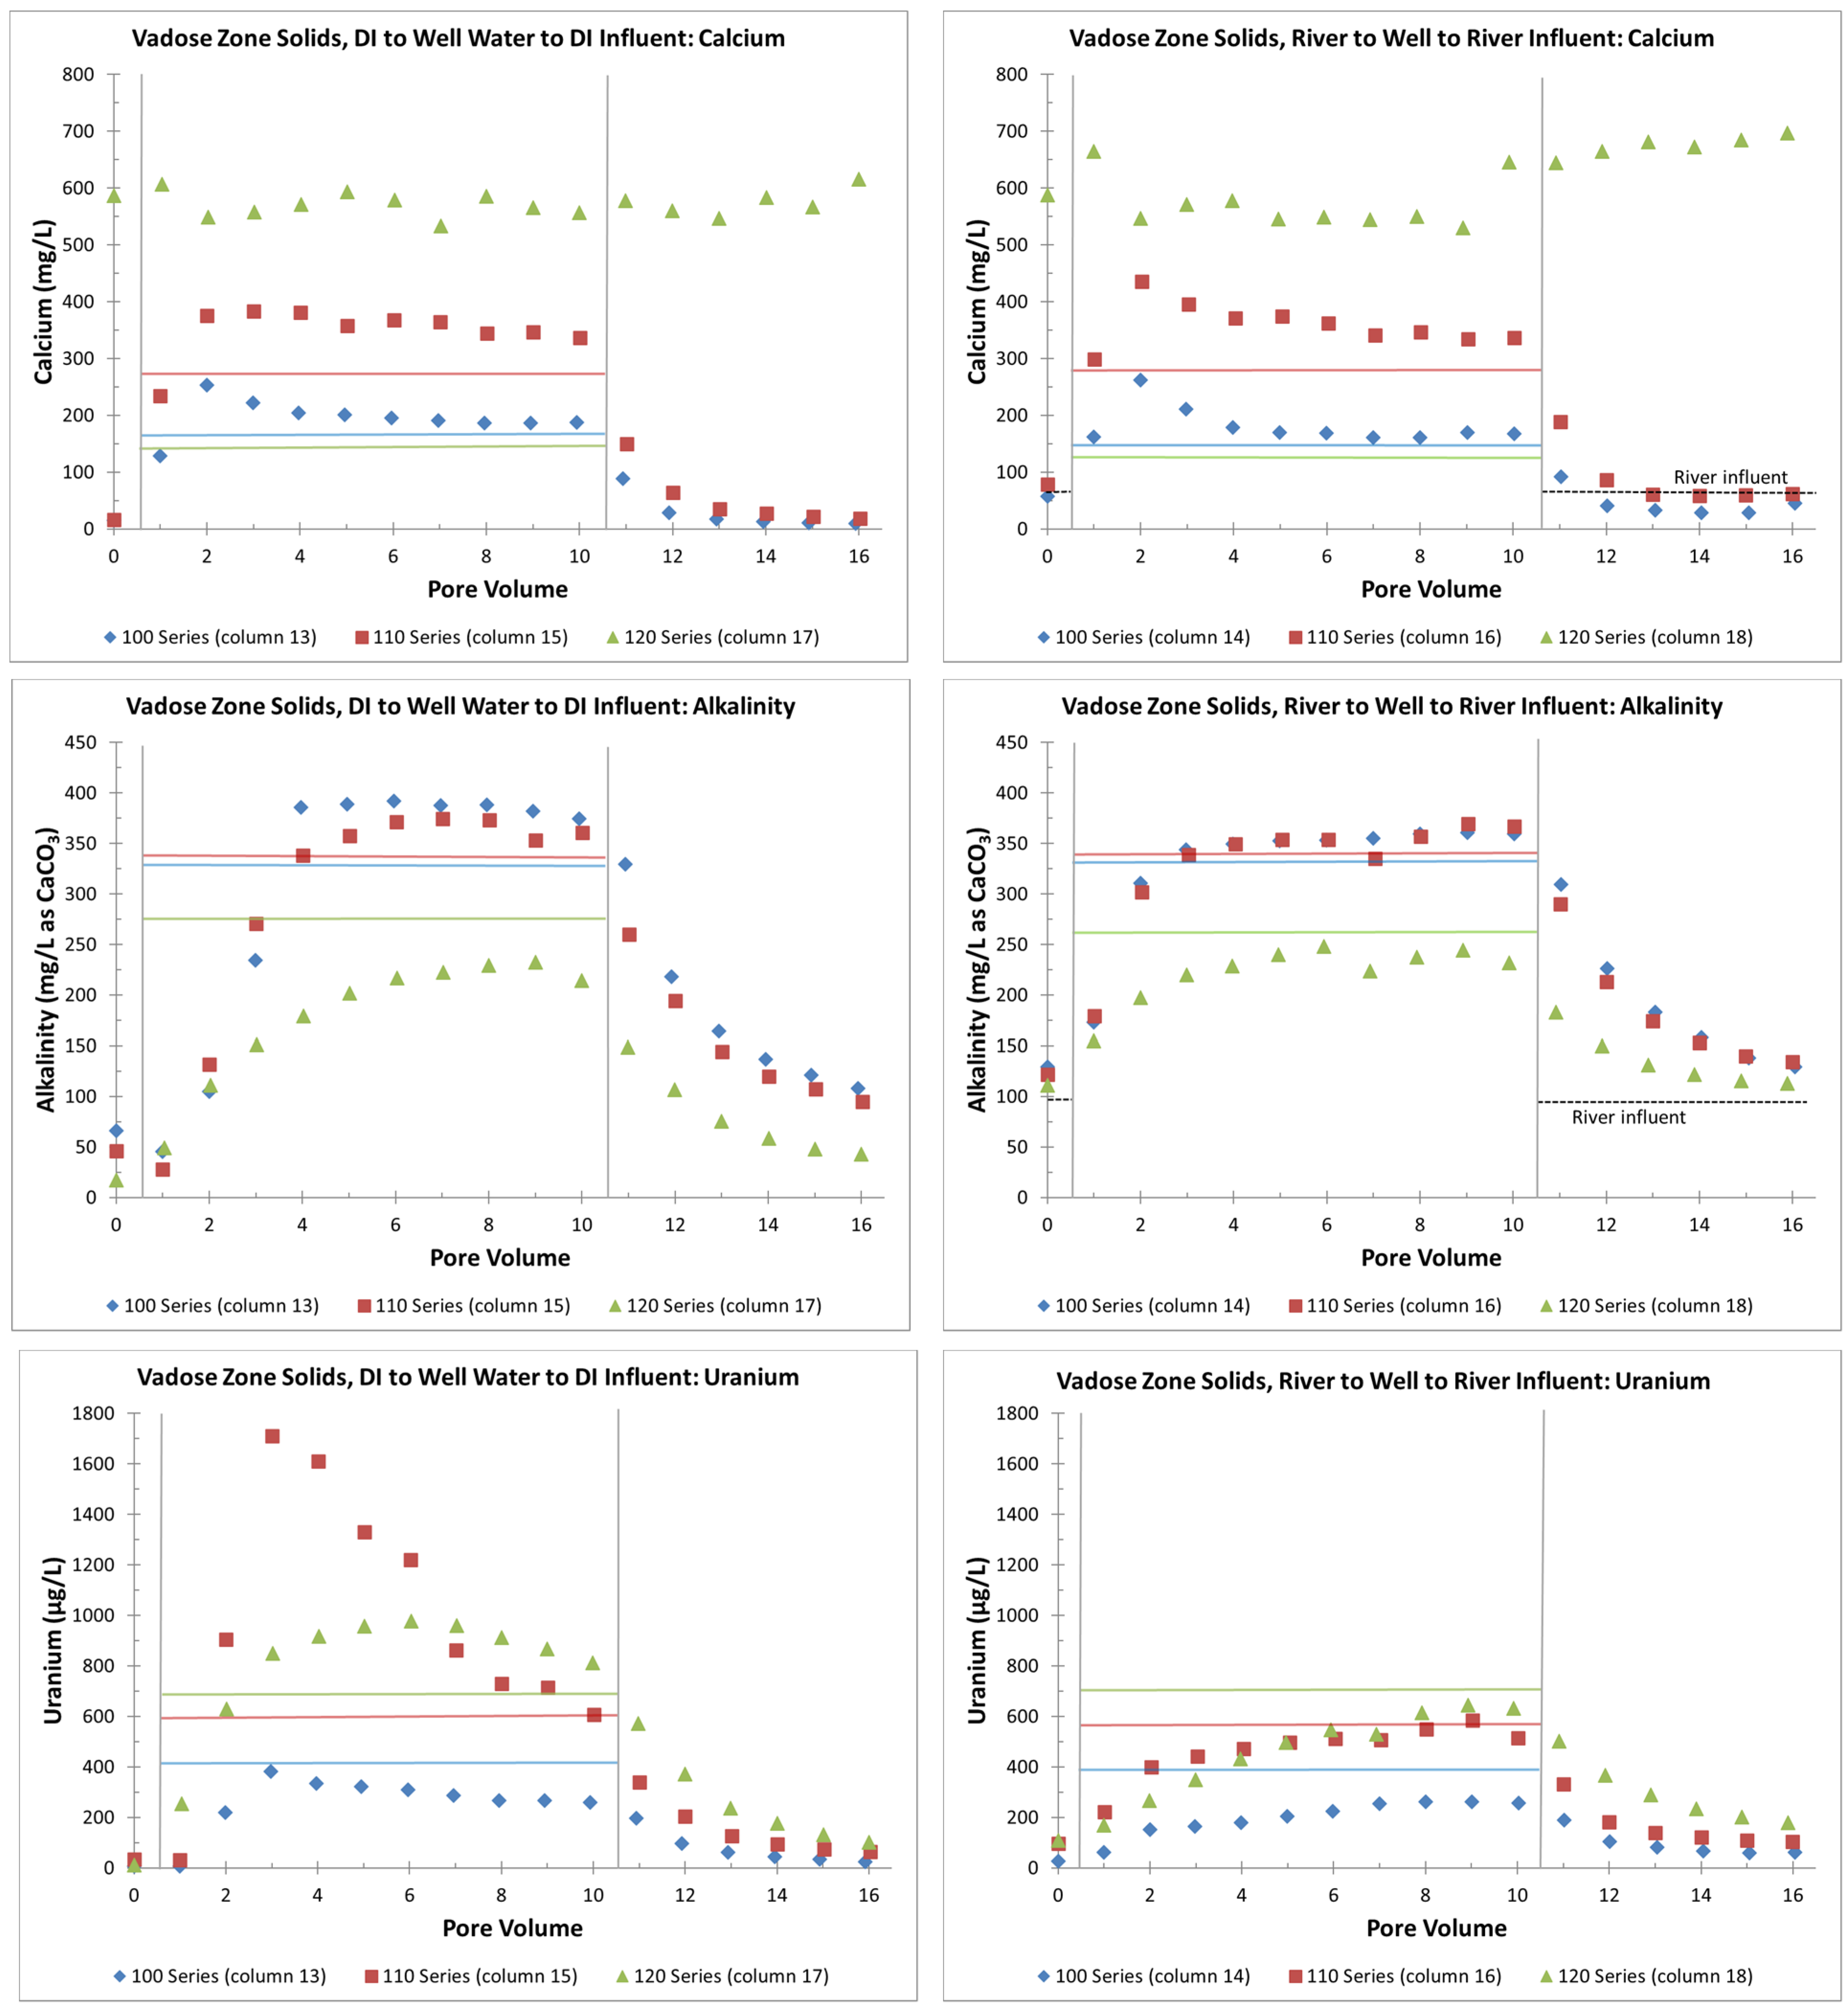
  • Without flooding events, more uranium is retained on the solid phase with just precipitation events. If a later rise in the water table creates contact between the underlying groundwater and the VZ, large uranium releases are possible (up to three times greater than the groundwater concentrations). The reverse is true with continuous flooding events that have removed solid-phase uranium from the VZ; during a water table rise, uranium is removed from the water phase to the solid phase by sorption reactions (Figure 4 and Figure 6);
  • The presence of gypsum can suppress alkalinity concentrations and lower initial uranium release rates during precipitation or flooding events (Figure 7). However, this involves a complex interplay between alkalinity concentrations and the possible release of uranium incorporated in the gypsum or other grain coatings. This is a topic of ongoing research;
  • Overall, higher uranium in the solid phase corresponds to greater uranium release concentrations (Table 2 and Figure 5). Likewise, elevated uranium concentrations in the VZ can contribute uranium to the underlying groundwater at concentrations well above typical standards for an extended time period (greater than 25 PVs of continuous flow for a river water influent, Figure 4). Actual uranium removal from the VZ requires a consideration of the frequency and release rates from flushing events (such as high precipitation, flooding, or water table rise) compared to uranium emplacement events (such as the sorption of uranium from contaminated groundwater influx with a water table rise or from high evapotranspiration).

5.2. Saturated-Zone Columns

The saturated-zone columns were designed to simulate river-water incursion, enhanced flushing with river water, or incoming background groundwater (6-2N). The results from the saturated-zone columns indicated that the overall uranium mobility appeared to be controlled by the sorption reactions. The column data indicated the following considerations, should natural or enhanced flushing be used as a remedial strategy:
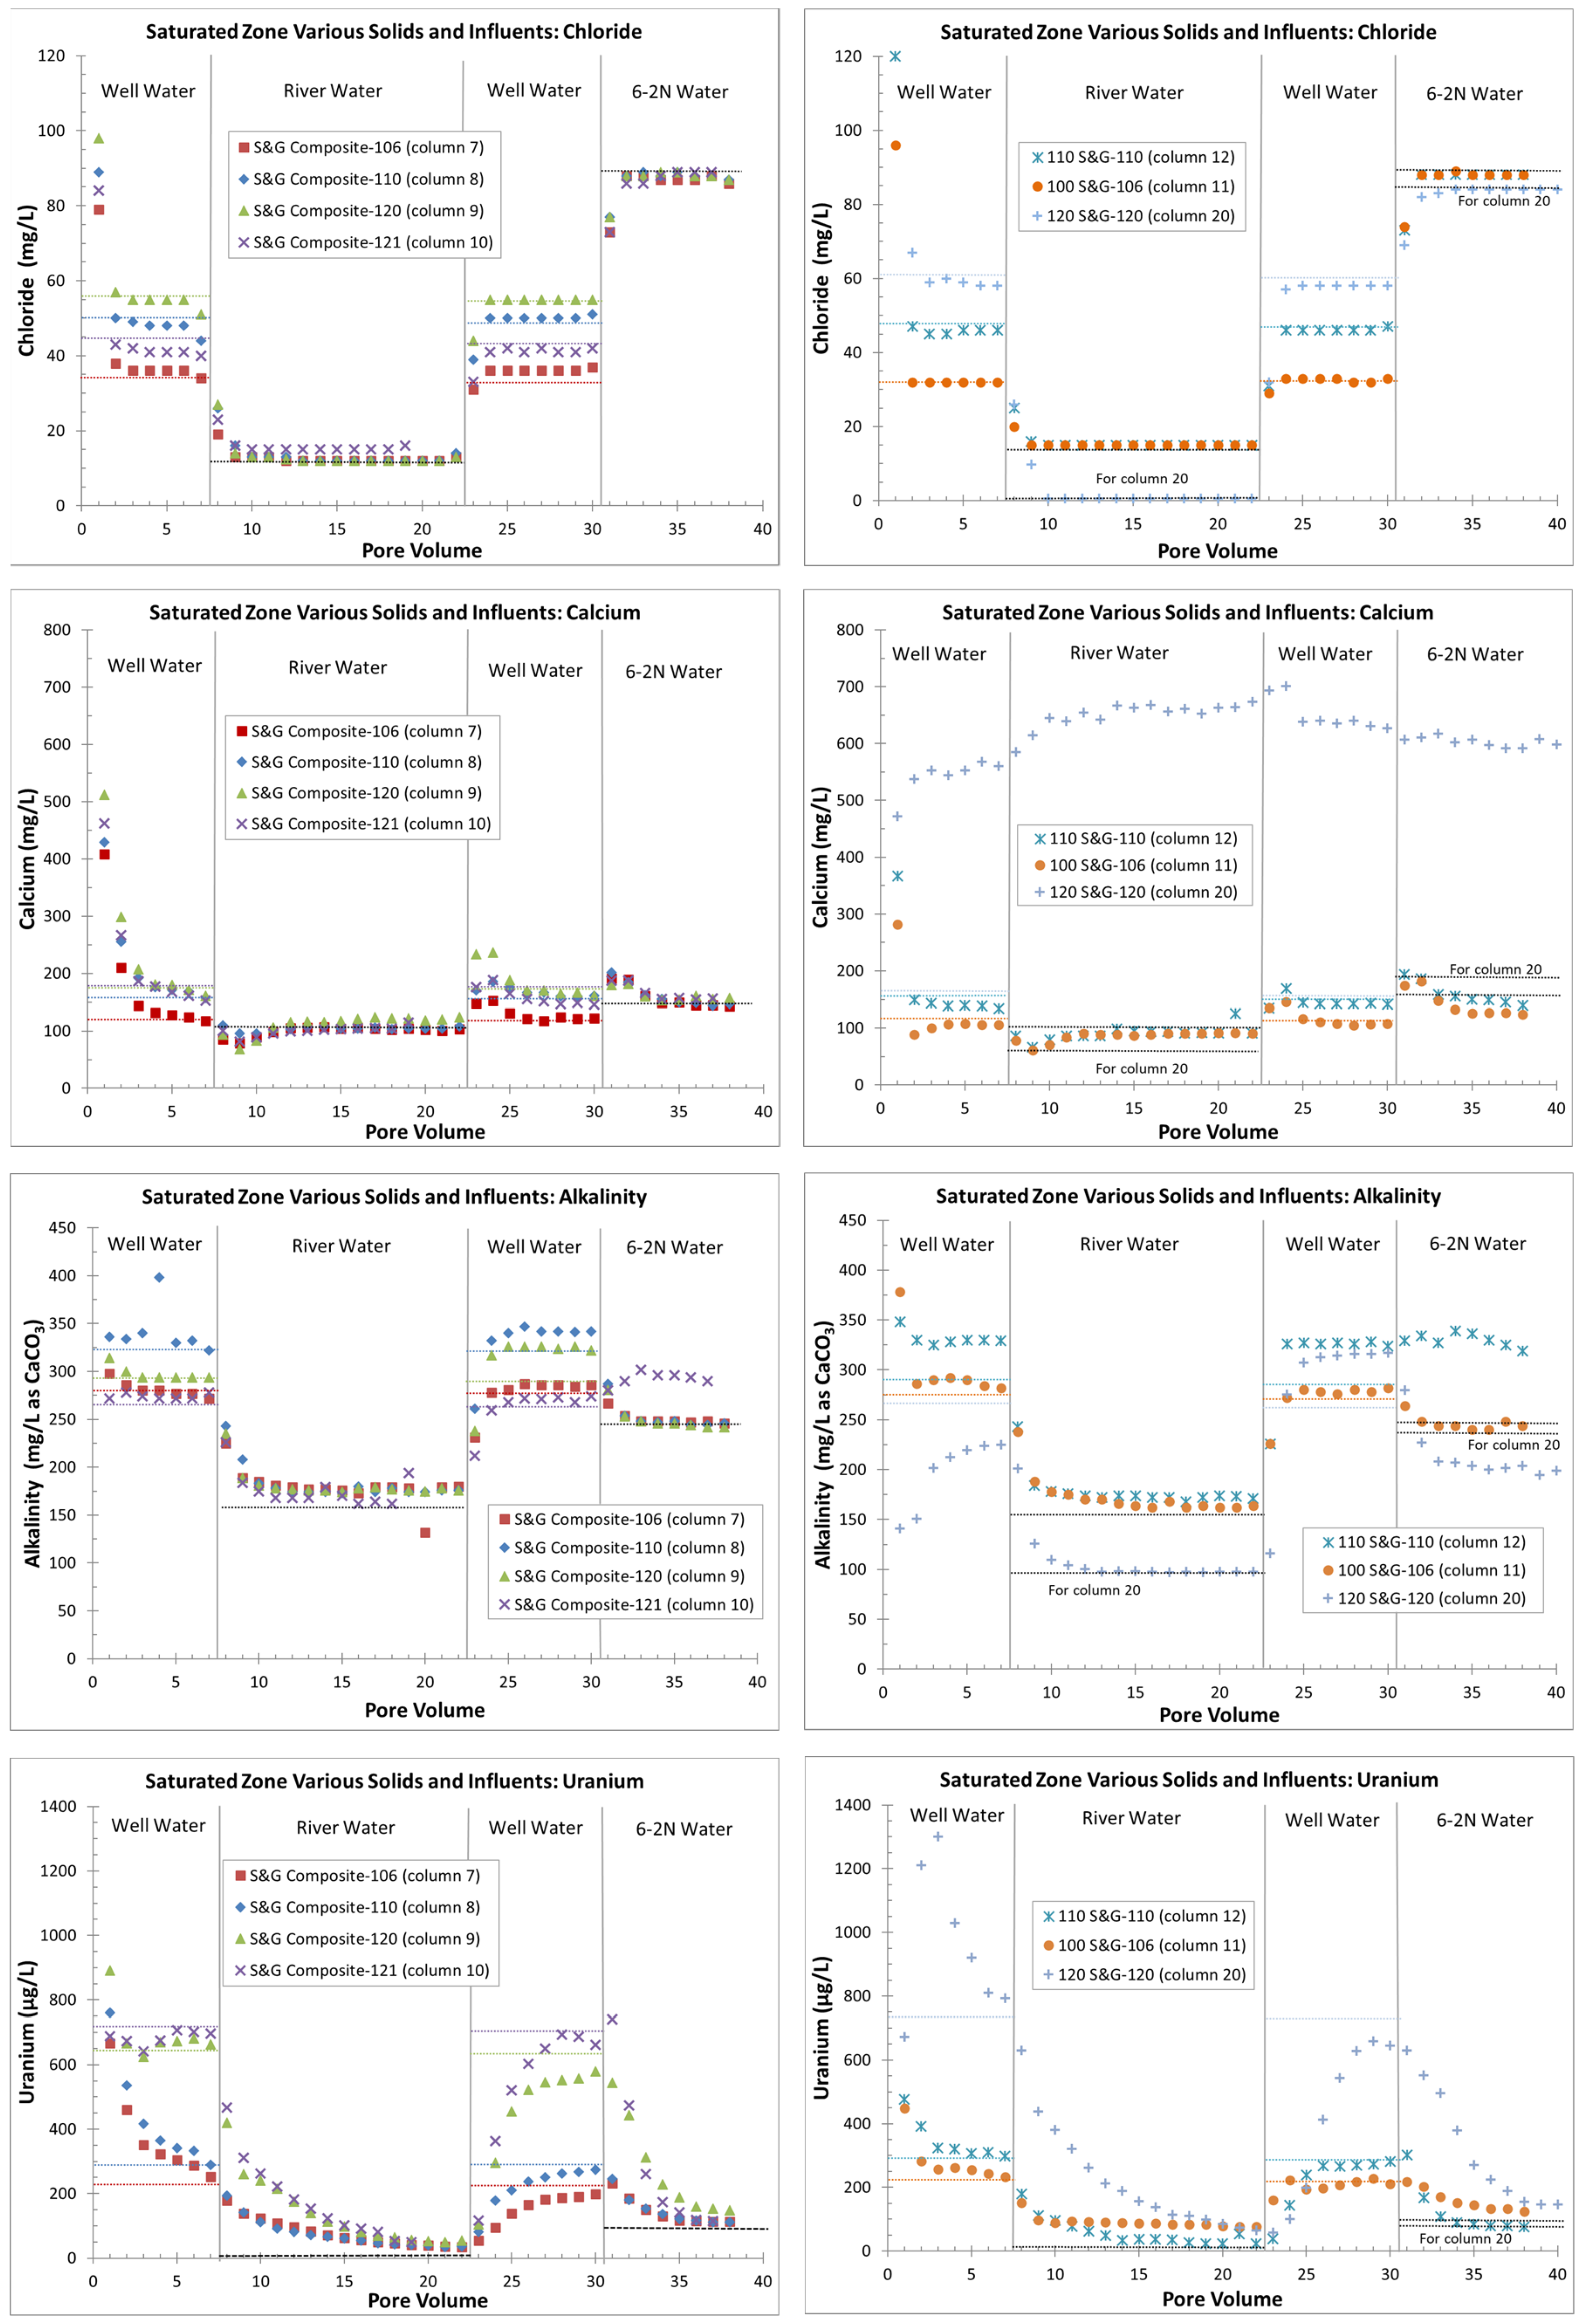
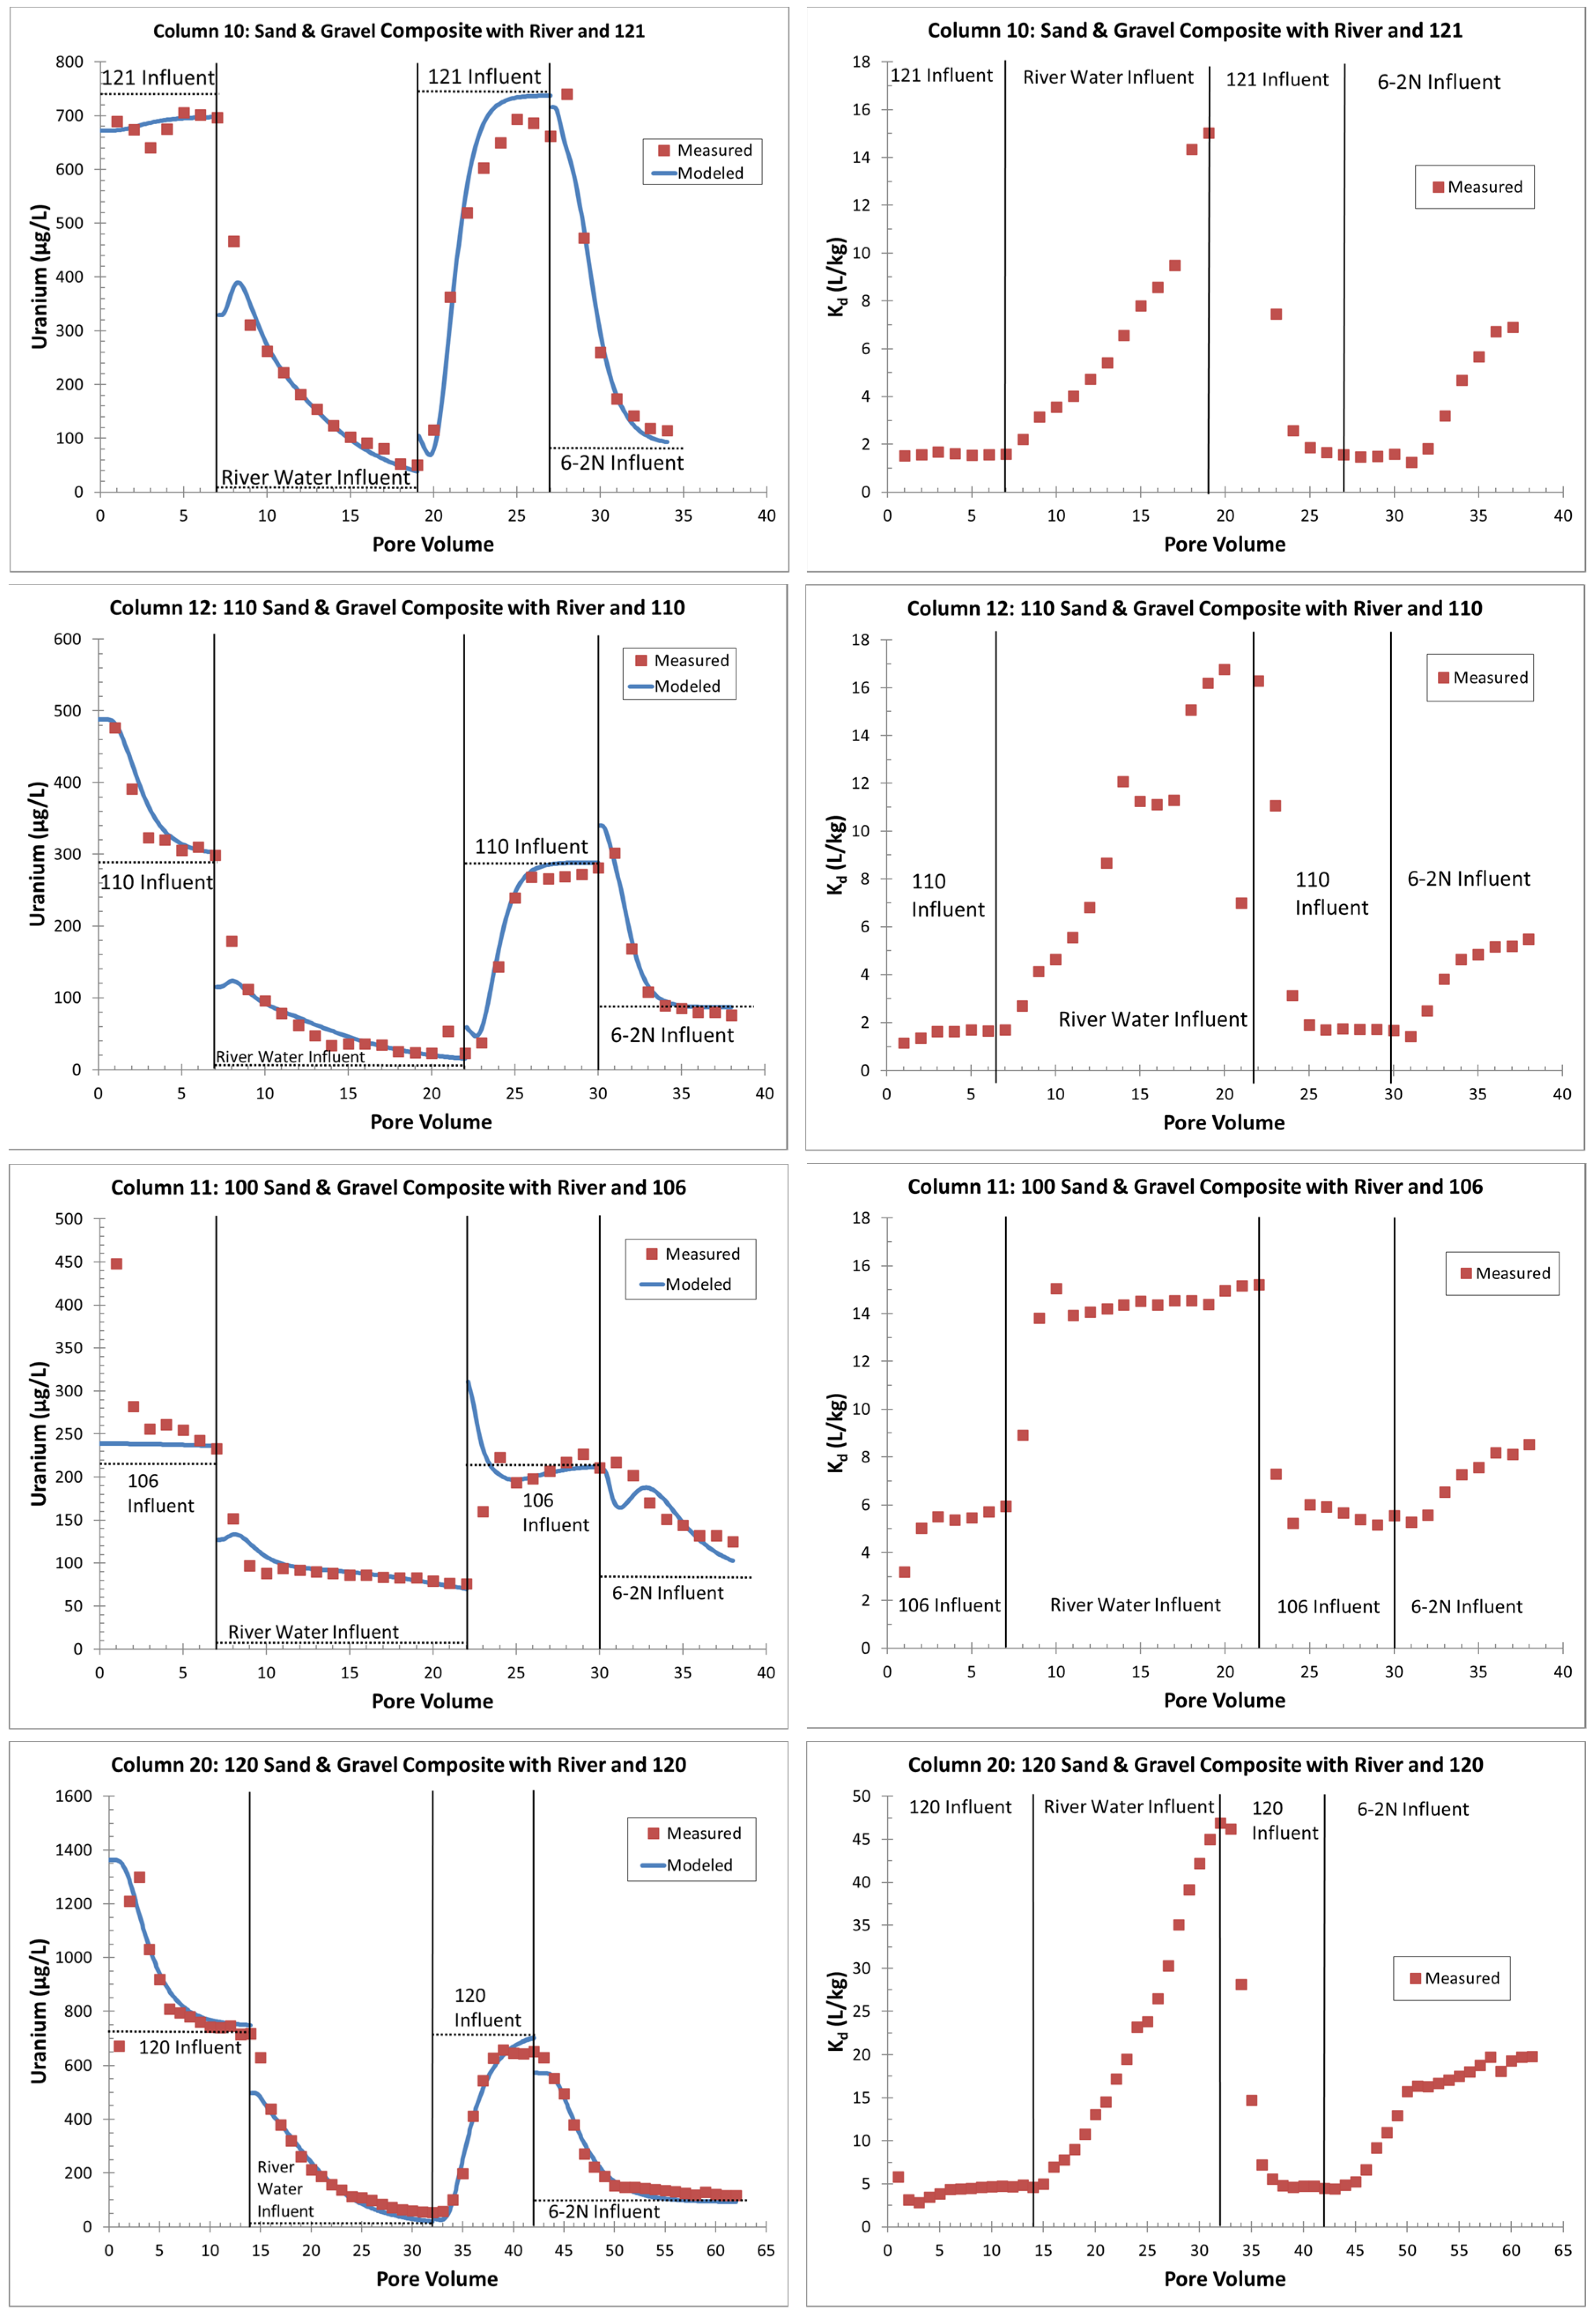
  • Zones with higher uranium sorption (e.g., column 11, 100-series sediments with more organics) might delay flushing or other remedial efforts;
  • The use of lower-alkalinity river water instead of higher-alkalinity, lower-uranium groundwater may inhibit flushing (there is less uranium desorption, based on higher Kd values (stronger sorption), with the use of river water);
  • An apparent increase in Kd values at lower effluent uranium concentrations, typical of the tail end of flushing (seen with river water and background groundwater), might create difficulties in reaching cleanup goals;
  • Areas with higher amounts of uranium on the solid phase (columns 20 with 120-series area sediments) might require slower flushing rates (lower flow velocities) to avoid kinetic limitations in uranium removal when uranium reactions are not strictly equilibrium-sorption controlled.

5.3. Overall

The results from the column testing at the GJO site are broadly applicable to any site where the removal of uranium or other metals from the solid phase is the goal. Whether this involves the ISR recovery of uranium from an ore deposit, ISR restoration, the remediation of a uranium-contaminated site, or the remediation of a metal-contaminated site, the following steps are applicable: (1) identify areas with high solid-phase uranium/metal concentrations; (2) understand and model the appropriate reactions, and (3) evaluate the kinetic limitations. Solid-phase characterization is always the first step. Understanding and modeling the reactions associated with uranium or the release of other metals under various geochemical conditions is the goal of column testing and the focus of this paper. Thus, various alternatives can be considered and tested in a controlled laboratory setting before implementation at the field scale.
These alternatives generally include “injection” fluids that are designed to mobilize the target metal, either through mineral dissolution or through desorption reactions (although some methods may be designed to immobilize the target metal). Thus, detailed knowledge of the associated reactions is necessary. As an example, for uranium, an overly “clean” injection fluid with low alkalinity can result in decreased uranium mobility due to an increase in uranium sorption. This cannot necessarily be anticipated unless the appropriate reactions are fully understood. As with the DI water influent for the GJO vadose-zone column tests releasing less uranium than the river-water or groundwater influents, overly clean restoration fluids can hinder remedial efforts. Similarly, the fact that gypsum dissolution can suppress alkalinity and reduce uranium desorption should be considered. In addition, for the GJO column-testing flow rates, equilibrium conditions between the water and solid phases were generally maintained (except for column 20), but kinetic limitations in the field must be considered, as high flow rates might not be productive.
While the upscaling of column-test data to field conditions is still a subject of ongoing research, the use of PHREEQC with a generalized surface complexation model to simulate the uranium release rates in the saturated zone shows promise. The issue with column-measured Kd values not being constant appears to have been overcome with the use of PHREEQC. However, a Kd evaluation does provide a best-case flushing scenario using a low-end, column-derived Kd value of 1.5 liters of water per kilogram of sediment (L/kg). When used to calculate a retardation factor for uranium mobility (1 + (bulk density/porosity*Kd)), the resulting value is 9.5, which means that the uranium might move nearly 10 times slower than the groundwater velocity. The original predictions of uranium flushing at the site with groundwater flow rates only (no sorption) suggested a timeframe of 50 to 80 years [6]; however, the timeframe might instead be in the order of 500 to 800 years, which is still without any ongoing sources from the VZ. Based on column testing, the VZ release of uranium can be significant (measured up to 1700 µg/L with an influent groundwater of 600 µg/L). The VZ release of uranium may be the biggest challenge for contaminated site remediation.
Tracer testing was completed at the site to compare column-derived sorption parameters with field-derived sorption parameters. This work is intended to determine whether column-derived sorption parameters are adequate for field predictions. With this in mind, the most applicable parameters will be used in a sitewide reactive transport simulation to test various site remedial strategies.

Supplementary Materials

The following supporting information can be downloaded at: https://www.mdpi.com/article/10.3390/min12040438/s1, File S1: Full data spreadsheet; File S2: Stop flow, continuous flow comparison graphs; File S3: Column effluent PHREEQC files; File S4: Updated PHREEQC database; File S5: Vadose zone column graphs; File S6: Vadose zone graphs with model and PHREEQC files; File S7: Saturated zone graphs; File S8: Saturated zone graphs with model and PHREEQC files; File S9: Saturated zone graphs with one parameter sorption model.

Author Contributions

Conceptualization, R.H.J.; methodology, R.H.J. and A.D.T.; software, R.H.J.; validation, R.H.J. and A.D.T.; formal analysis, R.H.J., A.D.T. and C.D.R.; investigation, R.H.J. and A.D.T.; resources, R.H.J.; data curation, R.H.J. and A.D.T.; writing—original draft preparation, R.H.J. and A.D.T.; writing—review and editing, R.H.J., A.D.T. and C.D.R.; visualization, R.H.J.; supervision, R.H.J.; project administration, R.H.J. All authors have read and agreed to the published version of the manuscript.

Funding

Funding for this work was provided by the U.S. Department of Energy Office of Legacy Management through contract DE-LM0000421 to Navarro Research and Engineering, Inc., as the contractor for Legacy Management Support (LMS). At the time of writing, the current LMS contractor is RSI EnTech, LLC (contract #89303020DLM000001). This work was completed under the Applied Studies and Technology Program (https://www.energy.gov/lm/services/applied-studies-and-technology-ast).

Data Availability Statement

Data are contained within the article and Supplementary Materials.

Acknowledgments

The presented column testing and resulting data represent a significant amount of effort in the laboratory, and we greatly appreciate the assistance of Sarah Morris, Kara Tafoya, and Mike Bradley in the Environmental Sciences Laboratory in Grand Junction, Colorado. They all spent many hours overseeing the column tests and performing the water analyses.

Conflicts of Interest

The authors declare no conflict of interest.

References

  1. DOE (U.S. Department of Energy). Plume Persistence Final Project Report; LMS/ESL/S15233; ESL-RPT-2018-02; Office of Legacy Management: Grand Junction, CO, USA, 2018. Available online: https://www.energy.gov/lm/services/applied-studies-and-technology-ast/ast-reports (accessed on 13 January 2022).
  2. Dangelmayr, M.A.; Reimus, P.W.; Wasserman, N.L.; Punsal, J.J.; Johnson, R.H.; Clay, J.T.; Stone, J.J. Laboratory column experiments and transport modeling to evaluate retardation of uranium in an aquifer downgradient of a uranium in-situ recovery site. Appl. Geochem. 2017, 80, 1–13. [Google Scholar] [CrossRef]
  3. DOE (U.S. Department of Energy). Final Site Observational Work Plan for the UMTRA Project Site at Riverton, Wyoming; U0013801; Grand Junction Office: Grand Junction, CO, USA, 1998. Available online: https://lmpublicsearch.lm.doe.gov/SitePages/default.aspx?sitename=Riverton (accessed on 13 January 2022).
  4. DOE (U.S. Department of Energy). Monticello Mill Tailings Site, Operable Unit III, Interim Remedial Action Progress Report, July 1999–July 2000; GJO-200C163-TAR; Grand Junction Office: Grand Junction, CO, USA, 2000.
  5. DOE (U.S. Department of Energy). Final Report of the Decontamination and Decommissioning of the Exterior Land Areas at the Grand Junction Projects Office Facility; DOE/ID/12584-220; GJPO-GJ-13; Grand Junction Office: Grand Junction, CO, USA, 1995.
  6. DOE (U.S. Department of Energy). Final Remedial Investigation/Feasibility Study for the U.S. Department of Energy Grand Junction (Colorado) Projects Office Facility; DOE/ID/12584-16; UNC-GJ-GRAP-1; Grand Junction Office: Grand Junction, CO, USA, 1989.
  7. DOE (U.S. Department of Energy). Monticello Mill Tailings Site, Operable Unit III, Remedial Investigation; GJO-97-6-TAR; Grand Junction Office: Grand Junction, CO, USA, 1998.
  8. DOE (U.S. Department of Energy). 2015 Advanced Site Investigation and Monitoring Report Riverton, Wyoming, Processing Site; LMS/RVT/S14148; Office of Legacy Management: Grand Junction, CO, USA, 2016. Available online: https://lmpublicsearch.lm.doe.gov/SitePages/default.aspx?sitename=Riverton (accessed on 13 January 2022).
  9. DOE (U.S. Department of Energy). Monticello Mill Tailings Site, Operable Unit III, Geochemical Conceptual Site Model Update; LMS/MNT/S26486; Office of Legacy Management: Grand Junction, CO, USA, 2020. Available online: https://lmpublicsearch.lm.doe.gov/SitePages/default.aspx?sitename=Monticello (accessed on 13 January 2022).
  10. Dam, W.L.; Campbell, S.; Johnson, R.H.; Looney, B.B.; Denham, M.E.; Eddy-Dilek, C.A.; Babits, S.J. Refining the site conceptual model at a former uranium mill site in Riverton, Wyoming, USA. Environ. Earth Sci. 2015, 74, 7255–7265. [Google Scholar] [CrossRef] [Green Version]
  11. DOE (U.S. Department of Energy). Fact Sheet for the Grand Junction, CO, Site; Office of Legacy Management: Grand Junction, CO, USA, 2020. Available online: https://www.energy.gov/lm/articles/grand-junction-colorado-site-fact-sheet (accessed on 13 January 2022).
  12. DOE (U.S. Department of Energy). Long-Term Surveillance and Maintenance Plan for the Grand Junction, Colorado, Site; LMS/GJT/S02013-1.0; Office of Legacy Management: Grand Junction, CO, USA, 2021.
  13. Johnson, R.H.; Hall, S.M.; Tigar, A.D. Using Fission-Track Radiography Coupled with Scanning Electron Microscopy for Efficient Identification of Solid-Phase Uranium Mineralogy at a Former Uranium Pilot Mill (Grand Junction, Colorado). Geosciences 2021, 11, 294. [Google Scholar] [CrossRef]
  14. DOE (U.S. Department of Energy). Sediment Sampling and Analysis Report for the Grand Junction, Colorado, Office Facility; GJO–2002-288-TAR; Grand Junction Office: Grand Junction, CO, USA, 2002.
  15. Paradis, C.J.; Johnson, R.H.; Tigar, A.D.; Sauer, K.B.; Marina, O.C.; Reimus, P.W. Field experiments of surface water to groundwater recharge to characterize the mobility of uranium and vanadium at a former mill tailing site. J. Contam. Hydrol. 2020, 229, 103581. [Google Scholar] [CrossRef] [PubMed]
  16. DOE (U.S. Department of Energy). Environmental Sciences Laboratory Procedures Manual; LMS/PRO/S04343-5.0; Office of Legacy Management: Grand Junction, CO, USA, 2021.
  17. Parkhurst, D.L.; Appelo, C.A.J. Description of Input and Examples for PHREEQC Version 3: A Computer Program for Speciation, Batch-Reaction, One-Dimensional Transport, and Inverse Geochemical Calculations. US Geol. Surv. Tech. Methods 2013, 6, 497. Available online: https://pubs.usgs.gov/tm/06/a43/ (accessed on 13 January 2022).
  18. Davis, J.D.; Meece, D.E.; Kohler, M.; Curtis, G.P. Approaches to surface complexation modeling of uranium (VI) adsorption on aquifer sediments. Geochim. Cosmochim. Acta 2004, 68, 3621–3641. [Google Scholar] [CrossRef]
  19. Johnson, R.H.; Truax, R.A.; Lankford, D.A.; Stone, J.J. Sorption Testing and Generalized Composite Surface Complexation Models for Determining Uranium Sorption Parameters at a Proposed Uranium in Situ Recovery Site. Mine Water Environ. 2016, 35, 435–446. [Google Scholar] [CrossRef]
  20. Guillaumont, R.; Fanghanel, T.; Fuger, J.; Grenthe, I.; Neck, V.; Palmer, D.; Rand, M.H. Update on the Chemical Thermodynamics of Uranium, Neptunium, Plutonium, Americium and Technetium. In Chemical Thermodynamics; OECD Nuclear Energy Agency, Elsevier Science: Amsterdam, The Netherlands, 2003; Volume 5. [Google Scholar]
  21. Dong, W.; Brooks, S.C. Determination of the Formation Constants of Ternary Complexes of Uranyl and Carbonate with Alkaline Earth Metals (Mg2+, Ca2+, Sr2+, and Ba2+) Using Anion Exchange Method. Environ. Sci. Technol. 2006, 40, 4689–4695. [Google Scholar] [CrossRef]
  22. Sun, Y.; Li, Y. Application of surface complexation modeling on adsorption of uranium at water-solid interface: A review. Environ. Pollut. 2021, 278, 116861. [Google Scholar] [CrossRef] [PubMed]
  23. Doherty, J. Calibration and Uncertainty Analysis for Complex Environmental Models, PEST: Complete Theory and What It Means for Modeling the Real World; Watermark Numerical Computing: Brisbane, Australia, 2015; Available online: https://pesthomepage.org/pest-book (accessed on 13 January 2022).
Figure 1. GJO site with coring locations, existing wells, and former contamination areas. River is flowing northward, and the side channel is an irrigation ditch.
Minerals 12 00438 g001
Figure 2. GJAST-14, -15 and -20 (locations in Figure 1) uranium concentrations with depth (National Geodetic Vertical Datum of 1929) for 5% nitric acid extraction. Typical water table for all three locations is 1389 m. Original data are from [1].
Minerals 12 00438 g002
Figure 3. Zoomed-in image from Figure 1 around well 8-4S showing additional coring locations that were used for sediment compositing. Wells were completed in these coring locations for subsequent tracer testing.
Minerals 12 00438 g003
Figure 4. Effluent uranium concentrations for columns with VZ solids and DI or Gunnison River influents. Vertical lines indicate influent switches to underlying groundwater and dashed horizontal lines indicate influent groundwater uranium concentrations. Uranium in DI and Gunnison River water was 3 µg/L or less.
Minerals 12 00438 g004
Figure 5. Effluent calcium, alkalinity, and uranium concentrations in VZ columns for PVs 1 through 14. Dashed horizontal lines indicate influent Gunnison River water concentrations for calcium and alkalinity. Uranium in DI and Gunnison River water was 3 µg/L or less.
Minerals 12 00438 g005
Figure 6. Effluent calcium, alkalinity, and uranium concentrations in VZ columns for PVs after the initial DI or river water influents. The data for PV 0 are the effluent concentrations from DI or river-water influents in the PV just before the switch to a groundwater influent. Colored horizontal lines correspond to the groundwater influent concentrations (blue = well 106, red = well 110, and green = well 120).
Minerals 12 00438 g006
Figure 7. Modeled calcium, alkalinity, and uranium concentrations in columns 15 and 16 compared to measured values. Calcium and alkalinity were controlled by setting the calcite, carbon dioxide, and gypsum SI equal to values determined from the effluent. Additional model parameters included cation exchange and uranium sorption. Modeling was completed in batch mode, so model results are only reported at the specified PV.
Minerals 12 00438 g007
Figure 8. Effluent chloride, calcium, alkalinity, and uranium concentrations in saturated-zone columns (note that the PV 1 concentration for chloride in column 20 was 360 mg/L, which was not plotted due to scaling issues).
Minerals 12 00438 g008
Figure 9. Representative saturated-zone columns with measured versus modeled effluent uranium concentrations and calculated Kd values (initial solid-phase uranium values from Table 3). L/kg = Liters of water per kilogram of sediment; note variable scales between columns.
Minerals 12 00438 g009
Table 1. Column-testing summary.
ColumnSolid PhaseInfluent Water SeriesStop FlowContinuous FlowDescription
1S&G Composite106/GR/106/6-2NX Stop-flow column to compare with continuous-flow column 7
2100 Series S&G106/GR/106/6-2NX Stop-flow column to compare with continuous-flow column 11
3S&G Composite110/GR/110/6-2NX Stop-flow column to compare with continuous-flow column 8
4110 Series S&G110/GR/110/6-2NX Stop-flow column to compare with continuous-flow column 12
5S&G Composite120/GR/120/6-2NX Stop-flow column to compare with continuous-flow column 9
6S&G Composite121/GR/121/6-2NX Stop-flow column to compare with continuous-flow column 10
7S&G Composite106/GR/106/6-2N XComposite solid phase with well 106 influent water
8S&G Composite110/GR/110/6-2N XComposite solid phase with well 110 influent water
9S&G Composite120/GR/120/6-2N XComposite solid phase with well 120 influent water
10S&G Composite121/GR/121/6-2N XComposite solid phase with well 121 influent water
11100-Series S&G106/GR/106/6-2N X100-series S&G solid phase with well 106 influent water
12110-Series S&G110/GR/110/6-2N X110-series S&G solid phase with well 110 influent water
13100-Series VZ DI/106/DIX 100-series VZ with DI influent
14100-Series VZGR/106/GRX 100-series VZ with river influent
15110-Series VZDI/110/DIX 110-series VZ with DI influent
16110-Series VZGR/110/GRX 110-series VZ with river influent
17120-Series VZDI/120/DIX 120-series VZ with DI influent
18120-Series VZGR/120/GRX 120-series VZ with river influent
19120-Series S&G120/GR/120/6-2NX Stop-flow column to compare with continuous-flow column 20
20120-Series S&G120/GR/120/6-2N X120 S&G solid phase with well 120 influent water
S&G = sand and gravel, VZ = vadose zone, GR = Gunnison River water, DI = deionized water.
Table 2. Summary of solid-phase uranium concentrations for the VZ columns.
DescriptionColumn NumberUranium, 5% Nitric Acid Extraction, Precolumn mg/kgRemaining Uranium, Calculated from Effluent, at 13 PVs mg/kgRemaining Uranium, Calculated from Effluent, Postcolumn mg/kgRemaining Uranium, 5% Nitric Acid Extraction, Postcolumn mg/kg
100-series VZ solids, DI influent130.940.491.00.96
100-series VZ solids, river influent140.940.401.11.0
110-series VZ solids, DI influent154.23.11.71.5
110-series VZ solids, river influent164.21.82.11.8
120-series VZ solids, DI influent173.83.31.82.3
120-series VZ solids, river influent183.82.42.82.5
Note: PV 13 was used for solid-phase uranium calculations instead of PV 14, highlighted in Figure 4, because the switch to the groundwater influent occurred after PV 13. Thus, the effluent in PV 14 was still representative of the DI or river-water influent, but the solid phase for PV 14 was in contact with the groundwater influent.
Table 3. Summary of saturated-zone columns with influent uranium concentrations and solid-phase uranium concentrations before and after completion of column.
DescriptionColumn NumberUranium, Influent Water µg/LUranium, 5% Nitric Extraction, Precolumn mg/kgRemaining Uranium, Calculated from Effluent, Postcolumn mg/kgRemaining Uranium, 5% Nitric Extraction, Postcolumn mg/kg
S&G Composite—10672201.00.690.82
S&G Composite—11082901.00.690.69
S&G Composite—12096601.00.700.80
S&G Composite—121107501.00.790.83
110 Series S&G—110122900.590.420.46
100 Series S&G—106112101.51.11.0
120 Series S&G—120207203.92.52.3
Gunnison River water for columns 7–9n/a7.2n/an/an/a
Gunnison River water for columns 10–12n/a7.4n/an/an/a
Gunnison River water for column 20n/a3.1n/an/an/a
6-2N groundwater for columns 7–9n/a86n/an/an/a
6-2N groundwater for columns 10–12n/a87n/an/an/a
6-2N groundwater for column 20n/a92n/an/an/a
Note: Ending number in the column descriptions after the “–” indicates well water used for the initial column influent. Column 12 is listed before column 11 to keep the order by increasing solid-phase uranium. n/a = not applicable.
Table 4. Summary of final PHREEQC parameter values for the saturated zone columns.
DescriptionColumn NumberPHREEQC Strong Sorption Site Density (GC_s) moles/kg waterPHREEQC Super-Strong Sorption Site Density (GC_ss) moles/kg waterMeasured Kd at Last PV before River Influent L/kg
S&G Composite—10673.0 × 10−32.0 × 10−43.4
S&G Composite—11083.5 × 10−39.5 × 10−53.0
S&G Composite—12091.5 × 10−32.0 × 10−41.5
S&G Composite—121101.1 × 10−31.0 × 10−41.6
110 Series S&G—110121.6 × 10−31.0 × 10−41.7
100 Series S&G—106111.0 × 10−32.9 × 10−45.9
120 Series S&G—120201.6 × 10−31.5 × 10−44.9
Publisher’s Note: MDPI stays neutral with regard to jurisdictional claims in published maps and institutional affiliations.

