Abstract
Single pulse, solid-state 29Si nuclear magnetic resonance (NMR) spectroscopy offers an additional method of characterisation of opal-A and opal-CT through spin-lattice (T1) relaxometry. Opal T1 relaxation is characterised by stretched exponential (Weibull) function represented by scale (speed of relaxation) and shape (form of the curve) parameters. Relaxation is at least an order of magnitude faster than for silica glass and quartz, with Q3 (silanol) usually faster than Q4 (fully substituted silicates). 95% relaxation (Q4) is achieved for some Australian seam opals after 50 s though other samples of opal-AG may take 4000 s, while some figures for opal-AN are over 10,000 s. Enhancement is probably mostly due to the presence of water/silanol though the presence of paramagnetic metal ions and molecular motion may also contribute. Shape factors for opal-AG (0.5) and opal-AN (0.7) are significantly different, consistent with varying water and silanol environments, possibly reflecting differences in formation conditions. Opal-CT samples show a trend of shape factors from 0.45 to 0.75 correlated to relaxation rate. Peak position, scale and shape parameter, and Q3 to Q4 ratios offer further differentiating feature to separate opal-AG and opal-AN from other forms of opaline silica. T1 relaxation measurement may have a role for provenance verification. In addition, definitively determined Q3/Q4 ratios are in the range 0.1 to 0.4 for opal-AG but considerably lower for opal-AN and opal-CT.
Keywords:
opal; hyalite; geyserite; silanol; solid-state NMR; silicon NMR; relaxation time; provenance 1. Introduction
Opal [1,2] is a generic term applied to commonly-found and naturally-formed hydrated silicas which lack the regular crystalline structure of quartz, moganite, cristobalite or tridymite [3]. X-ray powder diffraction (XRD) has been the primary method of classification [2] for over 50 years allowing delineation of opal-A (amorphous) comprising opal-AG (gel) and opal-AN (network, also known as hyalite), opal-CT (cristobalite/tridymite) and opal-C (cristobalite). Typically, XRD peaks are broad in all cases, particularly for opal-A [2,4,5,6,7,8,9], suggesting a disordered “paracrystalline” environment. Other variability, such as in the amount of molecular water [7,10,11,12,13], trace elements [14,15,16,17,18,19,20,21,22] and the mixture of silanols (Q3 site with one oxygen as a silanol [23,24,25] with the remainder bridged to other silicon atoms) with fully substituted (Q4 site all Si-O-Si bridged) species leads to a consensus that opal is not a true mineral. Despite extensive research, the structures of opal-A and opal-CT remain unresolved [3,12,26,27]. Opal-C shows similarities to cristobalite [2].
In terms of genesis, opal-AG primarily forms from ground waters associated with sedimentary rocks. Isotopic analysis of isotope signatures give temperature estimates below 45 °C [28]. “Play of colour” (POC) opal-CT is formed from low temperature hydrothermal fluids associated with volcanism while isotopic 18O signatures and fluid inclusion studies give a range of temperatures from below 45 °C up to 190 °C [16,28,29,30]. Opal-AN (hyalite) is also associated with volcanic rocks, but is thought to form by vapor deposition from supercritical aqueous fluids under pressure at temperatures up to 400 °C [31]. This higher temperature of formation is consistent with lower water content than other opals with much believed to be present in the form of fluid inclusions. Opal-CT may deposit under ambient seepage [32] though some may be formed under volcanic conditions [28,33]. It is also proposed that there is a series of diagenetic transformations [12,34,35,36,37,38,39,40] from opal-AG through opal-CT to quartz and/or moganite. Opal-AN is not involved in this sequence.
We have recently undertaken a thorough re-examination of opal, using over 200 discrete specimens, both to investigate if those samples obtained from newer locations, such as Ethiopia and Madagascar, conform to the accepted classification [9] and to see if advanced modern techniques, such as specular and diffuse reflectance IR [41], can provide insights into the amorphous and paracrystalloid structures of opal-A and opal-CT. Despite a seeming similarity of chemical composition, identical XRD patterns and the for most part, common Raman and IR spectra, opal-AG and opal-AN differ both visibly and morphologically under the scanning electron microscope (SEM) where opal-AG displays a pattern of spheres while opal-AN shows no structure [41]. Previous work [41] has shown that the spectroscopic differences between the opal-AG and opal-AN may originate from the Q3 rather than the Q4 centres on the basis of slight differences in the minor Raman and IR peaks [41]. Other forms of opaline silica [2], such as geyserite, show the same XRD patterns as opal-AG and opal-AN but may again differ at the Q3 focus. On the other hand, opal-CT and opal-A differ markedly in XRD patterns and Raman/IR spectra.
We now add a detailed solid-state 29Si NMR study to provide further and distinct spectroscopic insights which may access different aspects of silica chemistry to those obtained by XRD, and Raman and IR spectroscopy. The work extends previous studies of opal [9,42,43,44,45,46,47,48], silica [44,48,49,50,51,52,53,54,55] and silicates [49,56,57,58] using our well-characterized reference sample set [9,41] and thus allows correlation with other techniques. Typical 29Si NMR spectra of silicates show discrete, but not well separated pairs of peaks at −100 to −110 ppm and at −110 to −115 ppm, which have been ascribed to Q3 and Q4 centres respectively (see below). In this paper we examine single pulse (SP) 29Si NMR to determine the fundamental spin-lattice (T1) relaxation parameters and to explore trends within, and between, each opal type. The literature suggests a very long (typically thousands of seconds) spin-lattice (T1) relaxation time for silicon nuclei in glass and quartz [48,51,54,59] while aluminosilicates exhibit a range of values, up to 5000 s for nacrite [60]. However, SP spectra have been reported for opal and there is no previous indication of any specific problems arising from slow relaxation, with T1 values up to 10 s noted [42,46]. Of course, as for any study involving opal, such applicability needs to be tested against a range of types and specific specimens. The literature also suggests that as a spin-dilute [61] system, opal may follow a stretched exponential [61,62,63,64] regime (Weibull parameters) of relaxometry, as opposed to a simple exponential.
2. Materials and Methods
A wide range of opals was sourced from museum collections and recent acquisitions [9,41] with types, locations and sample description given in Appendix A. All samples have been classified by XRD [2] and none contain more than a trace of quartz. Some samples contain clearly different zones within the same piece and are marked as such. Specimens G13767, G34996 and G34997 all comprise different pieces collected from the same location. The former comprises seam opal-AG samples from Lightning Ridge, New South Wales and are identified by physical appearance. The latter two are mixed assemblages of fossilized molluscs from Coober Pedy, South Australia and have no obvious differentiating features other than species. Two samples of mussels are labelled G34996 (1) and (2), while G34997 (1), (2) and (3) refer to three examples of belemnites. One piece from G34997 showed sharp peaks in the XRD pattern due to minor clay inclusions. Possibly it derives a coating material on the fossil. There were no obvious peaks in the NMR spectrum associated with inclusions [65]. For brevity, Australian samples are classified by state (e.g., South Australia). Samples were finely ground in a tungsten carbide mortar and pestle and were stored in lightly sealed vials. For other analytical techniques involving opal, suitable quantity, and the ability to conduct destructive testing, limited the availability of samples.
Two samples were sourced from Caldes de Malavella in Catalonia, Spain and labelled “menilite” (from the Camp del Ninots [66] and popularly called “ninots”) but are opal-A by XRD, with small amounts of quartz, and are distinct from a South Australian Museum specimen labelled as from Ménilmontant in France, which is opal-CT. These show spheres under the SEM [41] but these are not regularly arranged as, for instance POC Australian opal-AG samples. We refer to these as “Spanish menilite”. Spectral evidence [41] suggest that these, geyserites (from Rotorua in New Zealand) and a sample labelled “hydrophane” opal from Dubnik in Slovakia, may be differentiated from opal-AG and opal-AN according to minor Raman peaks [41]. A sample of Gilson synthetic opal was acquired about 30 years ago by the South Australian Museum. A range of opal-CT samples covering progressively more complex XRD patterns was selected [9].
The minor and trace metal ion content of gem opals has been extensively analyzed for provenance reasons [16] or to explore diagenesis [20,21,67] while less attention has been paid to hyalites (opal-AN). Laser ablation/ion coupled plasma elemental analyses of selected samples (see Appendix B and Supplementary Materials) were conducted at Adelaide Microscopy using an Agilent 7900x (Agilent, Santa Clara, CA, USA) with attached New Wave NWR213 laser ablation system with NIST612 (primary for calibration and drift correction) and NIST614 (secondary) standards. A 10 ms dwell time was used for each spot and the calibration was undertaken every after every 15 point analyses. Results are presented as the average of at least 5 measurements in different positions. Data were processed using LADR software (Norris Scientific) and standard reference values from the GeoREM database [68]. Trace elements were quantified by normalizing to 75 weight% oxide totals (~35 weight% Si), which assumed 25 weight% H2O content in each opal. This approximation will have a minor effect on the values presented here.
NMR experiments were undertaken using a Bruker Avance III 400 MHz spectrometer (Bruker, Billerica, MA, USA) operating at 79.5 MHz for 29Si. Chemical shifts are relative to powdered DSS (sodium 3-(trimethylsilyl)propane-1-sulfonate or 2,2-dimethyl-2-silapentane-5-sulphonic acid sodium salt) at 0 ppm. Solid DSS is the current preferred external standard [69] for solid-state Si NMR rather than the liquid tetramethylsilane (TMS) which requires a sealed insert for use of a liquid. When compared DSS was found at +1.53 ppm relative to liquid TMS at 0 ppm [70]. T1 relaxation time experiments were carried out using a saturation-recovery technique with a range of recycle delays, with decoupling during acquisition, befitting the large values being determined [71]. Approximately 100 mg of finely ground opal sample was placed in a Bruker 4 mm rotor and spun at 5 kHz. 90° Pulse length was 5 μs for 29Si and acquisition times were typically 12 ms. Typically, 140–200 scans per delay were recorded giving suitable signal to noise ratio. A range of delay times spanning 0–400 s was employed. After some experimentation the delays used were 1, 2, 3, 5, 7, 10, 15, 20, 25, 35, 50, 75, 100, 200 and 400 s in addition to the zero-time value. Longer delay times are impractical as the 400 s experiment delay time experiment required almost 20 h of collection alone.
Unetched SEM images were obtained using a FEI Inspect 50 SEM (FEI, Hillsboro, ND, USA) by recording the secondary electron emission at an acceleration voltage of either 5 or 10 kV and working distances of 4 to 6 mm. Samples were sputter coated with a 2 nm layer of Pt.
All samples were measured under ambient atmospheric conditions. N2 flushing experiments were carried out using a small amount of finely ground opal sample in a sample vial placed under a blanket of nitrogen for minimum of 2–3 days. These flushed samples were transferred to the solid-state rotor using an inverted filter funnel dispensing nitrogen over the filling apparatus. Samples were then run immediately in T1 determination experiments. A rigorous freeze-thaw process was not undertaken due to concerns about the possible effect of dehydration [72] on the system.
We verified that the Weibull cumulative density function relationship, variously described as the Kohlrausch function, Williams-Watts equation or stretched exponential [61,62,63,73] Equation (1), gave the best fits for the growing development of signal with time, .
In this, is the signal at infinite time, t represents the delay time, λ represents a time related scale parameter while κ is termed the shape parameter. This shape factor defines how far removed the curve is from an exponential, with a value of 0.5 more different than 0.7. Only in the special case of κ = 1 does the curve become an exponential and Equation (1) becomes the more familiar form in Equation (2) where T1 is the conventional relaxation time. In this paper, we use the term T1 to indicate focus on the longitudinal spin-lattice relaxation process rather than the transverse T2 spin-spin process.
Initially, all samples were analyzed to ensure they followed a Weibull form by fitting each spectrum to two Gaussian functions where the same Q3 and Q4 positions and full width half maxima (FWHM) were used for each spectrum in a time-delay series. The peak areas were fitted to Equation (1) and in all cases good fits were obtained and always with κ < 1 meaning the signal rises faster than an exponential at early times and slower to asymptote to the infinite-time value. No samples showed an exponential relationship. Final κ and λ values for a sample were determined by simultaneously refitting all the spectra in the time-delay series to 10 variables: peak position, FWHM, final (infinity) signal level, and shape and scale parameters for both Q3 and Q4 components. This involved over 10,000 data points in the range −80 to −130 ppm from 1 to 400 s delay times. Scale parameters are quoted to 3 significant figures with fitting uncertainties determined from the non-linear least squares algorithm [74]. Shape parameter uncertainties are listed to two decimal places, though in many cases the uncertainty is much lower than the default minimum of ±0.01. The ratios of the final areas for the Q3 and Q4 peaks were used to estimate the respective proportions of the two components with the quoted ±0.01 uncertainty value determined to be the upper limit. Q3/Q4 ratios were determined using final () signal levels for the two peaks.
3. Results
Saturation of the 29Si NMR signal followed by a variable delay time allows the excited nuclei to return to the ground state and signal intensity to return. As a variety of behaviours was seen, we address each opal “type” in turn, using the arbitrary delineation given in Table 1 (opal-A) and Table 2 (opal-CT). Full, or mostly complete, relaxation is evidenced by a flattening of the intensity versus time curve, or minor intensity increases between delay time spectra. As can be seen (Figure 1) relaxation is largely complete after 400 s delay time for the example of opal-AG shown but is only partial for an opal-AN specimen.

Table 1.
Weibull fitting: scale parameter (λ) and shape parameter (κ) for opal-A specimens with extrapolated Q3 to Q4 ratios. One standard deviation fitting errors are given. Sources given in Appendix A.
Table 2.
Weibull fitting: scale parameter (λ) and shape parameter (κ) for opal-CT with extrapolated Q3 to Q4 ratios. One standard deviation fitting errors are given. Sources given in Appendix A.
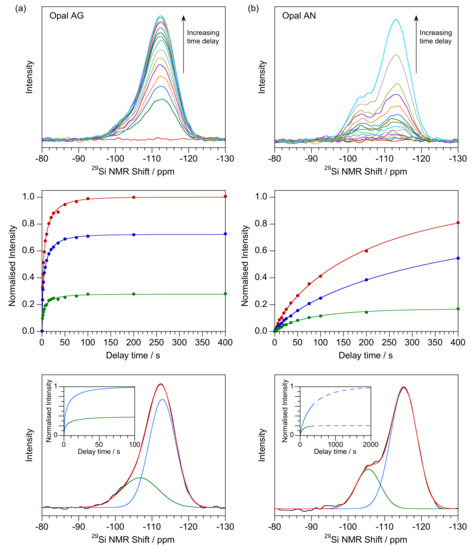
Figure 1.
Side by side comparison of (a) Opal-AG (G1442 from William Creek, South Australia) with (b) Opal-AN (T18117 from North Carolina, USA). Top: spectra after delay times of 1, 2, 3, 5, 7, 10, 15, 20, 25, 35, 50, 75, 100, 200 and 400 s (with the zero-time measurement shown in red). Middle: Time dependence of the total integrated signal (red), and Gaussian-fitted Q3 (green) and Q4 (blue) signals. The line of best fit from Weibull fitting is shown as solid line. Intensity is normalized to the fitted value of the integrated signal fit. Lower: Gaussian deconvolution of the Q3 and Q4 components for the 400 s delay time data as determined from global fit of all delay times. The time behaviour displayed in the inset is generated from the globally fitted λ and κ values and normalized to the Q4 value. Extrapolated data to longer times is shown by a dashed line.
First, we consider an Australian seam opal-AG (Figure 1a) where there is an asymmetric peak which can be interpreted as overlapping Q3 and Q4 components [46]. This asymmetry, rather than separated peaks, has been noted before [42,43]. Q3 peaks can be fitted giving values spanning −104 to −107 ppm (FWHM typically 5 ppm) with the range probably caused by the lack of a clear peak, or shoulder. In common with the other opals, the major Q4 peak is at −113 to −114 ppm (FWHM about 4 ppm). The Q3 to Q4 ratio was 0.38 and was deduced from extrapolations to infinite time (inset) and these accord with visual observation and fitting of the 400 s delay time spectra. Other samples are in the range 0.2 to 0.5. Relaxation times are relatively fast in comparison with the other opal-A samples even for other examples of opal-AG. Shape factors are routinely about 0.5, both for Q3 and Q4.
Opal-AN (Figure 1b) samples present different 29Si NMR spectra to those for opal-AG with a more separated pair of peaks, again ascribable to Q3 and Q4. The plots are however of poorer quality, possibly as a result of the slower relaxation time. Curve-fitting gives Q3 at −103 to −104 ppm (FWHM typically 4 ppm) and −113 to −114 ppm (FWHM typically 4 ppm) for Q4. Although several of the examples are only partially relaxed after 400 s delay time, the data shows a general trend to a lower ratio of Q3 to Q4 than for opal-AG, in the range 0.05 to 0.20 (Table 1). Q3 scale factors show slower relaxation than for opal-AG and scan the range of about 100 to 200 s while those for Q4 are far slower and more variable. As can be seen (Table 1) even for the fastest relaxation (T18117 from N. Carolina, USA), as shown in Figure 1b, only 60% relaxation of Q4 is achieved after 400 s delay time, with many much less. It would be impractical to gain more extensive scale factor data as the individual experimental times might run to several weeks. Thus, some of the slower Q4 scale factors should be treated as indicative only. However, the shape factors are more robust and show values of about 0.7 to 0.8 for both Q3 and Q4. For the example shown in Figure 1b, the ratio of Q3 to Q4 decreases from 0.54 after 10 s delay time, to 0.30 after 400 s and 0.20 at infinite time (see [48]) illustrating the need for extrapolated final values. This bias leads to a reliable determination of the Q3 parameters even though the percentage is low. The differences in shape factors between the opal-AG (typically 0.5) and opal-AN (typically 0.7) are consistent within each type.
Details for other examples of opal-A are given in Table 1 with some plotted in Supplementary Materials. Some of these samples show relatively short relaxation times though there is a large range of values. For instance, Queensland boulder opals and opal-AG samples from Slovakia show slower relaxation than the Australian seam opals though mostly have similar Q3 to Q4 ratios. The two examples of “Spanish menilite” (Supplementary Materials), however, relaxed very slowly and may contain low Q3 levels. Other fine, and potentially informative, detail is revealed in this work. For instance, the opalised molluscs show moderately fast relaxation but have similar parameters for Q3 and Q4 unlike other examples where the difference ranges from minor (for fast T1 relaxation) to over a factor of five (for slower relaxation). This was verified through examination of several distinct samples. Two visually distinct zones of the hydrophane example, G34775 (Supplementary Materials), show different scale parameters though similar shape values. The final extrapolated Q3 to Q4 parameter suggest a similar silica composition. The spectrum for a sample of Gilson synthetic opal (Supplementary Materials) shows clear evidence for a peak at −103 to −104 ppm (FWHM about 3–4 ppm) which is more separated than for the other opal-AG samples. Significantly, the scale and shape parameters lie between those for opal-AG and opal-AN. Curve fitting suggested a relatively low proportion of Q3, while Q4 showed slow relaxation. For reference, the XRD pattern (broad peak centered at 4.0 Å [9]), IR spectrum (wide peak at 800 cm−1 and shoulder at 550 cm−1 [41]) and Raman (broad peak 300–500 cm−1 [9]) are all consistent with opal-A.
The spectra (Figure 2) for the New Zealand geyserites, on the other hand, are more like opal-AN than opal-AG, showing more resolved Q3 and Q4 peaks with shape factors of 0.7 to 0.8. Both samples can be fitted to two peaks at −103 to −105 ppm and −113 ppm with FWHM in the range 3–5 ppm. While the Q3 to Q4 ratio in G21471 was about 0.2 it was much higher for T1665 (Table 1) though both shared the same shape parameters.
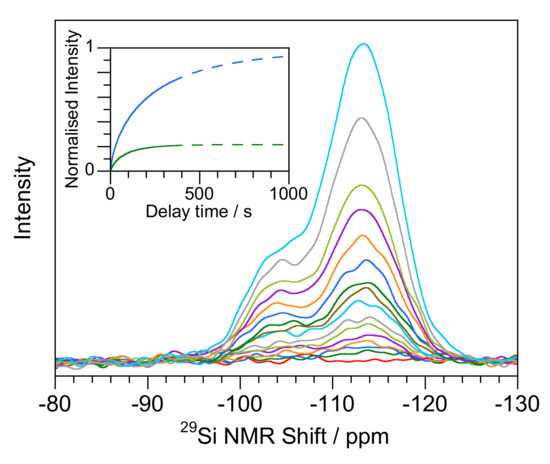
Figure 2.
(main) Evolution of signal with delay time for geyserite (G21471 from Rotorua, New Zealand). Delay times are 1, 2, 3, 5, 7, 10, 15, 20, 25, 35, 50, 75, 100, 200 and 400 s (with the zero-time measurement shown in red) (insert) calculated fitting of Q3 (green) and Q4 (blue) components using data in Table 2 scaled to Q4 maximum.
Opal-CT samples show spectra ranging from those with a prominent presumed Q3 peak (Figure 3a) to examples where the peak (Figure 3b) is minor. An example of each type has been reported previously [43,46]. Figure 3 shows the differences in fitted spectra and relaxation times between the two. Shape factors span the range between those found for opal-AG and opal-AN. Q4 data shows that relaxation is often less than 50% after 400 s delay time. The highest Q3 to Q4 ratios are only 0.15 (Table 2) for opal-CT with many much smaller. Solutions show maxima at about −104 to −105 (Q3) and −113 to −114 ppm (Q4) with FWHM of about 3 ppm for both peaks. The marginally narrower FWHM (when compared to opal-AG) for the presumed Q3 peak at around −104 ppm gives a visual appearance for G32925 more like opal-AN than opal-AG.
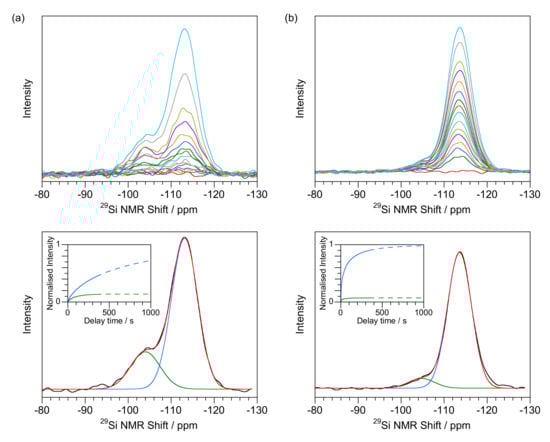
Figure 3.
Evolution of signal with delay time for opal-CT (a) with a separated Q3 peak (G32925 from Zelinograd, Qazaqstan) (b) less delineated Q3 peak (GNEW24 from Kutahuya, Turkey). Top: spectra after delay times of 1, 2, 3, 5, 7, 10, 15, 20, 25, 35, 50, 75, 100, 200 and 400 s (with the zero-time measurement shown in red). Lower: Q3 (green) and Q4 (blue) fitting for the 400 s delay time data with infinite time extrapolated data shown in inset.
Curve fitting for NMNH Eth S2 (bottle-glass brown opal-CT with POC from Ethiopia) gave what appeared to be anomalous results. The main peak was broad and asymmetric while the computed solution gave a Q3 to Q4 ratio of 0.45 with the presumed Q3 peak at −109.0 ppm (FWHM 7 ppm) with Q4 at the consistent position of −114.2 (FWHM 3 ppm). At −109 ppm, the Q3 peak position was considerably removed from other samples. The visual appearance does however suggest a high level of Q3 (see later) while the shape and scale factors seem credible.
Full curve-fitting was not successful in all cases with problems encountered for the Q3 components of GNEW05 and GNEW27. Both fitting solutions showed λ values greater than for Q4 and κ terms of about 0.4 though both with very high fitting errors. We believe that there is a trade-off between the shape and scale parameters that the fitting algorithm is unable to resolve for these minor peaks. This results in artificially high and low values for the respective terms. The Q4 terms seemed consistent though GNEW05 shows very fast relaxation. In another case, GNEW03 (opaque green sample from Mt Iyobo, Tanzania) gave an anomalous spectrum including what looked like two peaks at around −113 ppm. Combined Q3 and Q4 gave respective λ and κ values of 23 s and 0.50. XRD shows a possible minor silicate impurity at 4.45 Å which might lead to a more complex NMR spectrum.
4. Discussion
4.1. 29Si NMR Spectra of Opal
Opal spectra [42,43,44,45,46,47,48] should be interpreted in relation to well-characterized polymorphs of silica, such as coesite [50], cristobalite [43,49,50], tridymite [43,50], moganite [75], quartz [43,44,49,50,59] as well as less structurally defined materials including glass [51] and volcanic sinters [48] noting the importance of systematic referencing of chemical shifts. There is general support that the major peak in opal [42,43,44,45,46,47,48] is due to the fully silicate bridged Q4. In our work, we find that the major peaks are about 5 ppm more negative than quartz, consistent with previous work though at different absolute values probably caused by the use of external standards (we use DSS), experimental variations and differences in natural materials. We found kaolinite at −92.76 ppm and quartz (150 s delay time) at −108.64 ppm (FWHM of 1.2 ppm) relative to DSS at 0 ppm. Other authors have reported the quartz signal in the range −107.1 to −107.4 [43,44,49,50,59]. This difference is consistent with the offset value of about +1.5 ppm between DSS and TMS [70] (see before). The major peaks consistently lie in the range −113 to −114 ppm for all samples of opal-AG, opal-AN and opal-CT with little difference between type as noted before [44]. The variations in reported absolute values make any comparison of opal (this work) to previous work on silica polymorphs, such as tridymite or cristobalite, difficult. We also note the importance of conducting any comparative solid-state Si NMR study by using a clearly defined calibration in the instrument. None of the samples studied here contain evidence for cristobalite by XRD or Raman and IR spectroscopy. In addition, as will be described below, the relative proportions of Q3 and Q4 also affect the peak positions, particularly the latter.
Peaks due to silanol (Q3) in opal-A and opal-CT are expected at less negative chemical shifts than for Q4 and have been observed in varying amounts in previous work [44,45,46] usually as shoulders in SP spectra. They are also prominent in 1H-29Si cross polarization (CP) NMR spectra [44,45,46,47]. There is other spectroscopic evidence through mid-IR and mid-Raman [41] and near-IR [23,24,25] spectra which show silanol hydroxyls in addition to water. In the present work these peaks are mostly in the range −104 to −107 ppm.
We found Q3 to Q4 ratios generally in the range 0.05 to 0.3 with opal-AG showing more silanol than opal-AN and opal-CT. These figures are compatible with the 19–23% abundance of Q3 reported [45,47] through curve-fitting. However, it has been proposed that this figure may be artificially high [48] with a lower figure of 10% proposed for opal-AN and 13–15% for Yellowstone geyserites. The use of the extrapolated infinite time signal value, however, as detailed in this work, provides a novel and definitive method for estimation of this ratio. Simple calculations suggest that, for instance, a 0.3 ratio of Q3 to Q4 would equate to a weight percentage of about 3.3% “water” present as (SiO)3Si-OH HO-Si(OSi)3 (compare with (SiO)3Si-O-Si(OSi)3). Of course, free water is also present in fluid inclusions and possibly as non-structural water of hydration [7,10,23,76]. Even a low figure of 1% water all present as silanol would result in a ratio of 0.07 Q3 to Q4. Similarly, a figure of 7% water would lead to a ratio of 1:1 Q3 to Q4. Other techniques give results in this range (e.g., [12]) with values up to 16% water being reported though with no correlations between opal types.
We also note that the spectrum will be more complicated than a simple mix of single Q3 and Q4 peaks. If Q3 is present, then this is likely to cause a disruption of the silicate rings and sheets allowing geometric effects. Each Q4 SiO4 tetrahedra is linked to 4 other Si ions via bridging oxygens, as nearest cation neighbors. These Si ions are in turn linked to 3 further Si ions, so there may be 10 to 12 Si ions in the second cation coordination sphere. The number of Si in the second cation co-ordination sphere depends on the structural topology, if a 3-dimensional framework it will be 12. Different types of, and adjacent Q3 sites, would also produce subtle differences in the spectrum. Similarly, the effect of tetrahedral Al3+ [47] may also produce additional peaks if it substitutes for Si4+. Finally, both Q3 and Q4 may be subject to water proximity effects which although unlikely to have a major effect on chemical shift, will make a profound difference in the appearance of both the SP and 1H-29Si CP spectra, particularly in the relative magnitudes of the peaks. Given the relatively high level of Q3 in opal-AG this species is likely to have the most complicated spectra and may require extensive further analysis, such as CP studies, to resolve.
There is also no reason to suppose absolute structural homogeneity in opals and Q3 to Q4 ratios may vary within each opal type and even with samples taken from a single specimen. This would result in subtly different maxima for the main peaks as a result of different composition or the extent to which the Q3 and Q4 centres have relaxed. For instance, changes in peak position have been seen for silica glass with differing measurement delay times [49]. The evidence from this work, given FWHM of generally less than 4 ppm, however, is that the Q4 peaks are probably all within 1 ppm and likely will affect peak maximum to a limited extent. However, they will be impractical to resolve through curve-fitting as the peaks are likely to be very close. Multiple close peaks may however be the cause of poor fitting of some of the opal-CT samples (see above). Given the results of the present study, we propose that the Q4 peak position is unlikely to be diagnostic of opal structural type. Injudicious selection of delay time may result in misleading SP spectra, depending on the contribution of the Q3 component.
Finally, we note that despite the limitations of signal strength, delay time requirements and the need for extensive scans and instrument time, SP is probably the best method to obtain authentic, quantitative 29Si NMR spectra without artificial enhancement of any component.
4.2. T1 Relaxation
The key findings of the relaxation rate experiments are as follows. First, relaxation rates of opal are variable but are faster than for other forms of silica. Second, relaxation of 29Si in all forms of opal follows a stretched exponential relationship which can be described by scale (λ) and shape (κ) parameters. Next, there are distinct differences between the scale and shape parameters for opal-AG, opal-AN, opal-CT and other forms of opaline silica. Finally, we note that there may be consistent and discriminatory characteristics of the opal-AG samples from different sources.
While it is difficult to compare simple exponentials to Weibull parameters, we can equate the time taken for say 95% of relaxation to occur. For instance, nacrite, with an exponential relaxation time of 5 h (18,000 s) [60] will reach this level after about 55,000 s. The Q4 data in Table 1 implies that most of the Australian seam opals will be 95% relaxed after 50 s with some in as short a time as 30 s. The fastest shows a scale factor of 5 s though some samples of opal-AG are significantly slower with figures up to at least 4000 s for the “Spanish menilites”. The limited number of Slovakian opals also show slower relaxation. While some examples of opal-AN may be relatively slow (over 10,000 s) all samples studied here appear to relax faster than quartz (see Figure 2 in [59]).
After excitation, nuclei undergo relaxation to return to the ground state. This occurs through two main processes—longitudinal (spin-lattice) and transverse (spin-spin) relaxation processes with time constants designated as T1 and T2 respectively. Spin-lattice relaxation processes in solid state NMR occur via dipole-dipole interactions, chemical shift anisotropy, and molecular motion. Dipole-dipole interactions may occur between adjacent spin nuclear spins, or between nuclear spin and hydrogen nuclei, or by interaction with unpaired electrons in paramagnetic species and are governed by a 1/r6 dependency.
As 29Si is only present at 4.7% of the total nuclei then on average only 17.5% of the Si nuclei will be within two atoms of a suitable silicon for a Q4 centre to relax. In contrast, hydrogen nuclei (as either molecular water or silanol groups) would be expected to be more prevalent within the structure. In addition, paramagnetic centres present as ionic species or molecular oxygen may also be expected to assist in 29Si relaxation.
Finally, the limited motion in quartz coupled with weak 29Si-29Si dipolar coupling probably accounts for the very slow T1 times observed. The enhancement to relaxation implies access to spin-lattice relaxation mechanisms in opal that are not available for silica glass or quartz and thus relaxation increases (the scale parameter, λ, is reduced).
The major differences between quartz and opal are as follows. Quartz has a rigid and regular crystal structure exhibiting sharp peaks in XRD patterns suggesting a crystalline structure. In contrast, opal-AG and opal-AN show little obvious regularity with only a single broad peak seen [9]. While the diffraction pattern for opal-CT shows more structure [9], the peaks are still nonetheless broad. There are also chemical differences. Quartz comprises fully silicate bridged O3Si-O-SiO3 Q4 centres whereas all types of opal will include some silanol O3Si-O-H Q3 sites and different silicate topologies (see above). Opals also contain varying amounts of so-called “impurities” (Appendix B and Supplementary Materials) including cations replacing Si4+ in the matrix (e.g., Al3+ accompanied by other cations for charge balance), other metal ions (in undetermined coordination with oxygen) as well as other solutes possibly associated with opal diagenesis. These include group 2a and 2b elements such as Na+ and Mg2+. While anions are not usually measured, we noted significant amounts of phosphorus in the samples studied here, implying the presence of phosphate. Finally, molecular water may be present, probably with varying ionic strengths due to the presence of solutes. Thus, we propose that the key contributors to enhanced T1 relaxation are likely to derive from adjacent hydrogens (in water or silanol), paramagnetic metal ions and molecular motion.
To assist investigation of the enhanced relaxation, we present consolidated Q3 and Q4 data for scale factors versus shape factor (from Table 1 and Table 2) in Figure 4. Apparent is a clear trend from low shape factors and relatively fast relaxation to slower relaxation coupled with higher shape factors. Data is plotted in an alternative form in Figure 5 which compares Q3 and Q4 scale and shape terms for individual samples. While there is a possible break point at λ ≈ 50, in general there is an overall trend correlating the Q3 and Q4 scale parameters (Figure 5a) with a slope of around 1.4. Figure 5b shows a correlation of Q3 and Q4 shape factors with slope of less than unity, though with scatter. Values for Q4 are generally lower than for Q3 though are usually within 0.1.
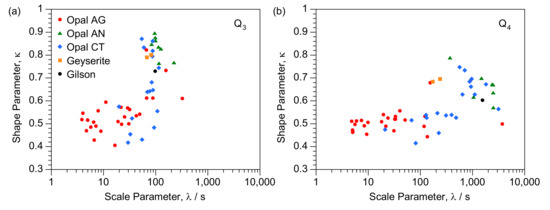
Figure 4.
Correlation of consolidated scale and shape parameters for (a) Q3 and (b) Q4 and designated with opal type.
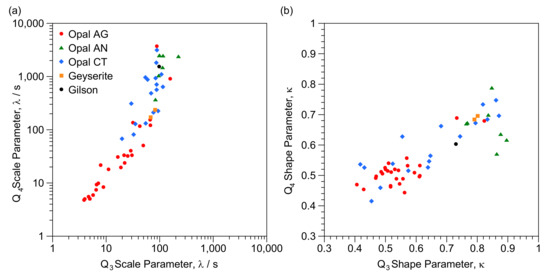
Figure 5.
Correlation of scale and shape parameters for (a) Q3 and Q4 scale parameters (b) Q3 and Q4 shape parameters and designated with opal type.
Plotting in these forms, particularly for Figure 4, allows vertical and horizontal comparisons to investigate differences between individual samples to explore the likely impact of the factors noted above, as discussed below. There are also clear zones in both Figure 4a and Figure 5a with, for instance, Australian seam opals at lower left and opal-AN at upper right.
First, we examine the influence of “metal ion impurities”. In this (see Appendix B and Supplementary Materials) and previous work [12,14,16,20,21,22,77] it has been demonstrated that many transition metal, f-block and heavy metal elements may be present. We note, however, that there is no compelling case to invoke the presence of such ions to effect relaxation rate enhancement, at least for opal-A. Gilson synthetic opal shows properties similar to opal-A including enhanced relaxation. The Gilson analogue is manufactured by hydrolysis of tetraethoxylsilane and contains no additional metal ions.
A significant difference between opal-AG and opal-AN lies in the much lower concentration of [Al3+] for hyalites, as shown in this work (Appendix B). A wide range of [Al3+] has been reported for gem opals [16,30,78]. Al3+ may contribute to spin-diffusion via a 29Si-O-27Al bridge. Enough 27Al3+ may be present to be detected by NMR in opal-AG and opal-CT [47] and follows tetrahedral geometry suggesting incorporation into the silicate matrix which may also cause structural effects. While opal-AG samples show faster relaxation than opal-AN we note that G32740 (opal-AN from Czechia with 8.1 ppm [Al]) has more Al3+ than OOC10 (opal-AN from Lesvos, Greece with 0.46 ppm [Al]) though both share similar Q3 and Q4 parameters.
Next, we examine the enhancement effected by transition metals, for instance Fen+ [71], whose concentration varies from below the detection limit to 1000 ppm for some examples of opal-AG. A value of 17500 ppm was seen for GNEW03 (from Tanzania). This showed a relatively rapid combined Q3 and Q4 scale parameter of 23 s (see above). This high level of [Fen+] [16,77] has been noted before for Australian seam opals from the Great Artesian Basin (GAB). For instance, the three samples from the dark and black [79] opal site of Lightning Ridge, Australia, all relax very quickly though, possibly contrary to expectation, the opaque blue-grey sample (T2233) relaxes more slowly than two other examples (G13767) which appear as pale yellow and orange glasses. However, G32740 (6.3 ppm) contains more Fen+ than OOC10 (<0.1 ppm) but again shows similar relaxation parameters.
Some samples of opal-AN are fluorescent due to the presence of UO22+ species [80,81]. OOC10, T18117 (from N. Carolina, USA) and T18511 (Arkaroola, Australia) all contain higher levels of uranium (typically >15 ppm) than the other samples (Appendix B) and while all are among the fastest to relax, they have similar rate for the Q3 component to that for G32740 which contains very little (<1 ppm). The last, however, contains the highest level of [Fen+] of the samples studied here though and much less than those of the Australian opal-AG samples.
This discussion is, of course, complicated by lack of knowledge of where such ions are located. For instance, it remains to be seen if Fen+ replace Si4+ in the opal matrix or if it is randomly located in aqueous residues between zones of silica. No convincing case can be made for an overriding increase in relaxation caused by such ions though minor effects may be expected, though probably difficult to ascribe to any particular element.
Similarly, the presence of molecular oxygen is likely to be a major source of enhancement. The nitrogen flushing experiments (Table 1) of the opal-AG samples of G1401 and G8608 show no obvious major effects with parameters associated with the major Q4 component being similar. The differences seen for the minor Q3 peaks probably just reflect a shallow fitting minimum with a trade-off between λ and κ (see above).
The amount and location of hydrogen nuclei in water/silanol is however likely to be the most fruitful source of both enhanced relaxation and differentiation. It has been reported previously [51] that T1 reduces from 11,000 to 7000 s in going from low to high water content silica glass, though the location of the water was not determined. There are a number of possible sites to provide the necessary hydrogens to effect dipole-dipole interaction. This may occur via adjacent water molecules or through Q3 centres via 29Si-O-1H dipole interactions. Q3 peaks in MQ silicone co-polymers have faster relaxation rates than for Q4 due to the proximity of hydroxyl to silicon [82]. The question of the location and level of water in opal is however a difficult topic [10,13,72] though the presence of both silanol and free water has been demonstrated [47,52,58,83]. All samples studied in this study show a complicated 1H NMR spectrum comprising (to be reported elsewhere) peaks attributable to different water and silanol chemical environments though with differences between opal types. An example is given by the two experiments involving different zones of the hydrophane opal G34475 (Supplementary Materials). Both contain same ratio of Q3 to Q4 while differences in water level are probably the cause of the observed dissimilarity under the SEM (see Figure 16 in [41]). As the opaque zone relaxes more slowly, a proposition is that this contains less water, or that it is located farther from the silicon centres.
Finally, we consider molecular motion. This is likely to occur through two mechanisms: local motion relating to the silica tetrahedra, akin to rotations, and vibrations and generic translational thermal mobility. The latter may be enhanced by the physical effect of spinning in the NMR probe which may be enhanced by friction-based heating. Given that opal-AG and opal-AN have the same XRD patterns then the bulk structures are unlikely to be the source of any differences in molecular motion. Nevertheless, we expect that “lattice” motion will be different for each opal type though definitive evidence is lacking.
The most striking observation in the current work is the difference in shape parameter, particularly between opal-AG and opal-AN. The literature, however, is sparse with only limited data available for the “spin-dilute” 29Si system. The dominance of CP studies has also rendered this as a neglected area for opal. A shape parameter of less than 1, has been reported before for 29Si NMR with values in the range 0.5 to 1 for silicon carbide [61] and a figure of 0.5 for a volcano derived silica coating [48]. One study of silica glass gave a better fit with a shape factor of 0.9 rather than as an exponential [54] (κ = 1). It has been proposed that a shape factor of 0.5 is due to relaxation via random (three dimensional) distribution of paramagnetic centres [48] with no contribution from spin-diffusion [63], based on earlier theoretical studies [84,85]. Values of 0.5–1.0 have, however, been described and may be due to non-random distribution of paramagnetic centres [48,61], partial contribution of spin-diffusion [63,86] or degree of glassiness [87].
We hypothesize that the major differences in scale and shape factor between, for instance, opal-AG and opal-AN are mostly due to the amount and distribution of water/silanol and to a lesser extent other metal ions. Shape factor values of 0.5 will occur where there is an even and uniform distribution causing a three-dimensional arrangement with equal probabilities of encountering paramagnetic centres in all directions. Higher shape factors values would arise if there is localization of water, silanol or the “impurity” metal ions. For instance, water may be collected as micro-inclusions. Similarly, Q3 silanols may be grouped (rather than uniformly distributed) and associated with hydrogen-bonded water, which may contain metal ions as solutes. Consistent with this is the observation that the largest values for κ occur for Q3 (Figure 4) while the spread of values suggest greater variability for these sites in comparison with Q4. Q2 (gem-silanol) may be present and while there is little evidence for substantial amounts in the present work (peak in the range −90 to −95 ppm) [46] their effect, if present, may be considerably more than Q3 and Q4. Q4 sites are likely to be remote from such centres and are thus more subject to a general bulk effect. In contrast, it is likely that the amount, rather than the distribution, of these paramagnetic centres that influences the scale factor. Those samples that show very slow Q4 relaxation are presumably very remote from the water and metal ion sites. Compounded with the 1/r6 law, this is likely to be a very variable feature, as observed for opal-AN.
4.3. Implications for the Formation and Characterisation of Opal-A
Opal-AG and opal-AN show clear differences both in the SP spectrum and in the T1 relaxation parameters (Table 1). This is possibly to be expected as the two have very distinct microstructures when viewed by SEM and from what is known about the conditions of formation. What is surprising, however, is the magnitude of the differences, particularly when compared with the minor differences seen in the Raman and IR spectra [41].
Chemical aspects of the formation of silica in general [88] and particularly precious opal-AG have been a topic of interest for many years though as yet only a generic mechanism may be proposed [20,32,34,67,89,90]. Irrespective of the source of water, or the nature of the host rock, it is proposed that a saturated (or near saturated) silicic acid solution is generated by aqueous action on silicate rich rocks [20,32,34,67,89,90]. This liquor is sequestrated in gaps in weathered terrain and slowly forms the necessary silica spheres to effect Bragg diffraction in POC opal. Optimum conditions for POC creation, such as temperature, pH, other metal species, ionic strength and the presence of nucleating centres are open to conjecture though a reasonable proposition is that formation should be slow allowing consistent geometries of similarly sized spheres to deposit. It is probable that slow deposition from a colloidal suspension of variable viscosity results in a uniform three-dimensional arrangement. This would be consistent with the relatively fast relaxation seen for the opal-AG samples and shape factors of about 0.5. Indeed, these seem typical for the seam opal associated with sedimentary rocks covering the southern Bulldog Shale region of the GAB (from South Australia and New South Wales) [90] comprising the current and recent Australian mining centres of Andamooka, Coober Pedy, Lambina, Lightning Ridge, Mintabie and White Cliffs.
Examination of the data in Table 1 suggests that T1 relaxation may provide insights into the formation conditions, or at least correlate with conditions of deposition, for instance affecting the speed of deposition. The two examples of Winton-formation boulder opal also show slower T1 relaxation, which might be linked to formation in ironstone rather than kaolin or clay as in the other major opal fields in Australia. The shape parameters are also slightly higher than for the Australian seam opals though the sample size is small. Fossilized Cretaceous (Aptian) molluscs (probably Eyrena and Peratobelus) from Coober Pedy show slower relaxation and, interestingly, similar Q3 and Q4 parameters which might be a consequence of replacement of calcite or aragonite and a distinct different formation process to that for seam opals.
The Slovakian samples probably formed under a pressure/temperature condition similar to those of the Australian seam opals, but in different rock types [28] and have slightly slower T1 relaxation values. Figure 6 (G34280 from Cerenvenica in Slovakia) shows zones both of regular lines of spheres and irregular arrays similar to that seen for other samples from these sites [28] and for a hydrophane (G34475) [41]. G34280 itself shows extreme values for the Q3 to Q4 ratio and the highest shape factor values, though all over indications are that it should be classified as opal-AG. It is possible that the high level of Q3 effects major structural change. The example of a hydrophane also shows complex SEM images [41] and while the optically distinct zones show different scale factors, both the shape factors and the calculated (infinite time) Q3 to Q4 ratios are the same (Supplementary Materials). This would be consistent with the reversible ability to take up water and thus provide the necessary adjacent hydrogen nuclei (faster relaxation) without any chemical change to the silica matrix itself.
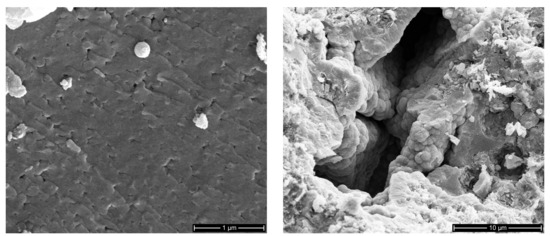
Figure 6.
SEM images of freshly ground G34280 (opal-AG from Cerenvenica, Slovakia) showing mixed zones.
The examples of the chert-based “Spanish menilites” are again distinct with slow Q3 and very slow Q4 T1 relaxation. SEM images [41,66] also show irregular assemblages of silica spheres. A biogenic-derived formation mechanism involving diatomite has been proposed [66]. Very different relaxation characteristics are thus not surprising as they may not be “typical” examples of opal-AG as from Australia or Slovakia. The slightly higher κ values for the Q3 centres may imply a marginally different silanol environment to for instance seam opals. In contrast, an opal-CT specimen from the same site (GNEW09) shows parameters which seem more typical for the type with a Q4 scale parameter of 566 s. The Q3 to Q4 ratio of 0.13, however, was similar to the 0.15 found for GNEW01 (Table 1). The very high shape for parameter for GNEW09 (0.86) for Q3 also suggests similar origins as has been suggested for this site [66].
Opal-AN, on the other hand, forms at higher temperature by vapor deposition [31] and has undergone significantly rapid cooling and thus potential fractionation of water/silanol, possibly with formation of aqueous micro-inclusions and formation of pockets of high Q3 density. The lower ratio of Q3 to Q4 in opal-AN when compared with opal-AG is demonstrated by the extrapolation of the final peak areas.
The two samples of geyserite show a shape factor of 0.7 which would be consistent with the higher formation temperature [12], while the NMR spectra are more like those for opal-AN rather than opal-AG.
Data for the Gilson synthetic opal is also enlightening. We have demonstrated a characteristic set of parameters such as low Q3 to Q4 ratio and a very slow Q4 relaxation, at least for the sample studied. The relatively fast relaxation of Q3 implies the presence of accessible water in the matrix while the high shape factor implies clusters of incomplete hydrolysis. T1 relaxation potentially provides ready differentiation from Australian seam opals.
We also note a continuing problem with the term “opal”. While opal-A, opal-CT and opal-C are accepted overarching terms, this may be misleading since it implies some sort of similarity between the various forms. XRD analysis provides a delineating structural, rather than paragenetic classification, for instance of opal-A. This is, of course, well known for opal-AN through major differences under the SEM. The NMR results in this work provide further support for structural differentiation. Thus, hyalite may prove to be a better term rather than opal-AN, even noting spectroscopic similarities through some techniques with opal-AG. The remaining types of opal-A (Table 1) show common features such as the presence of silica spheres though in our experience we find these show differing levels of regularity (see this paper and previous images of unetched samples [9,41]). The T1 relaxation features may thus provide a further delineation. We suggest that any examination of new sources of material, or a re-interpretation of old sites, should include a 29Si SP NMR spectrum and a T1 relaxation experiment to build up a corpus of reference material. For instance, other examples of authenticated “white or milky opals” [16] from sites such as Honduras [16,91], Brazil [16], Mexico [28], Madagascar [8] and the USA [33] may prove to have distinct characteristics.
T1 studies may also provide evidence of provenance. For instance, in this work the Australian seam opals showed distinctively faster relaxation when compared to those from other Australian sites, such as Queensland boulder opals and opalised fossils. Further work will be required to see if trends appear between the different regions (e.g., Coober Pedy versus Lightning Ridge) and within localities (e.g., the different fields at Coober Pedy). Examination of POC types, such as “pinfire” or “harlequin” may also provide insights. It is noted that only about 100 mg of sample is required for this testing, though the measurement is effectively “destructive”. Any observed trends may provide insights into formation conditions and possible dating of the deposits. This may assist in further exploration. Finally, we note the distinctive results of the opalised fossils which merits further and directed study covering other organisms (e.g., marine reptiles) and sites (e.g., comparison of Coober Pedy and Lightning Ridge).
4.4. Implications for Characterisation of Opal-CT
Opal-CT spectra and relaxation properties are similar in nature to those for opal-AG and opal-AN with all showing peaks that can be assigned to Q3 and Q4. A major difference shown by 29Si SP NMR is that, in general, opal-CT samples show lower proportions of Q3 than opal-AG as judged by the presumed Q3 peak at around −104 ppm. In addition, shape and scale parameters span a larger range. Several features may be exploited from this study, as follows.
First, we examine the “boundary” between opal-AG and opal-CT. This notion is supported by transitional XRD forms [9] which show a narrower (than for opal-AG) major XRD pattern peak as well as a small peak at about 2.5 Å for all samples of opal-CT. This trend continues as XRD patterns of opal-CT can be arranged according to increasing structure in the XRD patterns (see Figure 5 in [9]) with clear differentiation of the peak at 4.1 and 4.3 Å [9]. Figure 4 and Figure 5 might be interpreted to suggest a continuum of shape and scale parameters linking opal-AG and opal-CT. However, the trends are misleading as a further implication would be that opal-CT bridges the gap between opal-AG and opal-AN, though consideration of what is known about formation conditions make this untenable. However, both Q3 to Q4 ratios (Table 1 and Table 2) and the visible appearance of the spectra (Figure 1b and Figure 3) show more similarities of opal-CT to opal-AN than to opal-AG.
Figure 7a shows four representative XRD patterns spanning the proposed boundary with corresponding 29Si NMR spectra in Figure 7b. Little attention should be paid to the major peak positions in the NMR spectra as they are for a fixed delay time with variable contribution from Q3 and Q4. The lower (G1442) and upper (GNEW24) plots show NMR spectra typical for opal-AG and opal-CT respectively. The transitional form (orange plot, G14581) can be fitted to respective scale and shape parameters of 10.5 ± 0.1 s/0.52 ± 0.01 (Q3) and 22.6 ± 0.1 s/0.47 ± 0.01 (Q4) with an extrapolated Q3 to Q4 ratio of 0.26. This is typical for Australian seam opal and may be expected as the sample originates in Andamooka, South Australia and has POC. NMNH Eth S2 (green plot, from Ethiopia), however, appears anomalous with the NMR spectrum showing significant amounts of Q3 resulting in an asymmetric main peak more like opal-AG than opal-CT. The XRD pattern, however, clearly defines this as opal-CT with the peak at 2.5 Å.
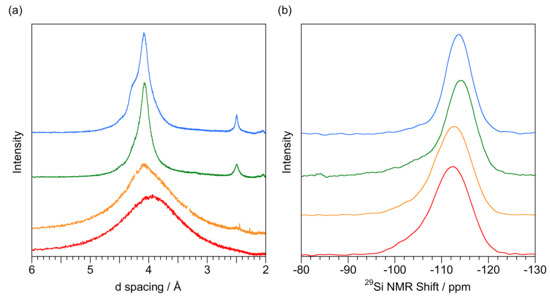
Figure 7.
Comparison of opals at the presumed AG to CT boundary (a) XRD patterns (b) 400 s delay time 29Si SP NMR spectrum for G1401 (opal-AG from White Cliffs NSW, with POC, red), G14581 (opal-AG to opal-CT transitional form from Andamooka, South Australia, orange), NMNH Eth S2 (opal-CT from Mezezo, Ethiopia with POC, green), GNEW24 (opal-CT from Kutahuya, Turkey with no POC, blue). Units are Å (XRD) and ppm (NMR). Major quartz peaks have been deleted from the XRD pattern of G14581.
As discussed above, we were also unable to determine discrete Q3 fitting data for two other samples of opal-CT (GNEW05 and GNEW27), both with relatively simple XRD patterns (as for NMNH Eth S2). Our interpretation is that the “boundary” between opal-AG and opal-CT is not well defined by NMR and, indeed, may vary according to the measurement type. It is perhaps not surprising that the fitting regimes for opal-AG and opal-CT may not apply in some cases. It is also possible that a re-interpretation of the assignment of the 29Si NMR peaks may be warranted through additional NMR techniques. This is a critical “region” as many POC opal-CT samples show a relatively simple XRD pattern.
Next, we examine potential trends across the opal-CT range which might result from the proposed transition (diagenesis) from of opal-A to quartz and moganite [12,34,35,36,37,38,39,40]. In previous work [9] we showed correlations between features associated with the four constituent major peaks at 4.3, 4.1, 3.9 and 2.5 Å in the XRD patterns. In one case a relation was noted between the relative area ratios of the 4.3 and 3.9 Å peaks and in the other between the FWHM for the 4.3 and 2.5 Å peaks. There is also a trend to sharper Raman spectroscopy peaks [9]. As noted in Figure 4 there is a loose correlation resulting in a trend from a low (i.e., faster relaxation) scale parameter/low shape factor to higher (i.e., slower relaxation) scale parameter/higher shape factor. It is tempting to ascribe this to a progressive migration of uniform but relatively unstructured Q3 and Q4 silica species to more structured forms with fractionation of the components, for instance, with increased ratios of tridymite to cristobalite [35]. In this, water might be expelled resulting in remoteness from the silicon nuclei (higher scale factors) and localized, resulting in higher shape factors owing to uneven distribution. Similarly, dehydration may occur for proximal silanol groups. While both effects may be in operation, we find no convincing support through correlation of any of the NMR parameters with the XRD pattern trends, such as high shape parameters (G32925 and GNEW09). Possibly other features, such as the presence of transition metals obscure any effects. As for other measurement techniques we find no evidence for the complicated NMR spectrum of tridymite [50]. Similar comments may be made about the Q3 to Q4 ratios. The highest Q3 ratios (Table 2) occur for G32925, GNEW09, GNEW30 and T4051. While G32925 and GNEW30 show well defined and separated peaks at 4.1 and 4.3 Å, the peaks at 4.3 Å are less prominent for the other two.
Finally, we reiterate concerns with the naming convention of opal. We have included results both for opal-A and opal-CT for comparison purposes in this paper and while there are clear similarities, there is little homogeneity across the opal range. However, commercial reasons may dominate structural classification as POC occurs with both opal-AG and opal-CT. Nevertheless, as for opal-A, we propose new work should include the full range of NMR parameters, particularly for those opal-CT samples showing POC.
5. Conclusions
Scale and shape parameters derived from solid-state 29Si SP NMR have proven to be an additional characterisation method for opal providing insights not available by XRD patterns, and Raman and IR spectroscopy. We speculate that 29Si NMR occupies a key position between the between bond length (Raman and IR) and microscopic (or interatomic) (XRD and SEM) scales, probably due to the 3-dimensional lay-out of water and Q3 species, and short-range structural changes induced by silanol and the conformation of the SiO4 frameworks. To exploit this further we intend to extend the study to other opal samples as described above, explore the characteristics of hydrogen to silicon magnetization transfer in CP mode and to examine the nature of silanol and water components through 1H NMR.
Supplementary Materials
The following supporting information can be downloaded at: https://www.mdpi.com/article/10.3390/min12030323/s1. Electronic Supplementary Information contains sample information, full elemental analyses, and additional spectra and delay time relaxation plots. Table S1: Laser Ablation/Ion Coupled Plasma Elemental Analyses (ppm by weight). Figure S1: Evolution of the spectrum with delay time for (a) a translucent zone in G34475 (hy-drophane opal (opal-A) from Dubnik, Slovakia), (b) an opaque zone in G34475, (c) “Spanish me-nilite” (GNEW23 from Caldes de Malvella, Spain), and (d) Gilson synthetic opal. Delay times are 1, 2, 3, 5, 7, 10, 15, 20, 25, 35, 50, 75, 100, 200 and 400s (with the zero-time measurement shown in red). Insets are calculated fitting of Q3 (green) and Q4 (blue) components using data in Table 1 and scaled to Q4 maximum.
Author Contributions
Conceptualization, N.J.C. and M.R.J.; methodology, N.J.C., M.R.J. and A.P.; software, J.R.G.; validation, N.J.C., J.R.G. and M.R.J.; formal analysis, N.J.C., J.R.G., M.R.J. and A.P.; investigation, N.J.C., M.R.J. and A.P.; resources, M.R.J. and A.P.; data curation, N.J.C.; writing—original draft preparation, N.J.C.; writing—review and editing, J.R.G., M.R.J. and A.P.; visualization, N.J.C.; supervision, M.R.J. and A.P.; project administration, M.R.J. and A.P.; funding acquisition, M.R.J. and A.P. All authors have read and agreed to the published version of the manuscript.
Funding
This research received no external funding.
Data Availability Statement
The data presented in this study are available on request from the corresponding authors.
Acknowledgments
Collection curators are thanked for provision of samples. The authors acknowledge the facilities, and the scientific and technical assistance, of Microscopy Australia and the Australian National Fabrication Facility (ANFF) under the National Collaborative Research Infrastructure Strategy, at the South Australian Regional Facility, Flinders Microscopy and Microanalysis, Flinders University.
Conflicts of Interest
The authors declare no conflict of interest.
Appendix A
Table A1.
Sample Data: As Labelled on Specimens.
Table A1.
Sample Data: As Labelled on Specimens.
| Reference | Type | Location (Australia Unless Noted) | Description |
|---|---|---|---|
| E1937 | AN | Mt Cora, New South Wales | colorless glass |
| G1401 | AG | White Cliffs, New South Wales | translucent |
| G1421 | CT | Mt Cora, New South Wales | shiny black |
| G1442 | AG | William Creek, South Australia | glassy white with POC |
| G7107 | AN | Valeč, Czechia | colorless glass |
| G8608 | AG | White Cliffs, New South Wales | opaque white, POC |
| G8736 | AN | Springsure, Queensland | colorless glass |
| G8877 | AN | Squaretop near Dalby, Queensland | colorless glass |
| G9258 | AG | Andamooka, South Australia | translucent white POC |
| G7532 | AG | Queensland | white with POC on matrix |
| G7682 | AG | Mintabie, South Australia | glassy blue-grey |
| G9592 | AG | Cloncurry, Queensland | milky white with POC |
| G9811 | AG | Coober Pedy, South Australia | opaque white with POC |
| G9942 | CT | Angaston, South Australia | translucent glossy white |
| G13755 | CT | Ross, Tasmania | translucent white |
| G13761 | CT | Marvell Loch, Western Australia | translucent green |
| G13764 | AN | Dalby, Queensland | colorless glass |
| G13767 a | AG | Lightning Ridge, New South Wales, Australia | mixed samples |
| G14581 | AG-CT | Andamooka, South Australia | opaque brown with POC |
| G21471 | A | Rotorua, New Zealand | crumbly white |
| G32740 | AN | Valeč, Czechia | colorless glass |
| G32925 | CT | Zelinograd, Qazaqstan | glassy vermilion |
| G34475 b | AG | Dubnik, Slovakia | white opaque/translucent |
| G34996 a | AG | Coober Pedy, South Australia, Australia | opalised mussels |
| G34997 a | AG | Coober Pedy, South Australia, Australia | opalised belemnites |
| GNEW01 | AG | Caldes de Malavella, Catalonia, Spain | opaque cream |
| GNEW03 | CT | Mt Iyobo, Tanzania | opaque green |
| GNEW05 | CT | Bemia, Madagascar | transparent yellow |
| GNEW08 | CT | Ethiopia | glassy green and brown |
| GNEW09 | CT | Caldes de Malavella, Catalonia, Spain | translucent brown |
| GNEW19 | CT | Tanzania | orange glass |
| GNEW20 | CT | California, USA | translucent yellow |
| GNEW22 | AG | Lambina, South Australia | opaque white with POC |
| GNEW23 | AG | Caldes de Malavella, Catalonia, Spain | opaque grey-brown |
| GNEW24 | CT | Kutahuya, Turkey | translucent olive |
| GNEW27 | CT | Yozgat, Turkey | blue-green glass |
| GNEW28 | CT | Yozgat, Turkey | olive-green glass |
| GNEW30 | CT | East of Manzano Mts, New Mexico, USA | opaque white |
| GNEW31 | AG | Andamooka, South Australia, Australia | translucent white |
| M8736 | AN | Springsure, Queensland | colorless glass |
| M53441 | CT | Kremze, Czechia | opaque blue |
| MS-4 | AN | Mt Squaretop, Queensland | colorless glass |
| NMNH ETH S2 | CT | Mezezo, Ethiopia | brown bottle glass, POC |
| OOC3 | CT | Ménilmontant, France | opaque grey-brown |
| OOC5 | CT | Virgin Valley, Nevada, USA | opaque white |
| OOC10 | AN | Lesvos, Greece | colorless glass |
| SO3 | AG | Dubnik, Slovakia | translucent with POC |
| SO7 | AG | Dubnik, Slovakia | opaque white |
| SO17 | AG | Dubnik, Slovakia | opaque white |
| T1665 | A | Rotorua, New Zealand | crumbly white |
| T2233 | AG | Lightning Ridge, New South Wales | blue-grey glass |
| T4051 | CT | Charlies Swamp, South Australia | translucent grey |
| T18117 | AN | Mitchell Co. N. Carolina, USA | colorless glass |
| T18511 | AN | Mt Gee, Arkaroola, South Australia | colorless glass |
| T22842 | CT | Missoula, Montana, USA | opaque white |
| WBO1 | AG | Winton, Queensland, Australia | bluish opaque, POC |
a Collection of samples from the same location. b different zones of the same piece used.
Appendix B
Table A2.
Selected Elemental Analyses (ppm by Weight) (see Supplementary Materials for Full Table).
Table A2.
Selected Elemental Analyses (ppm by Weight) (see Supplementary Materials for Full Table).
| 27Al | 31P | 49Ti | 51V | 55Mn | 57Fe | 59Co | 60Ni | 65Cu | 137Ba | 238U | ||
|---|---|---|---|---|---|---|---|---|---|---|---|---|
| Opal-AG | ||||||||||||
| G1401 | 6580 | 3.12 | 6.83 | 0.0701 | 9.17 | 485 | 0.0109 | 0.0694 | 0.0288 | 155 | 0.0265 | |
| G9811 | 5990 | 3.54 | 5.30 | 0.0896 | 5.50 | 393 | 0.0139 | 0.0566 | 0.0267 | 154 | 0.0265 | |
| T2233 | 6110 | 39.1 | 722 | 4.76 | 18.5 | 1040 | 50.0 | 17.3 | 159 | 144 | 2.36 | |
| G8608 | 4560 | 3.53 | 8.36 | 0.0895 | 5.30 | 271 | 0.0553 | 0.100 | 0.146 | 83.8 | 0.0572 | |
| Opal-AN | ||||||||||||
| E1937 | 5.19 | 3.29 | 0.128 | 0.347 | 0.0261 | 0.220 | 3.61 × 10⁻³ | 0.0236 | 9.03 × 10⁻³ | 0.122 | 0.298 | |
| MS-4 | 6.42 | 3.55 | 0.0207 | 0.495 | 0.0322 | — a | — a | 3.55 × 10⁻³ | — a | 2.27 × 10⁻⁴ | 0.135 | |
| G32740 | 8.10 | 8.43 | 0.633 | 0.458 | 0.122 | 6.30 | 0.0274 | 0.159 | 0.547 | 0.181 | 0.034 | |
| M8736 | 3.57 | 3.33 | 9.34 × 10⁻³ | 0.434 | 0.024 | — a | — a | 0.0192 | 7.57 × 10⁻³ | 4.38 × 10⁻³ | 0.116 | |
| OOC10 | 0.458 | 3.30 | 6.02 × 10⁻³ | 0.233 | 0.0247 | — a | 8.83 × 10⁻⁴ | 0.0217 | 0.0224 | 0.139 | 15.2 | |
| T18511 | 0.893 | 3.34 | 0.0109 | 0.0417 | 0.0272 | — a | — a | 3.43 × 10⁻³ | 2.43 × 10⁻³ | 0.0127 | 24.9 | |
| T18117 | 16.0 | 5.11 | 0.214 | 0.015 | 7.14 | 4.11 | 0.0260 | 0.0705 | 2.49 | 0.985 | 54.8 | |
| G7107 | 22.6 | 4.78 | 0.352 | 0.578 | 0.0526 | 2.31 | 7.50 × 10⁻⁴ | 0.0221 | 0.0376 | 0.0257 | 0.053 | |
| G8877 | 0.273 | 3.35 | 0.0654 | 0.775 | 0.0259 | — a | 1.77 × 10⁻³ | 0.0186 | 0.0277 | 0.0251 | 0.381 | |
| G13764 | 3.13 | 3.16 | 0.0403 | 0.0466 | 0.0328 | — a | — a | 0.0200 | 0.0281 | 2.44 × 10⁻³ | 0.295 | |
| Opal-CT | ||||||||||||
| G9942 | 29.8 | 3.93 | 2.70 | 0.348 | 0.267 | 54.3 | 0.0238 | 0.0951 | 0.124 | 0.06 | 0.0874 | |
| ETH S2 | 6760 | 2.86 | 46.8 | 5.36 × 10⁻⁴ | 17.1 | 724 | 0.0184 | 0.0226 | 0.0208 | 25.6 | 0.781 | |
| GNEW03 | 3640 | 4.30 | 0.330 | 0.804 | 2.43 | 17,500 | 1.14 | 9.62 | 8.85 | 1.96 | 0.212 | |
| OOC3 | 4320 | 16.6 | 743 | 57.4 | 1.51 | 1100 | 0.649 | 7.23 | 8.28 | 6.04 | 0.346 | |
| T22842 | 0.371 | 5.84 | 0.0829 | 0.224 | 0.137 | 201 | 4.22 × 10⁻³ | 0.0748 | 3.06 | 0.996 | 21.7 |
a Very low concentration.
References
- Jones, J.B.; Sanders, J.V.; Segnit, E.R. Structure of opal. Nature 1964, 204, 990–991. [Google Scholar] [CrossRef]
- Jones, J.B.; Segnit, E.R. The Nature of Opal I. Nomenclature and Constituent Phases. J. Geol. Soc. Aust. 1971, 18, 57–68. [Google Scholar] [CrossRef]
- Smith, D.K. Opal, cristobalite and tridymite: Noncrystallinity versus crystallinity, nomenclature of the silica minerals and bibliography. Powder Diffr. 1998, 13, 2–19. [Google Scholar] [CrossRef]
- Elzea, J.M.; Rice, S.B. TEM and X-Ray diffraction evidence for cristobalite and tridymite stacking sequences in opal. Clays Clay Miner. 1996, 44, 492–500. [Google Scholar] [CrossRef]
- Ghisoli, C.; Caucia, F.; Marinoni, L. XRPD patterns of opals: A brief review and new results from recent studies. Powder Diffr. 2010, 25, 274–282. [Google Scholar] [CrossRef]
- Caucia, F.; Marinoni, L.; Bordini, V.; Ghisoli, C.; Adamo, I. Physical and chemical properties of some Italian opals. Period. Mineral. 2012, 81, 93–106. [Google Scholar]
- Eckert, J.; Gourdon, O.; Jacob, D.E.; Meral, C.; Monteiro, P.J.M.; Vogel, S.C.; Wirth, R.; Wenk, H.-R. Ordering of water in opals with different microstructures. Eur. J. Mineral. 2015, 27, 203–213. [Google Scholar] [CrossRef]
- Sodo, A.; Municchia, A.C.; Barucca, S.; Bellatreccia, F.; Ventura, G.D.; Butini, F.; Ricci, M.A. Raman, FT-IR and XRD investigation of natural opals. J. Raman Spectrosc. 2016, 47, 1444–1451. [Google Scholar] [CrossRef]
- Curtis, N.J.; Gascooke, J.R.; Johnston, M.R.; Pring, A. A Review of the Classification of Opals with Reference to Recent New Localities. Minerals 2019, 9, 299. [Google Scholar] [CrossRef]
- Segnit, E.R.; Stevens, T.J.; Jones, J.B. The Role of Water in Opals. J. Geol. Soc. Aust. 1965, 12, 211–226. [Google Scholar] [CrossRef]
- Sosnowska, I.; Buchenau, U.; Reichenauer, G.; Graetsch, H.; Ibel, K.; Frick, B. Structure and dynamics of the opal-water system. Phys. B 1997, 234, 455–457. [Google Scholar] [CrossRef]
- Jones, B. Siliceous sinters in thermal spring systems: Review of their mineralogy, diagenesis, and fabrics. Sediment. Geol. 2021, 413, 105820. [Google Scholar] [CrossRef]
- Day, R.; Jones, B. Variations in water content in opal-A and opal-CT from geyser discharge aprons. J. Sediment. Res. 2008, 78, 301–315. [Google Scholar] [CrossRef]
- McOrist, G.D.; Smallwood, A. Trace elements in precious and common opals using neutron activation analysis. J. Radioanal. Nucl. Chem. 1997, 223, 9–15. [Google Scholar] [CrossRef]
- Thomas, P.S.; Brown, L.D.; Ray, A.S.; Prince, K.E. A SIMS study of the transition elemental distribution beyween bands in banded sedimentary opal from the Lightning Ridge locality. Neues Jahrb. Minerol. Abh. 2006, 182, 193–999. [Google Scholar]
- Gaillou, E.; Delaunay, A.; Rondeau, B.; Bouhnik-le-Coz, M.; Fritsch, E.; Corren, G.; Monnier, C. The geochemistry of gem opals as evidence of their origin. Ore Geol. Rev. 2008, 34, 113–126. [Google Scholar] [CrossRef]
- Ansori, C. Model mineralisasi pembentukan opal banten. J. Geol. Indones. 2010, 5, 151–170. [Google Scholar] [CrossRef][Green Version]
- Simoni, M.; Caucia, F.; Adamo, I.; Galinetto, P. New occurence of fire opal from Bemia, Madagascar. Gems Gemol. 2010, 46, 114–121. [Google Scholar] [CrossRef]
- Rondeau, B.; Cenki-Tok, B.; Fritsch, E.; Mazzero, F.; Gauthier, J.-P.; Bodeur, Y.; Bekele, E.; Gaillou, E.; Ayalew, D. Geochemical and petrological characterizarion of gem opals from Wegel Tena, Wolo, Ethiopia: Opal formation in an Oligocene soil. Geochem. Explan. Environ. Anal. 2012, 12, 93–104. [Google Scholar] [CrossRef]
- Liesegang, M.; Milke, R. Australian sedimentary opal-A and its associated minerals: Implications for natural silica sphere formation. Am. Mineral. 2014, 99, 1488–1499. [Google Scholar] [CrossRef]
- Dutkiewicz, A.; Landgrebe, T.C.W.; Rey, P.F. Origin of silica and fingerprinting of Australian sedimentary opals. Gondwana Res. 2015, 27, 786–795. [Google Scholar] [CrossRef]
- McOrist, G.D.; Smallwood, A.; Fardy, J.J. Trace elements in Australian opals using neutron activation analysis. J. Radioanal. Nucl. Chem. Artic. 1994, 185, 293–303. [Google Scholar] [CrossRef]
- Bobon, M.; Christy, A.A.; Kluvanec, D.; Illasova, L. State of water molecules and silanol groups in opal minerals: A near infrared spectrscopic study of opals from Slovakia. Phys. Chem. Miner. 2011, 38, 809–818. [Google Scholar] [CrossRef]
- Chauviré, B.; Rondeau, B.; Mangold, N. Near infrared signature of opal and chalcedony as a proxy for their structure and formation conditions. Eur. J. Mineral. 2017, 29, 409–421. [Google Scholar] [CrossRef]
- Pineau, M.; Deit, L.L.; Chauviré, B.; Carter, J.; Rondeau, B.; Mangold, N. Toward the geological significance of hydrated silica detected by near infrared spectroscopy on Mars based on terrestrial reference samples. Icarus 2020, 348, 113706. [Google Scholar] [CrossRef]
- Wilson, M.J. The structure of opal-CT revisited. J. Non-Cryst. Solids 2014, 405, 68–75. [Google Scholar] [CrossRef]
- Fröhlich, F. The opal-CT nanostructure. J. Non-Cryst. Solids 2020, 533, 119938. [Google Scholar] [CrossRef]
- Rondeau, B.; Fritz, E.; Guiraud, M.; Renac, C. Opals from Slovakia (“Hungarian opals”): A reassesment of the conditions of formation. Eur. J. Mineral. 2004, 16, 789–799. [Google Scholar] [CrossRef]
- Spencer, R.J.; Levinson, A.A.; Koivula, J.L. Opals from Querétaro Mexico: Fluid inclusion study. Gems Gemmol. 1992, 28, 28–34. [Google Scholar] [CrossRef]
- Chauviré, B.; Rondeau, B.; Alexandre, A.; Chamard-Boris, S.; La, C.; Mazzero, F. Pedogenic origin of precious opals from Wegel Tena (Ethiopia): Evidence from trace elements and oxygen isotopes. Appl. Geochem. 2019, 101, 127–139. [Google Scholar] [CrossRef]
- Floerke, O.W.; Jones, J.B.; Segnit, E.R. The genesis of hyalite. Neues Jahrb. Mineral. Mon. 1973, 2, 82–89. [Google Scholar] [CrossRef]
- Jones, J.B.; Segnit, E.R. The Occurence and Formation of Opal at Coober Pedy and Andamooka. Aust. J. Sci. 1966, 29, 129–133. [Google Scholar]
- Martin, E.; Gaillou, E. Insight on gem opal formation in volcanic ash deposits from a supereruption: A case study through oxygen and hydrogen isotopic composition of opals from Lake Tecopa, California, USA. Am. Mineral. 2018, 103, 803–811. [Google Scholar] [CrossRef]
- Williams, L.A.; Crerar, D.A. Silica diagenesis, II. General mechanisms. J. Sediment. Petrol. 1985, 55, 312–321. [Google Scholar]
- Liesegang, M.; Tomaschek, F. Tracing the continental diagenetic loop of the opal-A to opal-CT transformation with X-ray diffraction. Sediment. Geol. 2020, 398, 105603. [Google Scholar] [CrossRef]
- Lynne, B.Y.; Campbell, K.A.; Moore, J.N.; Browne, P.R.L. Diagenesis of 1900-year-old siliceous sinter (opal-A to quartz) at Opal Mound, Roosevelt Hot Springs, Utah, U.S.A. Sediment. Geol. 2005, 179, 249–278. [Google Scholar] [CrossRef]
- Kano, K. Ordering of opal-CT in diagenesis. Geochem. J. 1983, 17, 87–93. [Google Scholar] [CrossRef]
- Rice, S.B.; Freund, H.; Huang, W.-L.; Clouse, J.A.; Isaacs, C.M. Application of Fourier transform infrared spectroscopy to silica diagenis: The opal-A to opal-CT transformation. J. Sediment. Res. 1995, A65, 639–647. [Google Scholar]
- Herdianita, N.R.; Browne, P.R.L.; Rodgers, K.A.; Campbell, K.A. Mineralogical and textural changes accompanying ageing of silica sinter. Miner. Depos. 2000, 35, 48–62. [Google Scholar] [CrossRef]
- Jones, B.; Renaut, R.W. Microstructural changes accompanying the opal-A to opal-CT transition: New evidence from the siliceous sinters of Geysir, Haukadalur, Iceland. Sedimentology 2007, 54, 921–948. [Google Scholar] [CrossRef]
- Curtis, N.J.; Gascooke, J.R.; Pring, A. Silicon-oxygen region infra-red and Raman analysis of opals: The effect of sample preparation and measurement type. Minerals 2021, 11, 173. [Google Scholar] [CrossRef]
- de Jong, B.W.H.S.; van Hoek, J.; Veeeman, W.S.; Manson, D.V. X-ray diffraction and 29Si magic-angle-spinning NMR of opals: Incoherent long- and short-range order in opal-CT. Am. Mineral. 1987, 72, 1195–1203. [Google Scholar]
- Graetsch, H.; Mosset, A.; Gies, H. XRD and 29Si MAS-NMR study of some non-crystalline silica minerals. J. Non-Cryst. Solids 1990, 119, 173–190. [Google Scholar] [CrossRef]
- Adams, S.J.; Hawkes, G.E.; Curzon, E.H. A solid state 29Si nuclear magnetic resonance study of opal and other hydrous silicas. Am. Mineral. 1991, 76, 186371. [Google Scholar]
- Graetsch, H.; Gies, H.; Topalovic, I. NMR, XRD and IR study on microcrstalline opal. Phys. Chem. Miner. 1994, 21, 166–175. [Google Scholar] [CrossRef]
- Brown, L.D.; Ray, A.S.; Thomas, P.S. 29Si and 27Al NMR study of amorphous and paracrystalline opals from Australia. J. Non-Cryst. Solids 2003, 332, 242–248. [Google Scholar] [CrossRef]
- Paris, M.; Fritsch, E.; Aguilar-Reyes, B. 1H, 29Si and 27Al NMR study of the destabilization process of a paracrystalline opal from Mexico. J. Non-Cryst. Solids 2007, 353, 1650–1656. [Google Scholar] [CrossRef]
- Chemtob, S.M.; Rossman, G.R.; Stebbins, J.F. Natural hydrous amorphous silica: Quantitation of network speciation and hydroxyl content by 29Si MAS NMR and vibrational spectroscopy. Am. Mineral. 2012, 97, 203–211. [Google Scholar] [CrossRef]
- Lippmaa, E.; Mági, M.; Samoson, A.; Engelhard, G.; Grimmer, A.-R. Structural Studies of Silicates by Solid-State High-Resolution 29Si NMR. J. Am. Chem. Soc. 1980, 102, 4889–4893. [Google Scholar] [CrossRef]
- Smith, J.V.; Blackwell, C.S. Nuclear magnetic resonance of silica polymorphs. Nature 1983, 303, 223–225. [Google Scholar] [CrossRef]
- Gladden, L.F.; Carpenter, T.A.; Elliot, S.R. 29Si MAS NMR studies of the spin-lattice relaxation time and bond-angle distribution in vitreous silica. Philos. Mag. B 1986, 53, L81–L87. [Google Scholar] [CrossRef]
- Liu, C.C.; Maciel, G.E. The Fumed Silica Surface: A Study by NMR. J. Am. Chem. Soc. 1996, 118, 5103–5119. [Google Scholar] [CrossRef]
- Léonardelli, S.; Facchini, L.; Fretigny, C.; Tougne, P.; Legrand, A.P. Silicon-29 Nuclear Magnetic Resonance Study of Silica. J. Am. Chem. Soc. 1992, 112, 6412–6418. [Google Scholar] [CrossRef]
- Malfait, W.J.; Halter, W.E.; Verel, R. 29Si NMR spectroscopy of silica glass: T1 relaxation and constraints on the Si–O–Si bond angle distribution. Chem. Geol. 2008, 256, 269–277. [Google Scholar] [CrossRef]
- Baccile, N.; Laurent, G.; Bonhomme, C.; Innocenzi, P.; Babonneau, F. Solid-State NMR Characterization of the Surfactant-Silica Interface in Templated Silicas: Acidic versus Basic Conditions. Chem. Mater. 2007, 19, 1343–1354. [Google Scholar] [CrossRef]
- Klinowski, J. Solid-State NMR Studies of Molecular Sieve Catalysts. Chem. Rev. 1991, 91, 1459–1479. [Google Scholar] [CrossRef]
- Smith, K.A.; Kirkpatrick, R.J.; Oldfield, E.; Henderson, D.M. High-resolution silicon-29 nuclear magnetic resonance spectroscopic study of rock-forming silicates. Am. Mineral. 1983, 68, 1206–1215. [Google Scholar]
- Li, J.; Hayakawa, S.; Shirosaki, Y.; Osaka, A. Revisiting structure of silica gels from water glass: An 1H and 29Si MAS and CP-MAS NMR study. J. Sol.-Gel Sci. Technol. 2013, 65, 135–142. [Google Scholar] [CrossRef]
- Myers, S.A.; Cygan, R.T.; Assink, R.A.; Boslough, M.B. 29Si MAS NMR relaxation study of shocked Coconino Sandstone from Meteor Crater, Arizona. Phys. Chem. Miner. 1998, 25, 313–317. [Google Scholar] [CrossRef]
- Barron, P.F.; Frost, R.L.; Skjemstad, J.O. 29Si Spin–lattice relaxation in aluminosilicates. J. Chem. Soc. Chem. Commun. 1983, 10, 581–583. [Google Scholar] [CrossRef]
- Narayanan, A.; Hartman, J.S.; Bain, A.O. Characterizing Nonexponential Spin-Lattice Relaxation in Solid-State NMR by Fitting to the Stretched Exponential. J. Magn. Reson. A 1995, 112, 58–65. [Google Scholar] [CrossRef]
- Peyron, M.; Pierens, G.K.; Lucas, A.J.; Hall, L.D.; Stewart, R.C. The Modified Stretched-Exponential Model for Characterization of NMR Relaxation in Porous Media. J. Magn. Reson. Ser. A 1996, 118, 214–220. [Google Scholar] [CrossRef]
- Alaimo, M.H.; Roberts, J.E. Effects of paramagnetic cations on the nonexponential spin-lattice relaxation of rare spin nuclei in solids. Solid State Nucl. Magn. Reson. 1997, 8, 214–250. [Google Scholar] [CrossRef]
- Leonova, E.; Grins, J.; Shariatgorji, M.; Ilag, L.L.; Edén, M. Solid-state NMR investigationsof Si-29 and N-15 enriched silicon nitride. Solid State Nucl. Magn. Reson. 2009, 36, 11–18. [Google Scholar] [CrossRef]
- Watanabe, T.; Shimizu, H.; Masuda, A.; Saito, H. Studies of 29Si spin-lattice relaxation times and paramagnetic impurities in clay minerals by magic-angle spinning 29Si-NMR and EPR. Chem. Lett. 1983, 12, 1293–1296. [Google Scholar] [CrossRef]
- Miró, J.; Martín-Martín, J.D.; Ibáñez, J.; Anadón, P.; Oms, O.; Tritlla, J.; Caja, M.A. Opaline chert nodules in maar lake sediments from Camp dels Ninots (La Selva Basin, NE Spain). Teo-Gemas 2016, 16, 387–390. [Google Scholar]
- Liesegang, M.; Milke, R. Silica colloid ordering in a dynamic sedimentary environment. Minerals 2018, 8, 12. [Google Scholar] [CrossRef]
- Jochum, K.P.; Nohl, U.; Herwig, K.; Lammel, E.; Stoll, B.; Hofmann, A.W. GeoReM: A New Geochemical Database for Reference Materials and Isotopic Standards. Geostand. Geoanal. Res. 2005, 29, 333–338. [Google Scholar] [CrossRef]
- Struppe, J.; Steuernagel, S.; Aussenacc, F.; Benevelli, F.; Gierth, P.; Wegner, S. Solid State NMR AVANCE Solids User Manual 003; Bruker Corporation: Billerica, MA, USA, 2016. [Google Scholar]
- Hayashi, S.; Hayamizu, K. Chemical Shift Standards in High-Resolution Solid-State NMR (1) 13C, 29Si and 1H Nuclei. Bull. Chem. Soc. Jpn. 1991, 64, 685–687. [Google Scholar] [CrossRef]
- Edwards, C.L.; Alemany, L.B.; Barron, A.R. Solid-State 29Si NMR Analysis of Cements: Comparing Different Methods of Relaxation Analysis for Determining Spin−Lattice Relaxation Times to Enable Determination of the C3S/C2S Ratio. Ind. Chem. Eng. Res. 2007, 46, 5122–5130. [Google Scholar] [CrossRef]
- Oster, J.L.; Kitajima, K.; Valley, J.; Rogers, B.; Maher, K. An evaluation of paired δ18O and (234U/238U)0 in opal as a tool for paleoclimate reconstruction in semi-arid environments. Chem. Geol. 2017, 449, 236–252. [Google Scholar] [CrossRef]
- Johnston, D.C. Stretched exponential relaxation arising from a continuous sum of exponential decays. Phys. Rev. B 2006, 74, 184430–184437. [Google Scholar] [CrossRef]
- Press, W.H.; Flannery, B.P.; Teukolsky, S.A.; Vetterling, W.T. Numerical Recipes The Art of Scientific Computing (Fortran Vesion); Cambridge University Press: Cambridge, UK, 1989. [Google Scholar]
- Graetsch, H.; Topalovic, I.; Gies, H. NMR spectra of moganite and chalcedony. Eur. J. Mineral. 1994, 6, 459–464. [Google Scholar] [CrossRef]
- Thomas, P.; Chauviré, B.; Flower-Donaldson, K.; Aldridge, L.; Smallwood, A.; Liu, B. FT-NIR and DSC characterisation of water in opal. Ceram. Int. 2020, 46, 29443–29450. [Google Scholar] [CrossRef]
- Brown, L.D.; Ray, A.S.; Thomas, P.S. Elemental Analysis of Australian amorphous banded opals by laser-ablation ICP-MS. Neues Jahrb. Mineral. Mon. 2004, 2004, 411–424. [Google Scholar] [CrossRef]
- Bartoli, F.; Rosa, D.B.; Doirisse, M.; Meyer, R.; Philippy, R.; Samama, J.-C. Role of aluminium in the structure of Brazilian opals. Eur. J. Mineral. 1990, 2, 611–619. [Google Scholar] [CrossRef]
- Smallwood, A. A new era for opal nomenclature. Aust. Gemmol. 1997, 19, 489–496. [Google Scholar]
- Megaw, P.K.M.; Fritsch, E.; Spano, T.L.; Gray, M. Geology and Mineralogy of Electric OpalTM: Green Daylight-Luminescing Hyalite Opal from Zacatecas, Mexico. Rocks Miner. 2018, 93, 404–413. [Google Scholar] [CrossRef]
- Gaillou, E. An Overview of Gem Opals: From the Geology to Color and Microstructure. In Proceedings of the Thirteenth Annual Sinkankas Symposium—Opal, Carlsbad, CA, USA, 18 April 2015. [Google Scholar]
- Vasil’ev, S.G.; Volkov, V.I.; Tatarinova, E.A.; Muzafarov, A.M. A Solid-State NMR Investigation of MQ Silicone Copolymers. Appl. Magn. Reson. 2003, 44, 1015–1025. [Google Scholar] [CrossRef]
- Bronnimann, C.E.; Zeigler, R.C.; Maciel, G.E. Proton NMR Study of Dehydration of the Silica Gel Surface. J. Am. Chem. Soc. 1988, 110, 2023–2026. [Google Scholar] [CrossRef]
- Lowe, I.J.; Tse, D. Nuclear Spin-Lattice Relaxation via Paramagnetic Centers. Phys. Rev. 1968, 166, 279–291. [Google Scholar] [CrossRef]
- Tse, D.; Hartmann, S.R. Nuclear spin-lattice relaxation via paramagentic centers without spin diffusion. Phys. Rev. Lett. 1968, 21, 511–514. [Google Scholar] [CrossRef]
- Maiti, B.; McGarvey, B.R. Spin-Lattice Relaxation Time of 13C in [Fe(phen)2(N13CS)2]. Nonexponential Decay. J. Magn. Reson. 1984, 58, 37–46. [Google Scholar] [CrossRef]
- Johnston, D.C.; Baek, S.-H.; Zong, X.; Borsa, F.; Schmalian, J.; Kondo, S. Dynamics of Magnetic Defects in Heavy Fermion LiV2O4 from Stretched Exponential 7Li NMR Relaxation. Phys. Rev. Lett. 2005, 95, 176408. [Google Scholar] [CrossRef]
- Belton, D.J.; Deschaume, O.; Perry, C.C. An overview of the fundamentals of the chemistry of silica with relevance to biosilicification and technological advances. FEBS J. 2012, 279, 1710–1720. [Google Scholar] [CrossRef]
- Pewkliang, B.; Pring, A.; Brugger, J. The formation of precious opal: Clues from the opalization of bone. Can. Mineral. 2008, 46, 139–149. [Google Scholar] [CrossRef]
- Rey, P.F. Opalisation of the Great Artesian Basin (Central Australia): An Australian story with a Martian twist. Aust. J. Earth Sci. 2013, 60, 219–314. [Google Scholar] [CrossRef]
- Gaillou, E.; Fritsch, E.; Aguilar-Reyes, B.; Rondeau, B.; Post, J.; Barreau, A.; Ostroumov, M. Common gem opal: An investigation of micro- to nano-structure. Am. Mineral. 2008, 93, 1865–1873. [Google Scholar] [CrossRef]


Publisher’s Note: MDPI stays neutral with regard to jurisdictional claims in published maps and institutional affiliations. |
© 2022 by the authors. Licensee MDPI, Basel, Switzerland. This article is an open access article distributed under the terms and conditions of the Creative Commons Attribution (CC BY) license (https://creativecommons.org/licenses/by/4.0/).