Article

A Probabilistic Block Economic Value Calculation Method for Use in Stope Designs under Uncertainty

by
Tinashe Tholana
* and
Cuthbert Musingwini
*
School of Mining Engineering, University of the Witwatersrand, Johannesburg 2050, South Africa
*
Authors to whom correspondence should be addressed.
Minerals 2022, 12(4), 437; https://doi.org/10.3390/min12040437
Submission received: 7 March 2022 / Revised: 23 March 2022 / Accepted: 24 March 2022 / Published: 31 March 2022
(This article belongs to the Section Mineral Deposits)

Abstract

:
Uncertainty is intrinsic to mine design and planning and introduces risk into the process. Nonetheless, most mine design and planning processes have historically been undertaken as deterministic processes, often resulting in unrealistic mine designs and plans which potentially lead to the destruction of shareholder value. This paper presents a probabilistic block economic value (BEV) calculation approach to minimise the shortcoming of using deterministic BEVs, and evaluates the impact of uncertainty on stope designs. The probabilistic BEV calculation approach was applied to a synthetic geological block model of a gold mineral deposit. The uncertainty associated with BEV input parameters was simulated using Monte Carlo simulation to create equally probable economic orebody models which were then used to create stope designs at different levels of risk. The probabilistic approach generated 20% to 53% higher net present values (NPVs) compared to the deterministic approach within 30% to 70% probability range. This indicates that, for the case study deposit, blocks with approximately 30% to 70% probability of having positive BEVs are the ones that should be used for mine design and planning. The results demonstrate that incorporating uncertainty early in underground mine design and planning potentially creates higher-value stopes.

1. Introduction

The mine design and planning process consists of several interrelated and interdependent components which broadly start with mineral deposit evaluation. The evaluation of a mineral deposit is a process that characterises the deposit in terms of its spatial location, size, orientation, mineral composition, and other relevant geotechnical and technical characteristics. The mineral deposit evaluation process uses data obtained from precursor prospecting and exploration activities that are carried out to search for a mineral or minerals of economic interest. Geological data obtained from prospecting and exploration activities is used to create a three-dimensional (3D) block model to represent the mineral deposit, and is generally referred to as a geological block model. The 3D block model is typically divided into regular blocks along the x, y, and z directions such that the model is a depiction of the technical context within which the deposit’s mineralisation forms a basis on which the finite Mineral Resources contained in the mineral deposit are estimated [1]. The block model is a primary input for subsequent mine design and planning processes which include, among other processes, the mining method selection, mine design, production rate determination, equipment selection, and production scheduling.
Each block within the geological block model has specific geological data, such as grade, volume, density, and lithology [2]. The geological data together with technical and economic factors such as commodity price, mining cost, processing cost and mineral processing recovery rate are then used to calculate the economic value of each block called the block economic value (BEV) [3]. Equation (1) is a typical formula used to calculate the BEV of each block [4]:
BEV = [(Block tonnage × grade × recovery rate × price) − (Mining cost + Processing cost)]
The process of calculating BEVs converts a geological block model into an economic block model. For each set of input parameters applied, the BEVs distinguish economic and uneconomic blocks [5]. A block will be economic to mine if its BEV is positive, and uneconomic if negative.
The input parameters indicated in Equation (1) for calculating BEV are inherently uncertain at the time when mine design and planning is being undertaken. Despite this uncertainty, deterministic BEVs are usually calculated to expedite the design and planning decisions. In the deterministic BEV calculation, it is assumed that the geological, economic, and other technical input parameters are known with certainty [6]. This results in a deterministic economic block model, from which practical and optimum underground stope designs are then developed [5]. However, this assumption ignores the reality that the economic, geological, and technical parameters are associated with considerable uncertainties [6]. By ignoring uncertainty during mineral deposit evaluation, undesirable consequences can occur, hence the need to shift away from deterministic to probabilistic approaches in calculating BEVs. The application of probabilistic approaches in calculating BEVs should improve confidence levels in the stope designs, since the mineral deposit is a primary input to the stope design process.
There are several techniques that have been developed to optimise stope designs, including techniques by [7,8,9,10] among many others. The realisation of incorporating uncertainty in stope design optimisation can be seen from several stochastic optimisation techniques that have been developed for stope design. These works include such work as [11,12,13]. However, the focus of this paper is not on stope design optimisation, but on BEV calculation and evaluating the impact of uncertainty on stope designs. Therefore, a detailed review of stope design optimisation techniques is not the scope of this paper. A detailed review of the stope design optimisation techniques is provided by authors such as [5,7,8,9,10,11,12,13,14].
Given the foregoing challenges associated with deterministic approaches and the necessity to overcome them, this paper presents a probabilistic approach that incorporates uncertainty in key input parameters used in calculating BEVs to enable the design of more reliable or robust stope designs. The results of the approach are economic block models with associated probabilities that can then be used to generate probability stopes to improve the design and planning of underground mines.
In this paper, probability stopes are stopes with an assigned confidence level. For example, a P90 stope would mean a stope with at least a 90% probability that its constituent blocks fall within the ultimate stope boundary. This is important during mine design to guide and improve confidence in the location of key underground development and access infrastructure. This is also important for creating optimum production schedules that lead to the highest possible economic value to be generated from extracting the finite Mineral Resources. Some of the data used in this paper were obtained and adapted from an anonymous South African gold mine that uses the sub-level open stoping (SLOS) mining method and the Carbon-in-Pulp (CIP) mineral processing method, producing a run of mine of approximately 500,000 tonnes per annum. Due to proprietary reasons, the identity of the mine could not be disclosed, though the data are representative of operating gold mines using SLOS and CIP methods in the country. The data include mine design criteria, mineral processing recovery rate, and processing costs.

2. Sources of Uncertainty in Mining and Associated Risk

Uncertainty is inherent in mine planning processes and the actual mining process is also associated with uncertainty. Mine planning is associated with uncertainty because it involves forecasting of several technical, economic, social, and environmental inputs which are not known with certainty upfront. This is due to several reasons that include use of data estimates to represent unobserved future events [15]. For example, during planning, mine planners do not know with certainty the values of future commodity prices and exact characteristics of the mineral deposit [16]. It is only when the deposit gets extracted that all its characteristics are known with improved confidence. The exact characteristics, such as the total quantity of Mineral Resources for any given mineral deposit, are known with better confidence at mine closure with the benefit of hindsight; before that stage, only estimates are used in the mine planning process. This uncertainty introduces risk into mining and is something which mine planners must consider and plan for [16].
Despite the intrinsic uncertainty associated with mining, most approaches to mine planning have generally been deterministic, wherein fixed average values are used as input values to develop mine plans. As argued by [17], the use of average values relates to the concept of the ‘flaw of averages’ because “plans based on average assumptions are wrong on average”. Using averages means that uncertainty is ignored in the mine planning process, resulting in a deterministic mine plan which does not correctly model the actual behaviour of the mining process. The main advantage of deterministic approaches using averages is that they are simple to model and understand. However, as argued by [18], their disadvantage is that combined errors in each fixed estimate will result in significantly different real-life and real-time results.
Deterministic mine planning has several implications for mine design and planning which include:
(1)
Economic loss due to either foregone extra profits which could be gained during periods of favourable market conditions or losses because of unexpected weak markets [19].
(2)
Over-estimation or under-estimation of Mineral Reserves resulting in mining projects failing to meet their objectives [20,21].
(3)
Changes being made to mine designs later in the life of mine (LOM) which may require substantial capital, negatively affecting the NPV of the project [22].
(4)
Cost overruns and failure to complete projects in time because the initial estimates would not have incorporated uncertainty which is intrinsic to mining projects.
(5)
Achievement of below-target, behind-schedule or beyond-budget outcomes [23].
Therefore, uncertainty in mine design and planning should not be addressed by using averages, but should be modelled using probabilistic or stochastic approaches. However, the concept of stochastic mine planning is not yet widely practiced since stochastic modelling is generally more computationally complex and demanding compared to deterministic modelling, despite the gradual uptake of stochastic mine planning in recent years. The uptake is underpinned by the realisation that stochastic mine planning accounts for uncertainty in mine planning. Although there is limited literature available on the application of probabilistic or stochastic BEV calculation [16], some growth is likely to occur in the future, since the probabilistic or stochastic BEV calculation approach supports the stochastic mine planning process by incorporating geological and economic uncertainty.

2.1. Geological Uncertainty

During the evaluation of a mineral deposit, the grade is estimated using geostatistical techniques by interpolating relatively limited data collected from exploration drilling results [21]. However, the main shortcoming with geostatistical estimation is that it fails to adequately reproduce the in situ spatial variability of geological parameters as inferred from available sample data [24]. Since the data is not representative of the entire mineral deposit, the geology of the deposit is a significant source of uncertainty in mining operations. The impacts of geological uncertainty on the success of mining operations were discussed by several authors including [20,21,25], among many others. Several works have been undertaken to model geological uncertainty in mine planning using conditional simulation. Conditional simulation was defined by [25] as a type of Monte Carlo simulation for modelling uncertainty in spatially distributed attributes, such as those encountered in mineral deposits. The works of [24,25,26,27,28,29], among many others, discuss examples of such applications.
The basic idea of conditional simulation is to reproduce the actual in situ variability and spatial continuity of geological attributes of interest [30]. Conditional simulation results in multiple equally probable realisations of the deposit as opposed to a single deposit produced by traditional geostatistical estimation methods. The use of multiple mineral deposit models to represent uncertainty of the spatial distribution of grades assists mine planners to assess the sensitivity of mine designs and plans to grade uncertainty, and to produce mine designs and plans with higher NPVs [24]. According to [29], stochastic optimisation can distinguish between the maximum possible contained metal from the minimum possible metal content. In their study of stochastic optimisation at a gold mine, Ref. [31] found that stochastic optimisation led to a 28% improvement in NPV over the LOM, compared to conventional (largely deterministic) approaches that were applied at the mine.

2.2. Economic Uncertainty

Commodity price is one of the other major sources of uncertainty in mining projects [21,32,33]. This is due to most mining companies being ‘price takers’ as commodity prices are often dictated by unpredictable global supply and demand fundamentals. Therefore, forecasting commodity price accurately is impossible, which makes commodity price a significant source of uncertainty in mine design and planning.
Several techniques have been developed to model uncertainty associated with commodity prices. These techniques are broadly classified as econometric, time series, stochastic-gaussian and dynamic systems methods [34]. However, research found that commodity price tends to follow two main stochastic behaviours. The first is the Brownian motion [35,36,37,38,39], also called a Wiener process. Equation (2) shows the Brownian motion with drift [35]:
dx = α dt + σ dz
where, x is the price, α is the drift parameter, d t is an increment of time,   σ is the standard deviation and d z is the increment of the Wiener process. The second behaviour is the mean-reverting behaviour, often observed in the prices for base metals [35,38,40] and is represented by Equation (3) [40]:
d x   x = K ( μ ln x ) d t + σ d z
where x is the spot price, K is the reversion speed, μ is the logarithm of the long-term equilibrium level of metal price, σ is the standard deviation, d t is an increment of time and d z is an increment in a standard Weiner process.
In addition to commodity price uncertainties, the other major source of economic uncertainty in mining projects is exchange rates [33,36] and cost, because they are difficult to predict over the LOM due to the lack of engineering and economic information required at the planning stage. Exchange rates are volatile, making it speculative and erroneous to represent them using averages. Regarding cost, the actual cost of mining and processing a specific block in a block model will only be known with certainty after the block has been completely mined.
Most of the work discussed above considered the modelling of grade and commodity price uncertainty separately. Research on simultaneously integrating grade and price uncertainty during mine design and planning is growing, and includes the works of [41,42,43,44].

3. Research Methodology or Steps

3.1. Conversion of the Geological Block Model into an Economic Block Model

The probabilistic BEV calculation approach presented in this paper started by developing a 5 m × 2 m × 5 m (X, Y and Z directions, respectively) geological block model in Surpac software. The block model with 366,792 blocks shows a steeply dipping gold orebody at a range of 60 to 80 degrees with a strike length of about 280 m. The width of the orebody varies between 2 m to 15 m. The orebody is a relatively small low-grade deposit with gold grade varying from 0 g/t to about 6 g/t. In the design, main levels were located at 60 m vertical intervals with sub-levels located 15 m between the main levels.
The geological block model was then converted into a deterministic economic block model by applying the following factors in calculating BEVs, where the input parameters are average values, as per the typical practice in deterministic BEV calculation:
(1)
Density of rock was based on a mean value of 3 t/m3.
(2)
Mining and processing costs were assumed to be $50/t and $30/t, respectively.
(3)
Average gold price was US$1520/oz.
(4)
Average mineral processing recovery rate was 84%.
Using the same data set as for the deterministic scenario, uncertainty was then incorporated to selected BEV input parameters. To model uncertainty associated with gold grade, the Sequential Gaussian Simulation (SGS) embedded in Surpac software was used to run conditional simulations. Twenty realisations were run, resulting in twenty equally probable realisations of the orebody. The mean and standard deviation of the gold grade for each block was calculated from the conditional simulation results of the geological block model. The statistical parameters were used to further run Monte Carlo simulations of gold grade in calculating BEVs. The grade values for the geological block model were then analysed in @Risk software, which showed that the gold grade for the deposit followed a slightly positively skewed lognormal probability distribution. These results confirm findings by [1] that mineral commodities, such as precious metals that are measured in parts per million or grams per tonne, tend to be positively skewed. The lognormal distribution was therefore used to further simulate the gold grade (simultaneously with other BEV input parameters). The use of conditional simulation in combination with other techniques is normal practice in evaluating orebodies. For example, [42] used conditional simulation in combination with Monte Carlo simulation, while [26] used conditional simulation in combination with Whittle 4D.
In addition to grade, the other input parameters used to calculate BEV are block dimensions, rock density, mineral processing recovery rate, commodity price, mining cost and processing cost. Mining and processing cost were assumed to be constant, and uncertainty was modelled for density, mineral processing recovery rate, and gold price. Density was assumed to follow a normal distribution with μ and σ of 3.0 t/m3 and 0.05 t/m3, respectively; mineral processing recovery rate was assumed to follow a uniform distribution with minimum and maximum values of 80% and 89%, respectively; and gold price was assumed to follow a Geometric Brownian Motion. The different BEV input parameters were combined into a single model given by Equation (4):
B E V i j = ( G i j × R i j × P t   C m i j C p i j ) × T i j
where;
  • B E V i j is the economic value of block bij at time t,
  • G i j   ~ L o g N   ( μ , σ 2 ) is the gold grade of block bij,
  • R i j   ~ U   ( α , β ) is the recovery rate of processing block bij,
  • P t = p 0 e [ ( µ σ 2 2 ) t + σ d B ( t ) ] is the gold price at time, t,
  • C m i j = is the cost per tonne of mining block bij,
  • C p i j = is the cost per tonne of processing block bij,
  • T i j = X I N C i j × Y I N C i j × Z I N C i j × D i j is the tonnage of block bij,
  • X I N C i j is the dimension of block bij in the x direction,
  • Y I N C i j is the dimension of block bij in the y direction,
  • Z I N C i j is the dimension of block bij in the z direction,
  • D i j   ~ N   ( μ ,   σ 2 ) is the density of block bij.

3.2. Simulation of Block Economic Values

The BEV calculation model indicated by Equation (4) was then used in the simulation of BEVs in Microsoft Excel. After a series of trial and error from about 100 iterations initially, and considering the 366,792 blocks in the model, it ended up being practical to set up and run 5000 iterations over two weeks to generate reasonably stable BEV distributions for each block. Using the simulated BEVs, the probability of each block being positive was calculated based on the number of times the BEV was positive. Using the probabilities, several economic block models with probabilities of BEV being positive were created. For illustration and discussion purposes, this paper only presents results at 10%, 30%, 50%, 70%, 90%, and 100% probability intervals. The 10% and 100% probability economic block models represent the economic block models with blocks with lowest and highest confidence of being economic, respectively. The lowest confidence and highest confidence assume the worst-case values and best-case values of the range of input parameters sampled from the assumed underlying probability distributions of these input parameters, respectively. For example, a 100% probability economic block model does not mean that even when the gold price is zero, the blocks in the block model will be economic. It means that based on the range of inputs sampled from the various probability distributions, the blocks were found to be positive in all iterations. However, 100% confidence cannot be achieved because the future is always uncertain. The simulated economic block models were then used to design stopes based at varying levels of risk. The stopes which were designed in Mineable Shape Optimizer (MSO) module available Datamine software are denoted as P10, P30, P50, P70, P90, and P100 stopes for the different probability levels.

4. Results and Discussion

4.1. Deterministic and Probabilistic Economic Block Models

Figure 1 shows the deterministic economic block model coloured by BEV attribute.
The output of deterministic economic block modelling are single BEVs from which all blocks with negative BEVs are considered as uneconomic and excluded without evaluating the potential of the blocks to be economic under different future scenarios. After excluding the uneconomic blocks, the resulting total economic value, tonnage, and grade of the final deterministic economic block model were $17.71 m, 0.71 Mt and 3.27 g/t, respectively. After simulating BEVs, probabilistic economic block models at different probabilities were created as described in the previous section. These are shown in Figure 2.
A visual observation of Figure 2 shows that as the probability of BEV being positive increases, then the number of blocks decreases, resulting in the orebody size, hence tonnage, also decreasing. This means that a significant portion of the orebody is sacrificed by increasing the confidence levels in BEVs. This information is important during mine planning to understand the likely ranges of total orebody tonnage, grade, and contained metal at difference risk levels. The key economic and technical factors of a project were analysed for different probabilities to establish the impact of uncertainty on project outcomes, as summarised in Figure 3 and Figure 4.
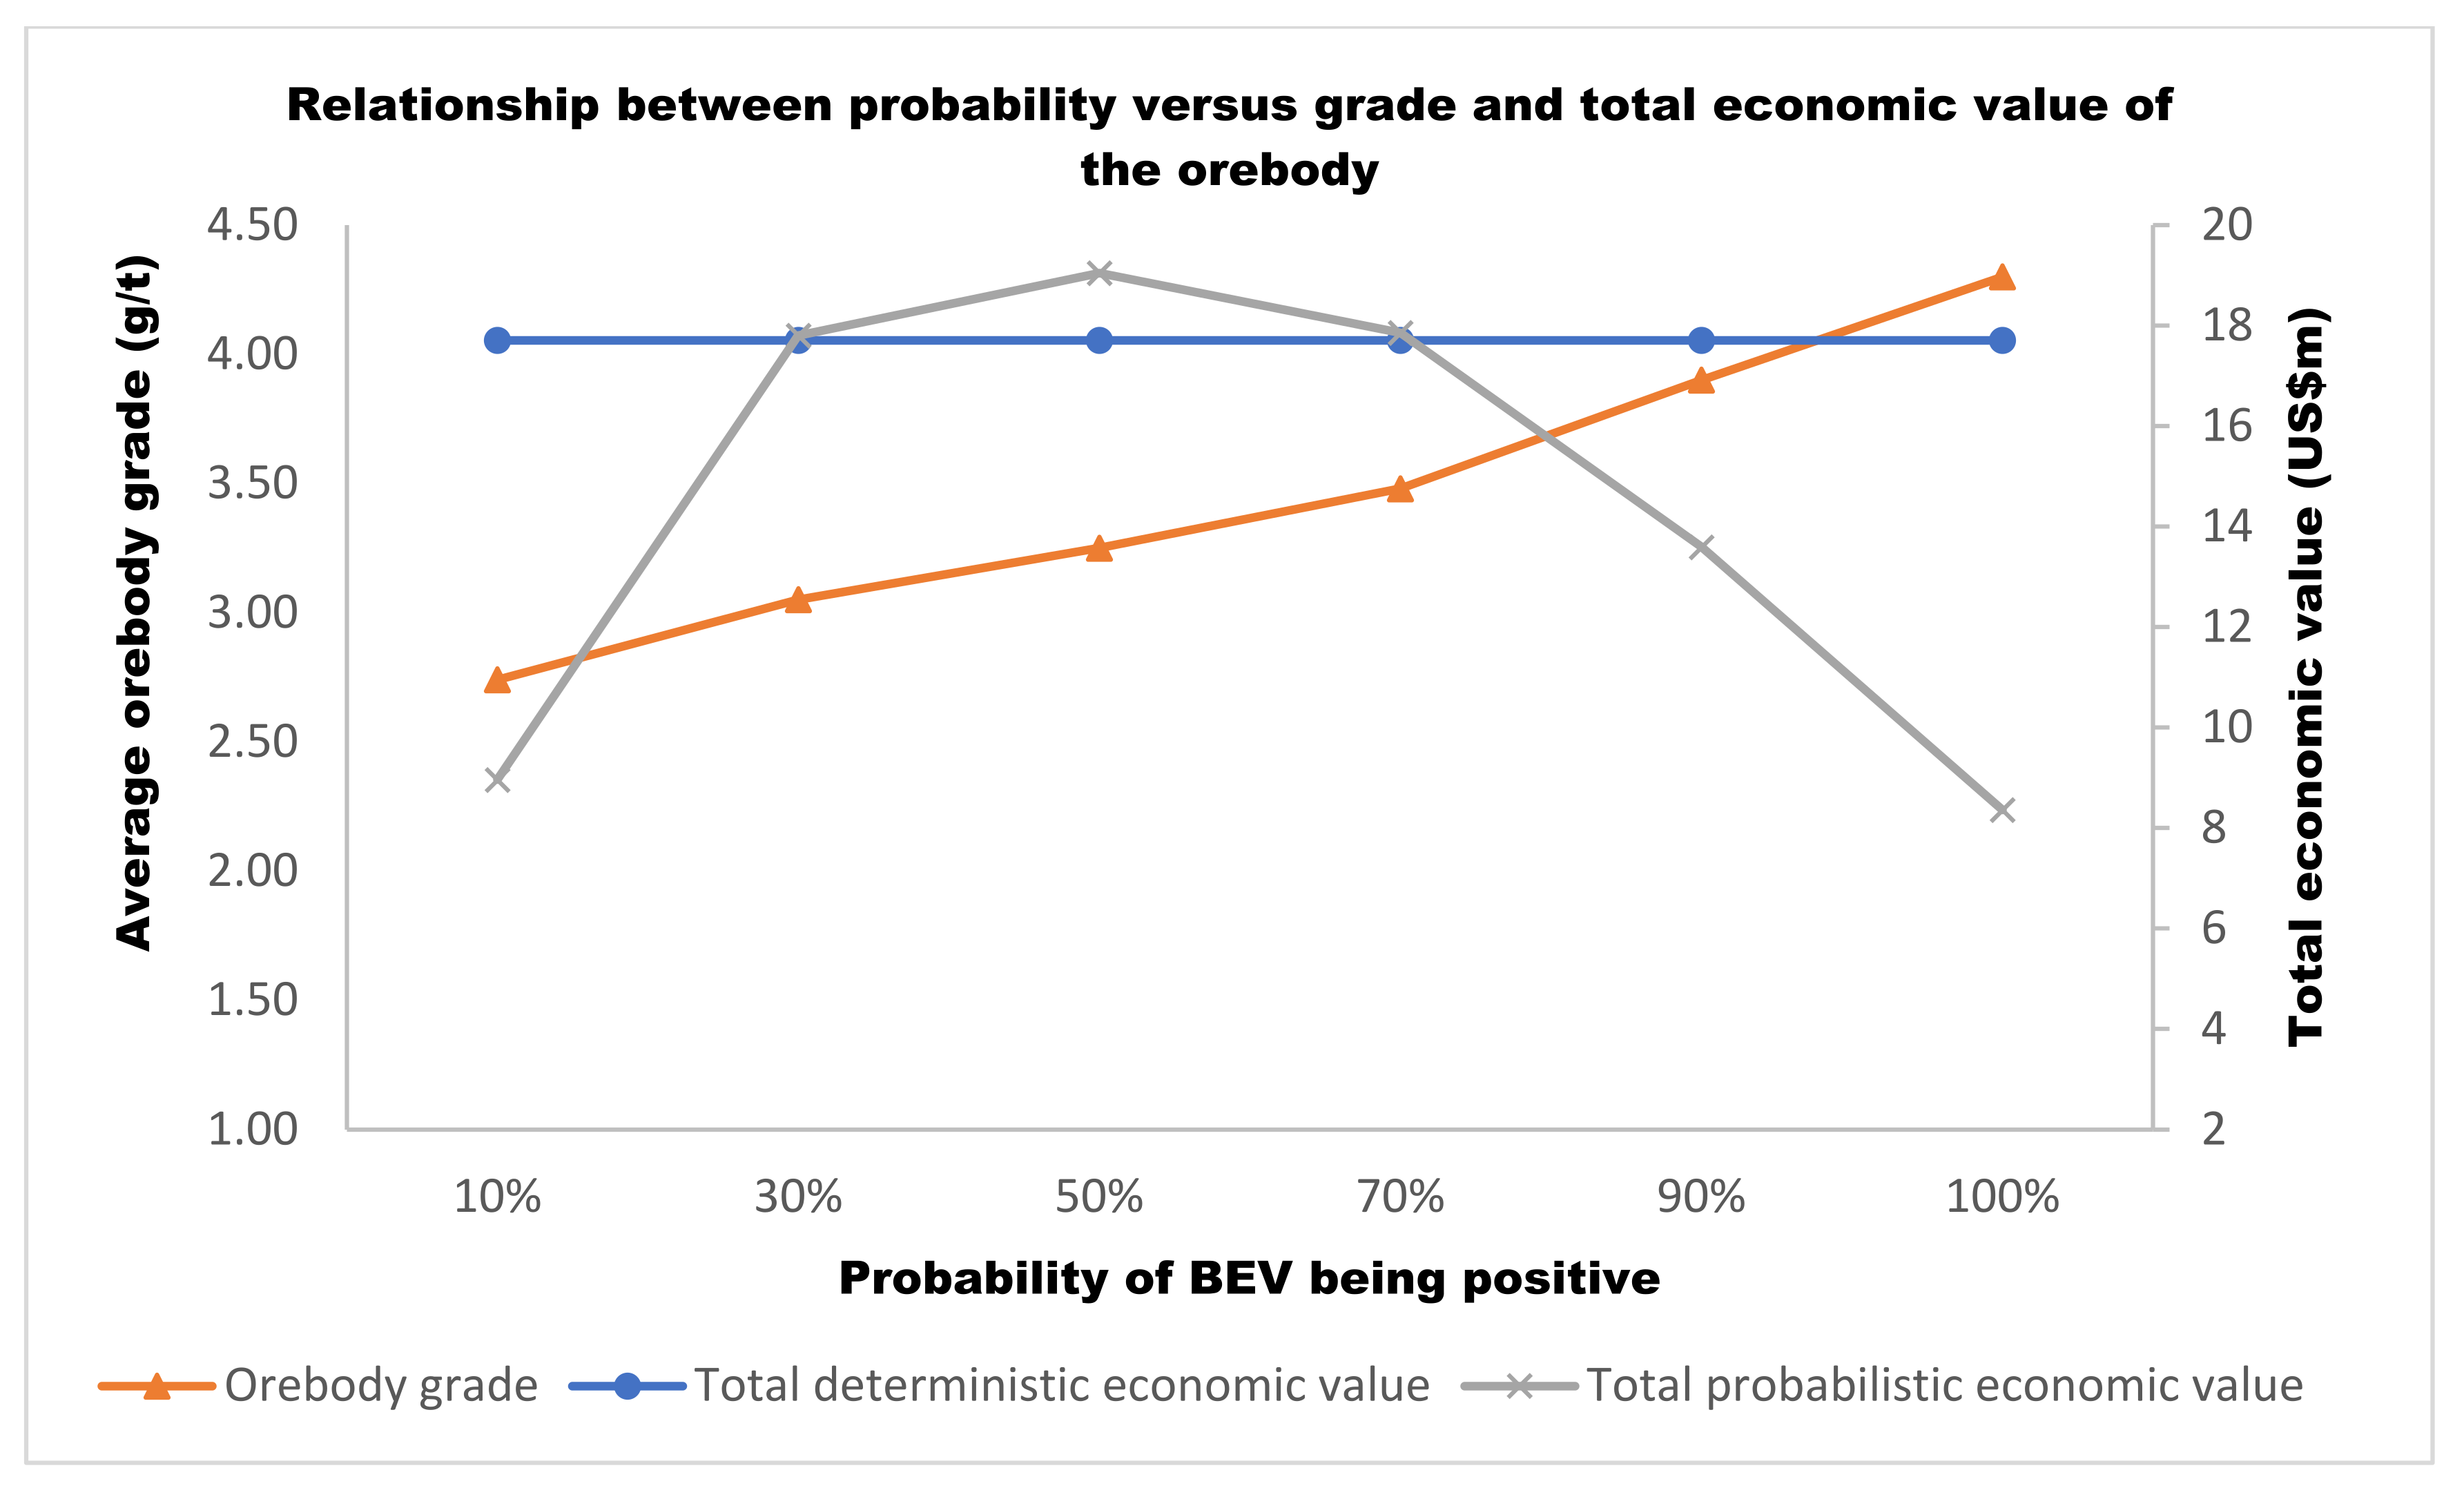
Uncertainty affects the overall economics of a mining project, as shown in Figure 3 and Figure 4. Figure 3 shows that the total economic value of the deterministic is constant as expected. In contrast with probabilistic orebodies, as the probability increases, the total economic value of the orebody increases to a peak at about 50% probability. This is because at the lowest confidence, all blocks in the orebody are included whether they have positive or negative BEVs, but as the confidence increases, the number of blocks with negative BEVs decreases, hence increasing total economic value. However, as the probability continues to increase, the total economic value of the orebody decreases, because all blocks with negative BEVs and low positive BEVs are excluded from the orebody as confidence increases.
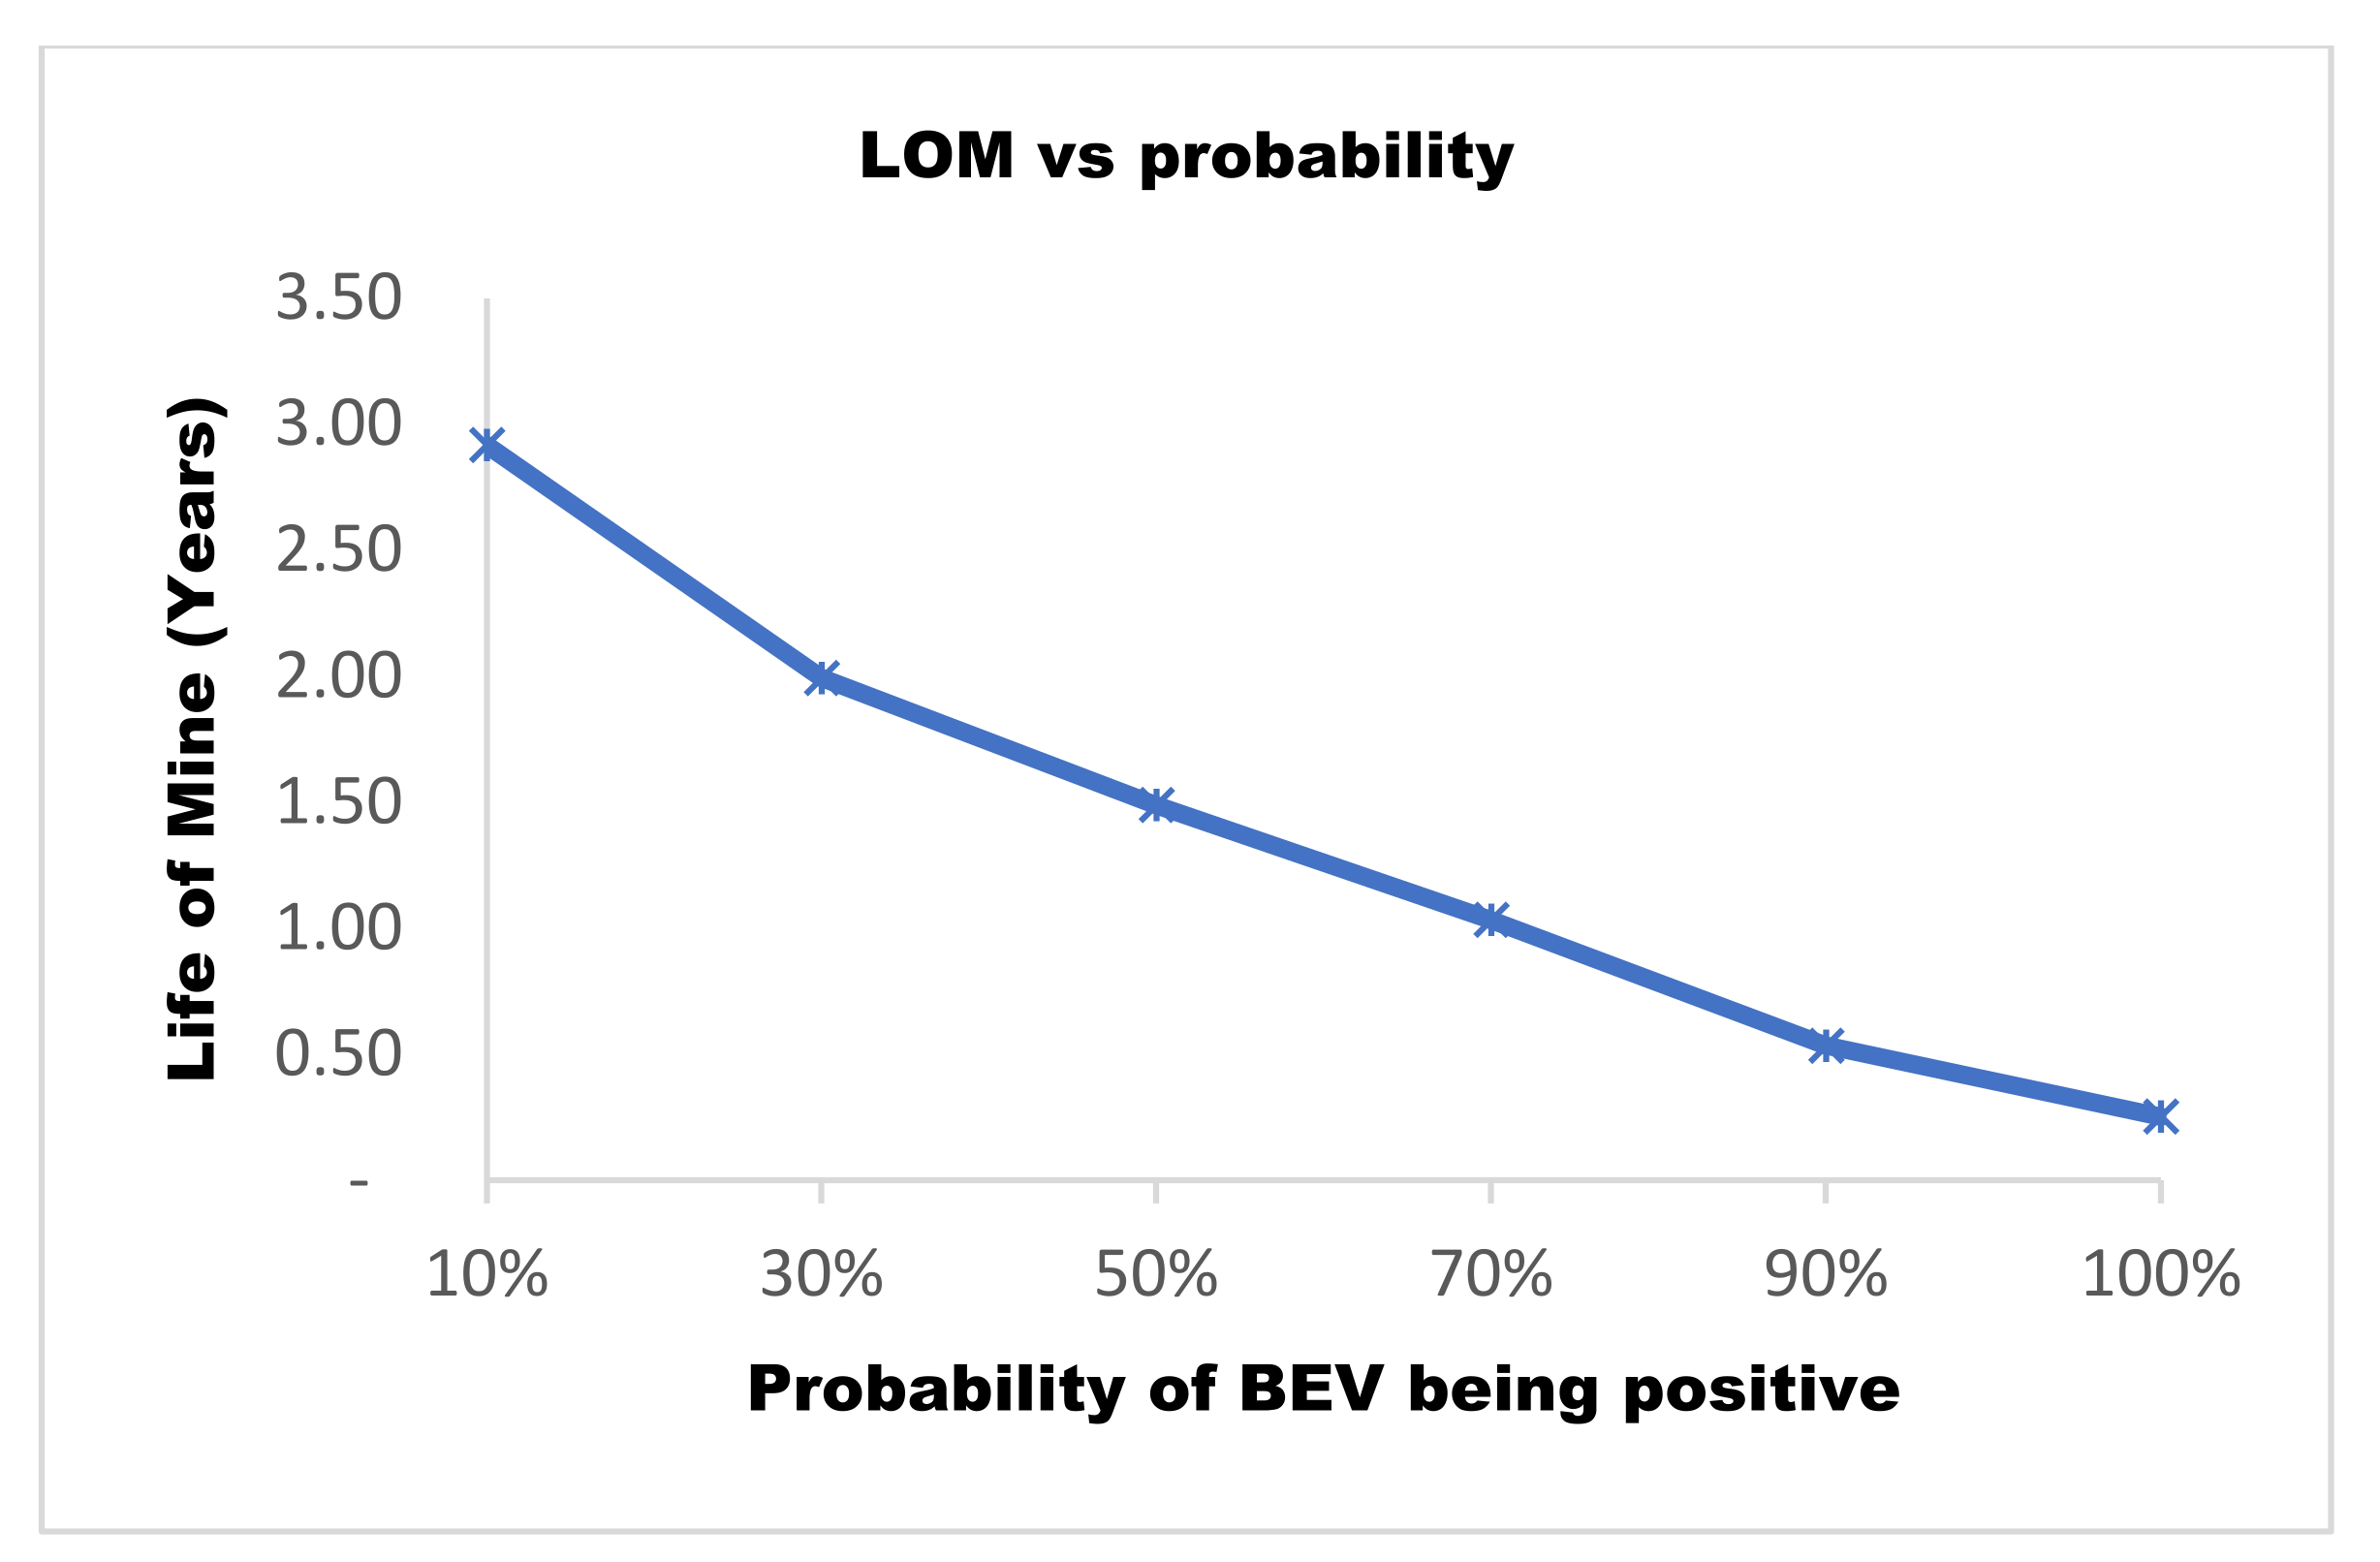
Figure 3 also shows that as probability increases, the average grade of the orebody increases. The highest average grade is obtained with the P100 economic block model. This is the block model that would result in the most reliable stope design. However, extracting only the P100 orebody would be akin to ‘high grading’, a mining practice that is generally unsustainable because it may result in sterilizing a large part of the orebody, thereby destroying economic value. Also, the high average grade may not be able to offset the lower orebody tonnage (Figure 2). This may also result in the mine failing to meet production targets and having a reduced and unpractical LOM, as demonstrated in Figure 4.

4.2. Comparison of Deterministic and Probabilistic Stope Designs

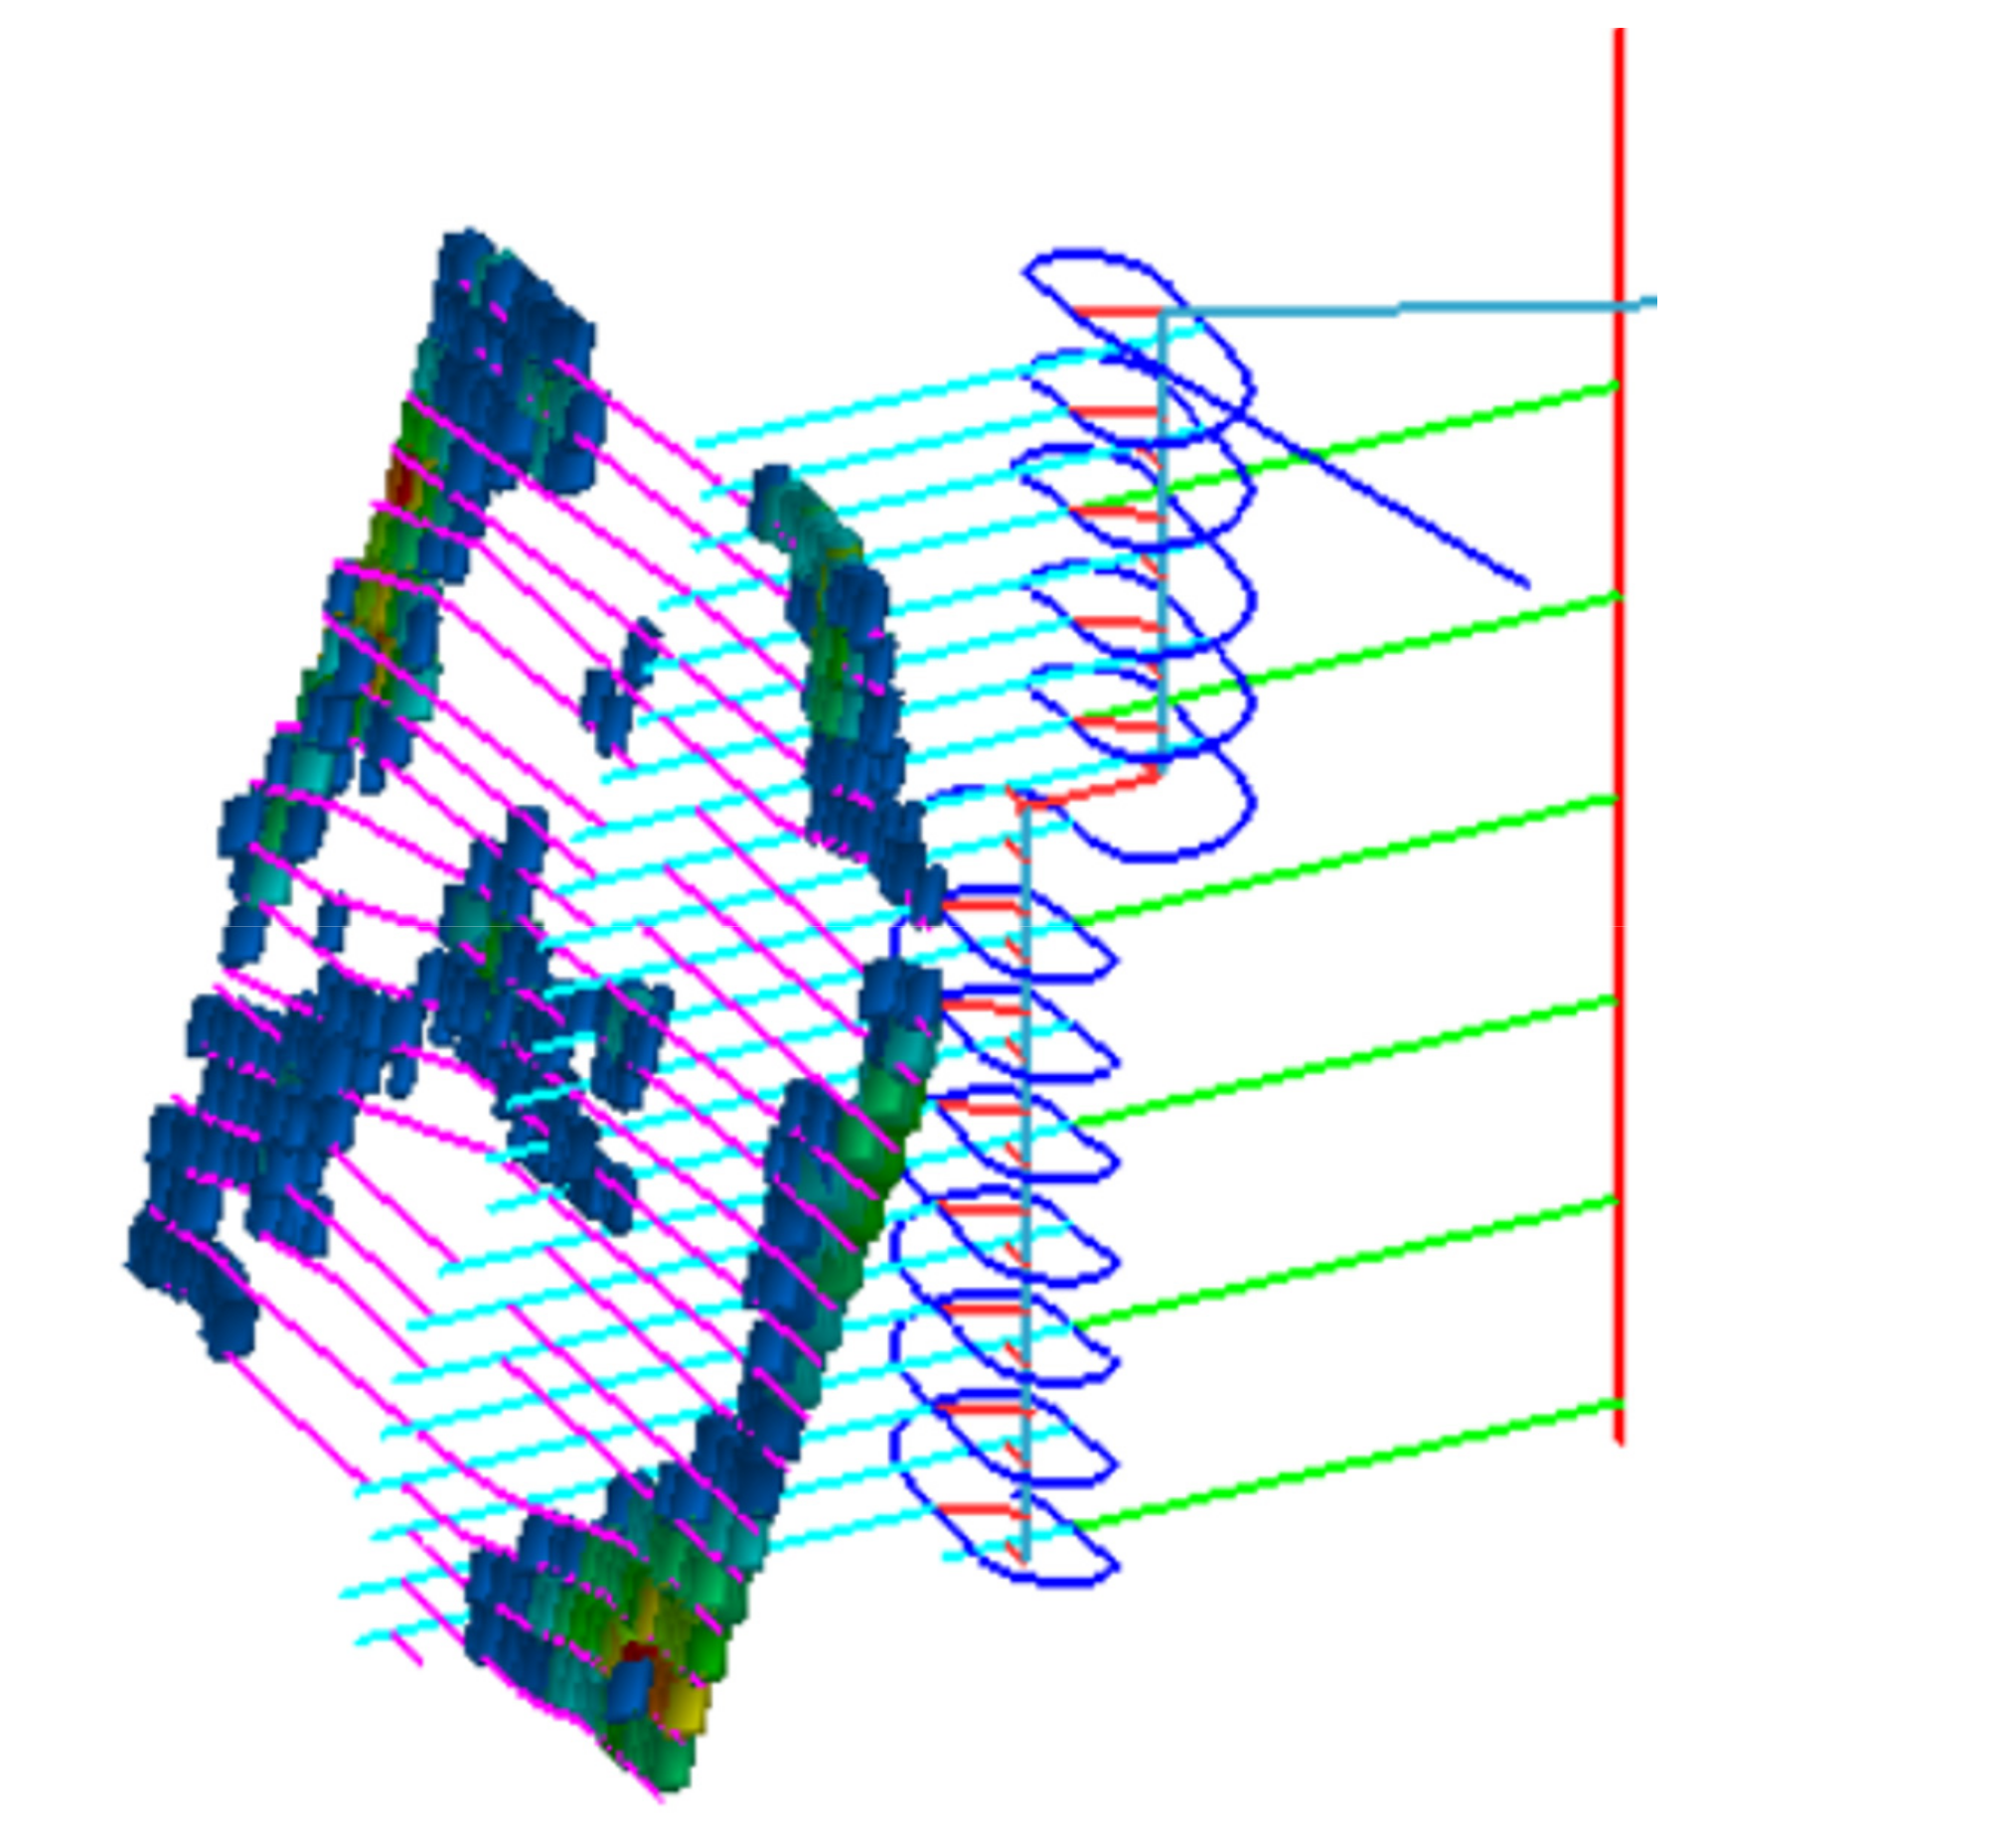
Figure 5 and Figure 6 show the deterministic stope design and probabilistic stope designs which were generated using the probabilistic economic orebody models presented in the previous section. The basic conceptual SLOS designs of primary and secondary development were performed for each stope design. Each design consists of a vertical shaft (red), main levels (green), ramp (blue), sub-levels (turquoise), and strike drives (purple). Table 1 shows the assumptions used in designing the primary and secondary development.
The deterministic stopes consist of a total of 463 stopes with 937,465 t of ore and an economic value of $714,614. However, these deterministic stopes do not quantify the probability of the stopes being mined to the defined dimensions, thus ignoring uncertainty encountered in actual mining practice. Probabilistic stopes denoted as P10, P30, P50, P70, P90, and P100 stopes, respectively, in Figure 6 are equally probable under different future scenarios.
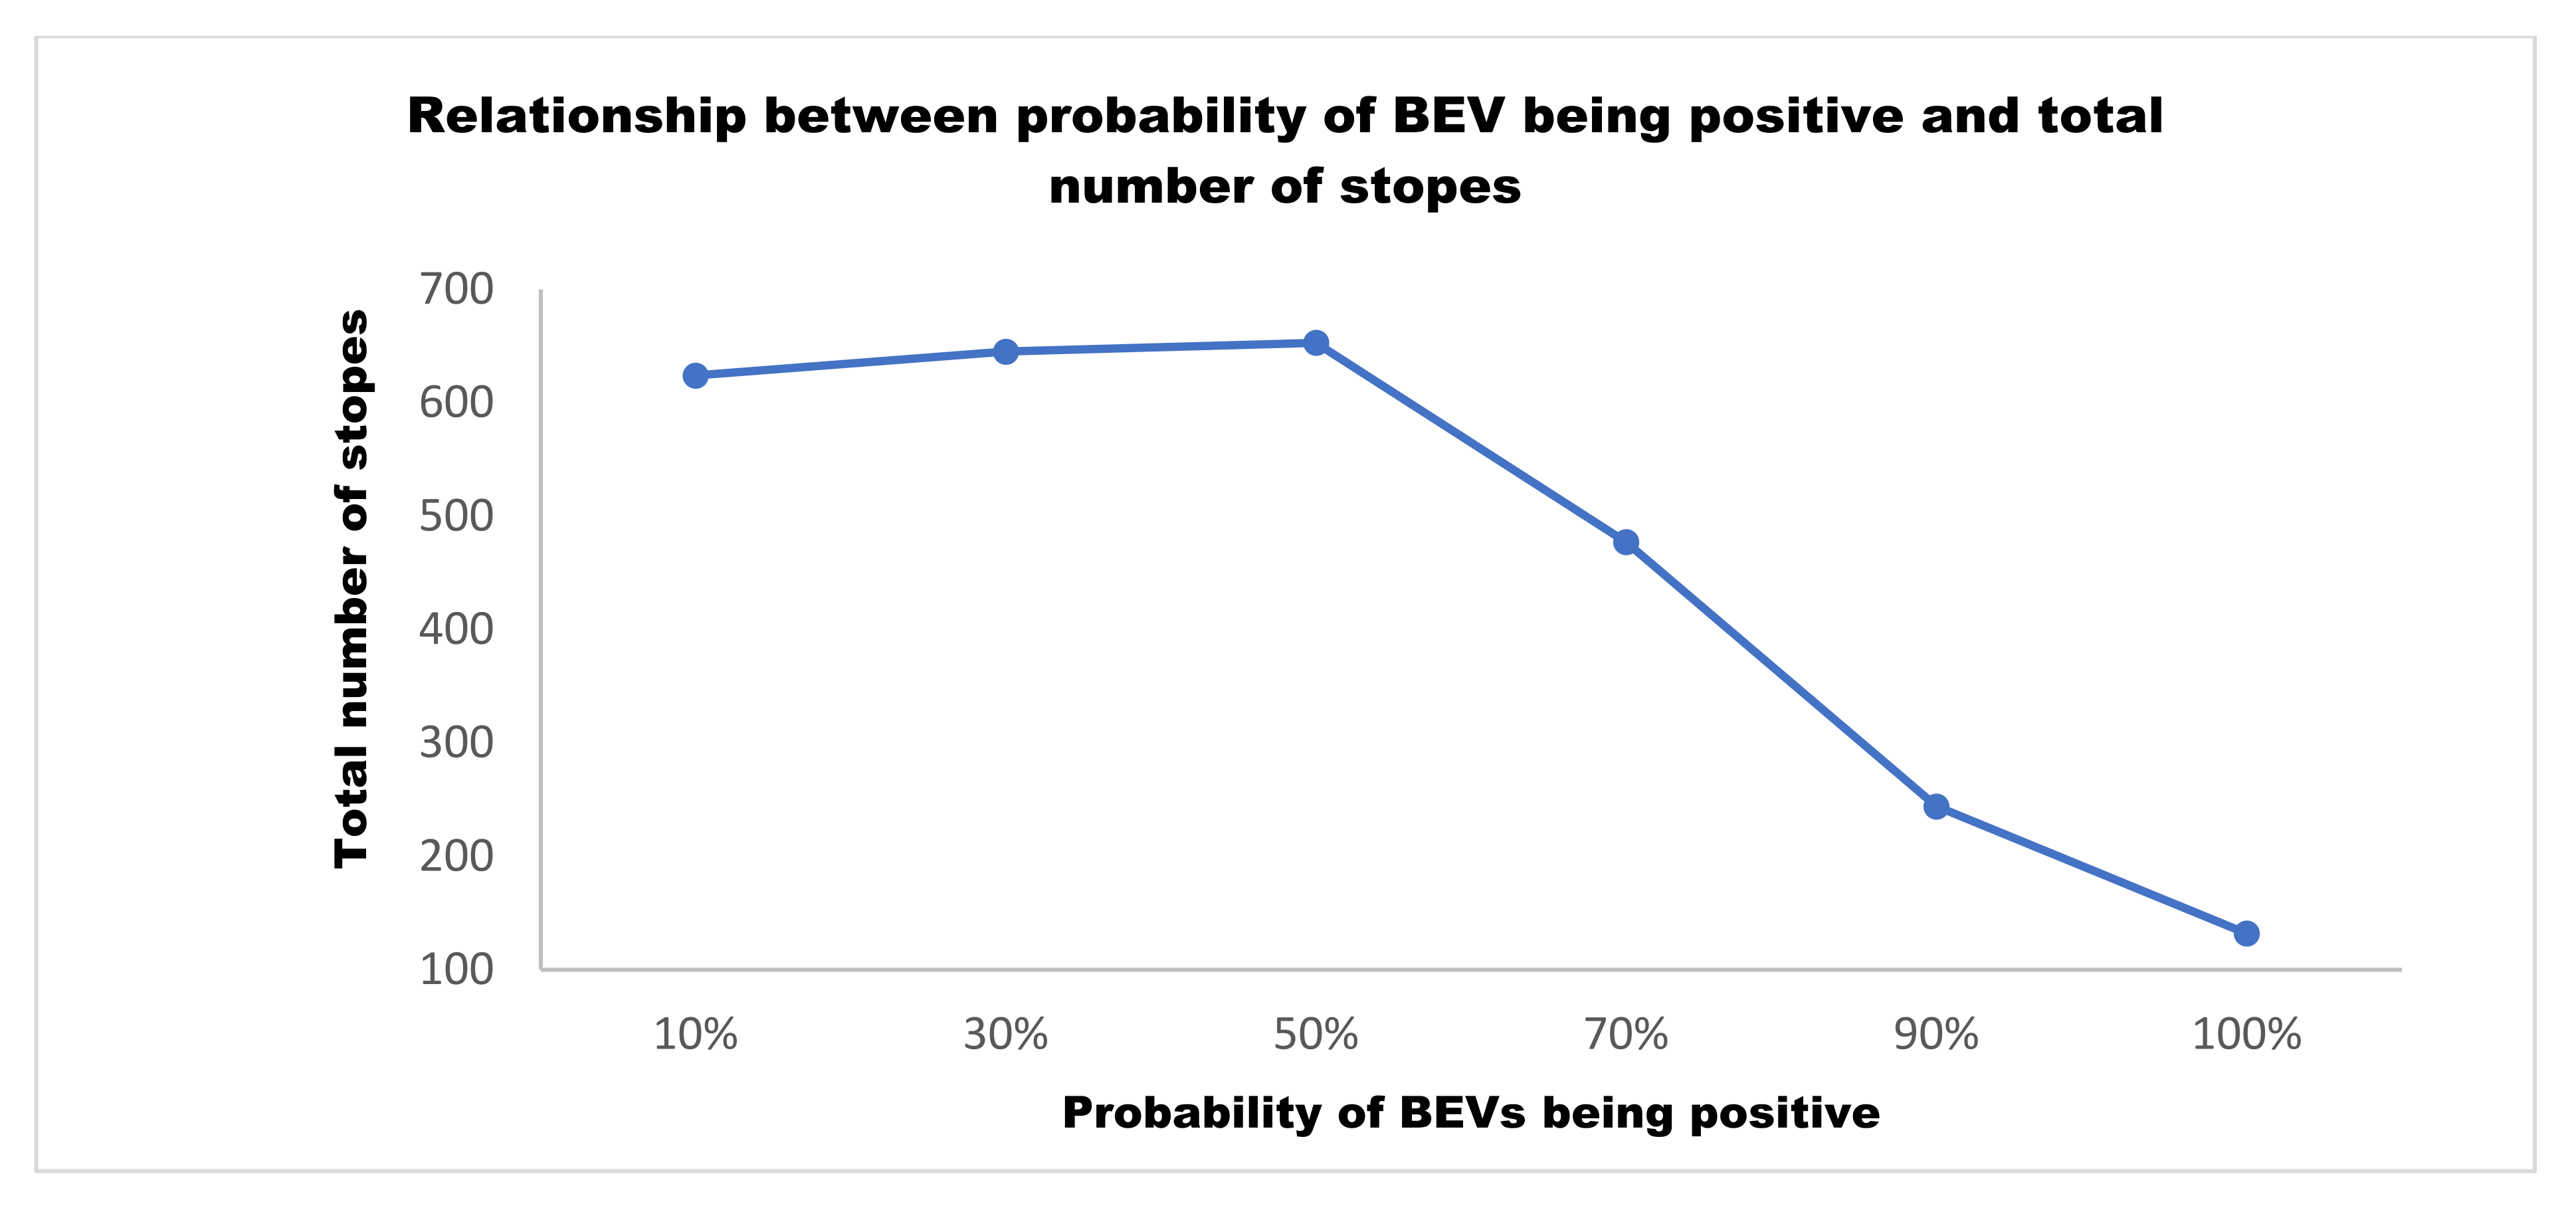
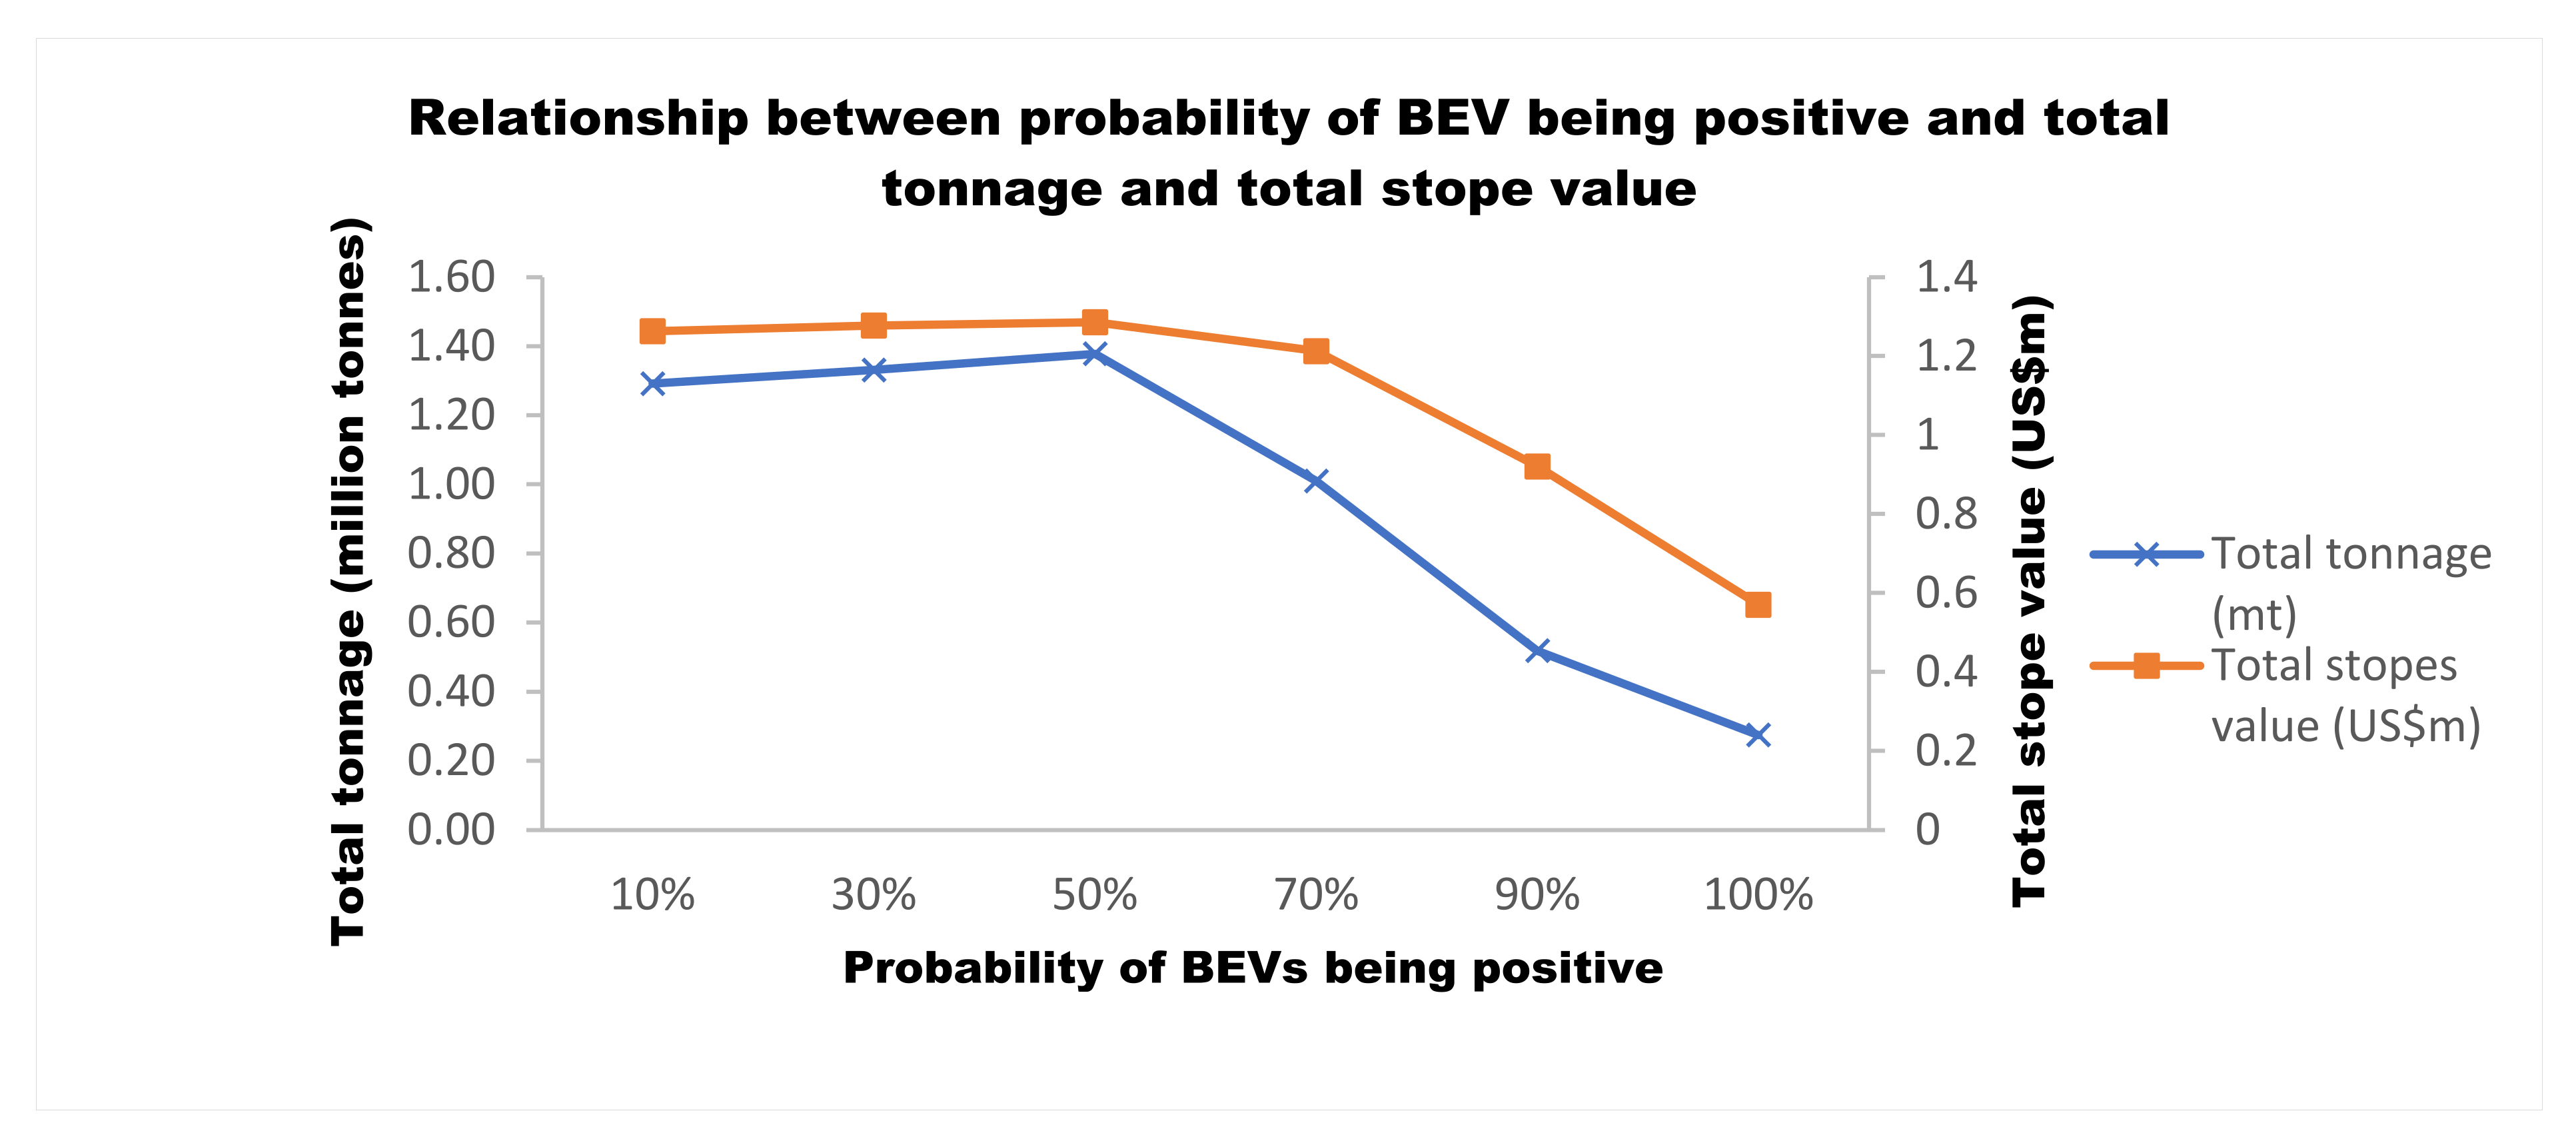
Figure 7 and Figure 8 show the impact of uncertainty on the total number of stopes, total stope tonnage and total stope economic value, respectively. The figures show almost similar trends discussed in the previous section of slightly increasing trends from 10% probability to about 50% probability, and a significant declining trend from 50% to 100% probability.
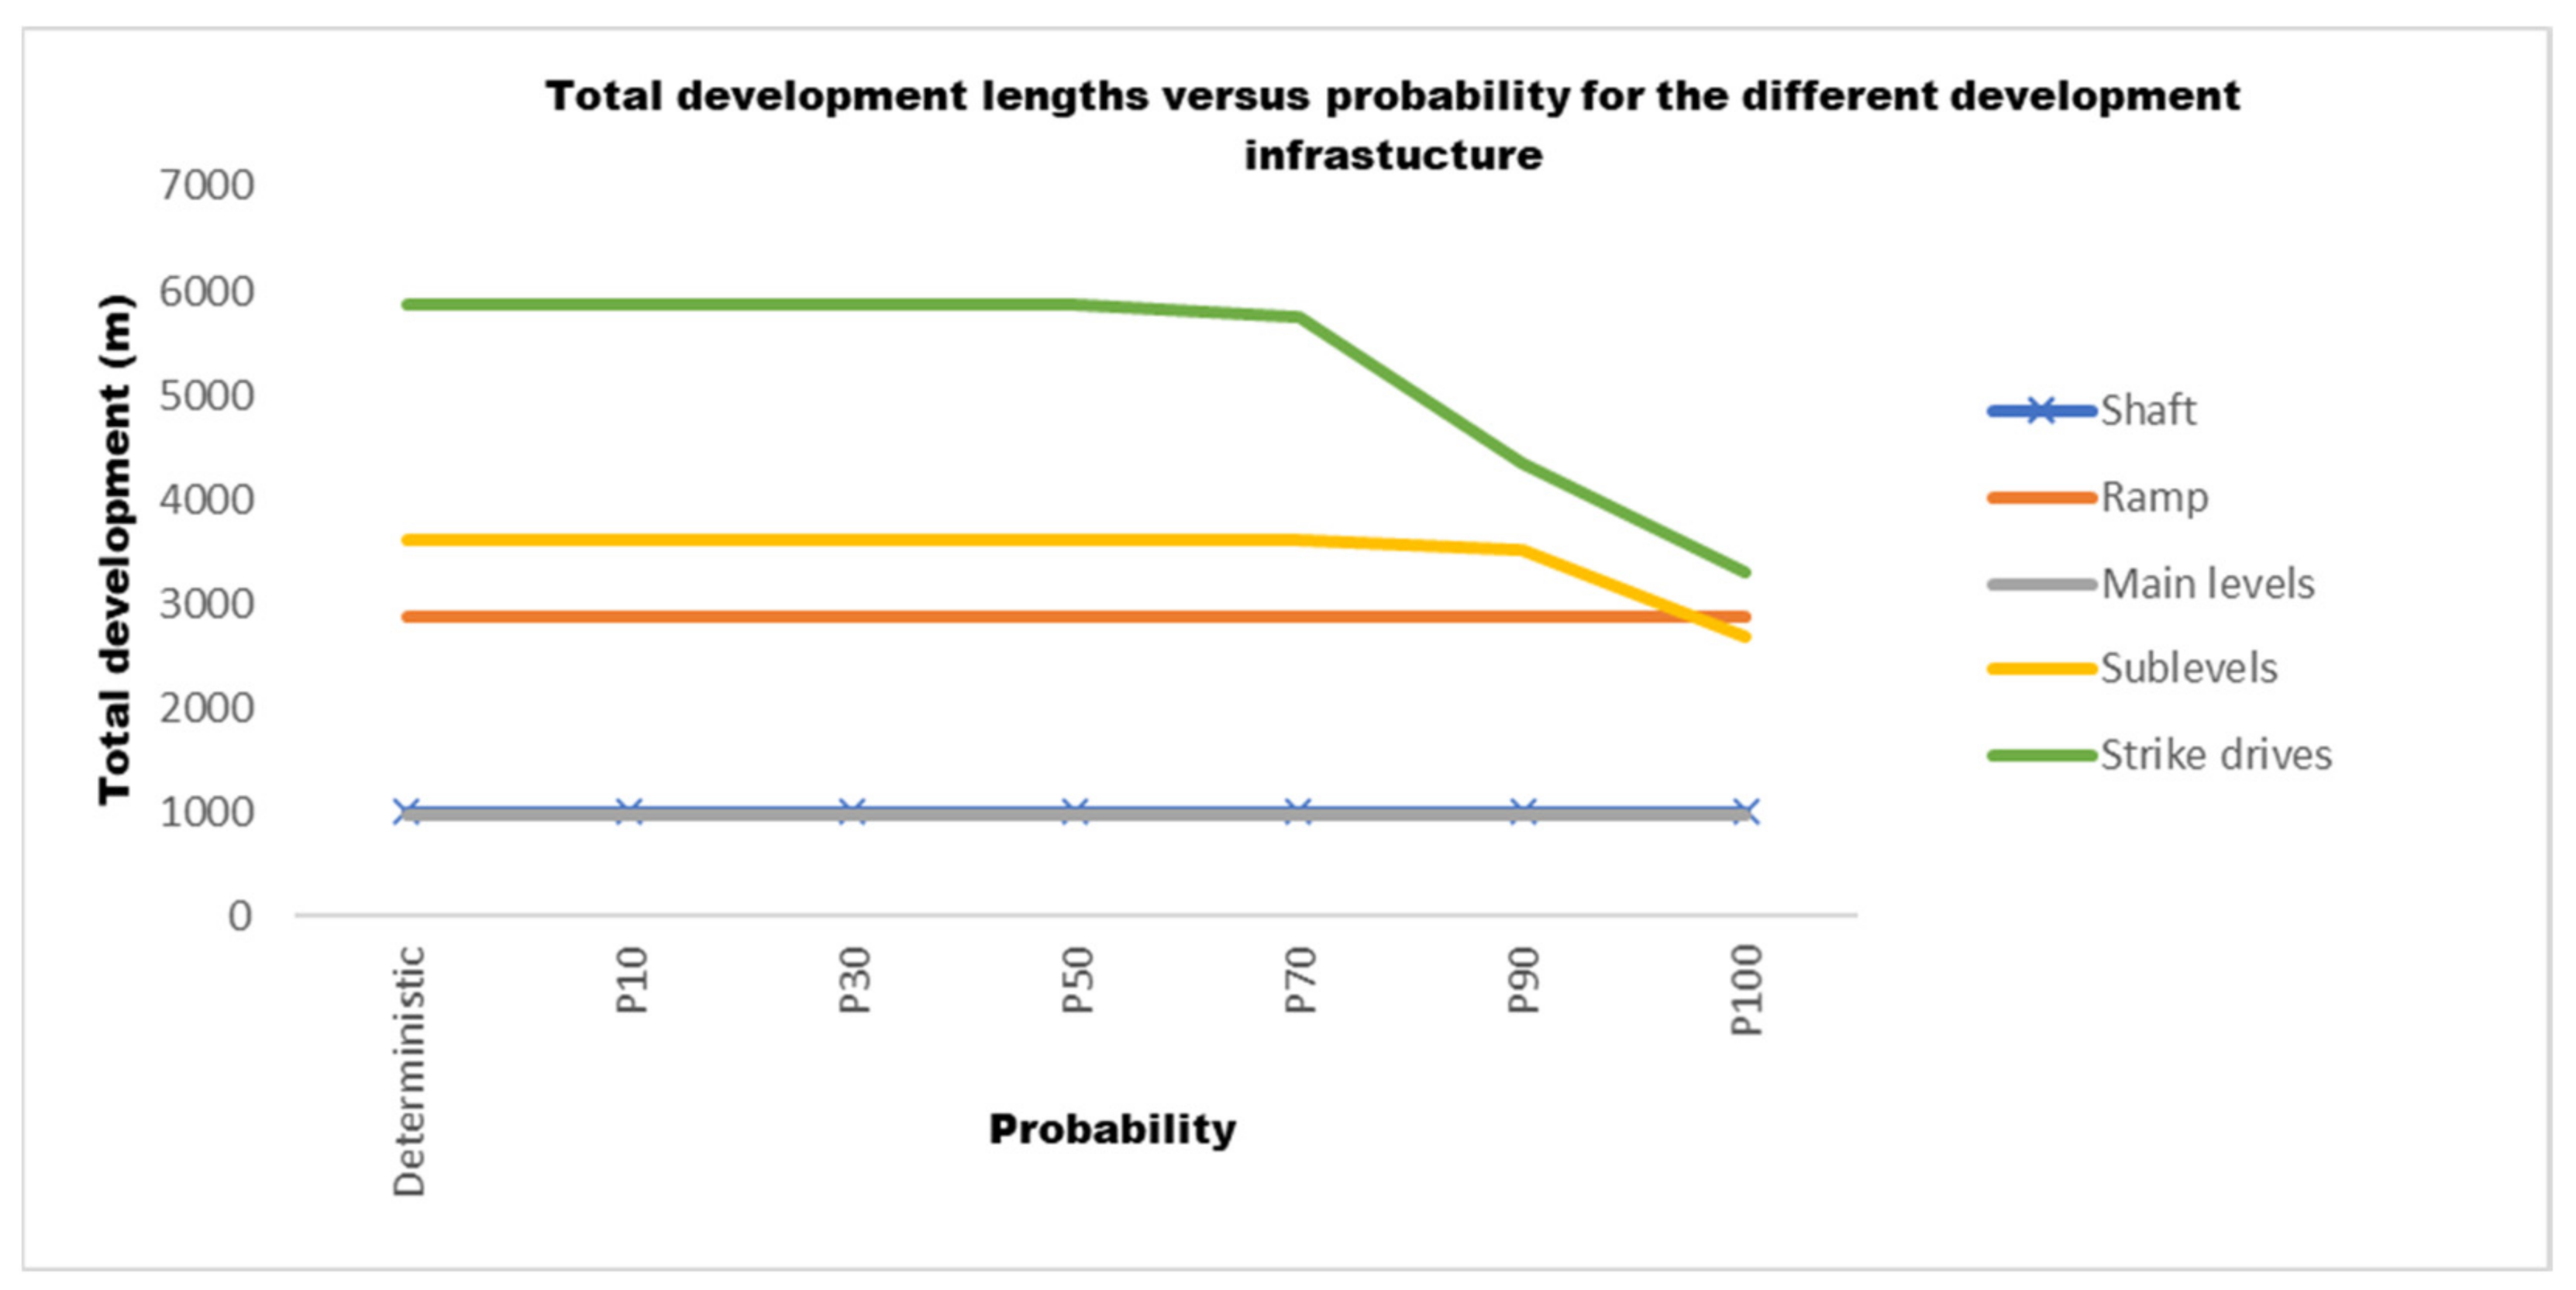
In addition to the impact of uncertainty on the total number of stopes, total stope tonnages, and total economic value, the different stope designs also show that uncertainty impacts the amount of development infrastructure required. From each stope design (Figure 6), the total development meters for all development excavations were calculated. Figure 9 shows the different types of development and their total lengths or depth (for the shaft) in relation to probability.
Figure 9 shows that uncertainty has a significant effect on the amount of primary and secondary development required. The figure shows that the shaft, ramp, and main levels have the same total depths or lengths for all the designs. Therefore, the same amount of development of these excavations is required regardless of the confidence in the economic value of the stopes. This is because both the lateral and vertical extends of the orebody remained the same as probability increased. The same is true for strike drives and sublevels up to about 50% and 70% probability, respectively. However, as the confidence increases from 50% for strike drives and 70% for sub-levels, the total length of development reduces because the size of the orebody reduces significantly. As probability increases causing the size of the orebody to decrease, some portions of the orebody become uneconomic such that no secondary development is required to access those portions. These results are useful when estimating the range of capital required to develop a mine. From the total development length or depth for each development excavation, the total development cost was calculated based on the per meter cost assumptions provided in Table 2.
A conceptual DCF analysis was done for the respective designs to calculate the NPV for each design. This was done to analyse the combined effect on NPV of the observed results of decreasing tonnage, LOM, and development cost, and increasing average orebody grade as confidence increased. The data used in the DCF analysis included total stope tonnage and average grade of the simulated orebodies, total capital cost of development for the respective designs together with the average gold price, mineral processing recovery rate, mining cost, and processing cost. The royalty rate and tax rate formulae applicable to South African gold mines were used. Figure 10 shows the NPV results for the different stope designs.
Figure 10 shows that as probability increases from 10% to 50%, NPV also increases to peak at approximately $29 m at 50% probability, then declines as probability further increases to 100%, as also observed and explained in previous sections of the paper. P10, P90, and P100 stope designs all have NPVs less than the NPV for the deterministic design. The NPV for probabilistic designs is 20% to 53% higher than the NPV for the deterministic design for a range of probability from 30% to 70%. These results confirm the results in Figure 3, which show that economic block models at a probability range within 30% to 70% have higher economic values than the deterministic economic block model. These results show that the deterministic BEV calculation may underestimate or overestimate the true potential of the orebody because it does not quantify the upside or downside risk associated with BEVs. These results also indicate that the orebodies with approximately 30% to 70% of blocks being positive for BEV are the ones that should be used for mine design and planning.

5. Conclusions

The paper presented a probabilistic BEV calculation approach that simultaneously incorporates uncertainty associated with geological and economic parameters used in calculating BEVs. This approach ensures that uncertainty which is intrinsic to a mineral deposit is incorporated during the early stages of the mine design and planning process. This is important, as it establishes a foundation for creating robust mine designs and plans later in the design and planning process. This research found that as confidence in the BEV increases, the size of the economic block model decreases concomitantly with the LOM, whilst the average grade of the block model that is amenable for extraction increases. The probabilistic approach generated NPVs that were 20% to 53% higher than for the deterministic approach and this was observed within 30% to 70% probability range. This finding suggests that orebodies with approximately 30% to 70% of their blocks having positive BEVs, are the ones that should be considered for mine design and planning. It was also found that the NPV peaked at approximately 50% probability, but decreased as the probability increased beyond 50%. However, it is quite probable that the NPV may peak at a probability which is not 50%, because this may vary from block model to block model depending on probability distributions underlying the input parameters used to calculate the BEVs.

Author Contributions

Conceptualization, T.T. and C.M.; methodology, T.T. and C.M.; software, T.T.; validation, T.T.; formal analysis, T.T.; investigation, T.T.; writing—original draft preparation, T.T.; writing—review and editing, C.M.; supervision, C.M. All authors have read and agreed to the published version of the manuscript.

Funding

The APC was funded by the School of Mining Engineering, University of the Witwatersrand., Johannesburg.

Data Availability Statement

The method presented in this paper can be applied on any geological block model data. However, specific data supporting reported results can be requested from [email protected].

Conflicts of Interest

The authors declare no conflict of interest.

References

  1. Coombes, J. The Art and Science of Resource Estimation: A Practical Guide for Geologists and Engineers; Coombes Capability: Perth, Australia, 2008; 232p. [Google Scholar]
  2. Ataee-pour, M. A linear model for determination of block economic values. In Proceedings of the 19th International Mining Congress and Fair of Turkey, İzmir, Turkey, 9–12 June 2005; pp. 289–294. [Google Scholar]
  3. Chung, J.; Topal, E.; Ghosh, A.K. Where to make the transition from open-pit to underground? Using integer programming. J. S. Afr. Inst. Min. Metall. 2016, 116, 801–808. [Google Scholar] [CrossRef] [Green Version]
  4. Jamshidi, M.; Osanloo, M. Determination of block economic value in multi-element deposits. In Proceedings of the 6th International Conference on Computer Applications in the Minerals Industries, CAMI2016-06, Istanbul, Turkey, 5–7 October 2016. [Google Scholar]
  5. Nhleko, A.; Tholana, T.; Neingo, P. A review of underground stope boundary optimization algorithms. Resour. Policy 2018, 56, 59–69. [Google Scholar] [CrossRef]
  6. Tholana, T.; Musingwini, C.; Ali, M.M. A stochastic block economic value model. In Proceedings of the Mine Planners Colloquium 2019: Skills for the Future—Yours and Your Mine’s, Johannesburg, South Africa, 22–23 May 2019; The Southern African Institute of Mining and Metallurgy: Johannesburg, Southern Africa, 2019; pp. 35–50. [Google Scholar]
  7. Nikbin, V.; Ataee-Pour, M.; Shahriar, K.; Pourrahimian, Y. A 3D approximate hybrid algorithm for stope boundary optimization. Comput. Oper. Res. 2020, 115, 104475. [Google Scholar] [CrossRef]
  8. Alford, C. Optimisation in underground mine design. Proc. Int. J. Rock Mech. Min. Sci. Geomech. Abstr. 1996, 33, 213–218. [Google Scholar]
  9. Sandanayake, D.S.; Topal, E.; Asad, M.W. Designing an optimal stope layout for underground mining based on a heuristic algorithm. Int. J. Min. Sci. Technol. 2015, 25, 767–772. [Google Scholar] [CrossRef]
  10. Sari, Y.A.; Kumral, M. A planning approach for polymetallic mines using a sublevel stoping technique with pillars and ultimate stope limits. Eng. Optim. 2020, 52, 932–944. [Google Scholar] [CrossRef]
  11. Martha, E.; Matamoros, V.; Kumral, M. Calibration of genetic algorithm parameters for mining-related optimization problems. Nat. Resour. Res. 2019, 28, 443–456. [Google Scholar]
  12. Wilson, B.; Boisvert, J. Updates and Implementation Recommendations for Stochastic Stope Layout Optimization. Cent. Comput. Geostat. 2020, 22, 1–10. [Google Scholar]
  13. Faria, M.F.; Dimitrakopoulos, R.; Pinto, C. Stochastic stope design optimisation under grade uncertainty and dynamic development costs. Int. J. Min. Reclam. Environ. 2022, 36, 81–103. [Google Scholar] [CrossRef]
  14. Janiszewski, M.; Pontow, S.; Rinne, M. Industry Survey on the Current State of Stope Design Methods in the Underground Mining Sector. Energies 2021, 15, 240. [Google Scholar] [CrossRef]
  15. Corrigall, S. Stochastic Programs and Their Value over Deterministic Programs. MSc Dissertation, University of the Witwatersrand, Johannesburg, South Africa, 1998. [Google Scholar]
  16. Tholana, T. Generation of Probabilistic Stopes Using Monte-Carlo Simulation of Block Economic Values for Use in Mine Planning under Uncertainty. Ph.D. Thesis, University of the Witwatersrand, Johannesburg, South Africa, 2021. [Google Scholar]
  17. Savage, S.L.; Markowitz, H.M. The Flaw of Averages: Why We Underestimate Risk in the Face of Uncertainty; John Wiley & Sons, Inc.: Hoboken, NJ, USA, 2009. [Google Scholar]
  18. Palisade. Introduction to @Risk. 2016. Available online: http://www.palisade.com (accessed on 20 April 2017).
  19. Abdel Sabour, S.A.; Dimitrakopoulos, R.; Kumral, M. Mine design selection under uncertainty. Min. Technol. 2008, 117, 53–63. [Google Scholar] [CrossRef]
  20. Vallee, M. Mineral Resource + engineering, economic and legal feasibility = ore reserve. Can. Inst. Min. Metall. Pet. 2000, 93, 53–61. Available online: https://www.researchgate.net/publication/285842182_Mineral_resource_engineering_economic_and_legal_feasibility_ore_reserve (accessed on 5 July 2016).
  21. Martinez, L.A. Why accounting for uncertainty and risk can improve final decision-making in strategic open pit mine evaluation. In Proceedings of the Project Evaluation Conference, Melbourne, Australia, 21–22 April 2009; pp. 113–124. [Google Scholar]
  22. Musingwini, C. Optimisation in underground mine planning-developments and opportunities. J. S. Afr. Inst. Min. Metall. 2016, 116, 809–820. [Google Scholar] [CrossRef] [Green Version]
  23. Magagula, N.S.; Musingwini, C.; Ali, M. Multinomial logistic regression analysis of a stochastic mine production system. In Proceedings of the 23rd International Symposium on Mine Planning and Equipment Selection (MPES2015): Smart Innovation in Mining, Johannesburg, South Africa, 9–11 November 2015; pp. 331–339. [Google Scholar]
  24. Godoy, M. A risk analysis based framework for strategic mine planning and design—Method and application. In Advances in Applied Strategic Mine Planning; Springer: Cham, Switzerland, 2018; pp. 75–90. [Google Scholar]
  25. Dimitrakopoulos, R.; Farrelly, C.; Godoy, M. Moving forward from traditional optimisation: Grade uncertainty and risk effects in open-pit design. Min. Technol. 2002, 111, 82–88. [Google Scholar] [CrossRef]
  26. Rossi, M.E.; Van Brunt, B.H. Optimizing conditionally simulated orebodies with Whittle 4D. Optim. Whittle 1997, 97, 119–128. [Google Scholar]
  27. Grieco, N.; Dimitrakopoulos, R. Managing grade risk in stope design optimisation: Probabilistic mathematical programming model and application in sub-level stoping. Min. Technol. 2007, 116, 49–57. [Google Scholar] [CrossRef]
  28. Dimitrakopoulos, R.; Grieco, N. Stope design and geological uncertainty: Quantification of risk in conventional designs and a probabilistic alternative. J. Min. Sci. 2009, 45, 152–163. [Google Scholar] [CrossRef]
  29. Dimitrakopoulos, R. Stochastic mine planning–methods, examples and value in an uncertain world. In Advances in Orebody Modelling and Strategic Mine Planning; Series No. 17; The Australasian Institute of Mining and Metallurgy Spectrum: Carlton, Australia, 2010; pp. 13–19. [Google Scholar]
  30. Ersoy, A.; Yünsel, T.Y. Geostatistical conditional simulation for the assessment of the quality characteristics of Cayırhan lignite deposits. Energy Explor. Exploit. 2006, 24, 391–416. [Google Scholar] [CrossRef]
  31. Godoy, M.; Dimitrakopoulos, R. Managing risk and waste mining in long-term production scheduling of open-pit mines. SME Trans. 2004, 316, 43–50. [Google Scholar]
  32. Croll, R.C. Technical and financial risk in project evaluation. In Proceedings of the Colloquium: Bankable Feasibility Studies and Project Financing for Mining Projects, Johannesburg, South Africa, 18 March 1999; pp. 1–4. [Google Scholar]
  33. Abdel Sabour, S.A.; Dimitrakopoulos, R. Accounting for joint ore supply, metal price and exchange rate uncertainties in mine design. In Advances in Orebody Modelling and Strategic Mine Planning: Old and New Dimensions in a Changing World; The Australasian Institute of Mining and Metallurgy (AusIMM): Carlton, Australia, 2009; pp. 29–34. [Google Scholar]
  34. Tapia Cortez, C.A.; Saydam, S.; Coulton, J.; Sammut, C. Alternative techniques for forecasting mineral commodity prices. Int. J. Min. Sci. Technol. 2018, 28, 309–322. [Google Scholar] [CrossRef]
  35. Dixit, A.K.; Pindyck, R.C. Investment under Uncertainty; Princeton University Press: Princeton, NJ, USA, 1994; 468p. [Google Scholar]
  36. Haque, M.A.; Topal, E.; Lilford, E. A numerical study for a mining project using real options valuation under commodity price uncertainty. Resour. Policy 2014, 39, 115–123. [Google Scholar] [CrossRef]
  37. Abdel Sabour, S.A.; Poulin, R. Mine expansion decisions under uncertainty. Int. J. Min. Reclam. Environ. 2010, 24, 340–349. [Google Scholar] [CrossRef]
  38. Lemelin, B.; Abdel Sabour, S.A.; Poulin, R. Valuing mine 2 at Raglan using real options. Int. J. Surf. Min. Reclam. Environ. 2006, 20, 46–56. [Google Scholar] [CrossRef]
  39. Glasserman, P. Monte Carlo Methods in Financial Engineering; Springer Science & Business Media: Berlin/Heidelberg, Germany, 2003; 596p. [Google Scholar]
  40. Schwartz, E.S. The stochastic behaviour of commodity prices: Implications for valuation and hedging. J. Financ. 1997, 52, 923–973. [Google Scholar] [CrossRef]
  41. Dimitrakopoulos, R.; Martinez, L.; Ramazan, S. A maximum upside/minimum downside approach to the traditional optimisation of open-pit mine design. J. Min. Sci. 2007, 43, 73–82. [Google Scholar] [CrossRef]
  42. Whittle, G.; Stange, W.; Hanson, N. Optimising project value and robustness. In Proceedings of the Project Evaluation Conference, Melbourne, Australia, 19–20 June 2007; The Australasian Institute of Mining and Metallurgy: Melbourne, Australia, 2007; pp. 147–155. [Google Scholar]
  43. Abdel Sabour, S.A.; Dimitrakopoulos, R. Incorporating geological and market uncertainties and operational flexibility into open-pit mine design. J. Min. Sci. 2011, 47, 191–201. [Google Scholar] [CrossRef]
  44. Del Castillo, F.; Dimitrakopoulos, R. Joint effect of commodity price and geological uncertainty over the life of mine and ultimate pit limit. Min. Technol. 2014, 123, 207–219. [Google Scholar] [CrossRef]
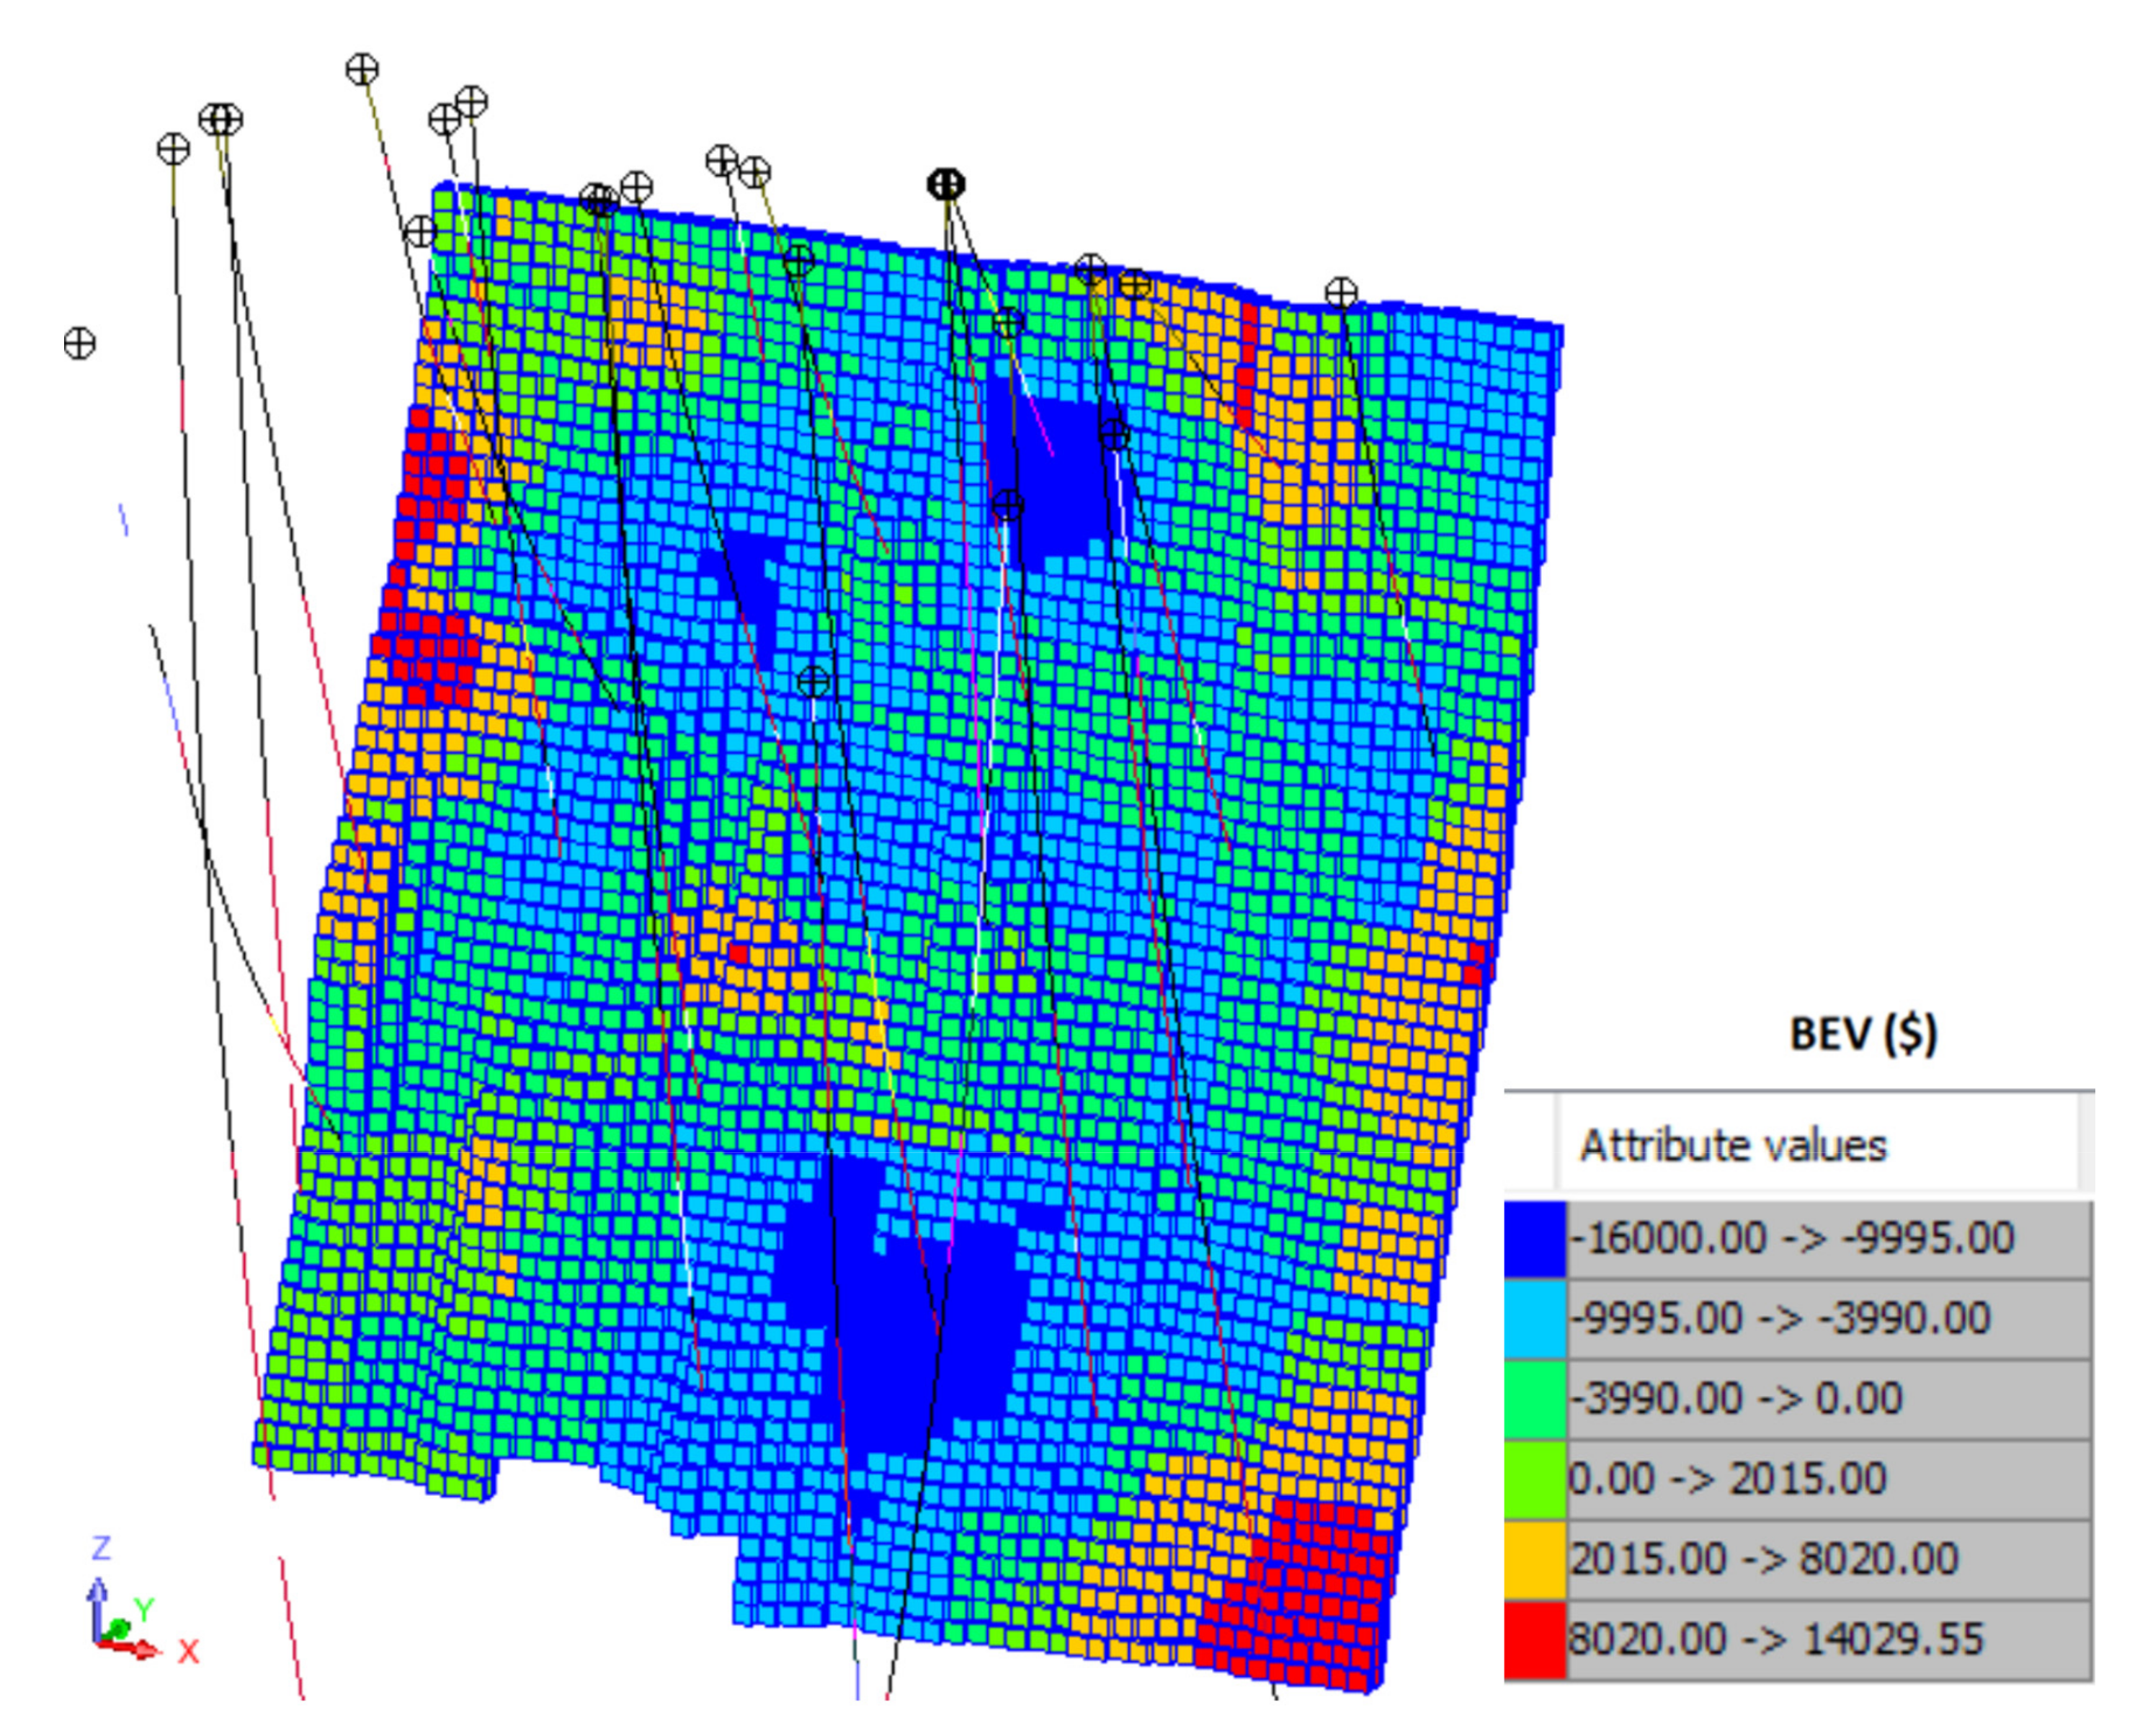
Figure 1. The deterministic economic block model for the case study deposit [16].
Minerals 12 00437 g001
Figure 2. Probabilistic economic block models (Adapted from [16]).
Minerals 12 00437 g002
Figure 3. Relationship between probability of BEV being positive versus average grade and total economic value of the deterministic and probabilistic orebodies (Adapted from [16]).
Minerals 12 00437 g003
Figure 4. Relationship between probability and LOM (Adapted from [16]).
Minerals 12 00437 g004
Figure 5. Deterministic stope design (Adapted from [16]).
Minerals 12 00437 g005
Figure 6. Probabilistic stopes (Adapted from [16]).
Minerals 12 00437 g006
Figure 7. Relationship between probability of BEV being positive and the total number of stopes (Adapted from [16]).
Minerals 12 00437 g007
Figure 8. Probability of BEV being positive versus the total stope tonnage and the total stope value (Adapted from [16]).
Minerals 12 00437 g008
Figure 9. Relationship between probability and total meters for different development excavations [16].
Minerals 12 00437 g009
Figure 10. NPV results for the different conceptual stope designs [16].
Minerals 12 00437 g010
Table 1. Development design parameters [16].
Excavation TypeValue
Shaft dimensions (m)3 × 2
Ramp gradient (degrees)−10
Ramp dimensions (m)5 × 3
Main level spacing (m)60
Main level dimensions (m)5 × 3
Sub-level dimension (m)4 × 3
Sub-level spacing (m)15
Strike drive dimensions (m)4 × 3
Table 2. Cost of development for each type of excavation [16].
ItemCost
Shaft development cost ($/m)2000
Ramp development cost ($/m)1800
Main level development cost ($/m)730
Sublevels development cost ($/m)500
Strike drives cost ($/m)500
Publisher’s Note: MDPI stays neutral with regard to jurisdictional claims in published maps and institutional affiliations.