
The Energy Dissipation Mechanism and Damage Constitutive Model of Roof–CPB–Floor (RCF) Layered Composite Materials

Abstract
:1. Introduction
2. Materials and Methods
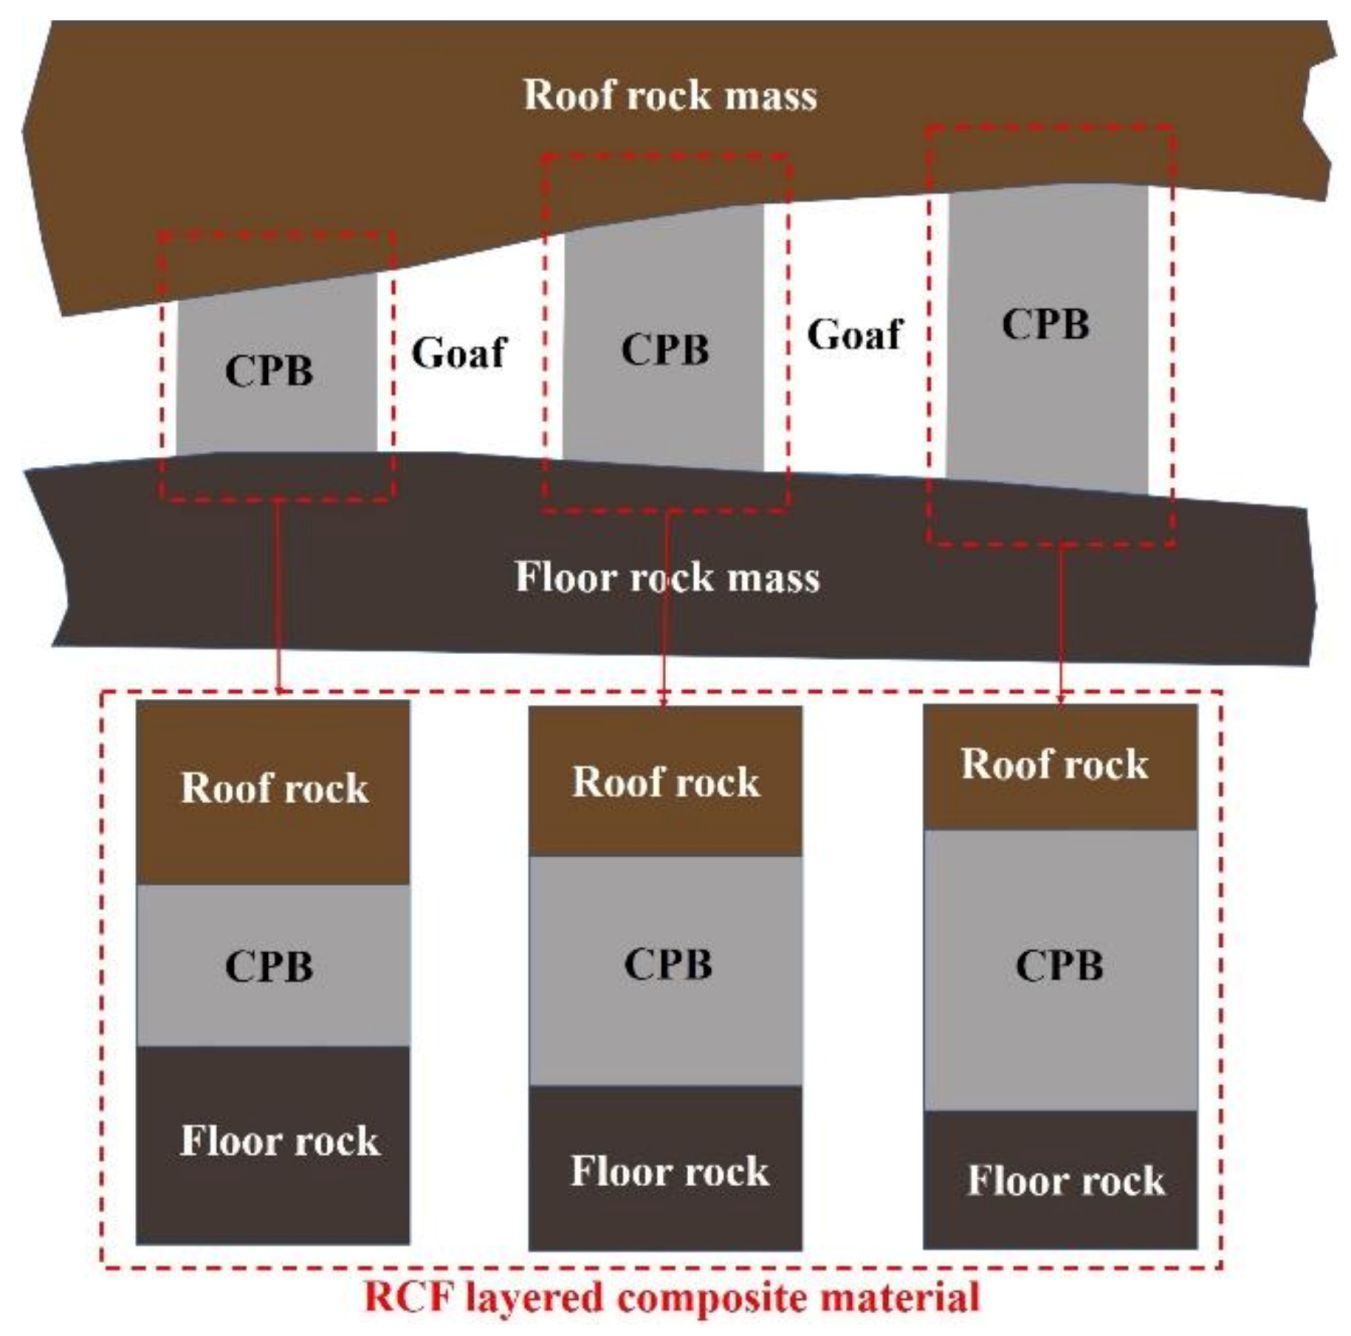
2.1. Research Background
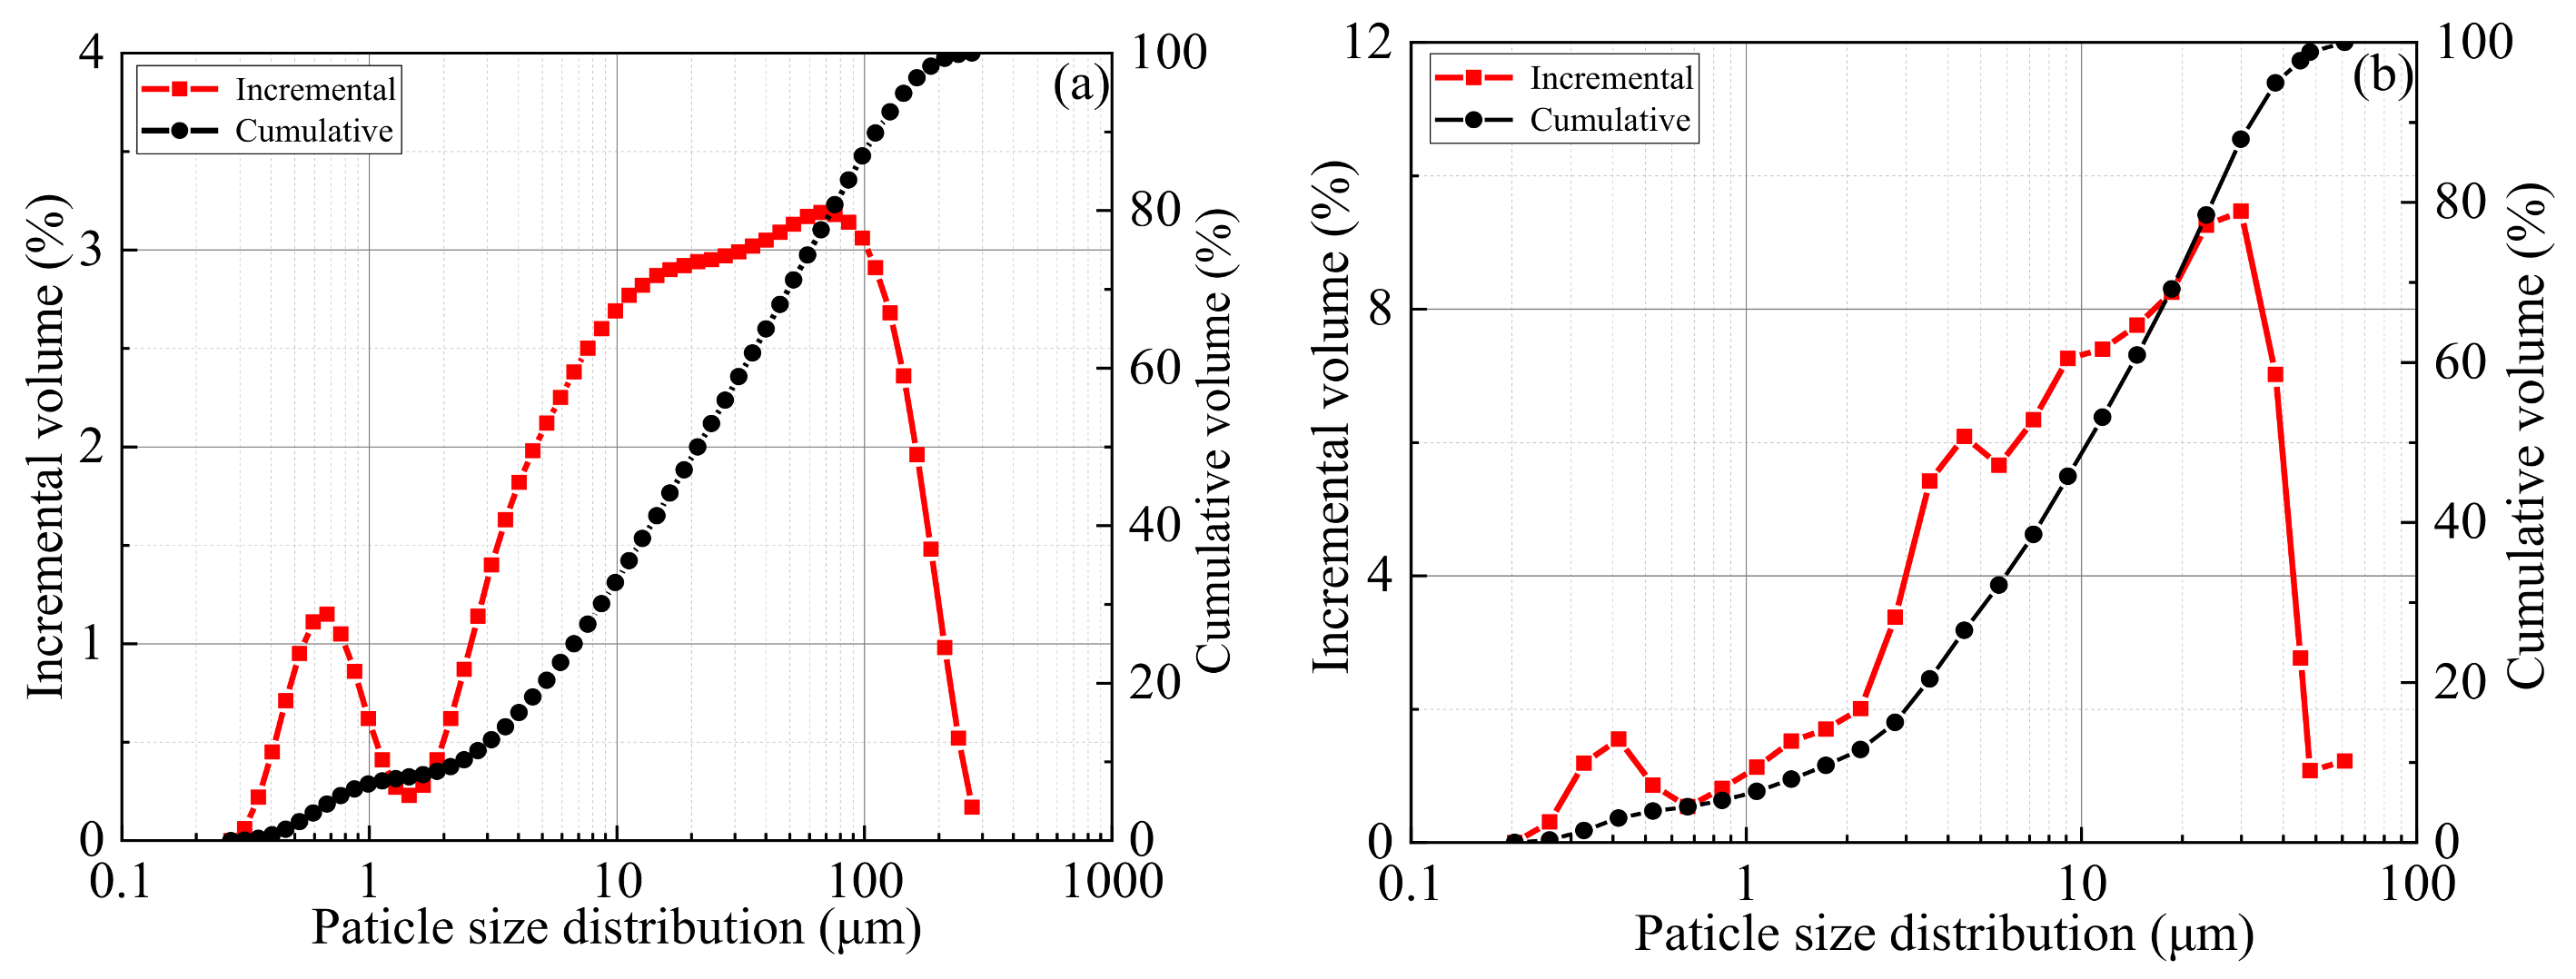
2.2. Experimental Materials and Characteristics
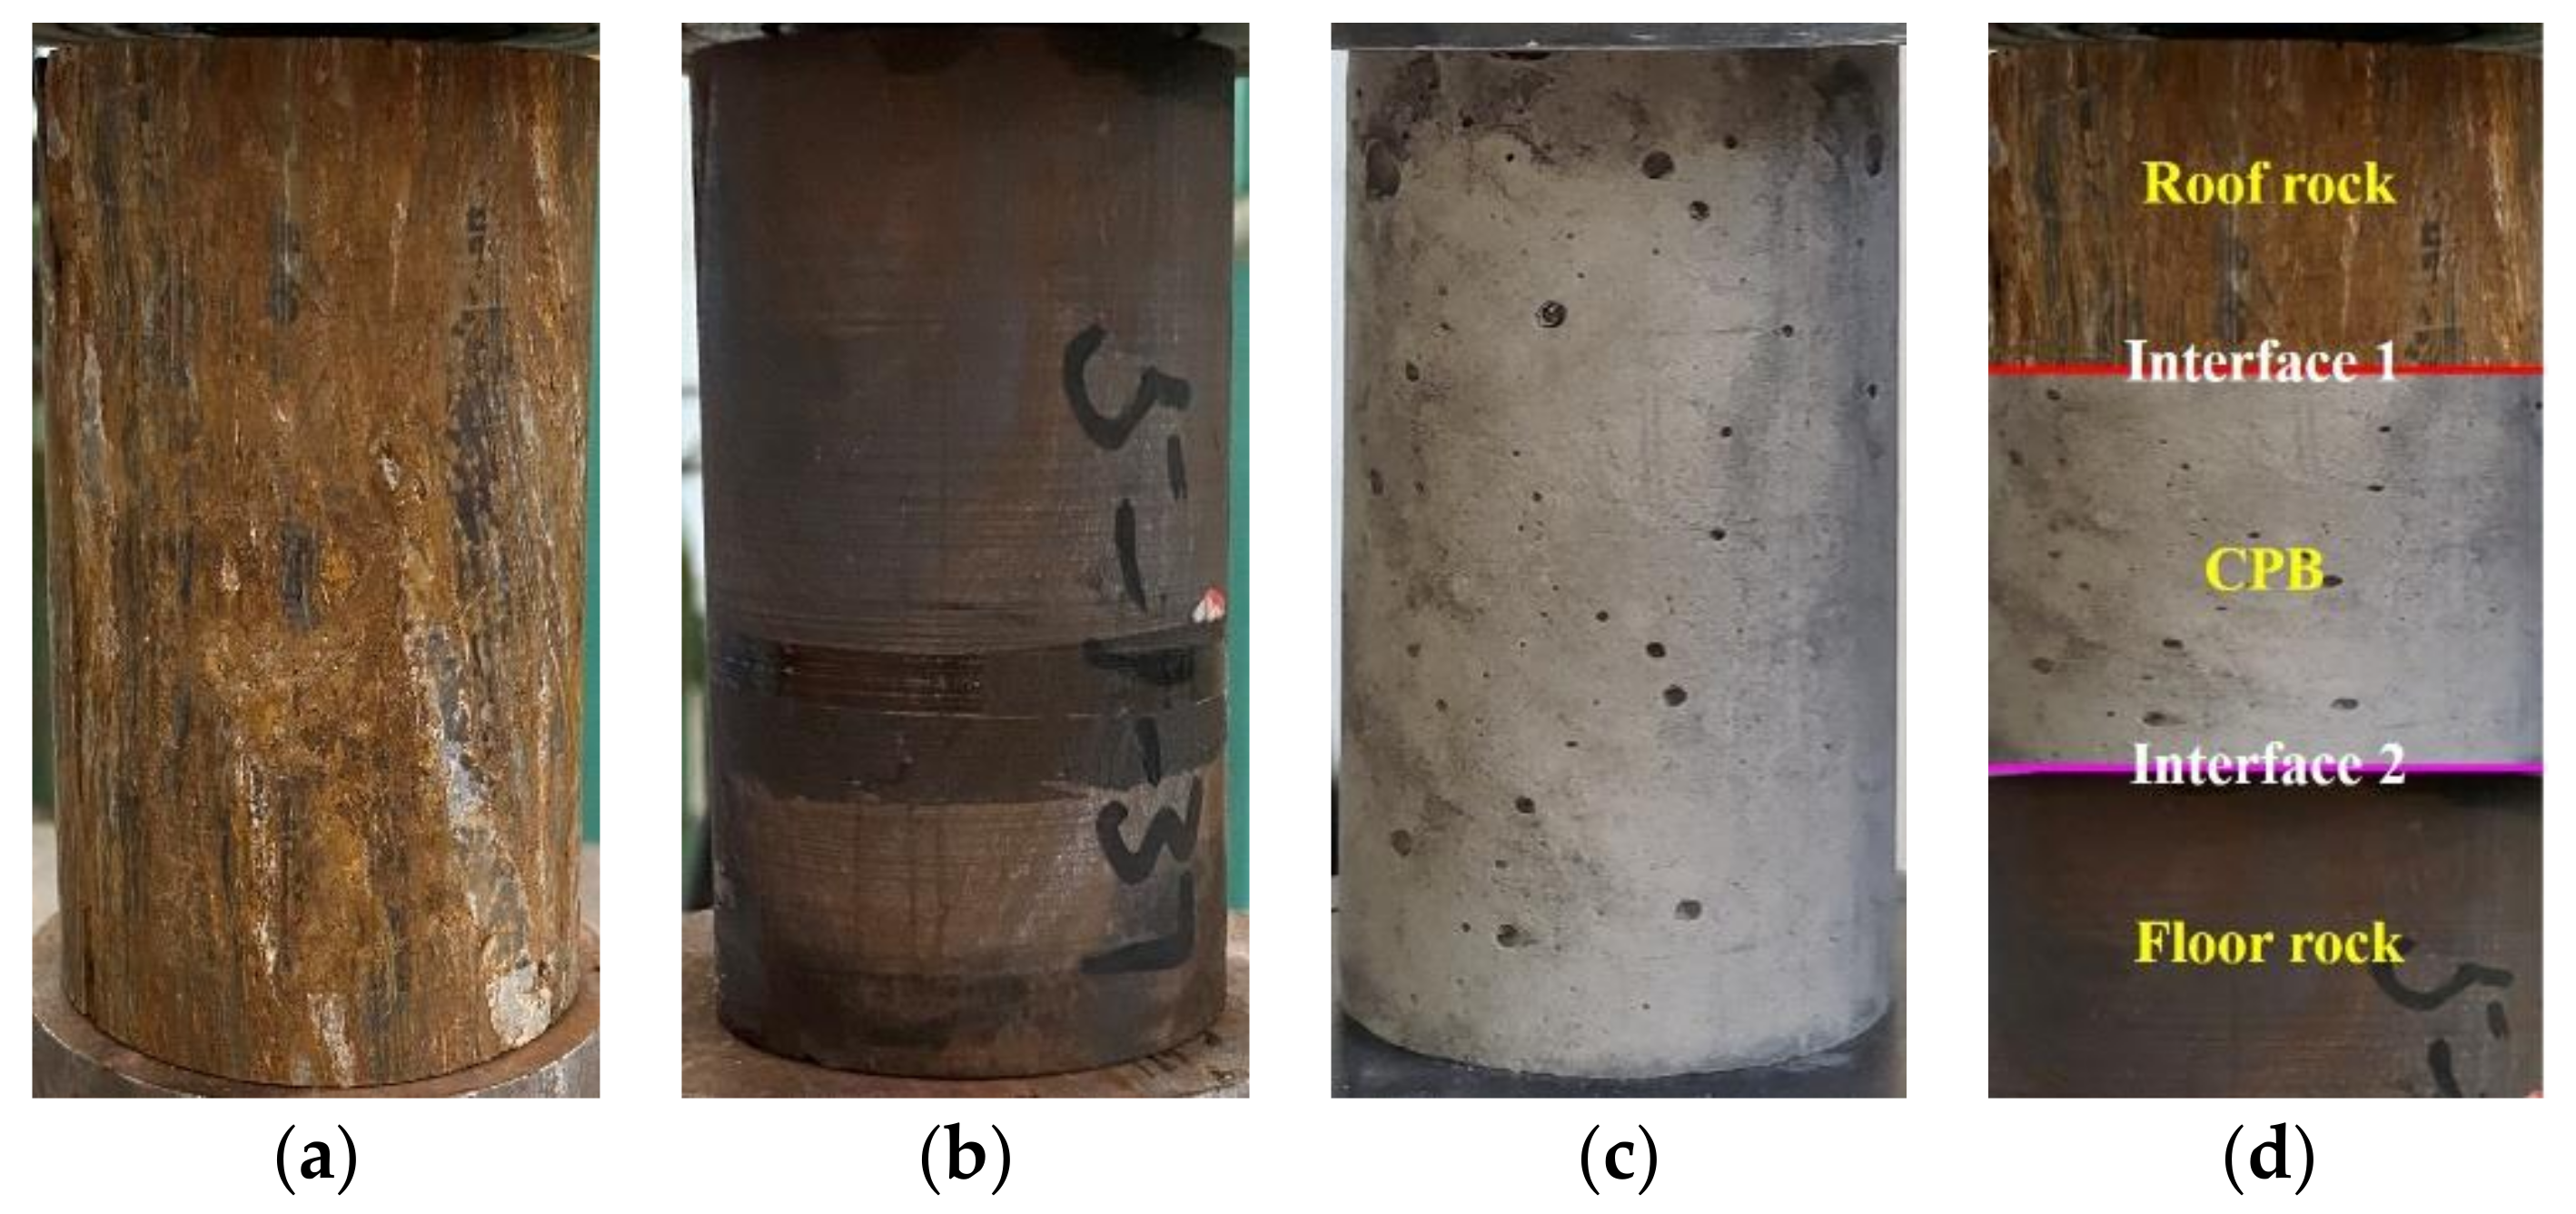
2.3. Sample Preparation
2.4. Uniaxial Compression AE Test
3. Results and Analysis
3.1. Mechanical Properties of RCF Materials
3.1.1. Uniaxial Compressive Strength
3.1.2. Elastic Modulus
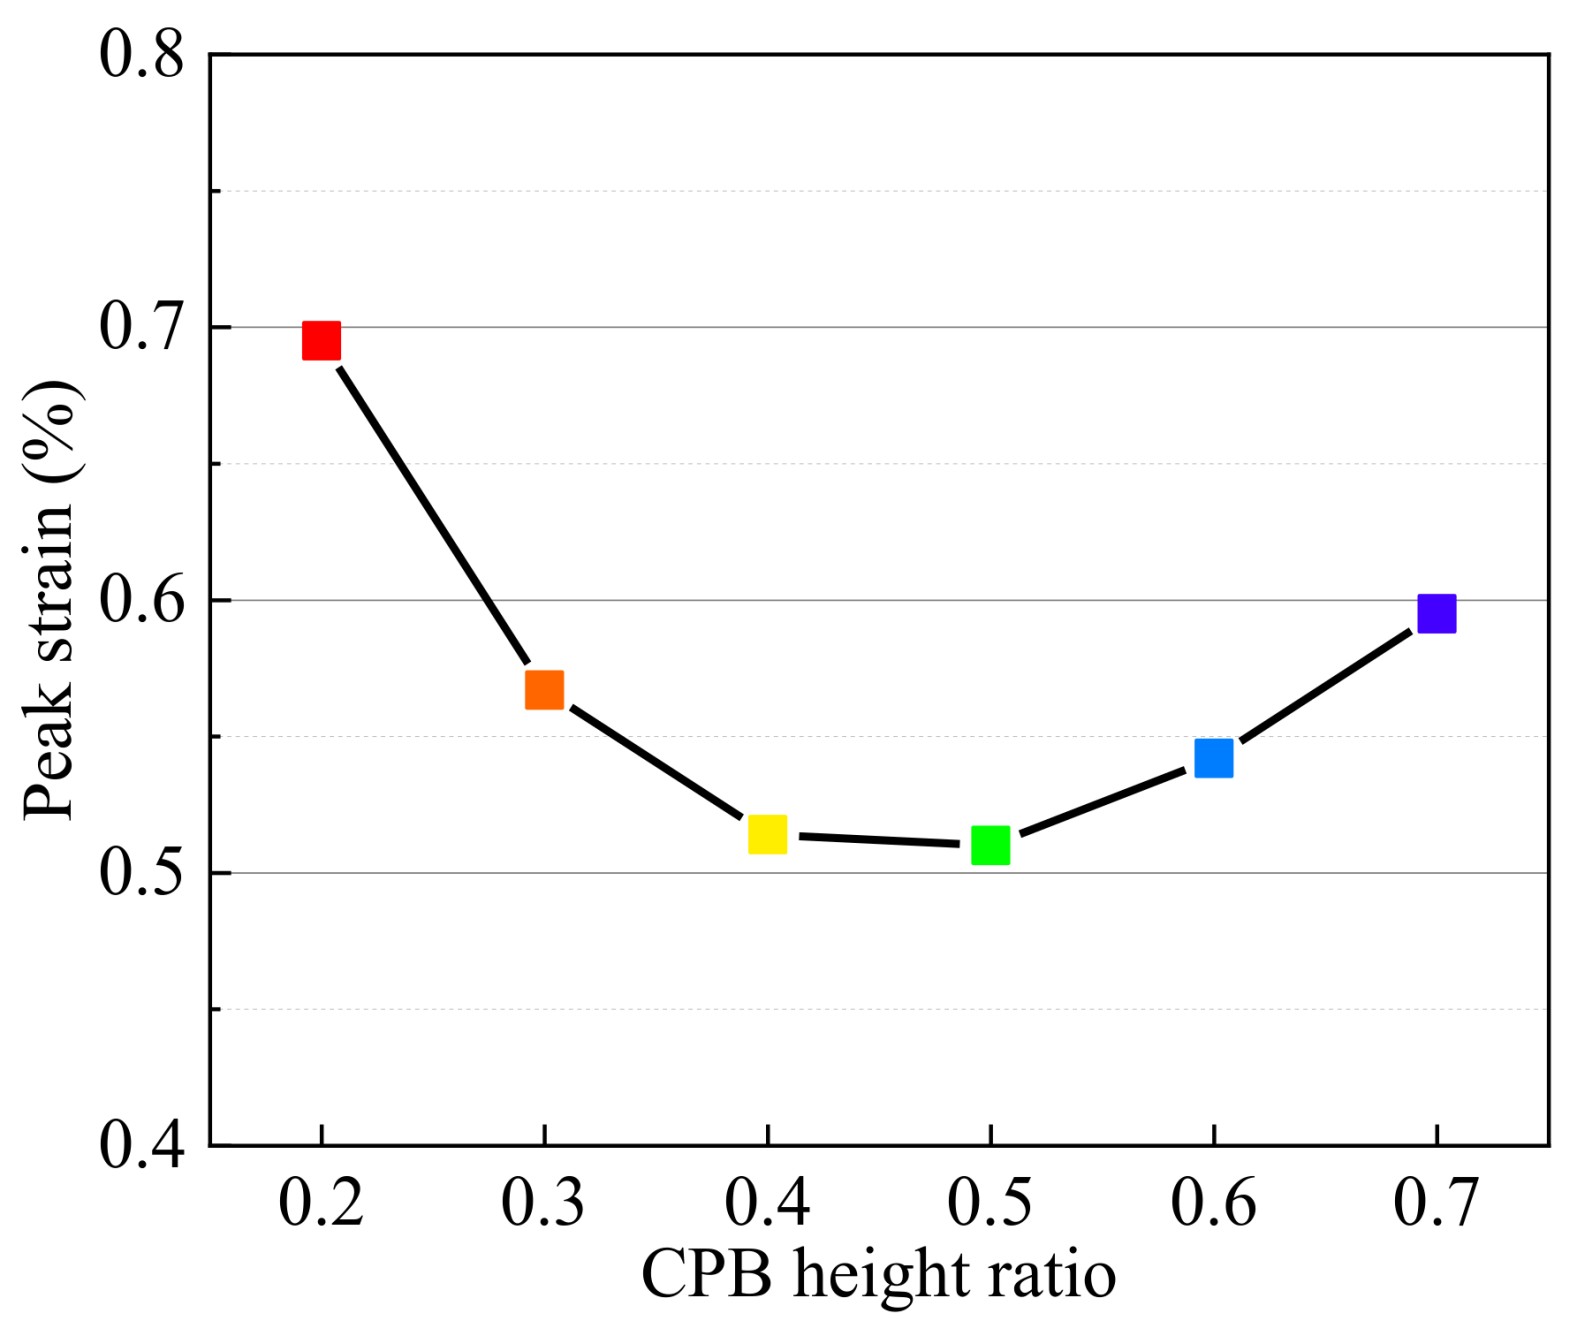
3.1.3. Peak Strain
3.2. AE Ring Count Characteristic of RCF Materials
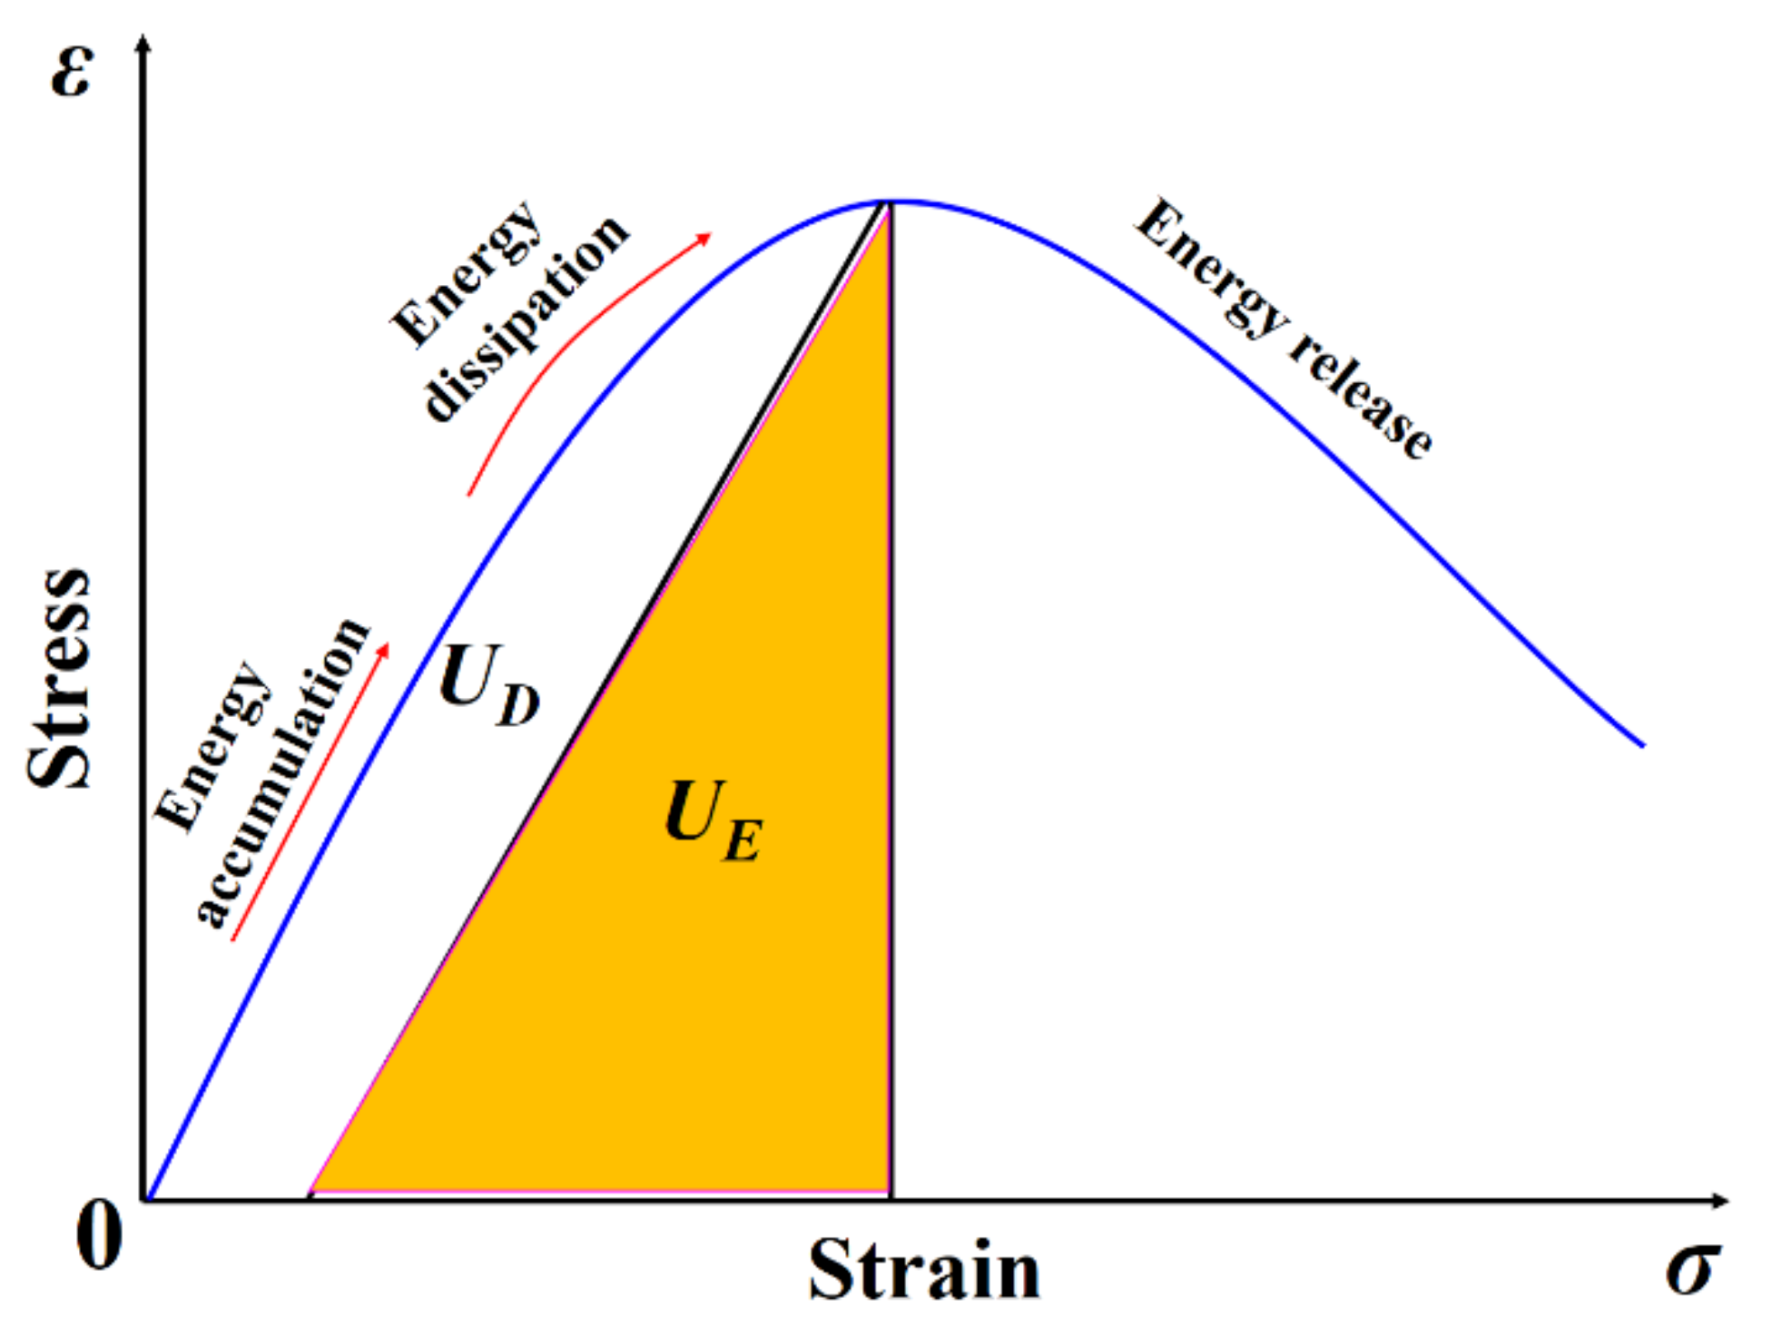
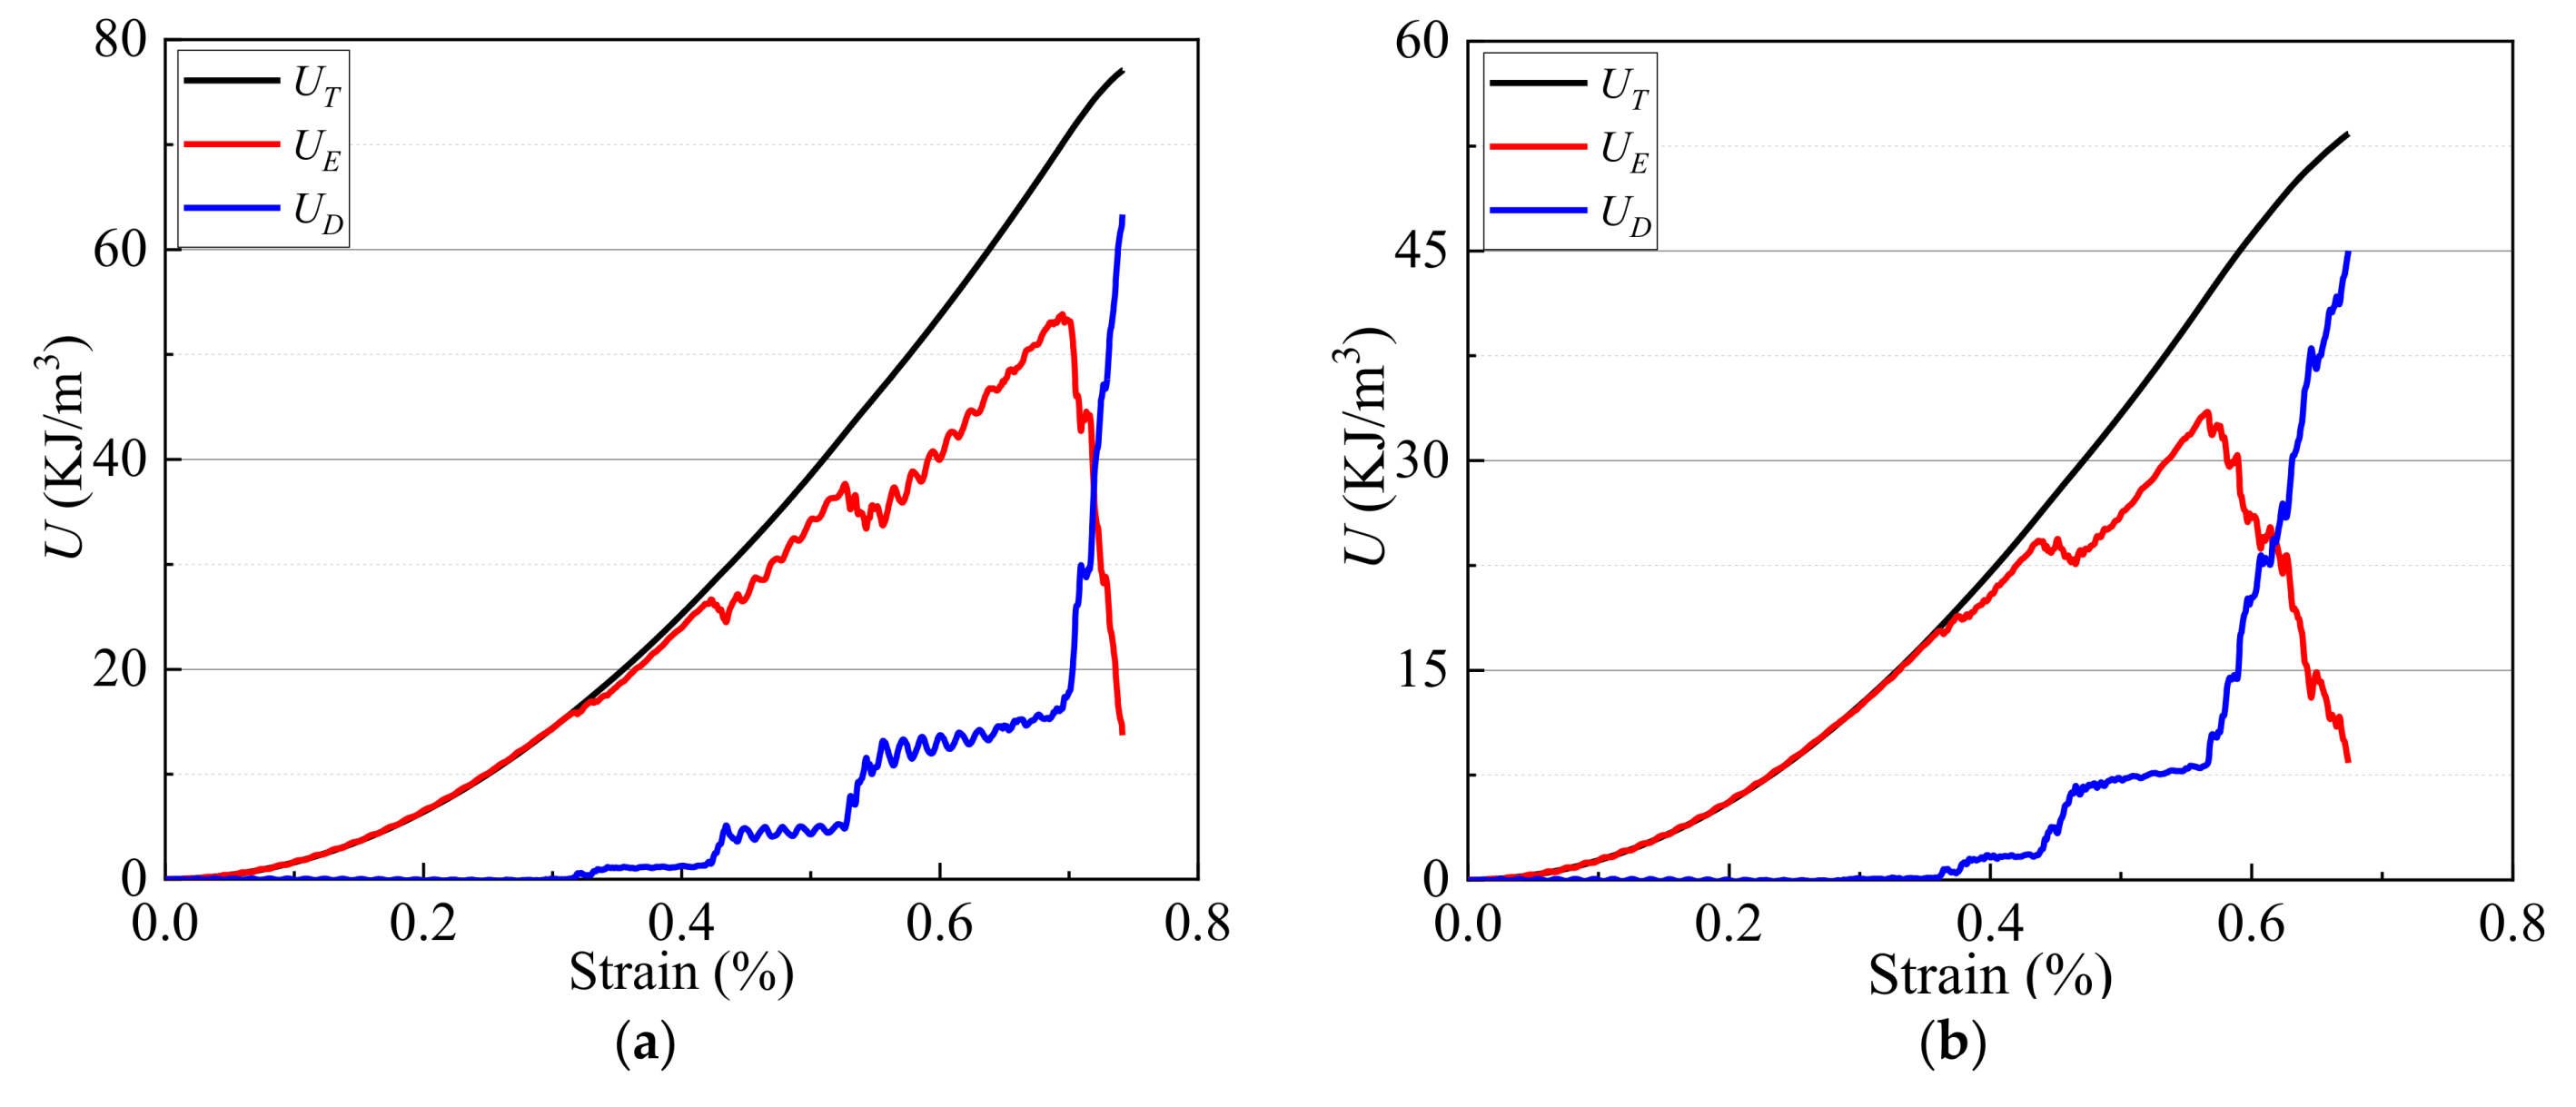
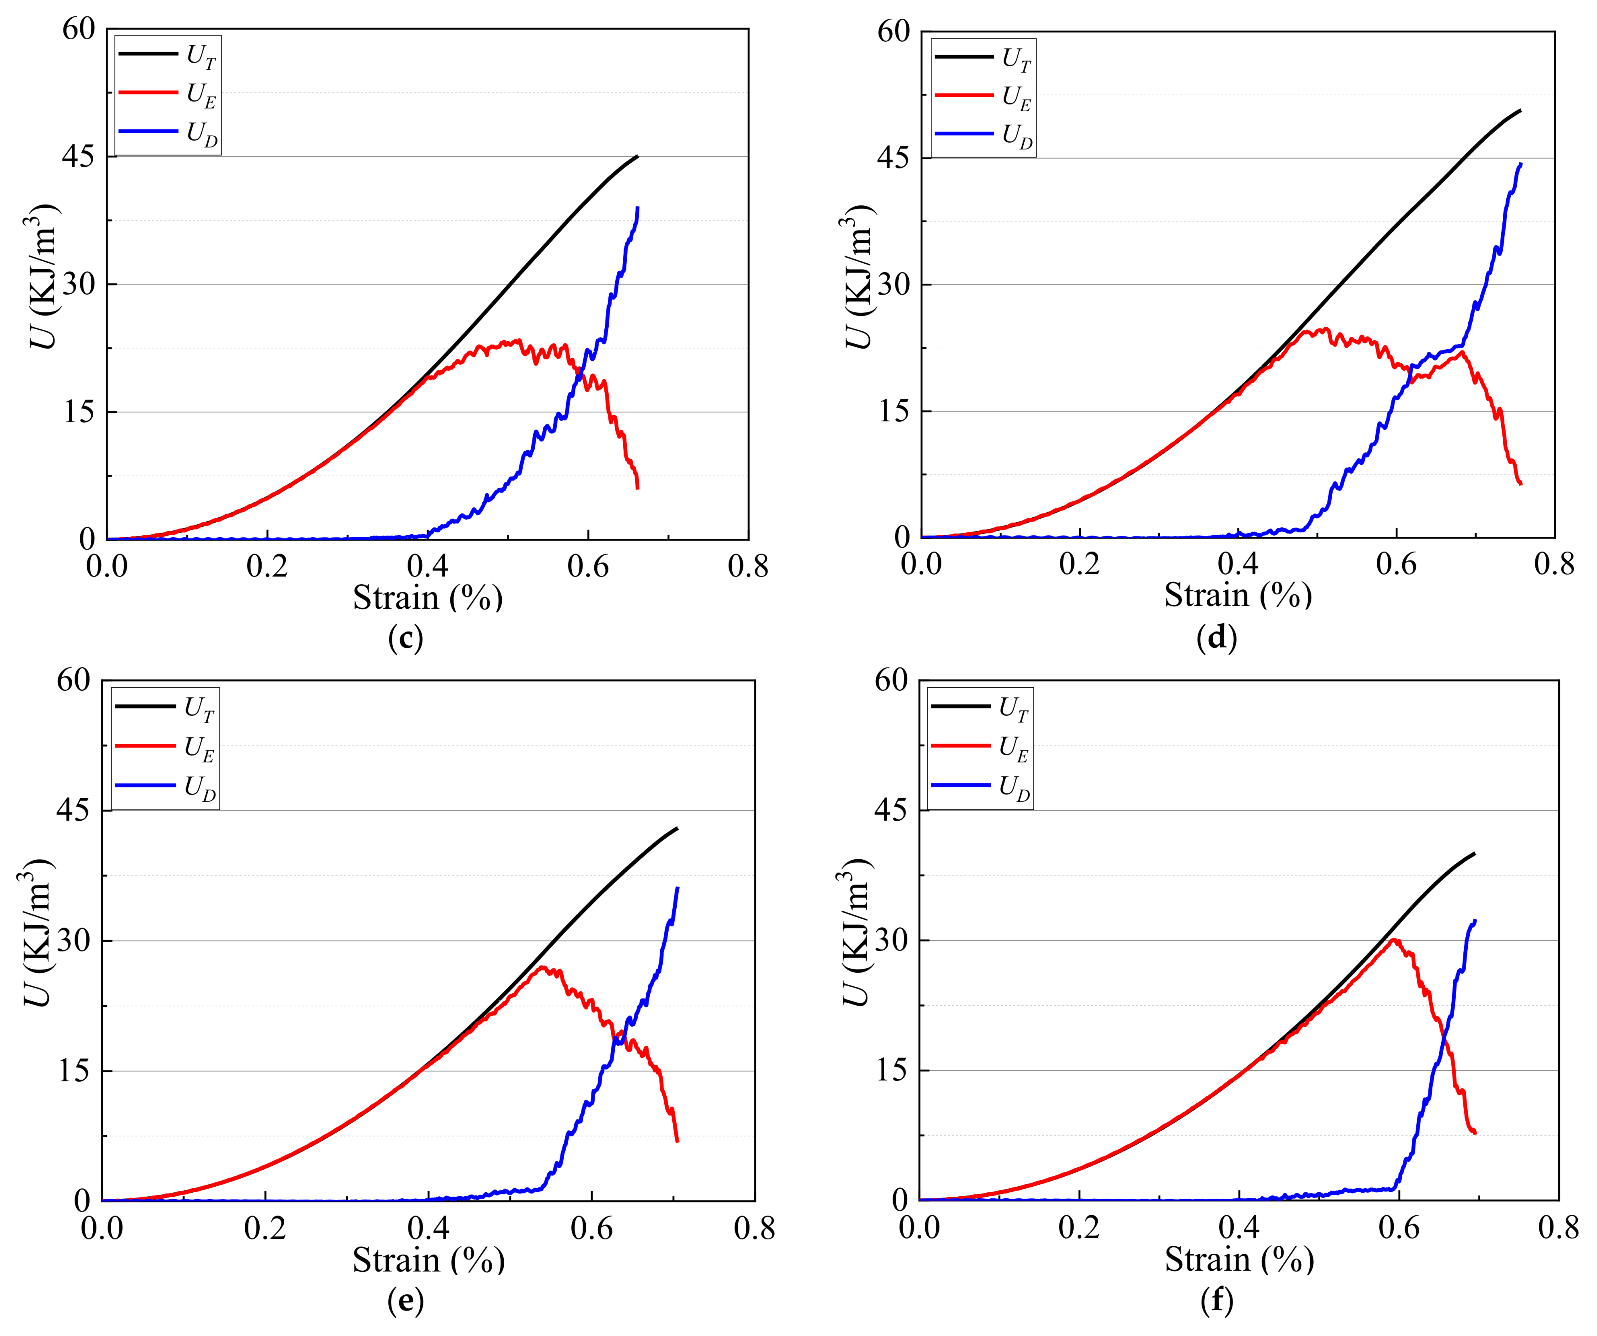
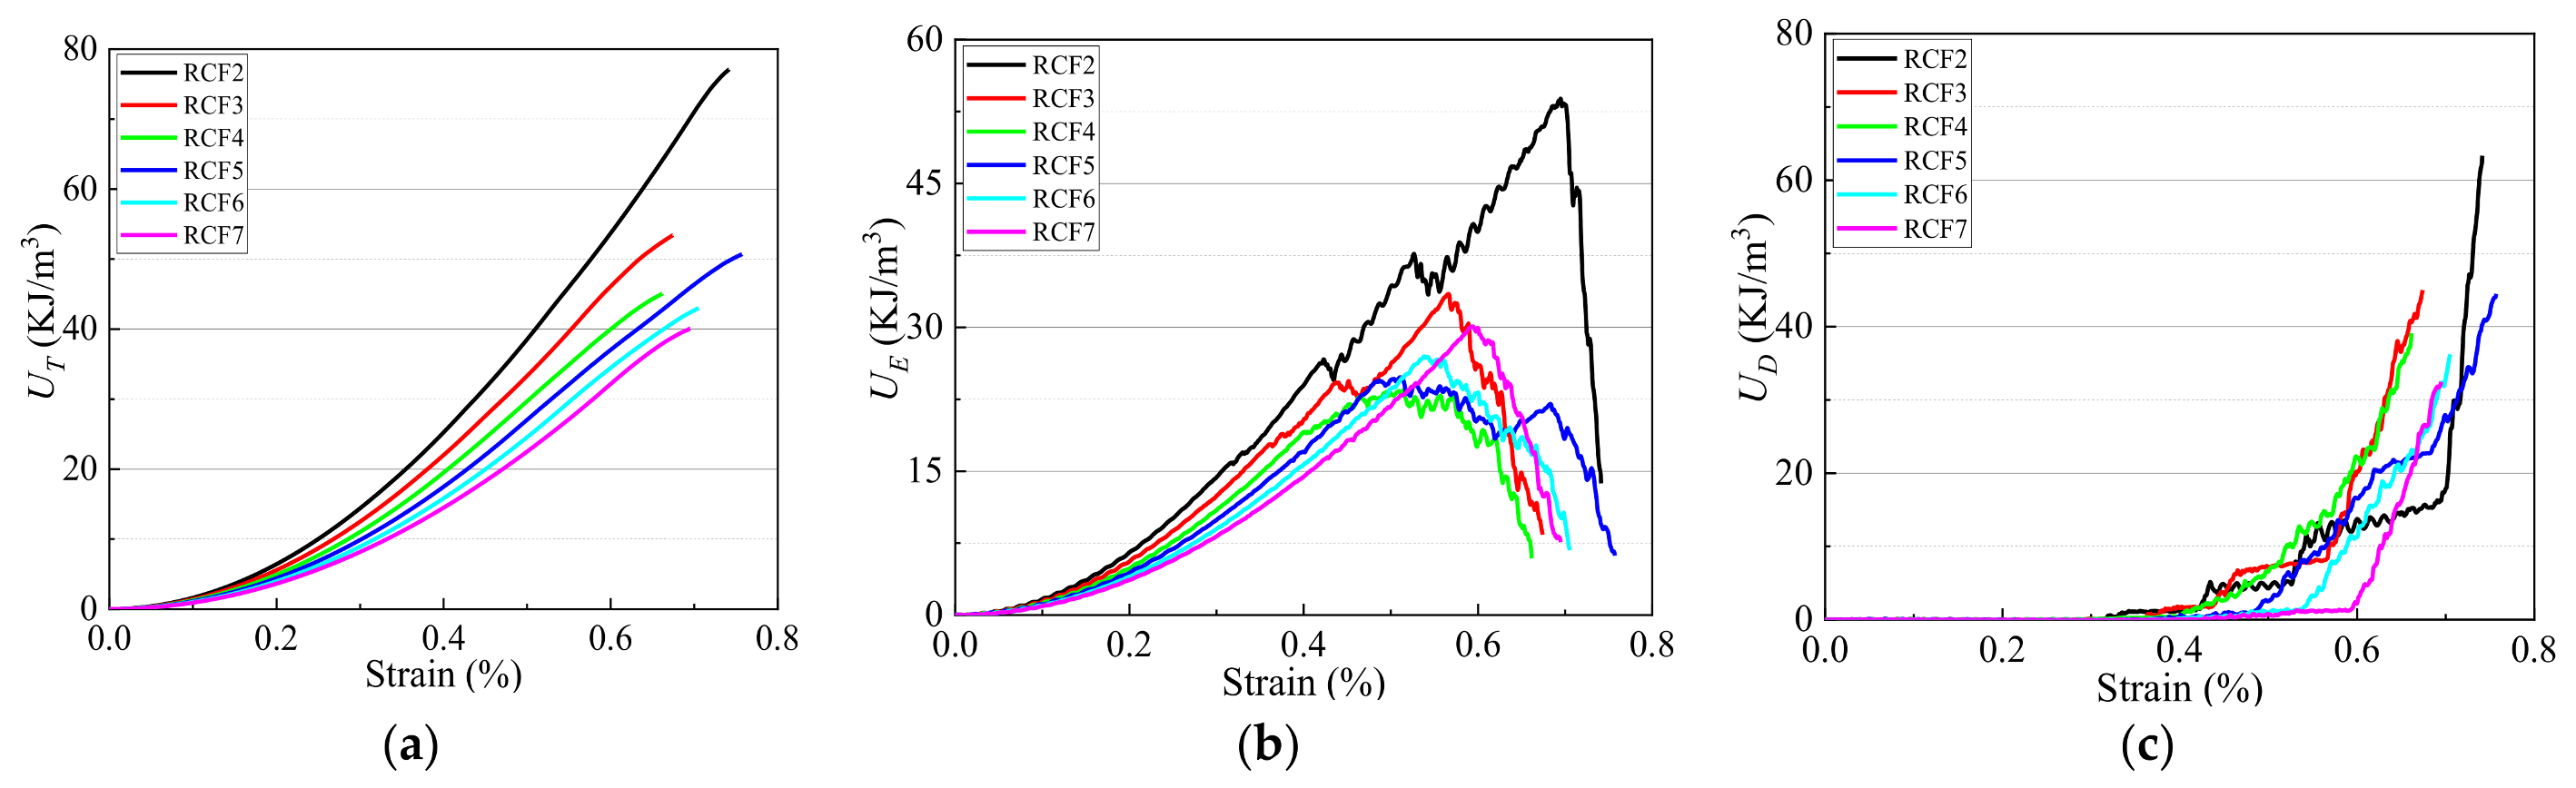
3.3. Energy Dissipation Mechanism of RCF Materials
3.4. Damage Constitutive Model of RCF Materials
3.4.1. Model Construction
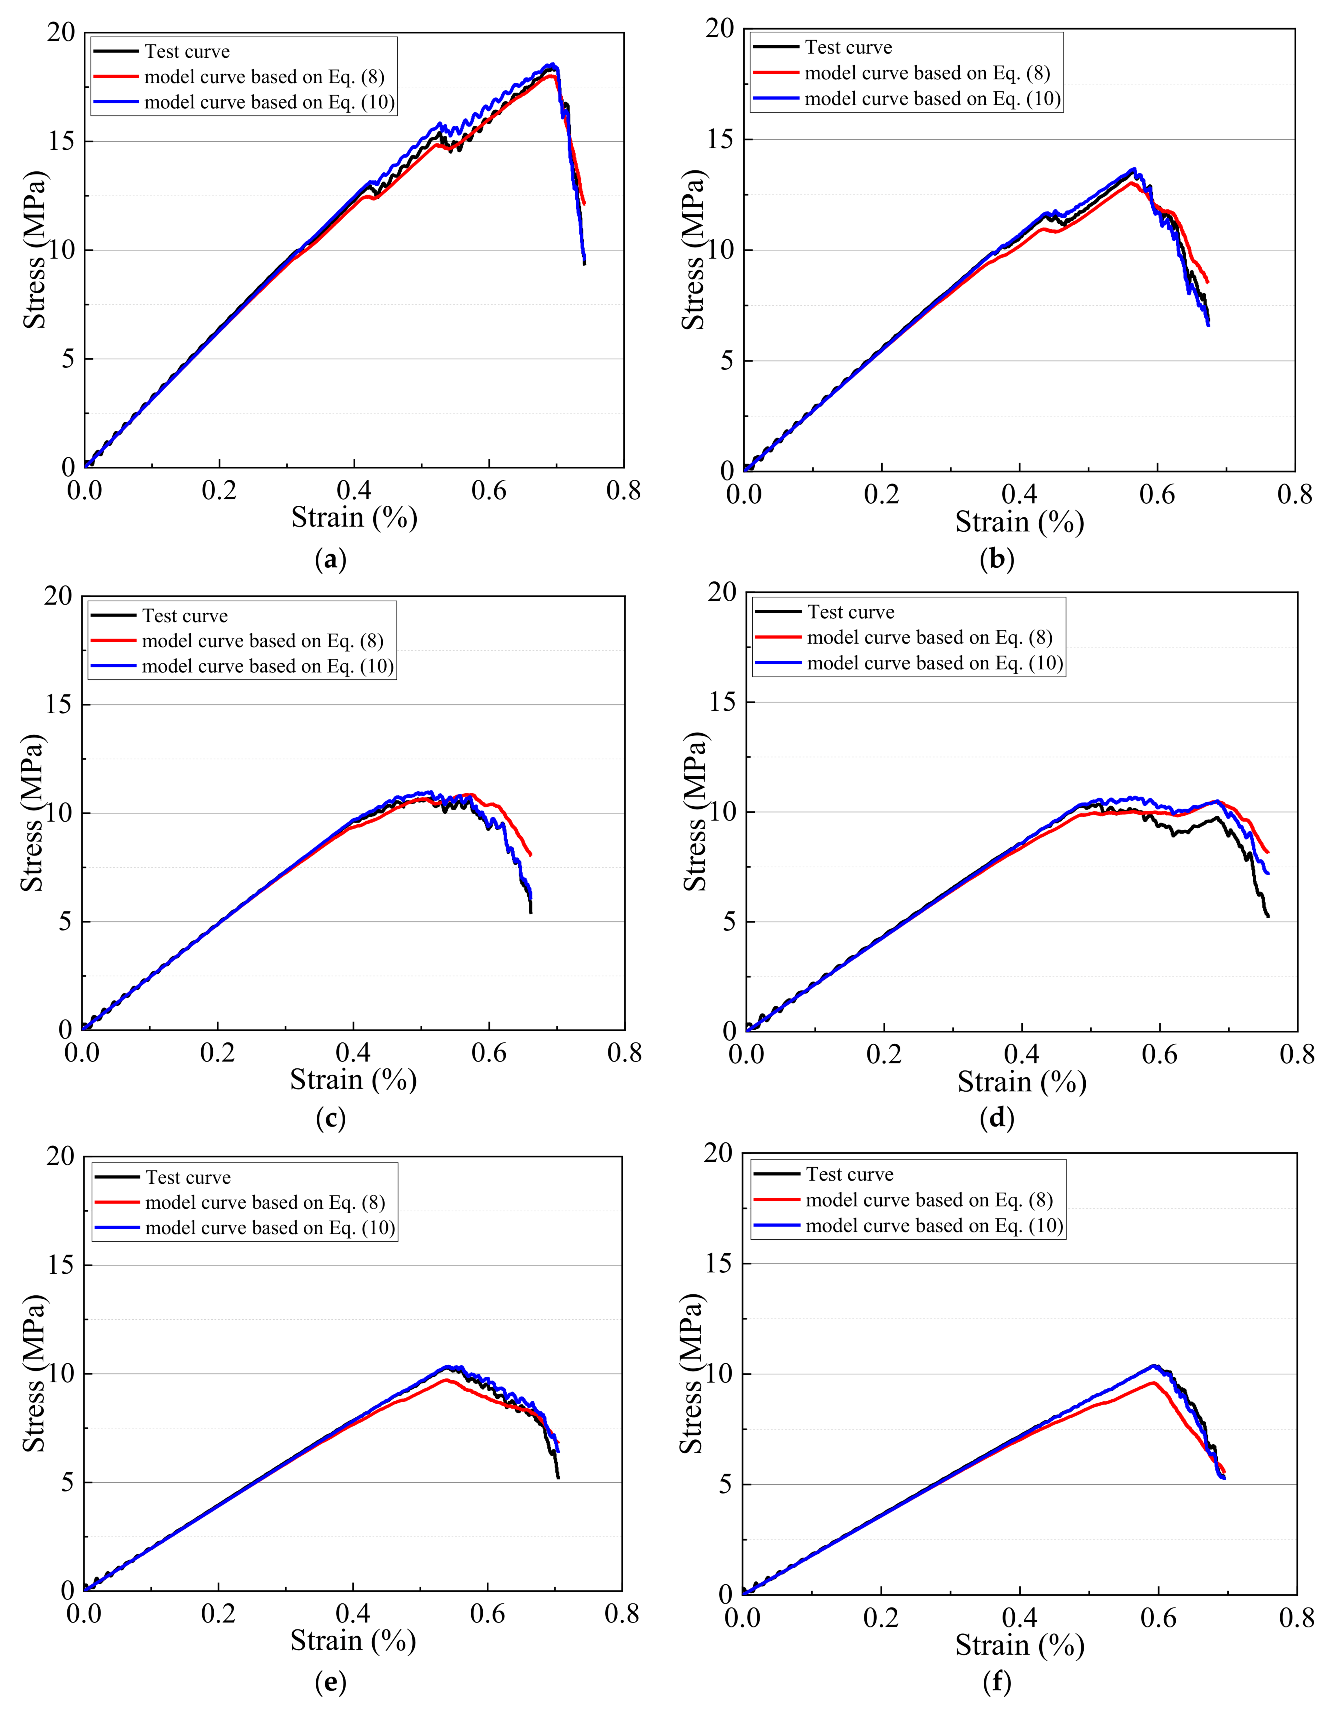
3.4.2. Model Verification
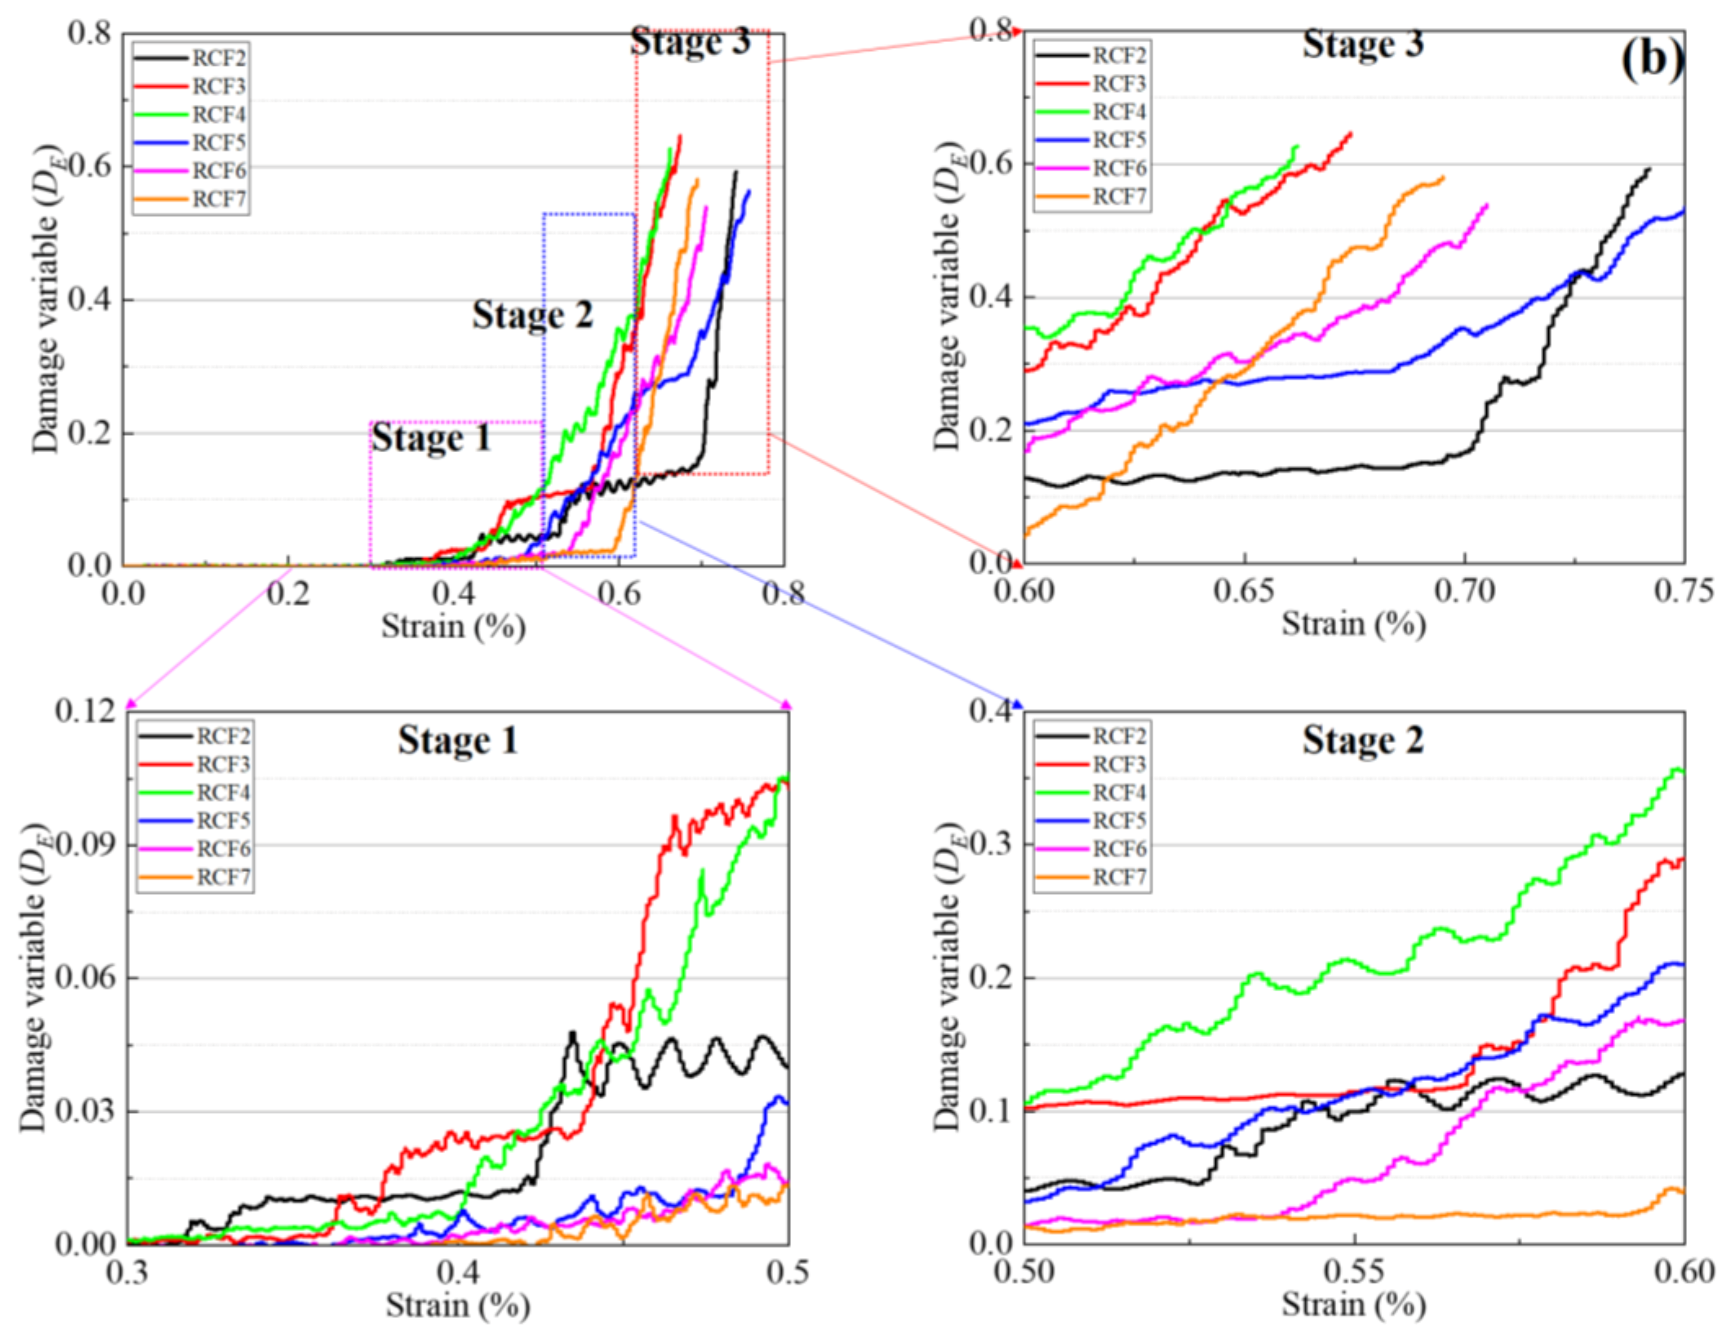
3.4.3. Damage Evolution
- (1)
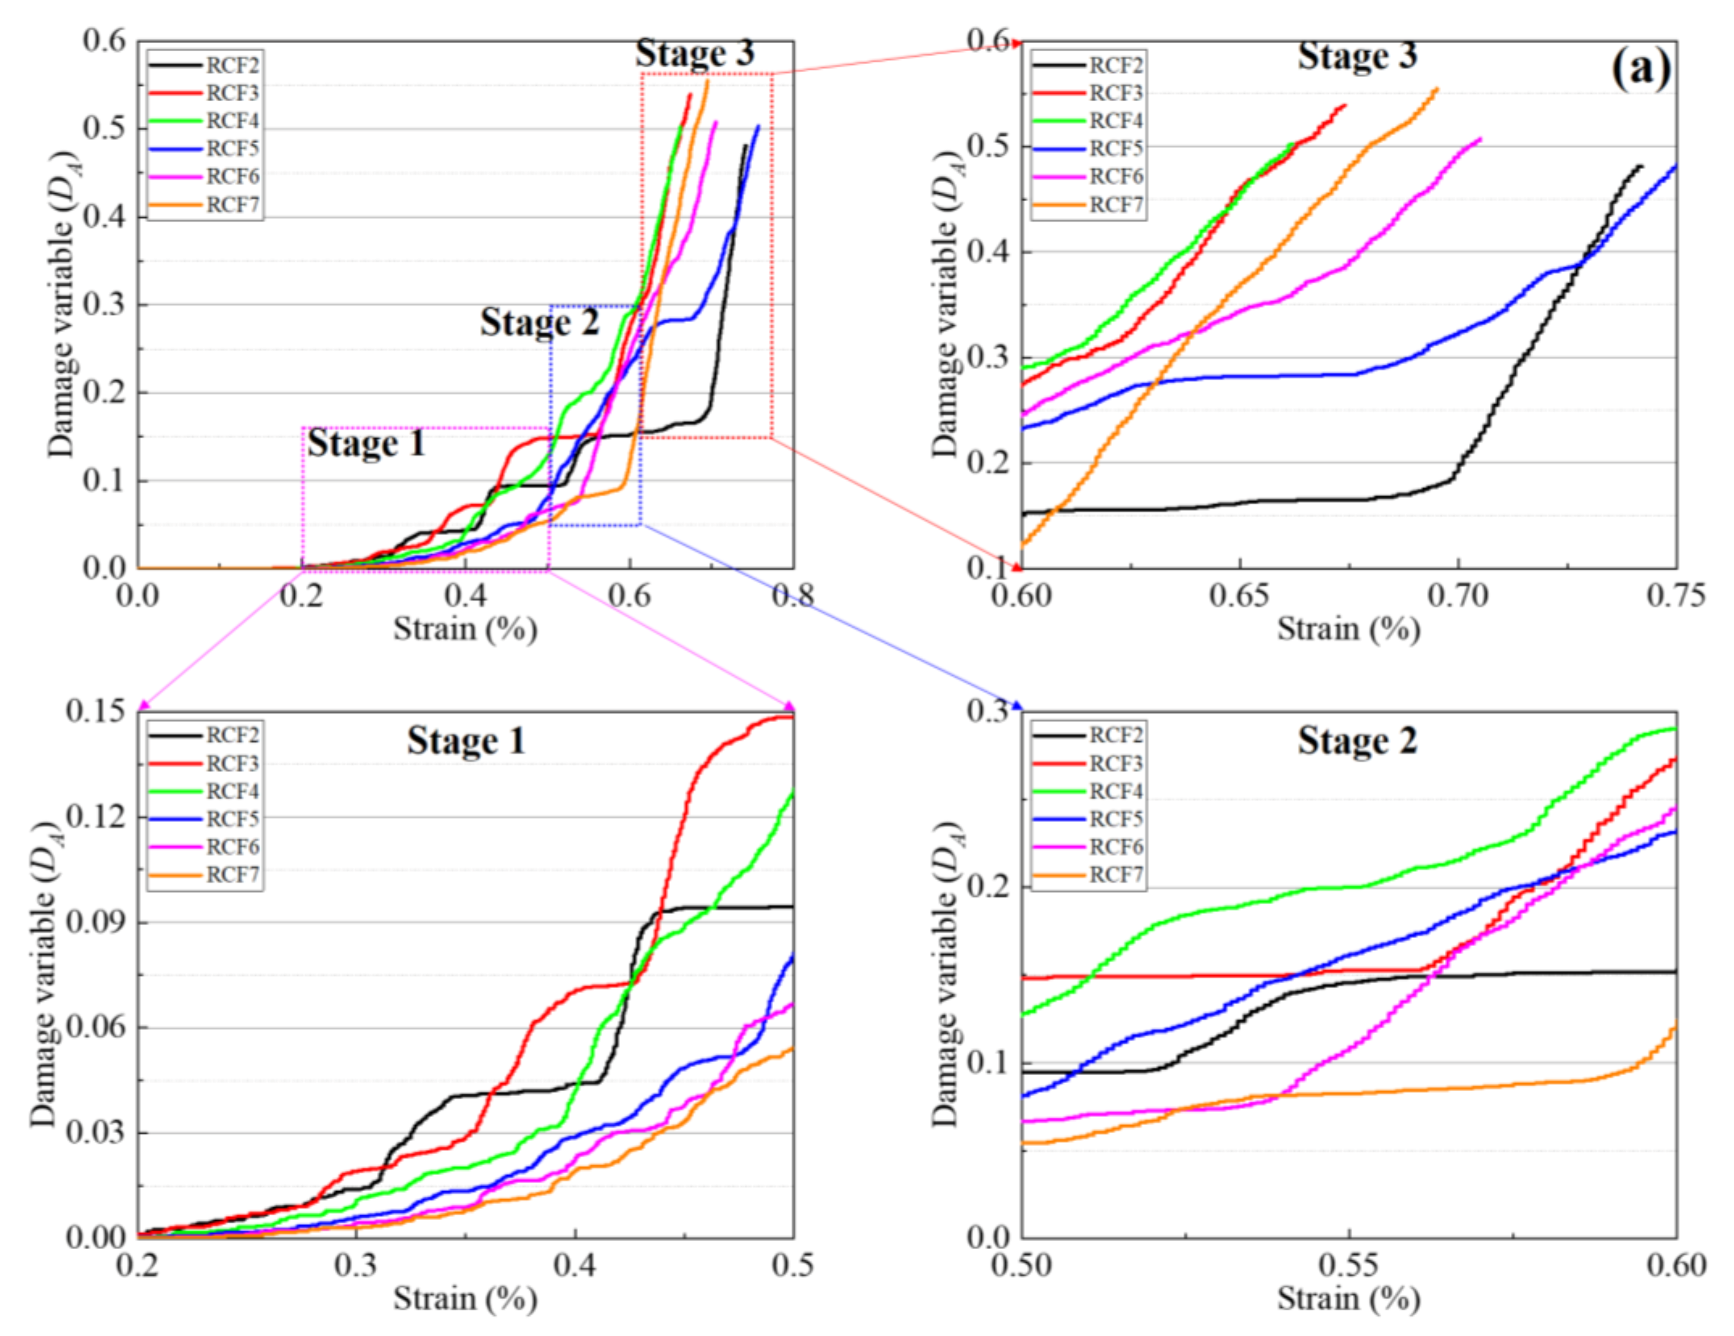
- Stage 1: At this stage, the original pore structure in the RCF sample had been compacted and the layered structural plane had been closed. The original pores in the sample began to expand, while new microcracks gradually formed, the sample’s damage began to accumulate slowly, and the damage curve began to grow slowly. The damage evolution curve of RCF material has an obvious correlation with the CPB height ratio. It can be seen from the figure that the smaller the CPB height ratio, the faster the damage evolution rate. In the initial compression stage, the sample with a larger CPB height ratio could bear greater deformation, but it was not easy to damage. On the contrary, a smaller CPB height ratio allowed the deformation to reach the upper limit quickly and damage occurred in this case first.
- (2)
- Stage 2: This stage is the stage of damage-stable evolution. Under the load, the internal primary pores and new cracks developed steadily, and the damage accumulated stably. At this time, it could be inferred that the damage accumulation of the central CPB was close to its upper limit, the rocks at both ends were compressed, and a small number of fractures expanded in the rocks at both ends. The CPB height ratio had little effect on the damage evolution process and the damage evolution curves of the different RCF samples had no obvious difference.
- (3)
- Stage 3: This stage is the stage of rapid damage accumulation. As the load that was on the RCF material gradually exceeded its peak load, the overall stable structure of the RCF sample had been destroyed, the internal crack and pore structure expanded rapidly and formed macro cracks, and the internal damage to the sample accumulated rapidly. At this stage, there was no significant difference in the damage evolution curves of the different RCF samples.
4. Discussion
5. Conclusions
- (1)
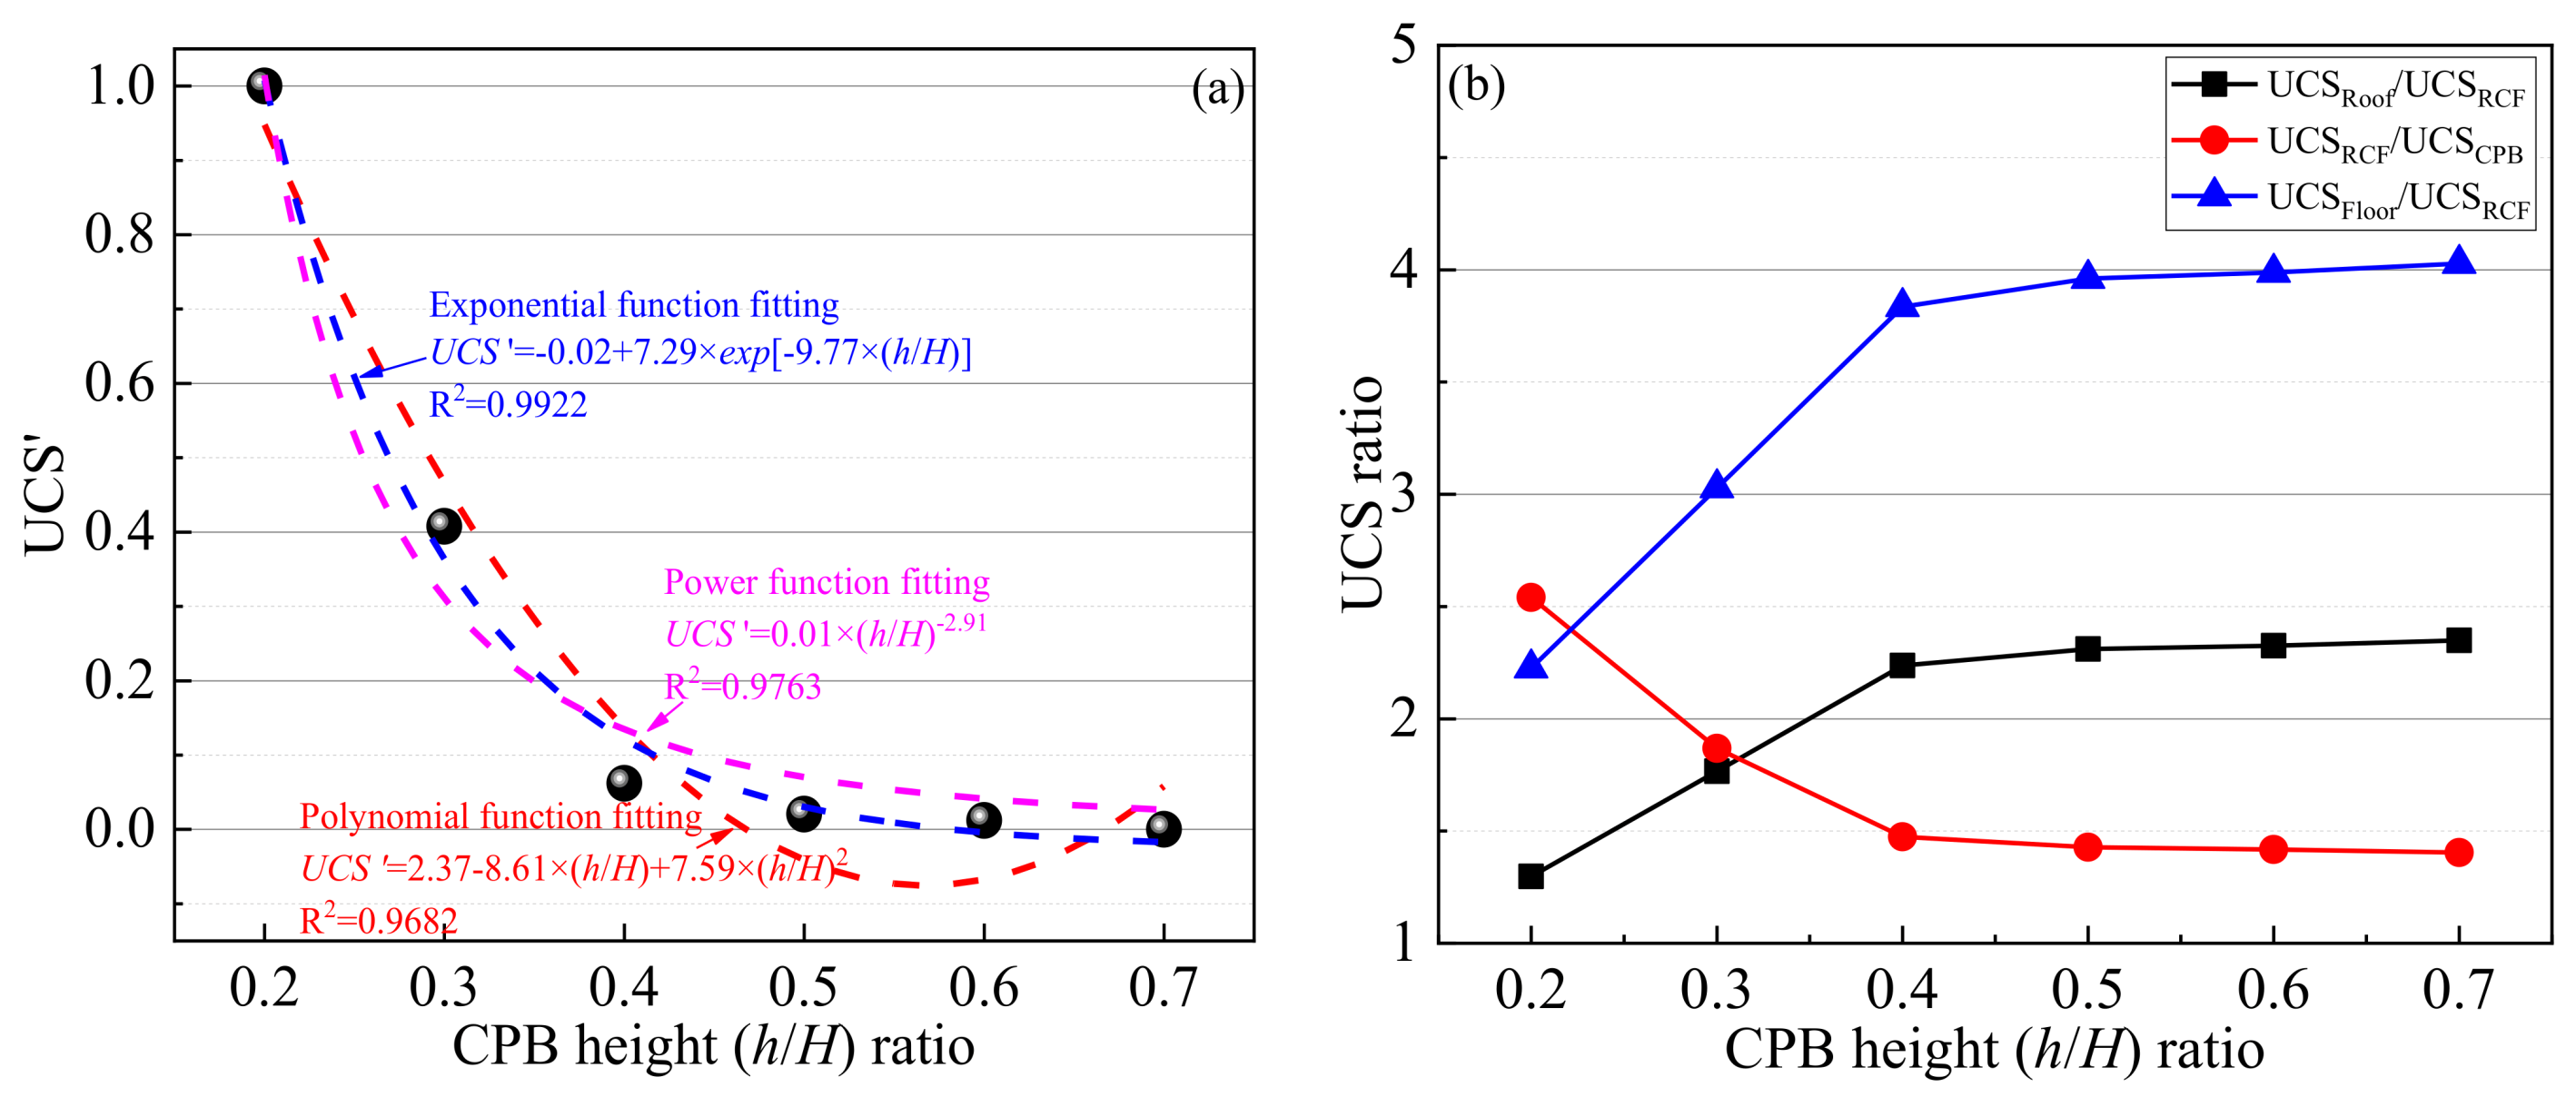
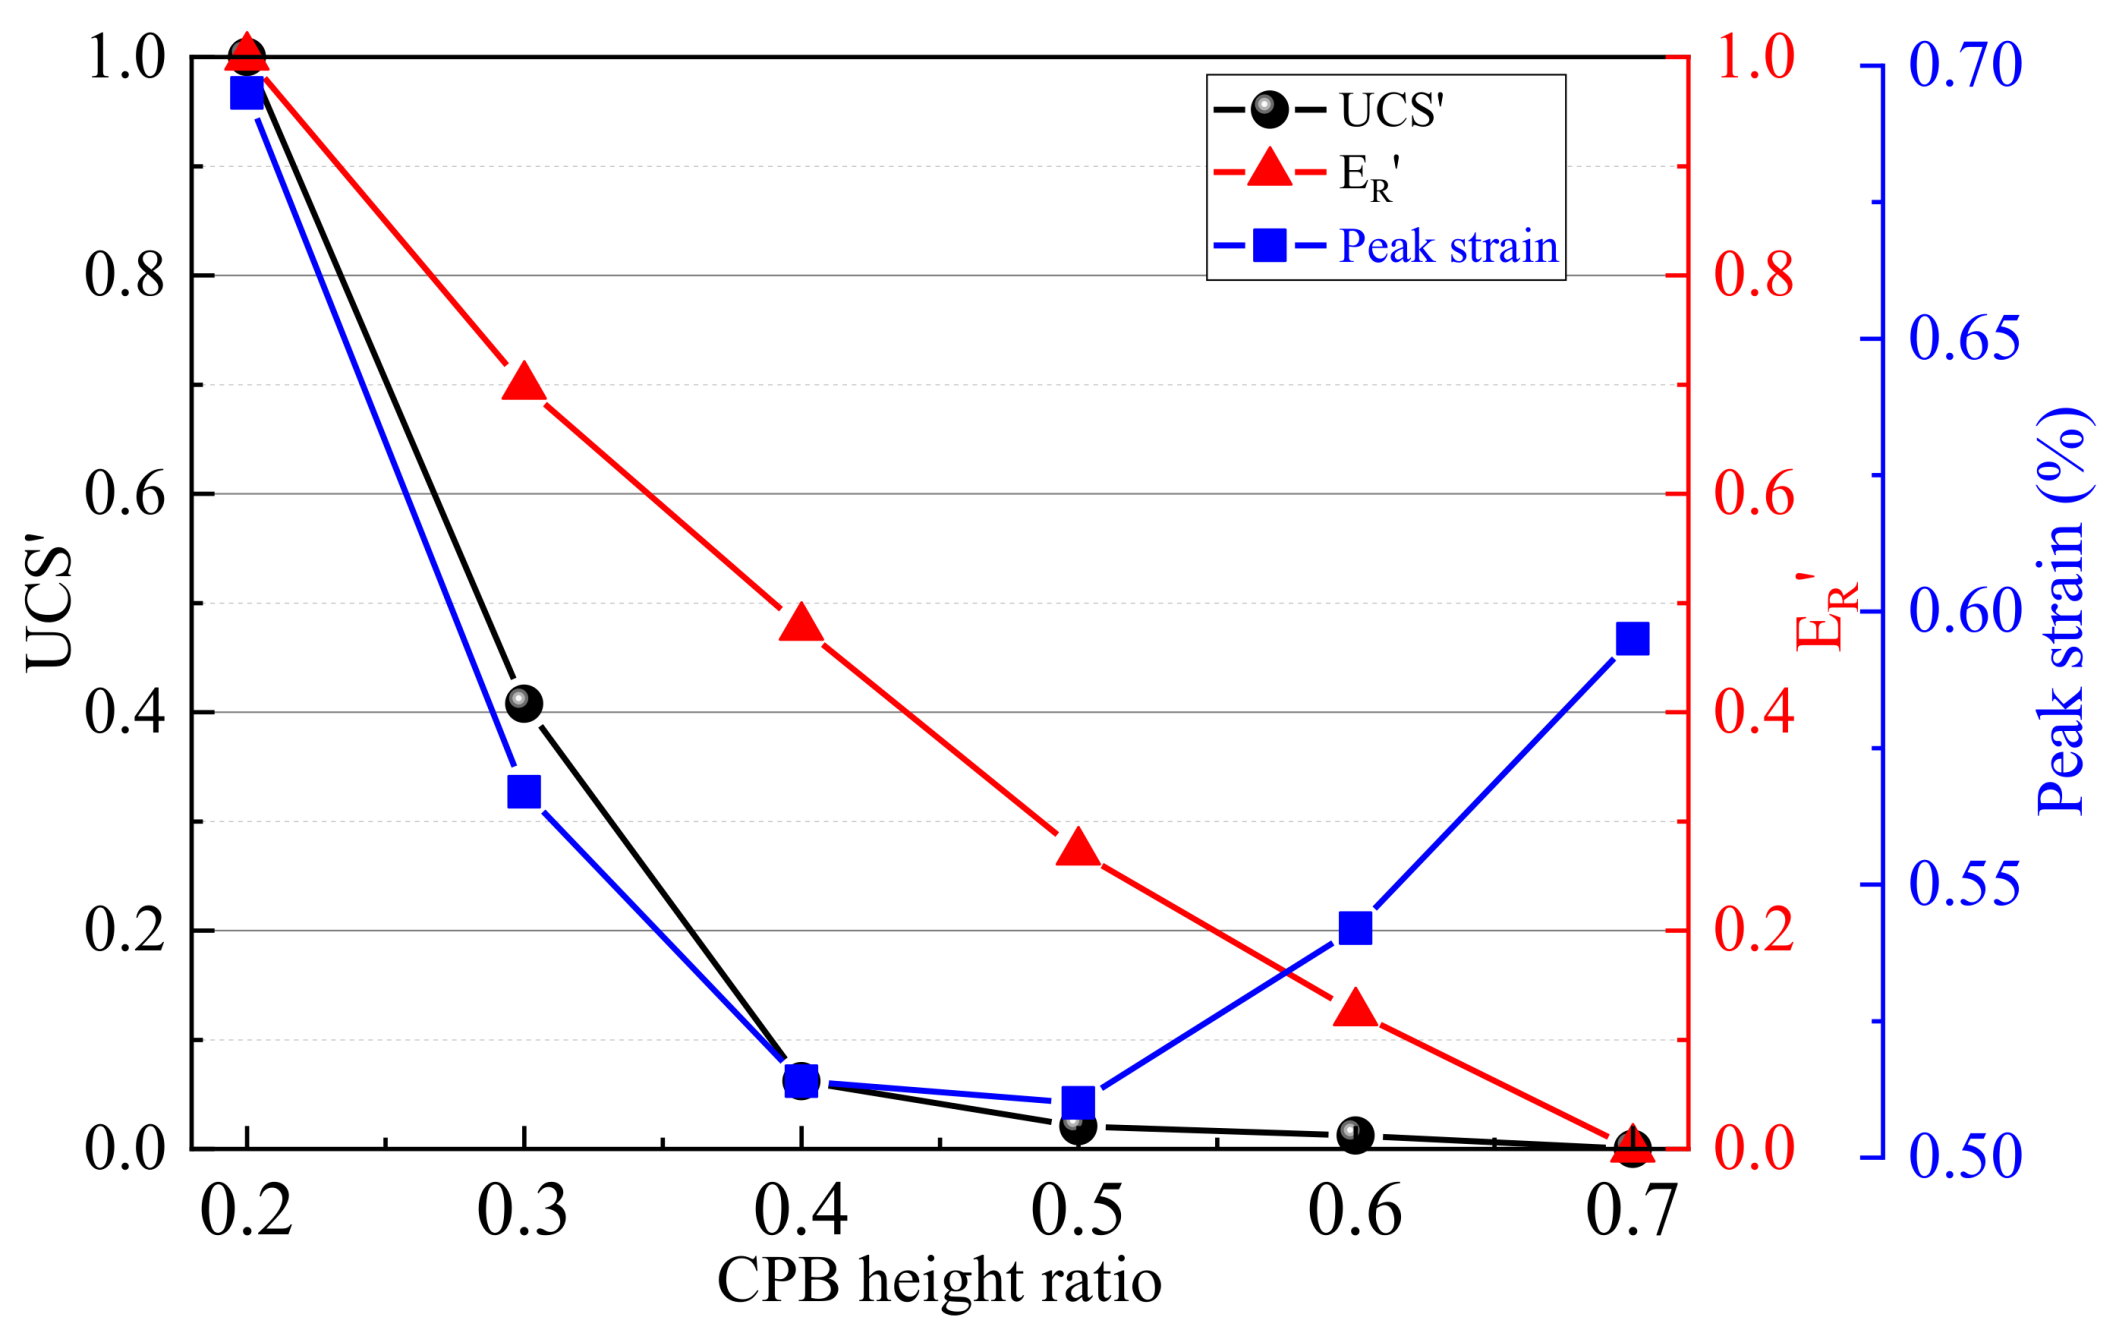
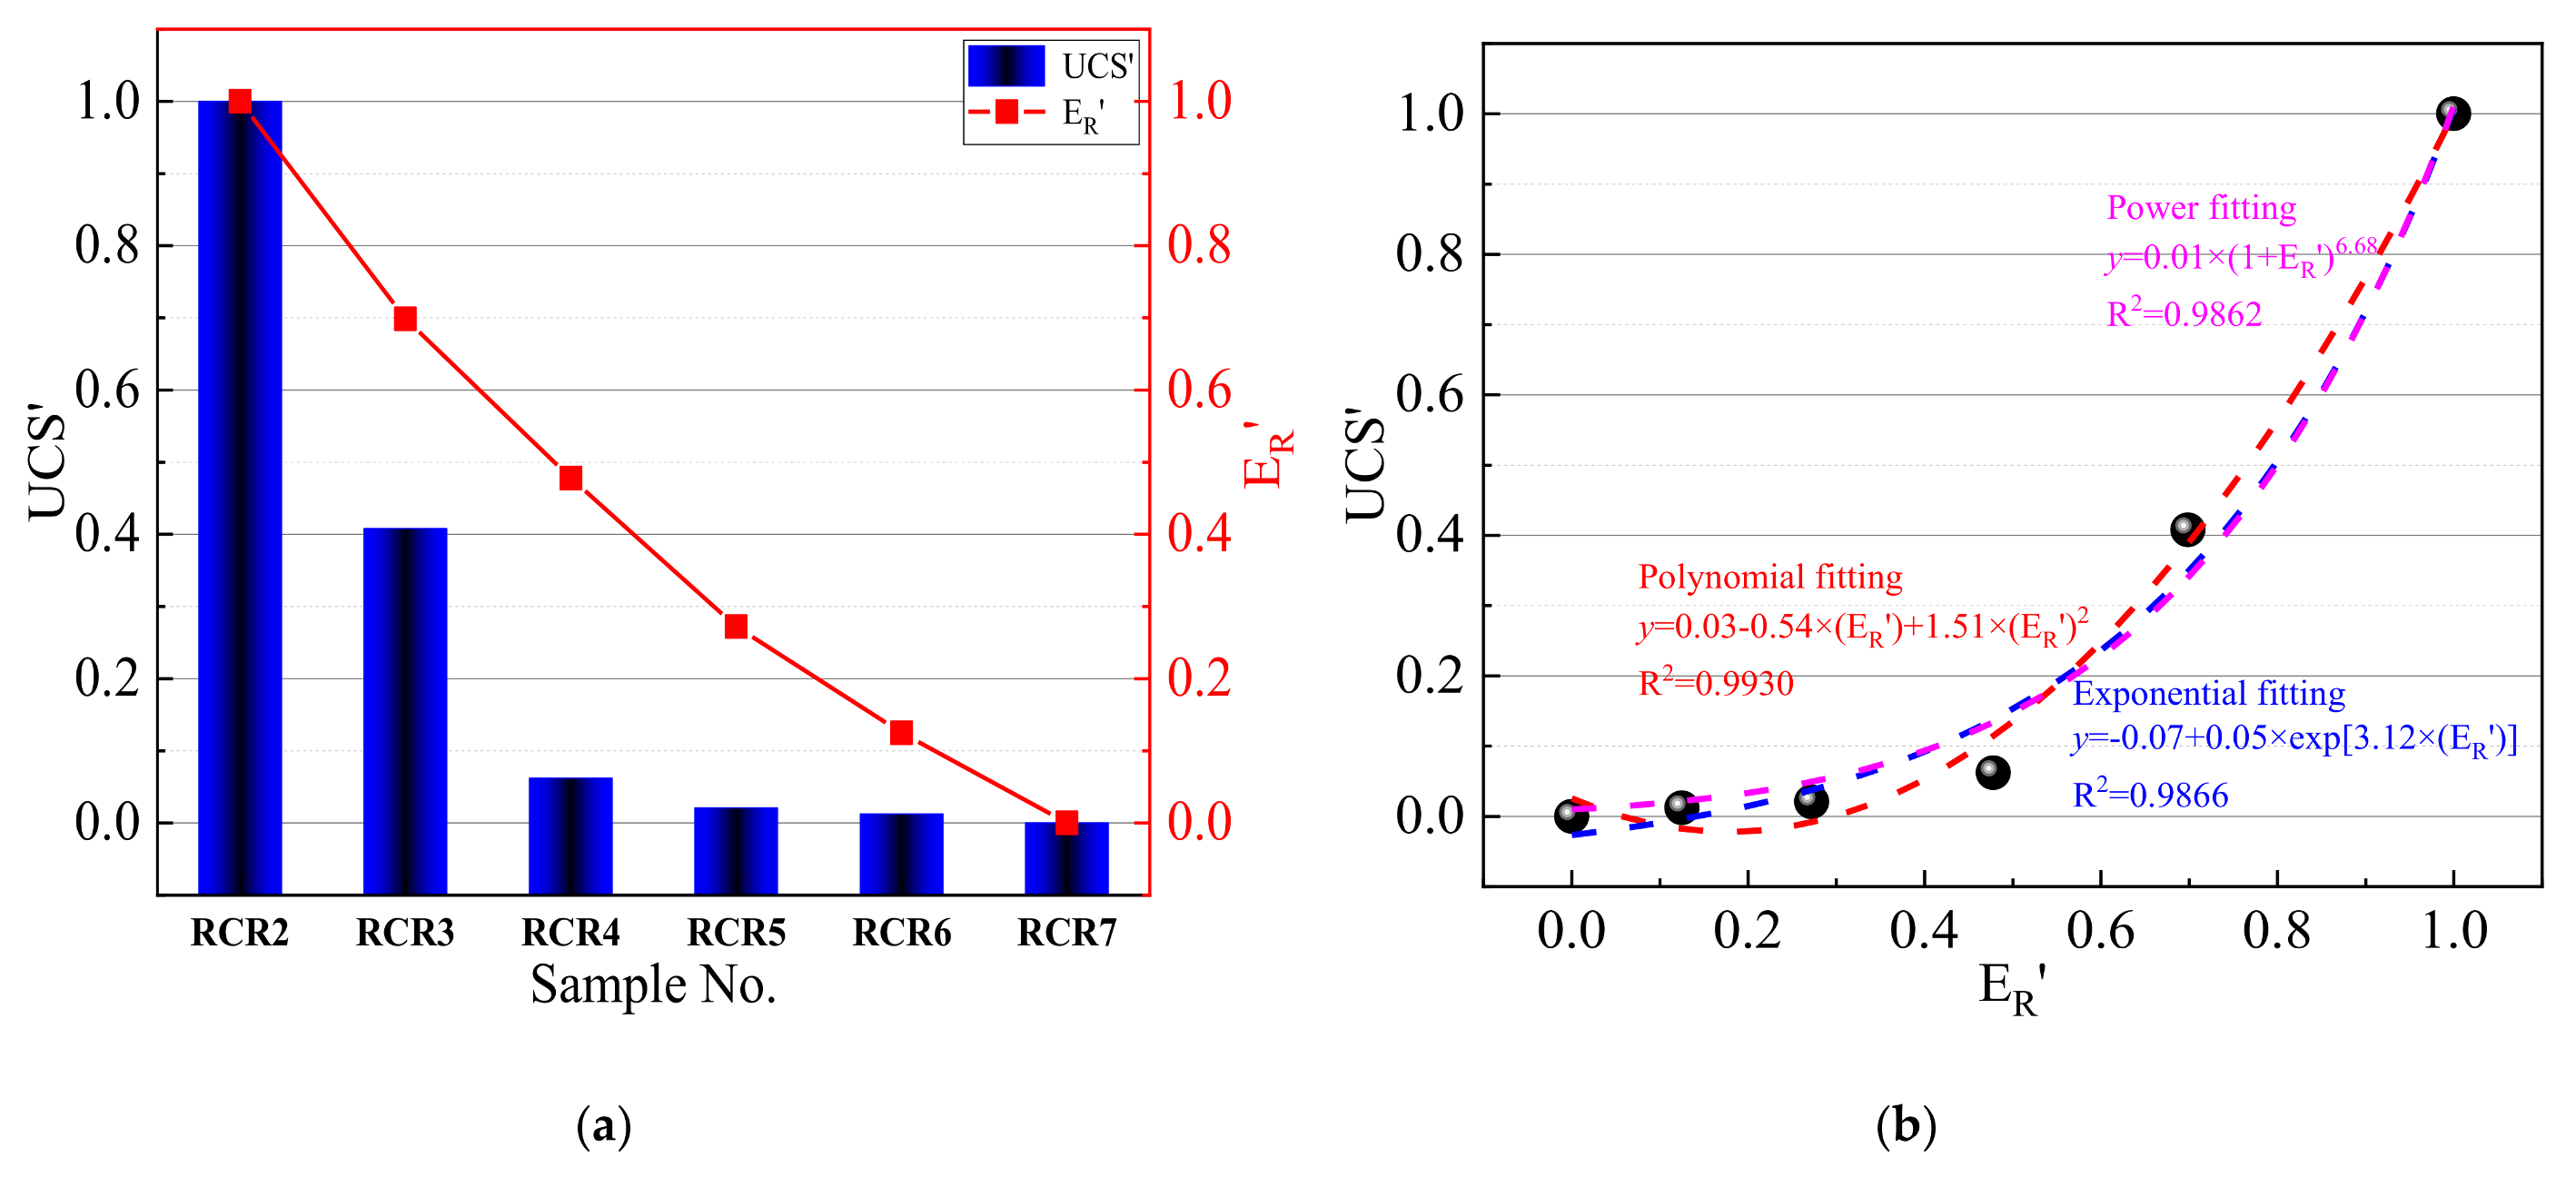
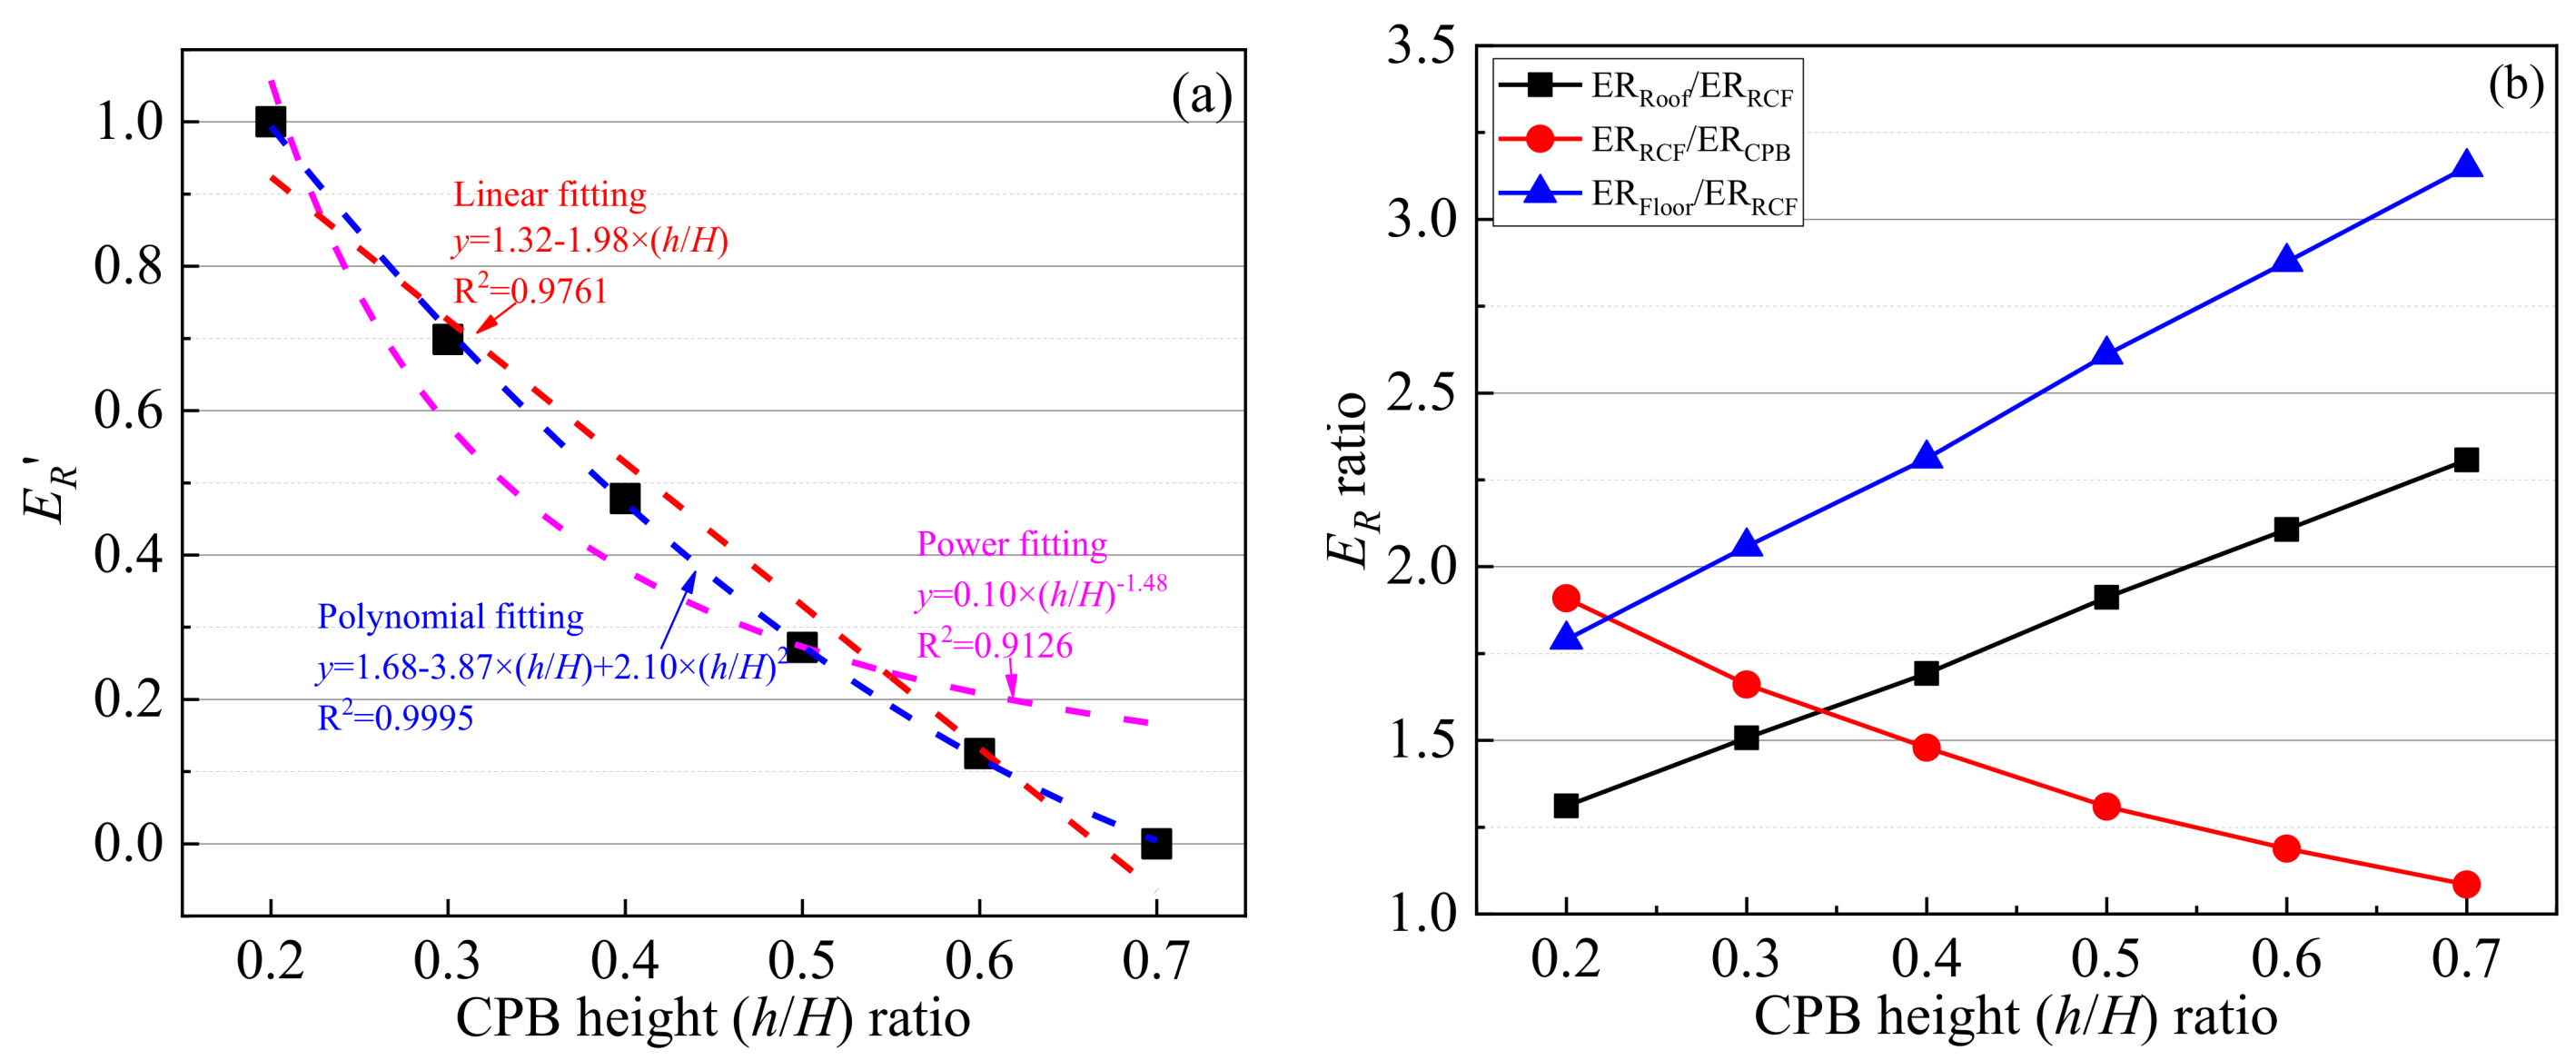
- The UCS and ER of the RCF samples were lower than those of the RR and FR, but higher than those of the CPB. With the increase in the CPB height ratio, the UCS and ER of the RCF samples showed a decreasing trend. The CPB height ratio had an exponential function relationship with the UCS and a polynomial function relationship with ER. The UCS increased as a polynomial function with the increase in the ER.
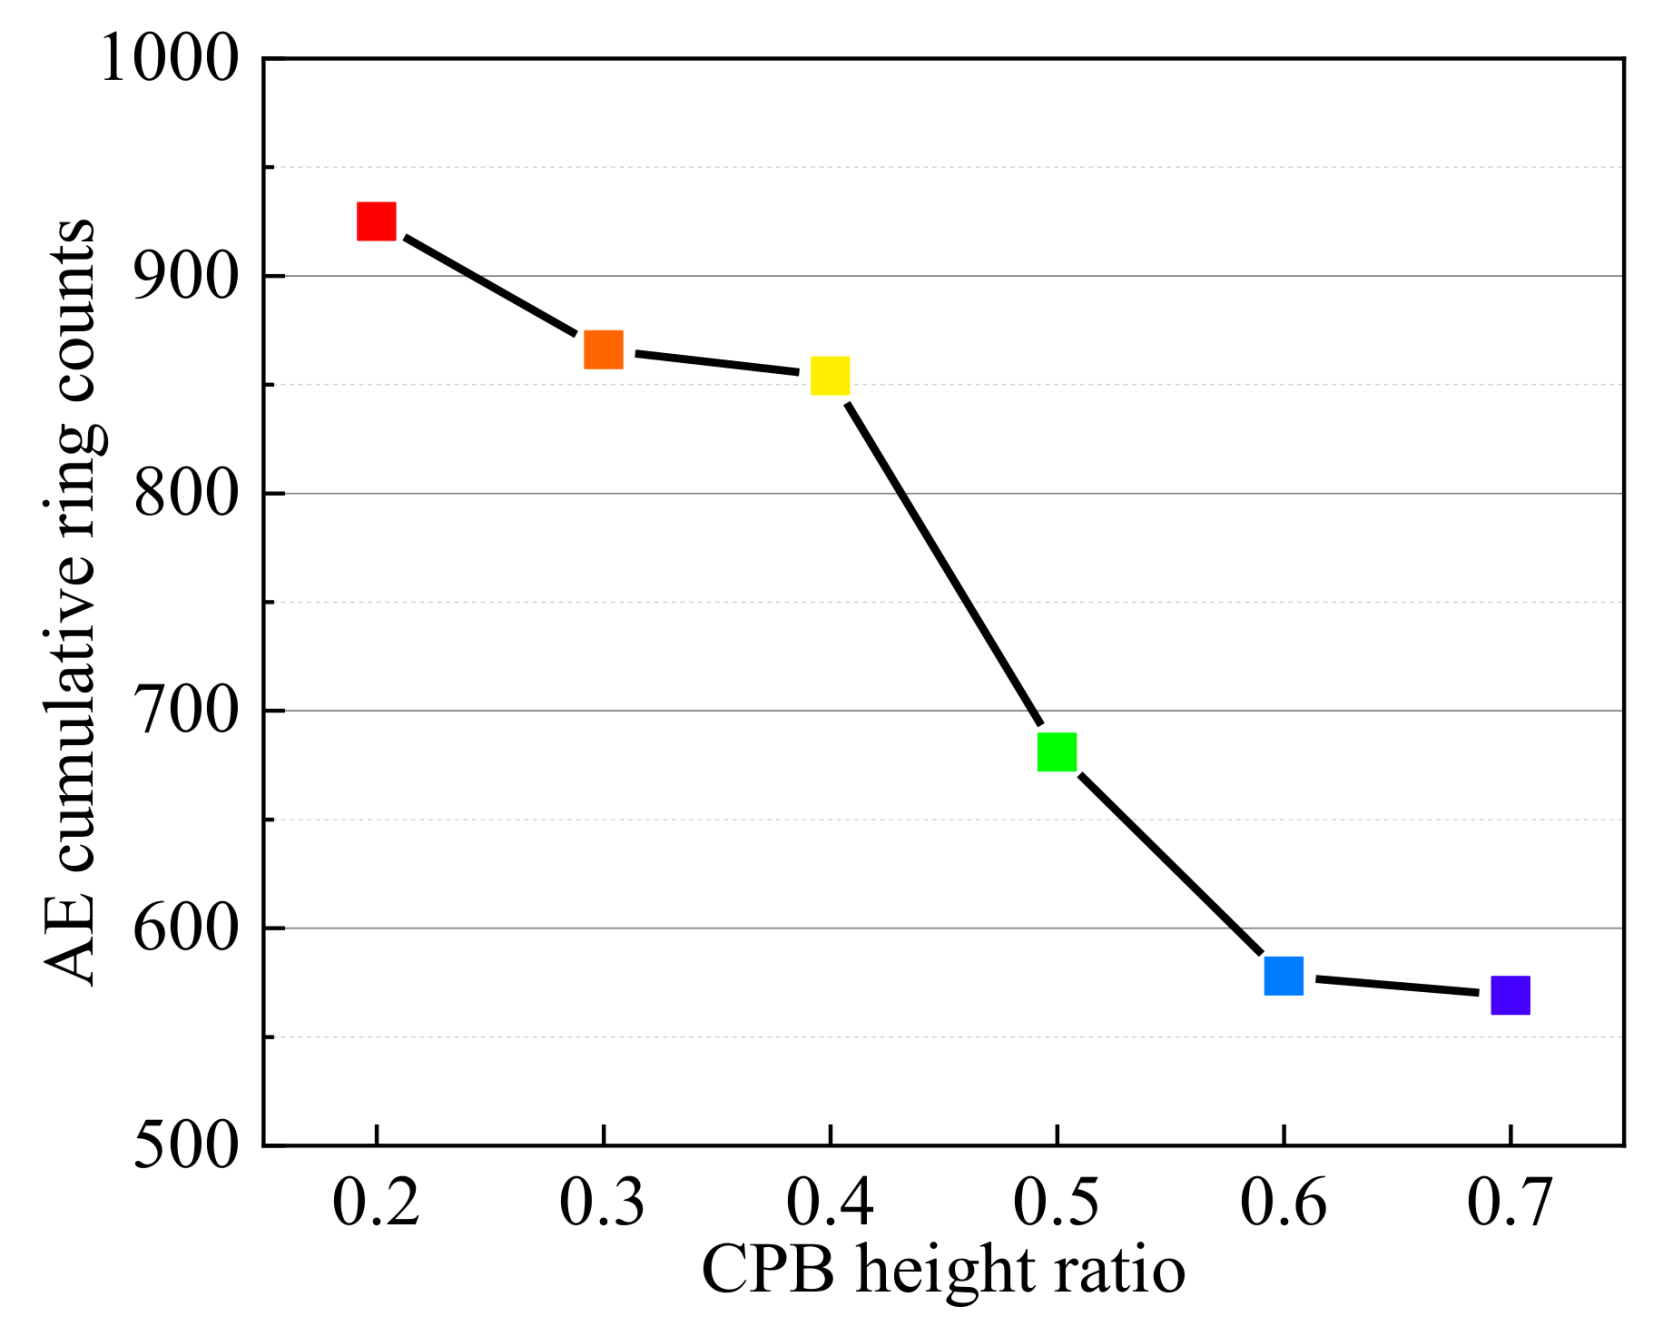
- (2)
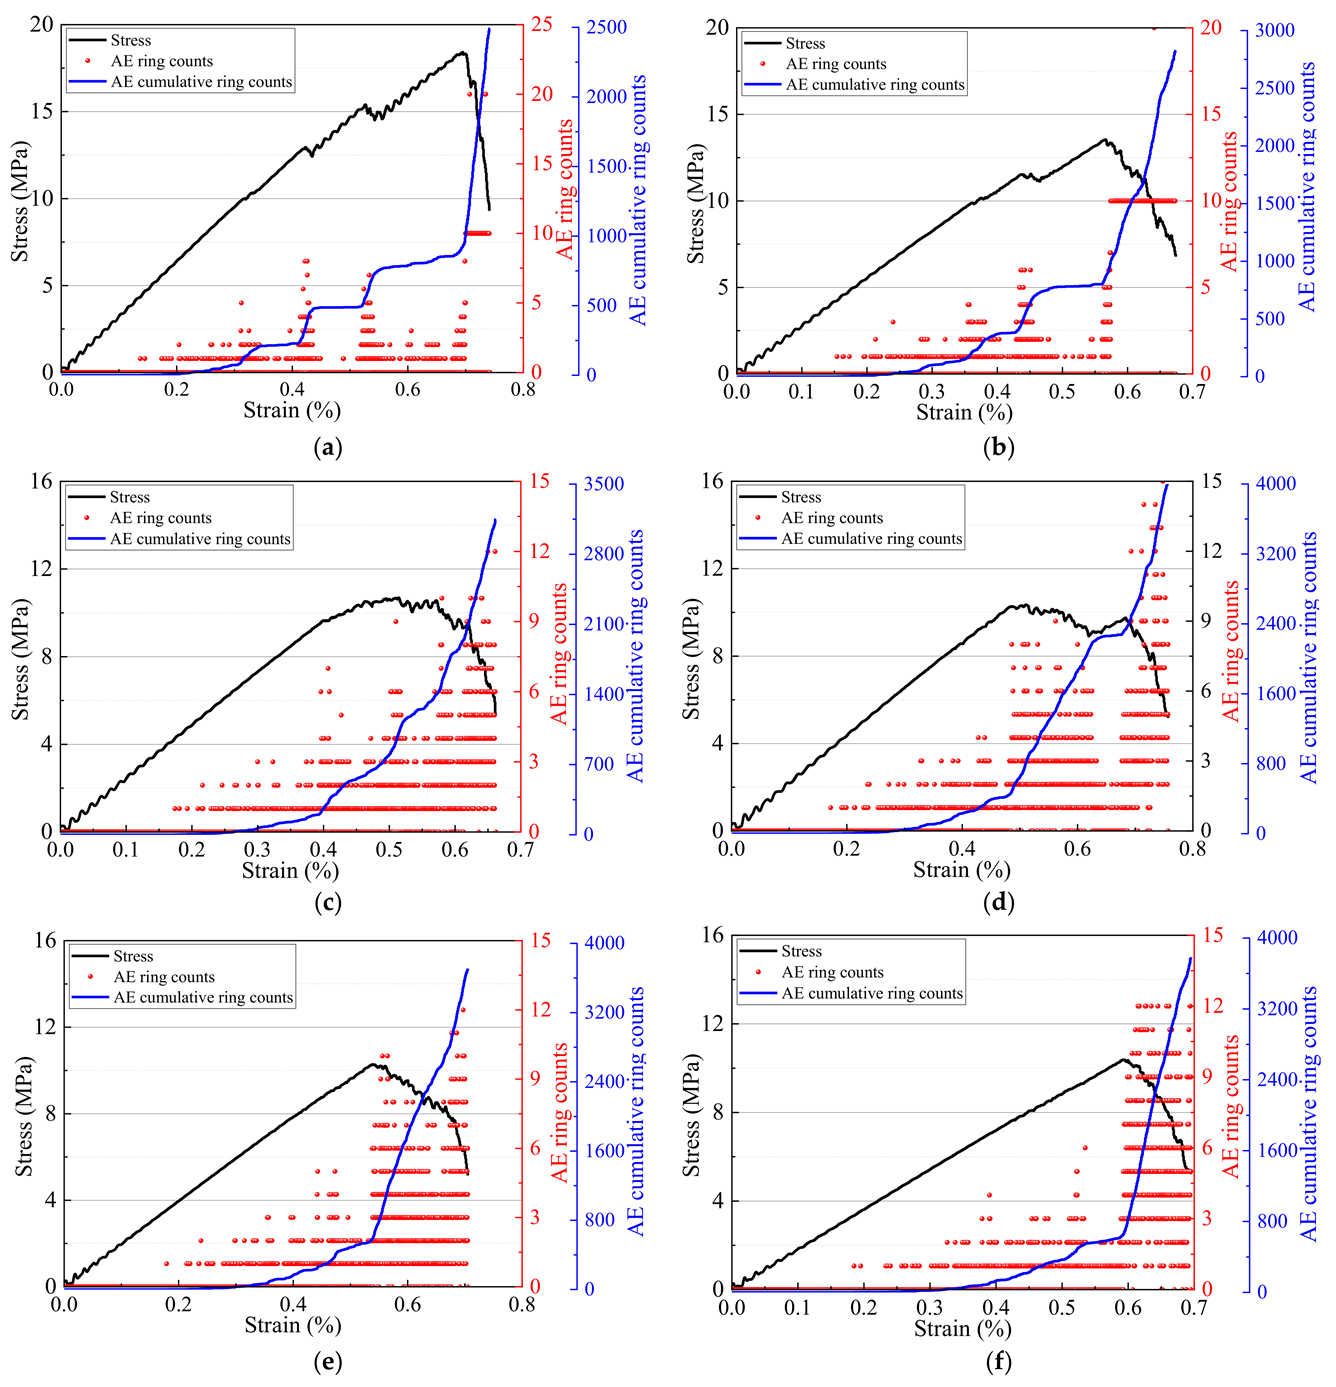
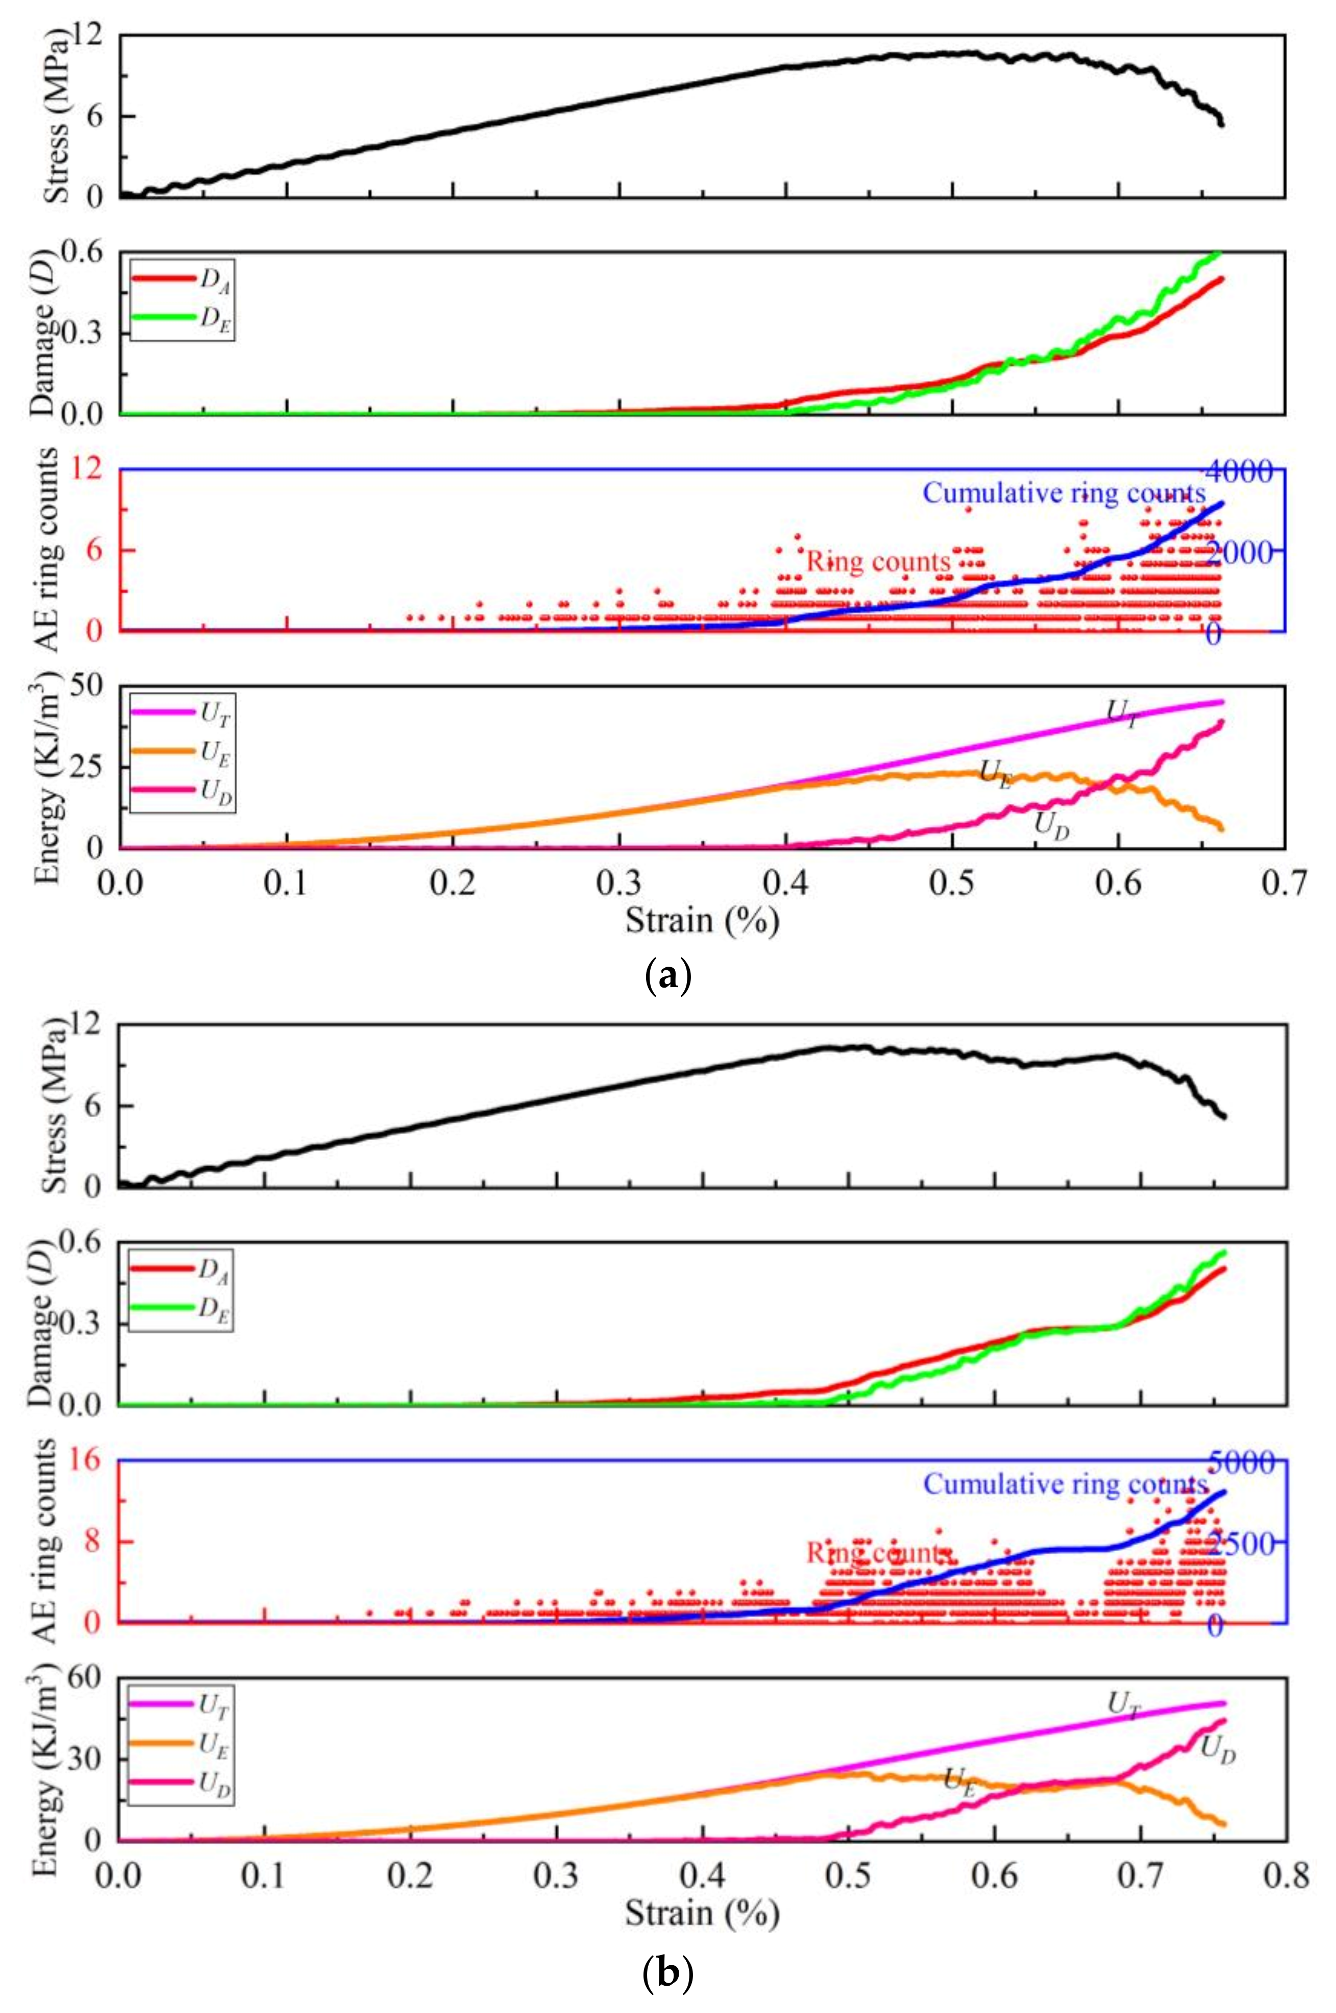
- The change law of the AE ring counts of the different RCF samples was basically similar. The AE ring count first grew slowly, then increased rapidly, and finally maintained a high-speed increase. The AE cumulative ring count at the peak point of the RCF sample decrease with the increase in the CPB height ratio.
- (3)
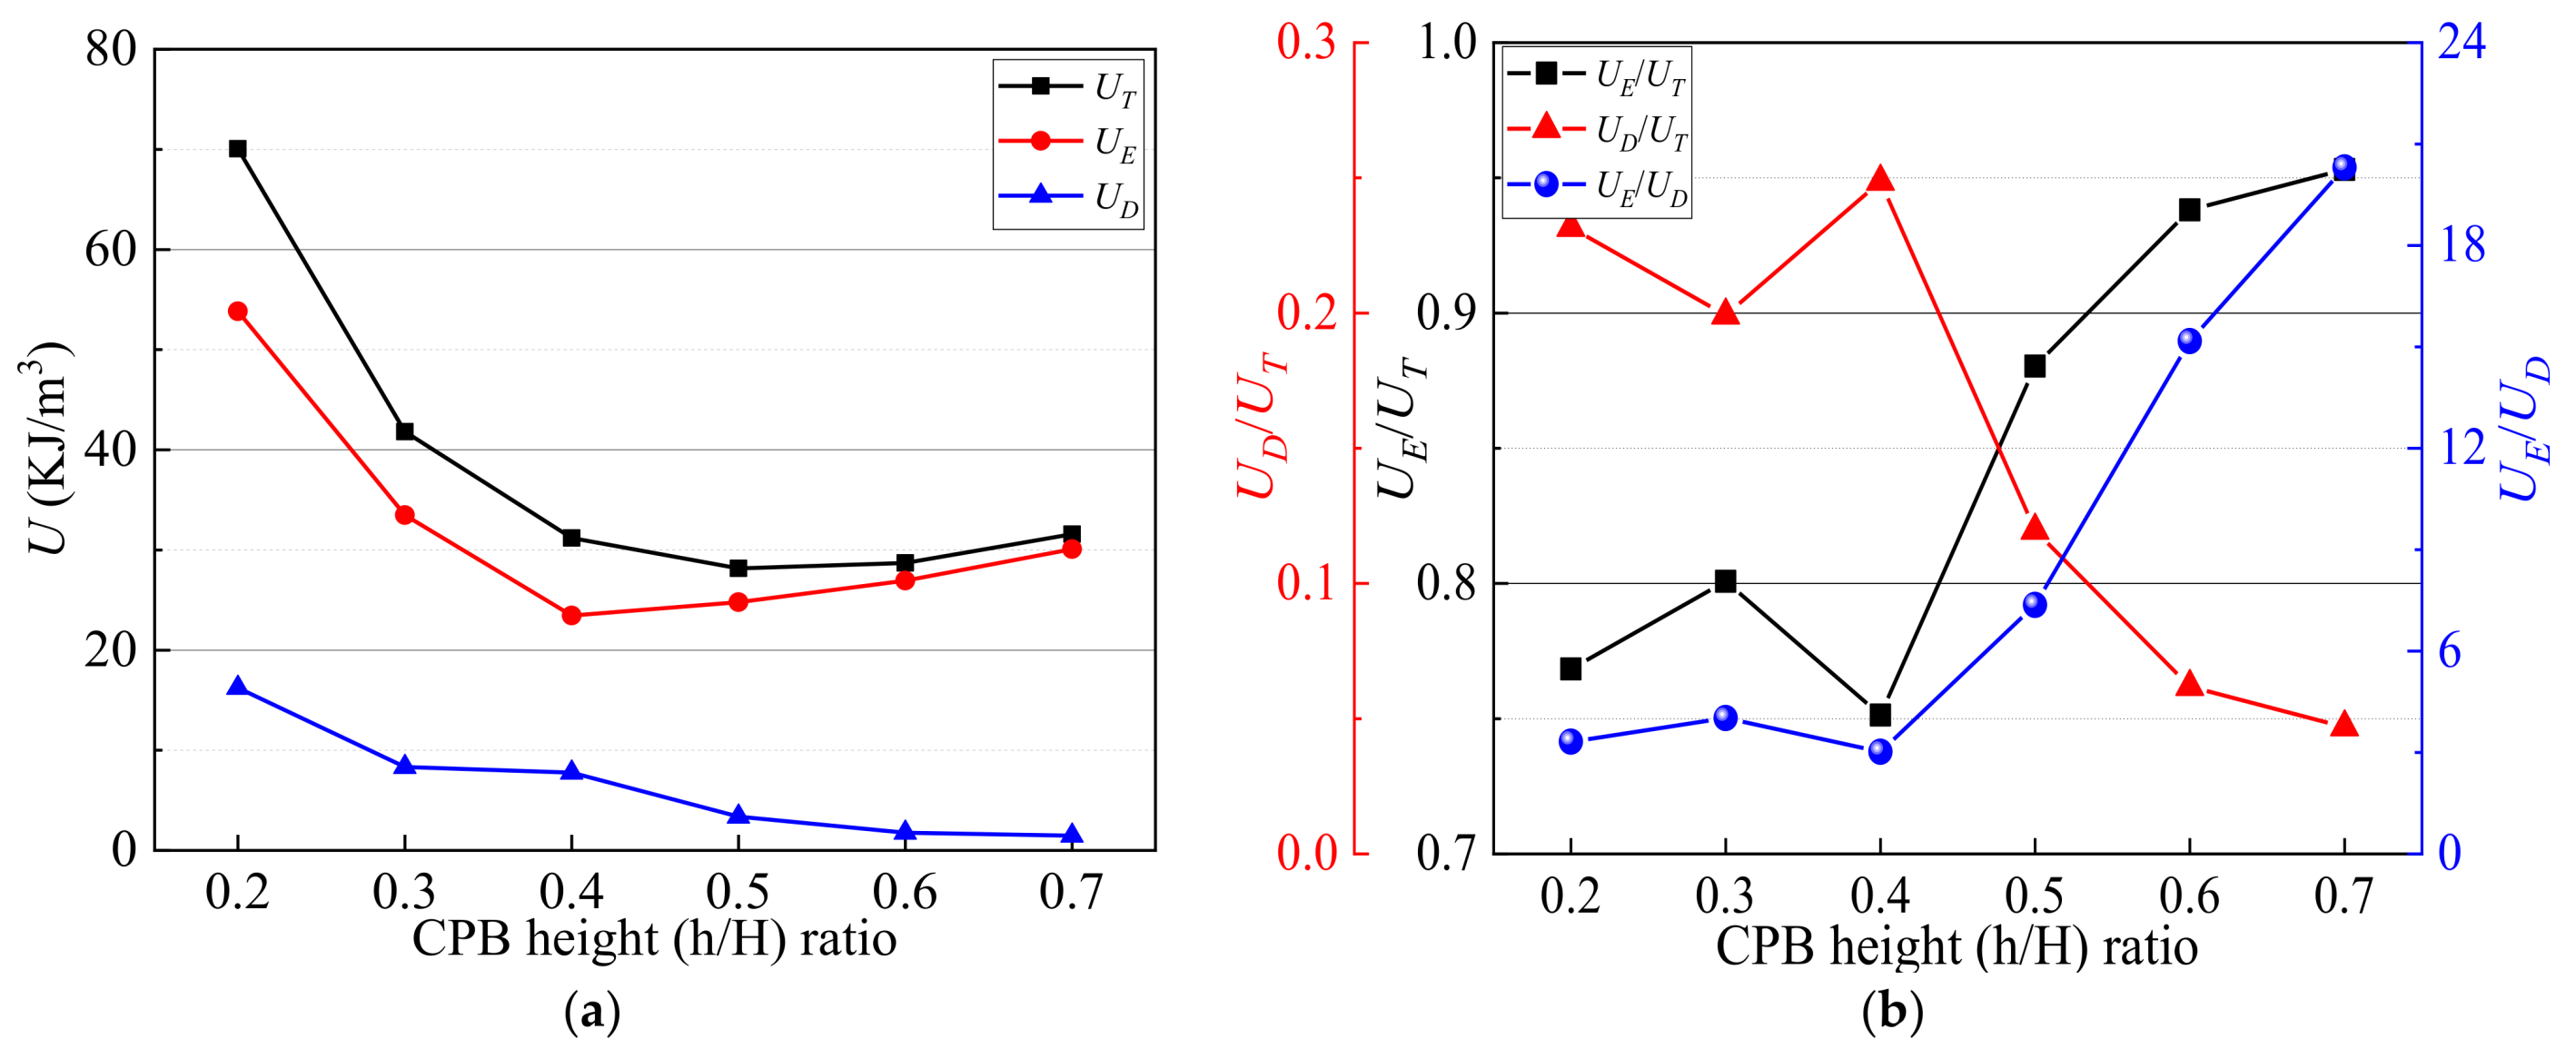
- At first, the elastic energy UE of the RCF sample began to accumulate slowly, then the dissipated energy UD began to increase. Finally, the UE began to decrease and the UD increased almost linearly. The UT, UE, and UD at the peak point showed a decreasing trend with the increase in the CPB height ratio. With the increase in the CPB height ratio, the UE–UT ratio and the UD–UT ratio decreased and the UE–UD ratio increased.
- (4)
- Two damage constitutive models were established based on the AE ring counts and energy principle. The verification results show that the model that was constructed in this paper is reasonable and reliable. The damage evolution process of RCF materials can be divided into three stages: the slow damage accumulation stage, stable damage growth stage, and rapid damage accumulation stage.
- (5)
- The AE ring counts and energy dissipation are closely related to internal damage evolution. First, the AE ring count accumulated slowly, the UE increased slowly, and there was almost no damage evolution. Subsequently, the AE ring count accumulated rapidly, UD increased slowly, and damage slowly evolved. Finally, the AE ring count maintained high-speed accumulation, UE began to decrease, UD increased rapidly, and damage rapidly evolved.
Author Contributions
Funding
Data Availability Statement
Acknowledgments
Conflicts of Interest
References
- Xue, G.L.; Yilmaz, E.; Song, W.D.; Cao, S. Mechanical, flexural and microstructural properties of cement-tailings matrix composites: Effects of fiber type and dosage. Compos. Part B Eng. 2019, 172, 131–142. [Google Scholar] [CrossRef]
- Wang, J.; Fu, J.X.; Song, W.D.; Zhang, Y.F. Viscosity and Strength Properties of Cemented Tailings Backfill with Fly Ash and Its Strength Predicted. Minerals 2021, 11, 78. [Google Scholar] [CrossRef]
- Li, J.J.; Yilmaz, E.; Cao, S. Influence of industrial solid waste as filling material on mechanical and microstructural characteristics of cementitious backfills. Constr. Build. Mater. 2021, 299, 124288. [Google Scholar] [CrossRef]
- Xue, G.L.; Yilmaz, E.; Song, W.D.; Cao, S. Analysis of internal structure behavior of fiber reinforced cement-tailings matrix composites through X-ray computed tomography. Compos. Part B Eng. 2019, 175, 107091. [Google Scholar] [CrossRef]
- Zhao, K.; Huang, M.; Yan, Y.J.; Wan, W.L.; Ning, F.J.; Zhou, Y.; He, Z.W. Mechanical properties and synergistic deformation characteristics of tailings cemented filling assembled material body with different cement-tailings ratios. Chin. J. Rock Mech. Eng. 2021, 40 (Suppl. 1), 2781–2789. [Google Scholar]
- Cao, S.; Xue, G.L.; Yilmaz, E.; Yin, Z.Y.; Yang, F.D. Utilizing concrete pillars as an environmental mining practice in underground mines. J. Clean. Prod. 2021, 278, 123433. [Google Scholar] [CrossRef]
- Tosun-Felekoglu, K.; Felekoglu, B. Effects of fiber–matrix interaction on multiple cracking performance of polymeric fiber reinforced cementitious composites. Compos. Part B Eng. 2013, 52, 62–71. [Google Scholar] [CrossRef]
- Fang, K.; Fall, M. Shear Behaviour of Rock-Tailings Backfill Interface: Effect of Cementation, Rock Type, and Rock Surface Roughness. Geotech. Geol. Eng. 2021, 39, 1753–1770. [Google Scholar] [CrossRef]
- Xiu, Z.G.; Wang, S.H.; Wang, F.L.; Ren, F.Y.; Vantuan, N. Comparative experimental study on the shear behavior of cemented paste backfill and surrounding rock-backfill interface. Chin. J. Rock Mech. Eng. 2021, 40, 1628–1642. [Google Scholar]
- Cheng, A.P.; Shu, P.F.; Zhang, Y.S.; Wang, P.; Wang, M.X. Acoustic emission characteristics and damage constitution of backfill-surrounding rock combination. J. Min. Saf. Eng. 2020, 37, 1238–1245. [Google Scholar]
- Sarfarazi, V.; Abharian, S.; Ghorbani, A. Physical test and PFC modelling of rock pillar failure containing two neighboring joints and one hole. Smart Struct. Syst. 2021, 27, 123–137. [Google Scholar]
- Sarfarazi, V.; Abharian, S.; Ghalam, E.Z. Physical test and PFC2D simulation of the failure mechanism of echelon joint under uniaxial compression. Comput. Concr. 2021, 27, 99–109. [Google Scholar]
- Wang, Y.R.; Lu, H.J.; Wu, J. Experimental investigation on strength and failure characteristics of cemented paste backfill-rock composite under uniaxial compression. Constr. Build. Mater. 2021, 304, 124629. [Google Scholar] [CrossRef]
- He, Z.W.; Zhao, K.; Yan, Y.J.; Ning, F.J.; Zhou, Y.; Song, Y.F. Mechanical response and acoustic emission characteristics of cement paste backfill and rock combination. Constr. Build. Mater. 2021, 288, 123119. [Google Scholar] [CrossRef]
- Wu, W.L.; Xu, W.B.; Zuo, J.P. Effect of inclined interface angle on shear strength and deformation response of cemented paste backfill-rock under triaxial compression. Constr. Build. Mater. 2021, 279, 122478. [Google Scholar]
- Fang, K.; Cui, L.; Fall, M. A coupled chemo-elastic cohesive zone model for backfill-rock interface. Comput. Geotech. 2020, 125, 103666. [Google Scholar] [CrossRef]
- Fang, K.; Fall, M.; Cui, L. Thermo-chemo-mechanical cohesive zone model for cemented paste backfill-rock interface. Eng. Fract. Mech. 2021, 244, 107546. [Google Scholar] [CrossRef]
- Yu, X.; Kemeny, J.; Tan, Y.Y.; Song, W.D.; Huang, K. Mechanical properties and fracturing of rock-backfill composite specimens under triaxial compression. Constr. Build. Mater. 2021, 304, 124577. [Google Scholar] [CrossRef]
- Zhao, L.D. Numerical investigation on the mechanical behaviour of combined backfill-rock structure with KCC model. Constr. Build. Mater. 2021, 283, 122782. [Google Scholar] [CrossRef]
- Zhao, K.; He, Z.W.; Ning, F.J.; Zhou, Y.; Yan, Y.J.; Wang, Y.L.; Wang, J.Q. Acoustic Emission Characteristics of Cementitious Material with Different Cement-Tailing Ratio. J. Chin. Ceram. Soc. 2021, 49, 2462–2469. [Google Scholar]
- Liu, W.; Ma, L.Q.; Sun, H.; Khan, N.M. An experimental study on infrared radiation and acoustic emission characteristics during crack evolution process of loading rock. Infrared Phys. Technol. 2021, 118, 103864. [Google Scholar] [CrossRef]
- Liu, X.L.; Liu, Z.; Li, X.B.; Gong, F.Q.; Du, K. Experimental study on the effect of strain rate on rock acoustic emission characteristics. Int. J. Rock Mech. Min. Sci. 2020, 133, 104420. [Google Scholar] [CrossRef]
- Liu, J.P.; Wang, R.; Lei, G.; Si, Y.T.; Xu, S.D.; Li, Y.H. Studies of stress and displacement distribution and the evolution law during rock failure process based on acoustic emission and microseismic monitoring. Int. J. Rock Mech. Min. Sci. 2020, 132, 104384. [Google Scholar] [CrossRef]
- Lin, Q.B.; Cao, P.; Cao, R.H.; Lin, H.; Meng, J.J. Mechanical behavior around double circular openings in a jointed rock mass under uniaxial compression. Arch. Civ. Mech. Eng. 2020, 20, 19. [Google Scholar] [CrossRef] [Green Version]
- Wang, J.; Fu, J.X.; Song, W.D.; Zhang, Y.F.; Wu, S. Acoustic emission characteristics and damage evolution process of layered cemented tailings backfill under uniaxial compression. Constr. Build. Mater. 2021, 295, 123663. [Google Scholar] [CrossRef]
- Cheng, A.P.; Shu, P.F.; Deng, D.Q.; Zhou, C.S.; Huang, S.B.; Ye, Z.Y. Microscopic acoustic emission simulation and fracture mechanism of cemented tailings backfill based on moment tensor theory. Constr. Build. Mater. 2021, 308, 125069. [Google Scholar] [CrossRef]
- Zhou, Y.; Yan, Y.J.; Zhao, K.; Yu, X.; Song, Y.F.; Wang, J.Q.; Suo, T.Y. Study of the effect of loading modes on the acoustic emission fractal and damage characteristics of cemented paste backfill. Constr. Build. Mater. 2021, 277, 122311. [Google Scholar] [CrossRef]
- Zhao, K.; Yu, X.; Zhu, S.T.; Yan, Y.J.; Zhou, Y.; He, Z.W.; Song, Y.F.; Huang, M. Acoustic emission fractal characteristics and mechanical damage mechanism of cemented paste backfill prepared with tantalum niobium mine tailings. Constr. Build. Mater. 2020, 258, 119720. [Google Scholar] [CrossRef]
- Wang, Y.Y.; Deng, H.C.; Deng, Y.; Chen, K.P.; He, J.H. Study on crack dynamic evolution and damage-fracture mechanism of rock with pre-existing cracks based on acoustic emission location. J. Pet. Sci. Eng. 2021, 201, 108420. [Google Scholar] [CrossRef]
- Behera, S.K.; Mishra, D.P.; Singh, P.; Mishra, K.; Mandal, S.K.; Ghosh, C.N.; Kumar, R.; Mandal, P.K. Utilization of mill tailings, fly ash and slag as mine paste backfill material: Review and future perspective. Constr. Build. Mater. 2021, 309, 125120. [Google Scholar] [CrossRef]
- Souyang, H.; Huang, Y.; Zhou, N.; Li, J.; Gao, H.; Guo, Y. Experiment on hydration exothermic characteristics and hydration mechanism of sand-based cemented paste backfill materials. Constr. Build. Mater. 2021, 318, 125870. [Google Scholar]
- Cavusoglu, I.; Yilmaz, E.; Yilmaz, A.O. Sodium silicate effect on setting properties, strength behavior and microstructure of cemented coal fly ash backfill. Power Technol. 2021, 384, 17–28. [Google Scholar] [CrossRef]
- Libos, I.L.S.; Cui, L.; Liu, X. Effect of curing temperature on time-dependent shear behavior and properties of polypropylene fiber-reinforced cemented paste backfill. Constr. Build. Mater. 2021, 311, 125302. [Google Scholar] [CrossRef]
- Ran, H.; Guo, Y.; Feng, G.; Qi, T.; Du, X. Creep properties and resistivity-ultrasonic-AE responses of cemented gangue backfill column under high-stress area. Int. J. Min. Sci. Technol. 2021, 31, 401–412. [Google Scholar] [CrossRef]
- Hou, Y.; Yin, S.; Chen, X.; Zhang, M.; Yang, S. Study on characteristic stress and energy damage evolution mechanism of cemented tailings backfill under uniaxial compression. Constr. Build. Mater. 2021, 301, 124333. [Google Scholar] [CrossRef]
- Yin, S.; Hou, Y.; Chen, X.; Zhang, M. Mechanical, flowing and microstructural properties of cemented sulfur tailings backfill: Effects of fiber lengths and dosage. Constr. Build. Mater. 2021, 309, 125058. [Google Scholar] [CrossRef]
- Qiu, H.; Zhang, F.; Liu, L.; Huan, C.; Hou, D.; Kang, W. Experimental study on acoustic emission characteristics of cemented rock-tailings backfill. Constr. Build. Mater. 2021, 315, 125278. [Google Scholar] [CrossRef]
- Xin, L. Meso-scale modeling of the influence of waste rock content on mechanical behavior of cemented tailings backfill. Constr. Build. Mater. 2021, 307, 124473. [Google Scholar] [CrossRef]
- Zhao, K.; Huang, M.; Zhou, Y.; Yan, Y.; Wan, W.; Ning, F.; He, Z.; Wang, J. Synergistic deformation in a combination of cemented paste backfill and rocks. Constr. Build. Mater. 2022, 317, 125943. [Google Scholar] [CrossRef]
- Liu, H.F.; Zhang, J.X.; Li, B.Y.; Zhou, N.; Li, D.Q.; Zhang, L.B.; Xiao, X. Long term leaching behavior of arsenic from cemented paste backfill made of construction and demolition waste: Experimental and numerical simulation studies. J. Hazard. Mater. 2021, 416, 125813. [Google Scholar] [PubMed]
- Liu, L.; Fang, Z.Y.; Wu, Y.P.; Lai, X.P.; Wang, P.; Song, K.-I. Experimental investigation of solid-liquid two-phase flow in cemented rock-tailings backfill using Electrical Resistance Tomography. Constr. Build. Mater. 2018, 175, 267–276. [Google Scholar] [CrossRef]
- Guicheng, H.; Shenglong, L.; Bingxiang, H.; Zhijun, Z.; Dexin, D. Reasonable matching for cemented waste rock backfill and sand shale. J. Min. Saf. Eng. 2017, 34, 371–376. [Google Scholar]
- Yuye, T.; Xin, Y.; Weidong, S.; Haiping, W.; Shuai, C. Experimental study on combined pressure-bearing mechanism of filling body and surrounding rock. J. Min. Saf. Eng. 2018, 35, 1071–1076. [Google Scholar]
- Wang, J.; Fu, J.X.; Song, W.D.; Zhang, Y.F.; Wang, Y. Mechanical behavior, acoustic emission properties and damage evolution of cemented paste backfill considering structural feature. Constr. Build. Mater. 2020, 261, 119958. [Google Scholar] [CrossRef]
- Wang, J.; Fu, J.X.; Song, W.D.; Zhang, Y.F. Mechanical properties, damage evolution, and constitutive model of rock-encased backfill under uniaxial compression. Constr. Build. Mater. 2021, 285, 122898. [Google Scholar] [CrossRef]
- Fu, J.X.; Wang, J.; Song, W.D. Damage constitutive model and strength criterion of cemented paste backfill based on layered effect considerations. J. Mater. Res. Technol. 2020, 9, 6073–6084. [Google Scholar] [CrossRef]
- Liu, W.Z.; Chen, J.T.; Guo, Z.P.; Yang, H.Z.; Xie, W.W.; Zhang, Y.D. Mechanical properties and damage evolution of cemented coal gangue-fly ash backfill under uniaxial compression: Effects of different curing temperatures. Constr. Build. Mater. 2021, 305, 124820. [Google Scholar] [CrossRef]
- Hou, J.F.; Guo, Z.P.; Li, J.B.; Zhao, L.J. Study on triaxial creep test and theoretical model of cemented gangue fly ash backfill under seepage-stress coupling. Constr. Build. Mater. 2021, 273, 121722. [Google Scholar] [CrossRef]
- Lin, Q.B.; Cao, P.; Mao, S.Y.; Ou, C.J.; Cao, R.H. Fatigue behaviour and constitutive model of yellow sandstone containing pre-existing surface crack under uniaxial cyclic loading. Theor. Appl. Fract. Mech. 2020, 109, 102776. [Google Scholar] [CrossRef]
- Ma, Q.; Tan, Y.L.; Liu, X.S.; Gu, Q.H.; Li, X.B. Effect of coal thicknesses on energy evolution characteristics of roof rock-coal-floor rock sandwich composite structure and its damage constitutive model. Compos. Part B Eng. 2020, 198, 108086. [Google Scholar] [CrossRef]
- Hou, Z.K.; Gutierrez, M.; Ma, S.Q.; Almrabat, A.; Yang, C.H. Mechanical Behavior of Shale at Different Strain Rates. Rock Mech. Rock Eng. 2019, 52, 3531–3544. [Google Scholar] [CrossRef]
- Jia, Z.Q.; Li, C.B.; Zhang, R.; Wang, M.; Gao, M.Z.; Zhang, Z.T.; Zhang, Z.P.; Ren, L.; Xie, J. Energy Evolution of Coal at Different Depths Under Unloading Conditions. Rock Mech. Rock Eng. 2019, 52, 4637–4649. [Google Scholar] [CrossRef]
- Liu, B.; Huang, J.; Wang, Z.; Liu, L. Study on damage evolution and acoustic emission character of coal-rock under uniaxial compression. Chin. J. Rock Mech. Eng. 2009, 28 (Suppl. 1), 3234–3238. [Google Scholar]
- Barile, C.; Casavola, C.; Pappalettera, G.; Vimalathithan, P.K. Damage characterization in composite materials using acoustic emission signal-based and parameter-based data. Compos. Part B Eng. 2019, 178, 107469. [Google Scholar] [CrossRef]
- Liu, X.S.; Tan, Y.L.; Ning, J.G.; Lu, Y.W.; Gu, Q.H. Mechanical properties and damage constitutive model of coal in coal-rock combined body. Int. J. Rock Mech. Min. Sci. 2018, 110, 140–150. [Google Scholar] [CrossRef]


| Sample | SiO2 | K2O | CaO | P2O5 | MgO | Al2O3 | Fe2O3 | SO3 |
|---|---|---|---|---|---|---|---|---|
| OPC (%) | 20.10 | 0.37 | 61.8 | / | 1.57 | 5.11 | 2.91 | 1.98 |
| Full tailing (%) | 66.95 | 4.40 | 7.68 | 0.15 | 2.24 | 11.71 | 4.91 | 0.20 |
| Intact Sample | Sample No. | UCS (MPa) | Elastic Modulus (GPa) | Peak Strain (%) |
|---|---|---|---|---|
| Roof rock | RR | 23.91 | 4.13 | 0.71 |
| Cemented paste backfill | CPB | 7.25 | 1.65 | 0.57 |
| Floor rock | FR | 41.00 | 5.64 | 0.92 |
| CPB Height (h/H) Ratio | 0.2 | 0.3 | 0.4 | 0.5 | 0.6 | 0.7 |
|---|---|---|---|---|---|---|
| Sample No. | RCF2 | RCF3 | RCF4 | RCF5 | RCF6 | RCF7 |
| RCF samples models | 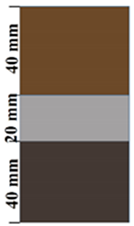 | 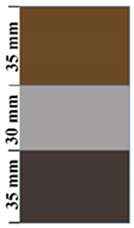 | 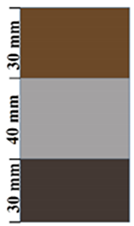 | 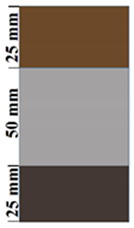 | 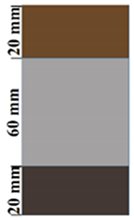 | 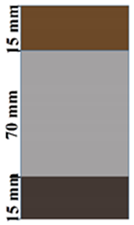 |
| UCS (MPa) | 18.42 | 13.54 | 10.69 | 10.35 | 10.28 | 10.18 |
| EM (GPa) | 3.15 | 2.74 | 2.44 | 2.16 | 1.96 | 1.79 |
| Peak strain (%) | 0.695 | 0.567 | 0.514 | 0.510 | 0.542 | 0.595 |
Publisher’s Note: MDPI stays neutral with regard to jurisdictional claims in published maps and institutional affiliations. |
© 2022 by the authors. Licensee MDPI, Basel, Switzerland. This article is an open access article distributed under the terms and conditions of the Creative Commons Attribution (CC BY) license (https://creativecommons.org/licenses/by/4.0/).
Share and Cite
Wang, J.; Zhang, C.; Fu, J.; Song, W.; Zhang, Y. The Energy Dissipation Mechanism and Damage Constitutive Model of Roof–CPB–Floor (RCF) Layered Composite Materials. Minerals 2022, 12, 419. https://doi.org/10.3390/min12040419
Wang J, Zhang C, Fu J, Song W, Zhang Y. The Energy Dissipation Mechanism and Damage Constitutive Model of Roof–CPB–Floor (RCF) Layered Composite Materials. Minerals. 2022; 12(4):419. https://doi.org/10.3390/min12040419
Chicago/Turabian StyleWang, Jie, Chi Zhang, Jianxin Fu, Weidong Song, and Yongfang Zhang. 2022. "The Energy Dissipation Mechanism and Damage Constitutive Model of Roof–CPB–Floor (RCF) Layered Composite Materials" Minerals 12, no. 4: 419. https://doi.org/10.3390/min12040419
APA StyleWang, J., Zhang, C., Fu, J., Song, W., & Zhang, Y. (2022). The Energy Dissipation Mechanism and Damage Constitutive Model of Roof–CPB–Floor (RCF) Layered Composite Materials. Minerals, 12(4), 419. https://doi.org/10.3390/min12040419