
The Energy Dissipation, AE Characteristics, and Microcrack Evolution of Rock–Backfill Composite Materials (RBCM)

Abstract
:1. Introduction
2. Materials and Methods
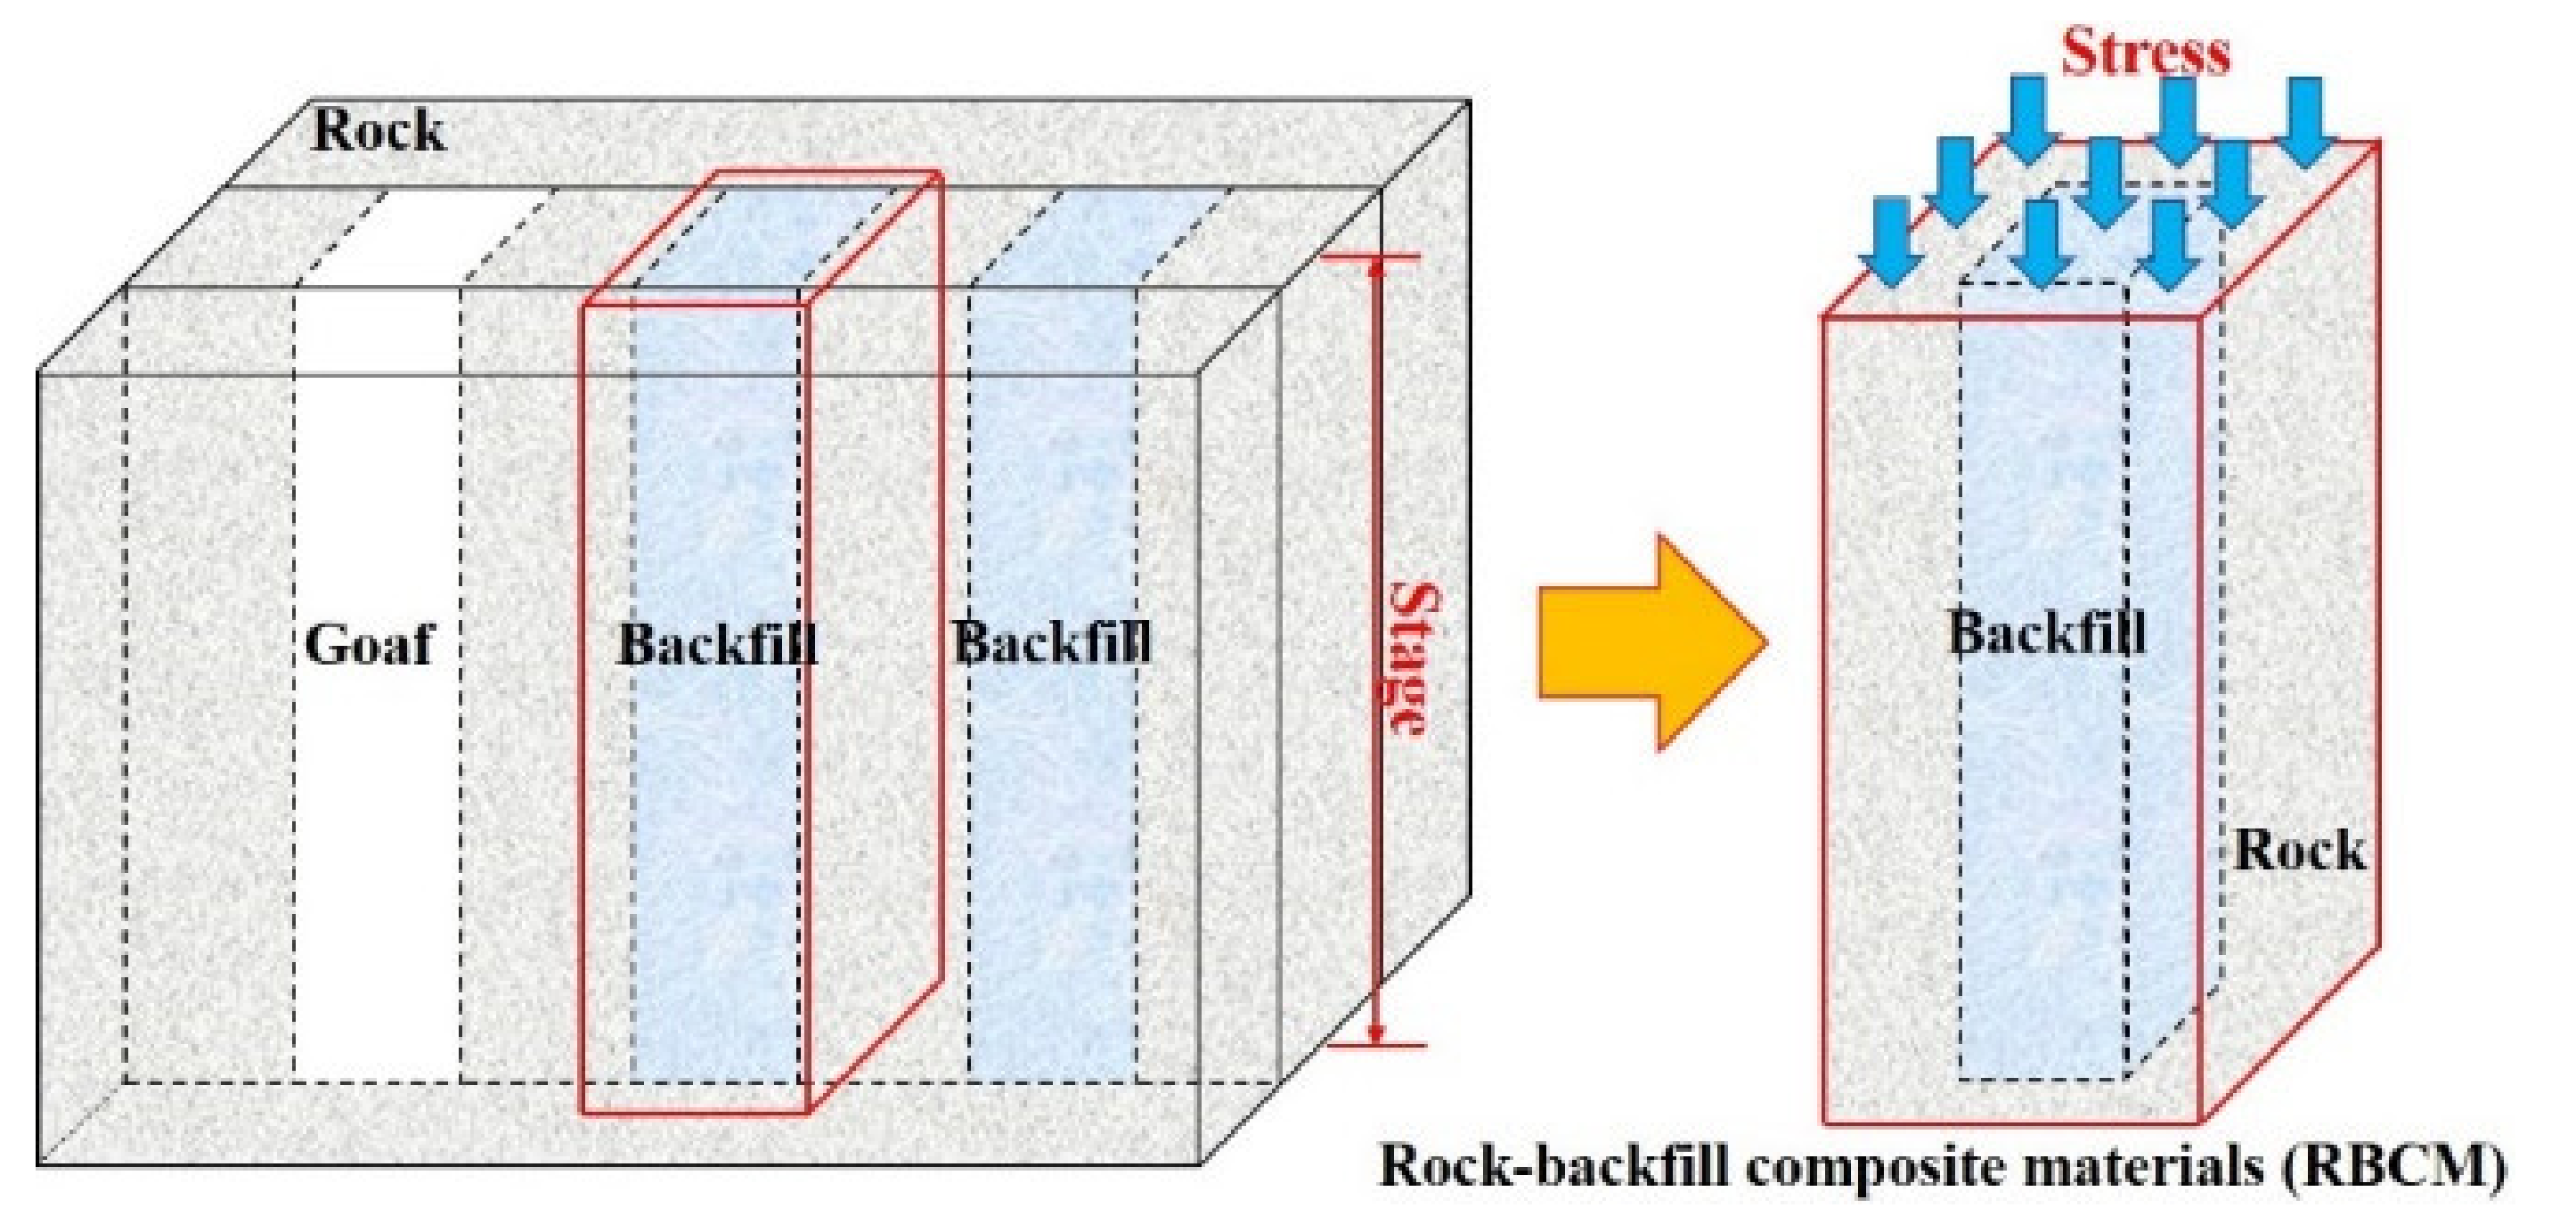
2.1. Research Background
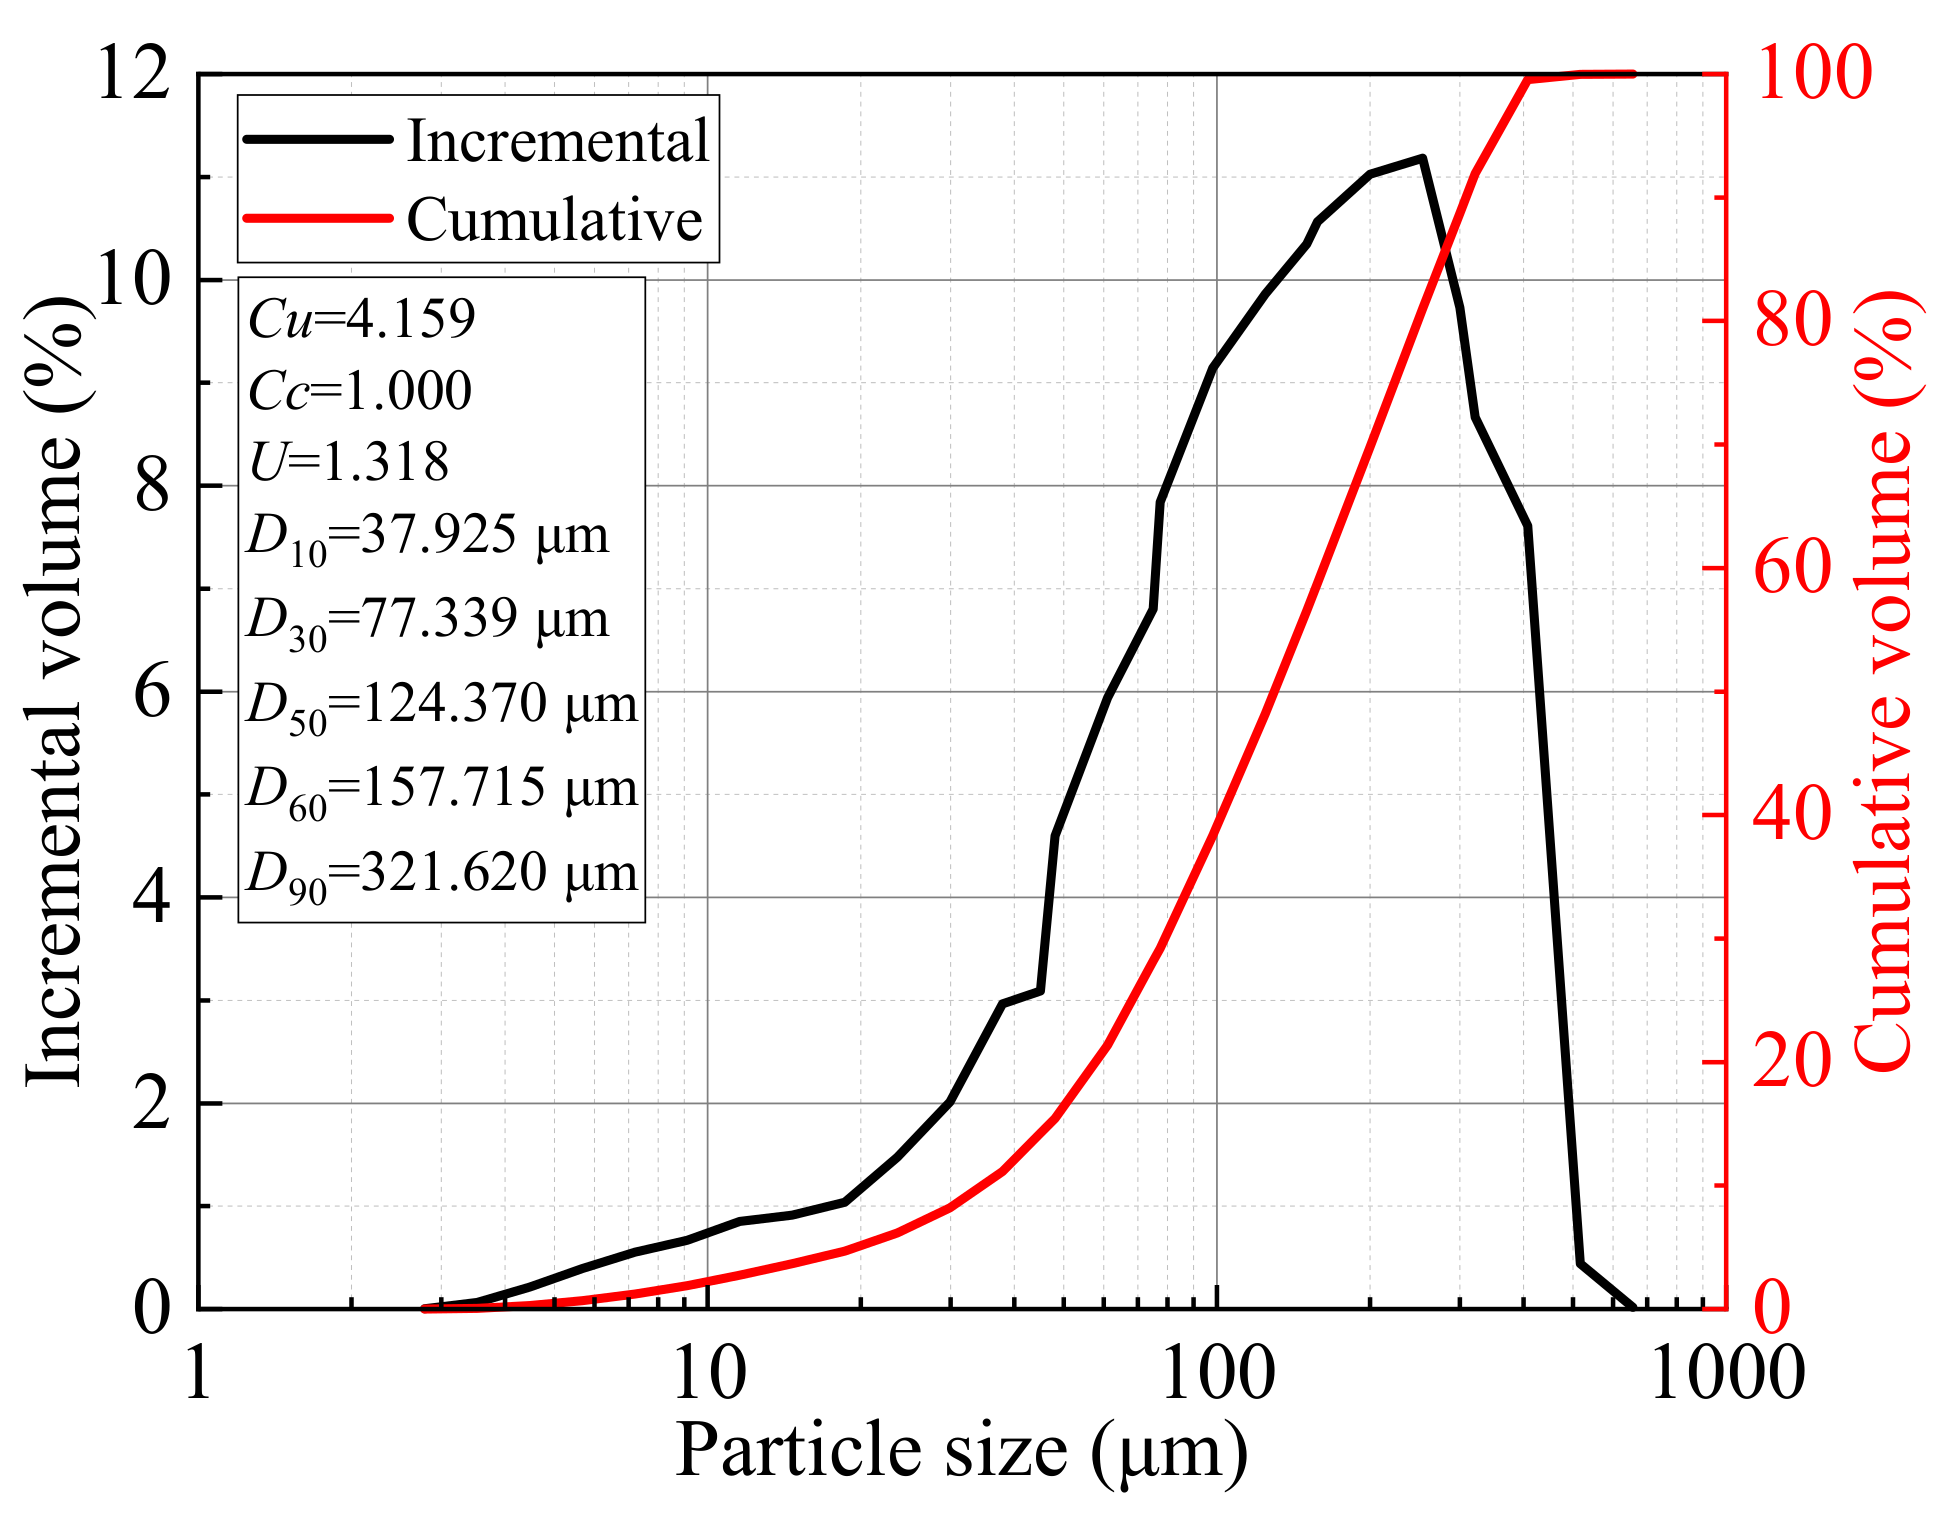
2.2. Materials
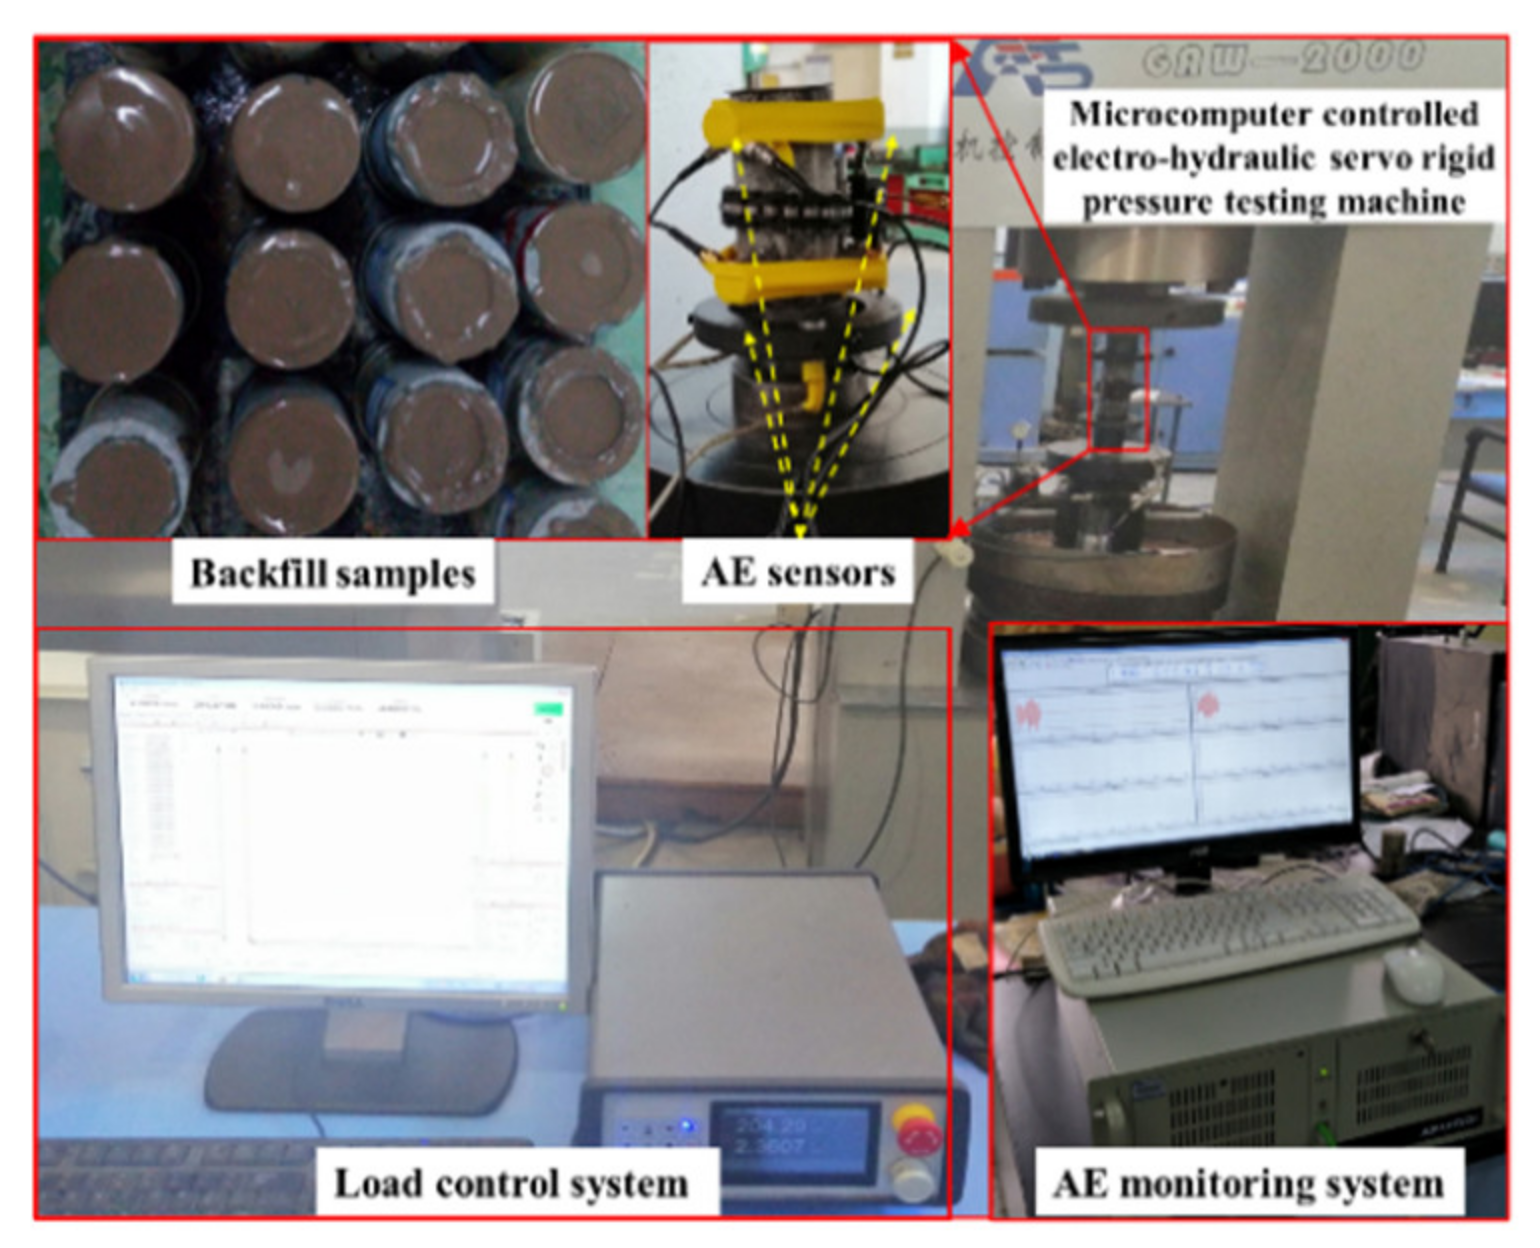
2.3. Test Scheme
2.4. Test Devices
3. Results and Analysis
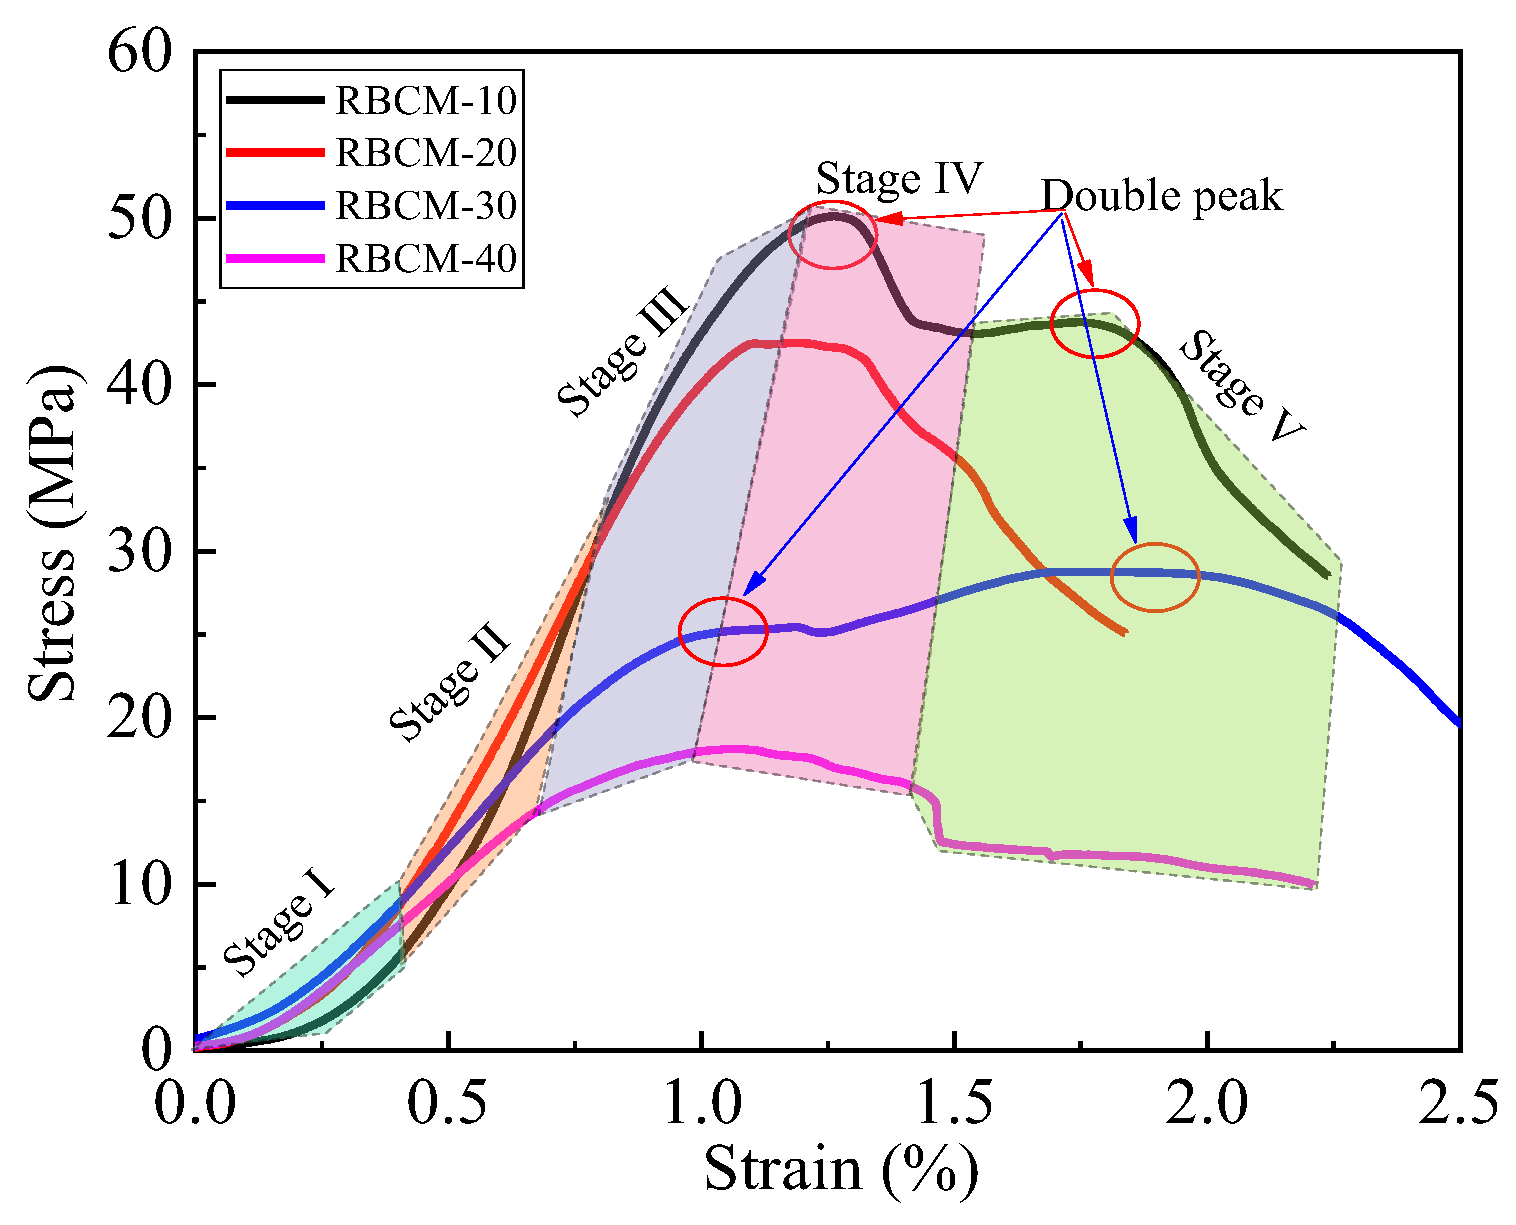
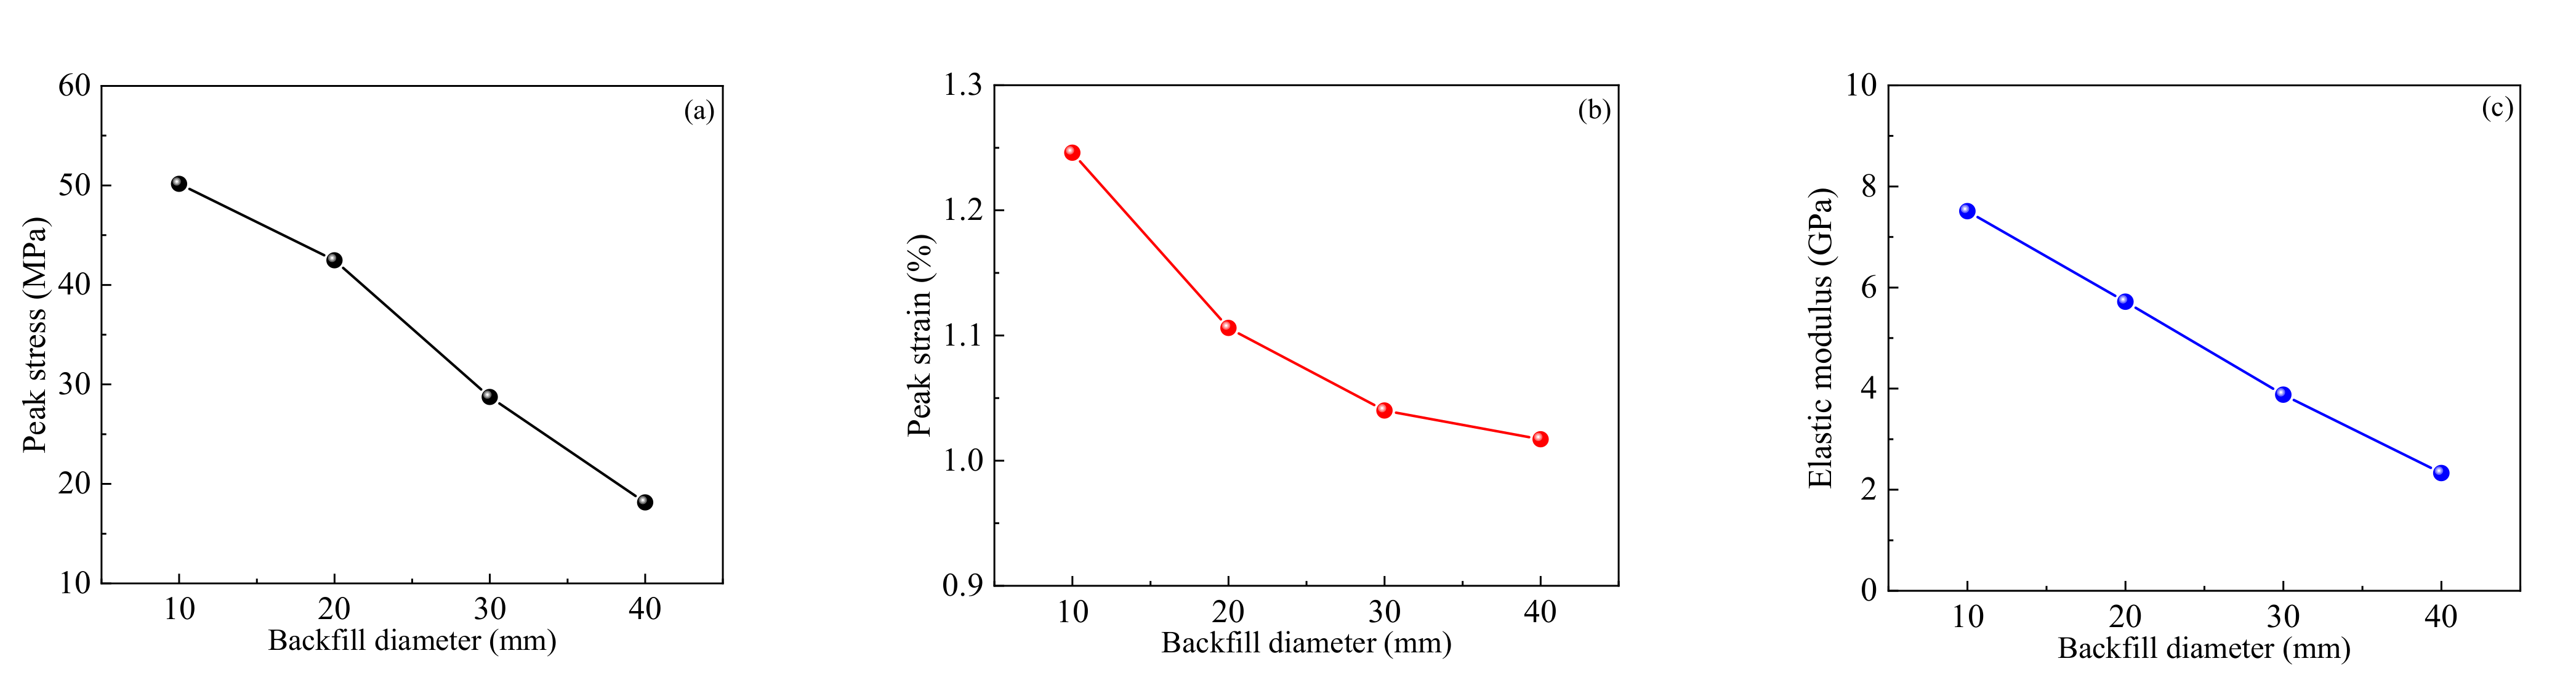
3.1. Mechanical Properties
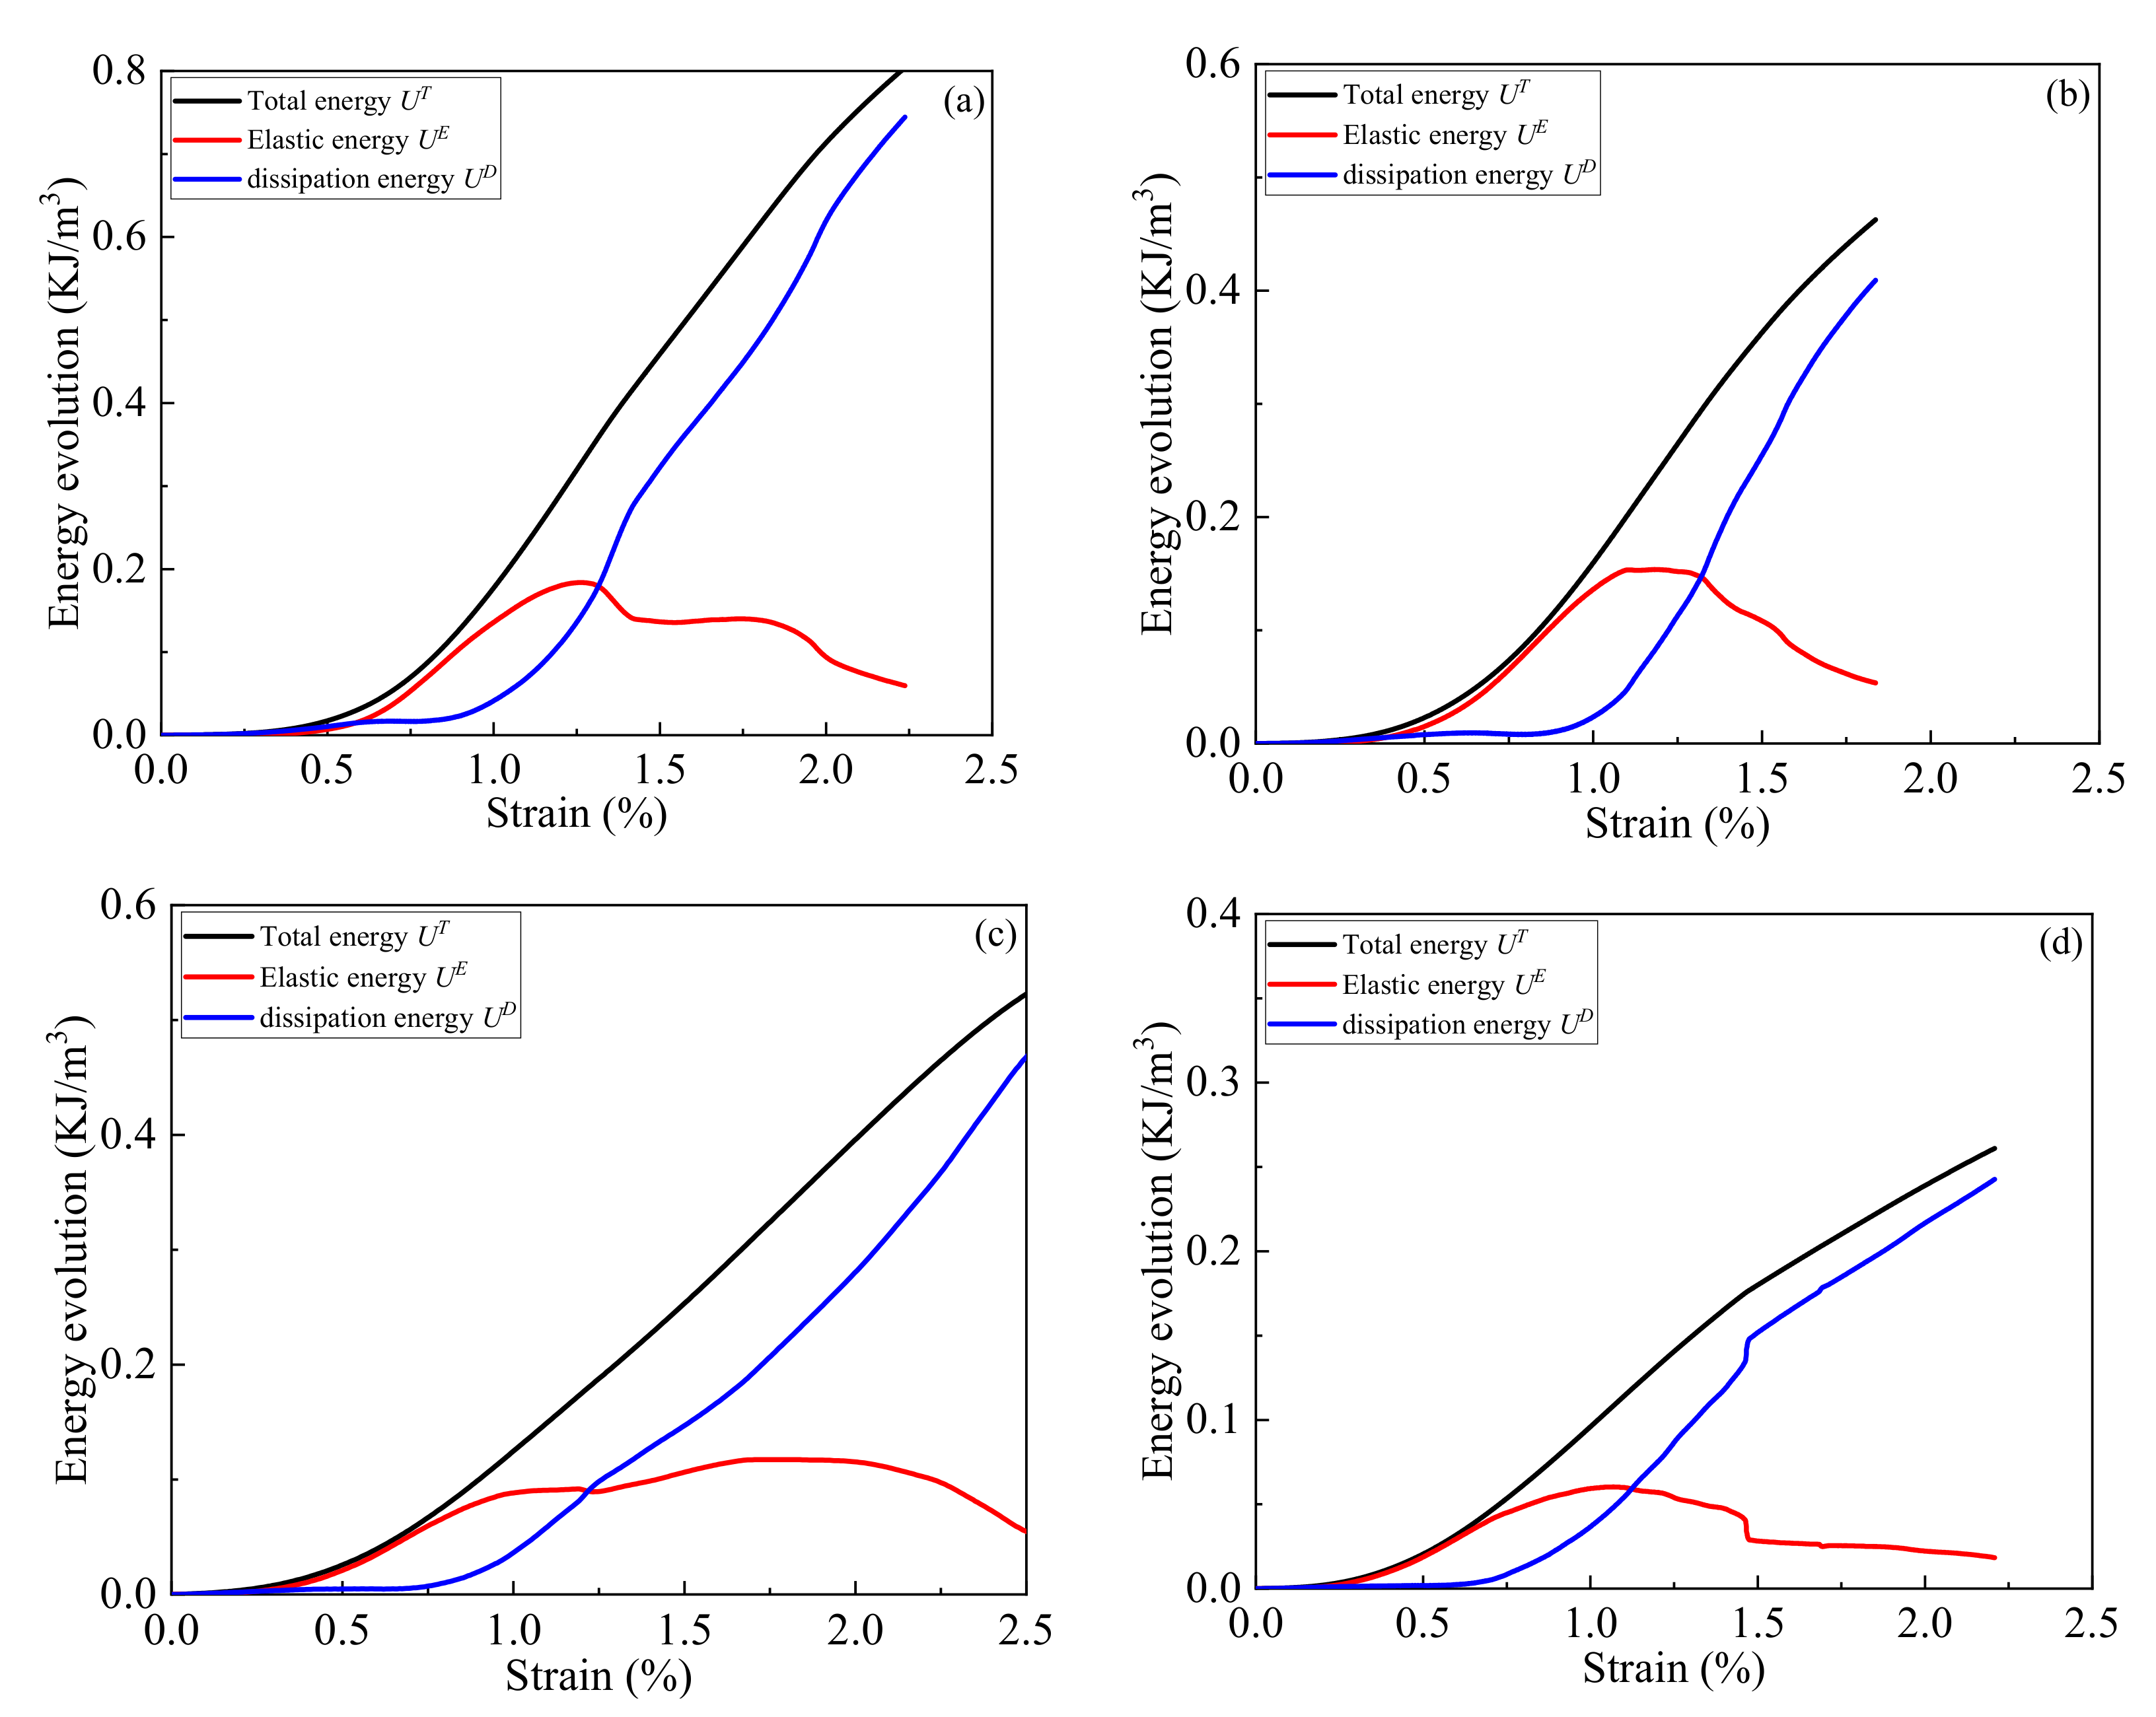
3.2. Energy Dissipation Mechanisms
3.3. Damage Constitutive Model
3.3.1. Model Constructed
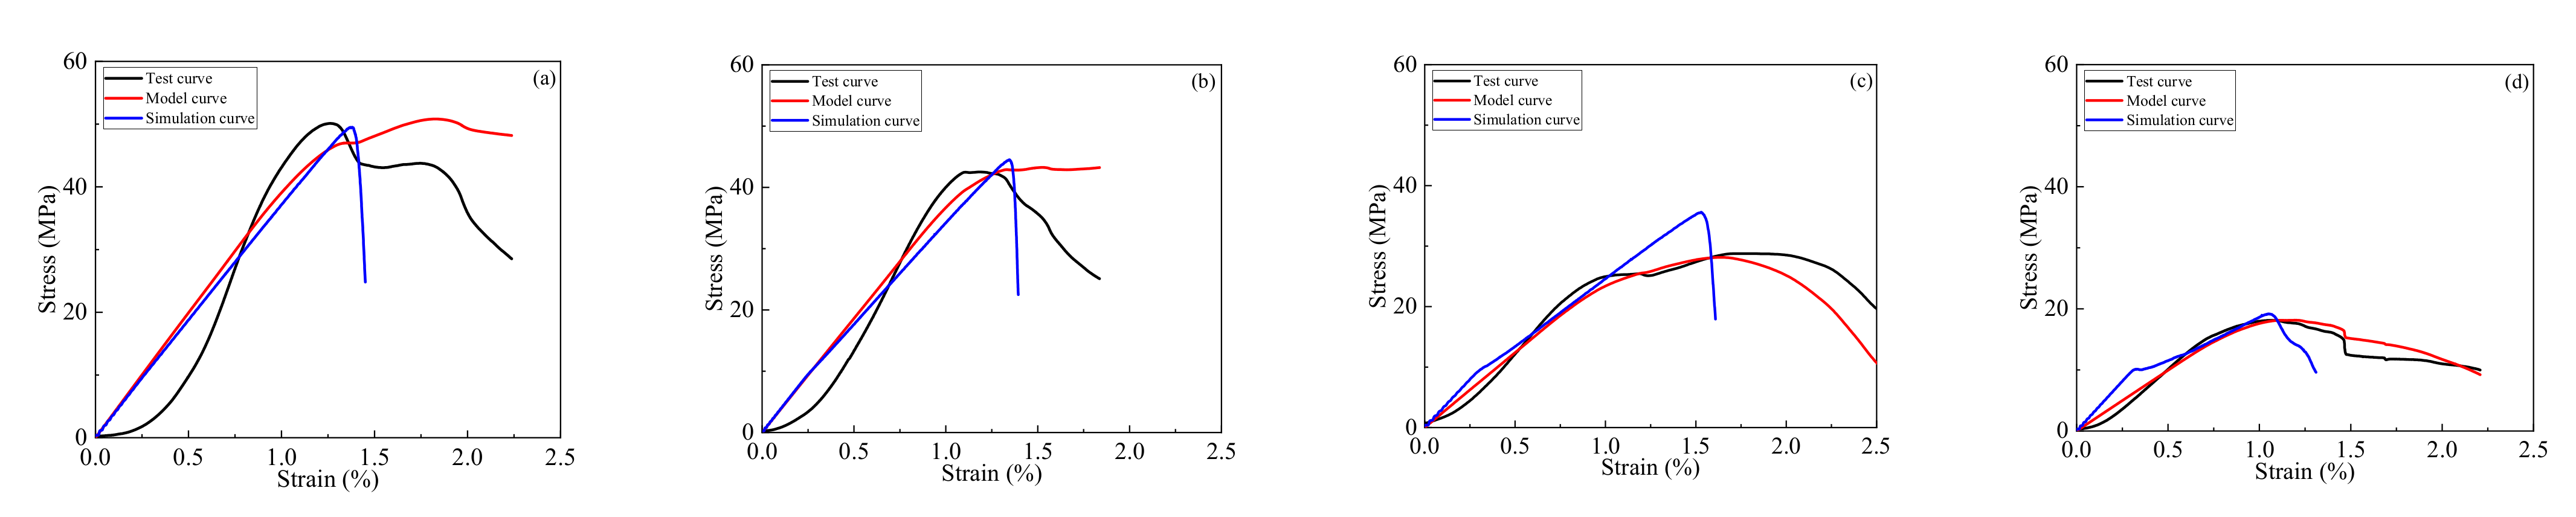
3.3.2. Model Validation
3.3.3. Damage Evolution Analysis
3.4. AE Characteristics
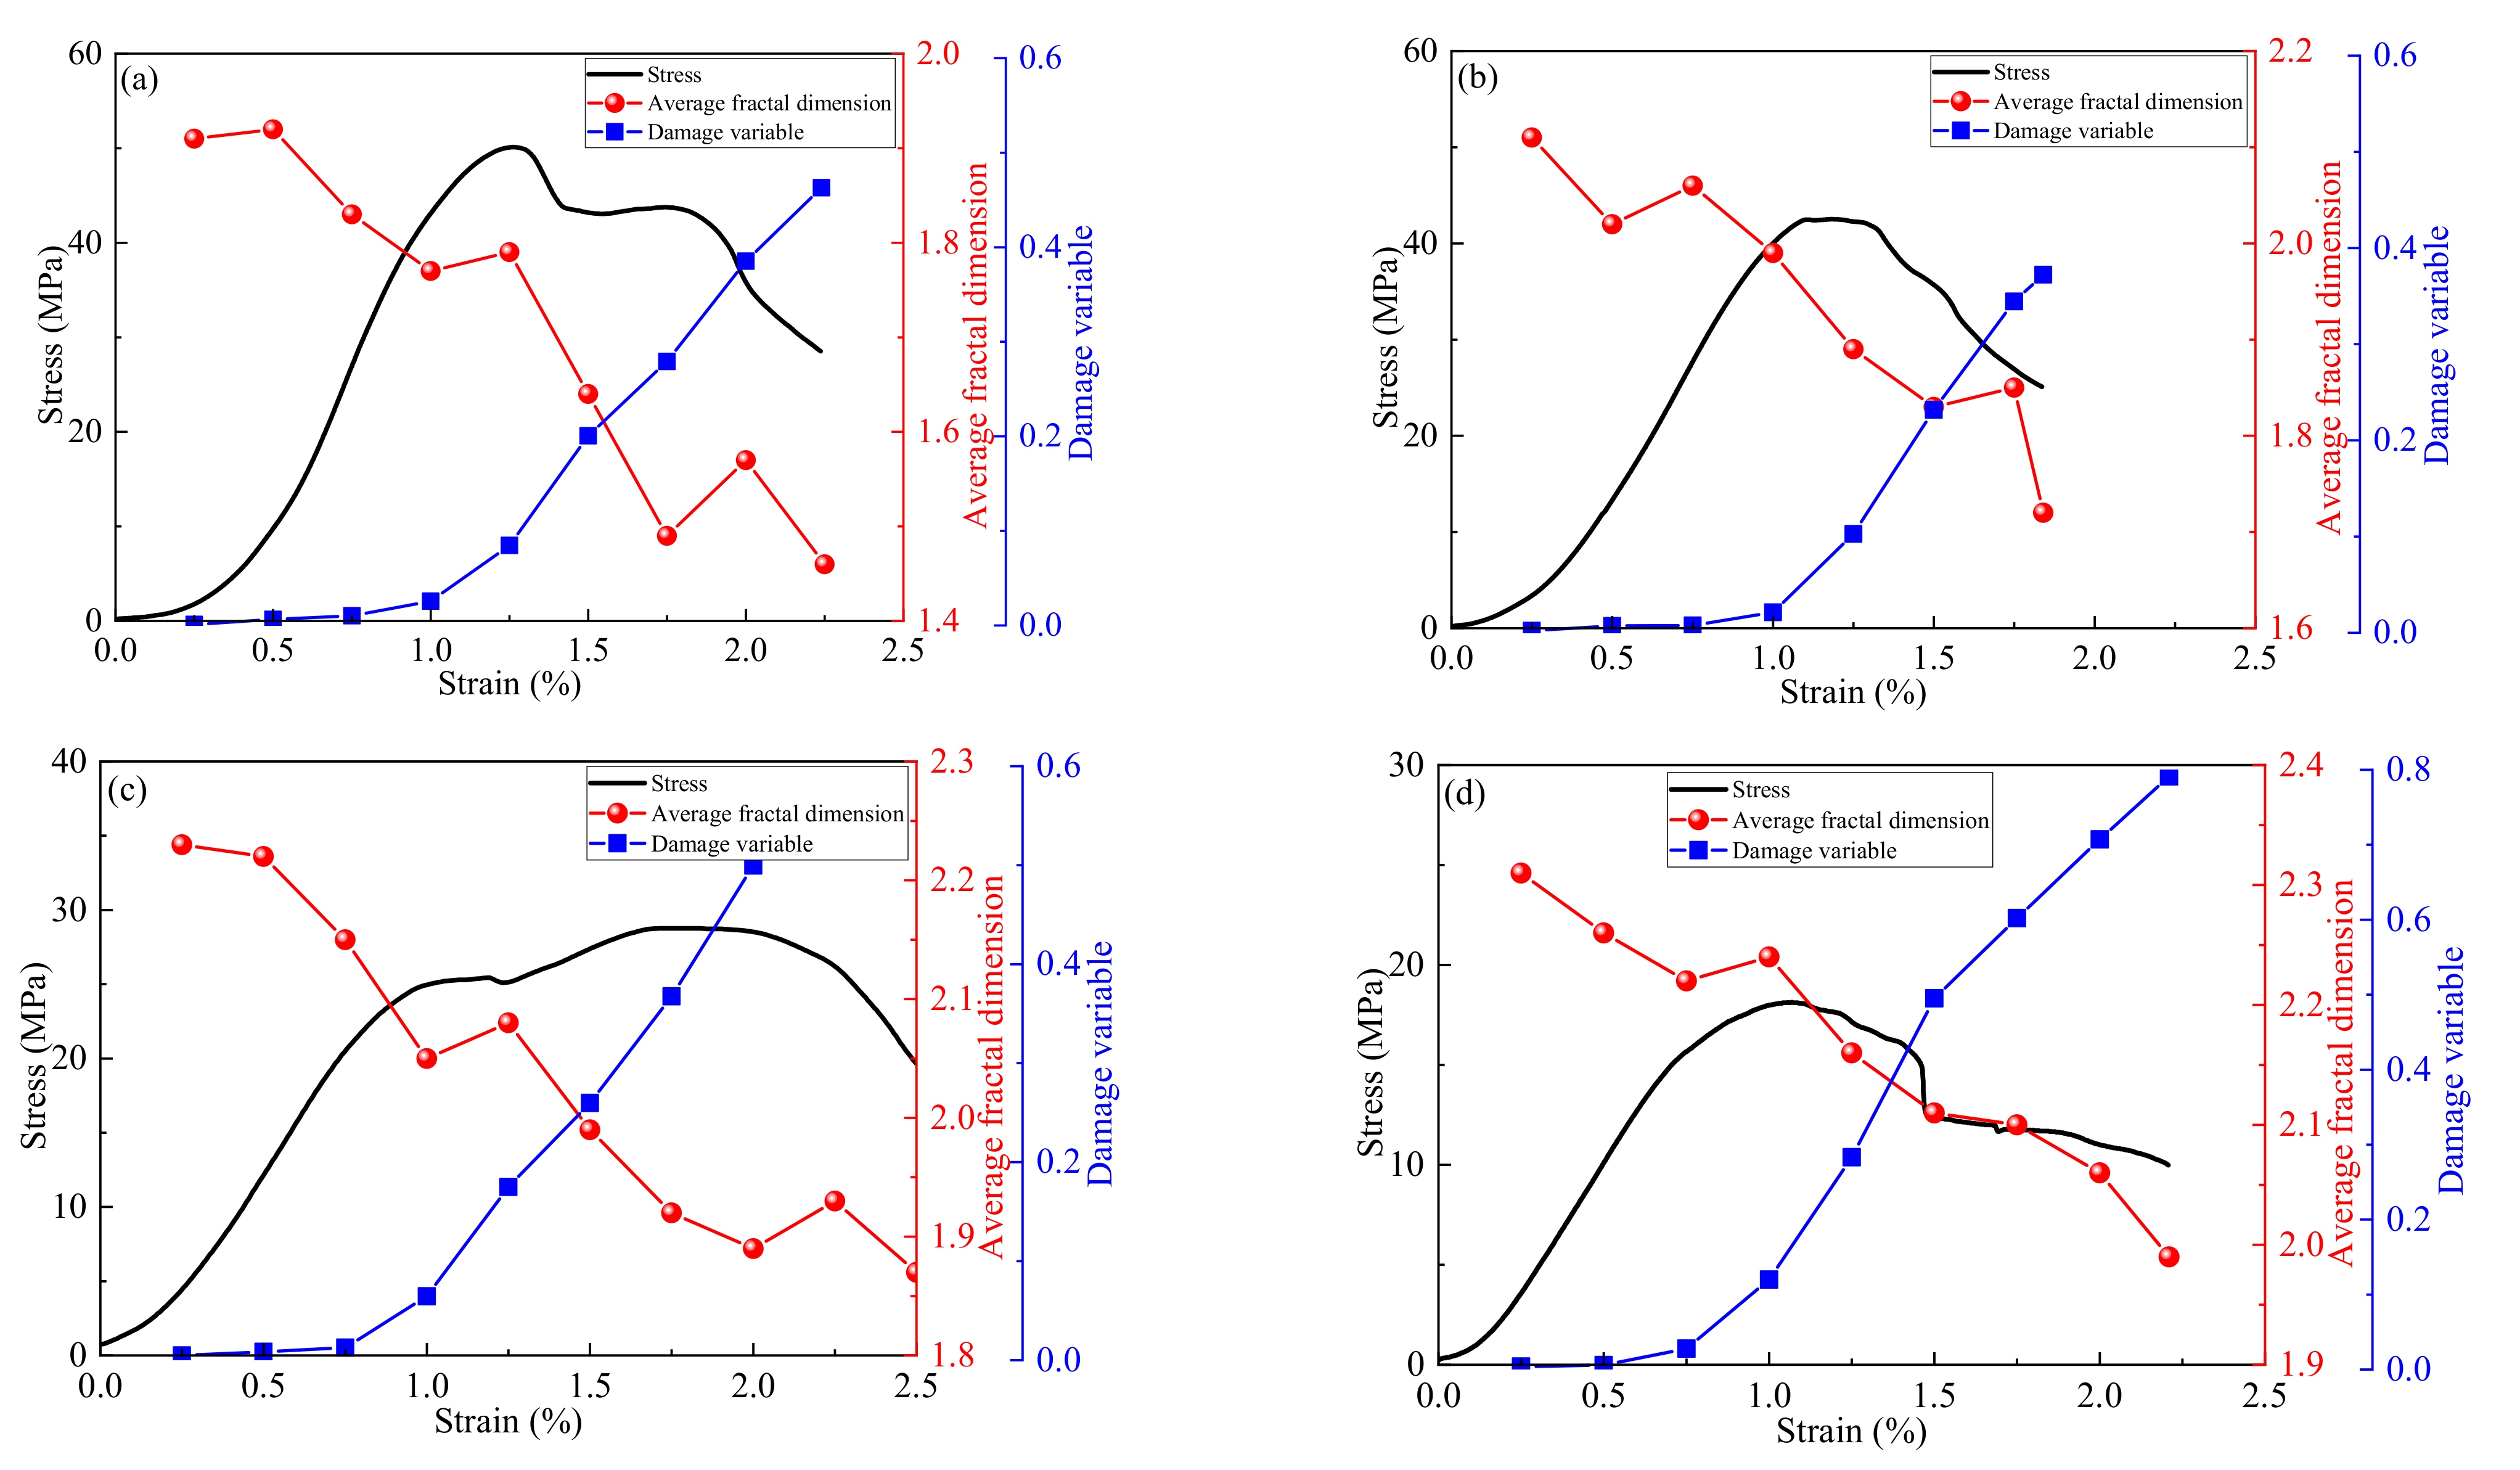
3.4.1. AE Fractal Dimension
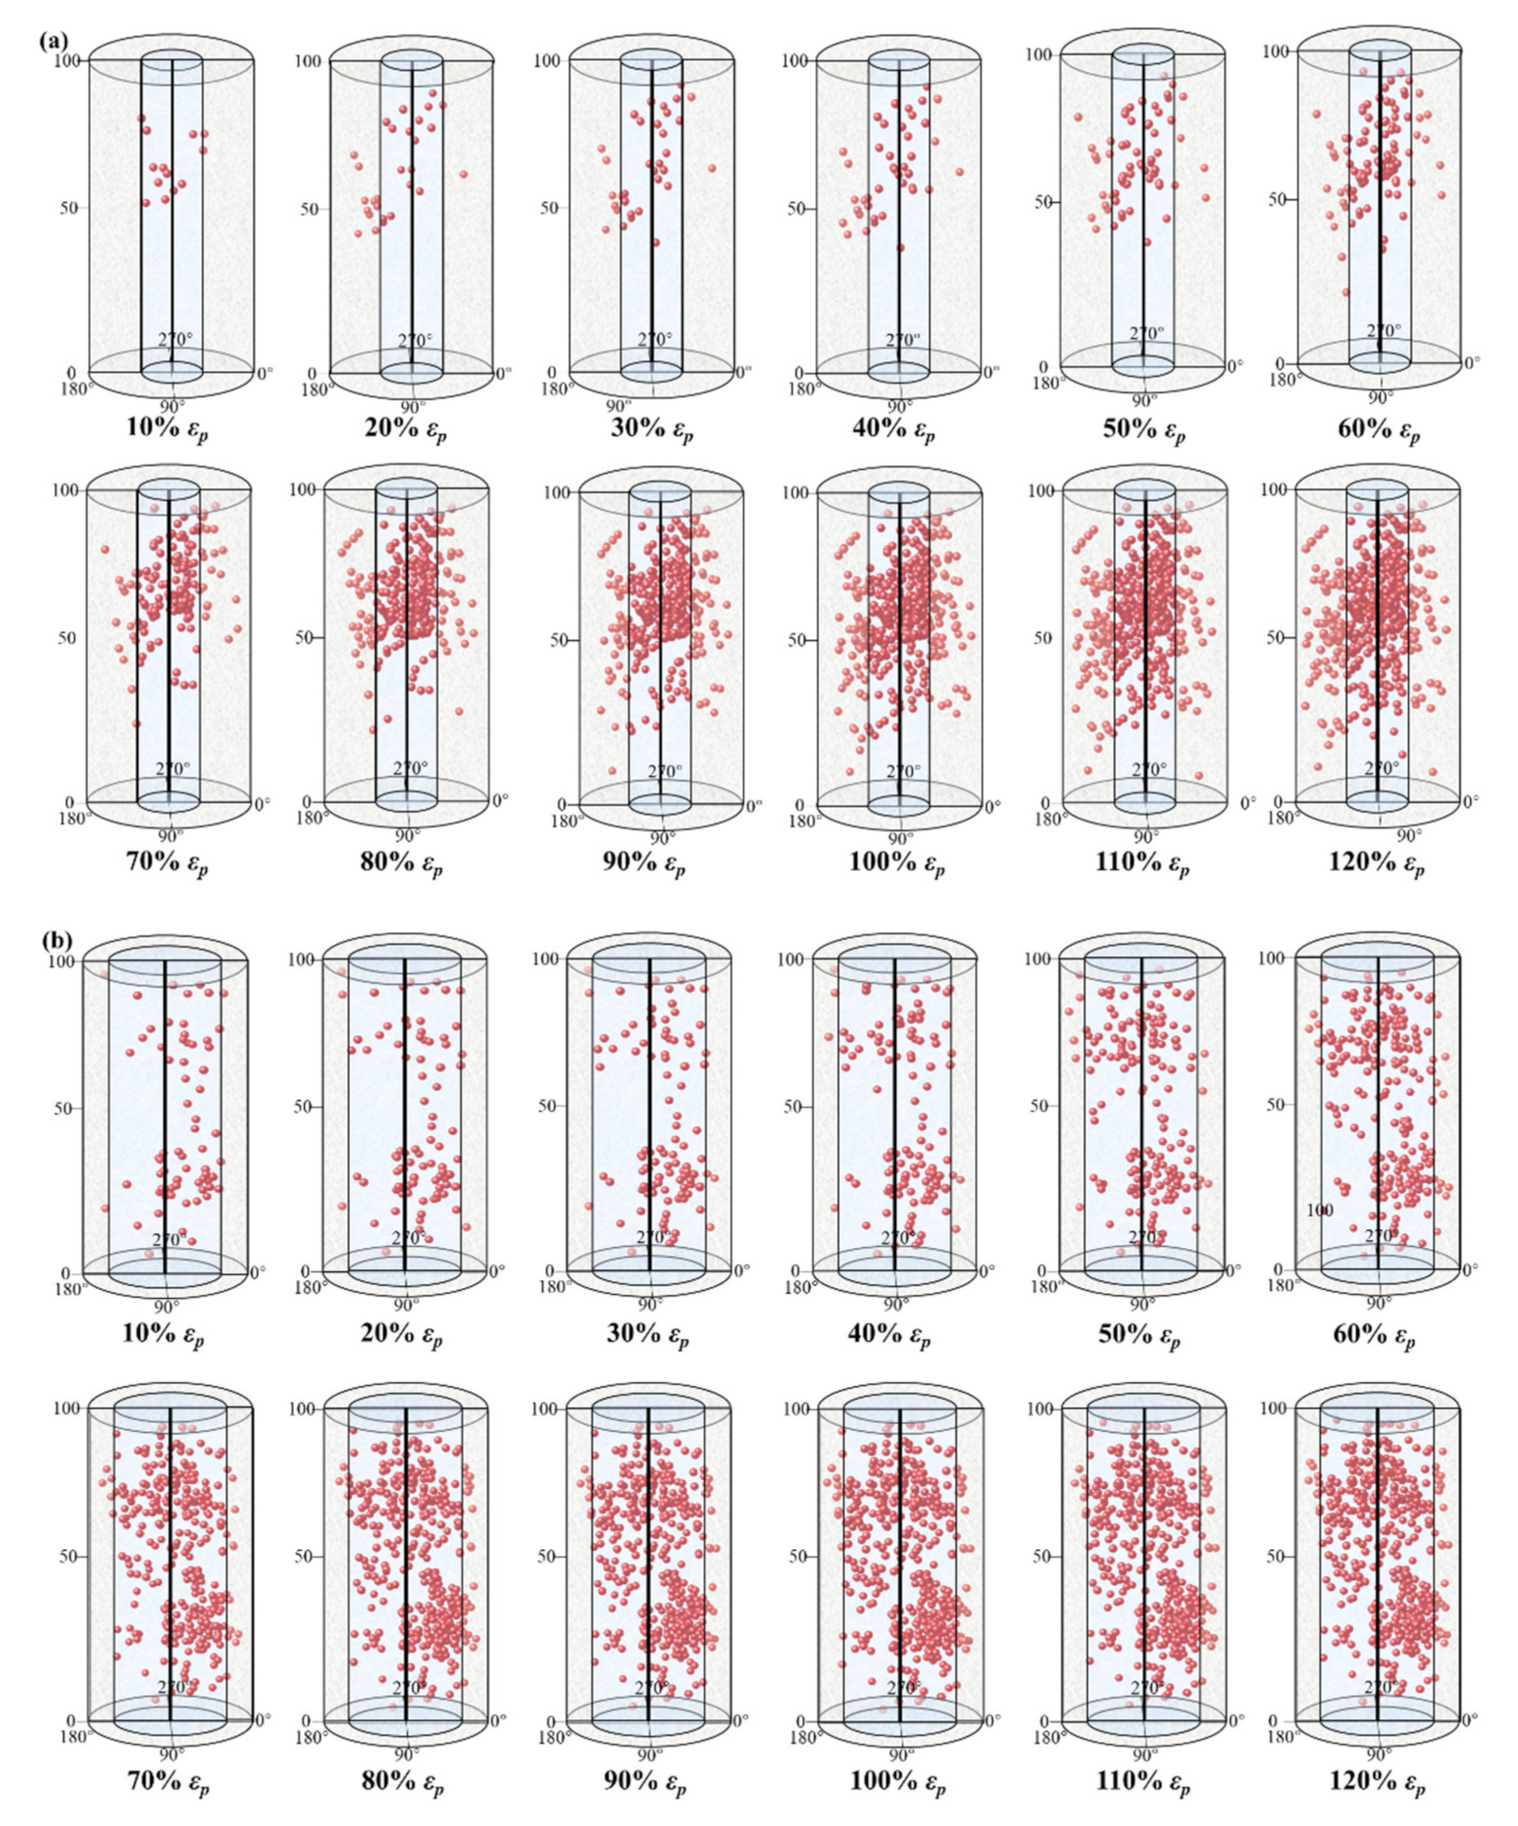
3.4.2. AE Event Location
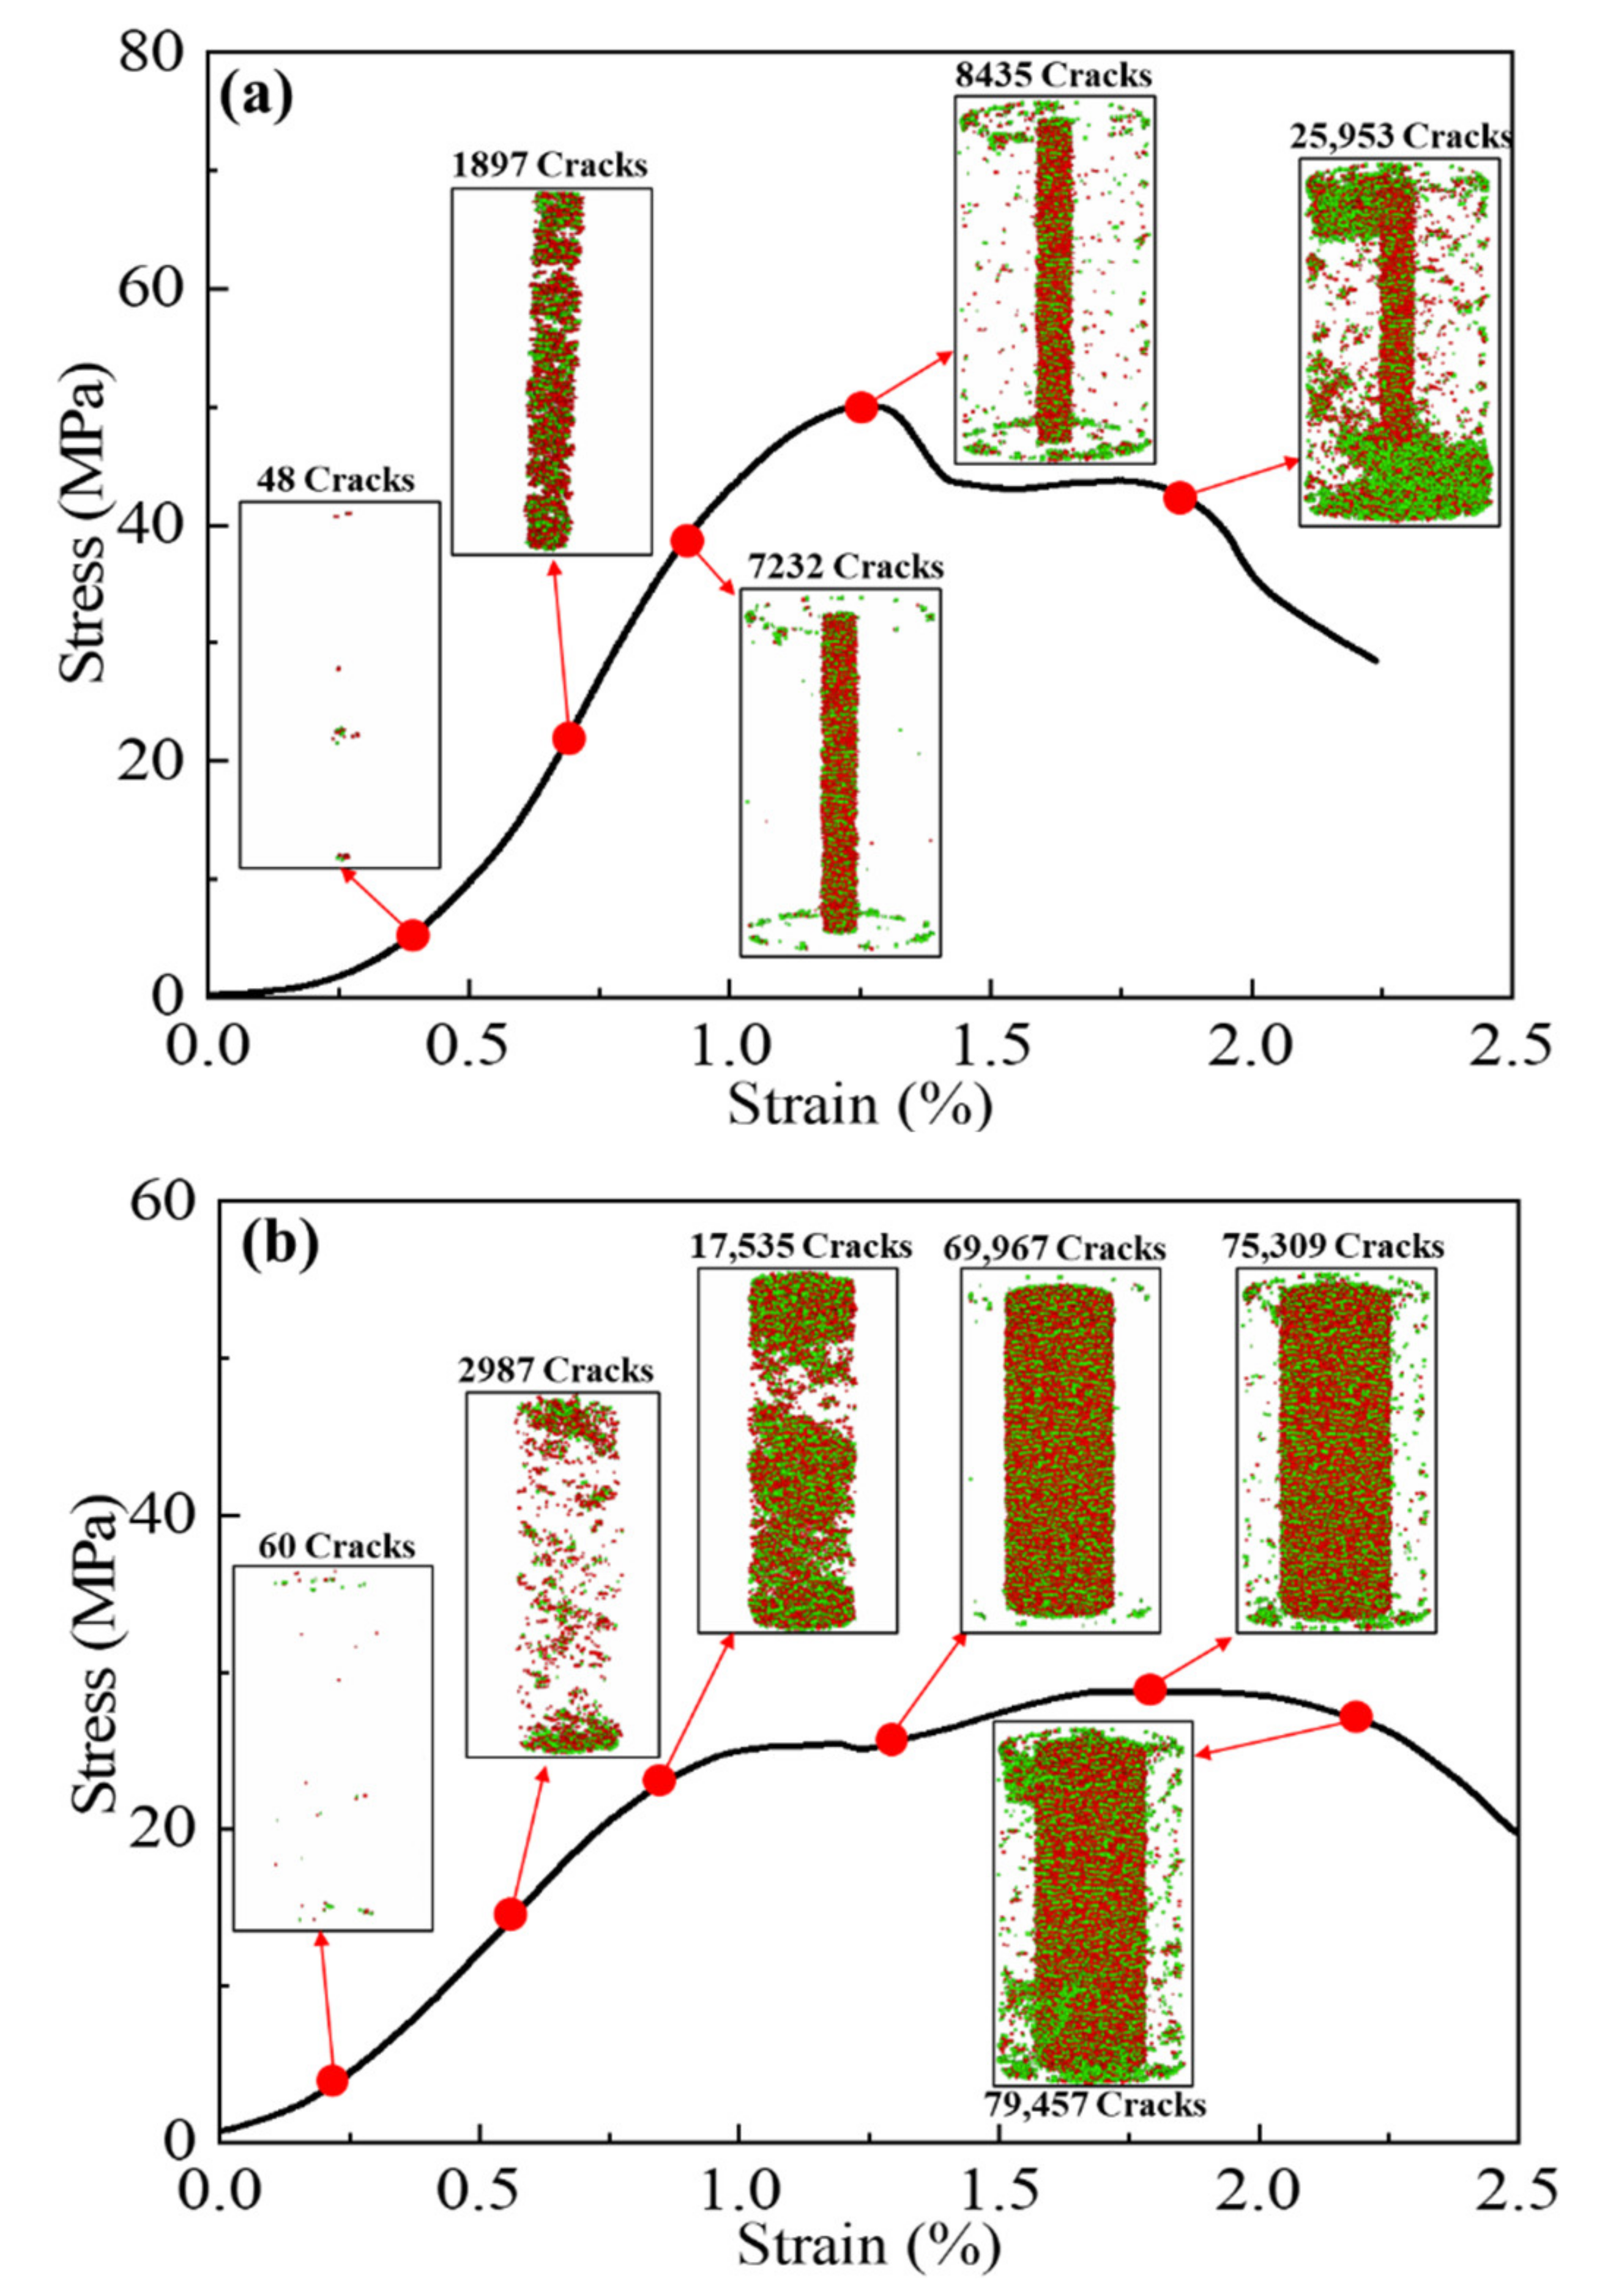
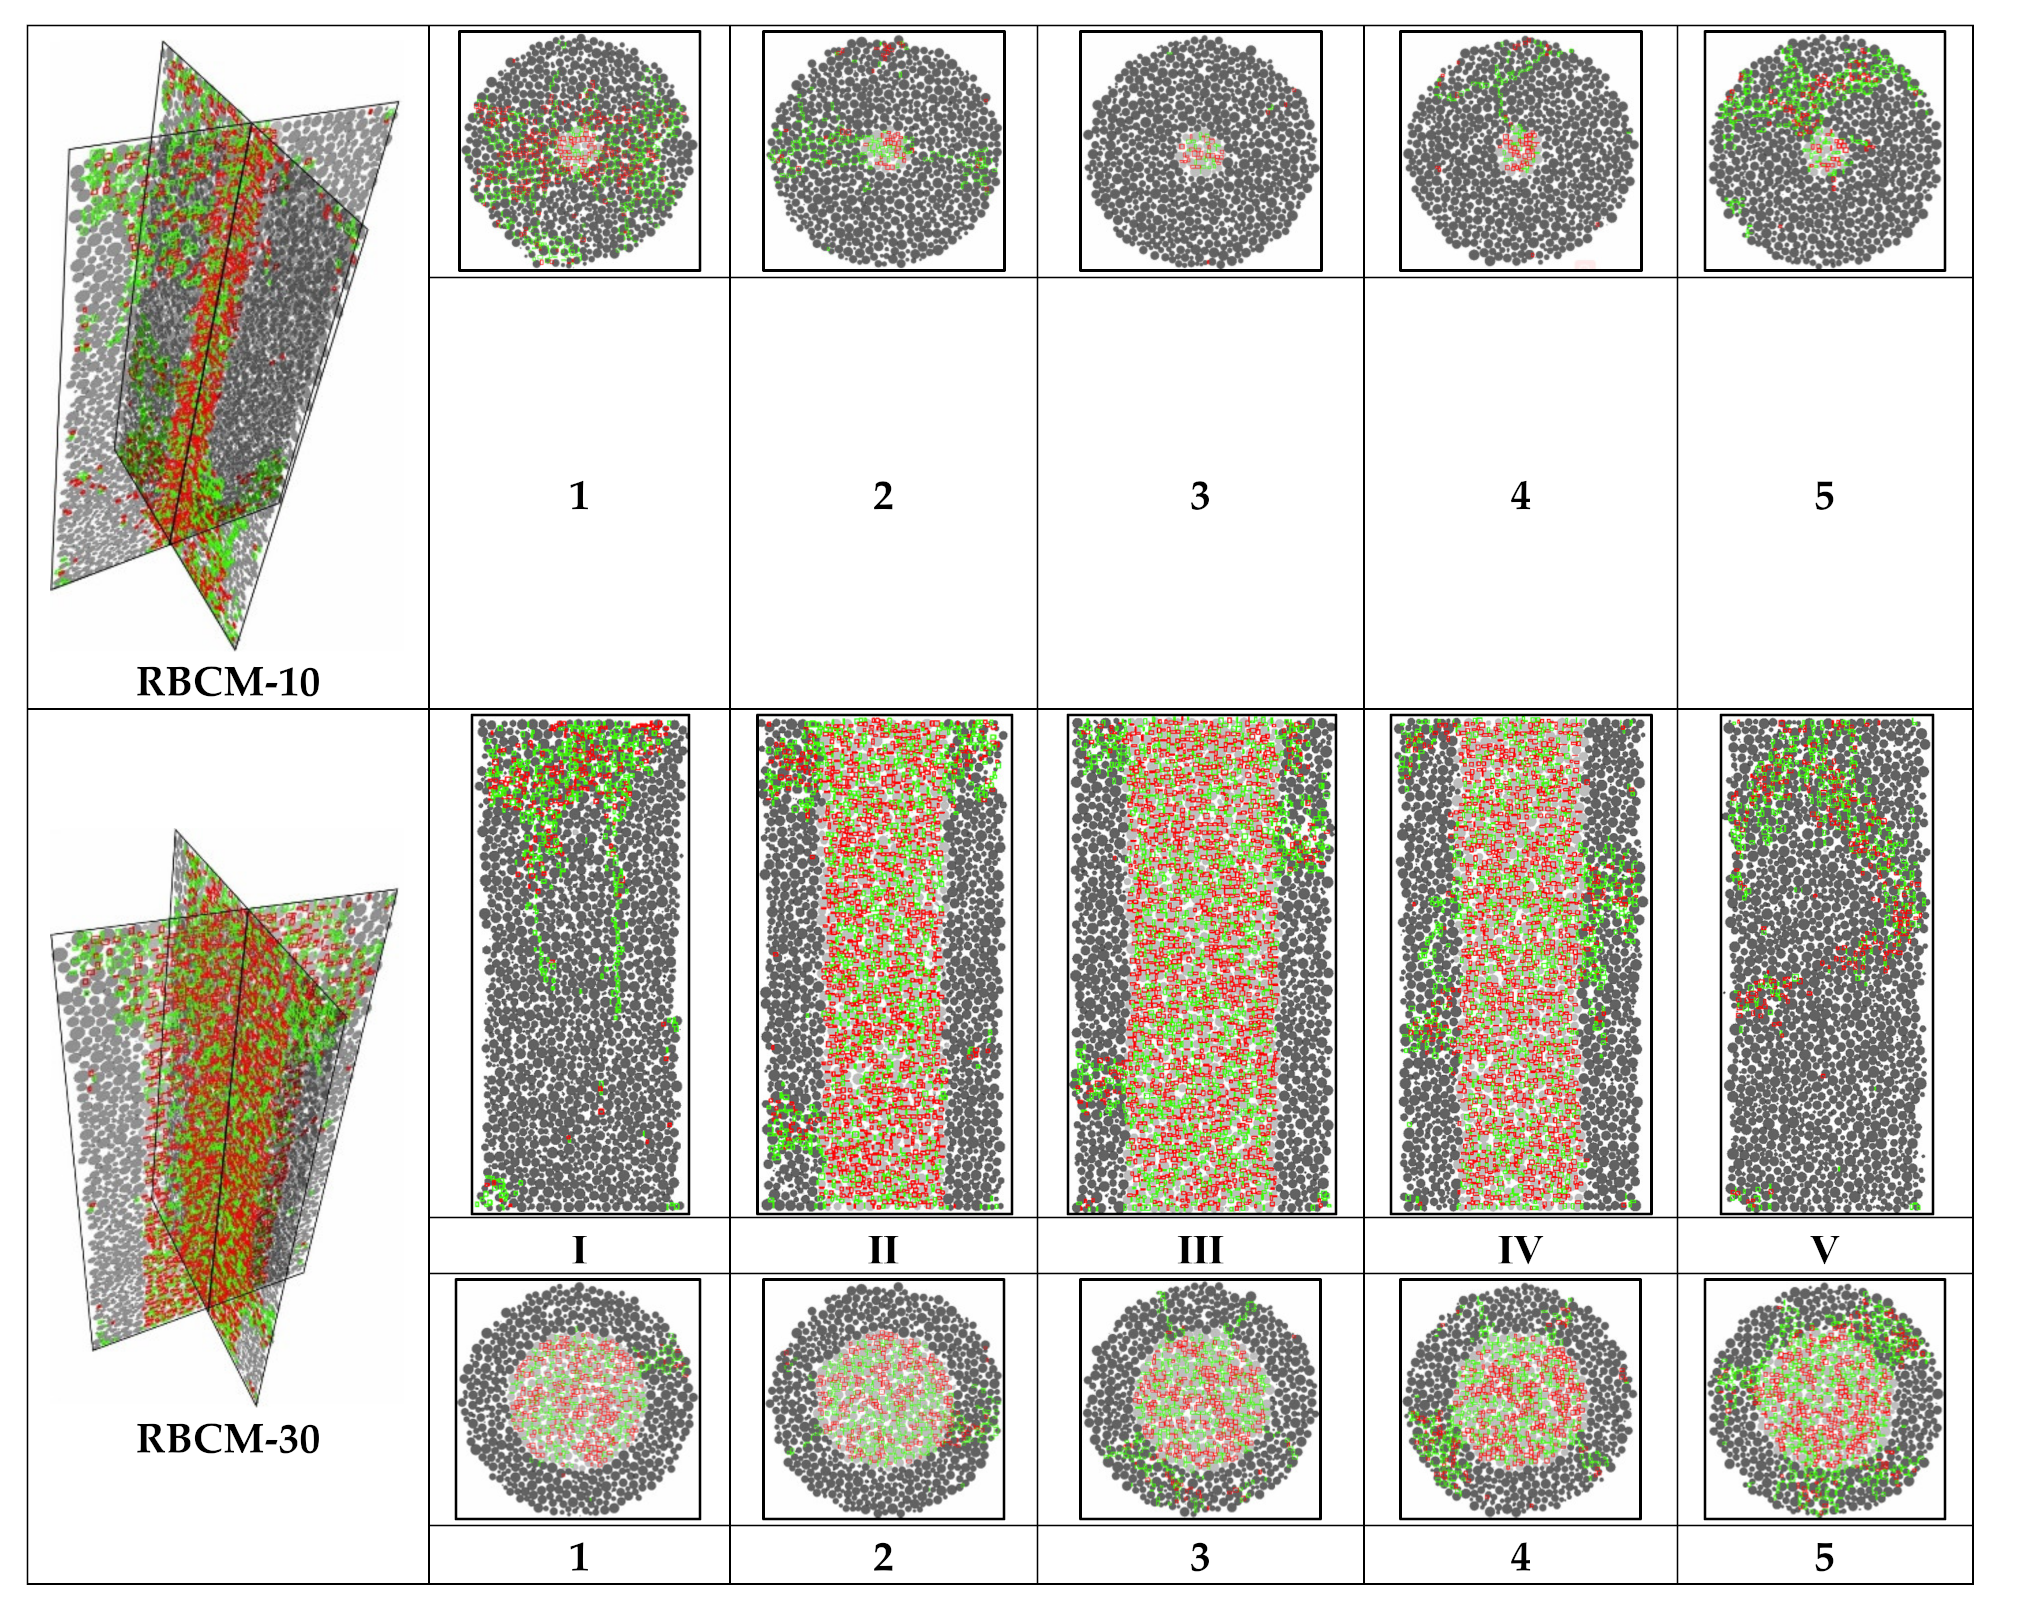
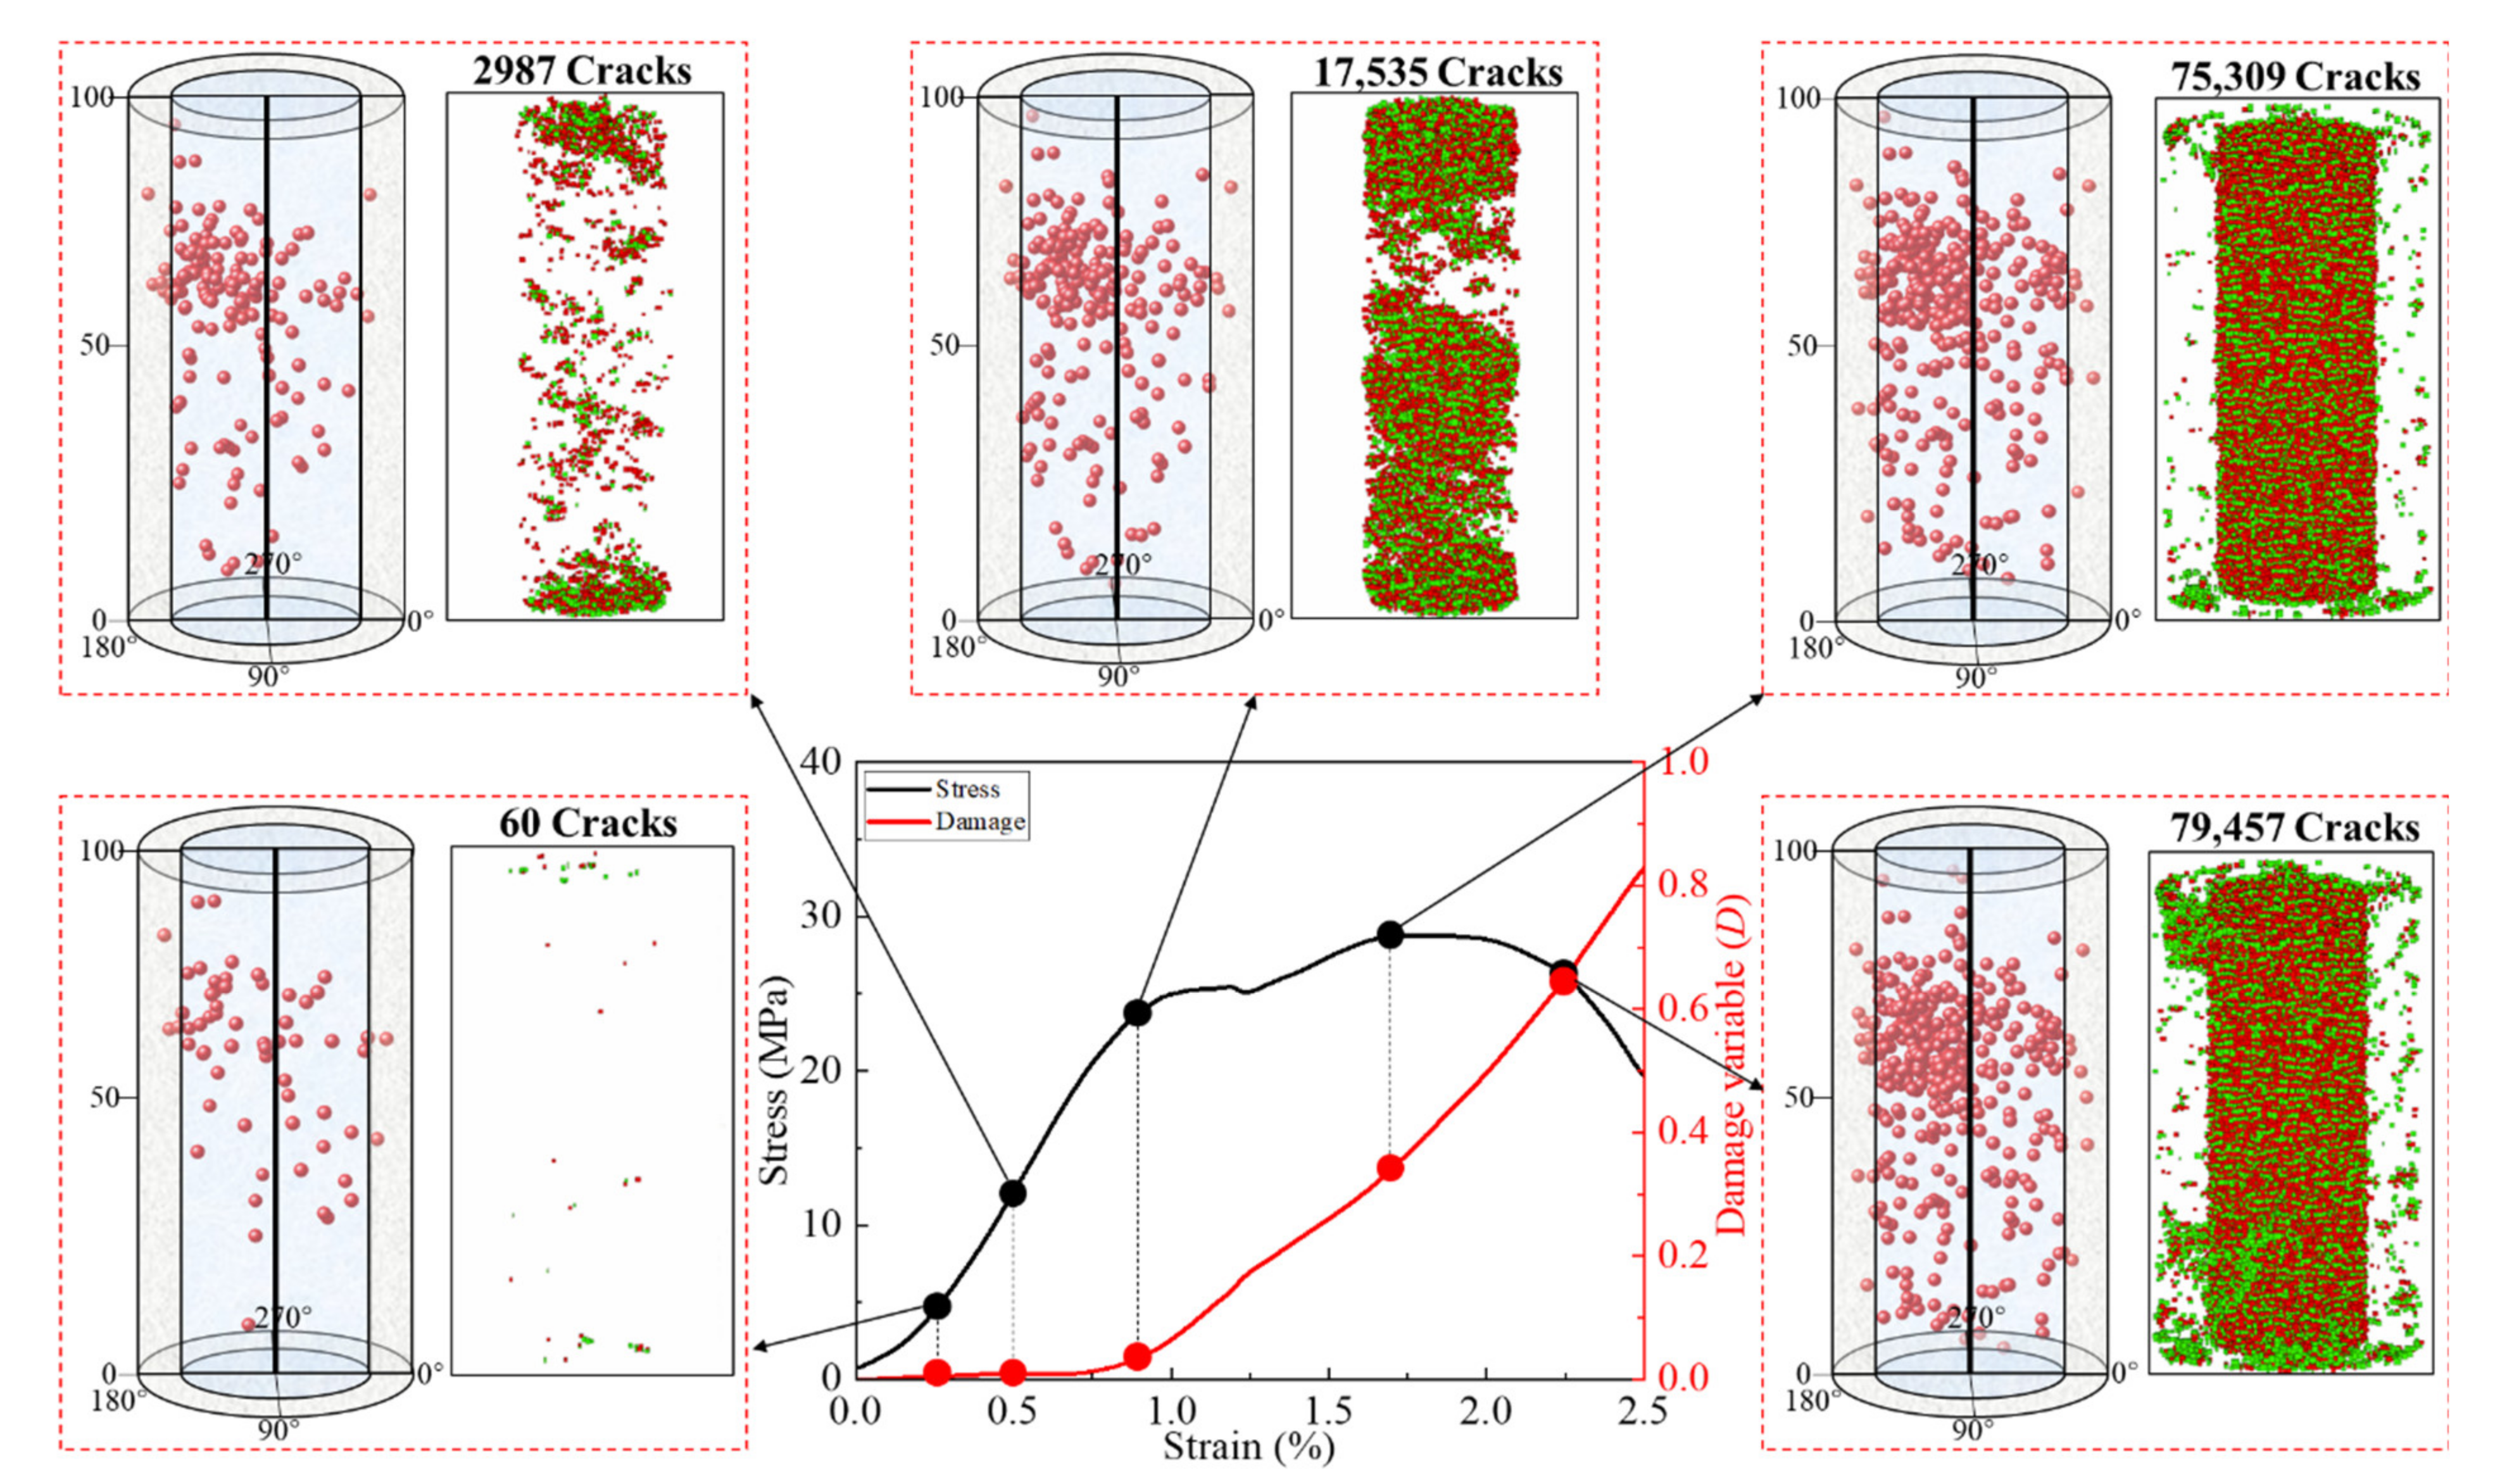
3.5. Temporal and Spatial Evolution of Microcracks
4. Discussion
5. Conclusions
- (1)
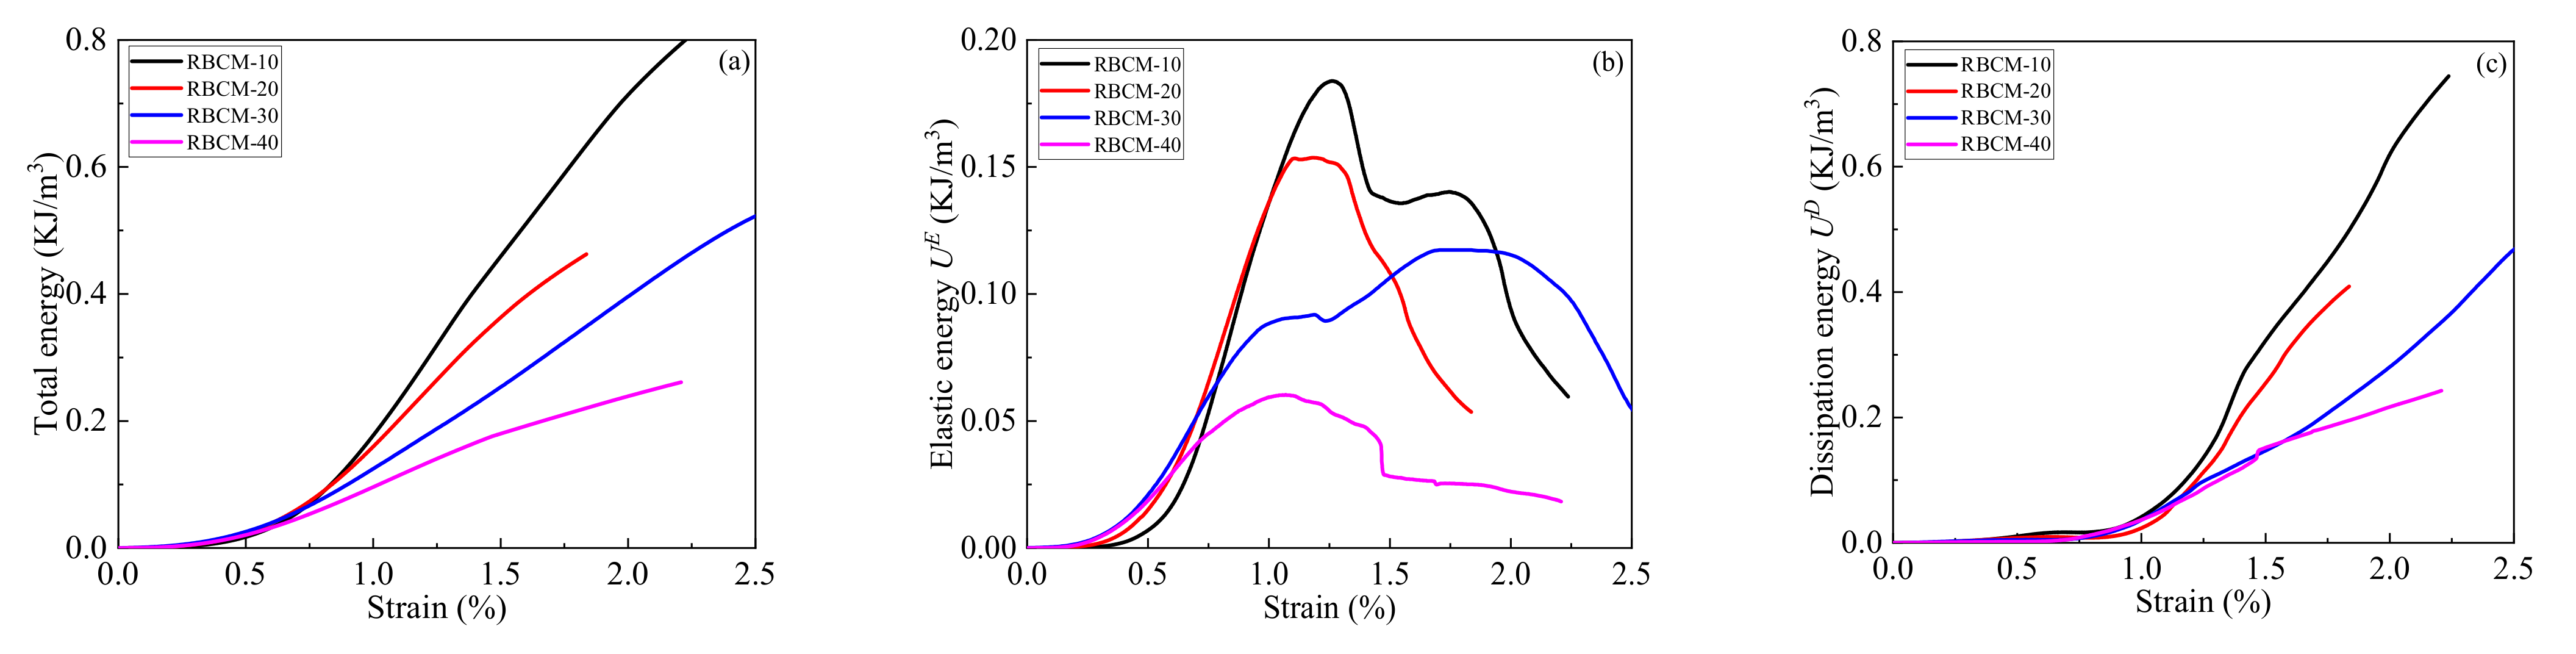
- The stress–strain curve of the RBCM can be divided into five stages: the pore compaction closure stage, the linear elasticity stage, the yield stage, the peak strength stage, and the residual stress stage; some stress–strain curves show double peaks. The σp, εp, and E decreased with the increase of the internal backfill diameter.
- (2)
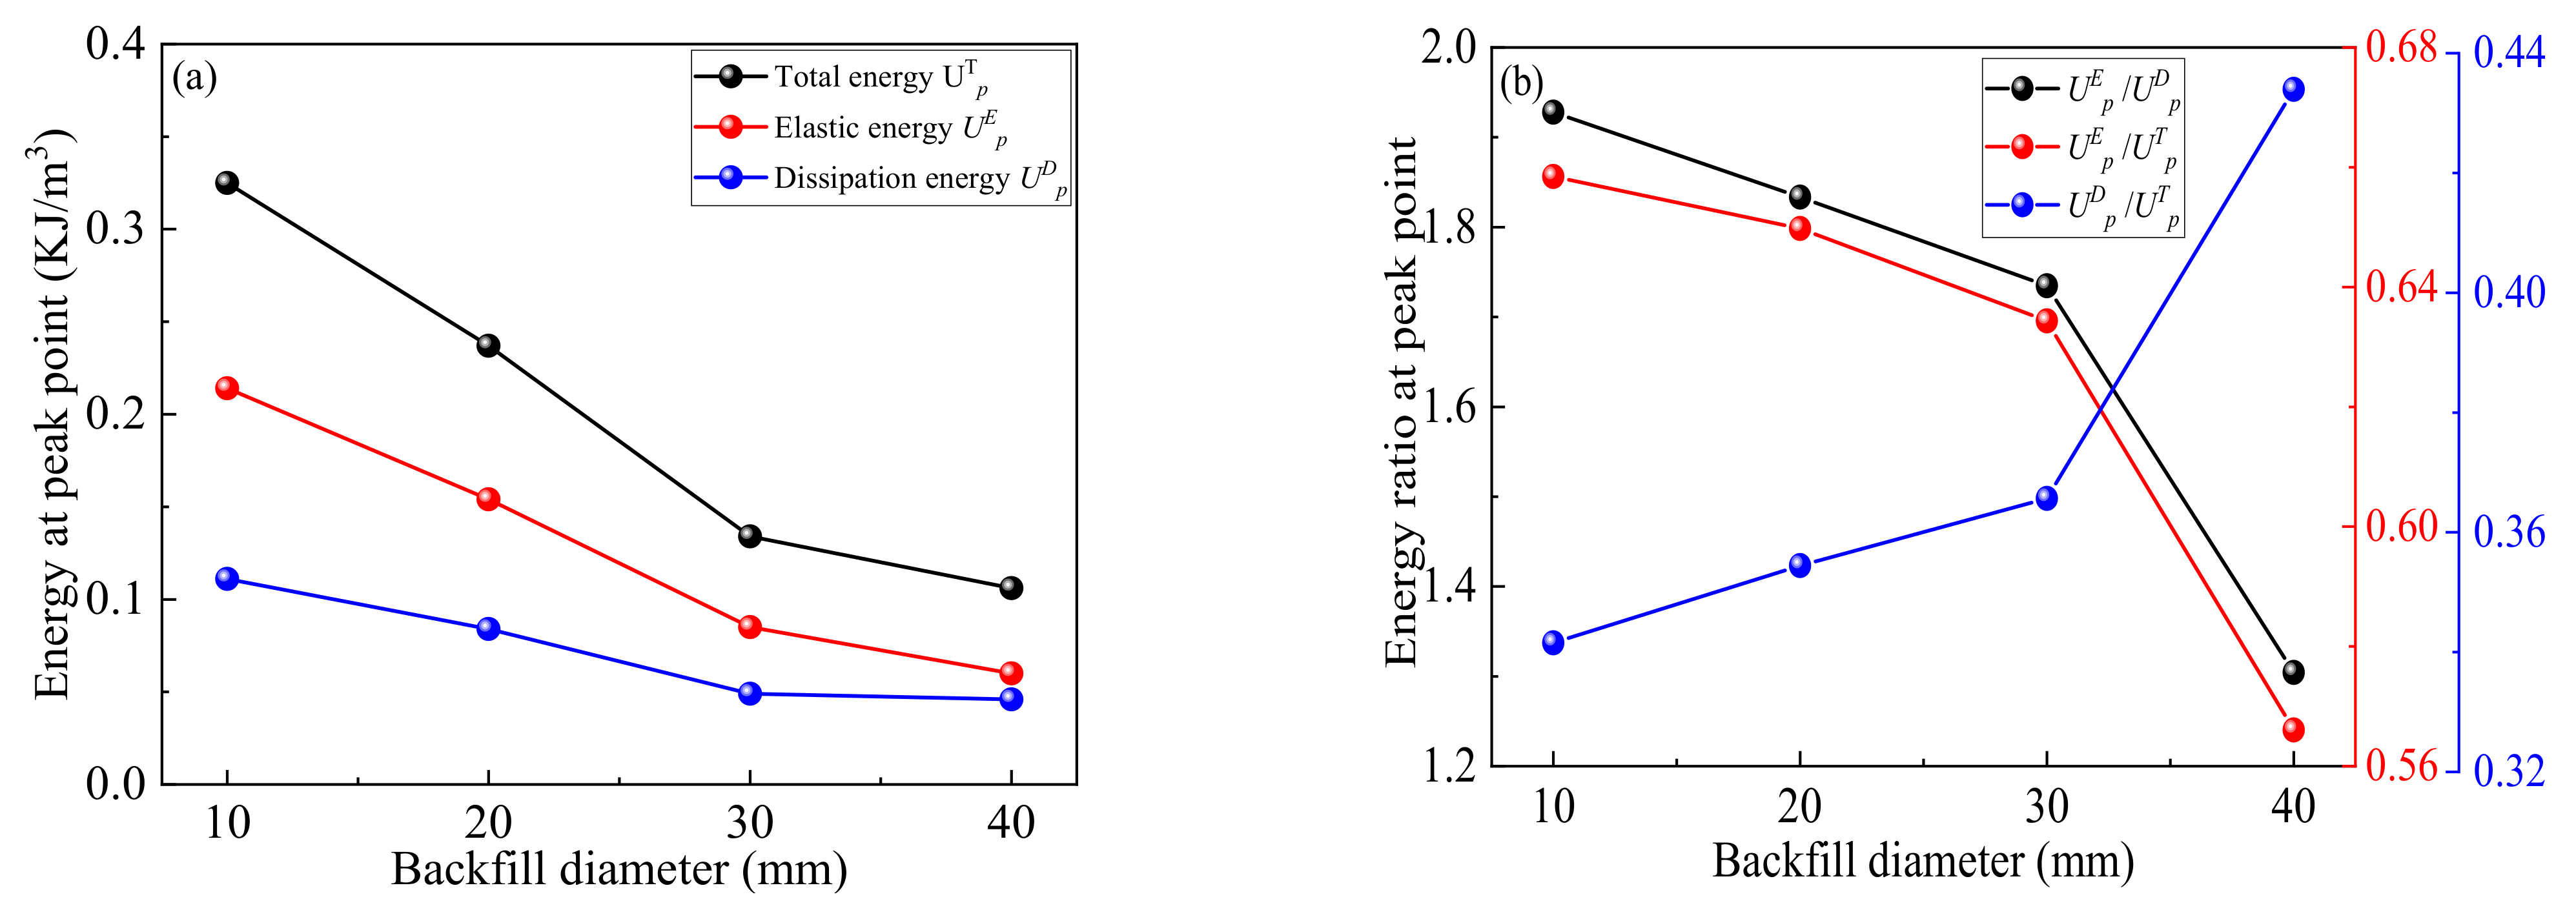
- The UT shows an S-shaped distribution. The UE shows an inverted U-shaped distribution. The UD first increases slowly and then increases rapidly. The UTp, UEp, and UDp all decrease with the increase of the backfill diameter. The UEp/UDp and UEp/UTp decrease and the UDp/UTP increases with the increases of the backfill diameter.
- (3)
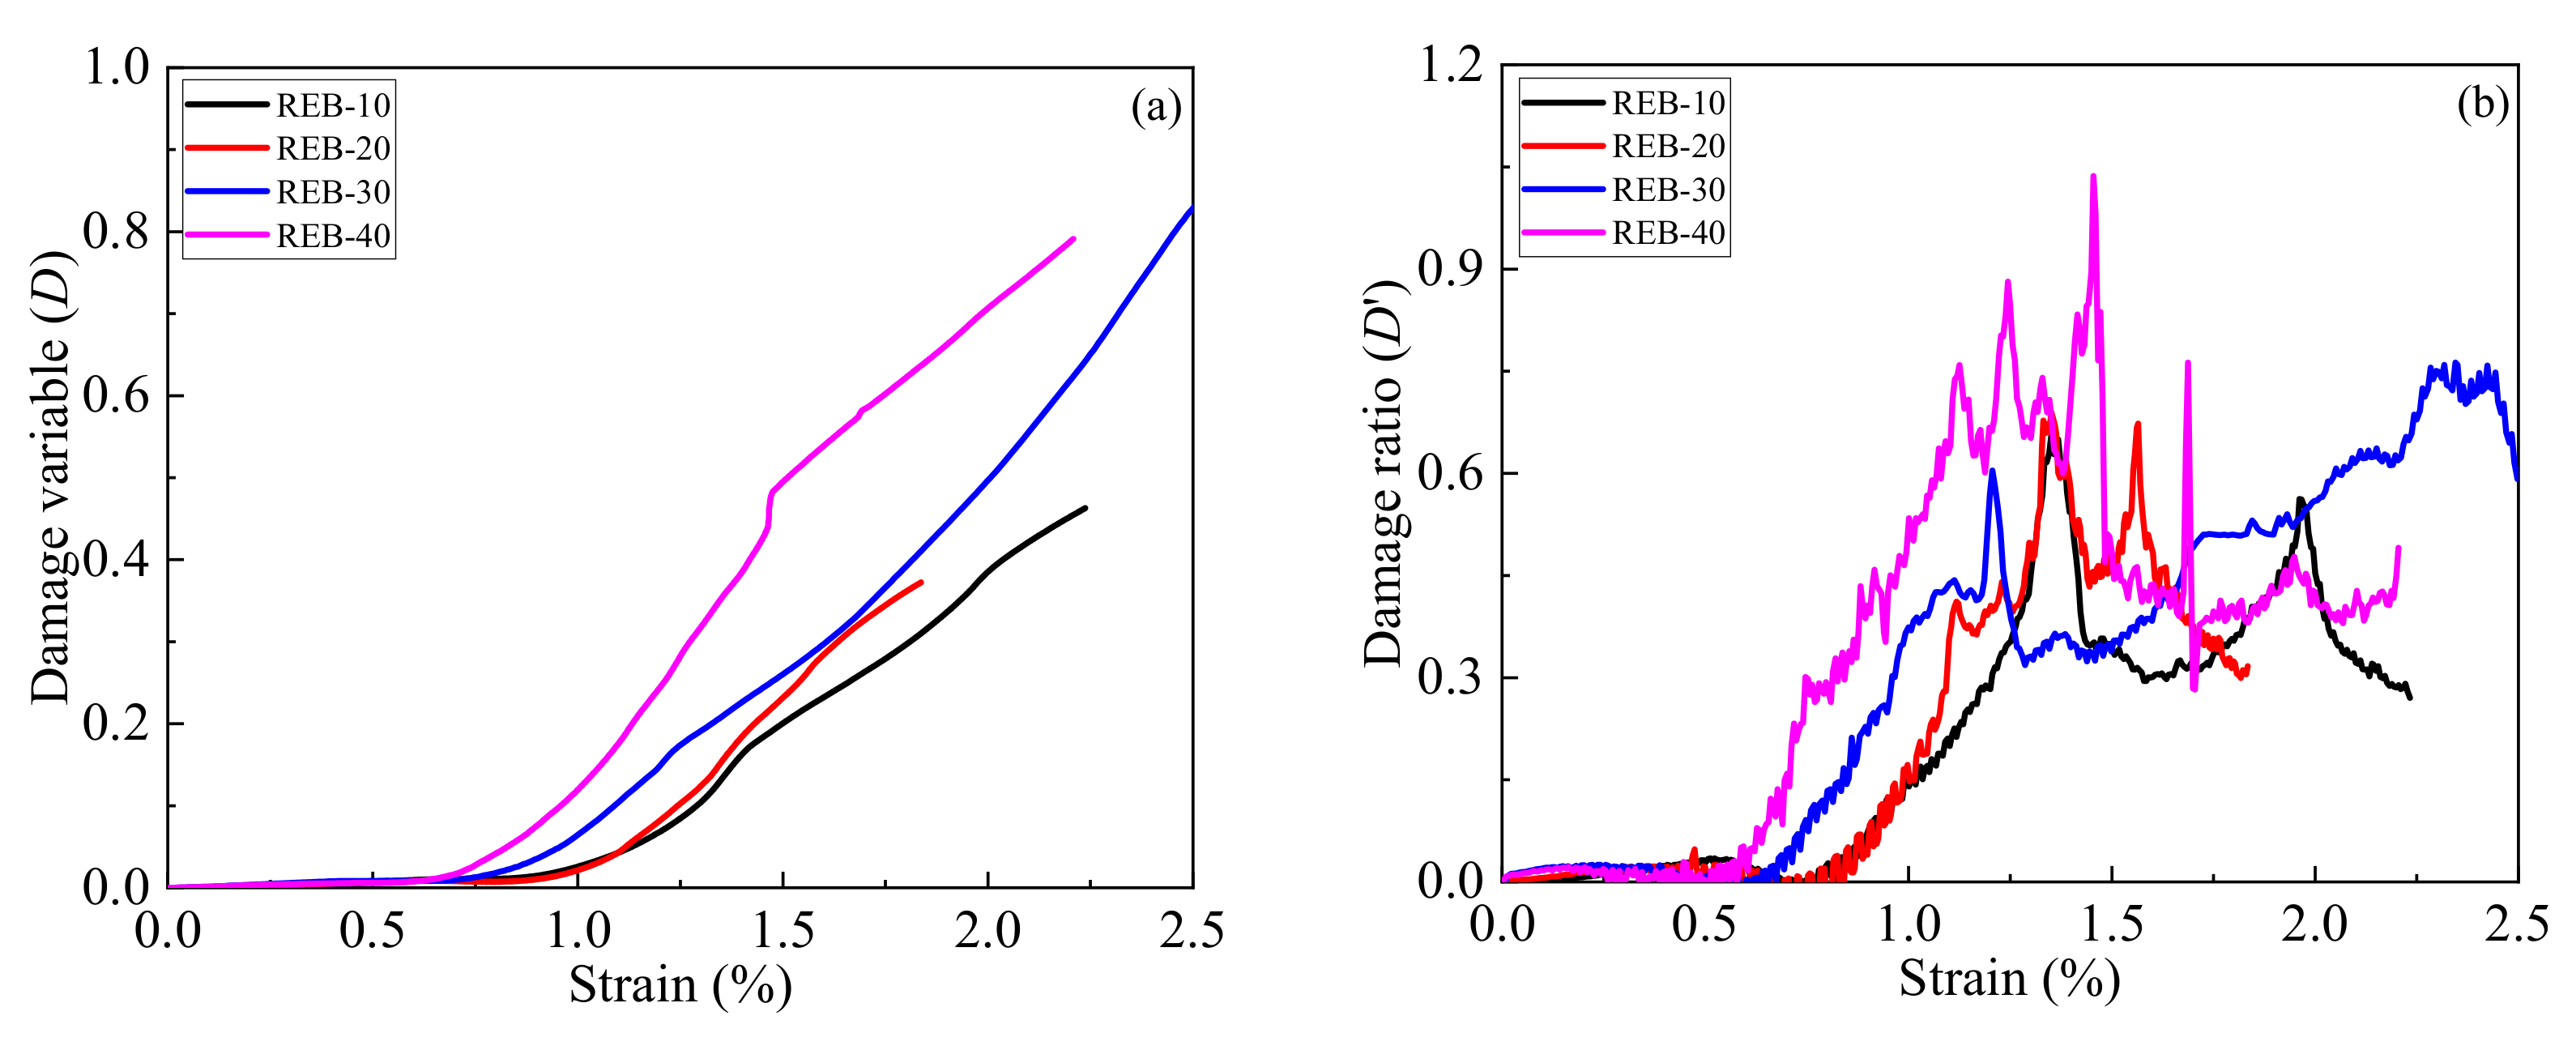
- A damage constitutive model of the RBCM was established. The damage evolution curves and damage rate evolution curves of the RBCM show S-shaped and U-shaped distributions, respectively.
- (4)
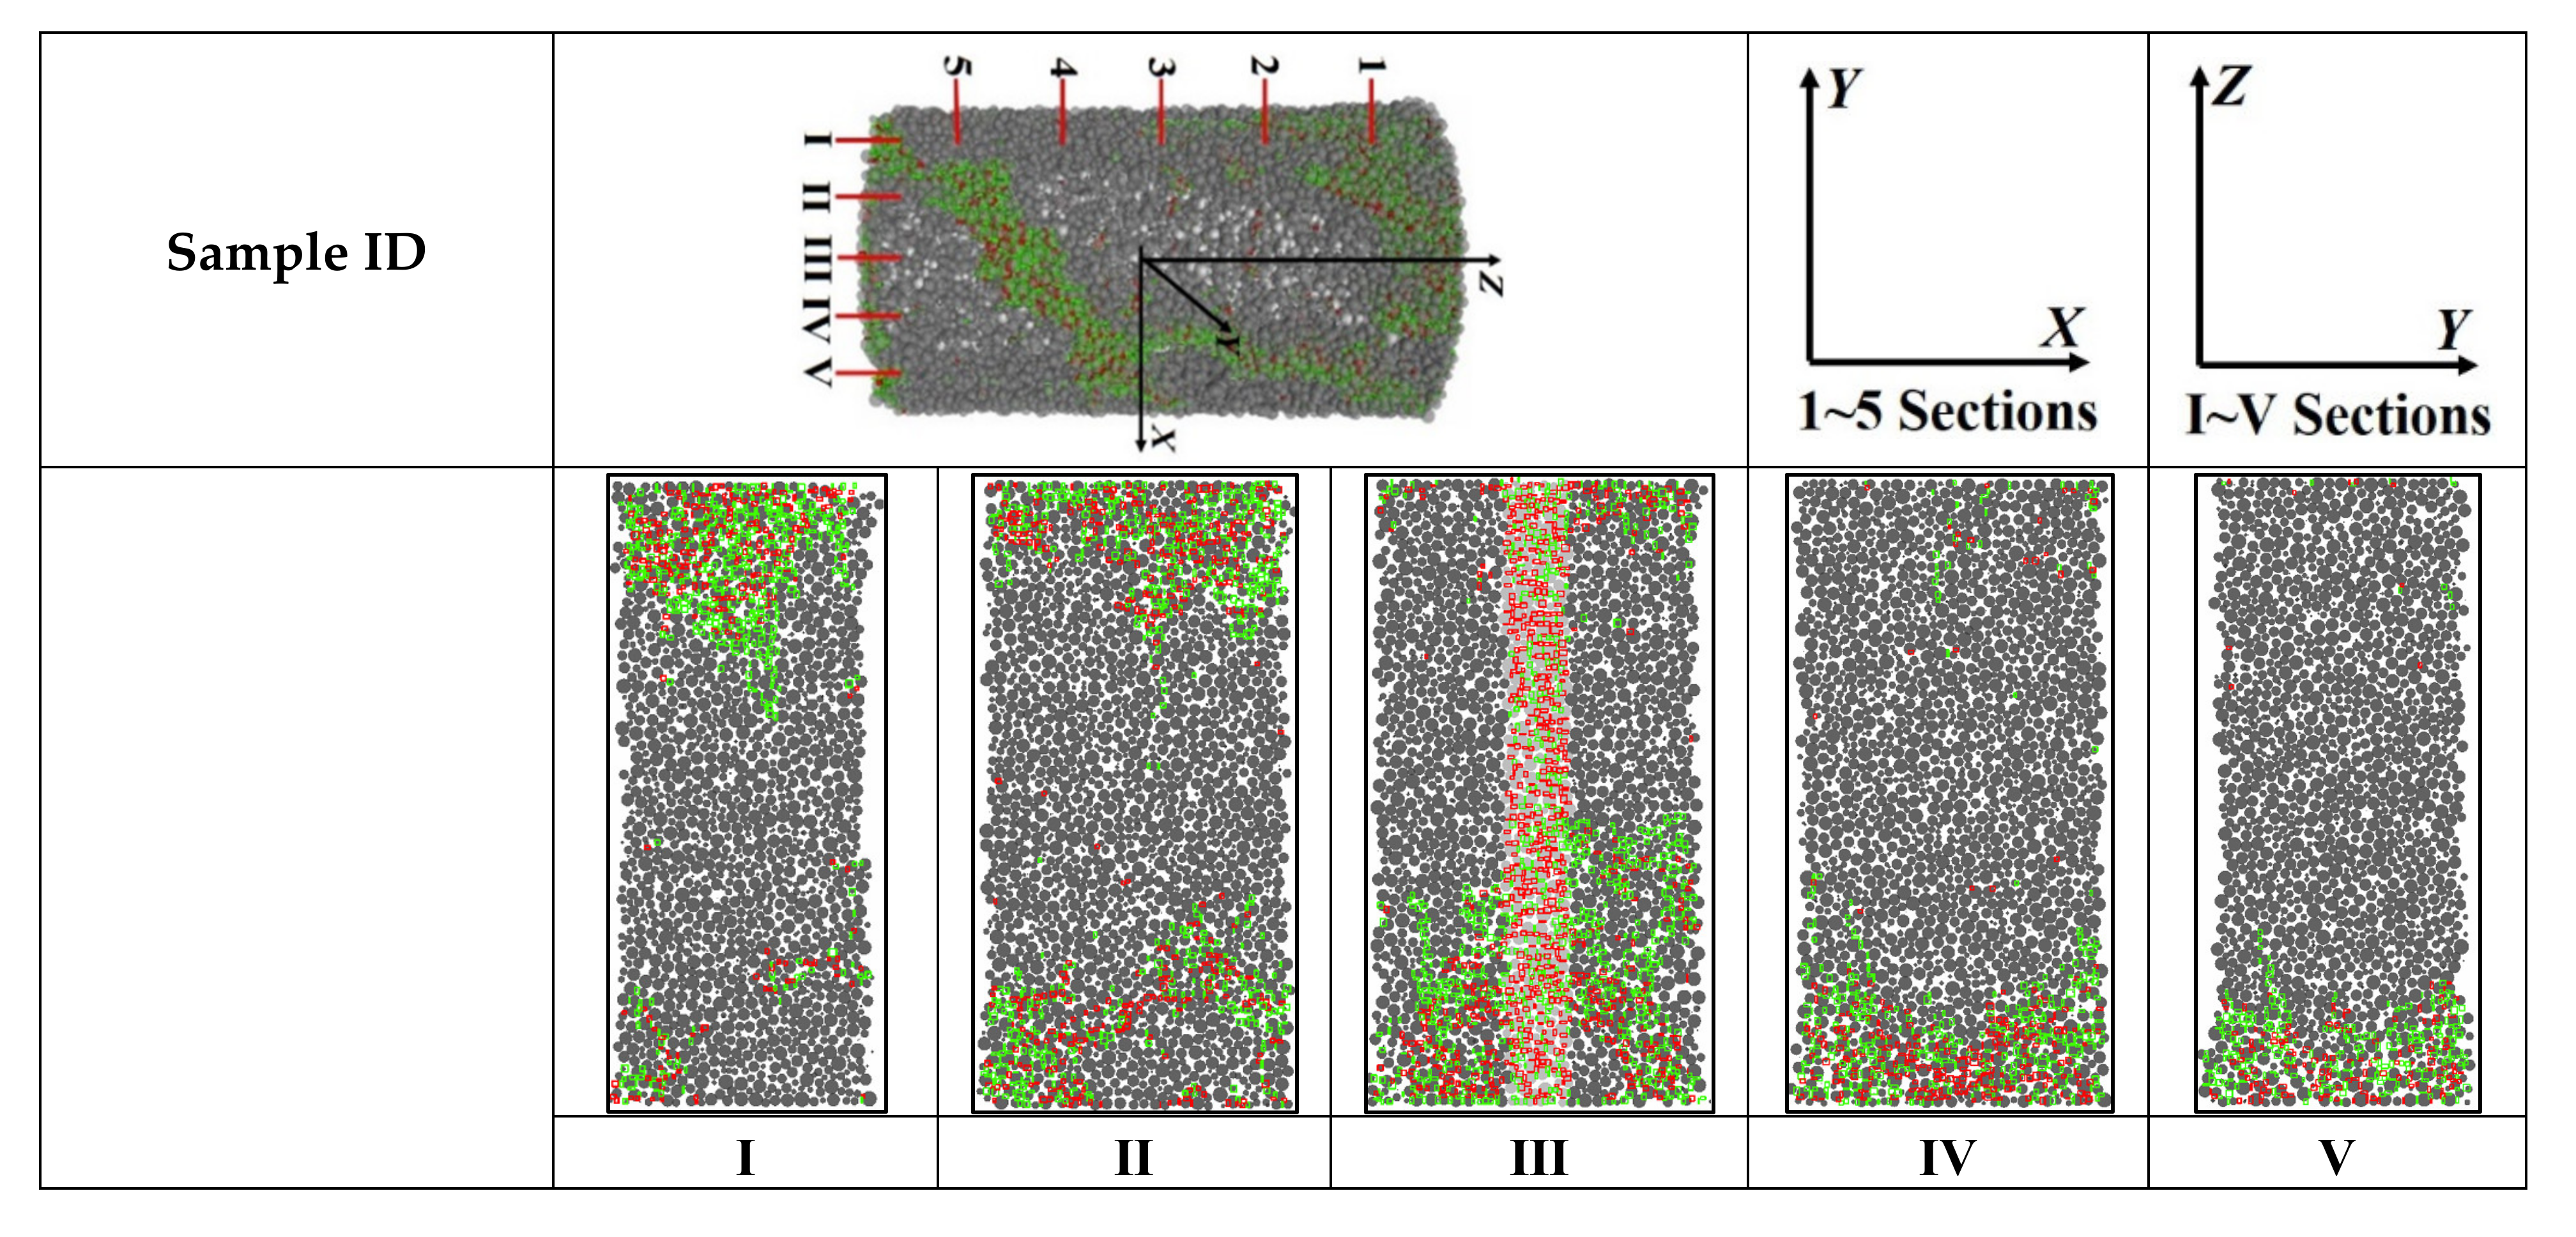
- The AE correlation fractal dimension of the RBCM was deduced and calculated. The AE correlation fractal dimension decreases with the increase of the strain gradient and damage value, and the AE correlation fractal dimension presents a linear and an exponential function with them, respectively. The AE events’ localization results show that the damage first accumulates in the internal backfill. Then, the damage extends into the surrounding rock. Finally, the damage accumulates rapidly in the surrounding rock.
- (5)
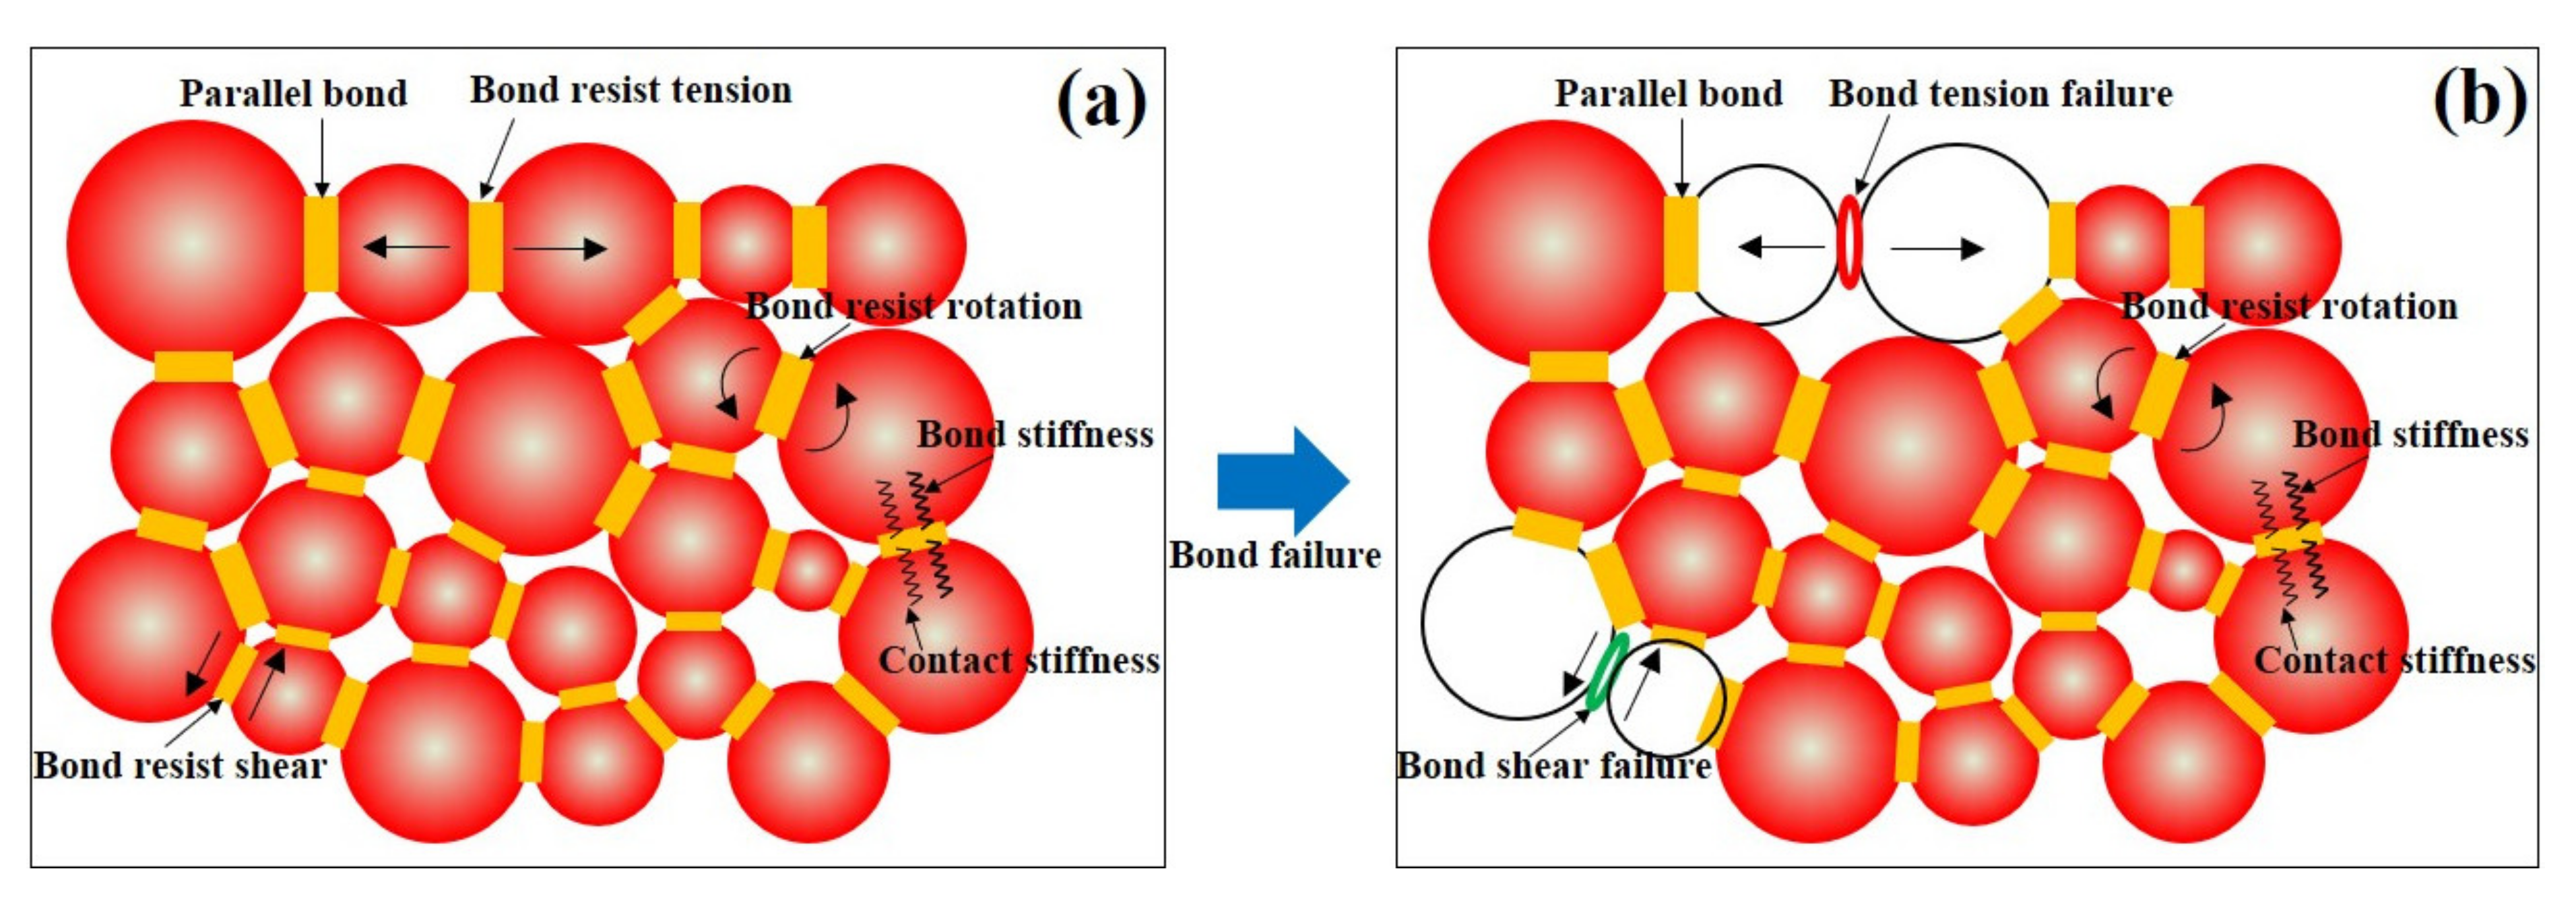
- The internal microcracks of the RBCM are caused by the local tensile stress or shear stress between particles exceeding the bond strength between particles. With the increase of stress, microcracks first appear and gather in the internal backfill of the RBCM, and then microcracks also appear and gather in the peripheral rock, which together leads to the macro penetration failure of the RBCM.
Author Contributions
Funding
Acknowledgments
Conflicts of Interest
References
- Wang, J.; Fu, J.; Song, W. Mechanical properties and microstructure of layered cemented paste backfill under triaxial cyclic loading and unloading. Constr. Build. Mater. 2020, 257, 119540. [Google Scholar] [CrossRef]
- Wang, J.; Fu, J.; Song, W.; Zhang, Y.; Wu, S. Acoustic emission characteristics and damage evolution process of layered cemented tailings backfill under uniaxial compression. Constr. Build. Mater. 2021, 295, 123663. [Google Scholar] [CrossRef]
- Xu, W.; Cao, Y.; Liu, B. Strength efficiency evaluation of cemented tailings backfill with different stratified structures. Eng. Struct. 2019, 180, 18–28. [Google Scholar] [CrossRef]
- Xu, W.-B.; Liu, B.; Wu, W.-L. Strength and deformation behaviors of cemented tailings backfill under triaxial compression. J. Central South Univ. 2020, 27, 3531–3543. [Google Scholar] [CrossRef]
- Wang, J.; Fu, J.; Song, W.; Zhang, Y. Viscosity and Strength Properties of Cemented Tailings Backfill with Fly Ash and Its Strength Predicted. Minerals 2021, 11, 78. [Google Scholar] [CrossRef]
- Ferdi, C.; Yunus, A.; Marco, C. Effect of Desliming of Tailings on the Fresh and Hardened Properties of Paste Backfill Made from Alkali-Activated Slag. Adv. Mater. Sci. Eng. 2020, 2020, 4536257. [Google Scholar]
- Hou, J.; Guo, Z.; Li, J.; Zhao, L. Study on triaxial creep test and theoretical model of cemented gangue-fly ash backfill under seepage-stress coupling. Constr. Build. Mater. 2021, 273, 121722. [Google Scholar] [CrossRef]
- Xiu, Z.; Wang, S.; Ji, Y.; Wang, F.; Ren, F.; Nguyen, V.-T. Loading rate effect on the uniaxial compressive strength (UCS) behavior of cemented paste backfill (CPB). Constr. Build. Mater. 2021, 271, 121526. [Google Scholar] [CrossRef]
- Zhao, K.; Yu, X.; Zhu, S.T.; Zhou, Y.; Wang, Q.; Wang, J.Q. Acoustic emission investigation of cemented paste backfill pre-pared with tantalum-niobium tailings. Constr. Build. Mater. 2020, 237, 117523. [Google Scholar] [CrossRef]
- Doherty, J.P.; Wood, D.M. A bonding and damage constitutive model for lightly cemented granular material. Comput. Geotech. 2020, 127, 103732. [Google Scholar] [CrossRef]
- Dzaye, E.D.; De Schutter, G.; Aggelis, D.G. Monitoring early-age acoustic emission of cement paste and fly ash paste. Cem. Concr. Res. 2020, 129, 105964. [Google Scholar] [CrossRef] [Green Version]
- Sun, Q.; Li, B.; Tian, S.; Cai, C.; Xia, Y. Creep properties of geopolymer cemented coal gangue-fly ash backfill under dynamic disturbance. Constr. Build. Mater. 2018, 191, 644–654. [Google Scholar] [CrossRef]
- Li, H.; Wu, A.; Wang, H. Evaluation of short-term strength development of cemented backfill with varying sulphide contents and the use of additives. J. Environ. Manag. 2019, 239, 279–286. [Google Scholar] [CrossRef]
- Fang, K.; Fall, M. Insight into the mode I and mode II fracture toughness of the cemented backfill-rock interface: Effect of time, temperature and sulphate. Constr. Build. Mater. 2020, 262, 120860. [Google Scholar] [CrossRef]
- Fang, K.; Cui, L.; Fall, M. A coupled chemo-elastic cohesive zone model for backfill-rock interface. Comput. Geotech. 2020, 125, 103666. [Google Scholar] [CrossRef]
- Koupouli, N.J.; Belem, T.; Rivard, P.; Effenguet, H. Direct shear tests on cemented paste backfill–rock wall and cemented paste backfill–backfill interfaces. J. Rock Mech. Geotech. Eng. 2016, 8, 472–479. [Google Scholar] [CrossRef] [Green Version]
- Wang, Y.R.; Lu, H.J.; Wu, J. Experimental investigation on strength and failure characteristics of cemented paste back-fill-rock composite under uniaxial compression. Constr. Build. Mater. 2021, 304, 124629. [Google Scholar] [CrossRef]
- Wu, W.L.; Xu, W.B.; Zuo, J.P. Effect of inclined interface angle on shear strength and deformation response of cemented paste backfill-rock under triaxial compression. Constr. Build. Mater. 2021, 279, 122478. [Google Scholar]
- Xiu, Z.; Wang, S.; Ji, Y.; Wang, F.; Ren, F.; Nguyen, V.-T. The effects of dry and wet rock surfaces on shear behavior of the interface between rock and cemented paste backfill. Powder Technol. 2021, 381, 324–337. [Google Scholar] [CrossRef]
- Zhao, L. Numerical investigation on the mechanical behaviour of combined backfill-rock structure with KCC model. Constr. Build. Mater. 2021, 283, 122782. [Google Scholar] [CrossRef]
- Yu, X.; Kemeny, J.; Tan, Y.; Song, W.; Huang, K. Mechanical properties and fracturing of rock-backfill composite specimens under triaxial compression. Constr. Build. Mater. 2021, 304, 124577. [Google Scholar] [CrossRef]
- Wang, J.; Fu, J.X.; Song, W.D.; Zhang, Y.F.; Wang, Y. Mechanical behavior, acoustic emission properties and damage evo-lution of cemented paste backfill considering structural feature. Constr. Build. Mater. 2010, 261, 119958. [Google Scholar] [CrossRef]
- Shah, S.G.; Kishen, J.M.C. Fracture behavior of concrete-concrete interface using acoustic emission technique. Eng. Fract. Mech. 2010, 77, 908–924. [Google Scholar] [CrossRef]
- Liu, S.; Li, X.; Li, Z.; Chen, P.; Yang, X.; Liu, Y. Energy distribution and fractal characterization of acoustic emission (AE) during coal deformation and fracturing. Measurement 2019, 136, 122–131. [Google Scholar] [CrossRef]
- Anay, R.; Soltangharaei, V.; Assi, L.; DeVol, T.; Ziehl, P. Identification of damage mechanisms in cement paste based on acoustic emission. Constr. Build. Mater. 2018, 164, 286–296. [Google Scholar] [CrossRef]
- Hou, Y.; Yin, S.; Chen, X.; Zhang, M.; Yang, S. Study on characteristic stress and energy damage evolution mechanism of cemented tailings backfill under uniaxial compression. Constr. Build. Mater. 2021, 301, 124333. [Google Scholar] [CrossRef]
- Wang, J.; Song, W.; Cao, S.; Tan, Y. Mechanical properties and failure modes of stratified backfill under triaxial cyclic loading and unloading. Int. J. Min. Sci. Technol. 2019, 29, 809–814. [Google Scholar] [CrossRef]
- Song, W.D.; Wang, J.; Tan, Y.Y.; Cao, S. Energy consumption and damage characteristics of stratified backfill under triaxial loading and unloading. J. China Univ. Min. Technol. 2017, 45, 1050–1057. [Google Scholar]
- Xin, L. Meso-scale modeling of the influence of waste rock content on mechanical behavior of cemented tailings backfill. Constr. Build. Mater. 2021, 307, 124473. [Google Scholar] [CrossRef]
- Zhao, K.; Yu, X.; Zhu, S.; Yan, Y.; Zhou, Y.; He, Z.; Song, Y.; Huang, M. Acoustic emission fractal characteristics and mechanical damage mechanism of cemented paste backfill prepared with tantalum niobium mine tailings. Constr. Build. Mater. 2020, 258, 119720. [Google Scholar] [CrossRef]
- Zhou, Y.; Yan, Y.; Zhao, K.; Yu, X.; Song, Y.; Wang, J.; Suo, T. Study of the effect of loading modes on the acoustic emission fractal and damage characteristics of cemented paste backfill. Constr. Build. Mater. 2021, 277, 122311. [Google Scholar] [CrossRef]
- He, Z.; Zhao, K.; Yan, Y.; Ning, F.; Zhou, Y.; Song, Y. Mechanical response and acoustic emission characteristics of cement paste backfill and rock combination. Constr. Build. Mater. 2021, 288, 123119. [Google Scholar] [CrossRef]
- Wang, J.; Fu, J.; Song, W.; Zhang, Y. Mechanical properties, damage evolution, and constitutive model of rock-encased backfill under uniaxial compression. Constr. Build. Mater. 2021, 285, 122898. [Google Scholar] [CrossRef]
- Ma, Q.; Tan, Y.; Liu, X.; Gu, Q.; Li, X. Effect of coal thicknesses on energy evolution characteristics of roof rock-coal-floor rock sandwich composite structure and its damage constitutive model. Compos. Part B Eng. 2020, 198, 108086. [Google Scholar] [CrossRef]
- Liu, W.Z.; Chen, J.T.; Guo, Z.P.; Yang, H.Z.; Xie, W.W.; Zhang, Y.D. Mechanical properties and damage evolution of ce-mented coal gangue-fly ash backfill under uniaxial compression: Effects of different curing temperatures. Constr. Build. Mater. 2021, 305, 124820. [Google Scholar] [CrossRef]
- Cui, L.; Fall, M. An evolutive elasto-plastic model for cemented paste backfill. Comput. Geotech. 2016, 71, 19–29. [Google Scholar] [CrossRef]
- Zhou, Y.; Yu, X.; Guo, Z.; Yan, Y.; Zhao, K.; Wang, J.; Zhu, S. On acoustic emission characteristics, initiation crack intensity, and damage evolution of cement-paste backfill under uniaxial compression. Constr. Build. Mater. 2021, 269, 121261. [Google Scholar] [CrossRef]
- Qiu, J.; Zhou, Y.; Vatin, N.I.; Guan, X.; Sultanov, S.; Khemarak, K. Damage constitutive model of coal gangue concrete under freeze-thaw cycles. Constr. Build. Mater. 2020, 264, 120720. [Google Scholar] [CrossRef]
- Liu, X.S.; Tan, Y.L.; Ning, J.G.; Lu, Y.W.; Gu, Q.H. Mechanical properties and damage constitutive model of coal in coal-rock combined body. Int. J. Rock Mech. Min. Sci. 2018, 110, 140–150. [Google Scholar] [CrossRef]
- Fu, J.; Wang, J.; Song, W. Damage constitutive model and strength criterion of cemented paste backfill based on layered effect considerations. J. Mater. Res. Technol. 2020, 9, 6073–6084. [Google Scholar] [CrossRef]
- Xie, H.P.; Ju, Y.; Li, L.Y. Criteria for strength and structural failure of rocks based on energy dissipation and energy release principles. Chin. J. Rock Mech. Eng. 2005, 24, 3003–3010. [Google Scholar]
- Jia, Z.Q.; Li, C.B.; Zhang, R.; Wang, M.; Gao, M.Z.; Zhang, Z.T.; Zhang, Z.P.; Ren, L.; Xie, J. Energy Evolution of Coal at Dif-ferent Depths Under Unloading Conditions. Rock Mech. Rock Eng. 2019, 52, 4637–4649. [Google Scholar] [CrossRef]
- Guo, H.F.; Song, D.Z.; He, X.Q.; Lou, Q.; Qiu, L.M. Fractal characteristics of acoustic emission in different damage degrees of impact coal. Coal Sci. Technol. 2021, 49, 38–46. [Google Scholar]
- Gong, C.; Zhao, K.; Bao, H.; Zhao, K.; Zeng, P.; Wang, W.J. Acoustic emission source evolution characteristics and fractal features during creep failure of red sandstone. Rock Soil Mech. 2021, 42, 1–13. [Google Scholar]
- Wang, J.; Fu, J.X.; Song, W.D.; Zhang, Y.F.; Wang, Y. Particle flow simulation of mechanical properties and microcrack evolution characteristics of rock-backfill combined model. J. China Univ. Min. Technol. 2020, 49, 453–462. [Google Scholar]
- Cheng, A.; Shu, P.; Deng, D.; Zhou, C.; Huang, S.; Ye, Z. Microscopic acoustic emission simulation and fracture mechanism of cemented tailings backfill based on moment tensor theory. Constr. Build. Mater. 2021, 308, 125069. [Google Scholar] [CrossRef]


| Sample ID | Backfill Diameter db (mm) | c/t Ratio | Peak Stress (MPa) | Peak Strain (%) | Elastic Modulus (GPa) |
|---|---|---|---|---|---|
| RBCM-10 | 10 | 1:4 | 50.15 | 1.246 | 7.51 |
| RBCM-20 | 20 | 42.47 | 1.106 | 5.72 | |
| RBCM-30 | 30 | 28.73 | 1.040 | 3.88 | |
| RBCM-40 | 40 | 18.14 | 1.017 | 2.33 |
| ID | RBCM-10 | RBCM-20 | RBCM-30 | RBCM-40 |
|---|---|---|---|---|
| UTp (KJ/m3) | 0.325 | 0.237 | 0.134 | 0.106 |
| UEp (KJ/m3) | 0.214 | 0.154 | 0.085 | 0.06 |
| UDp (KJ/m3) | 0.111 | 0.084 | 0.049 | 0.046 |
| UEp/UDp | 1.93 | 1.83 | 1.73 | 1.30 |
| UEp/UTp | 0.66 | 0.65 | 0.63 | 0.57 |
| UDp/UTp | 0.34 | 0.35 | 0.37 | 0.43 |
Publisher’s Note: MDPI stays neutral with regard to jurisdictional claims in published maps and institutional affiliations. |
© 2022 by the authors. Licensee MDPI, Basel, Switzerland. This article is an open access article distributed under the terms and conditions of the Creative Commons Attribution (CC BY) license (https://creativecommons.org/licenses/by/4.0/).
Share and Cite
Wang, J.; Zhang, C.; Song, W.; Zhang, Y. The Energy Dissipation, AE Characteristics, and Microcrack Evolution of Rock–Backfill Composite Materials (RBCM). Minerals 2022, 12, 482. https://doi.org/10.3390/min12040482
Wang J, Zhang C, Song W, Zhang Y. The Energy Dissipation, AE Characteristics, and Microcrack Evolution of Rock–Backfill Composite Materials (RBCM). Minerals. 2022; 12(4):482. https://doi.org/10.3390/min12040482
Chicago/Turabian StyleWang, Jie, Chi Zhang, Weidong Song, and Yongfang Zhang. 2022. "The Energy Dissipation, AE Characteristics, and Microcrack Evolution of Rock–Backfill Composite Materials (RBCM)" Minerals 12, no. 4: 482. https://doi.org/10.3390/min12040482
APA StyleWang, J., Zhang, C., Song, W., & Zhang, Y. (2022). The Energy Dissipation, AE Characteristics, and Microcrack Evolution of Rock–Backfill Composite Materials (RBCM). Minerals, 12(4), 482. https://doi.org/10.3390/min12040482