Article

Flocculation and Settlement Characteristics of Ultrafine Tailings and Microscopic Characteristics of Flocs

1
State Key Laboratory of High-Efficient Mining and Safety of Metal Mines of Ministry of Education, University of Science and Technology Beijing, Beijing 100083, China
2
School of Civil and Resource Engineering, University of Science and Technology Beijing, Beijing 10083, China
3
Daye Iron Mine Co., Ltd., Wuhan Iron and Steel Resources Group, Huangshi 435006, China
*
Author to whom correspondence should be addressed.
Minerals 2022, 12(2), 221; https://doi.org/10.3390/min12020221
Submission received: 27 December 2021 / Revised: 5 February 2022 / Accepted: 7 February 2022 / Published: 9 February 2022

Abstract

:
Aiming to solve the problems related to the slow settling speed and the long-term consumption of ultra-fine tailings in mine filling, the effect of flocculant type on the flocculation and settling performance of ultra-fine tailings was studied through static sedimentation experiments on tailings. The microstructure of the flocculation was observed and analyzed using an electron microscope. On this basis, the selection of the optimum flocculant type and dosage parameters was carried out. The results show that the best addition amount of the AZ9020 anionic flocculant was 30 g/t, a solution concentration of 0.3%, and a stirring time of more than 45 min. The floc structure of the full-tailings flocculation solution was formed by the AZ9020 anionic flocculant. Moreover, the size of less than 0.1 μm was still relatively large; thus, the overall size of the structure was small and uniformly dispersed. The floc solution had the smallest porosity, the fractal dimension was the largest, the molecular weight of the floc was the largest, and the floc was the most compact, making it appropriate for the rapid removal of floc structures from water. Sedimentation is also the best flocculant for flocculation and sedimentation. The size of the flocs decreased as the height of the flocculation sediment bed increased during flocculation and sedimentation. The research results provide a microscopic view for the selection of the best flocculant type.

1. Introduction

As a cement filling, tailings can prevent surface subsidence and can reduce the occupation of ground space by tailing stacking. Thus, the use of tailings as a cement filling is an inevitable choice for the green development of current mines [1,2,3]. However, ultrafine tailings encounter problems, such as a long natural settlement time and slow speed, due to their high content of fine particles, thus failing to meet the large-scale continuous filling requirements of mines [4,5,6]. Increasing the sedimentation efficiency by adding flocculants is a common practice in current mines to meet the needs of large-scale continuous filling underground. The sedimentation speed and concentration of tailings particles in the flocculation sedimentation process are affected by many factors, such as the type of flocculant [7,8]. Therefore, selecting a reasonable flocculation type according to the characteristics and properties of tailings is crucial to ensure the flocculation and settlement effect of mine-filling systems.
In recent years, scholars at home and abroad have conducted various studies on the sedimentation laws of ultrafine tailings. Jiao created a tailings sedimentation velocity model through experiments and divided the tailings sedimentation process into the following six stages: turbulent flow affected, accelerated sedimentation, final sedimentation velocity, interference sedimentation, compaction sedimentation, and ultimate sedimentation [9]. Yang conducted static flocculation sedimentation and slurry rheological test experiments by investigating three factors, including the flocculant type, the volume fraction of the feed, and the unit consumption of the flocculant [10]. Li conducted a static flocculation and sedimentation experiment on ultrafine tailings and obtained the optimal flocculant unit consumption as well as other parameters [11]. Xue performed deep-cone dense dynamic sedimentation experiments to analyze the influence of the feeding speed, rake stirring speed, and slurry mass fraction on the settlement behavior of flocs and obtained the optimal feeding and rake stirring speeds [12]. Wu studied various factors influencing the flocculation and sedimentation processes through laboratory experiments and determined the degree of influence [13]. Gheshlaghi M. E. and Ruan Z. E. applied numerical simulation methods to study the flocculation and sedimentation behaviors of the tailings in a deep-cone thickener [14,15]. Hou conducted scanning electron microscopy (SEM) observations of tailings flocculation sedimentation samples, analyzed the particle size distribution of tailings particles in different settlement areas, and explored the sedimentation characteristics of tailings particles of various sizes [16]. Chen used SEM technology to analyze the floc structures, explained the characteristics of the concentration distribution and gel point concentration of the viscous sediment from the perspective of the floc microstructure, and discussed common morphological pore parameters [17]. Yang used SEM to observe the microstructure of the mortar in the compaction zone and found that the flocs had three different forms of sedimentation, compaction, and stability, which were accompanied by changes in the size of the flocs [18]. Hu analyzed the pore structure of the tailing fillings, quantified the fractal dimension of the pores [19], and studied the relationship between the grading index, pore structure, and strength.
The aforementioned studies show that laboratory experiments are an effective method through which to examine the rules of tailings flocculation and sedimentation, while nuclear magnetic resonance and micro-electron microscopy provide the possibility of investigating the microstructure characteristics of tailings flocs during flocculation and sedimentation. In this paper, laboratory experiments are used to study the flocculation and sedimentation characteristics of ultrafine tailings in the Daye Iron Mine, and the microstructure characteristics and floc parameters at different bed heights during flocculation and sedimentation are analyzed through nuclear magnetic resonance (NMR) and micro-electron microscope observations, respectively, thus providing a scientific reference for selecting the best type of flocculant. This paper takes ultrafine iron ore tailings as the research object to conduct experiments, and the research conclusions can provide a certain degree of reference and a basis for other similar iron ore mines with the same grain size and chemical composition.

2. Materials and Methods

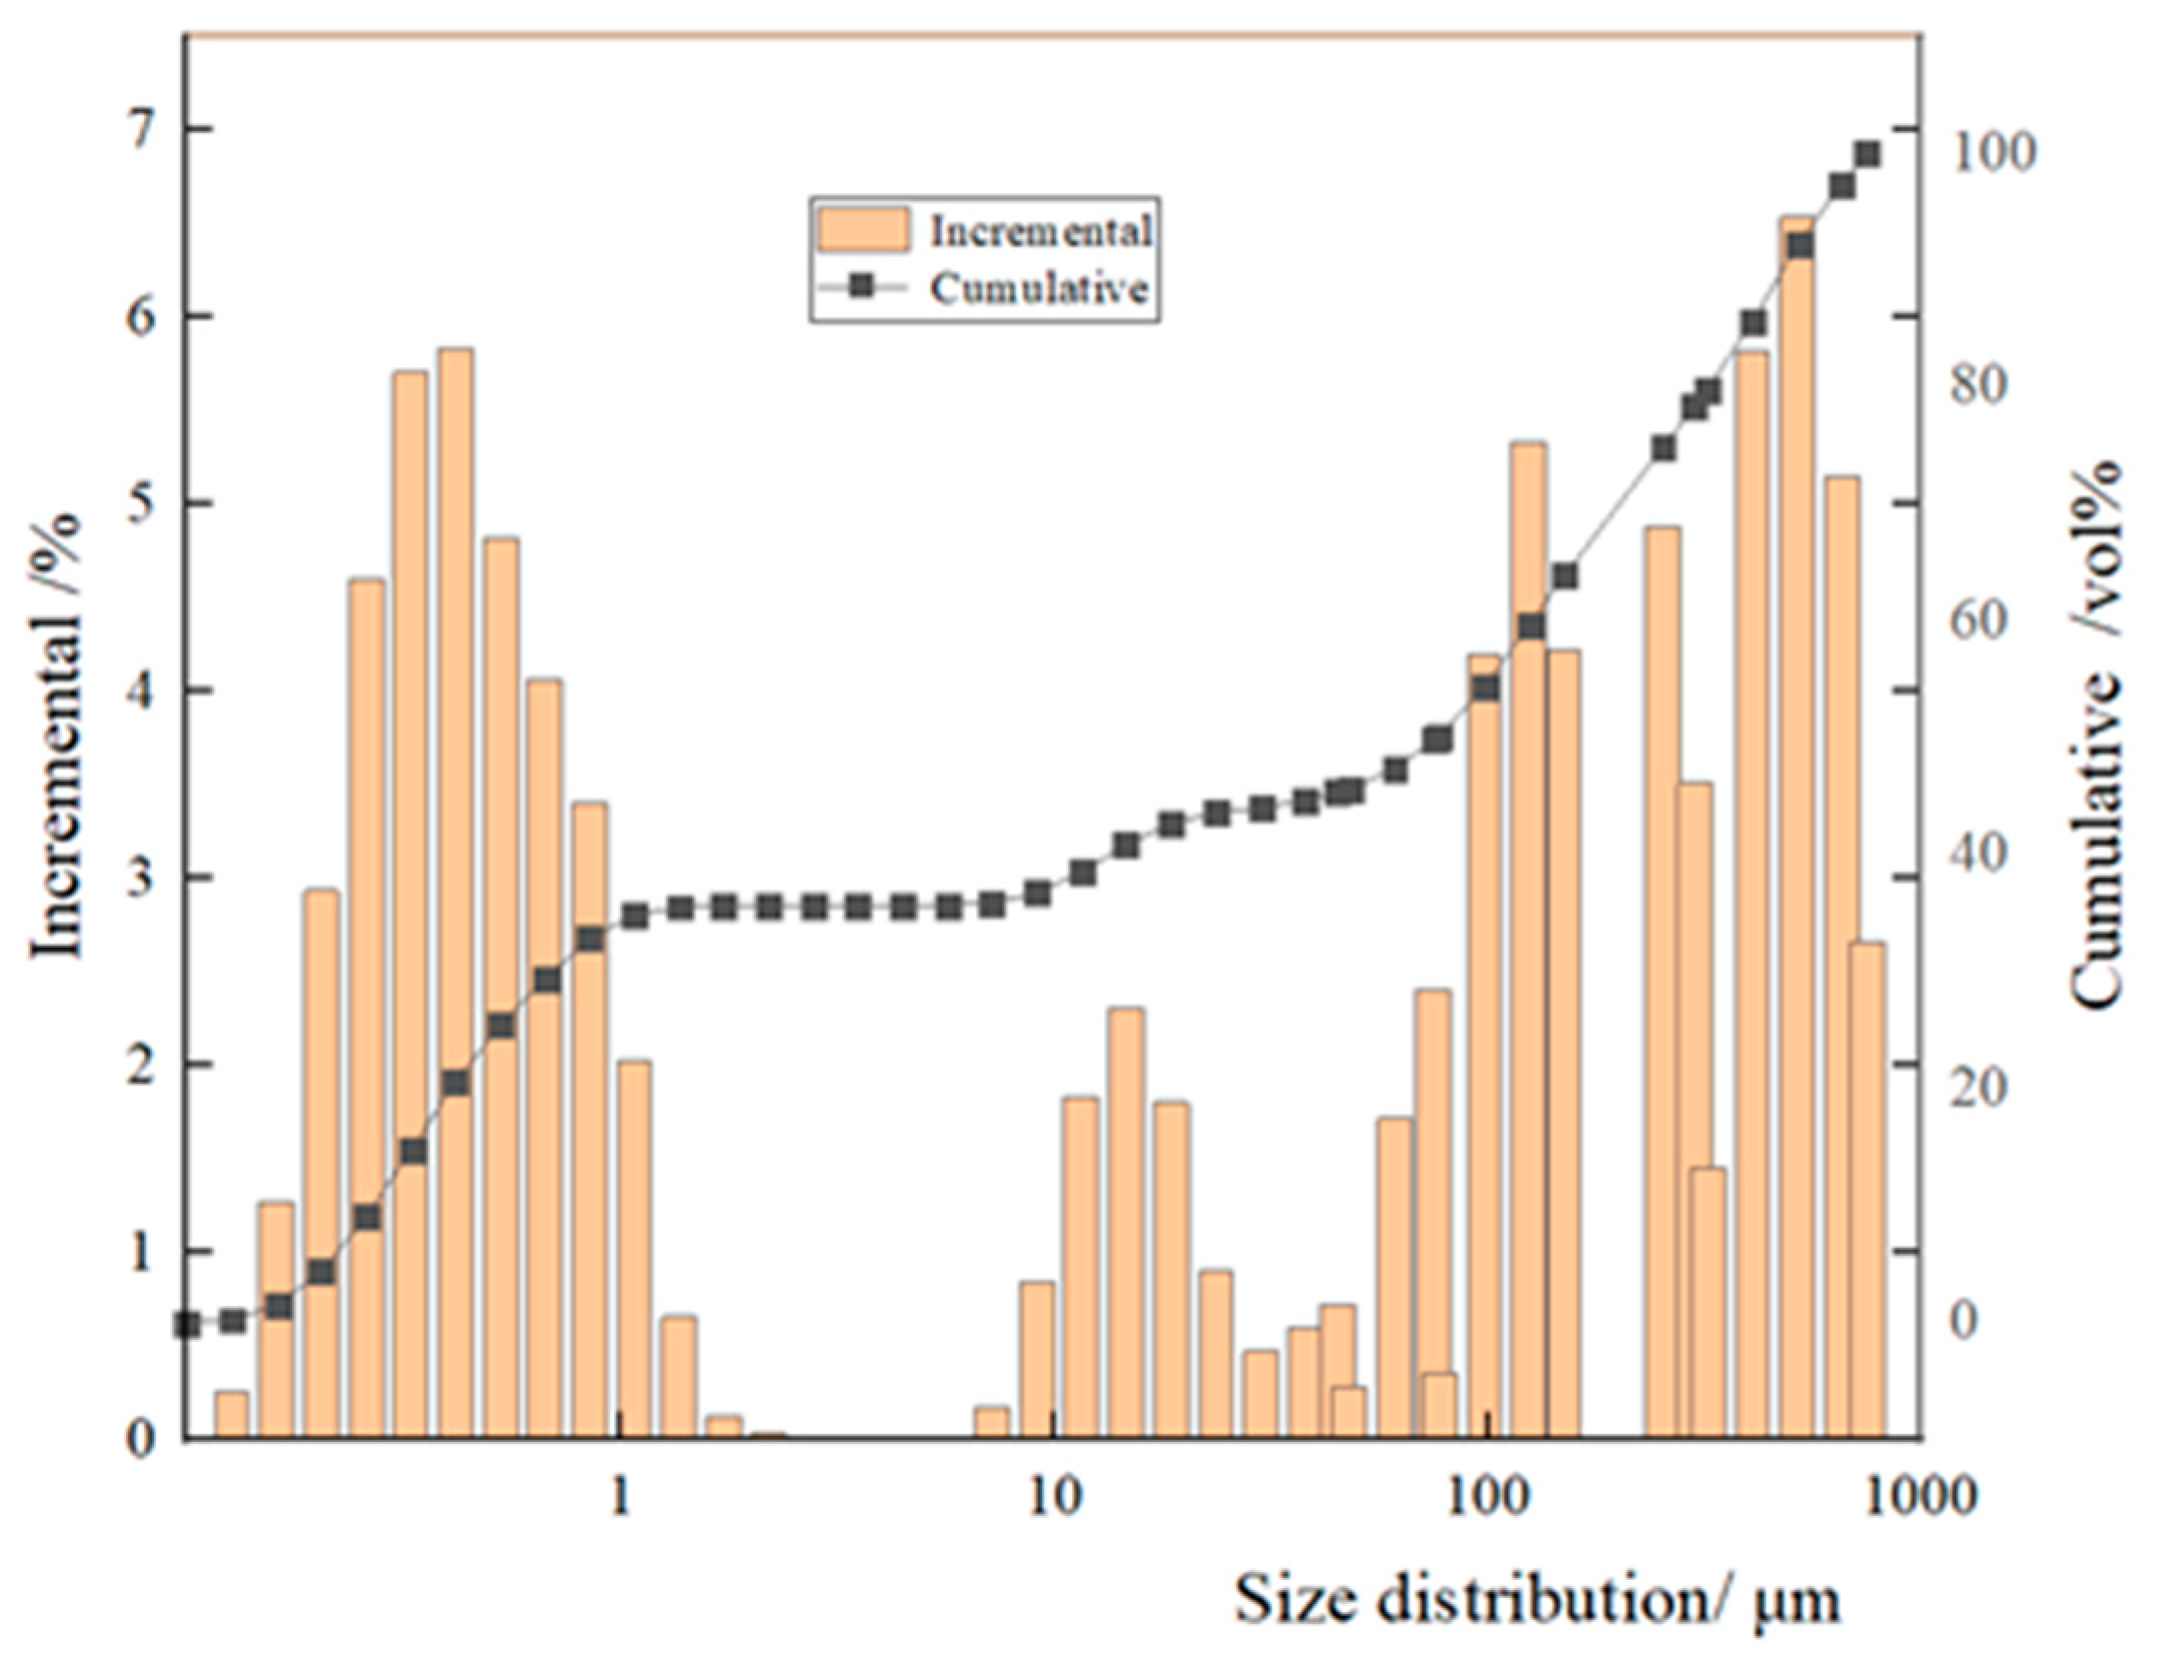
2.1. Physical and Chemical Properties of Ultrafine Tailings

Ultrafine tailings from the Daye Iron Mine were selected for the experiment. The physical parameters are shown in Table 1, and the particle size composition is presented in Figure 1. The figure shows that the gradation of ultrafine tailings is not particularly uniform. Several coarse and fine particles are observed, and only a few intermediate particles are found. The average median and surface area volume and average particle sizes of the tailings were relatively small, belonging to the category of ultrafine particle tailings. The tailings sorting coefficient was relatively large, making it suitable as a raw material for downhole filling.
Table 2 shows that the main mineral components of the tailings are inert oxides SiO2, TFe and SFe and contain active oxides, such as CaO, Al2O3, and MgO. Therefore, ultrafine tailings are inert materials. However, these tailings have corresponding cementing activity and can be stimulated for comprehensive utilization.

2.2. Flocculant Parameters

Numerous studies have shown that anionic flocculants have superior flocculation effects on tailings [20,21]. Therefore, the flocculants used in this article, namely AZ358, AZ625, AZ9020, and AZ505, are all anionic. The relevant parameters are shown in Table 3.

2.3. Experimental Program and Process

Regardless of the cross-effect between the ultrafine tailings concentration and the additional amount of flocculant, the type of flocculant, unit consumption, concentration, and mixing time using a fixed ultrafine tailings concentration of 30% were determined through indoor sedimentation experiments via the single-factor analysis method. The research, experimental program, and process are shown in Table 4. The height and time of the solid–liquid separation surface drop during the experiment were observed and recorded, as shown in Figure 2.

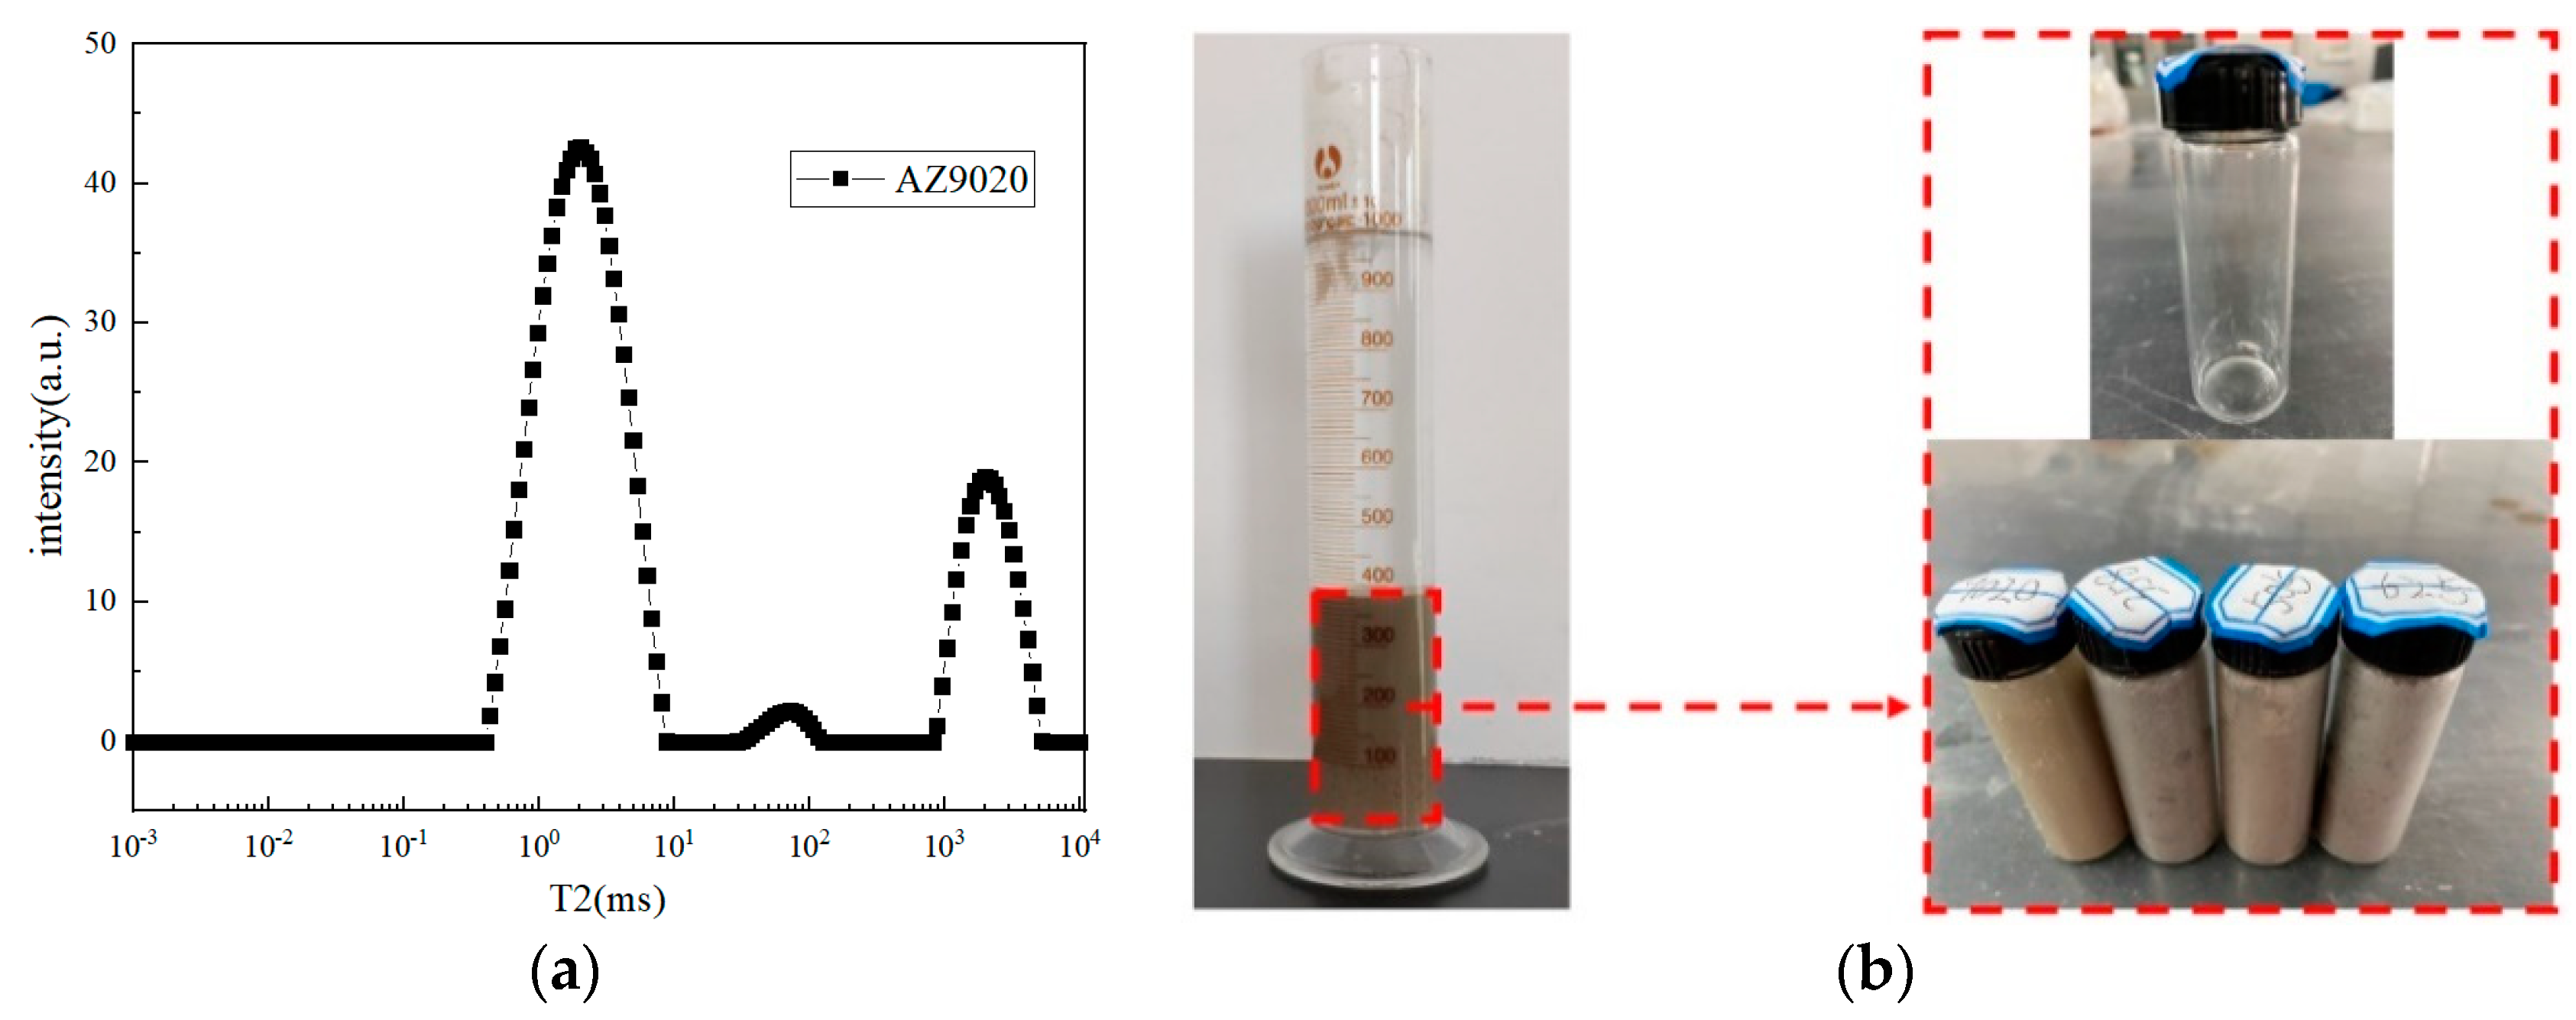
2.4. Nuclear Magnetic Resonance (NMR) Analysis Experiment

The experimental system used for the NMR analysis in this experiment (MESOMR23-060H-I, Suzhou, China), which has a hydrogen spectrum, is a kind of nuclear magnetic resonance effect of H−1 that can be used for nuclear magnetic resonance spectroscopy and has the following parameters: resonance frequency: 23 MHz, magnet temperature: 25–35 °C, temperature control accuracy: ±0.05 °C. The NMR spectrum is shown in Figure 3a.
The flocculants AZ358, AZ625, AZ9020, and AZ505 were used to perform the flocculation and sedimentation experiments with a solution concentration of 0.3%, a unit consumption of 30 g/t, and a stirring time of 45 min. The stirrer was taken out, and the solution was allowed to stand, and it was then timed to observe the height of the clarified layer in the cylinder. The flocculation solution was extracted at 200 mL of the graduated cylinder after 30 min and was placed in a sealed glass bottle (Figure 3b). The experimental system used for NMR analysis was also used for observation.

2.5. Micro-Electron Microscope Scanning Experiment (SEM)

For the SEM observation experiment, an SEM EVO 18 tungsten filament from Carl Zeiss (ZEISS) was adopted, along with an image size of 1000 × 750 pixels and an acceleration voltage of 20 kV.
SEM experiment ①: Figure 3 shows the extraction of the four flocculant floc solutions at a volume of 200 mL in a cylinder. This extraction was performed using a long pipette according to the exact scale of the extraction floccules and by gently dropping the cut-out on good filter paper. Liquid nitrogen freezing and fixed, conductive adhesive spraying carbon treatment procedures, the prepared samples were into the micro-electron microscope for scanning observation of the samples, and the electron microscope was operated at a magnification of 2000 times.
SEM experiment ②: The flocculant with the smallest porosity and fractal dimension was selected to conduct the flocculation settlement experiment of the ultrafine whole tailings a second time. The flocculant solutions at different bed positions (positions 1, 2, and 3, located at 300, 200, and 100 mL, respectively, in the measuring cylinder scale), such as those shown in Figure 4, were extracted and prepared for use as SEM observation samples according to the aforementioned method. The sample was observed by an operation electron microscope with magnification of 2000 times.

3. Results and Discussion

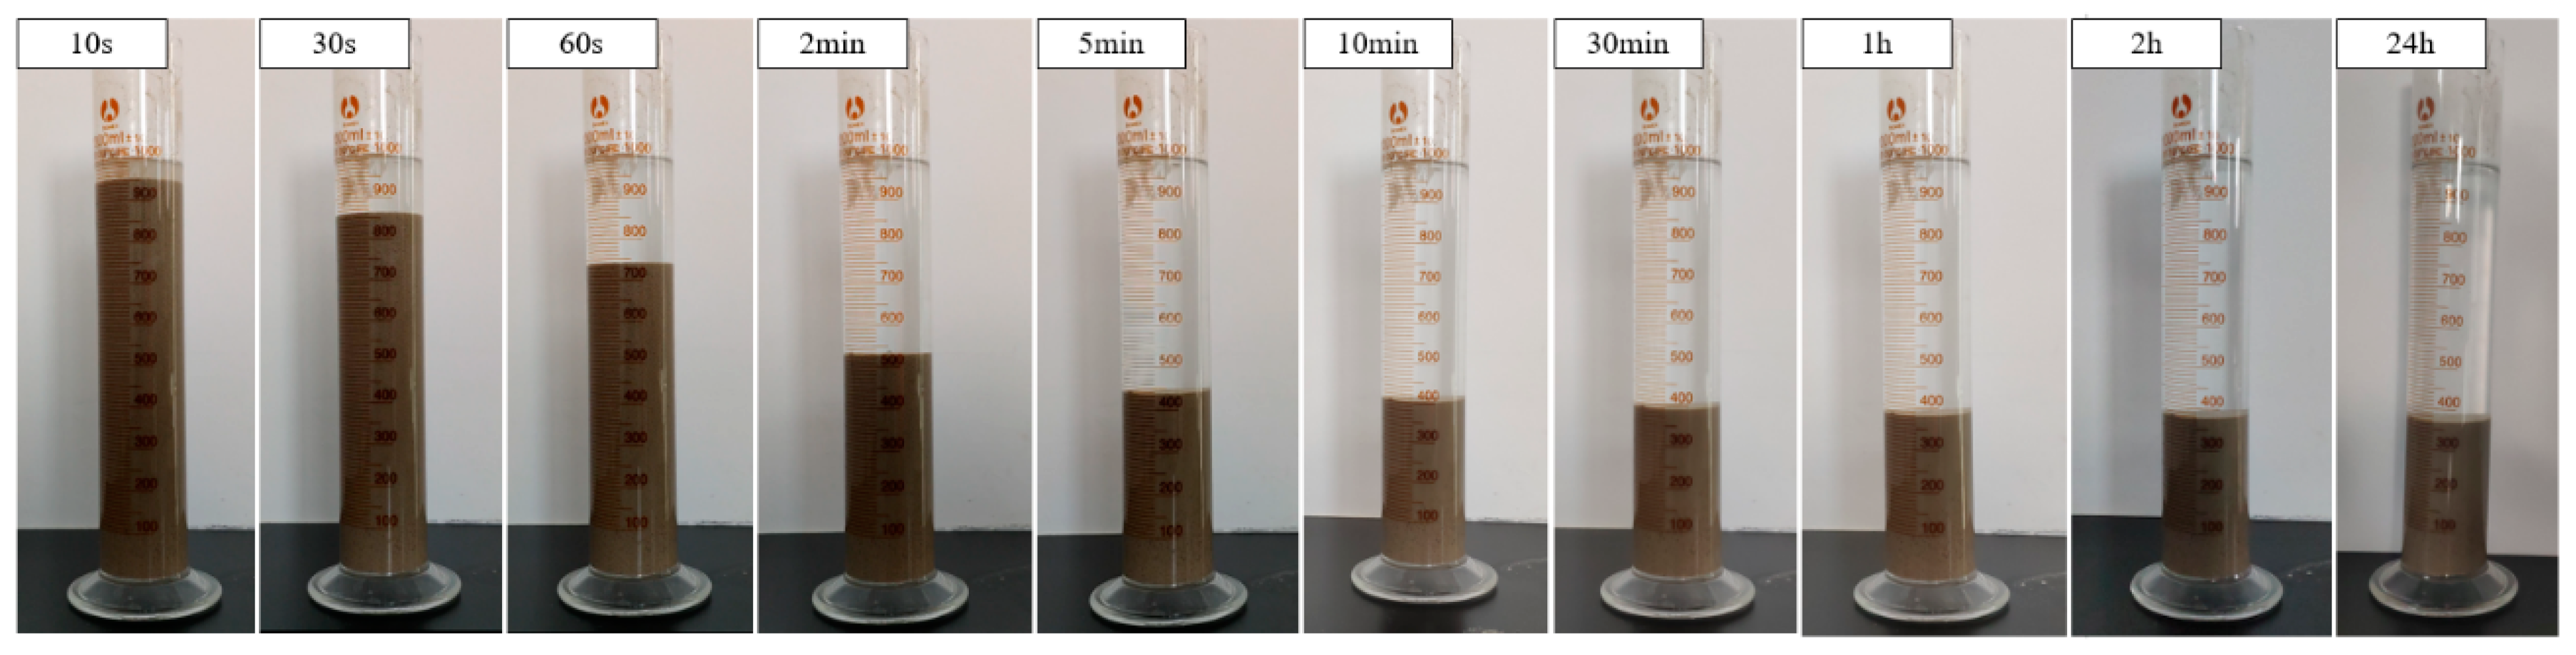
3.1. Flocculation Sedimentation Characteristics of Ultrafine Tailings

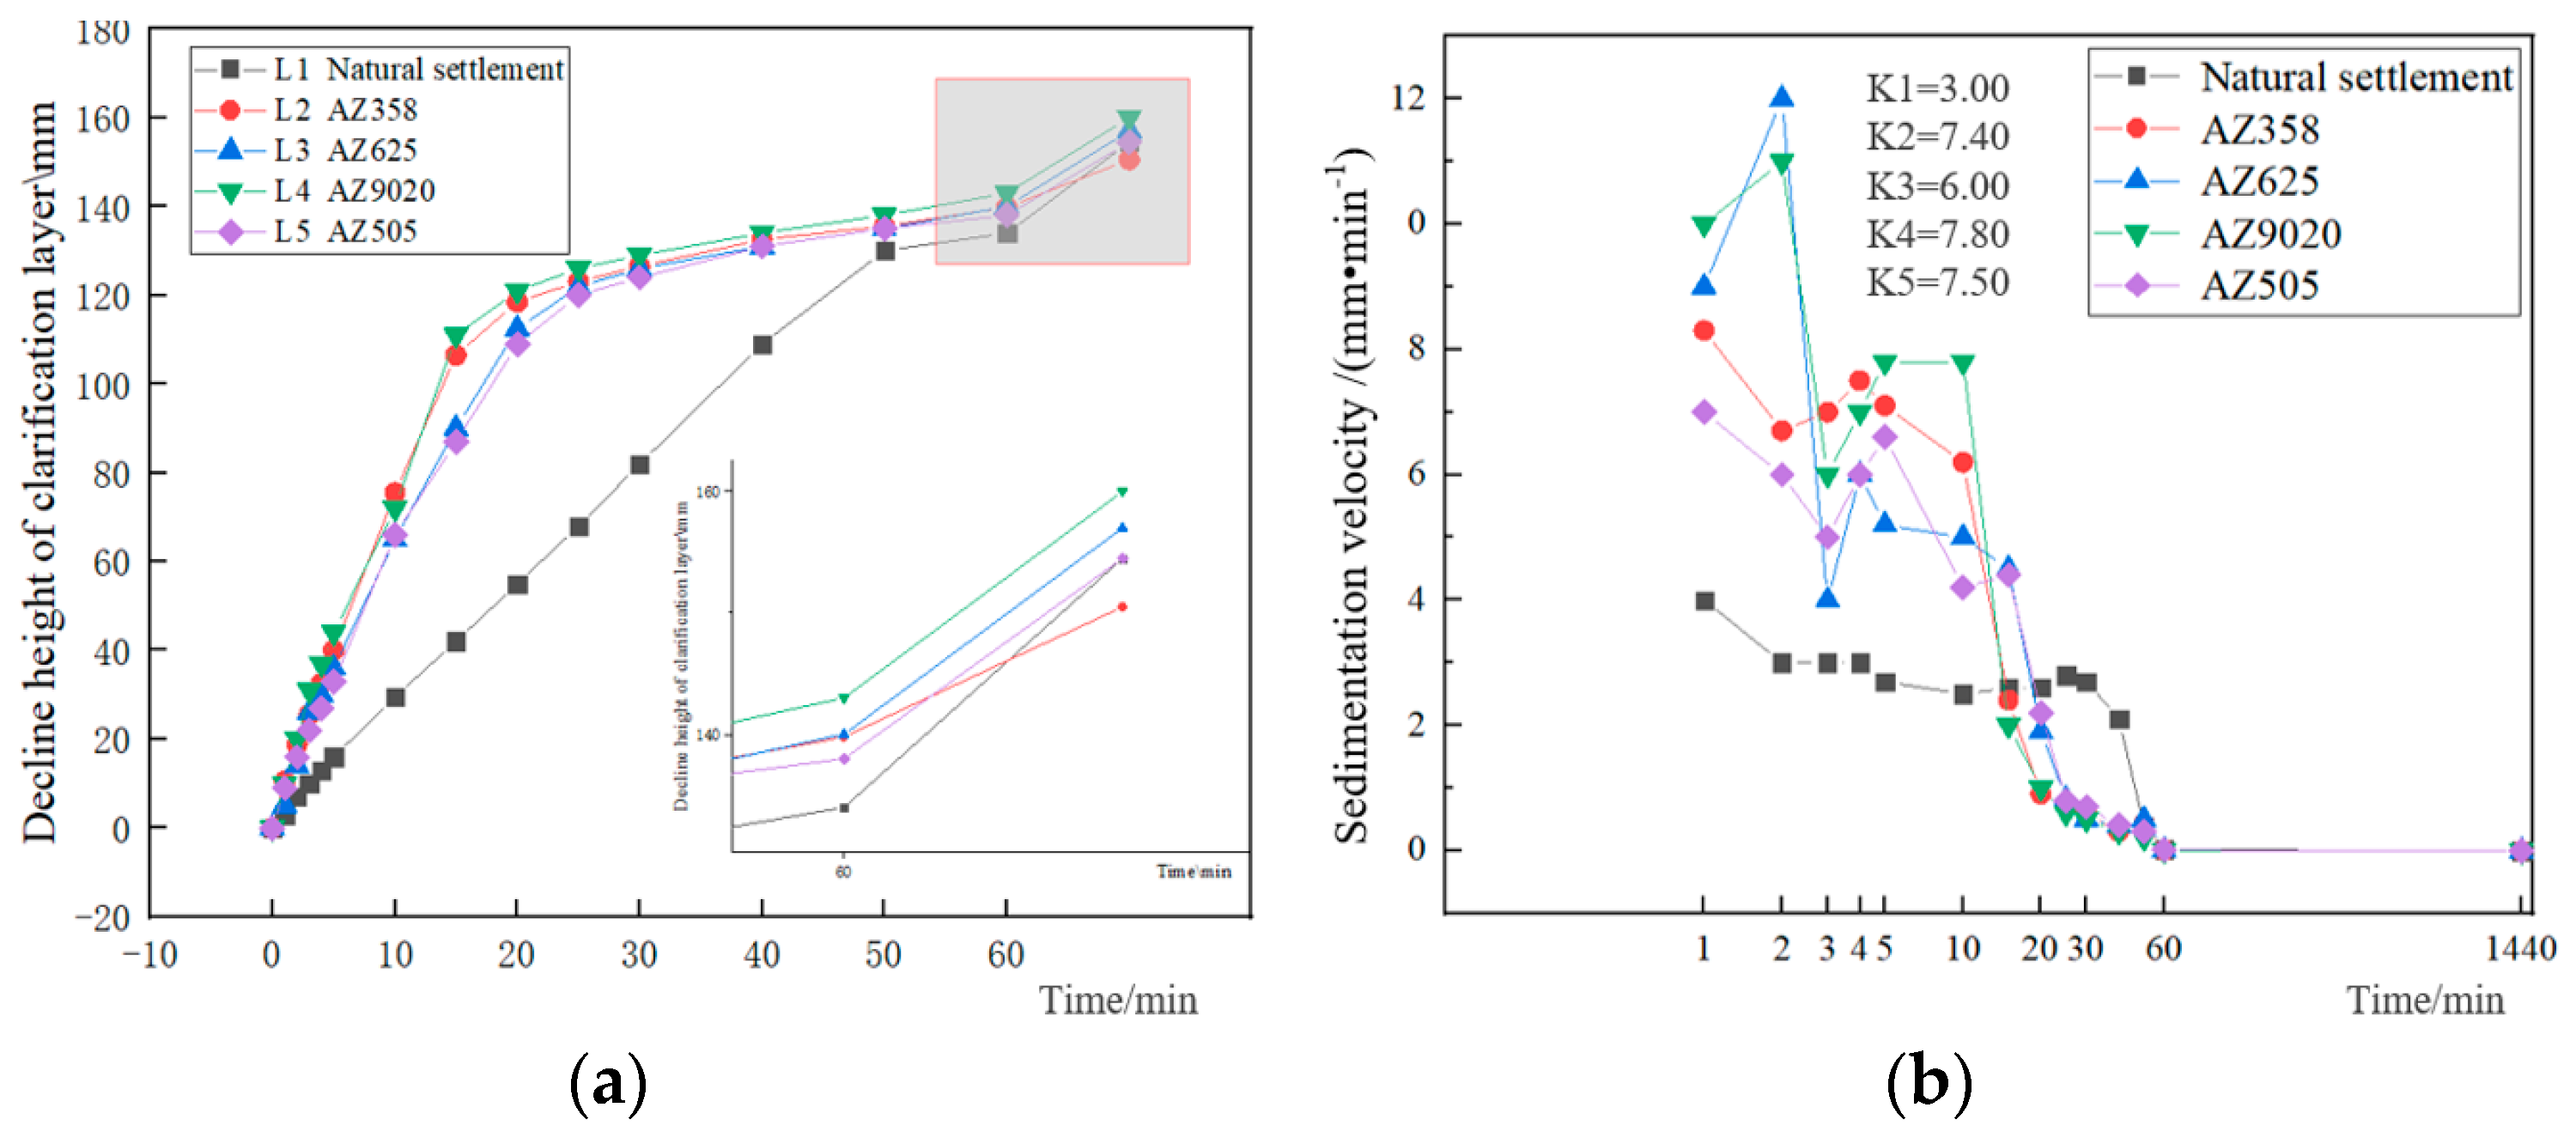
3.1.1. Analysis of the Influence of the Flocculant Type on the Settlement Effect

Figure 5a shows that the addition of a flocculant accelerates the sedimentation rate of the ultrafine tailings solution in the early stages (within 60 min), and the declining height of the clear layer of L4 is always lower than that of the four other groups (L1, L2, L3, and L5). The maximum difference is 80 mm. Figure 5b reveals that the curve of the average settling velocity experienced two peaks: the first peak appeared within the first 3 min, and the second peak appeared between 5 and 15 min. The calculation shows that the maximum settlement velocity of L4 is K4 = 7.80 mm/min, which is higher than that of the other groups. The limit concentrations of experimental groups L1, L2, L3, L4, and L5 after 24 h of sedimentation were 60%, 58.48%, 58.82%, 58.03%, and 58.59%, respectively, which met the mine-filling requirements for underflow concentrations. Experimental group L4 (AZ9020) generally showed the best reduction in the maximum settlement velocity and in the 1 h height of the clarification layer.

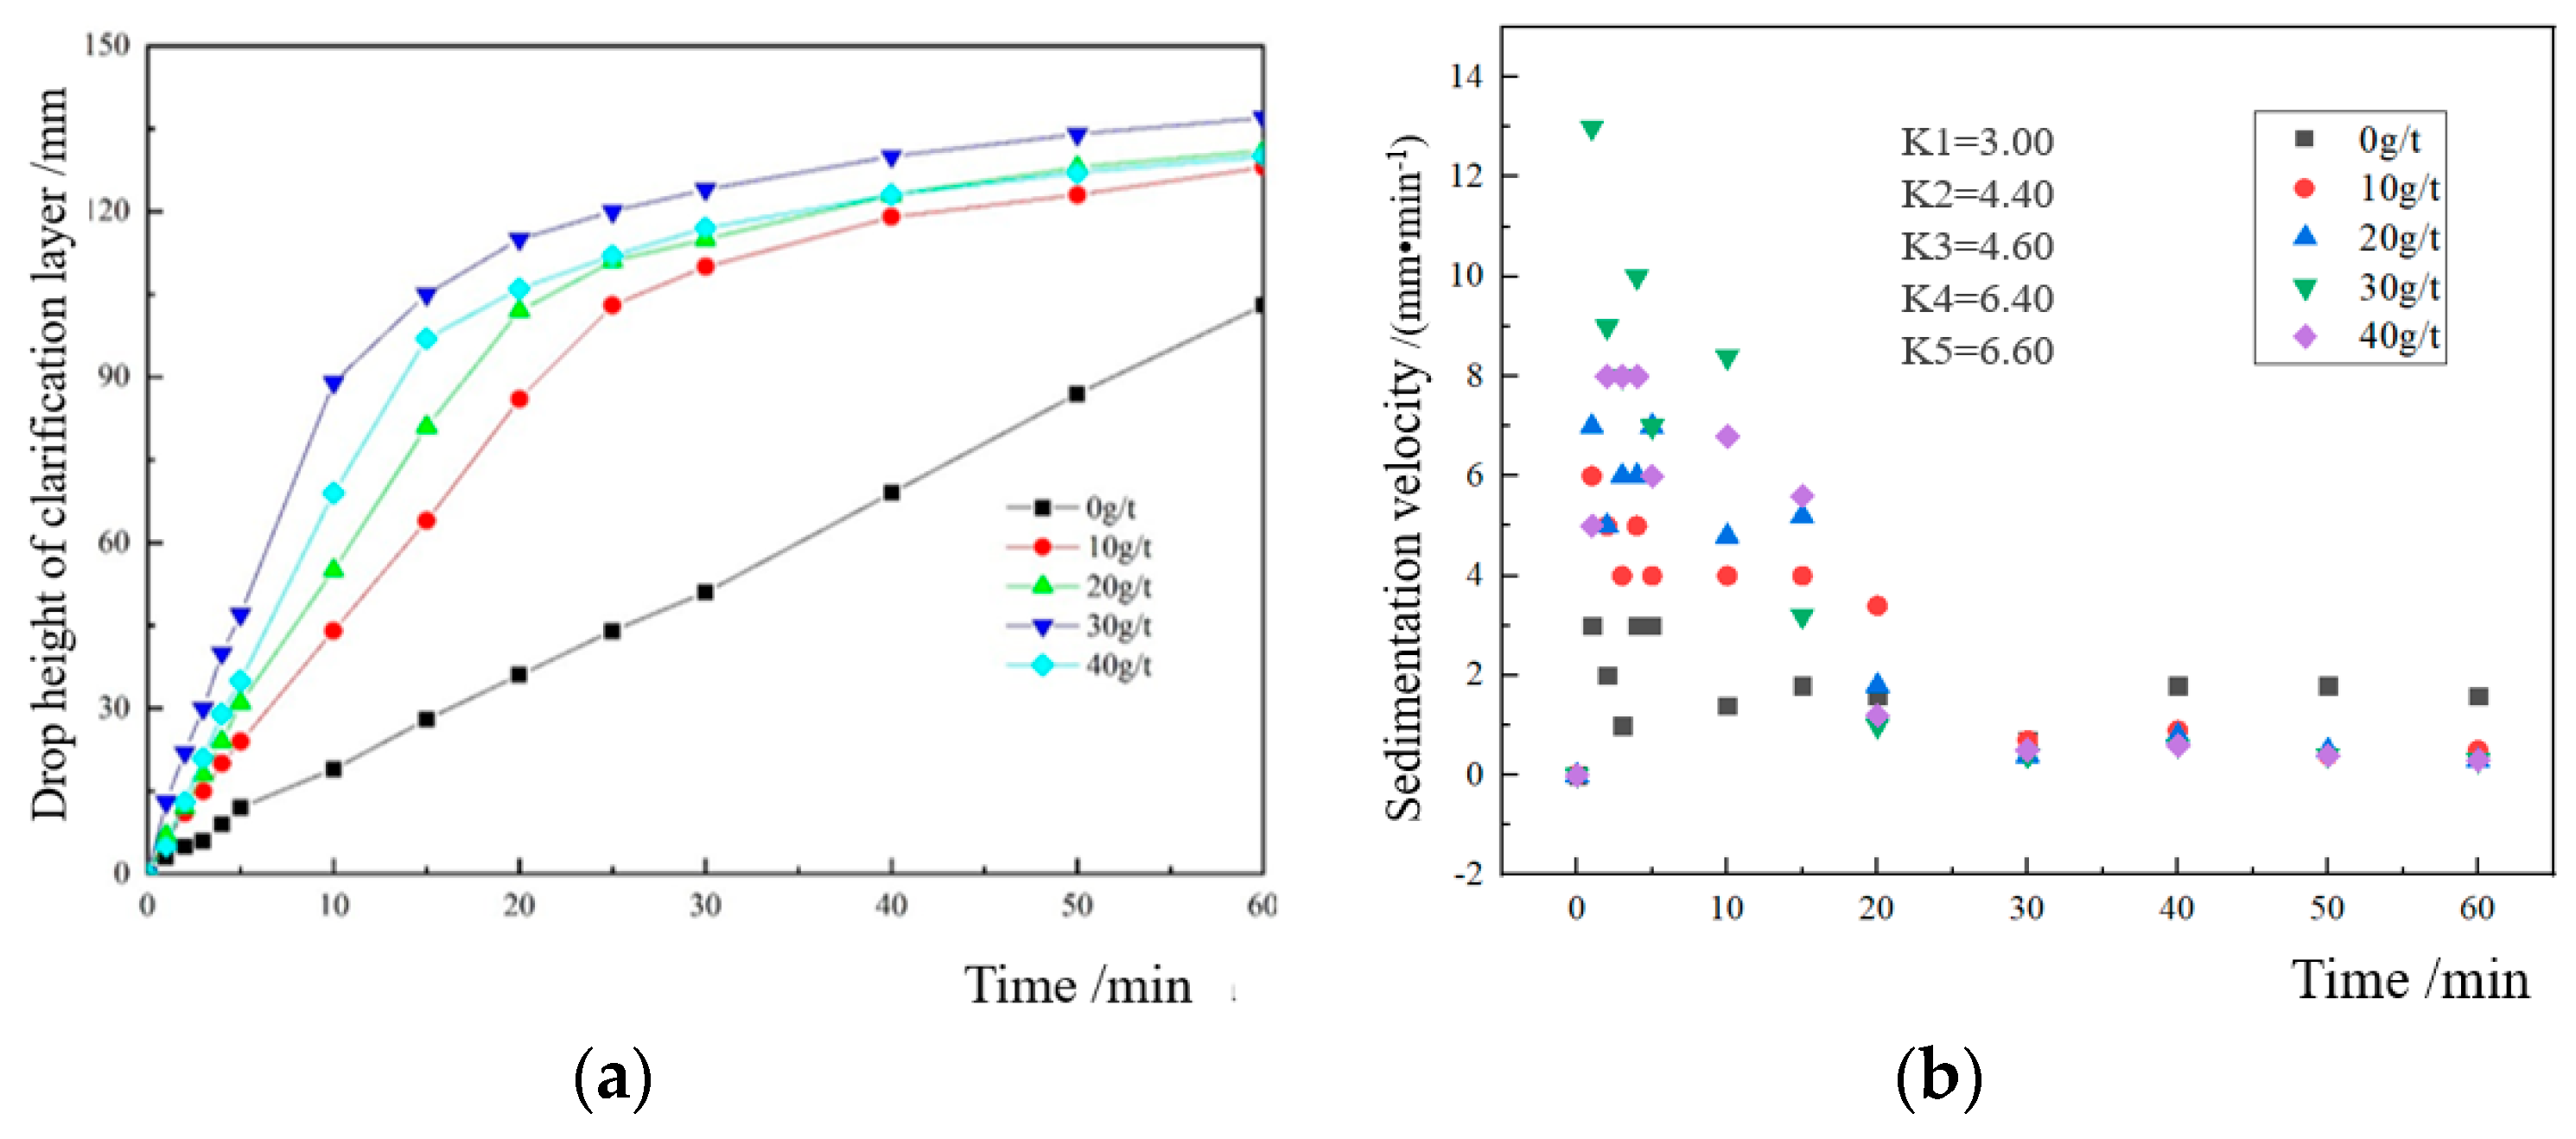
3.1.2. Analysis of the Influence of the Flocculant Unit Consumption on the Settlement Effect

Figure 6a shows that the height of the clarified layer of the tailings solution at first increased and then simultaneously decreased when the unit consumption of the flocculant increased. The unit consumption of experiment D3 was 30 g/t, representing the best consumption that was reached. Figure 6b indicates that the maximum settlement velocity first increased and then decreased as the single consumption of the flocculant increased. The single consumption in experiment D4 was 30 g/t, and the maximum settlement velocity was 8.20 mm/min.

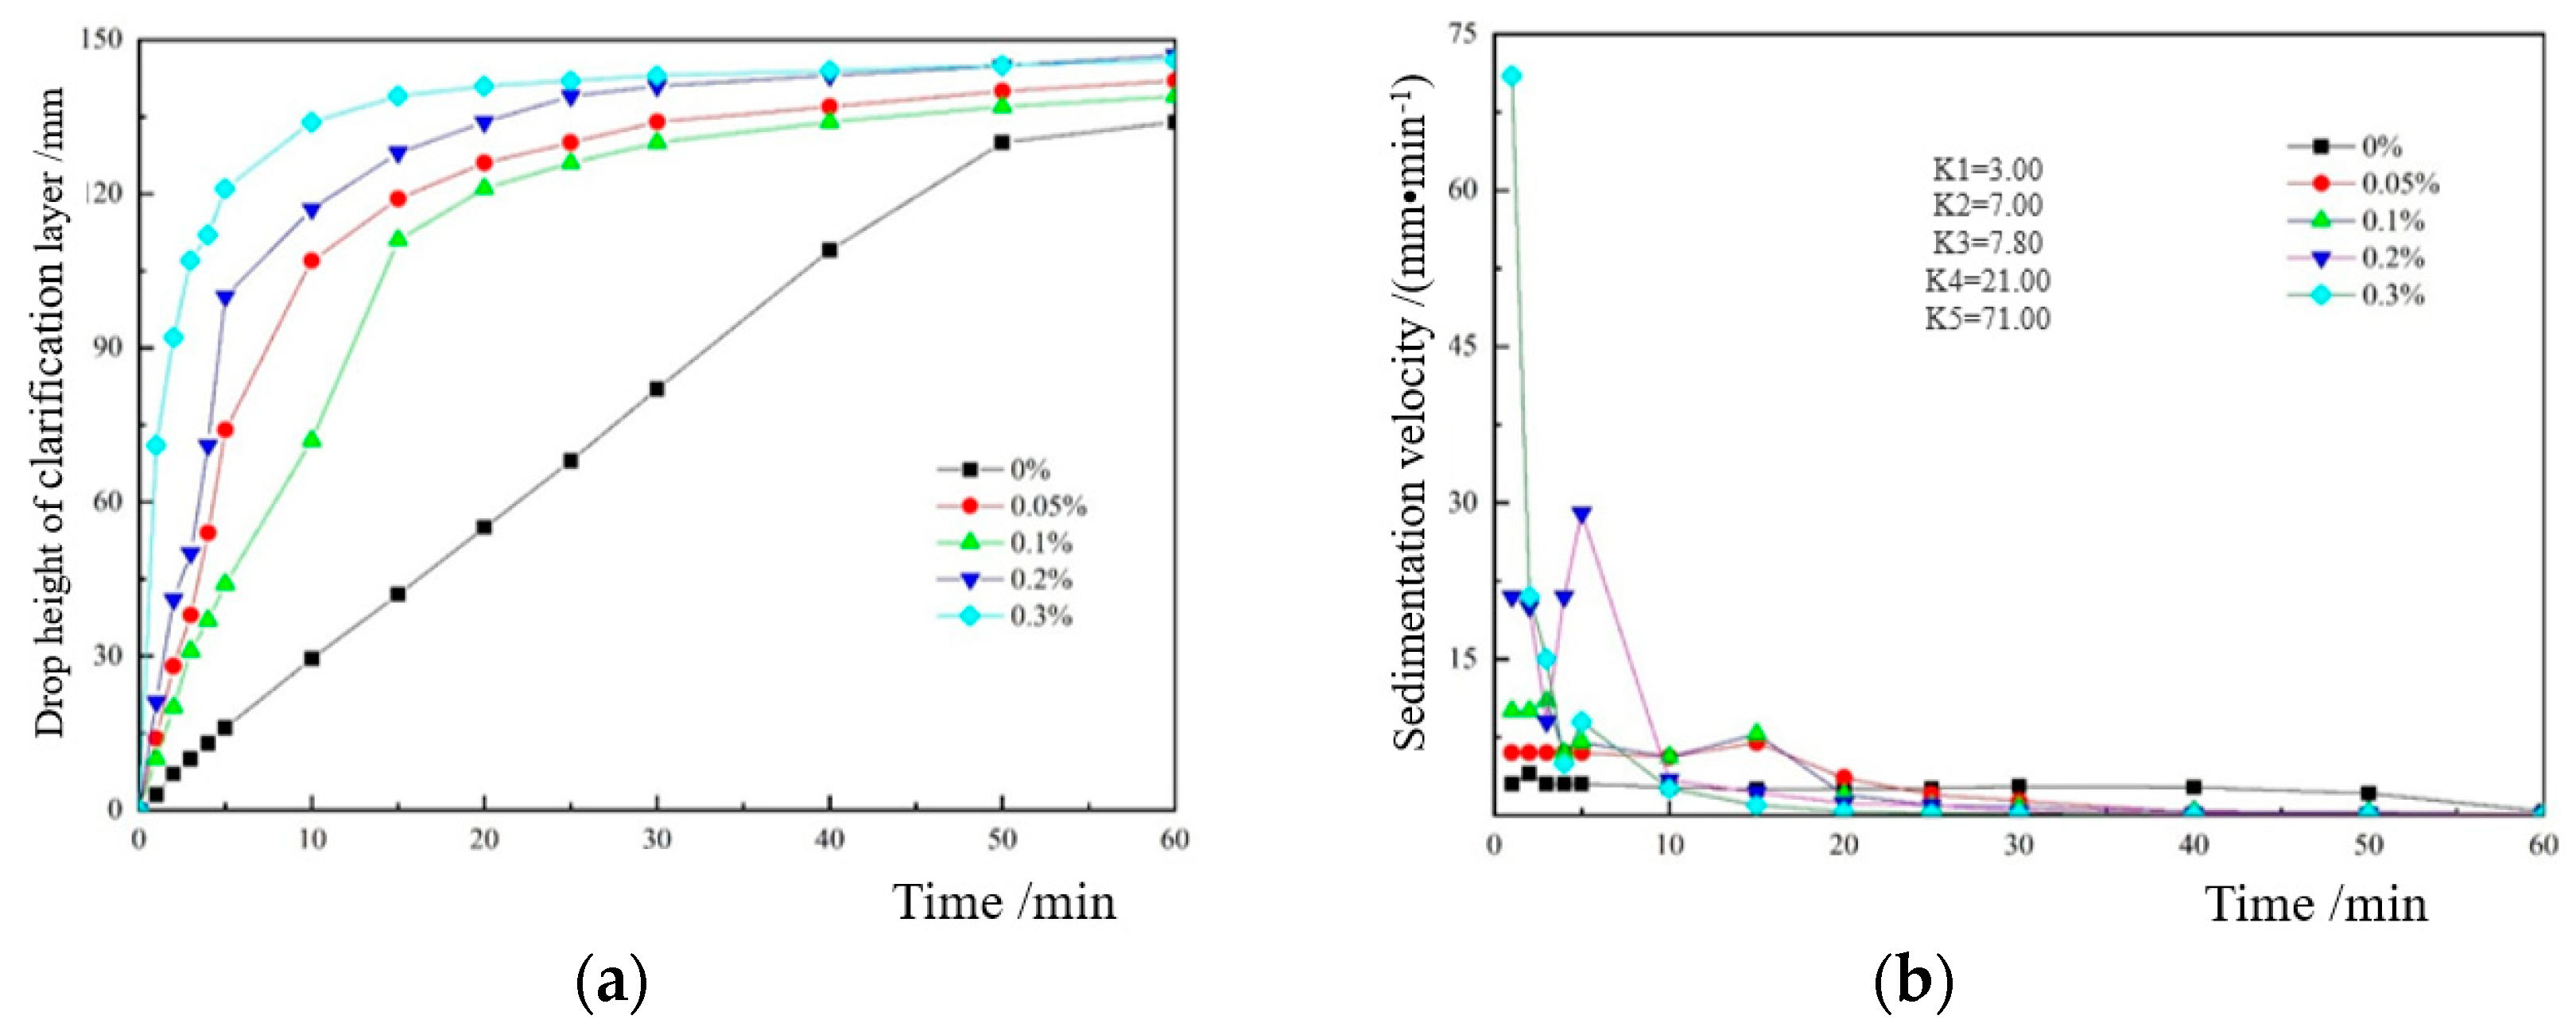
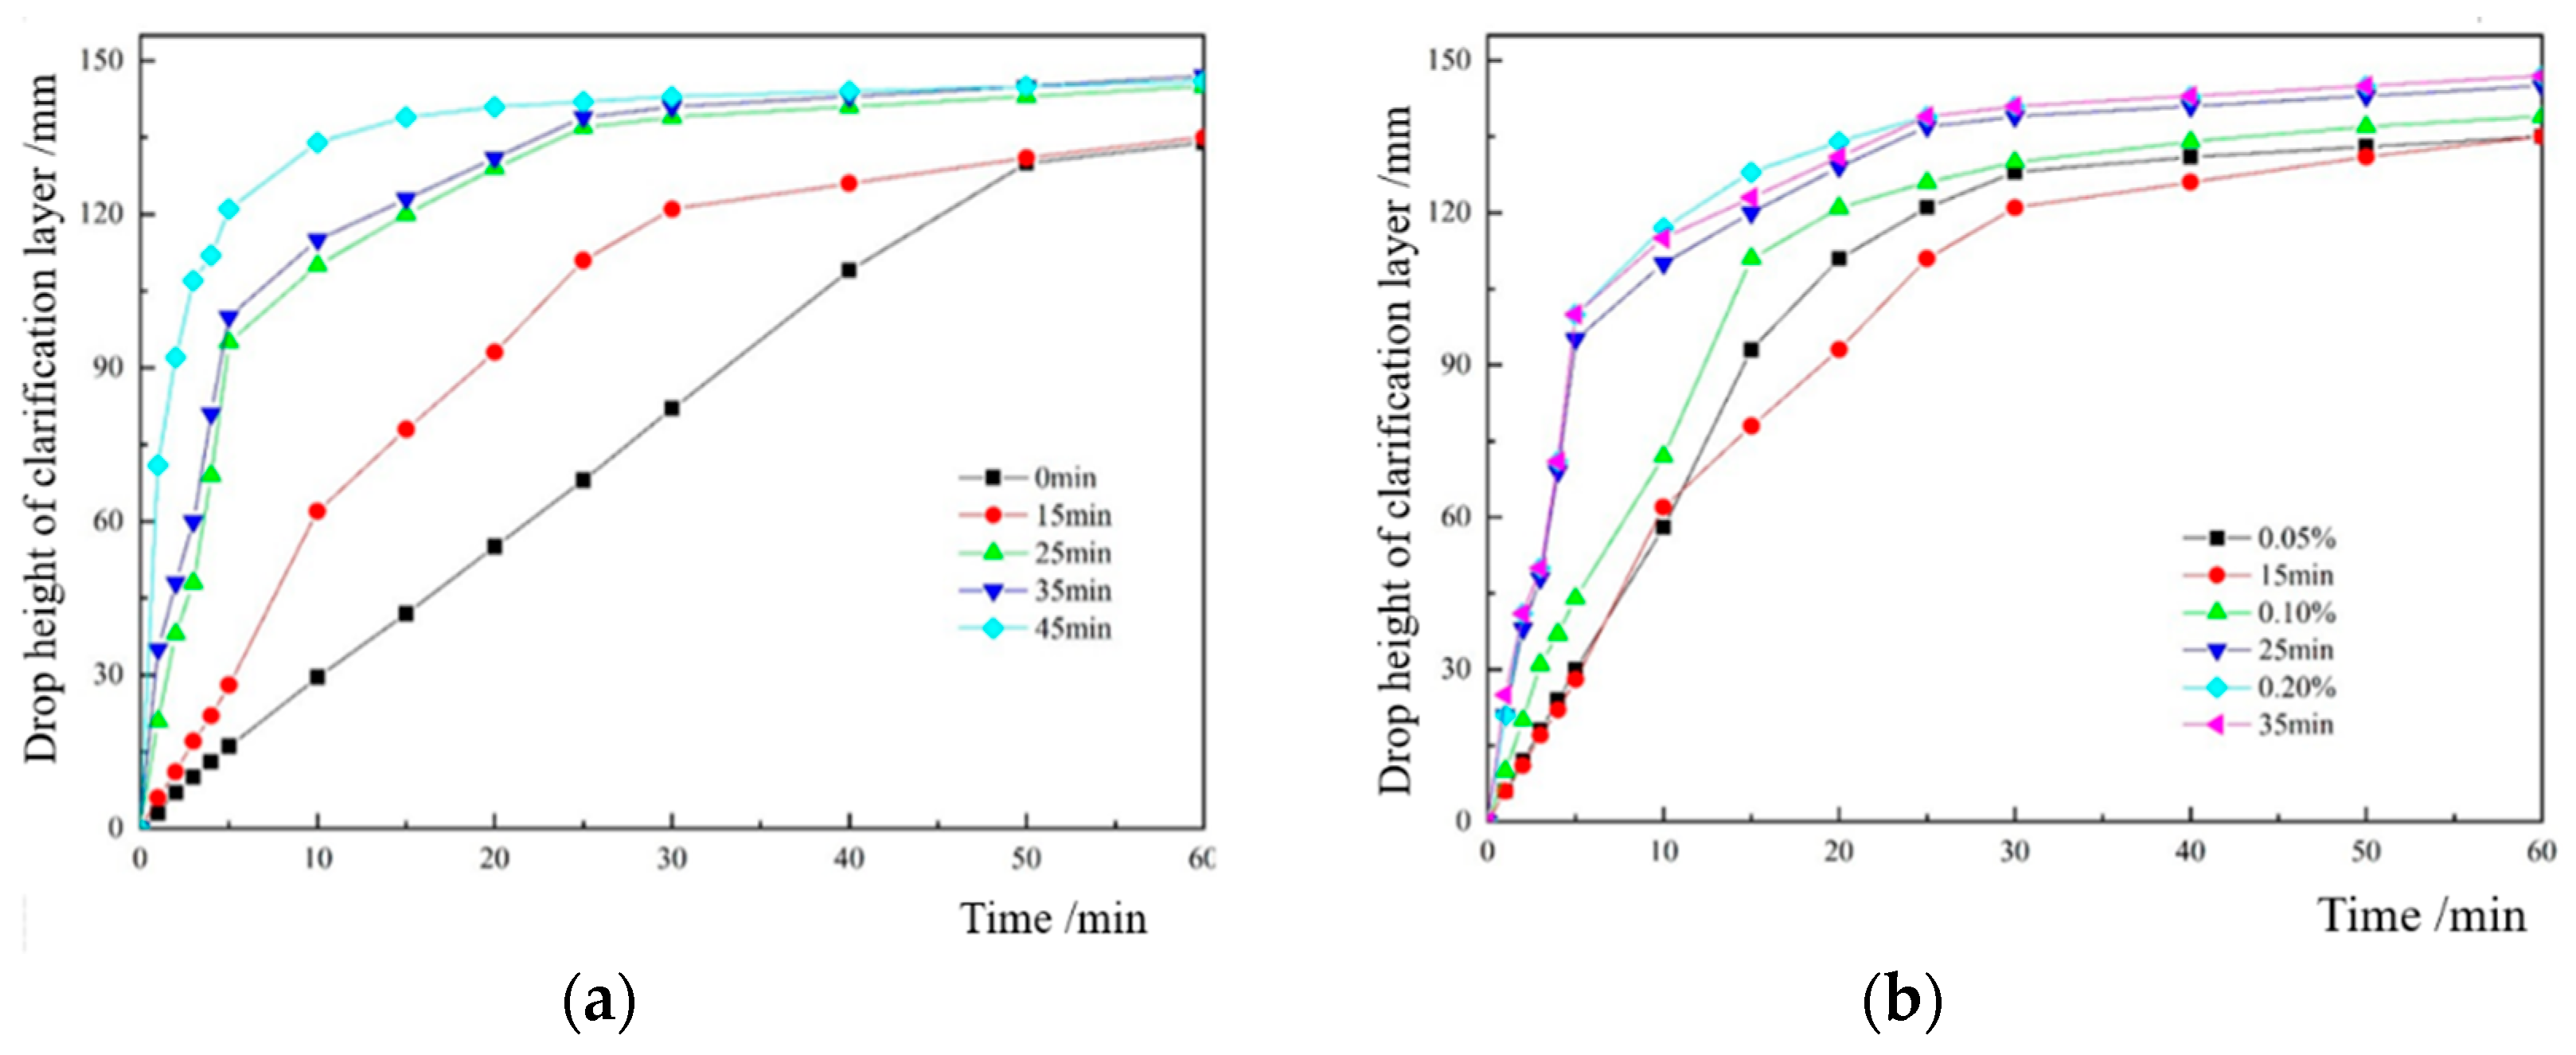
3.1.3. Analysis of the Influence of Flocculant Concentration on the Sedimentation Effect

Figure 7a shows that the clarification layer height increases at the initial sedimentation stage (0−10 min) as the concentration of the flocculant solution rises. The height of the clarification layer is the largest at the initial sedimentation stage, when the experimental N5 concentration is 0.3%, resulting in the best flocculation sedimentation effect. Figure 7b shows that the average sedimentation velocity at each concentration reached its maximum between 5 and 10 min, and the maximum appeared when the experimental N5 concentration was 0.3%, showing a height of 71.00 mm/min.

3.1.4. Analysis of the Influence of Flocculant Stirring Time on the Settlement Effect of Ultrafine Tailings

Flocculant AZ9020 was chosen under the 0.3% concentration solution and 30 g/t unit consumption conditions (step 4). Figure 8a shows that the height of the clarified layer increased under the same settling time conditions even though the stirring time increased. Experiments T1, T2, and T3 revealed the presence of transparent floccules of undissolved flocculant that were visible to the naked eye, indicating that the flocculant was only partially dissolved in the water at this time and that the concentration did not reach 0.3%. Figure 8b shows that the clarified liquid height curve is close to the curve when the flocculant concentration is 0.05% when the stirring time is 15 min and that the curve is close to the curve when the concentration is 0.20% and at the stirring times of 25 and 35 min. To achieve an improved settling effect, the stirring time should be more than 45 min.

3.2. Microscopic Characteristics of Floc Structure of Ultrafine Tailings

In order to study the flocculation effect of different flocculants from the microscopic point of view further, nuclear magnetic resonance analysis was used to observe all of the tailings flocculant solutions formed by the different flocculants and to analyze the porosity and other microscopic parameters of the flocculant solutions.

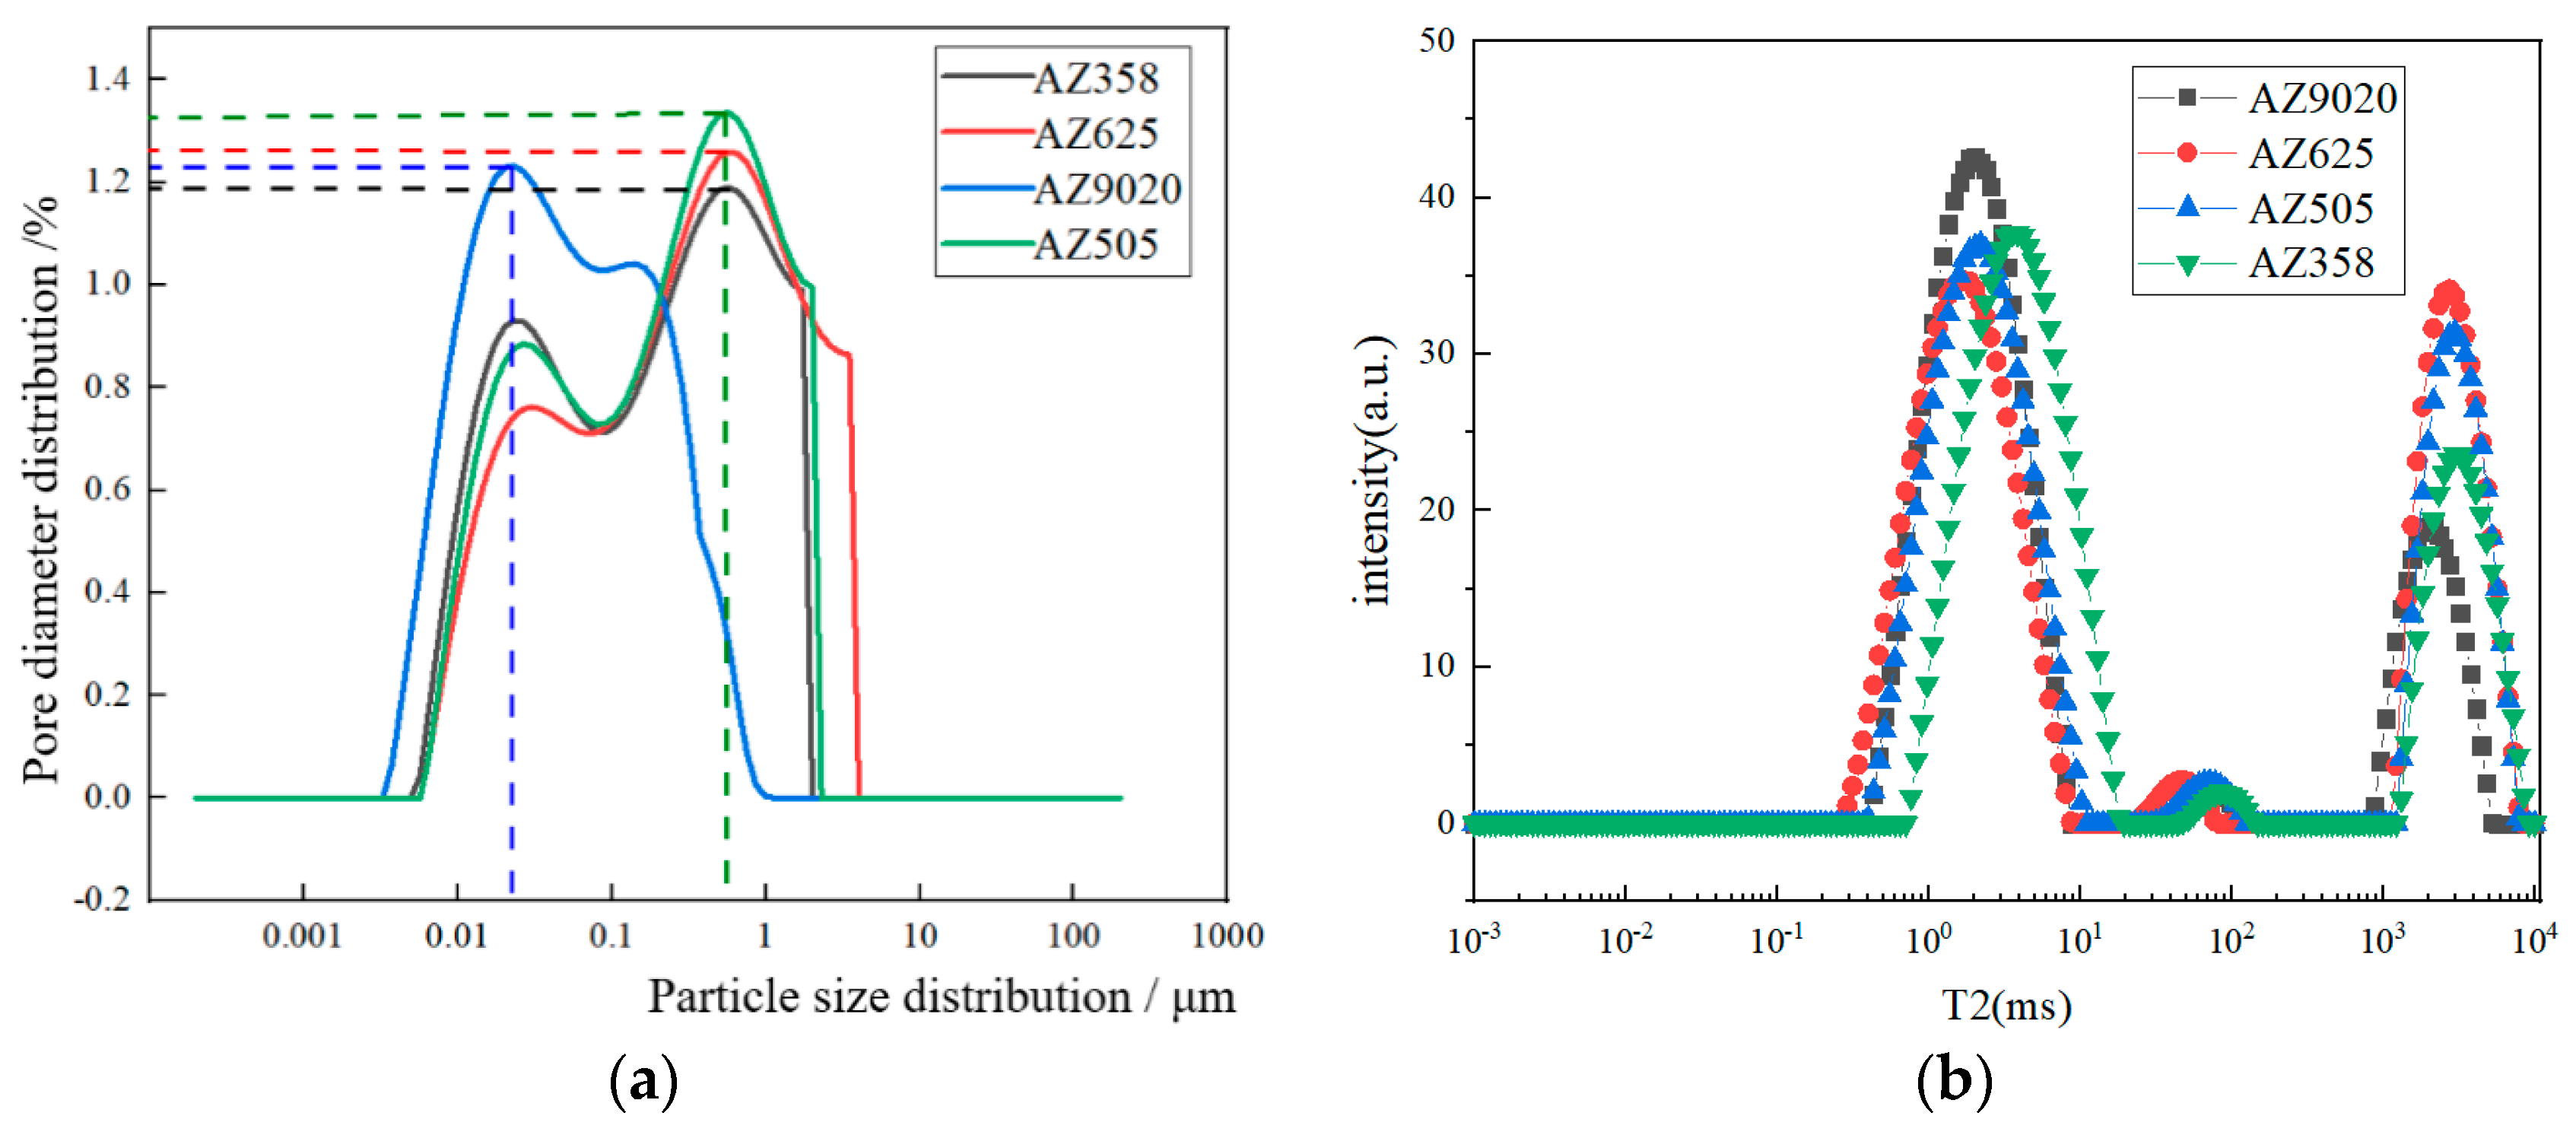
3.2.1. Analysis of Pore Distribution Characteristics of Ultrafine Tailing Flocculent Solution

The pore size distribution curve of the flocculation solution under the four flocculants is shown in Figure 9a based on the NMR detection and analysis. The spectrum is shown in Figure 9b.
Figure 9 reveals that the pore size distribution of the floc solution under the AZ359, AZ625, and AZ505 flocculants is only slightly different. The main peaks are at the same position, and the width of the pore size distribution is insignificantly different. The two main peaks appear at 0.01−0.1 μm. The main peak at 0.1−1 μm and the width of the pore size distribution are both large, indicating that the flocs with a pore size larger than 0.1 μm account for a substantial proportion and that the size of the floc structure is also large.
The pore size distribution of the AZ9020 flocculant was significantly different from that of the other flocculants. The two main peaks were located at 0.01 and 0.1 μm. The largest main peak appeared at 0.01 μm, and the pore size distribution between 0.01 and 0.1 μm was also large, indicating that the flocs with a pore size smaller than 0.1 μm accounted for a substantial proportion. The results show that the flocs were small in size and that the whole solution was homodispersed. Solutions that were formed by adding the flocculants had a certain proportion of particles with a small pore size.
Research shows that the tightness of the material structure is negatively related to the porosity [22]; that is, a smaller porosity leads to a tighter material structure. The porosities of the flocculation solution corresponding to flocculants AZ358, AZ625, AZ9020, and AZ505 are 35.96%, 38.84%, 32.65%, and 37.37%, respectively. Among these solutions, the porosity of the flocculation solution corresponding to flocculant AZ9020 is the smallest. Flocculant AZ9020 has the best flocculation and sedimentation effects under the tailings concentration, the amount of additional flocculant, and the concentration.

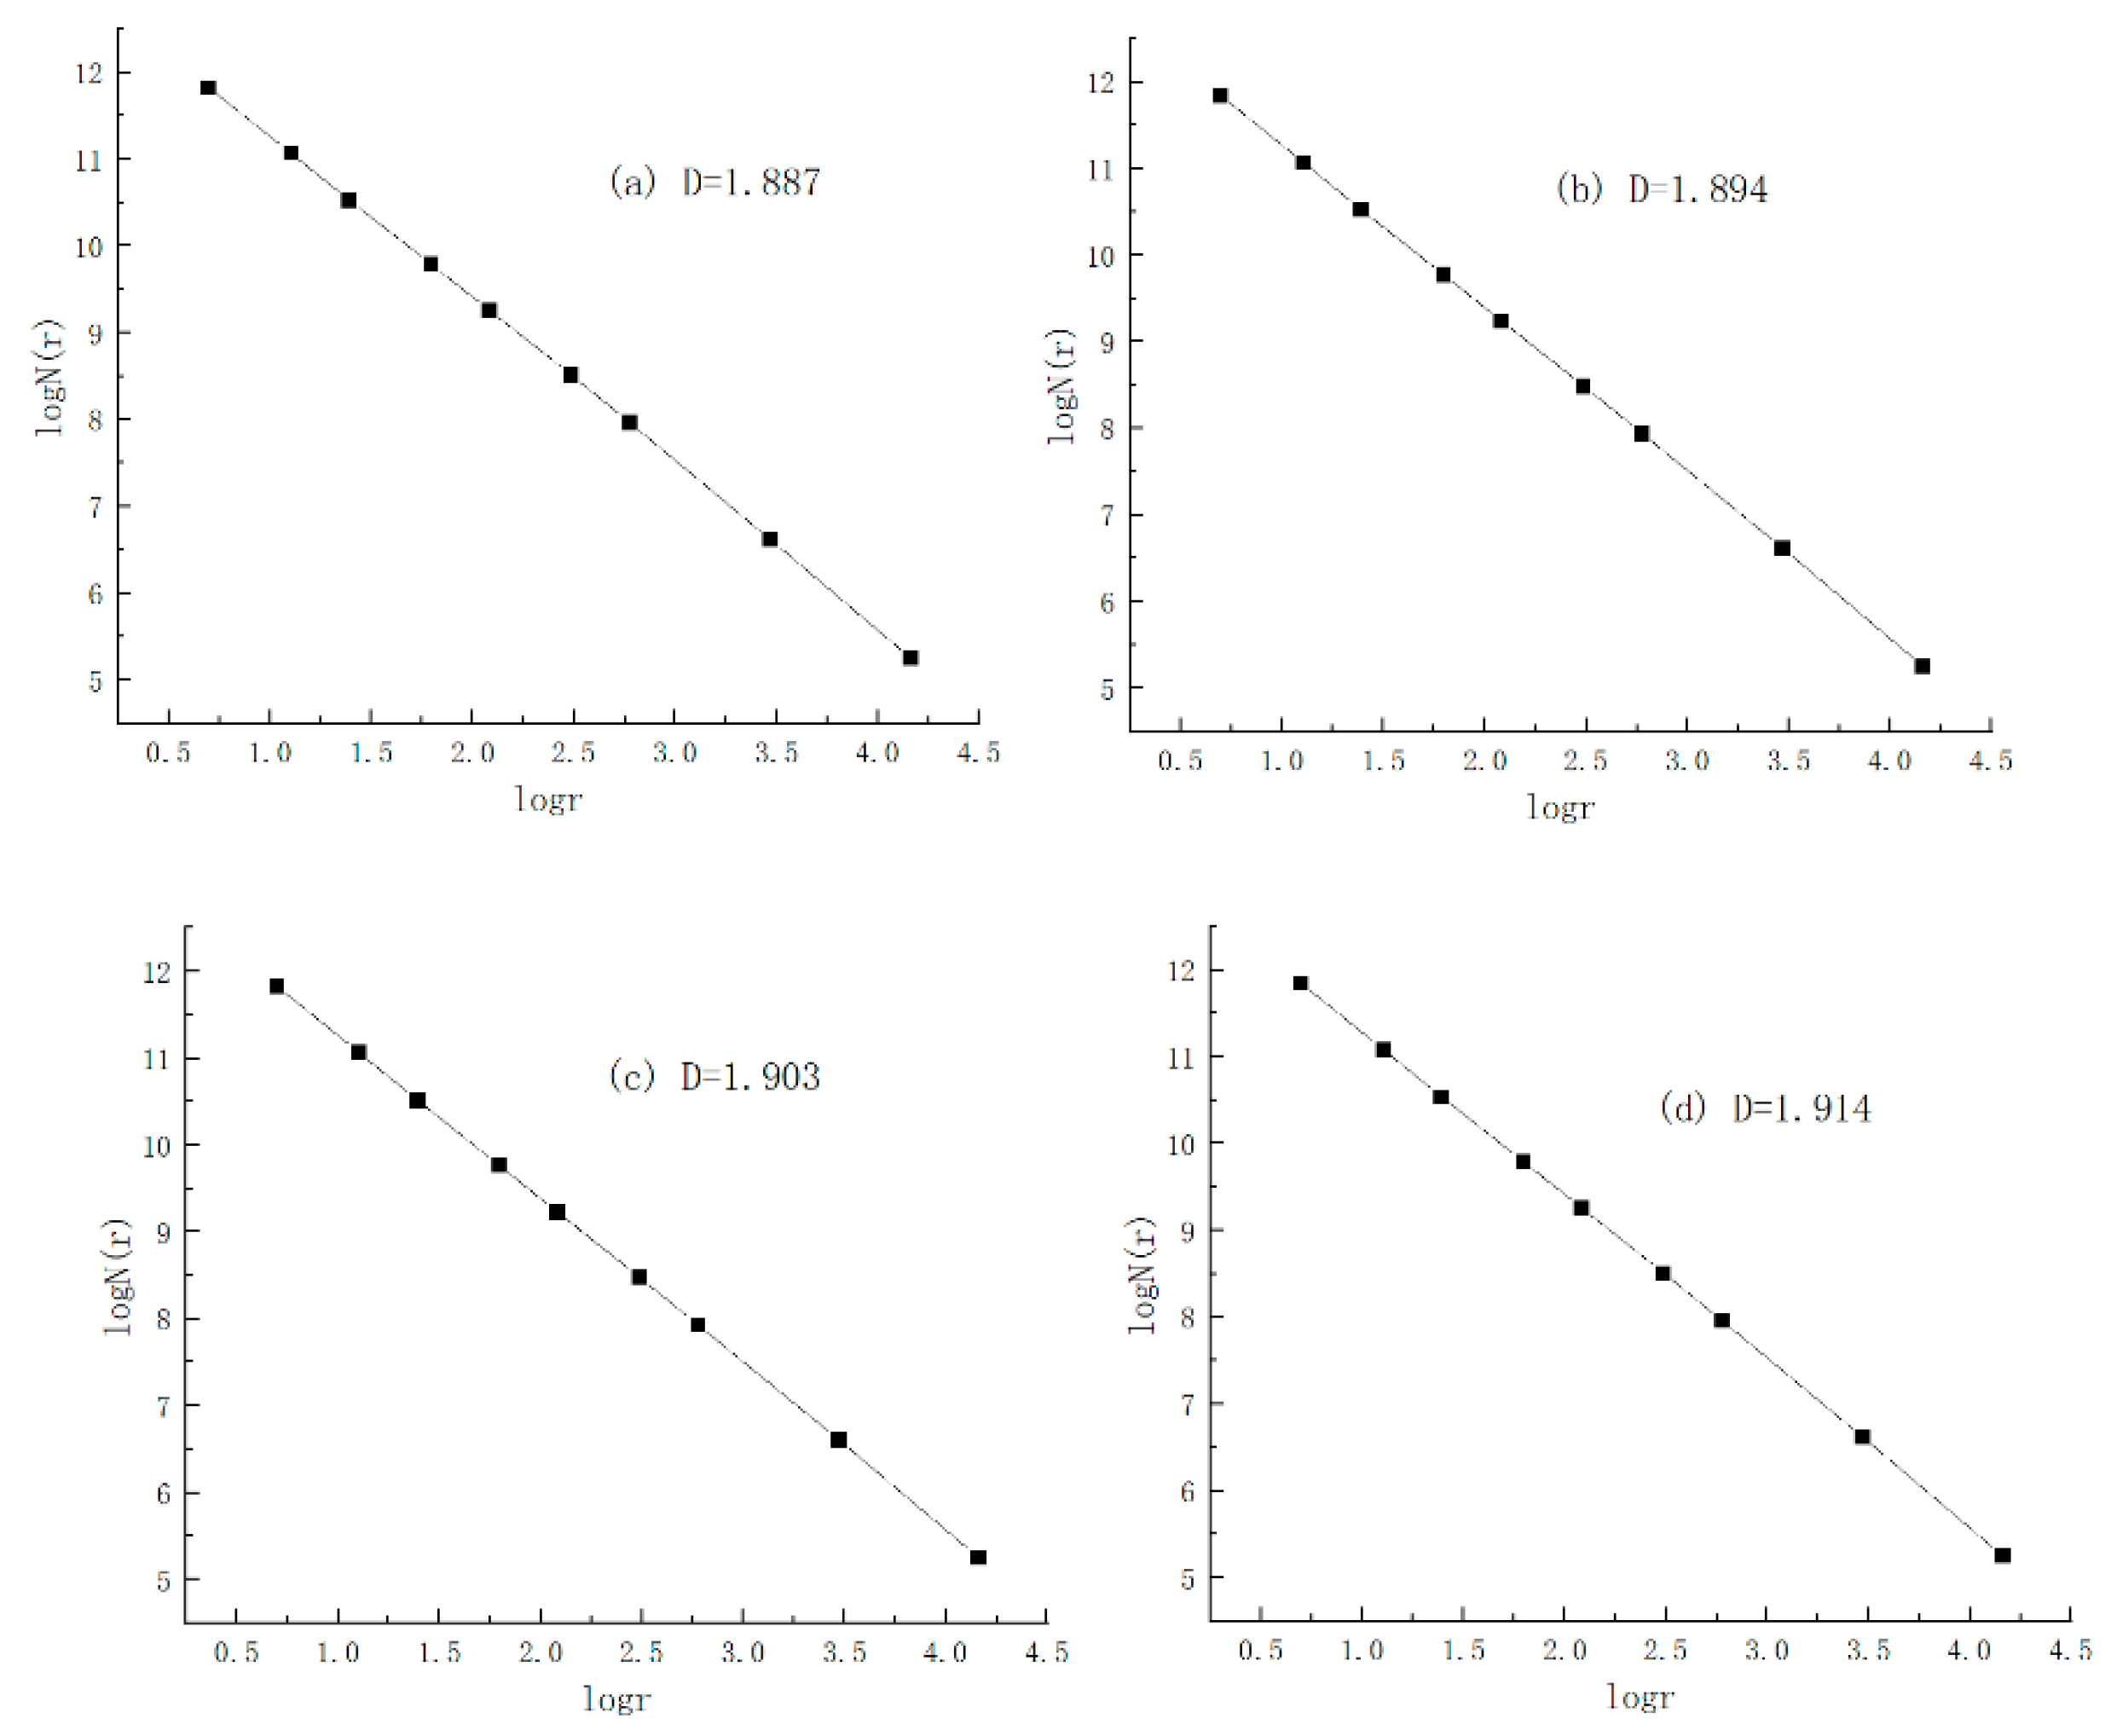
3.2.2. Fractal Characteristics of Floc Structure of Ultrafine Tailings

The SEM images are shown in Figure 10 and were obtained through the scanning experiment ① using the electron microscope. The dark parts of the figure represent the pores, and the other parts represent the floc structure.
Ultrafine tailings flocculation is under the action of Brownian motion and turbulence, in which the tailings particles collide with the flocculant and combine to form irregular clusters with fractal characteristics. The fractal dimension is important to characterize the fractal characteristics of the flocculation index, which can quantitatively describe the floc structure [23,24]. Take N (N = 1, 2, 3, ...) squares with side length r to divide the image. The divided areas do not overlap, and the area containing the flocs is denoted as N(r). Formula (1) is then established as follows:
N ( r ) = 1 / r D
Formula (2) is obtained after taking the logarithm:
D = lg N ( r ) lg r
where D represents the fractal dimension.
The quantitative analysis based on the SEM scanning images reveals that image binarization work is the basis for obtaining fractal analysis. Binarization is also called threshold segmentation. Binarization is the process of setting the pixels of an image to 0 or 255 and then presenting the entire image with a clear black and white effect. Thus, binarization is essentially the process of classifying each pixel. Assuming that the size of the SEM picture is M × N, f(x, y) represents the gray value of the pixel in the (x−1)th row and (y−1)th column of the image, where 0 ≤ x ≤ M, 0 ≤ y ≤ N, and x, y are integers. The principle of the gray-scale image binarization process is then presented as follows:
f ( x , y ) = { 1 , f ( x , y ) T 0 , o t h e r s
where T refers to the threshold. All pixels in the overall image are either black or white after the binarization process. The binarization of the image markedly reduces the amount of data in the image, thus making the contour of the target prominent. Figure 11 shows the binarized image obtained after processing the SEM image, and Figure 12 reveals the obtained fractal characteristic curve.
The calculated fractal dimensions of the samples under the four flocculants are 1.887, 1.894, 1.903, and 1.914. The largest fractal dimension indicates the compact flocs and the large molecular weights of the flocculants, which are conducive to rapid sedimentation from the water. A small particle spacing inside the flocs results in substantial differences between the densities of the flocs and the liquid, and large sedimentation speeds facilitate improved flocculation effects [25]. The fractal theory indicates that the order of the flocculation effects of the four flocculants is as follows: AZ9020 > AZ625 > AZ505 > AZ358. Flocculant AZ9020 has the best flocculation and sedimentation effects for ultrafine tailings.

3.3. Microscopic Characteristics of Floc Structure of Ultrafine Tailings

In this experiment, scanning electron microscopy was used to observe the different positions of the whole tailings floc solution formed by the same flocculant (AZ9020) to analyze the spatial morphological characteristics and microscopic parameters of the floc structure.

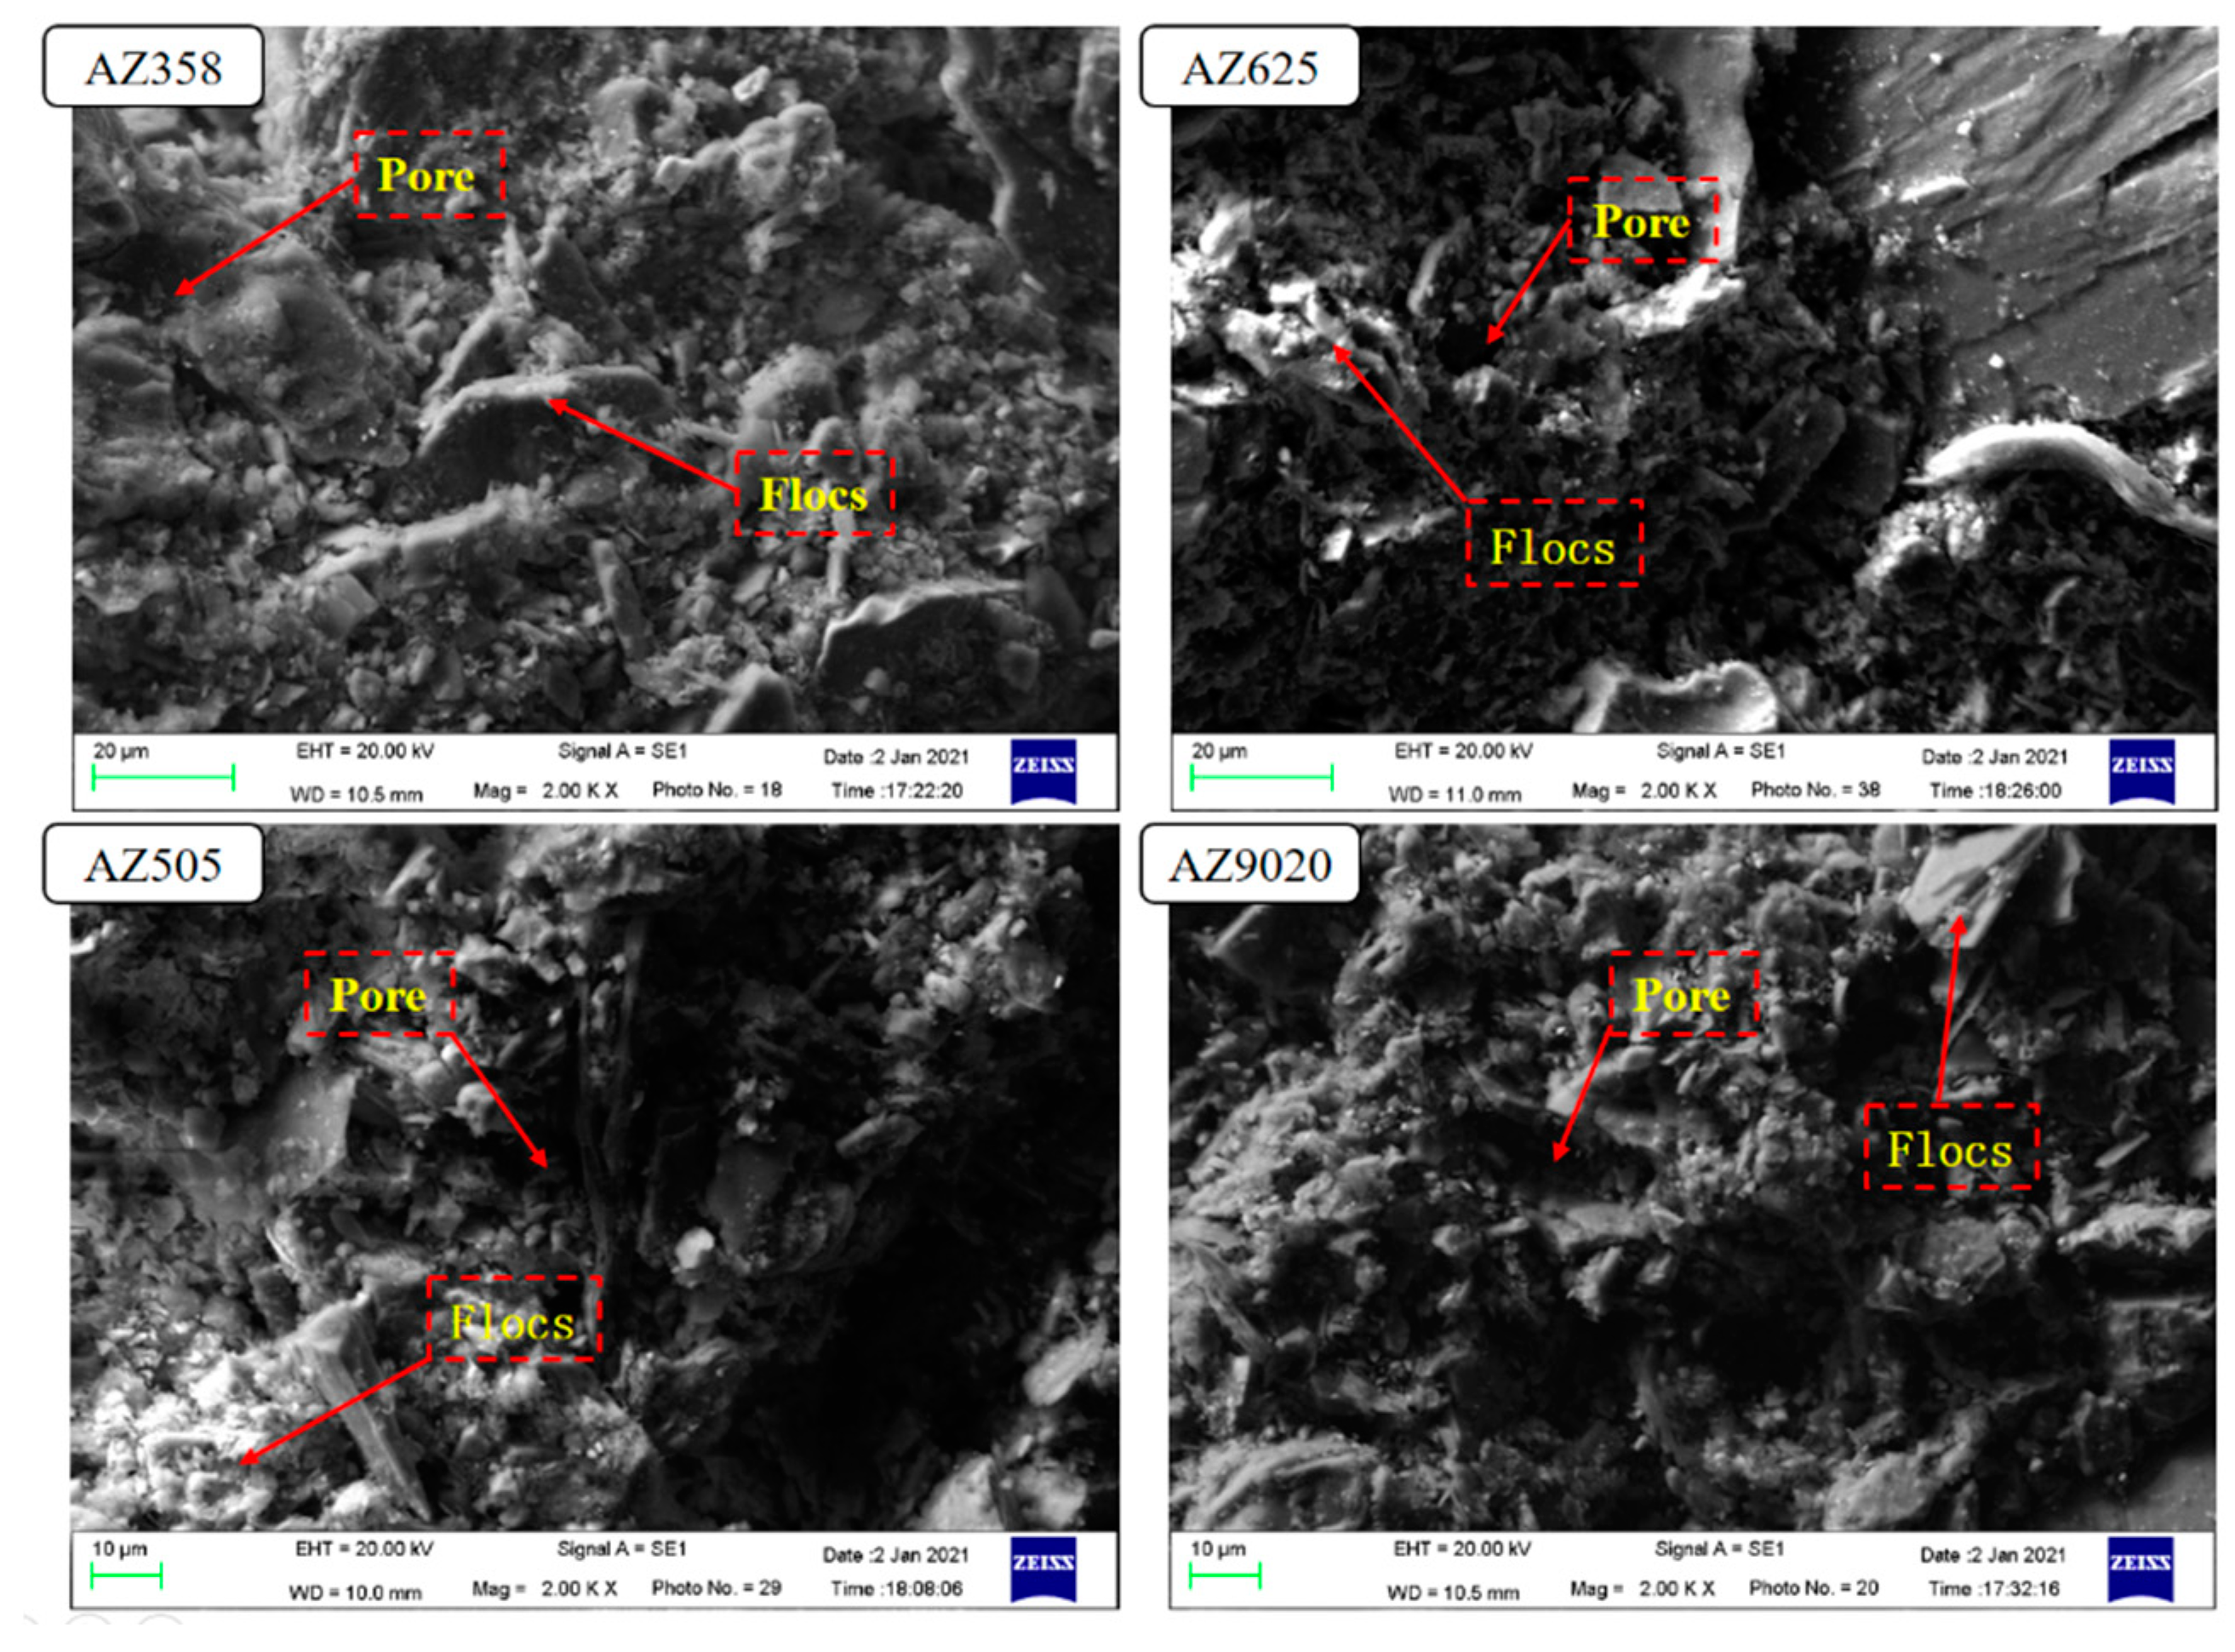
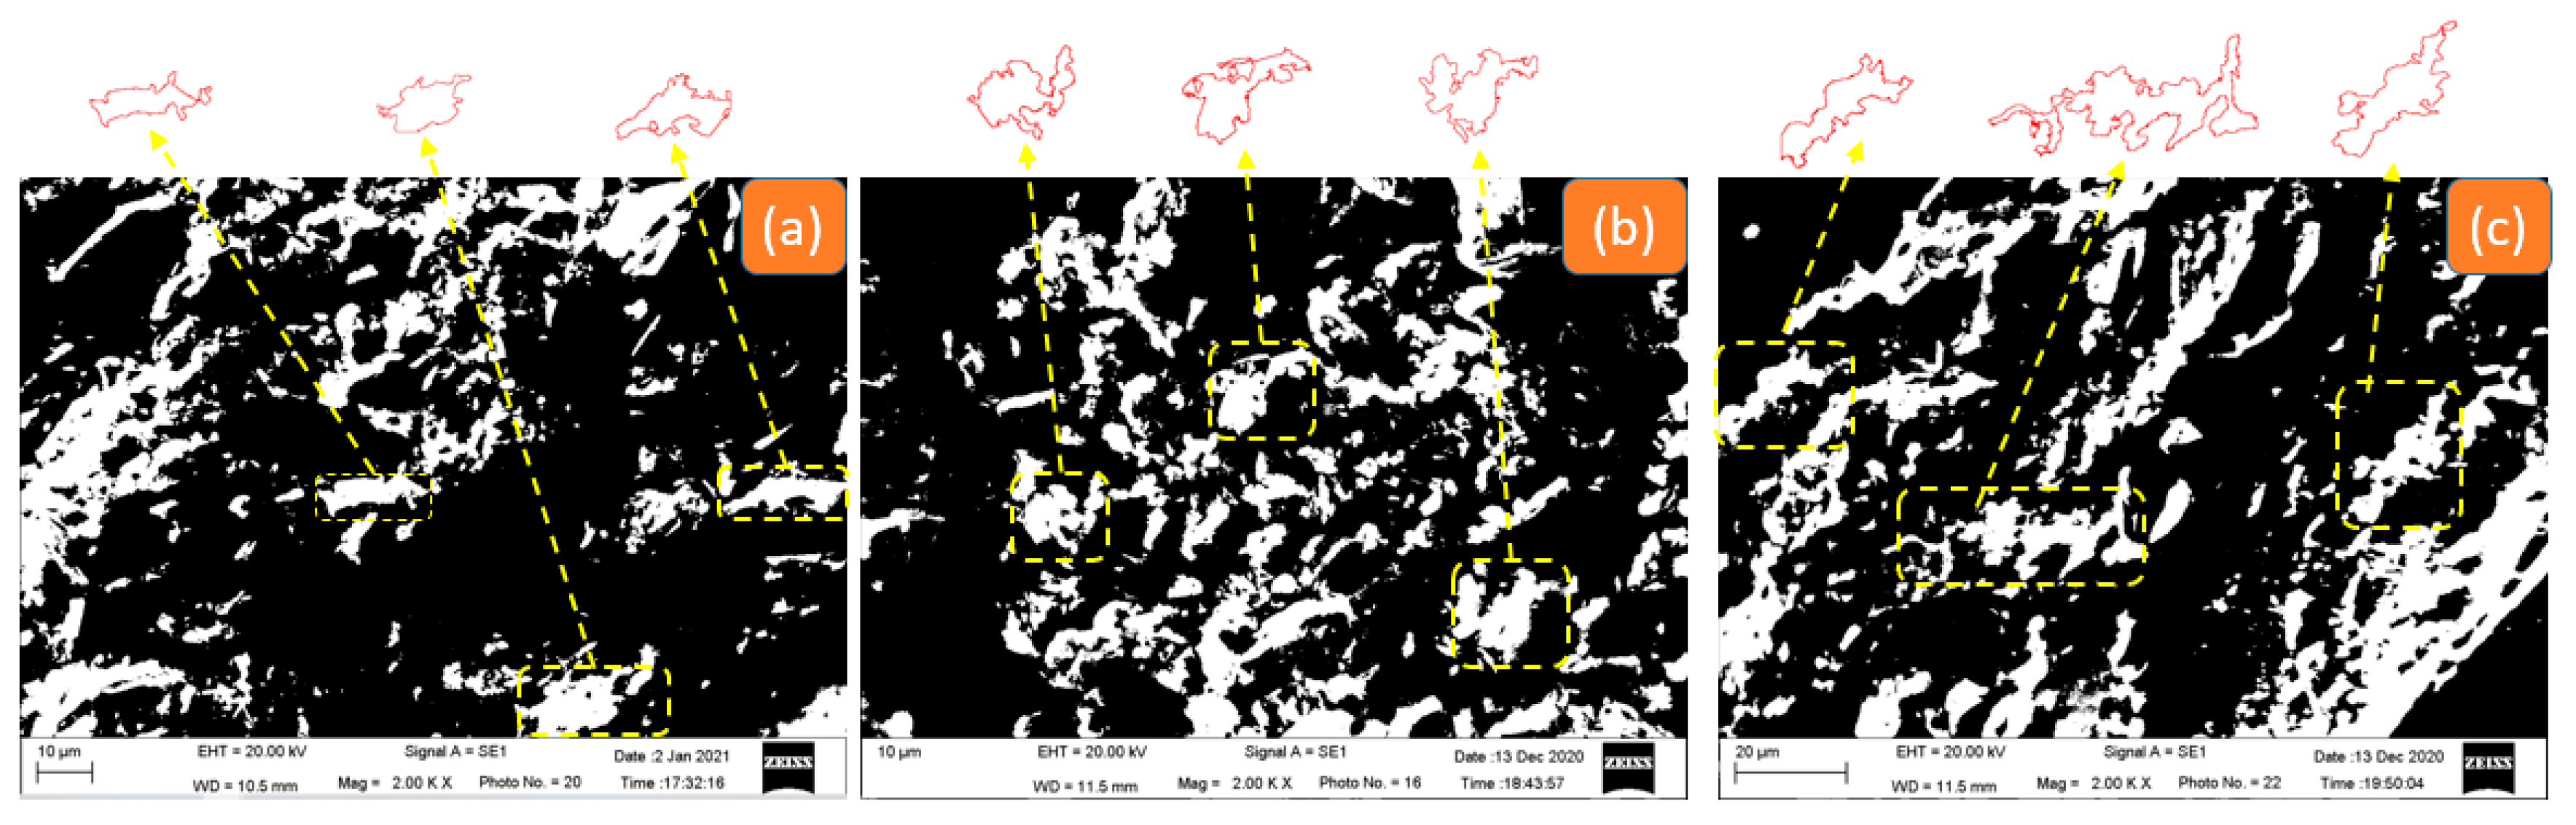
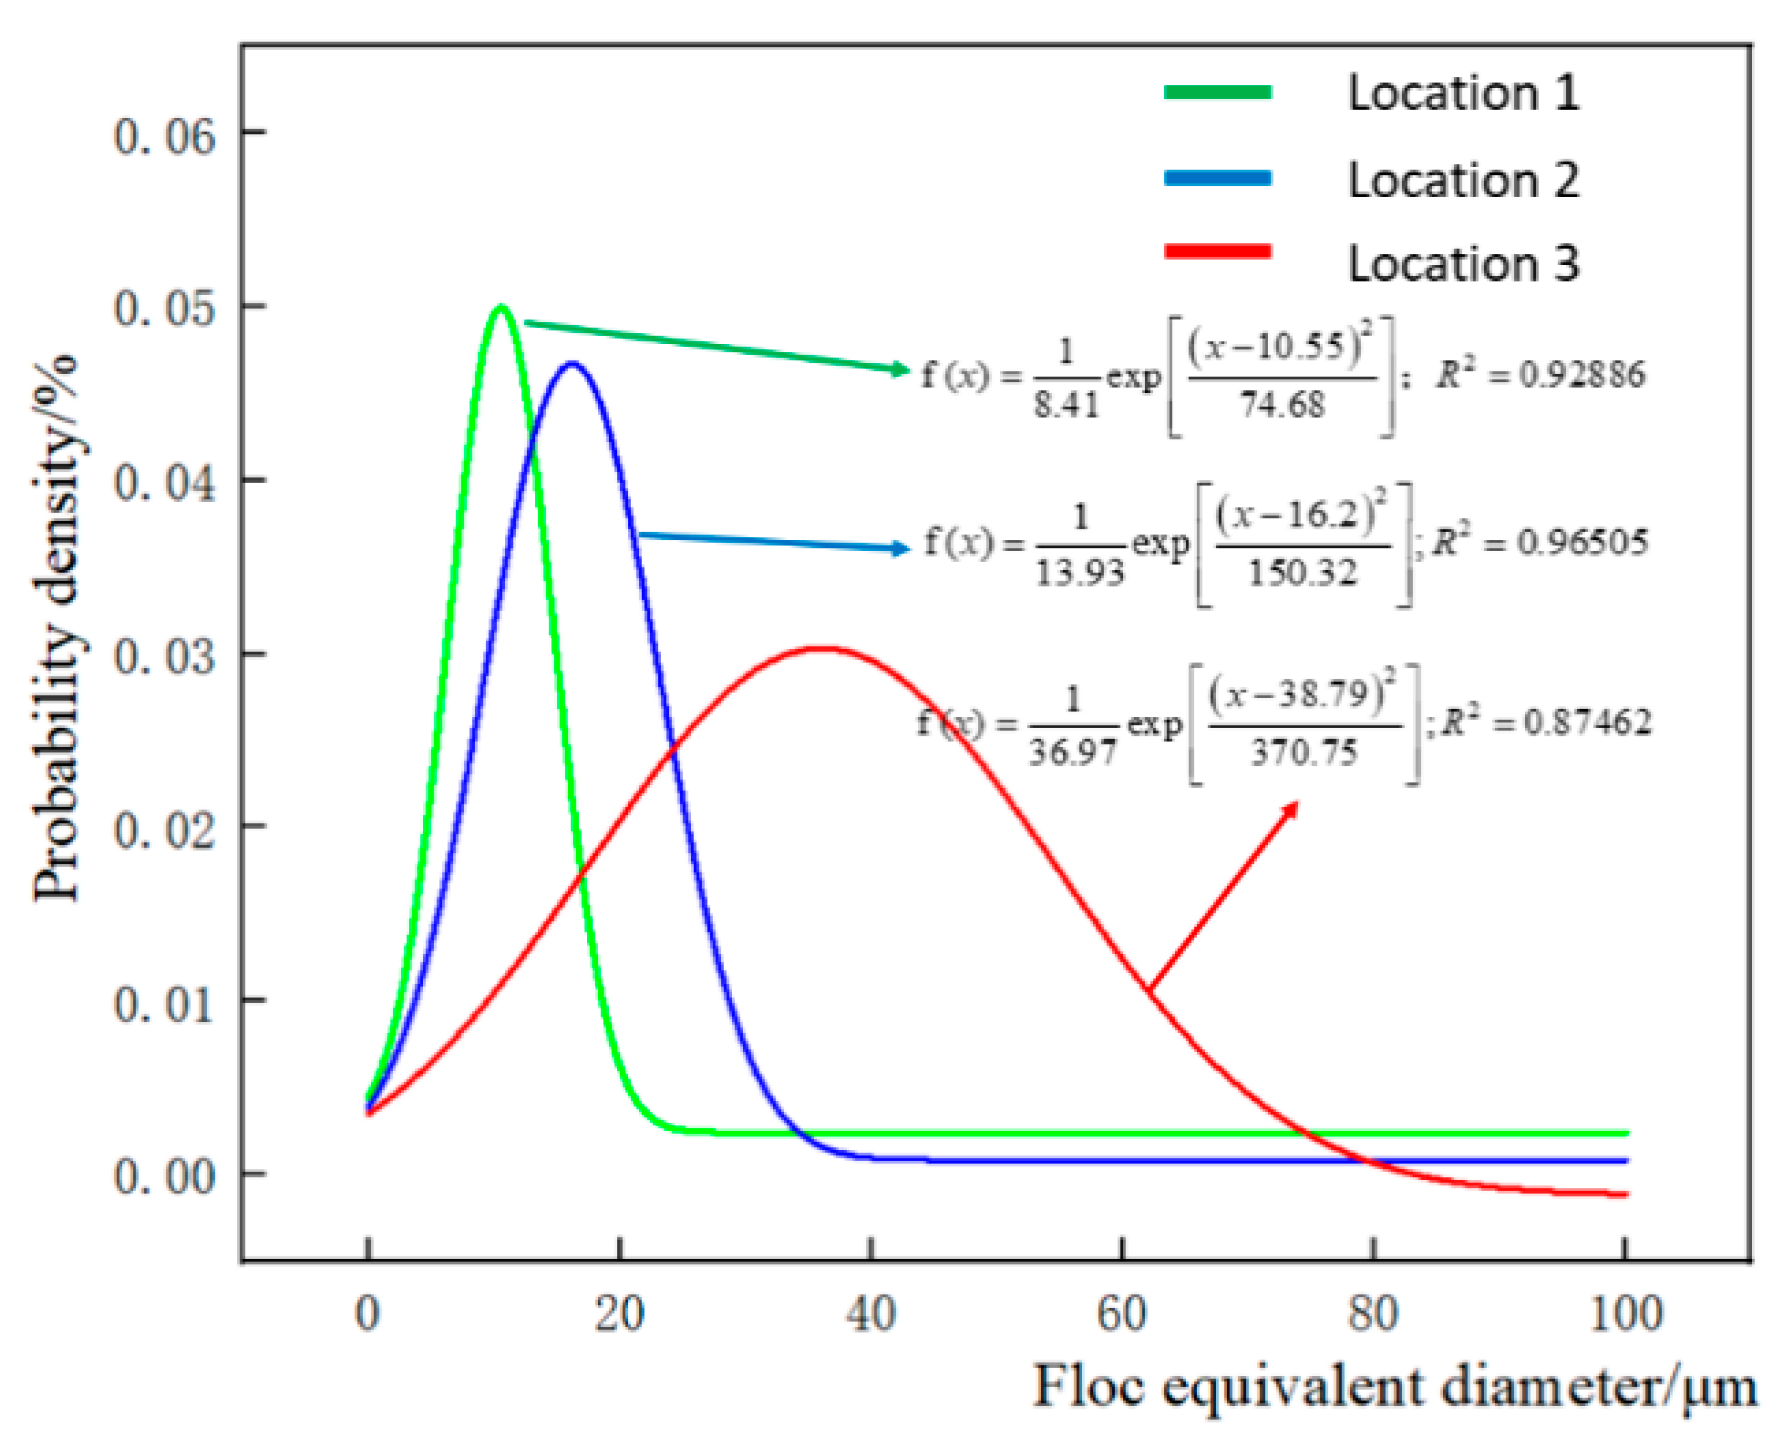
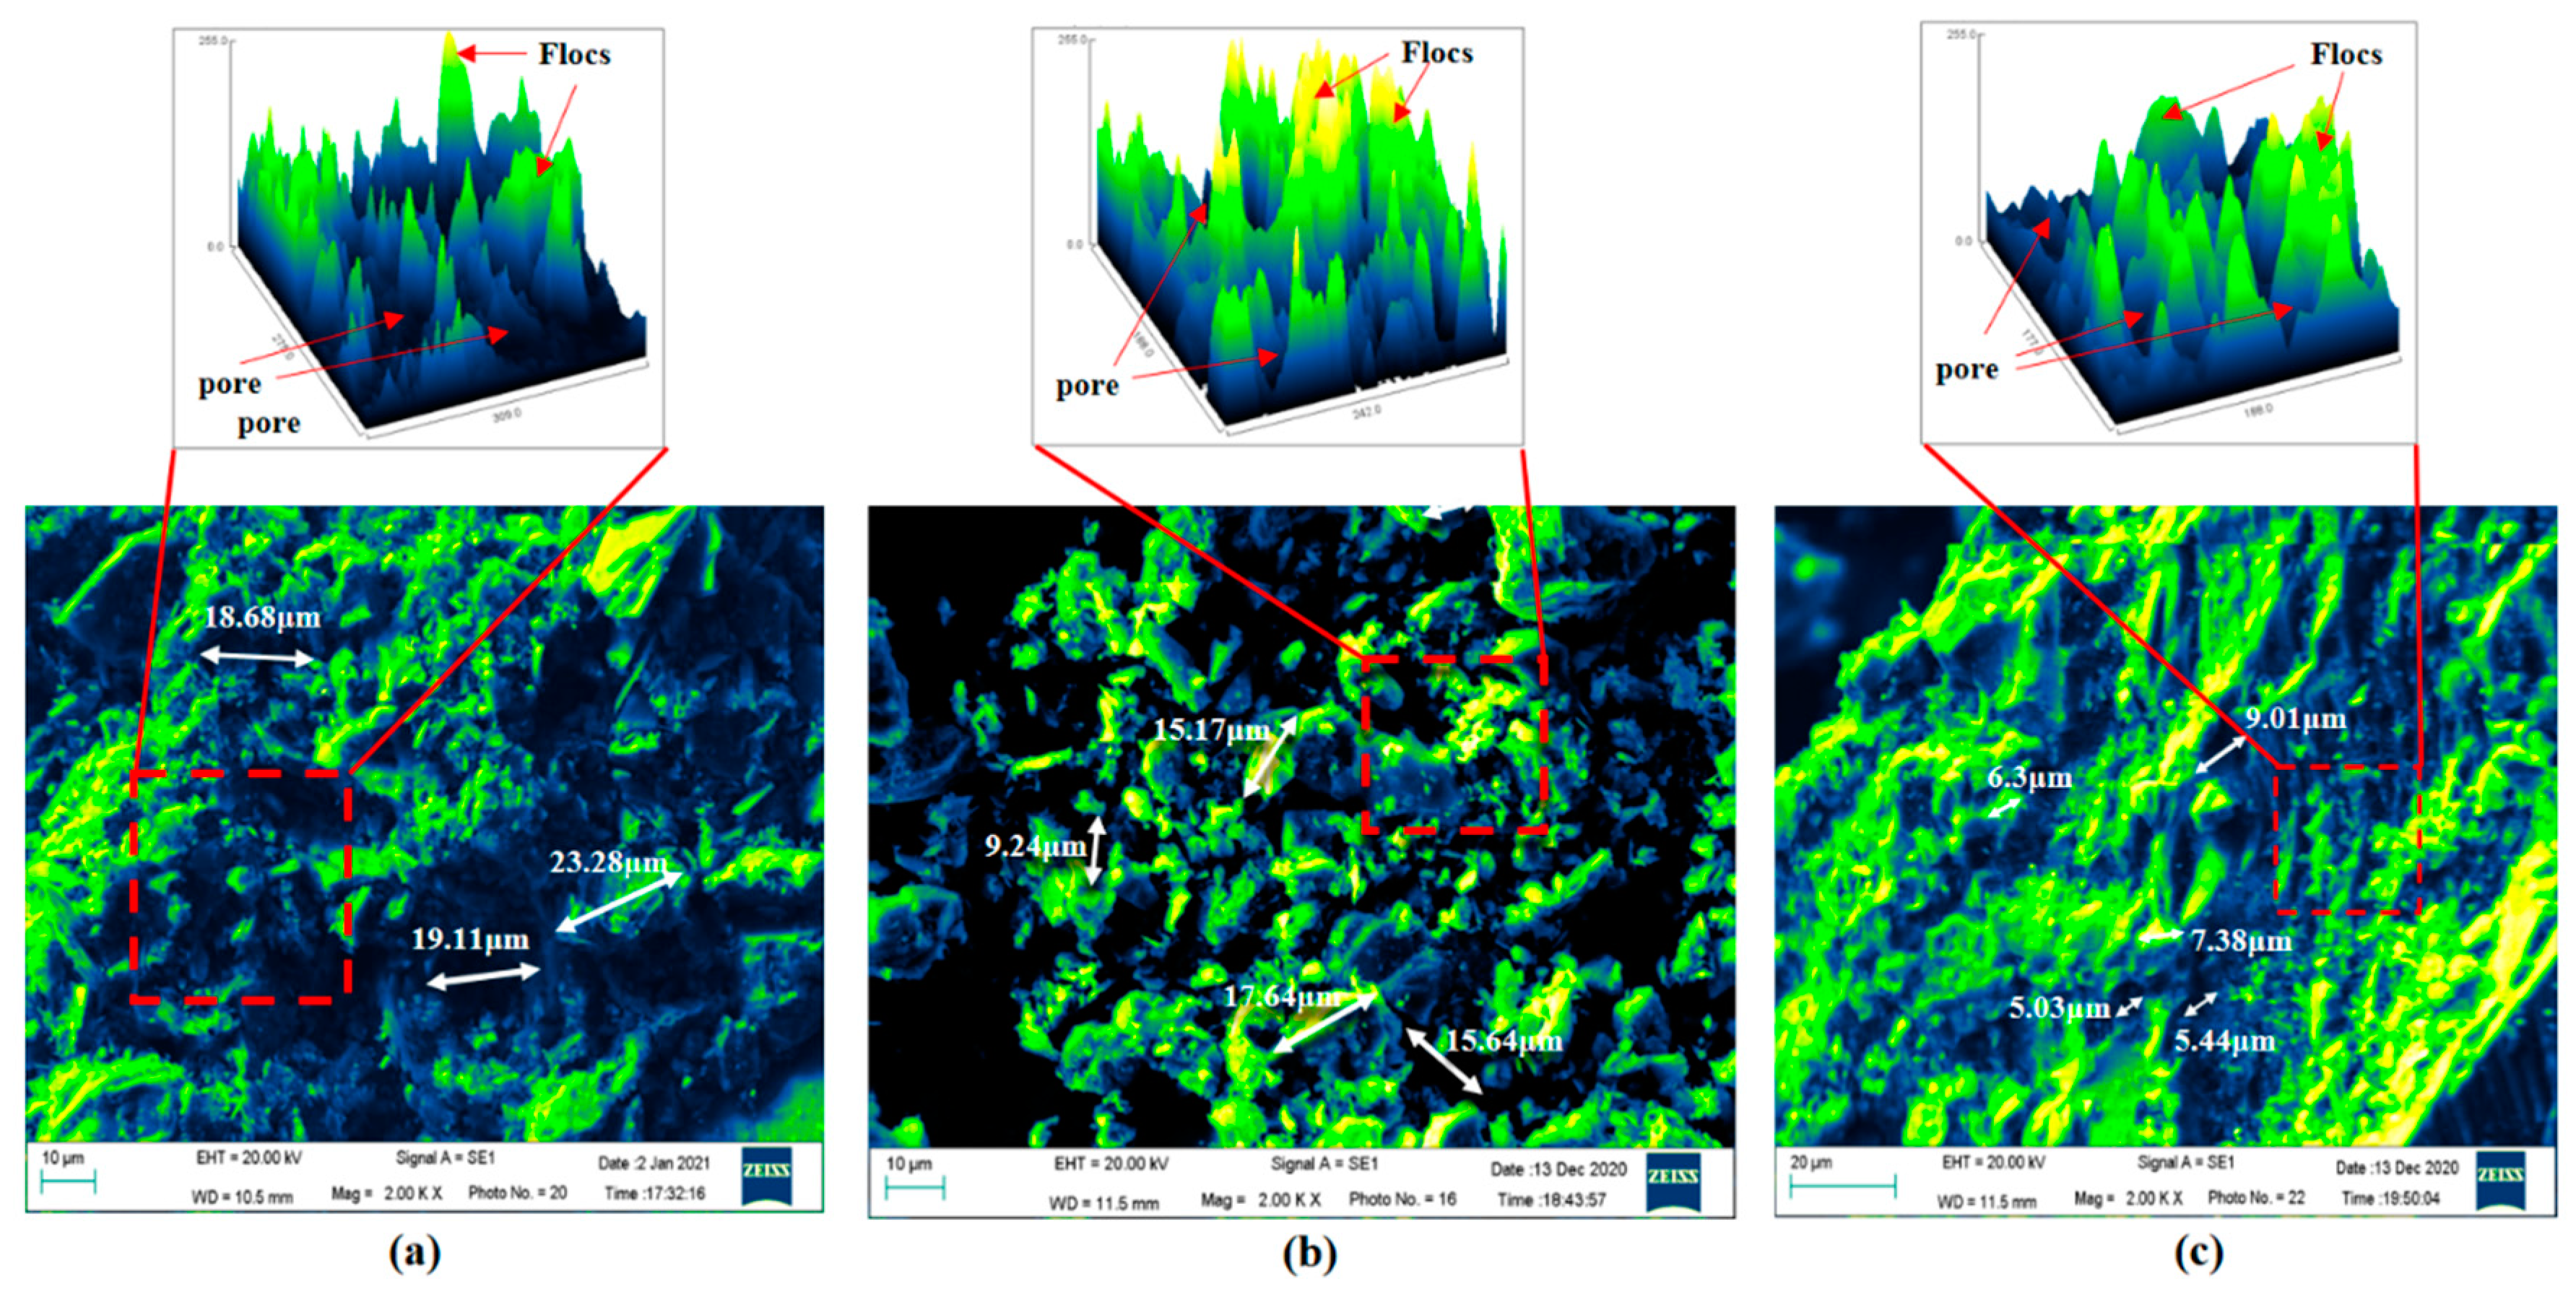
3.3.1. Analysis of the Particle and Morphological Characteristics of Tailings Floccules

SEM images of different sedimentation bed heights of flocculant AZ9020 were obtained through the scanning electron microscope experiment ②, and the tailings flocs were acquired through binarization processing, image contour perfection, edge detection, and boundary discrete-point sealing treatment [26,27,28,29]. The block area is shown in Figure 13. The white part in the picture is the tailings flocs, and their outlines are clearly demonstrated. The particles of tailings flocs of various bed settlement heights show different characteristics. The upper tailings are dispersed, the size of the middle tailings is obviously larger, and the lower tailings become denser as a whole.
The equivalent diameter of the floc was obtained in accordance with the enclosed area delineated by the selected floc profile, and the normal distribution curve of the tailings floc size was acquired as shown in Figure 14. The figure reveals the following: the upper part of the small-sized flocs accounted for a large proportion of the solution and were concentrated between 5 and 18 μm; the middle part of the flocs increased in size and were distributed between 10 and 30 μm; the lower part of the large-sized flocs accounted for substantially concentrated distributions between 20 and 60 μm. The average equivalent diameters of the upper, middle, and lower tailings floccules were 10.55, 16.2, and 38.79 μm, respectively. The diameter of a tailings floc is positively correlated with the settlement height.

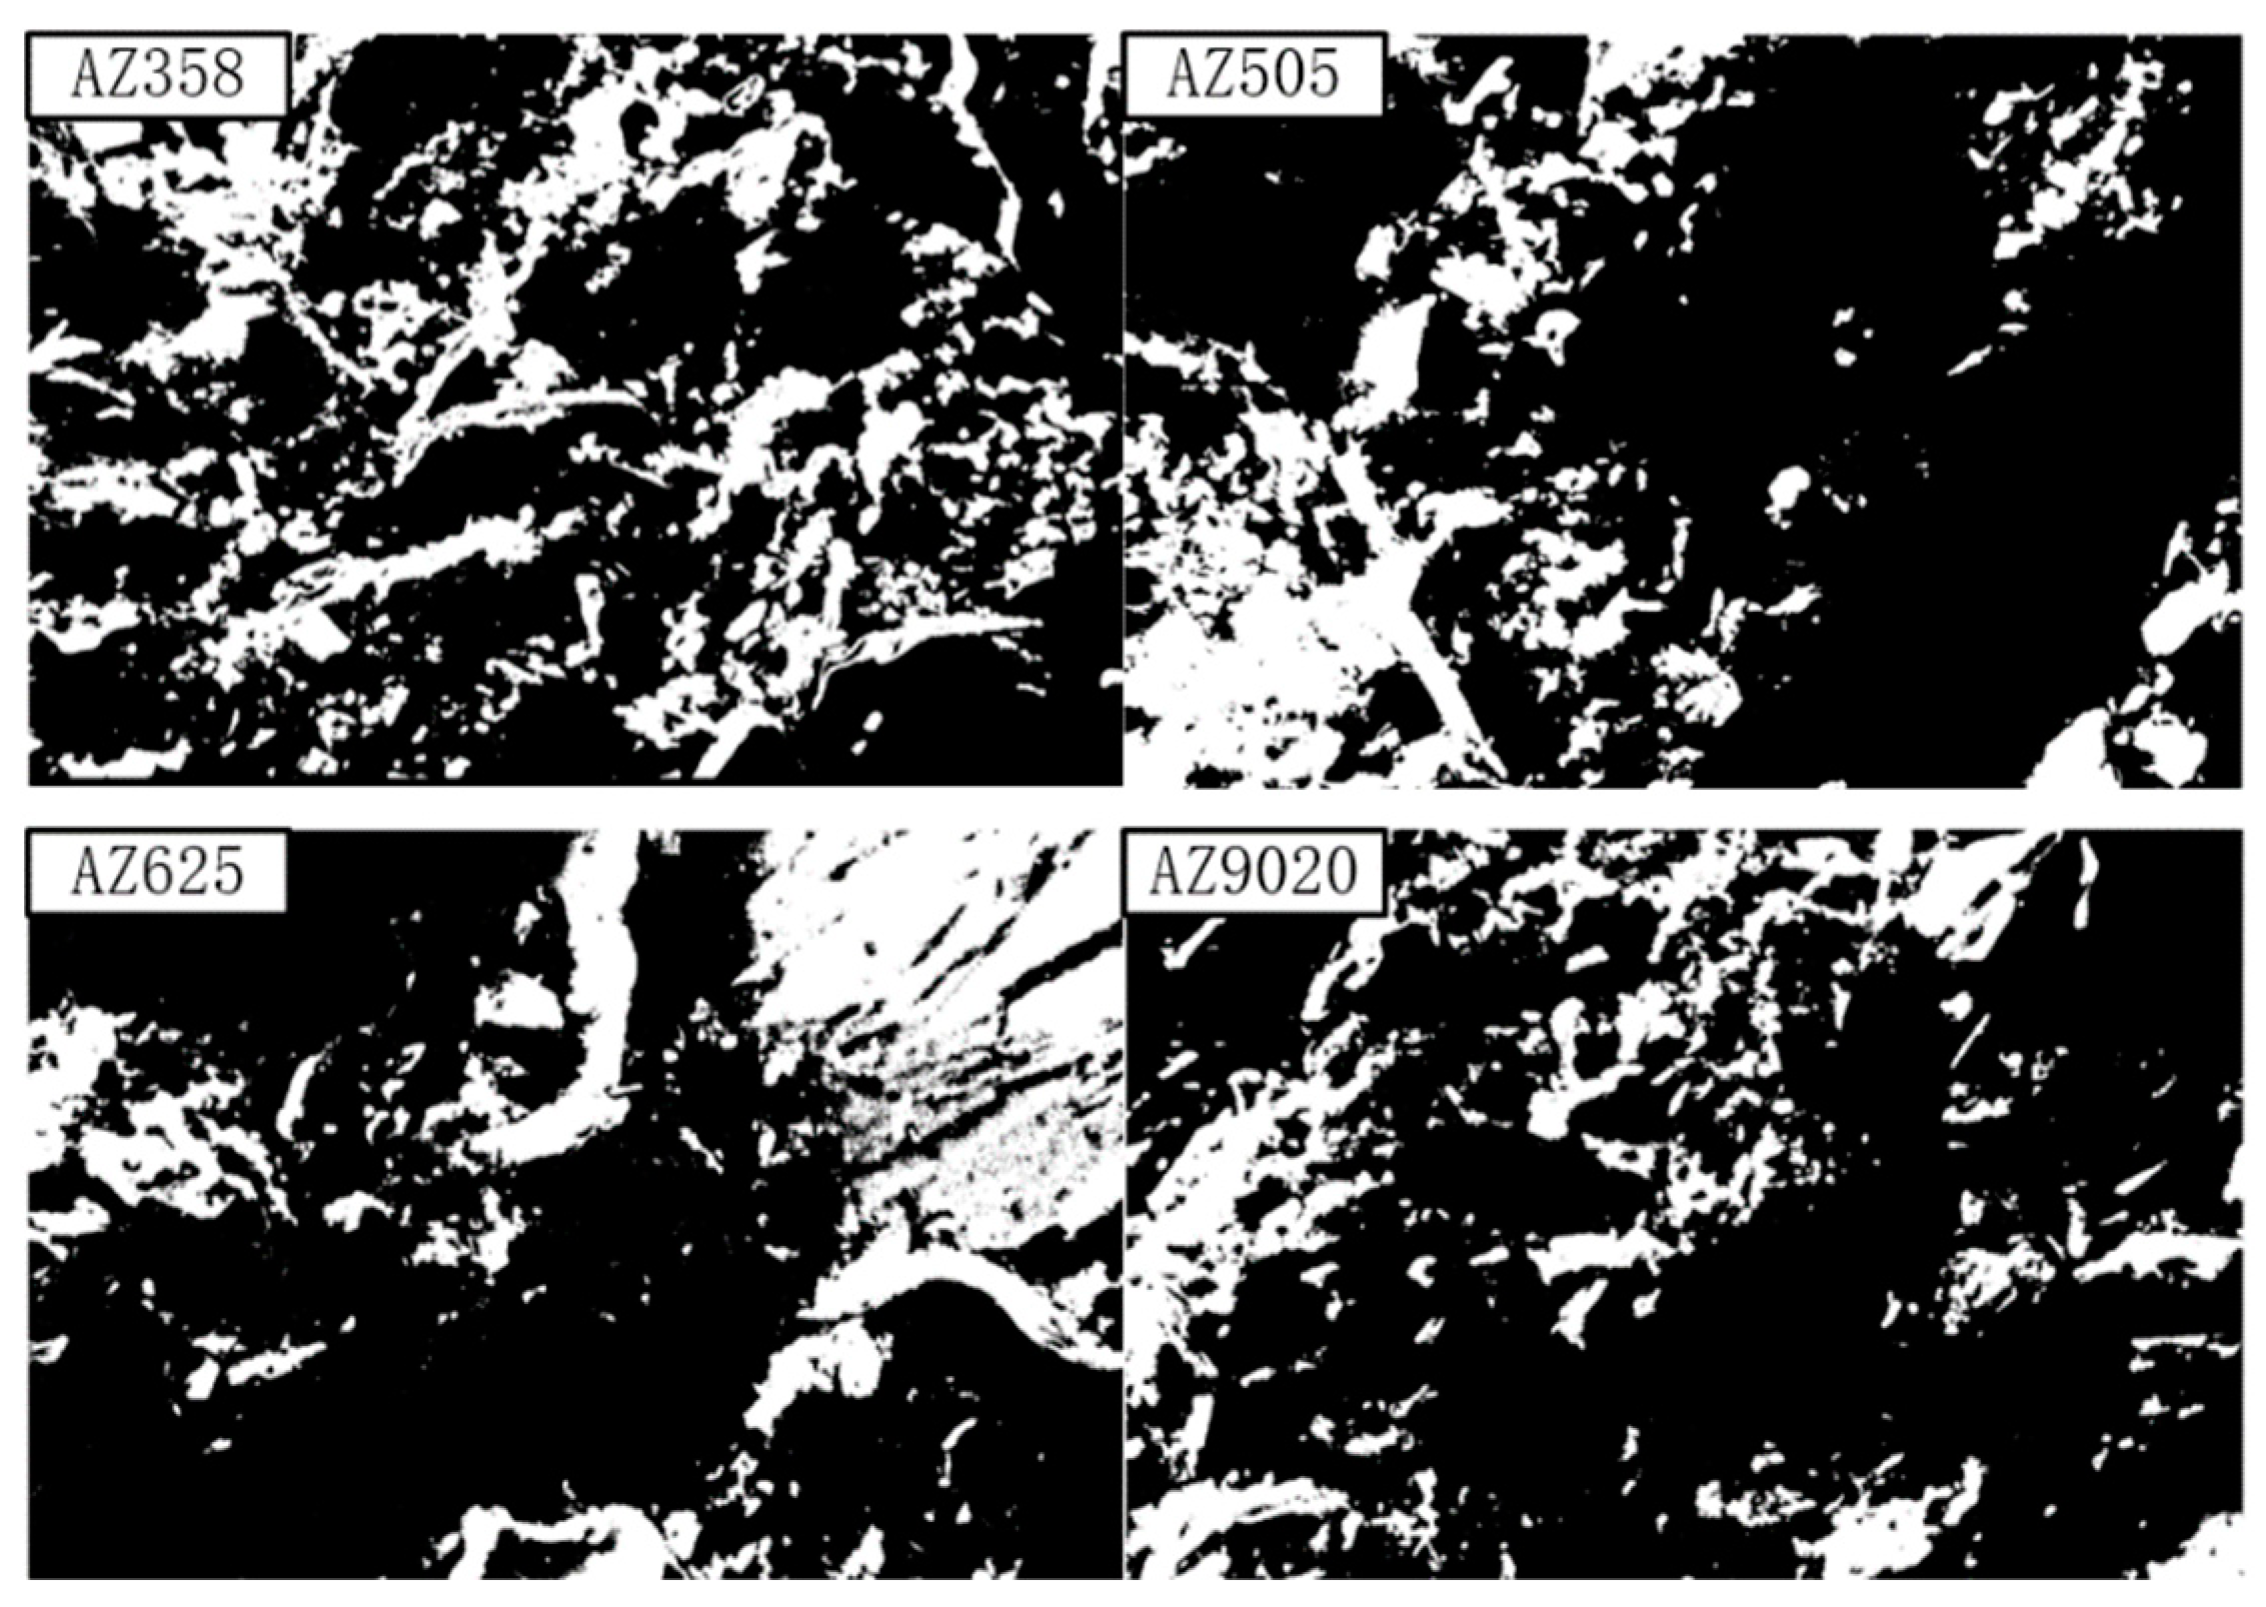
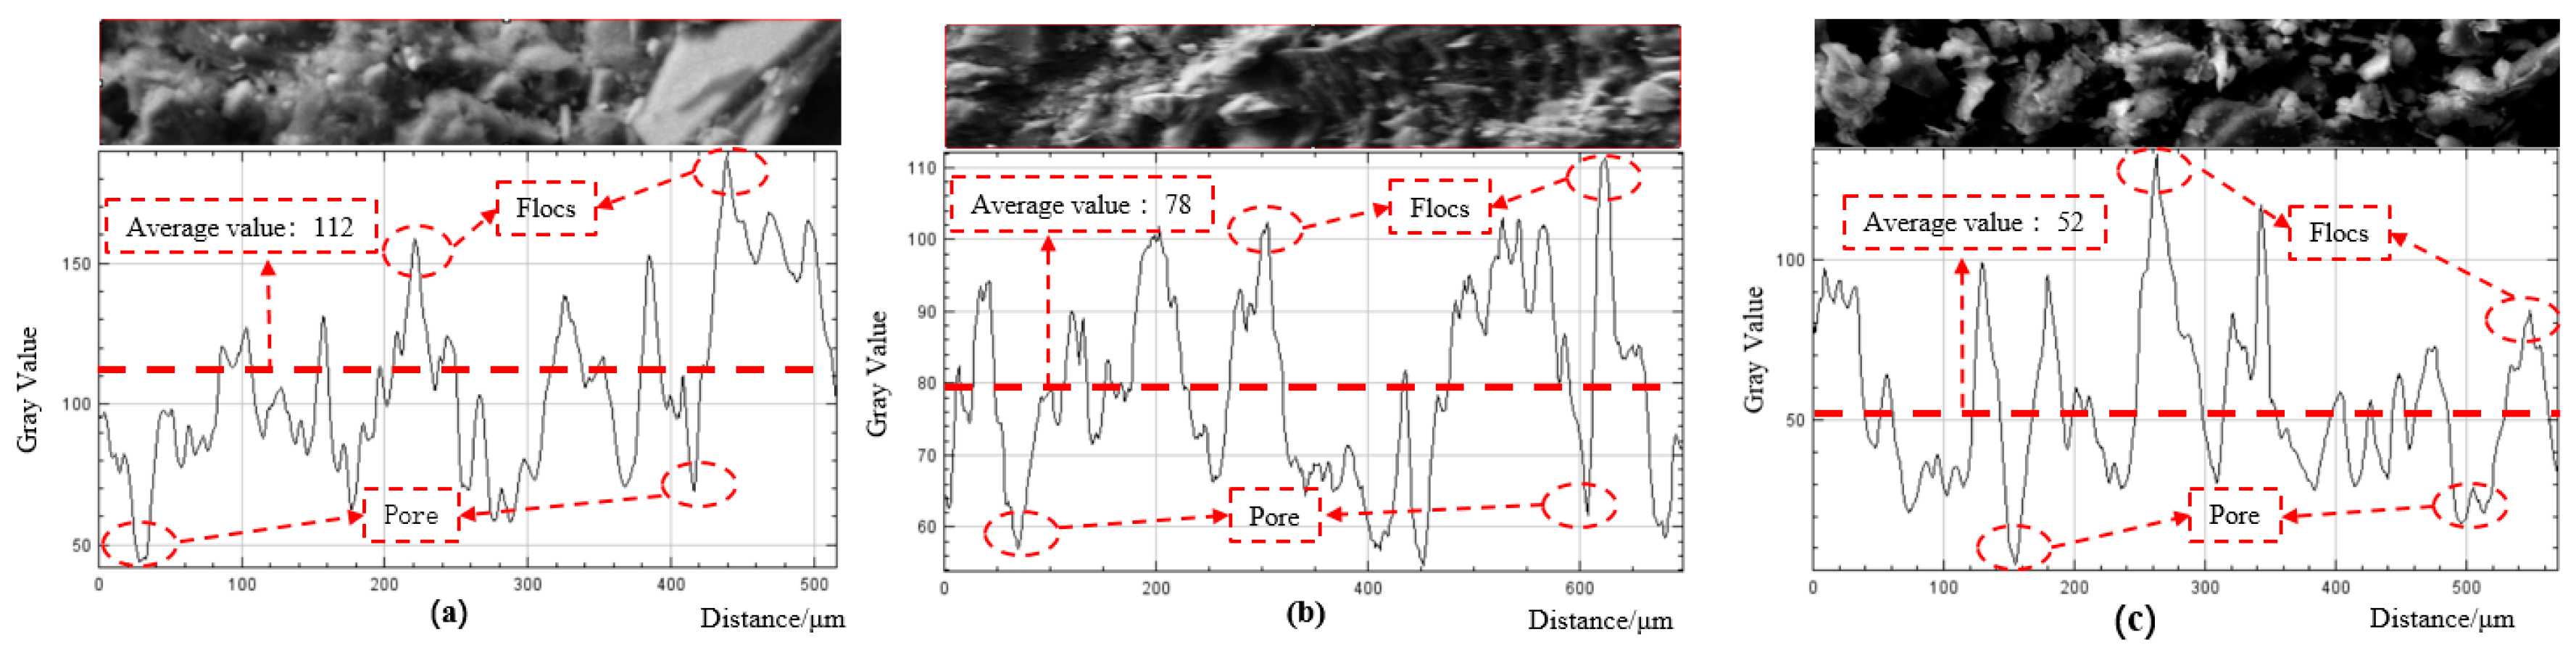
3.3.2. Analysis of Gray-Scale Characteristics of Ultrafine Tailing Floc Structure

The gray value refers to the dark range of the image, where the white value is 255, and the black value is 0, which can intuitively represent the difference between pores and entities [30]. The original SEM images obtained from the scanning electron microscope ② experiment are analyzed on the basis of the following gray-scale characteristics:
Figure 15a shows that the gray value of flocs at the top of the settlement bed is approximately 180, and the gray value of only one pore is below 50, with an average gray value of 112. Figure 15b reveals that the gray value of the flocs in the middle is approximately 110, with an average gray value of 78. Figure 15c shows that the gray value of the flocs at the bottom is lower than 130, and the gray value of most pores is lower than 50, with an average gray value of 52. Thus, the average gray value of flocs decreases with the bed height. This finding indicates that the water content of the upper flocs is high, and the flocs are bright white. The internal water is constantly drained during the floc sedimentation process, the flocs gradually become dark, and the gray value slowly decreases, thus forming a high concentration of ultrafine total tailings floc solution.

3.3.3. Analysis of the Spatial Morphology of the Ultrafine Tailings Floc Structure

The different gray values of the original SEM images obtained by SEM experiment (2) were defined as yellow, green, cyan, and blue, and the gray values of some regions were extracted and converted into 3D graphics [31,32,33], such as those shown in Figure 16. The upper part of the bed settlement (Figure 16a) reveals that the size of flocs is large, most of which are over 20 μm. Moreover, the distribution is concentrated, and macropores that are 10 μm in size are found. The middle of the bed settlement (Figure 16b) shows that the size of flocs ranges from 15 μm to 20 μm, and the pore size is evenly distributed. The lower part of the bed settlement (Figure 16c) demonstrates that the size of most flocs ranges from 3 μm to 10 μm and that there are many small flocs and a relatively increased number of pores distributed around the flocs. The flocs were also evenly distributed. The size of tailings flocs decreased as the settlement height decreased. This finding indicates that large-sized flocs gradually settle, dehydrate, and disperse into small-sized flocs during the flocculation and sedimentation processes, forming a uniform and dense floc pore structure.

4. Conclusions

The flocculation and sedimentation characteristics of ultrafine tailings were studied in this paper through indoor sedimentation experiments, NMR analysis, and micro-electron microscope scanning observations. A reasonable type of flocculant was selected, and the microscopic characteristics of the floc structure in the flocculation and sedimentation processes were analyzed. The main conclusions are as follows:
(1) The sedimentation characteristics of ultrafine tailings under different types of flocculants were studied by indoor flocculation sedimentation experiments, NMR monitoring and analysis, and scanning electron microscope observations. The results indicate that the optimal additional flocculant amount of ultrafine tailings from the Daye Iron Mine was 30 g/t, and the optimal concentration for the flocculant solution was 0.3%. The flocculant was completely dissolved when the flocculant was stirred more than 45 min, and the flocculation sedimentation effect was optimal under these conditions.
(2) The analysis of the pore distribution and fractal characteristics of the ultrafine tailings flocculation solution revealed that the size of flocs in the ultrafine tailings flocculation solution formed by the AZ9020 flocculant was less than 0.1 μm and that the overall structure size was small and evenly dispersed. The flocculant solution had the smallest porosity, the largest fractal dimensions, and the most compact flocs, indicating that it had the best flocculant sedimentation effect.
(3) The analysis of the spatial morphology and gray-scale characteristics of the ultrafine total tailings flocs showed that the average gray-scale value and size of the flocs decreased as the height of the flocculation sedimentation bed decreased. In the flocculation and sedimentation processes, the large-sized flocs gradually dehydrated and dispersed into small-sized flocs, forming a more uniform and compact pore structure for the flocs.

Author Contributions

Y.T., W.S. and C.H. designed the project; X.Y. and L.C. conducted the original literature reviews; C.H. and Y.T. wrote and organized the paper with a careful discussion and revision by W.S. All authors have read and agreed to the published version of the manuscript.

Funding

National Natural Science Foundation of China Youth Fund (52004019).

Informed Consent Statement

Informed consent was obtained from all subjects involved in the study.

Data Availability Statement

Not applicable.

Acknowledgments

We are very grateful to Daye Iron Mine Co. Ltd., for the experimental raw materials.

Conflicts of Interest

The authors declare no conflict of interest.

References

  1. Yao, H.H.; Cai, L.B.; Liu, W.; Tan, W.Q.; Jiao, F.; Yang, R.C. Status quo and development of comprehensive utilization of waste rock from metal mines in my country. Chin. J. Nonferrous Met. 2021, 31, 1649–1660. [Google Scholar]
  2. Yang, Z.L.; Tan, Y.Y.; Fu, J.X.; Zhen, D.; Wang, Y. Selection of Optimal Flocculant for whole tailings and Floc NMR Analysis. Min. Res. Dev. 2021, 41, 136–140. [Google Scholar]
  3. Shui, C.; Wang, X.J.; Wang, X.M.; Zen, Q.; Wang, H.; Liu, J. Study on the law and mechanism of APAM unit consumption on the flocculation of particles of different sizes in the flocculation and settlement of whole tailings. Min. Res. Dev. 2020, 40, 67–73. [Google Scholar]
  4. Du, J.F.; Hou, C.; Zhu, Z.W.; Liu, H.L.; Liu, X.G.; Wang, J.S. Tailings flocculation settlement test and its engineering application. Met. Mine 2020, 1, 95–100. [Google Scholar]
  5. Wu, A.X.; Wang, Y.; Wang, H.J. Current status and trend of paste filling technology. Metal Mine 2016, 7, 1–9. [Google Scholar]
  6. Shi, C.X.; Guo, L.J.; Chen, X. Static and dynamic flocculation settlement characteristics of tailings. Chin. J. Nonferrous Met. 2021, 31, 194–202. [Google Scholar]
  7. Li, X.; Guo, L.J.; Yang, C. Experimental study on flocculation and settlement of whole tailings in a gold mine in anhui. China Min. Mag. 2017, 26, 326–329. [Google Scholar]
  8. Guo, J.B.; Wang, H.J.; Tian, Z.G.; Du, X.H. The influence of different types of flocculants on the density of ultrafine tailings. Min. Res. Dev. 2021, 41, 141–145. [Google Scholar]
  9. Jiao, H.Z.; Wu, A.X.; Wang, H.J.; Liu, X.H.; Yang, S.K.; Xiao, Y.T. Experimental study on flocculation and settlement characteristics of whole tailings. J. Univ. Sci. Technol. Beijing 2011, 33, 1437–1441. [Google Scholar]
  10. Yang, L.H.; Wang, H.J.; Wu, A.X.; Li, H.; Hui, H.; Hui, C.Y. The effect of flocculation settlement on the rheological properties of whole tailings slurry. J. Cent. South Univ. (Sci. Technol.) 2016, 47, 3523–3529. [Google Scholar]
  11. Li, J.X.; Shun, W.; Zhang, S.Y.; Liu, W.D. Factors Influencing Flocculation and Sedimentation of Tailings. J. Kunming Univ. Sci. Technol. (Sci. Technol.) 2021, 46, 45–53. [Google Scholar]
  12. Xue, Z.L.; Yan, Z.P.; Jiao, H.Z.; Gan, Q.D.; Zhang, Y.Z.; Liu, Z.Y. Dynamic settlement of flocs in the deep cone thickening process of tailings. Chin. J. Nonferrous Met. 2020, 30, 2206–2215. [Google Scholar]
  13. Wu, A.X.; Zhou, L.; Yin, S.H. Influencing factors of flocculation and settlement of whole tailings. Chin. J. Nonferrous Met. 2016, 26, 439–445. [Google Scholar]
  14. Gheshlaghi, M.E.; Goharrizi, A.S.; Shanhrivar, A.A. Modelingindustrial thickener using computational fluid dynamics (CFD), acase study: Tailing thickener in the Sarcheshmeh copper mine. Int. J. Min. Sci. Technol. 2013, 23, 885–893. [Google Scholar] [CrossRef]
  15. Ruan, Z.E.; Li, C.P.; Shi, C. Numerical simulation of flocculation andsettling behavior of whole-tailings particles in deep-conethickener. Int. J. Cent. South Univ. 2016, 23, 740–746. [Google Scholar] [CrossRef]
  16. Hou, H.Z.; Li, C.P.; Wang, S.Y. Settlement velocity change and particle settling characteristics of thick and middle mud layer in tailings. J. Cent. South Univ. (Sci. Technol.) 2019, 50, 1428–1436. [Google Scholar]
  17. Chen, Y.P.; Luo, W.; Xu, C.Y. Microstructure of high-concentration viscous sediment flocs and its effect on settlement characteristics. J. Sediment Res. 2020, 45, 8–14. [Google Scholar]
  18. Ying, Y.; Wu, A.X.; Wang, H.J. Torque mechanics model and mechanism analysis of rake frame based on mud height. J. Cent. South Univ. (Sci. Technol.) 2019, 50, 165–171. [Google Scholar]
  19. Hu, J.H.; Ren, Q.F.; Yang, D.J. Cross-scale characteristics of backfill material using NMR and fractal theory. Trans. Nonferrous Met. Soc. China 2020, 30, 1347–1363. [Google Scholar] [CrossRef]
  20. Chen, D.; Song, W.D.; Wu, S. Experimental study on flocculation and settlement characteristics of tailings slurry. Non-Ferr. Met. (Min. Part) 2016, 68, 41–44. [Google Scholar]
  21. Dwari, R.K.; Angadi, S.I.; Tripathy, S.K. Studies onflocculation characteristics of chromite’s ore process tailing: Effect of flocculants ionicity and molecular mass. Colloids Surf. A Physicochem. Eng. Asp. 2018, 53, 467–477. [Google Scholar] [CrossRef]
  22. Su, S.L.; Rao, Q.H.; He, Y.H. Effects of porosity on tensile mechanical properties of porous FeAl intermetallics. Trans. Nonferrous Met. Soc. China 2020, 30, 2757–2763. [Google Scholar] [CrossRef]
  23. Zhao, J.; Fu, X.H.; Wang, J. Analysis of the effect of shear field on ultra-clean coal separation based on fractal dimension. J. China Coal Soc. 2016, 41, 2078–2085. [Google Scholar]
  24. Zhou, X.; Wu, A.X.; Wang, H.J. The Evolution Law of Flocculation in the Thickening Process of Tailings Based on FBRM. J. Eng. Sci. 2021, 43, 1425–1432. [Google Scholar]
  25. Zheng, D.; Song, W.D.; Tan, Y.Y. Research on fractal and microscopic quantitative characterization of unclassified tailings flocs. Int. J. Miner. Metall. Mater. 2021, 28, 1429–1439. [Google Scholar] [CrossRef]
  26. Hu, W.W.; Zhou, R.G.; Fan, P. Quantum Image Edge Detection Based on Canny Algorithm. J. Zhengzhou Univ. (Nat. Sci. Ed.) 2020, 52, 37–52. [Google Scholar]
  27. Li, J.; Chen, G.F.; Ding, X.Q. Research on Image Edge Detection Method Based on Improved Canny Algorithm. Comput. Simul. 2021, 38, 371–375. [Google Scholar]
  28. Li, J.; Li, H.Y.; Yao, R.J. Check of MR image edge information of lumber intervertebral disc using an improved Canny algorithm. J. Jilin Univ. (Eng. Technol. Ed.) 2016, 46, 1704–1709. [Google Scholar]
  29. Zhang, H.H.; Zhao, N.L.; Chao, Q. Influences of CO2 on the Microstructure in Sheared Olivine Aggregates. Minerals 2021, 11, 493. [Google Scholar] [CrossRef]
  30. Cai, G.P.; Wang, L.; Luo, X.Y. Multi-threshold Binary Algorithm for Ore Image Based on Block Processing. Min. Res. Dev. 2020, 40, 153–157. [Google Scholar]
  31. Xu, H.K.; Han, X.; Qu, H.J. Image gray scale transformation combining false edge extraction and histogram analysis. Opt. Precis. Eng. 2017, 25, 538–544. [Google Scholar]
  32. Sun, F.; Wang, F.Y.; Jiang, H.L. Analysis on the flocculation characteristics of algal organic matters. J. Environ. Manag. 2022, 302, 114094. [Google Scholar] [CrossRef] [PubMed]
  33. Rosa, M.F.L.; Francisco, D.P.V.F.A. Characterization and concentration by selective flocculation/magnetic separation of iron ore slimes from a dam of Quadrilátero Ferrífero—Brazil. J. Mater. Res. Technol. 2020, 9, 2021–2027. [Google Scholar] [CrossRef]
Figure 1. Ultrafine tailings from the Daye Iron Mine: screening size statistics chart.
Minerals 12 00221 g001
Figure 2. Change process of the liquid surface settlement height of ultrafine total tailings flocculation solution at different times.
Minerals 12 00221 g002
Figure 3. Floc extraction location and NMR analysis specimen (a) NMR analysis specimen (b) Floc extraction location.
Minerals 12 00221 g003
Figure 4. Floc extraction position and the scanning observation test piece under the microscope and electron microscope.
Minerals 12 00221 g004
Figure 5. Change curves of the height and average settling velocity of the ultrafine tailings solution under different types of flocculants (a) Drop height of clarification layer (b) Sedimentation velocity.
Minerals 12 00221 g005
Figure 6. Change curves of height and sedimentation velocity of clarifier under different flocculant consumptions (AZ9020) (a) Drop height of clarification layer (b) Sedimentation velocity.
Minerals 12 00221 g006
Figure 7. Change curves of height and sedimentation velocity of the clarifier under different flocculant solution concentrations (AZ9020) (a) Drop height of clarification layer (b) Sedimentation velocity.
Minerals 12 00221 g007
Figure 8. Height changes and transverse comparison curves of the clarifying layer at different stirring times (AZ9020) (a) Different mixing time (b) Different mixing time and concentration.
Minerals 12 00221 g008
Figure 9. Pore size distribution curve and NMR analysis specimen of the flocculent solution of ultrafine tailings (a) Pore size distribution (b) NMR analysis specimen.
Minerals 12 00221 g009
Figure 10. SEM images of specimens with different floc structures of flocculant ultrafine tailings.
Minerals 12 00221 g010
Figure 11. Binary image of tailings flocculation with different flocculants.
Minerals 12 00221 g011
Figure 12. Fractal characteristic curve of floc structure: (a) AZ358, (b) AZ505, (c) AZ625, and (d) AZ9020.
Minerals 12 00221 g012
Figure 13. Particle size and morphological characteristics of tailings flocs with different settlement heights under ZYZ-type flocculant: (a) location 1; (b) location 2; (c) location 3.
Minerals 12 00221 g013
Figure 14. Distribution curves of equivalent diameters of tailings flocs at different heights under AZ9020-type flocculant.
Minerals 12 00221 g014
Figure 15. Floc gray-scale characteristic curves: (a) location 1; (b) location 2; (c) location 3.
Minerals 12 00221 g015
Figure 16. SEM image of tailings floccules of AZ9020 flocculant: (a) location 1; (b) location 2; (c) location 3.
Minerals 12 00221 g016
Table 1. Physical properties of ultrafine tailings from the Daye Iron Mine.
Median Size d50/μmMean Diameter of Surface Area Volume
D(3, 2)/μm
Sorting Coefficient/S0Specific Surface Area by Weight ω/m2/kg
37.925 14.3195.5956400
Table 2. Main chemical composition of Daye Iron tailings.
ComponentSiO2TFeSFeCaOFeOAl2O3MgO
Content (%)26.3020.7920.0212.4510.906.075.55
Table 3. Technical flocculant index.
TypeExperiment NumberExteriorMolecular Weight/10,000Solid Content/%
AZ358 anionicL2White particle1400≥95.5
AZ625 anionicL3White granules or powder1500–1600≥95
AZ9020 anionicL4White granules or powder1500–1600≥95.5
AZ505 anionicL5White granules or powder1600≥95
Table 4. Experimental scheme and process of ultrafine tailings.
Experimental StepsExperiment CodeVariable/Experiment Number12345Purpose
1LTypeNatural settingAZ358AZ625AZ9020AZ505Determine the best flocculant model
2DUnit consumption0 g/t10 g/t20 g/t30 g/t40 g/tDetermine the best unit consumption of the flocculant
3NConcentration00.05%0.1%0.2%0.3%Determine the optimal flocculant concentration
4TChurning time10 min15 min25 min35 min45 minDetermine the best flocculant mixing time
Publisher’s Note: MDPI stays neutral with regard to jurisdictional claims in published maps and institutional affiliations.

