Article

Crystallographic Characteristics of Inorganic Mineral in Mammoth Ivory and Ivory

1
School of Gemology, China University of Geosciences, Beijing 100083, China
2
National Gemstone Testing Center Shenzhen Laboratory, Shenzhen 518020, China
*
Author to whom correspondence should be addressed.
Minerals 2022, 12(2), 117; https://doi.org/10.3390/min12020117
Submission received: 26 December 2021 / Revised: 15 January 2022 / Accepted: 17 January 2022 / Published: 20 January 2022
(This article belongs to the Special Issue Gems and Gem Minerals)

Abstract

:
In this paper, the chemical composition and crystalline properties of mammoth ivory and ivory were systematically analyzed. The results revealed that the microscopic crystalline hydroxyapatites are the major component of minerals in mammoth ivory and ivory. The Ca/P ratios of the samples studied are obviously lower than apatite. Refined cell parameters showed a similar value between mammoth ivory (a = 9.4148 Å and b = 6.8821 Å) and ivory (a = 9.4166 Å and c = 6.8841 Å). Individual crystal sizes in mammoth ivory and ivory are estimated to be 20.41–23.16 and 18.92–21.50 nm, respectively. The calculated crystallinity of two kinds of ivory (mammoth ivory: 1.55; ivory: 1.4) is far lower than geological mineral fluorapatite due to the impact of tissue function and organic matrix.

1. Introduction

Research of biomineralization has had a long history, the understanding of which is advanced by analyzing the function of living beings and organic evolution in mineralization [1,2,3]. Micro-structured biomaterials such as bone and teeth have gradually received much more attention. Tabular hydroxyapatite, which sets up the skeleton of vertebrates, offers significant hardness and supports the whole body, is the typical material from biomineralization [3,4,5]. The impact of the organic materials during bio-mineralization leads to some excellent properties, for example, a periodic layer composed of hydroxyapatite inhibits new cracks and reduces the energy transferred across both layers, even reflecting some of the incident energy [6,7].
Significant progress has been made on the bones and teeth of several species using electron microscopy. Robinson firstly discovered that the tabular hydroxyapatite in human bone was distributed along the c-axis of collagen triple helixes with the size of 50 × 25 × 10 nm, which also confirmed that the nano-hydroxyapatite can be observed [8]. Previous literature revealed that the hydroxyapatite crystal size has generally been accepted to be 35–70 nm in length, with a width of approximately 25–50 nm and a minimum uniform thickness of 2–5 nm [8,9,10,11]. Such crystal sizes present a conceptual problem related to the ultrastructure accommodation at the molecular level in collagen. The crystals are inferred to be located within or between the collagen fibrils [1,12,13]. The hydroxyapatite in bone and teeth is calcium deficient and carbonated. With age, its crystallinity decreased but the carbonate content increased. In addition, the effect of calcium and phosphate in demineralization and remineralization dynamics has been explained [14].
In many respects, mammoth ivory resembles bone and teeth in the organic and inorganic matrix compositions. The hierarchical structure of ivory, including the spatial relationship between apatite crystals and collagen fibrils, can be recognized [15,16]. The existence of a preferred orientation of hydroxyapatite in ivory and mammoth ivory was verified [17]. The average sizes of the crystals in ivory were measured to be 31 nm in length, 20 nm in width, and 3 nm in thickness, which is smaller than bone [18]. These phenomena present unique opportunities for the study of crystalline characteristics of hydroxyapatite in mammoth ivory and ivory from an elephant.
Due to the lack of research on mammoth ivory, crystalline characteristics of hydroxyapatite in mammoth ivory and ivory from an elephant are analyzed in this study applying X-ray diffraction (XRD), energy dispersive spectroscopy (EDS), and infrared spectroscopy (IR). The significance of this finding not only applies to the bio-mineral structure but also provides a kind of new theoretic basis for further study into the process of biological mineralization and a useful reference for synthesizing nano-hydroxyapatite with excellent properties [19].

2. Materials and Methods

2.1. Materials

In this study, three specimens were collected: (i) a sample of mammoth ivory (MI) from mammoth, recovered from tundra in the region of Siberia, Russia; (ii) a sample of ivory (I) originating from adult Zimbabwean elephants; and (iii) a sample of fluorapatite (F), used as standard material (Figure 1).

2.2. X-ray Diffraction

Part of the sample from the Retzius layer (Figure 2) was fractured into small lumps with an approximate size of 1.3 × 1.3 × 1.3 cm. The texted planes include transverse planes (TP), circumferential planes (CP) and radial planes (RP). The other part was ground in an agate mortar and then sieved on 400-mesh screens. The packed powders were analyzed. This test was performed on a Smartlab X-ray diffractometer (Rigaku, Tokyo, Japan), equipped with a graphite monochromator, and using CuKα1 radiation at 45 kV and 200 mA. A divergent slit and a scatter slit, both of 1/6° width, were employed for the beam source. A receiving slit of 0.15 mm width was used for the detector. Data were collected in the high precision step-scan mode: 3°–80° 2θ range, 0.02° step size, and 1 s/step counting time. All the data were analyzed by the software Jade 6.5 (Jade, Christchurch, New Zealand).

2.3. Scanning Electron Microscope and Energy Dispersive Spectroscopy

The samples were fractured along the transverse planes (TP). The fracture surfaces with outermost layer (OL) and Retzius layer (RL) (Figure 2) were gold-coated and studied in a ZEISS SIGMA scanning electron microscope (15 KV) (ZEISS, Oberkochen, Germany), and samples were embedded by electric conductive adhesive in an aluminum plate under vacuum. Distribution of Ca, P, Mg, Na, Cl, C and Ca/P were obtained.

2.4. Infrared Spectrometry

A standard procedure was used for sample preparation. Samples with the weight of 2 ± 0.1 mg were added to 400 ± 1 mg KBr and then sieved on 200-mesh screens after they had been blended and ground in an agate mortar. They were dried at 120 °C overnight in an oven for the experiment. The IR spectra were recorded in transmittance mode with a Bruker Tensor Ⅱ spectrometer (Bruker, Billerica, MA, USA). The sample includes the outermost layer (OL), Retzius layer (RL) and innermost layer (IL). Spectral scans at a spectral resolution of 4 cm−1 were accumulated over a period of about 120 s to give good signal-to-noise ratios. Reproducible spectra were obtained from several parts of each specimen.

3. Results and Discussion

3.1. Phase Identification

X-ray diffraction patterns in Figure 3a showed that the appearance of three main peaks at approximately 25.9° (d = 3.439 Å), 31.8° (d = 2.815 Å) and 32.2° (d = 2.779Å) are consistent with the standard pattern of hydroxyapatite, indicating that the predominant inorganic phase of these samples is carbonate-substituted hydroxyapatite.
The refined structural parameters obtained for both species are presented in Figure 3b and Table 1. The cell parameters for the two studied samples are similar and slightly higher than standard hydroxyapatite. The a value is reported to be associated with the carbonate content and decreased with age, while the c value, associated with hydroxyl sites, is more stable [14].

3.2. Elemental Analysis and Microstructure

Calcium–phosphate ratios (Ca/P) of stoichiometric hydroxyapatite, which is 1.67, are determined by geochemical phenomena. The Ca/P of samples studied, calculated from energy dispersive spectra (EDS), ranged between 1.37 and 1.47 in mammoth ivory and 1.20 and 1.27 in ivory from an elephant (Table 2), distinctly lower than the standard value, meaning the favorable biologically activity. The nucleation and growth stages of hydroxyapatite occur in a biological system containing various trace elements, and hydroxyapatite exchanges ions with its surroundings to optimize the biological functions. The element Ca is usually replaced by the elements with a similar radius (e.g., magnesium (Mg), sodium (Na)) [5]. Thus, we use the new Ca′ to do the calculation (Ca′ = Ca + Mg + Na). The Ca′/P value does not change significantly among the samples.
Through the Scanning Electron Microscope (SEM) images of the transverse plane (Figure 4a and Figure 5a), both mammoth ivory and ivory from an elephant displayed lamellar structure, and the tabular nature of hydroxyapatite was observed, appearing regularly and tightly. In addition, the morphology of hydroxyapatite crystal may be recognized vaguely. The statistics of its size range and average size are shown in Figure 4b and Figure 5b. The average sizes of both mammoth ivory and ivory from an elephant are similar, and the corresponding values are 29.25 and 28.15 nm, according to the estimation from Figure 4a and Figure 5a. As a check, these values are calculated by the Scherrer equation below. The elemental mapping has been made to explore the elemental distribution, and the most widely distributed elements are C, O, Ca and P, which are the basic constituent elements of hydroxyapatite. In addition, Si, Al and K appeared almost in the same position in the mapping images and implied the existence of kaolinite or other clay minerals here, which has not been reported before to our knowledge. However, further research is needed to explore the reason for the existence of clay minerals.

3.3. Infrared Spectroscopy

Infrared spectra of ivory consist of features clearly assignable to the inorganic matrix and organic protein components. The IR bands for all the samples except fluorapatite have been related to the PO4 group, CO3 groups at both B- and A-sites, and to OH according to the literature [20,21,22,23]. Specific decomposition procedures of complex IR bands into component bands are presented in Figure 6 and the assignments are listed in Table 3.
1700~1200 cm−1 region: The broad band encountered in this region has been decomposed into seven Gaussian components (Figure 6a). CO32− can replace both PO43− (B-type) or OH (A-type) in hydroxyapatite. Three bands (1551, 1454, 1412 cm−1) are related to the CO32− group, which indicates that CO32− substitution can simultaneously occur at the A- and B-site [25,26]. Amounts of CO32− at the A- and B- site can be estimated by the area ratios under the Gaussian curves of A1551/A566 and A1412/A566 [27]. The area and the area ratios are listed in Table 4. Due to the higher value of A1551/A566, CO32− occurs primarily at the A-site of hydroxyapatite in both mammoth ivory and ivory from an elephant. Three bands (1660–1670, 1550–1560, 1240 cm−1) are related to amide Ⅰ, Ⅱ, Ⅲ of collagen and the last one (1630 cm−1) is related to H2O. The relative intensities of collagen bands decrease slightly in mammoth ivory with respect to ivory from an elephant.
900~850 cm−1 region: The band is decomposed into three Gaussian band components at 880, 873, 865 cm−1, the former two of which are related to the CO32− group at the A- and B-site, respectively (Figure 6b). These two bands can also be used to assess the amount of CO32− and imply the conclusion as mentioned above. The band at 865 cm−1 has not been attributed to a specific site [28].
1200~900 cm−1 region and 800~400 cm−1 region: Three Gaussian band components decomposed in the 1200~900 cm−1 region and two in the 800~400 cm−1 region. These bands are all related to the vibration of phosphate.

3.4. Crystalline Characteristics

3.4.1. Crystal Size

Since the peak intensity in X-ray diffraction reflects the degree of crystal order or the perfection of a phase, the relative degree of crystallinity of hydroxyapatite was compared using the full width at half maximum (FWHM) of the (002) peak of different planes, and these two values are inversely proportional [29]. The FWHM of the (002) peak of different planes is shown in Figure 7 and Table 5, where all the values for the planes of mammoth ivory are lower than those for the corresponding planes of ivory from an elephant.
The crystal size measured in the direction perpendicular to the diffracting planes (002) was calculated using the Monshi–Scherrer equation [30].
Ln β = Ln (Kλ/L) + Ln (1/cosθ)
where L is the crystal size in nanometers; λ = 0.154056 nm, which is the X-ray wavelength in nanometers; K is the Scherrer constant (here K = 0.89); β is equal to B1/2-b, where B1/2 is the experimental FWHM intensity of the diffraction peak (002), and b is the width of the same peak measured in highly crystalline hydroxyapatite as a standard; and θ is the diffraction angle for the diffraction peak (002). The calculated L values at the corresponding planes of the two species are shown in Table 5.
The degree of crystal disorder in hydroxyapatite is related to its crystal size. From the above-described results, the relative degree of crystallinity of hydroxyapatite in mam-moth ivory appears to be higher than that in the ivory from an elephant. We further proposed that the difference between these two species may be related to the influence of the burial environment of the mammoth ivory in permafrost. The length dimensions of the individual crystals in mammoth ivory and ivory from an elephant are separately calculated to be 20.41–23.16 and 18.92–21.50 nm, respectively. These calculations were basically consistent with what we observed in 3.2. The FWHM and domain thickness indicated a poorly crystalline form of both biomaterials and a higher relative degree of crystallinity of hydroxyapatite in mammoth ivory.

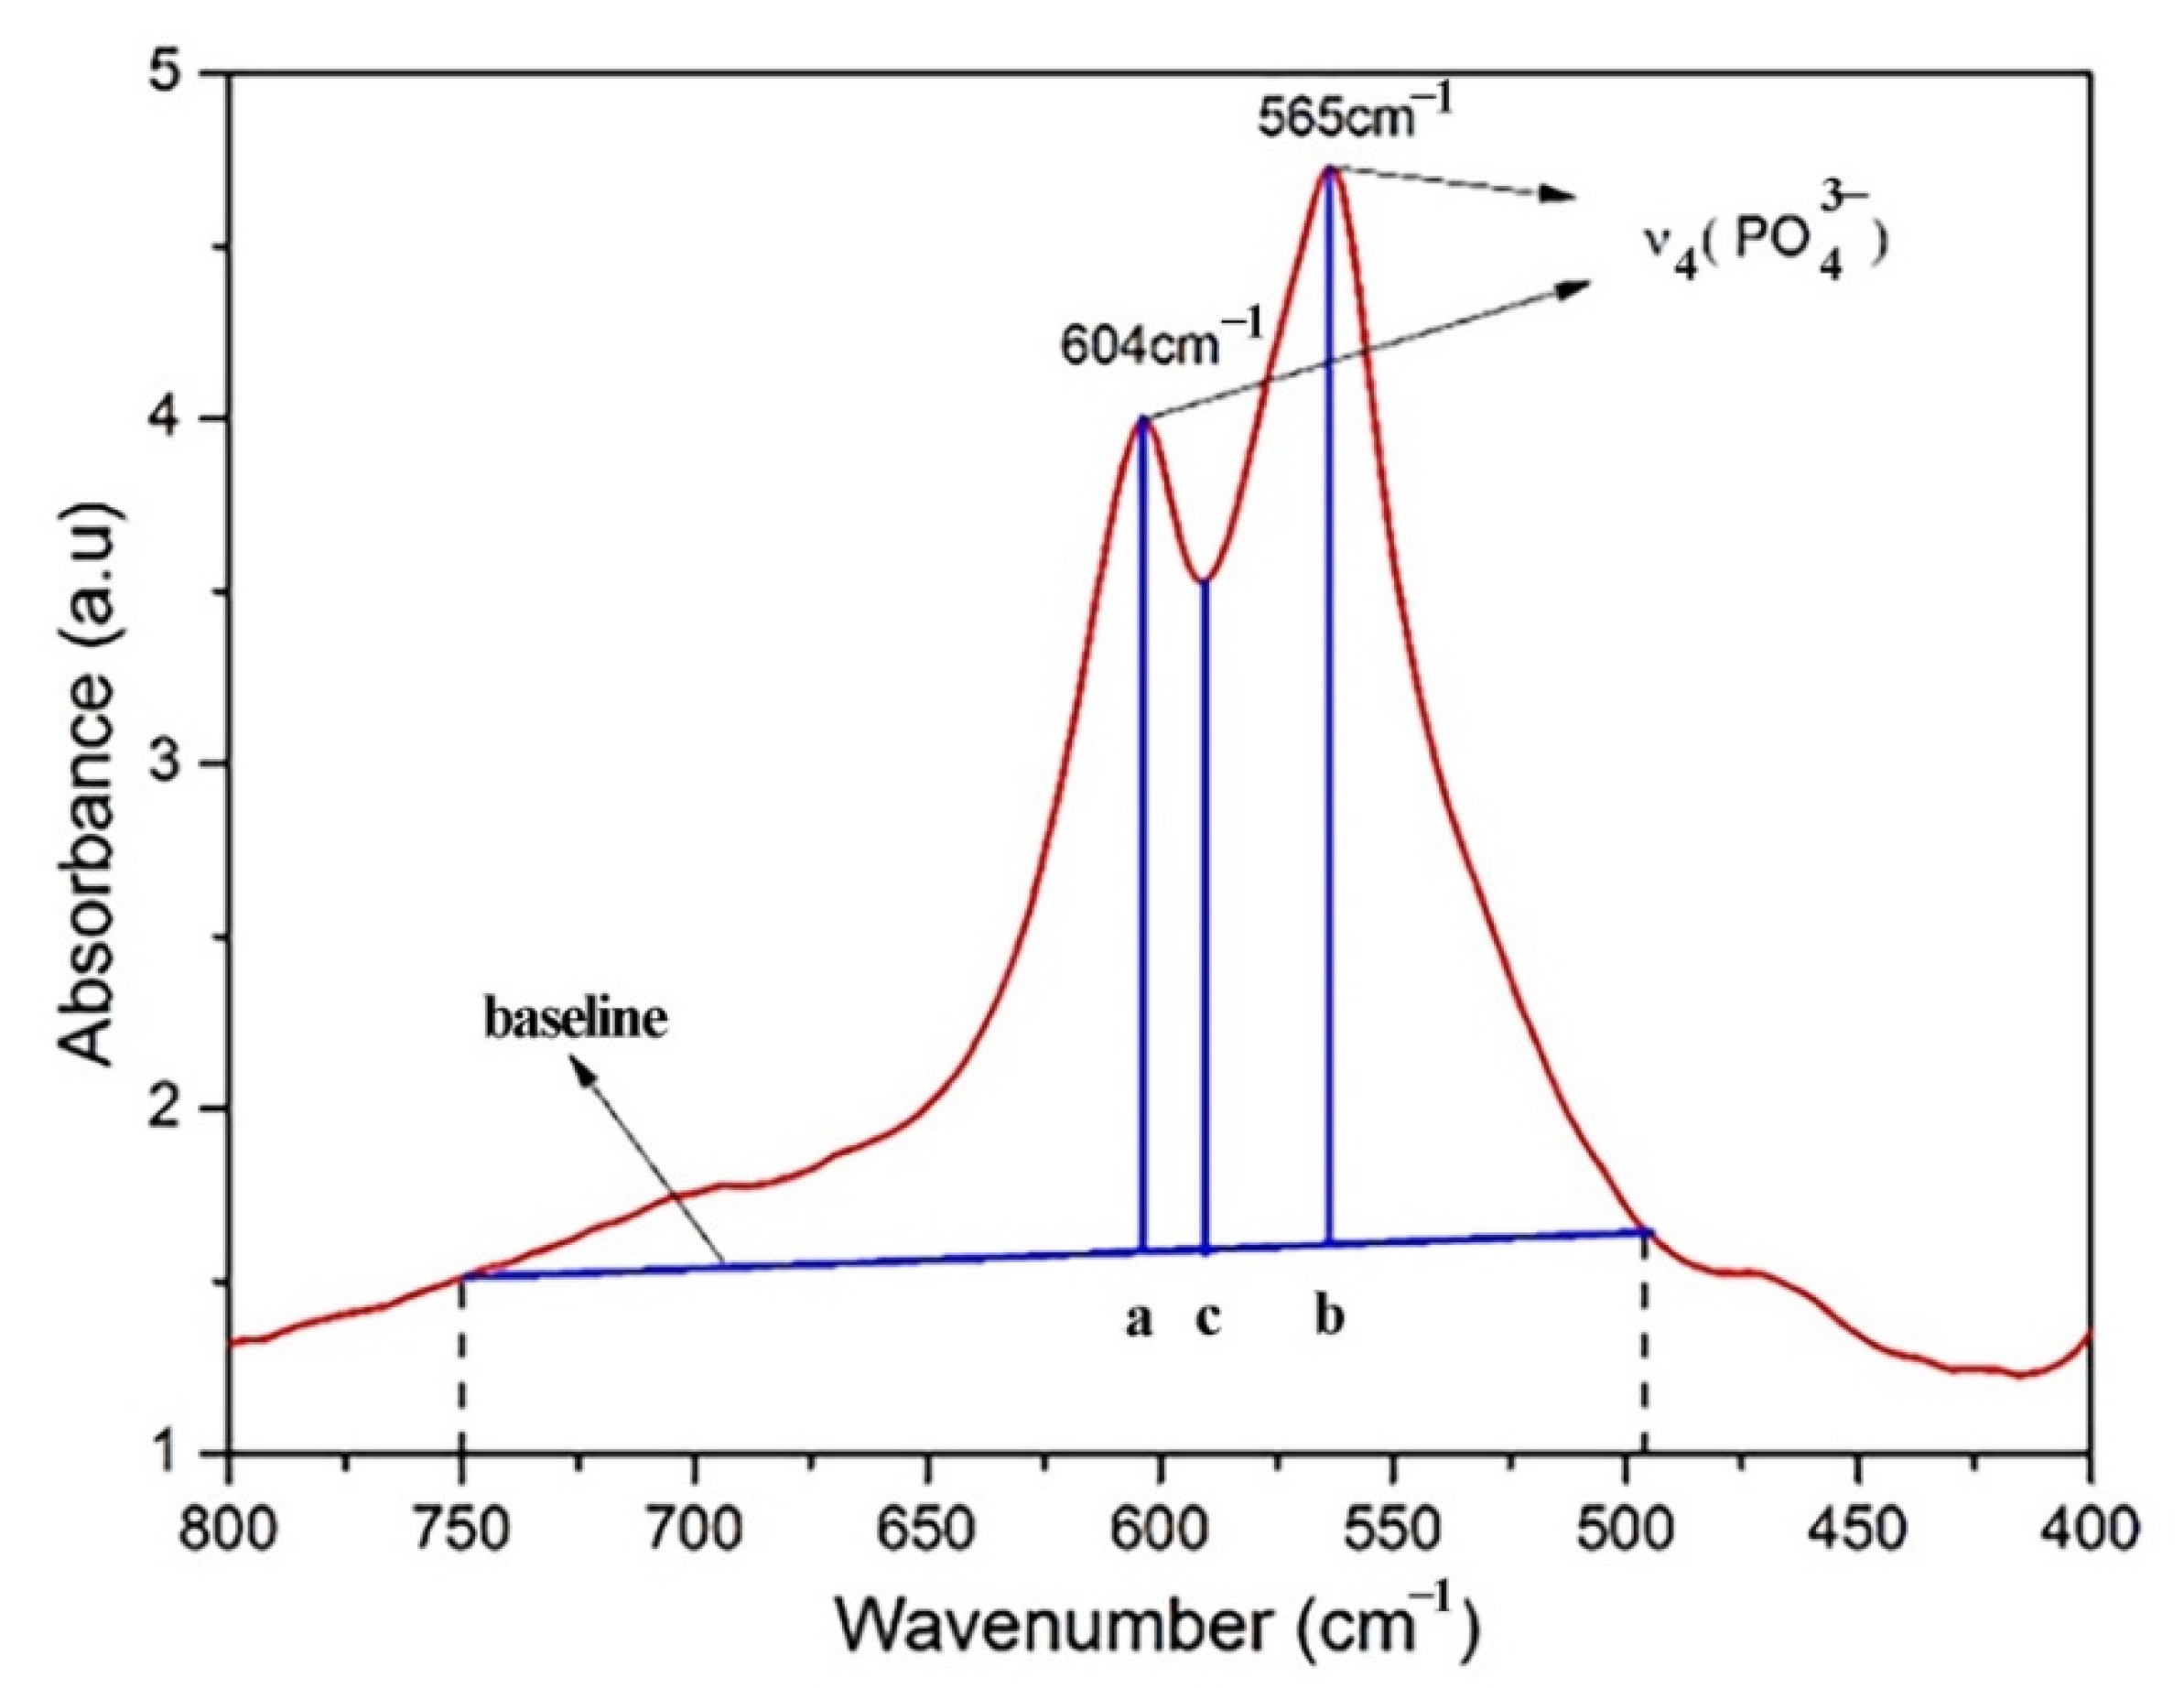
3.4.2. Infrared Splitting Factor and Crystallinity

The degrees of splitting for the phosphate ion antisymmetric bending mode are determined by the weight fraction of crystalline hydroxyapatite; thus, crystallinity may be assessed using the infrared splitting factor (SF), which is based on the division of the phosphate antisymmetric bending mode into two peaks in the region of 560–605 cm−1 for these two phases [29,31,32,33]. Amorphous calcium phosphate gives a broad single absorption band in this region, while the anisotropic local electric field of crystalline apatite partially splits the degeneracy of this absorption band into a well-field doublet [34]. The comparison between the biomaterials and fluorapatite contributes to ensuring that there are no protein absorption bands in the SF region. In this method, a baseline is drawn from approximately 495–750 cm−1. The heights of the 604 cm−1 (a) and 565 cm−1 (b) absorptions are summed and then divided by the height of the valley (c) between them (Figure 8), as shown below.
SF = (a + b)/c
The results are given in Table 6, values obtained were found to be within a 2 percent error. We found the small SF values of mammoth ivory and ivory from an elephant (SFMI-ave = 2.87, SFI-ave = 3.17), both of which are far lower than geological mineral fluorapatite (SFF-ave = 20.5). Take fluorapatite as standard material and the crystallinity of which is considered as 10, then the crystallinity of mammoth ivory and ivory from an elephant is calculated as 1.55 and 1.4, respectively. However, the hydroxyapatite in mammoth ivory with crystal sizes slightly larger than that in ivory from an elephant had slightly higher SF values. Since the variation in SF was produced by fully crystalline hydroxyapatites [31], the results showed that the hydroxyapatite in mammoth ivory and ivory from an elephant are both in the form of weak crystallization, and the mammoth ivory contains more calcium phosphate in the crystalline hydroxyapatite than in the amorphous state.
In addition, we also found a slight growth-dependent change in percentage crystallinity for the biomaterials, which implies the interrelation between the two phases of calcium phosphate in ivory growth. The fact that the innermost layer contains more amorphous than crystalline minerals suggests that amorphous calcium phosphate may be the first mineral deposited during the overall process of ivory formation and, moreover, the calcification process. This is not surprising because amorphous calcium phosphate appears prior to crystalline apatite in a synthetic system on a molecular level [35]. Therefore, there is a possibility that amorphous calcium phosphate can act as a metabolic precursor of crystalline hydroxyapatite in mammoth ivory and ivory from an elephant. The two-phased nature of bio-minerals may prove to be a valuable aid in understanding the molecular basis of the structure of mammoth ivory and ivory from an elephant.

4. Conclusions

This study revealed that microscopic crystalline hydroxyapatite and amorphous calcium phosphate are the main components of mammoth ivory and ivory from an elephant, of which the crystallinity was measured and compared. Refined cell parameters showed a similar value between mammoth ivory (a = 9.4148 Å and b = 6.8821 Å) and ivory (a = 9.4166 Å and c = 6.8841 Å). The estimated sizes of the individual crystals in mammoth ivory and ivory from an elephant are separately calculated to be 20.41–23.16 and 18.92–21.50 nm. CO32− substitution has been explored by specific decomposition procedures of complex IR bands and it proves to occur primarily at the A-site of hydroxyapatite. The crystallinity of mammoth ivory and ivory from an elephant is largely lower than geological fluorapatite due to the bio-mineralization and mammoth ivory has a slightly higher crystallinity. Efforts to explore the relation between bio-mineralization and low crystallinity should be more fully exploited.

Author Contributions

Formal analysis, X.S.; funding acquisition, M.H.; investigation, X.S. and J.W.; methodology, X.S. and M.H.; project administration, M.H.; resources, M.H.; software, X.S. and J.W.; supervision, M.H.; validation, X.S. and M.H.; visualization, X.S. and J.W.; writing—original draft, X.S.; writing—review and editing, M.H. All authors have read and agreed to the published version of the manuscript.

Funding

This research was funded by the National Science and Technology Infrastructure-The National Infrastructure of Mineral, Rock and Fossil Resources for Science and Technology (http://www.nimrf.net.cn, accessed on 25 December 2021), and the Program of the Data Integration and Standardization in the Geological Science and Technology from MOST, China, grant number 2013FY110900-3.

Acknowledgments

The authors would like to thank Fenghai Liu for providing the research samples. Furthermore, the staff members from the X-ray Powder Diffraction Laboratory at the China University of Geosciences (Beijing) and the Institute of Geomechanics of the Chinese Academy of Geological Sciences are thanked.

Conflicts of Interest

The authors declare no conflict of interest.

References

  1. Dove, P.M.; De Yoreo, J.J.; Weiner, S. Biomineralization; Mineralogical Society of America: Washington, DC, USA, 2003. [Google Scholar]
  2. Mann, S. Biomineralization: Principles and Concepts in Bioinorganic Materials Chemistry, 1st ed.; Oxford University Press: Oxford, UK, 2001; pp. 6–12, discussion 24–37. [Google Scholar]
  3. Cui, F.Z. Biomineralization, 1st ed.; Tsinghua University Press: Beijing, China, 2007. [Google Scholar]
  4. Bale, W.F. A Comparative Röntgen-Ray Diffraction Study of Several Natural Apatites and the Apatite-like Constituent of Bone and Tooth Substance. Am. J. Roentgenol. 1940, 43, 735–747. [Google Scholar]
  5. Hendricks, S.B.; Hill, W.L. The Nature of Bone and Phosphate Rock. Proc. Natl. Acad. Sci. USA 1950, 36, 731–737. [Google Scholar] [CrossRef] [PubMed] [Green Version]
  6. Tanner, K.E. Small But Extremely Tough. Science 2012, 336, 1237–1238. [Google Scholar] [CrossRef] [PubMed]
  7. Currey, J. The design of mineralised hard tissues for their mechanical functions. J. Exp. Biol. 1999, 202, 3285–3294. [Google Scholar] [CrossRef] [PubMed]
  8. Robinson, R.A. An electron-microscopic study of the crystalline inorganic component of bone and its relationship to the organic matrix. J. Bone Joint Surg. 1952, 34, 389–435. [Google Scholar] [CrossRef] [PubMed]
  9. Johansen, E.; Parks, H.F. Electron Microscopic Observations on the Three-Dimensional Morphology of Apatite Crystallites of Human Dentine and Bone. J. Cell Biol. 1960, 7, 743–746. [Google Scholar] [CrossRef]
  10. Bocciarelli, D.S. Morphology of crystallites in bone. Calcif. Tissue Res. 1970, 5, 261–269. [Google Scholar] [CrossRef]
  11. Jackson, S.A.; Cartwright, A.G.; Lewis, D. The morphology of bone mineral crystals. Calcif. Tissue Res. 1978, 25, 217–222. [Google Scholar] [CrossRef]
  12. Weiner, S.; Price, P.A. Disaggregation of bone into crystals. Calcif. Tissue Int. 1986, 39, 365–375. [Google Scholar] [CrossRef]
  13. Landis, W.J.; Song, M.J.; Leith, A.L.; Mc Ewen, L.; Mc Ewen, B.F. Mineral and Organic Matrix Interaction in Normally Calcifying Tendon Visualized in Three Dimensions by High-Voltage Electron Microscopic Tomography and Graphic Image Reconstruction. J. Struct. Biol. 1993, 110, 39–54. [Google Scholar] [CrossRef]
  14. Neel, E.A.A.; Aljabo, A.; Strange, A.; Ibrahim, S.; Coathup, M.; Young, A.M.; Bozec, L.; Mudera, V. Demineralization–remineralization dynamics in teeth and bone. Int. J. Nanomed. 2016, 11, 4743–4763. [Google Scholar] [CrossRef] [PubMed]
  15. Su, X.W.; Cui, F.Z. Hierarchical structure of ivory: From nanometer to centimeter. Mater. Sci. Eng. C 1999, 7, 19–29. [Google Scholar] [CrossRef]
  16. Locke, M. Structure of Ivory. J. Morphol. 2008, 269, 423–450. [Google Scholar] [CrossRef] [PubMed]
  17. Sun, X.Y.; He, M.Y.; Wu, J.L. Study of the Preferred Orientation of Hydroxyapatite in Ivory from Zimbabwe and Mammoth Ivory from Siberia. Crystals 2021, 11, 572. [Google Scholar] [CrossRef]
  18. Su, X.W.; Cui, F.Z. Direct Observations on Apatite Crystals in Ivory. J. Mater. Sci. Lett. 1997, 16, 1198–1200. [Google Scholar] [CrossRef]
  19. Rabiei, M.; Palevicius, A.; Dashti, A.; Nasiri, S.; Monshi, A.; Doustmohammadi, A.; Vilkauskas, A.; Janusas, G. X-ray Diffraction Analysis and Williamson-Hall Method in USDM Model for Estimating More Accurate Values of Stress-Strain of Unit Cell and Super Cells (2 × 2 × 2) of Hydroxyapatite, Confirmed by Ultrasonic Pulse-Echo Test. Materials 2021, 14, 2949. [Google Scholar] [CrossRef]
  20. Holcomb, D.W.; Young, R.A. Thermal decomposition of human tooth enamel. Calcif. Tissue Int. 1980, 31, 189–201. [Google Scholar] [CrossRef]
  21. LeGeros, R.Z. Apatites in biological systems. Prog. Cryst. Growth Charact. 1981, 4, 1–45. [Google Scholar] [CrossRef]
  22. Young, R.A.; Wiles, D.B. Application of the Rietveld Method for Structure Refinement with Powder Diffraction Data. Adv. X-ray Anal. 1980, 24, 1–23. [Google Scholar] [CrossRef]
  23. Farmer, V.C. The Infrared Spectrum of Minerals; Science Press: Beijing, China, 1982. [Google Scholar]
  24. Rehman, I.; Smith, R.; Hench, L.L.; Bonfield, W. Structural evaluation of human and sheep bone and comparison with synthetic hydroxyapatite by FT-Raman spectroscopy. J. Biomed. Mater. Res. 1995, 29, 1287–1294. [Google Scholar] [CrossRef]
  25. Vignoles, M.; Bonel, G.; Holcomb, D.W.; Young, R.A. Influence of preparation conditions on the composition of type B carbonated hydroxyapatite and on the localization of the carbonate ions. Calcif. Tissue Res. 1988, 43, 33–40. [Google Scholar] [CrossRef]
  26. Ito, A.; Aoki, H.; Akao, M.; Teraoka, K.; Tsutsumi, S.; Onuma, K.; Tateishi, T. Hydrothermal Growth of Carbonate-containing Hydroxyapatite Single Crystals. J. Cryst. Growth. 1996, 163, 1311–1317. [Google Scholar] [CrossRef]
  27. Michel, V.; Ildefonse, P.; Morin, G. Chemical and Structural Changes in Cervuselaphus Tooth Enamels during Fossilization (Lazaret Cave): A Combined IR and XRD Rietveld Analysis. Appl. Geochem. 1995, 10, 145–159. [Google Scholar] [CrossRef]
  28. Rey, C.; Renugopalakrishnan, V.; Shimizu, M.; Collins, B.; Glimcher, M.J. A Resolution-enhanced Fourier Transform Spectroscopic Study of the Environment of the CO32- ion in the Mineral Phase of Enamel during its Formation and Maturation. Calcif. Tissue Int. 1991, 49, 259–268. [Google Scholar] [CrossRef]
  29. Sillen, A.; Sealy, J.C. Diagenesis of Strontium in Fossil Bone: A Reconsideration of Nelson et al. (1986). J. Archaeol. Sci. 1995, 22, 313–320. [Google Scholar] [CrossRef]
  30. Rabiei, M.; Palevicius, A.; Monshi, A.; Nasiri, S.; Vilkauskas, A.; Janusas, G. Comparing Methods for Calculating Nano Crystal Size of Natural Hydroxyapatite Using X-Ray Diffraction. Nanomaterials 2020, 10, 1627. [Google Scholar] [CrossRef]
  31. Termine, J.D.; Posner, A.S. Infrared Analysis of Rat Bone: Age Dependency of Amorphous and Crystalline Mineral Fractions. Science 1966, 153, 1523–1525. [Google Scholar] [CrossRef]
  32. LeGeros, R.Z.; Tung, M.S. Chemical Stability of Carbonate- and Fluoride-Containing Apatites. Caries Res. 1983, 17, 419–429. [Google Scholar] [CrossRef] [PubMed]
  33. Weiner, S.; Bar-Yosef, O. States of preservation of bones from prehistoric sites in the Near East: A survey. J. Archaeol. Sci. 1990, 17, 187–196. [Google Scholar] [CrossRef]
  34. Stutman, J.M.; Termine, J.D.; Posner, A.S. Vibrational spectra and structure of the phosphate ion in some calcium phosphates. Trans. N. Y. Acad. Sci. 1965, 27, 669–675. [Google Scholar] [CrossRef]
  35. Eanes, E.D.; Posner, A.S. Division of Biophysics Kinetics and Mechanism of Conversion of Noncrystalline Calcium Phosphate to Crystalline Hydroxyapatite. Trans. N. Y. Acad. Sci. 1965, 28, 233–241. [Google Scholar] [CrossRef]
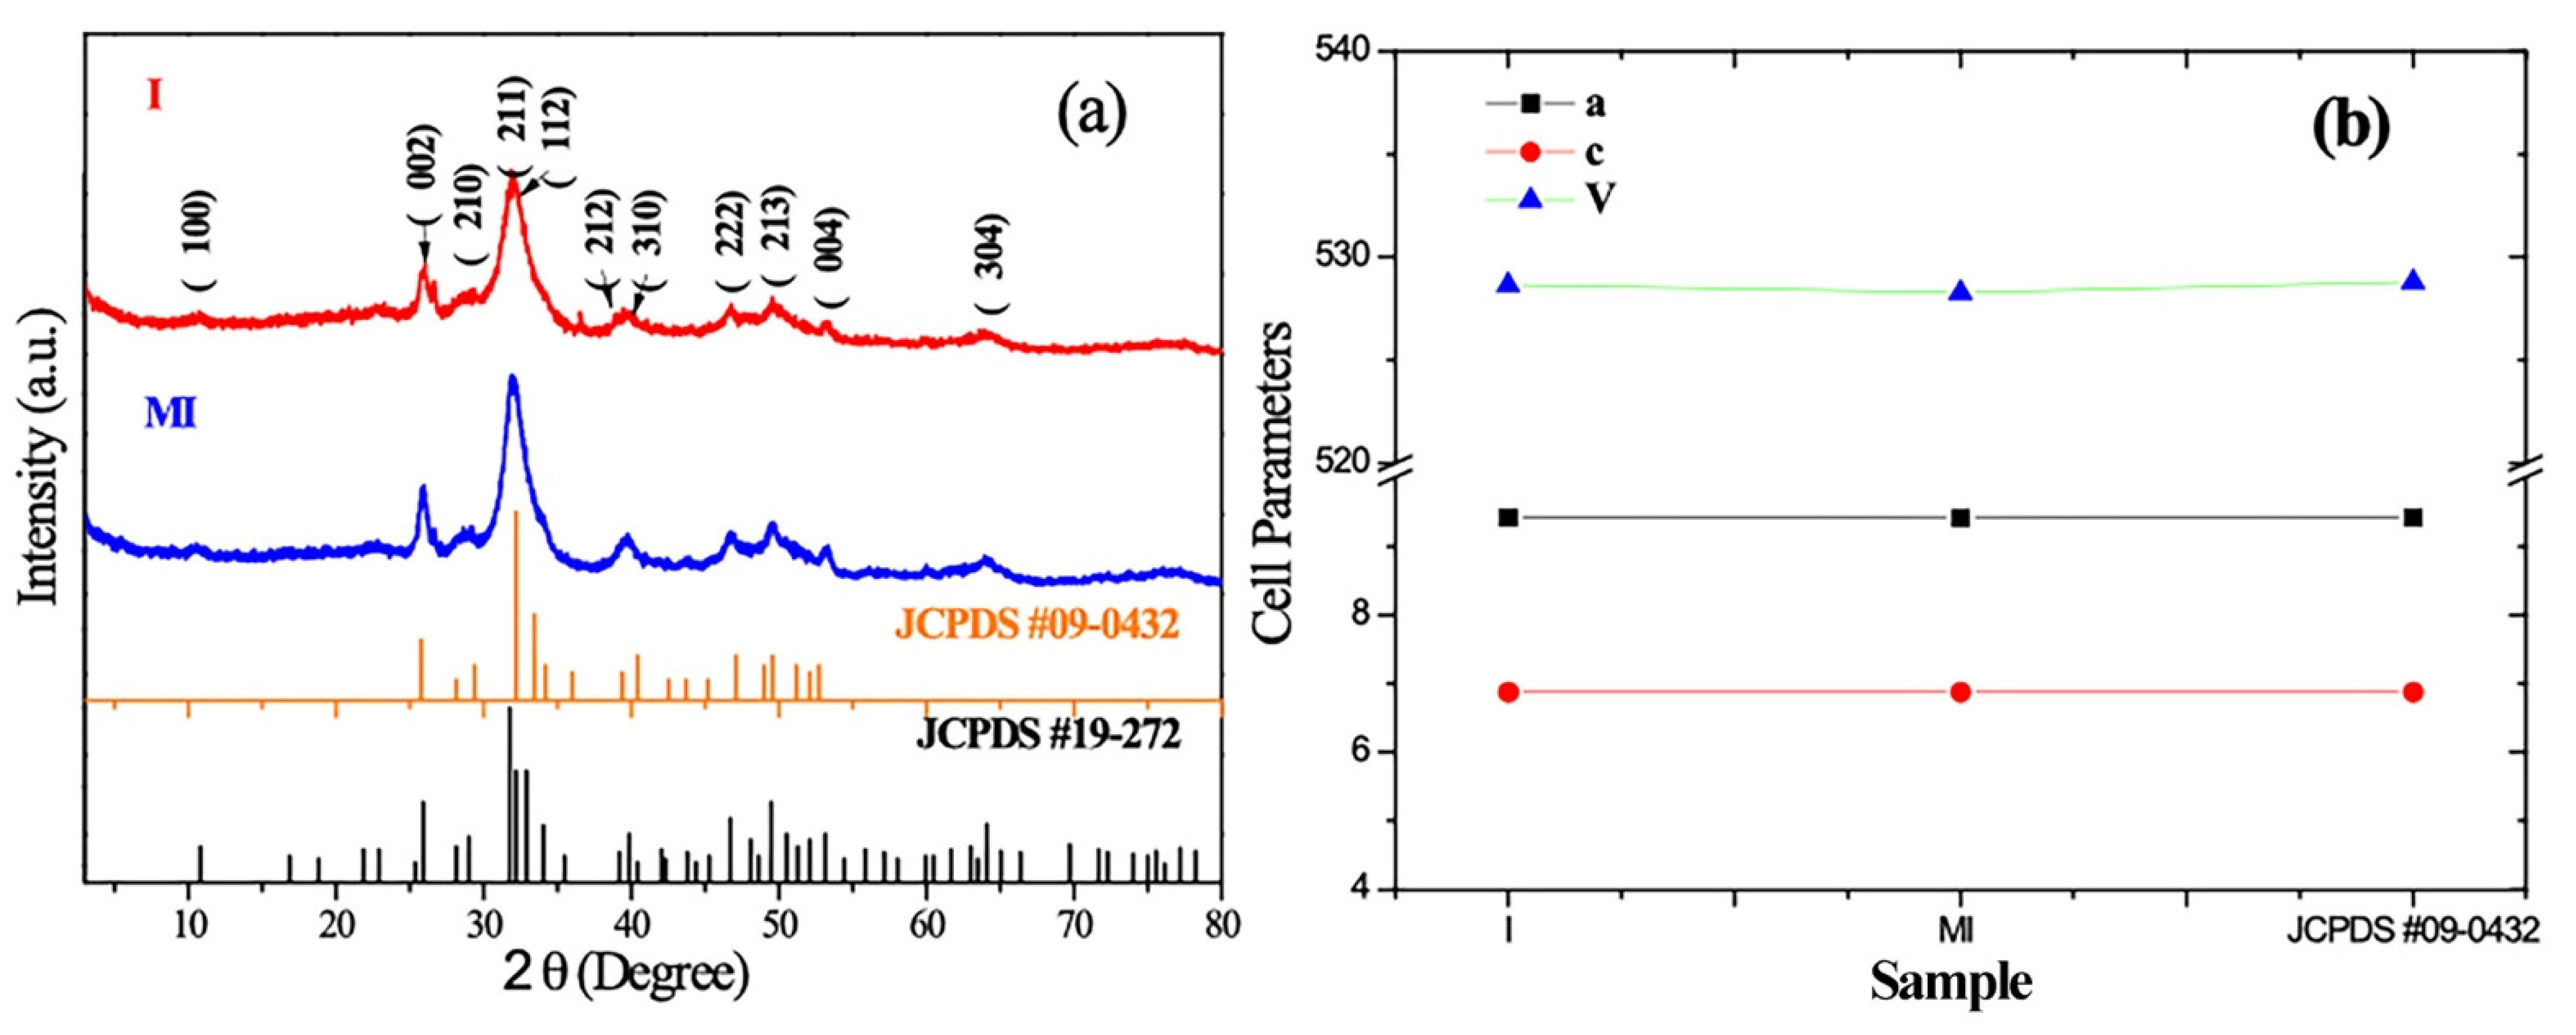
Figure 1. Photographs of specimens studied: (a) a sample of mammoth ivory from mammoth in Russia (Siberia); (b) a sample of ivory from adult Zimbabwean elephants; (c) Fluorapatite.
Minerals 12 00117 g001
Figure 2. Schematic diagram of Retzius. This pattern consists of alternative lines interweaving to form a network, which begins at the center of the tusk and sweeps outwards to the periphery [17].
Minerals 12 00117 g002
Figure 3. (a) The XRD patterns of mammoth ivory, ivory from elephant samples and standard profile of hydroxyapatite and carbonated hydroxyapatite (JCPDS #09-0432 and #19-272); (b) the cell parameters.
Minerals 12 00117 g003
Figure 4. SEM image of the Retzius layer in transverse planes in mammoth ivory: (a) 200 nm magnification; (b) histogram of the particle size distribution drawn for 200 nm; (c) elemental mapping of the Retzius layer in mammoth ivory.
Minerals 12 00117 g004
Figure 5. SEM image of the Retzius layer in transverse planes in ivory from an elephant: (a) 200 nm magnification; (b) histogram of the particle size distribution drawn for 200 nm; (c) elemental mapping of the Retzius layer in ivory from an elephant.
Minerals 12 00117 g005
Figure 6. Infrared spectra of mammoth ivory and ivory from an elephant fitted by Gaussian functions with different wavenumber ranges (a) 1700~1200 cm−1; (b) 1200~900 cm−1; (c) 900~850 cm−1; (d) 800~400 cm−1.
Minerals 12 00117 g006
Figure 7. Comparison of (002) peak of mammoth ivory, ivory from an elephant and fluorapatite.
Minerals 12 00117 g007
Figure 8. The portion of the infrared spectrum of sample I-R-2 used for calculating the crystallinity. Splitting factor (SF) measurement for the 600 cm−1 phosphate ion antisymmetric bending frequency in the calcium phosphate based on the calculation method of Weiner [33].
Minerals 12 00117 g008
Table 1. The cell parameters (a0 and c0) of ivory from an elephant and mammoth ivory.
a/Åσac/ÅσcV/Å3σV
I9.41660.01956.88410.0006528.651.0981
MI9.41480.01786.88210.0006528.290.9996
JCPDS #09-04329.4186.884528.8
Table 2. EDS data of mammoth ivory and ivory from an elephant.
TitlewB/%Ca/PCa′/P
COCaPMgNa
MIOL36.937.413.87.81.00.41.371.60
RL32.942.514.67.70.70.41.471.65
IOL37.040.711.06.71.20.61.271.62
RL30.038.113.28.51.50.51.201.50
Ca/P, Ca′/P are calculated molar ratios; Ca′ = Ca + Mg + Na.
Table 3. Observed infrared band positions (cm−1) of mammoth ivory and ivory from an elephant [24].
IR Absorption BandsPositions (cm−1)
MII
ν(C=O) amide I16601661
H2O16301631
δ(N-H); ν(C-H) amide Ⅱ15571558
ν3 (CO)15511552
14541456
14121411
δ(N-H); ν(C-N) amide Ⅲ12391239
ν3 (PO)11041106
10381036
ν1 (PO)960959
ν2 (CO)880880
873871
ν4 (PO)608607
566569
Table 4. Areas and area ratios of IR bands of mammoth ivory and ivory from an elephant.
BandsMammoth IvoryIvory from an Elephant
cm−1Areacm−1Area
ν3 (C-O)A15516.3515525.69
B14125.0114113.28
ν2 (C-O)A88027.7288019.88
B8738.5687211.53
ν4 (P-O)5667.195696.49
Area ratios A1551/A5660.8830.877
A1412/A5660.6970.505
A880/A5663.0633.855
A873/A5661.7761.191
Table 5. The FWHM of the (002) peak of different planes and the domain thickness of the mammoth ivory and the ivory from an elephant.
θ/(°)FWHM ((002))β/radL(002)/nm
Ivory from an elephantTP12.960.3750.00654521.50
CP12.960.3990.00696420.20
RP12.960.4260.00743518.92
Mammoth ivoryTP12.940.3480.00607423.16
CP12.960.3920.00684220.56
RP12.960.3950.00689420.41
Table 6. Spitting factor and crystallinity of mammoth ivory and ivory from an elephant.
SampleSample NumberSFC
Ivory from an elephantMI-IL3.171.55
MI-RL-1 *3.231.58
MI-RL-2 *3.261.59
MI-RL-3 *3.121.52
MI-RL-4 *3.161.54
Mammoth IvoryI-IL15511.58
I-RL-1 *14541.59
I-RL-2 *14121.52
I-RL-3 *12391.54
Fluorapatite20.510
* Note: RL-1~RL-4 means the different positions in the Retzius layer beginning at the center and sweeping outwards to the periphery, see Figure 2.
Publisher’s Note: MDPI stays neutral with regard to jurisdictional claims in published maps and institutional affiliations.

