Article

Experimental and Analytical Investigation into the Synergistic Mechanism and Failure Characteristics of the Backfill-Red Sandstone Combination

1
School of Resources Engineering, Xi’an University of Architecture and Technology, Xi’an 710055, China
2
International Joint Research Laboratory of Henan Province for Underground Space Development and Disaster Prevention, Henan Polytechnic University, Jiaozuo 454003, China
*
Authors to whom correspondence should be addressed.
Minerals 2022, 12(2), 202; https://doi.org/10.3390/min12020202
Submission received: 13 December 2021 / Revised: 28 January 2022 / Accepted: 3 February 2022 / Published: 4 February 2022
(This article belongs to the Special Issue Failure Characteristics of Deep Rocks)

Abstract

:
The stability of underground goaf in filling mining is dominated by the interaction mechanism of the backfill-surrounding rock combination. In order to investigate the interaction mechanism and failure characteristics of the backfill-surrounding rock combination, backfill-red sandstone combinations with three different cement–sand ratios were prepared for uniaxial compression tests. The deformation and failure characteristics of the specimens were analyzed. It was found that at the cement–sand ratio of 1:4, the backfill and red sandstone interacted with and restricted each other, and the through cracks appeared in the whole specimens, which indicated that the backfill and red sandstone can jointly resist external loads and play a role in common bearing. However, with the decrease of the cement–sand ratio, the stress mainly acts on the backfill, and the deformation observed in the backfill is large while there is no obvious rupture in the rock. Based on the failure characteristics and the stress–strain curves of the specimens, the damage constitutive relationship that can describe the failure process and deformation characteristics is proposed. Correlated with the experiment results, the damage constitutive equation is established in three stages including compaction pre-synergy stage, quasi-elastic synergy deformation stage and rupture deformation stage. The failure characteristics observed in each stage are analyzed. The research results are of great significance to accurately understanding the interaction between backfill and surrounding rock, which can be used to design and select the mixture ratio of the filling materials.

1. Introduction

Deep mining is one of the major technical issues faced by the mining industry. With the increase of mining depth, the ground pressure and roadway offset increase resulting in frequent occurrence of rock burst, which significantly increases the difficulties in maintaining the stability of roadway and stope. The filling mining method is more and more widely used for its high resource recovery rate, which also effectively prevents roof caving and stope collapse, as well as meets the requirements of green mine construction. In the process of underground filling, the surrounding rock and filling form a kind of heterogeneous, discontinuous and nonlinear special support. The surrounding rock and filling work together to bear the load of overburden, which has complex mechanical properties and deformation and failure mechanisms [1,2,3]. Therefore, it is necessary to establish the common bearing mechanical model of backfill-surrounding rock combination (BSRC) and study the damage evolution characteristics of surrounding rock and backfill after reasonable matching, which has an important reference value for exploring the damage and failure mechanism of the BSRC model in deep mining.
In order to improve the safety of underground filling mining areas, a lot of research on the mechanical properties, loss and failure characteristics of rock and backfill have been carried out world widely [4,5,6,7]. In terms of rock damage and failure, many scholars have analyzed the damage evolution in the process of rock deformation, and failure through experimental means and established constitutive models [8,9,10,11]. Bustamante et al. [12] proposed a nonlinear constitutive relation to simulate the properties of sandstone and studied the compressional and shear wave properties of rock under compression, finding that the compressional wave velocity is related to the compressive load. Zhao et al. [13] discussed the fracture toughness and subcritical crack propagation of rock under different environments, established a simple and practical rheological fracture model of rock crack and proposed a modified shear strength model of filled joint. Shahin et al. [14], based on viscoelastic and nonlinear dynamics, gave a mechanical interpretation of compaction creep and defined a constitutive operator to describe the evolution of compaction creep, so as to evaluate the spontaneous accumulation of pore collapse in the active compaction zone. In addition, by comprehensively considering the effects of damage threshold and residual strength, the Drucker Prager criterion, Harris function, Nishihara shear creep model and Burgers shear creep model of rock micro unit strength were improved; the deformation characteristics and long-term shear strength of rock during creep were analyzed, and the statistical constitutive models of rock damage and strain softening were established, respectively [15,16,17,18,19]. In terms of backfill, many scholars have conducted a lot of research on the properties and failure modes of filling materials [20,21]. Shahsavari et al. [22] considered the different behaviors and irreversible thermodynamics of concrete in tension and compression, decomposed the Gibbs potential energy of concrete into three parts, elasticity, damage and healing, and obtained the evolution equation of damage and healing variables by using Clausius Duhem inequality. In addition, lots of laboratory tests on filling materials with different lime sand ratio have been conducted. Based on the experimental results and damage mechanics theory and combined with the research results of fracture characteristics of different filling materials, the defect coupling constitutive models based on continuous damage mechanics were established [23,24,25]. With the wide application of filling mining method, the existing research on the deformation and failure of filling material and backfill under load is also more in-depth.
The above studies only focus on the damage evolution process of rock or backfill under different conditions. Considering that in the process of underground filling, the backfill is greatly affected by confining pressure from the surrounding rock. Koupouli et al. [26] showed that the interface of backfill with low cement content showed strain hardening behavior, and the shear strength between backfill and surrounding rock was affected by cohesion and internal friction angle. Fang et al. [27] experimentally studied the influence of different curing temperatures on the shear behavior and strength of the CPB-rock interface and found that higher curing temperature could improve cement hydration and self-drying rate, thus increasing the peak shear stress at the interface between CPB and rock in the early stage. Falaknaz et al. [28] used the numerical simulation method to create the response of two adjacent filling stopes. Based on the explicit relationship between Poisson’s ratio and the friction angle in the backfill, the stress state of the filling stope was changed. The simulation results expressed in stress, displacement and strain explained the influence of different parameters and evaluated the interaction between the filling material and surrounding rock to ensure the safe application of the filling material. The above research on the combined action of surrounding rock and backfill mainly involved their mechanical action mechanism and only studied the failure law, without considering the synergistic effect, and thus the damage constitutive model was established [29,30,31,32]. The surrounding rock and backfill were regarded as independent individuals and studied their roles under different combination structure modes, respectively. However, under the action of load, the surrounding rock and backfill form a composite by compression contact coupling. The properties and strength of the two materials are different, and the deformation and failure mode and law will inevitably change.
In this study, the backfill-red sandstone combination is prepared by red sandstone and full tailings cemented backfill with different cement–sand ratios. The uniaxial compression tests are carried out, and the deformation and failure characteristics of the composites in the uniaxial compression process are analyzed. The appropriate cement–sand ratio to realize the synergy between red sandstone and backfill is obtained. According to the stress–strain curve of the specimens during the compressing process, the damage constitutive relationship of the backfill-red sandstone combination under uniaxial compression is analyzed. Combined with the damage constitutive and elastic–plastic theory, the damage process is divided into three stages including compaction pre-synergy stage, quasi-elastic synergy deformation stage and rupture deformation stage. The damage constitutive model of the backfill-red sandstone combination is established which is able to describe the damage evolution law of the synergistic action between the surrounding rock and backfill. The obtained results provide an important reference value for improving the damage theory and failure mechanism of interaction between surrounding rock and backfill.

2. Experiment

2.1. Experimental Materials

2.1.1. Tailings

The tailings selected as aggregates in this research were collected from an iron mine in Shaanxi, China. The main chemical compositions of tailings obtained through analysis are shown in Table 1. The main chemical compositions are Fe2O3 and SiO2, accounting for 88% of the total solid weight. The content of SiO2 is 67.72%, indicating that the tailings are high-silicon iron tailings.
The particle size distribution is illustrated in Figure 1. The average particle size of the tailings d50 is 86.40 μm, the non-uniformity coefficient Cu is 5.70, and the curvature coefficient Cc is 1.39, indicating that the iron tailings have good gradation, compaction and mechanical properties.

2.1.2. Backfill Material

The backfill materials are composed of iron tailings, P.O42.5 cement and city tap water. P.O42.5 cement is used as gelling agents in the experiment. By adjusting the quality of cement, iron tailings and water, the filling slurry with different cement–sand ratio can be prepared. The backfill samples were selected with different cement–sand ratios (1:4, 1:6, and 1:8, respectively), and material concentration of 80%. According to the designed material ratio, three specimens with the same cement–sand ratio were in each group, and three groups of nine standard cylindrical specimens with dimensions of 50 and 100 mm in diameter and height were prepared. Nine specimens were marked and placed in a curing box for curing for 28 days with the curing temperature of 20 ± 5 ℃ and relative humidity of 95% ± 5%. Then, the backfill specimens were taken out for UCS test. The strength characteristics of specimens are shown in Table 2. With the change of the cement–sand ratio, there is an obvious gradient change in the compressive strength of the backfill. The strength of the backfill increase with the increase of the cement–sand ratio. The larger the cement–sand ratio, the higher the strength of the backfill.

2.1.3. Red Sandstone

The surrounding rock in this research was red sandstone with good uniformity. The average density of red sandstone is 2132 kg/m3; the uniaxial compressive strength (UCS) of red sandstone cylinder specimen with 50 mm in diameter and 100 mm in height is 22.39 MPa (average value).
By comparison, it is observed that there is a large difference in uniaxial compressive strength between the red sandstone and backfill. The backfill-red sandstone combination specimen is composed of two materials with different strength. How to realize a synergistic effect between two different materials with large strength difference is the focus of this paper.

2.2. Specimen Preparation

In strict accordance with the standard for test methods of engineering rock mass, code for rock test of water conservancy and Hydropower Engineering (DL/t5368-2007) and the standards recommended by the international society of rock mechanics, the red sandstone is prepared into a standard cylindrical sample with a diameter of 50 mm and a height of 50 mm, as shown in Figure 2a. The full tailings from iron ore, cement and water were used to make the slurry with a cement–sand ratio of 1:4, 1:6, 1:8 and mass fraction of 80%. The standard red sandstone sample (Φ 50 mm × H 50 mm) was placed in cylinder mold with size Φ 50 mm × H 100 mm, and then, the evenly stirred filling slurry with different proportions was slowly injected into the cylinder mold until the liquid level was flat with the mold, as shown in Figure 2b. After the filling slurry was fully cemented and solidified, the surface was troweled. Then, the prepared composite specimens were placed in the standard curing box for curing for 28 days. The curing environment was the same as in the backfill experiment. In total, 3 groups of backfill-red sandstone combination specimens with different cement–sand ratio were finally prepared, as shown in Figure 2c.

2.3. Testing Procedures

The microcomputer controlled electro-hydraulic servo universal testing machine after improvement was used for the uniaxial compression test, and the loading adopted displacement control mode, as shown in Figure 3. The composite specimen was placed on the pressure plate. Due to the different material properties of the backfill body and red sandstone, the strain gauges were pasted on the backfill and red sandstone, respectively, to collect the strain data of the two parts. The attached positions are shown in Figure 3. (Strain gauge BFH120-10AA-D150, sensitivity coefficient 2.0 ± 1%, resistance 120 Ω). The strain gauges were connected to the strain measuring instrument to obtain the strain data during the compression process of the specimen. The strain instrument transmitted data to the computer to obtain the actual stress–strain curve of the composite specimen. During the loading process, especially near the peak failure, the failure process was carefully observed and photographed. When the specimen entered the residual strength stage, it could be seen that with the increase of strain, the stress remained basically unchanged, and the test stopped.
The mechanical parameters obtained from the uniaxial compression test are shown in Table 3. σp and σr represent the peak stress and residual stress, respectively. εp and E represent the peak strain and elastic modulus. The variables of σp, σr, εp and E were obtained from the stress–strain curves. The elastic modulus E is defined as the tangent of the secants corresponding to 30%–60% of the peak stress [33].

3. Results and Analysis

3.1. Stress–Strain Curves

Due to the different material properties of the backfill and red sandstone, the strain gauges were pasted on the backfill and red sandstone, respectively, to collect the strain data from the two parts. The stress–strain curves of the backfill and red sandstones were obtained in the uniaxial compression tests, as shown in Figure 4, Figure 5 and Figure 6. The different lines in the stress–strain curves represent different parts of the specimens rather than different materials. The red line represents the stress–strain curve drawn by the data collected from the strain gauges affixed to the red sandstone during loading, while the blue line is the stress–strain curve drawn by the data from the strain gauges on the upper backfill. The gray line represents the synthesis of the two parts, namely, the stress–strain curve of the backfill-red sandstone composite specimen from the load equipment.
The stress–strain curves of the specimens with the cement–sand ratio of 1:4 (HB4) in the uniaxial compression tests are displayed in Figure 4. According to the stress–strain curves, the failure process could be separated into several stages. The first stage is compaction pre-synergy stage. During this period, the microcracks or gaps in the composite are continuously compacted with the strain increased rapidly for both the backfill and red sandstone. With the continuous increases of axial load, there is an obvious inflection point in the stress–strain curve of the specimen; the value of this inflection point is about three quarters of the compressive strength of the backfill with cement–sand ratio of 1:4. The reason for this phenomenon is that there is an interface between the backfill and red sandstone, which is different from the complete rock sample, resulting in the plastic yield of the upper backfill under load. This stage is also a key preparation stage for the synergy between the upper backfill and the lower red sandstone. The second stage is the quasi-elastic synergy deformation stage. It occurs between the inflection point in the previous stage and the peak stress. At this stage, the stress–strain curve of the specimen is approximately linear. The reason for this phenomenon is that the upper backfill and the lower red sandstone basically achieve synergy. The upper backfill and the lower red sandstone bear the load together. The third stage is the rupture deformation stage. After reaching the peak stress, the stress decreases rapidly while the strain increases rapidly. The curve shows an obvious parabolic shape. At this stage, the upper backfill and the lower red sandstone fully realize the synergistic support. The micro ruptures in the composite continue to expand, producing new ruptures and large through ruptures in the specimens. During this process, the strength of the composite specimens did not completely lose. The bearing capacity gradually decreased with the increase of strain, showing an obvious softening phenomenon.
The deformation trends of the curves in Figure 4 are consistent, the failure modes of the upper and lower components of the backfill-red sandstone combination specimens are basically the same, and the shear failure occurred in both the red sandstone part and the backfill part. This observation indicated that the upper backfill and the lower red sandstone can achieve coordinated deformation and jointly resist damage. In the compaction pre-synergy stage, due to the interface between the upper backfill and the lower sandstone, there is an obvious inflection point in the stress–strain curve. At this stage, the upper backfill first reaches plastic yield, but there is no crack on the surface. Therefore, in the next stage, the synergistic effect between the upper backfill and the lower red sandstone is obvious, the stress–strain curve is approximately linear, and the stress increases continuously with the increase of strain. After reaching the peak value, the composite specimen produces through cracks as a whole, and the stress does not decrease rapidly, but there is a small section of basic stability maintenance state, at which time the strain continues to increase. With the continuous increase of load, the strain continues to increase, while the stress begins to decrease rapidly, and finally reaches the residual strength of the specimen.
The stress–strain curves of the specimens with the cement–sand ratio of 1:6 (HB6) are shown in Figure 5. Due to the huge difference in the deformation between the backfill and red stone, the upper backfill and the lower red sandstone failed to realize the overall synergy resistance during the compression tests. Therefore, compared with the 1:4 composite specimens, there is no obvious inflection point in the stress–strain curve. Additionally, after reaching the peak stress, only the upper backfill breaks and produces plastic deformation. During the loading process, due to the large deformation of the upper backfill, there was no obvious through rupture in the lower red sandstone, which indicated the failure mostly occurred in the backfill parts.
Figure 6 shows the stress–strain curve of the specimens with the cement–sand ratio of 1:8 (HB8) under uniaxial compression. The deformation process of the composite specimen is similar to that of HB6. With the continuous application of load, the strain increase rate is significantly greater than the stress increase rate, and the stress–strain curve of the backfill part basically coincides with the stress–strain curve of the composite specimen. The stress–strain curve of the lower red sandstone is obviously different from that of the backfill. During the loading process, the deformation of the backfill is large. After the stress reaches the peak value, there is a step decline and obvious plastic deformation, which further shows that the load mainly acts on the backfill. The experiment ended with the destruction of the backfill without obtaining the residual strength of combination.
Comparing the variation characteristics of stress–strain curves of the specimens with three different cement–sand ratios, it can be found that the strain of red sandstone gradually decreases with the decrease of the cement–sand ratio. When the cement–sand ratio is 1:8, the failure of red sandstone at the bottom of the composite is not obvious. The strain of the backfill gradually increases with the decrease of the cement sand ratio. The final stress and strain mainly act on the backfill, and the main damage of the composite is the backfill.

3.2. Macroscopic Failure Patterns

Three composite specimens with the most representative failure characteristics are selected from nine specimens, as shown in Figure 7. Figure 7a shows the macroscopic failure phenomenon of composite specimen HB4-3. It is obvious that the cracks occur in both the backfill and red sandstone. The backfill first has cracks and large deformation. With the continuous increase of stress, the red sandstone splits after reaching the peak, indicating that the backfill limits the evolution of rock displacement and damage to a certain extent. Figure 7b shows the macroscopic failure phenomenon of the composite specimen HB6-1. Cracks first appear in the backfill and extend downward to the contact surface. The edges and corners of red sandstone specimens are slightly damaged, and the cracks in the upper backfill are further expanded and damaged, finally showing a “V” rupture. Figure 7c shows the macroscopic failure phenomenon of composite specimen HB8-1. With the continuous increase of load, the red sandstone was not damaged, but the backfill was seriously damaged, and finally the occurrence of failure was “flaking”.

3.3. Deformation and Failure Characteristics

The backfill-red sandstone combination is composed of two different materials, which is different from the intact rock or backfill, and its bearing mechanism is different. When the composite specimen is subjected to load, the two materials interact and restrict each other. Nine stress–strain curves are summarized and analyzed, and three groups of typical stress–strain curves of backfill-red sandstone combinations with different ratios are obtained, as shown in Figure 8. It can be seen that the peak strength of backfill-red sandstone combination specimens decreases with the decrease of the cement–sand ratio. The residual strength of HB4 is large. At the cement–sand ratio of 1:4, the red sandstone and the backfill jointly resist the external load, and the stress continues to increase with the increase of strain. For the composites HB6, the residual strength is smaller. With the increase of load, the strain increases rapidly, but the strain of the lower part of the red sandstone increases slowly and remains constant after reaching the peak. Therefore, the red sandstone part has not undergone large deformation, which shows that the strength of the backfill under this cement–sand ratio fails to match well with the red sandstone, and the synergy cannot be realized. At the cement–sand ratio of 1:8, the load completely acts on the backfill, and the strain of the red sandstone almost tends to zero. The stress–strain curve of composite specimen with the cement–sand ratio of 1:8 can be approximately regarded as the stress–strain of the backfill. The difference in the mechanical properties and failure patterns of the specimens suggest that it is necessary to reasonably optimize the cement–sand ratio of the backfill to realize synergy support of the red sandstone and the backfill.

4. Synergy Support Damage Constitutive Model

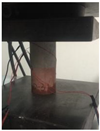
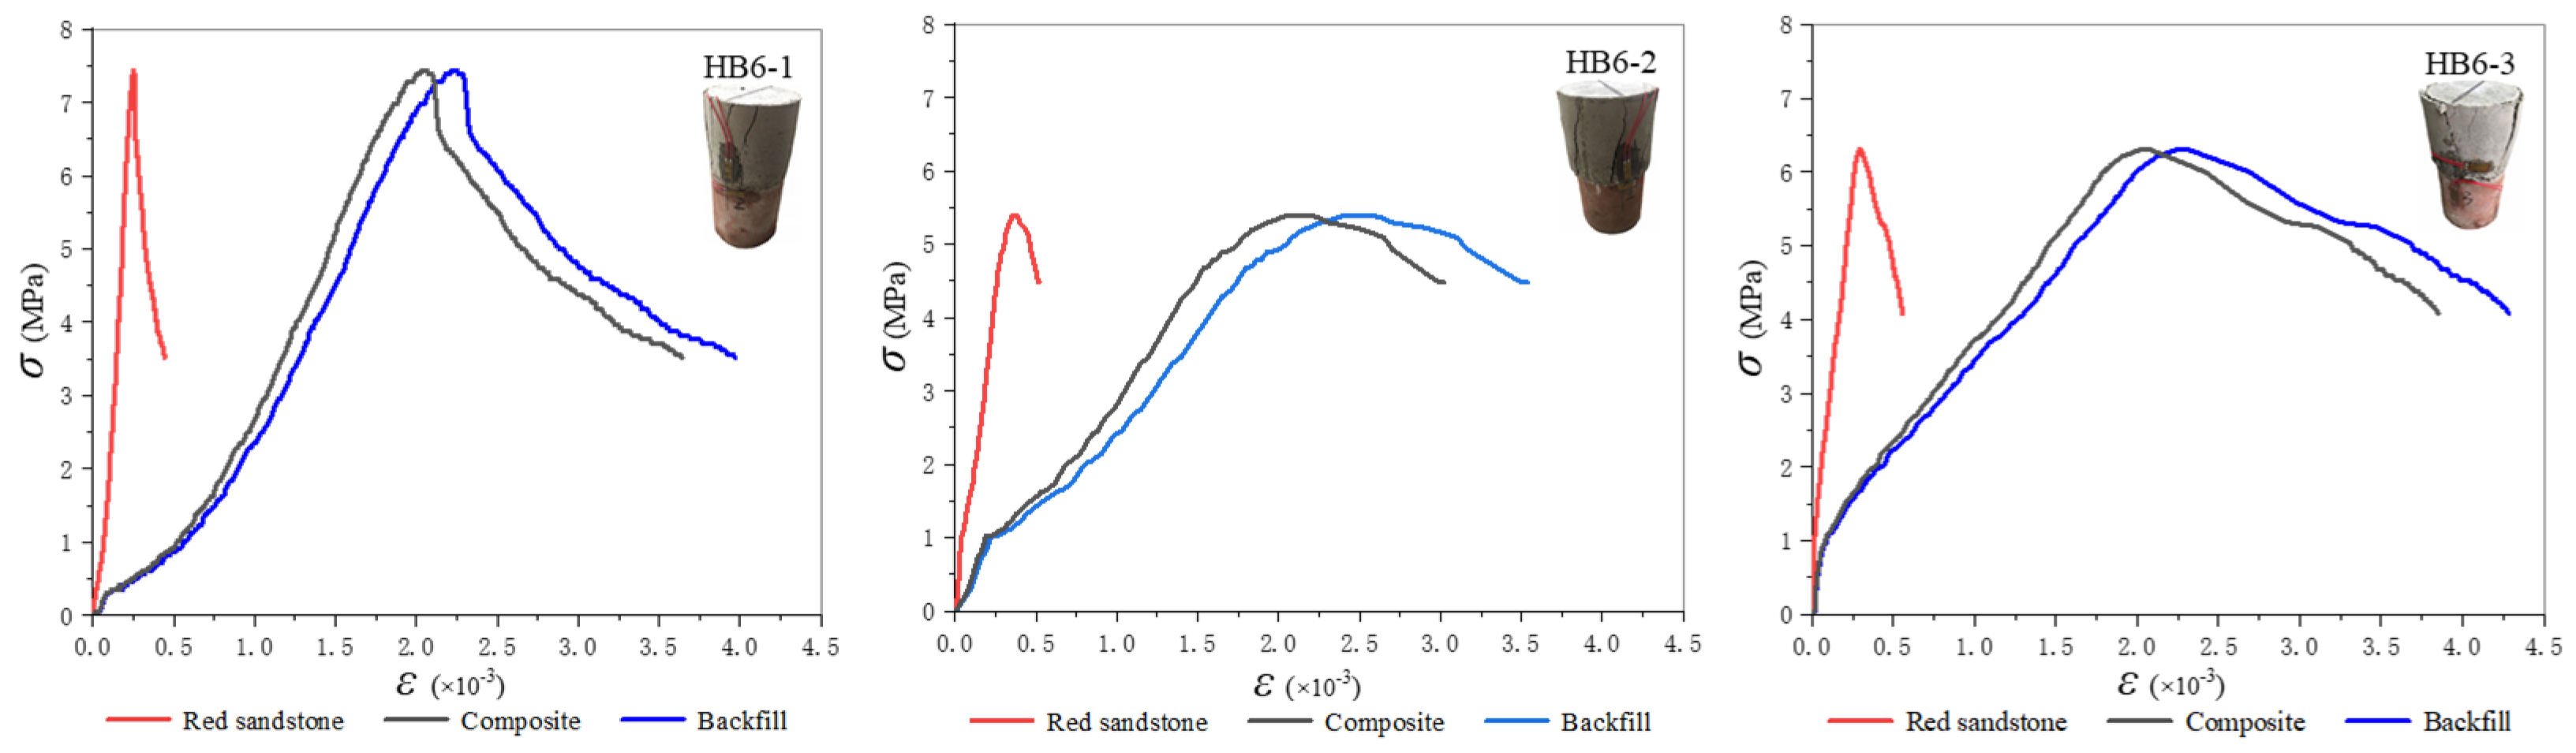
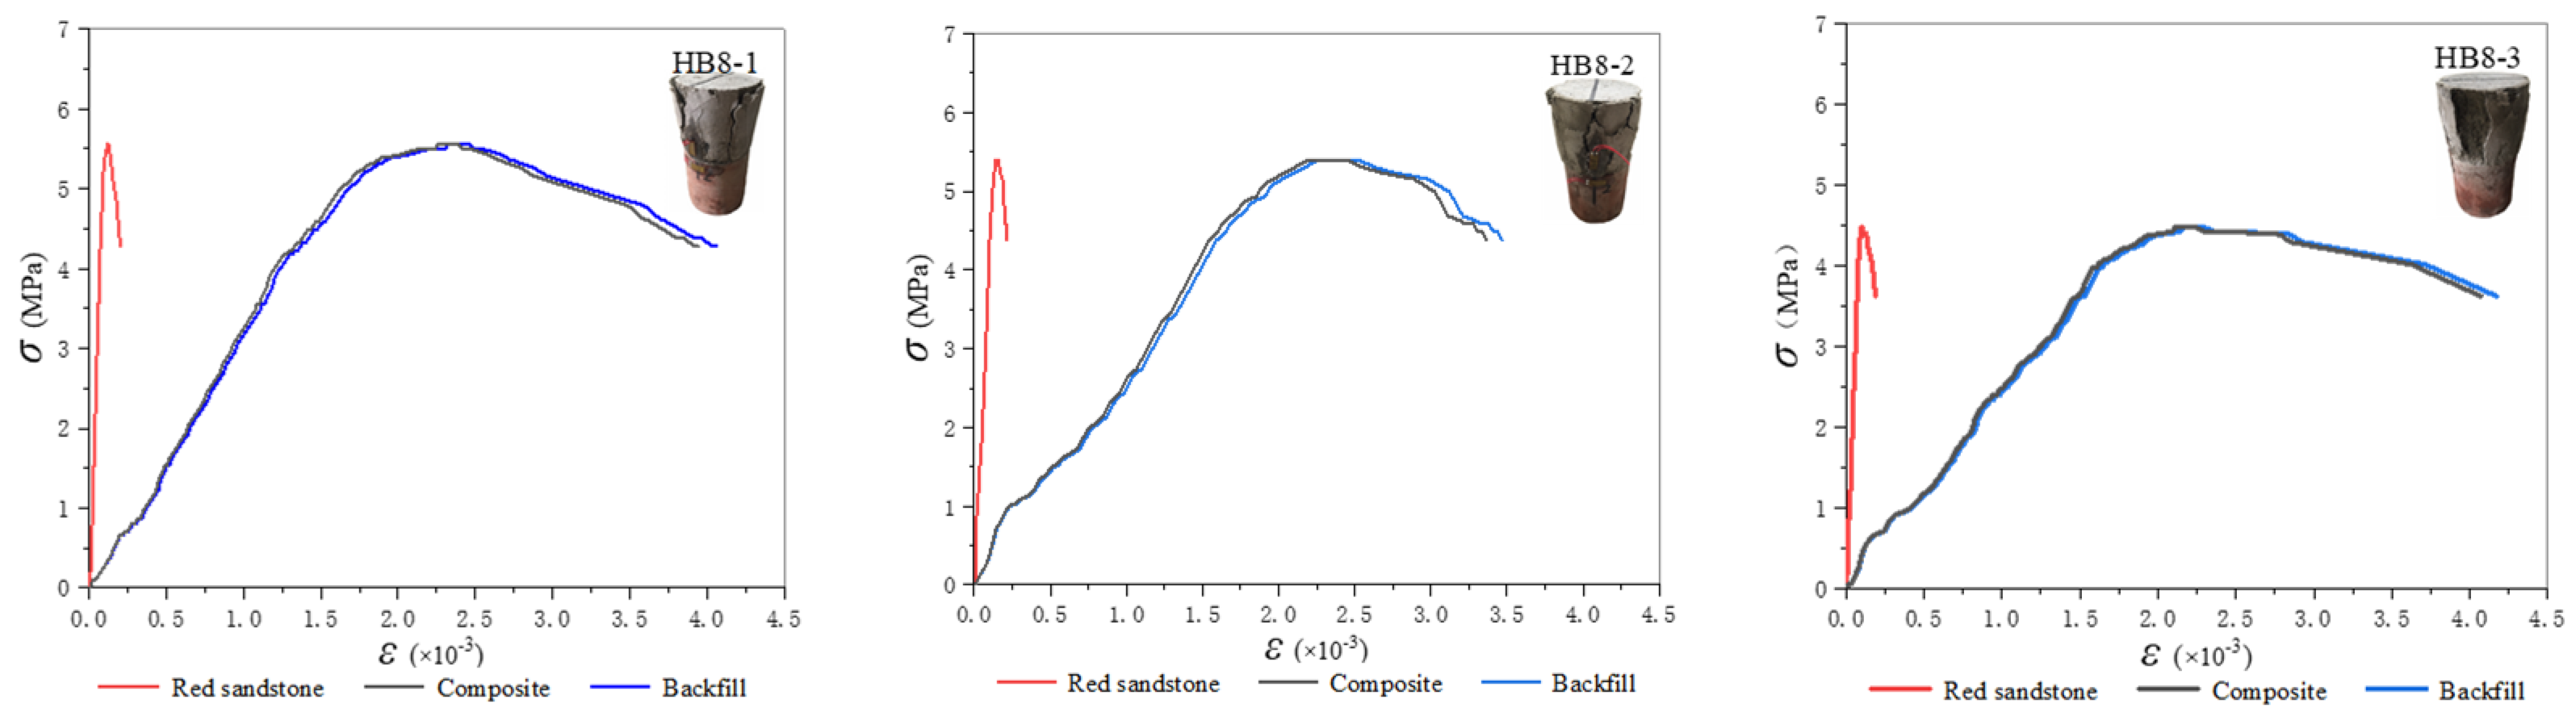
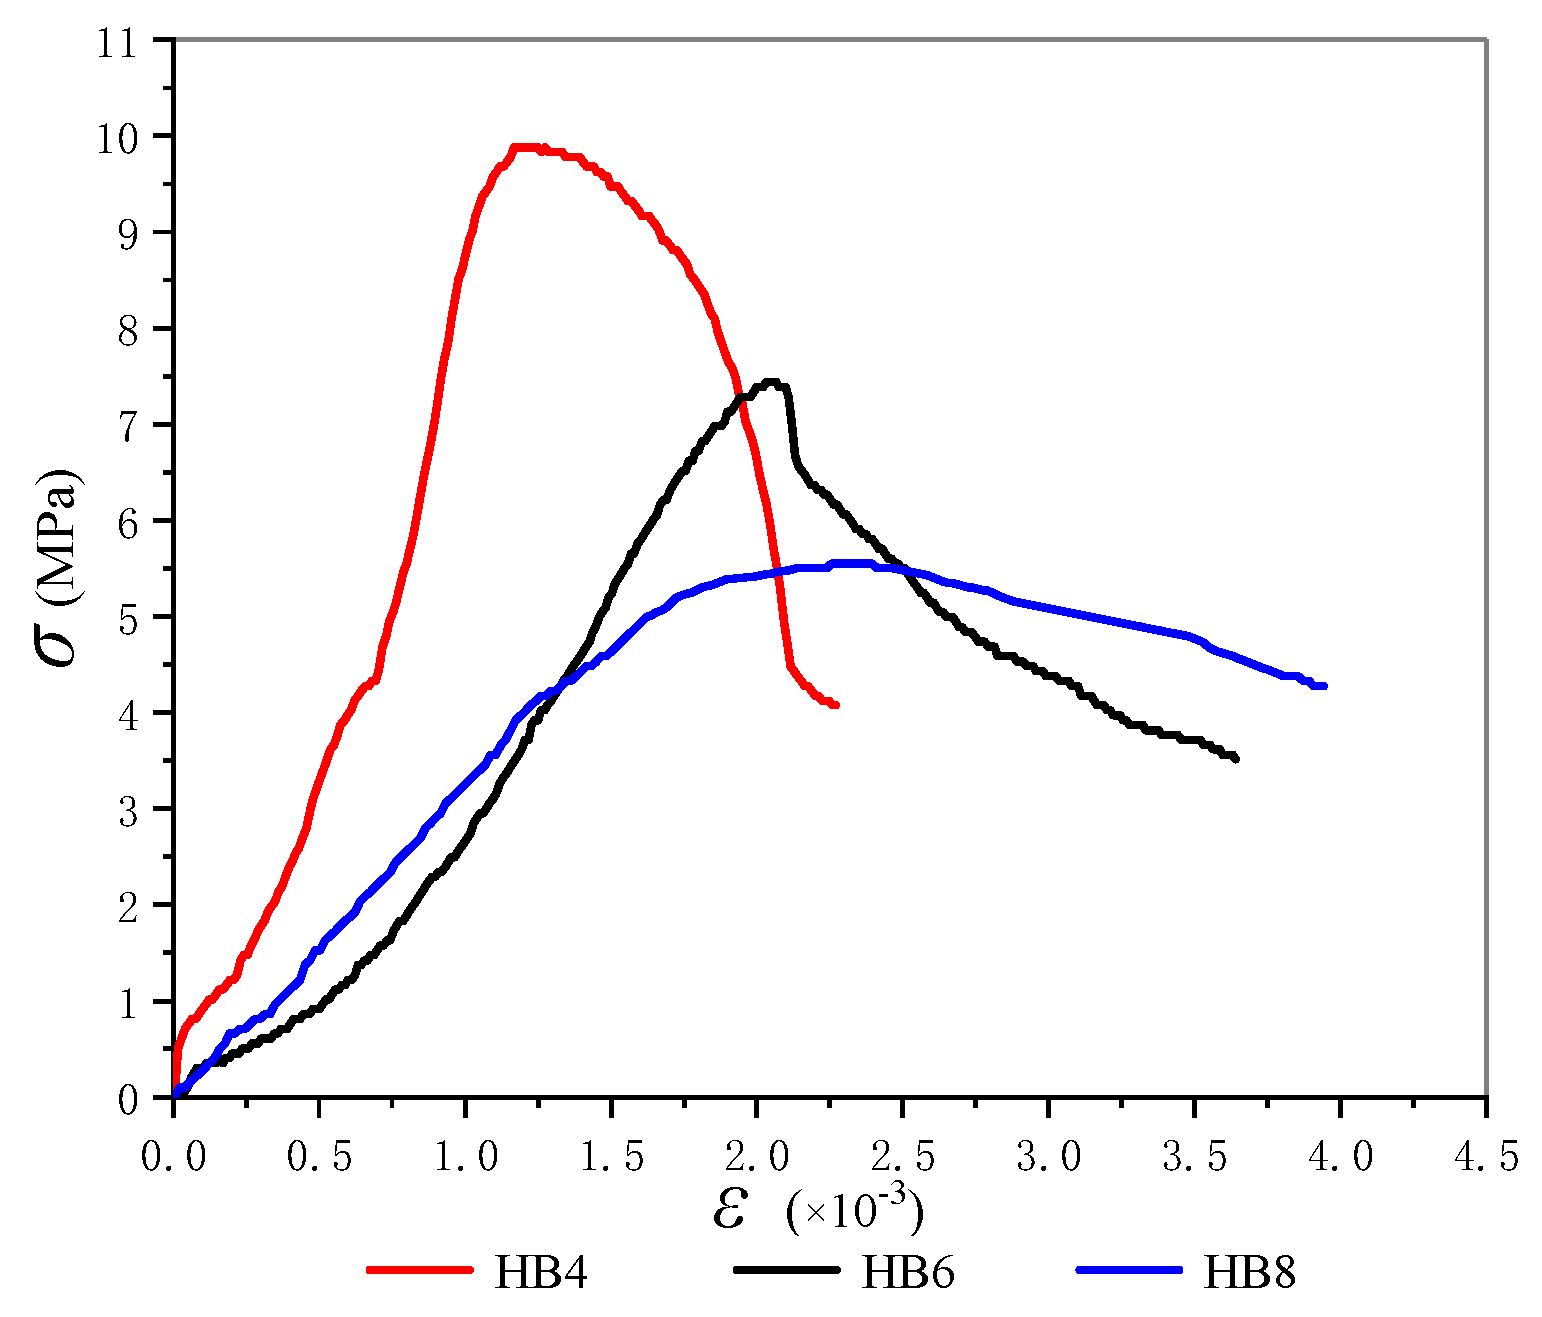
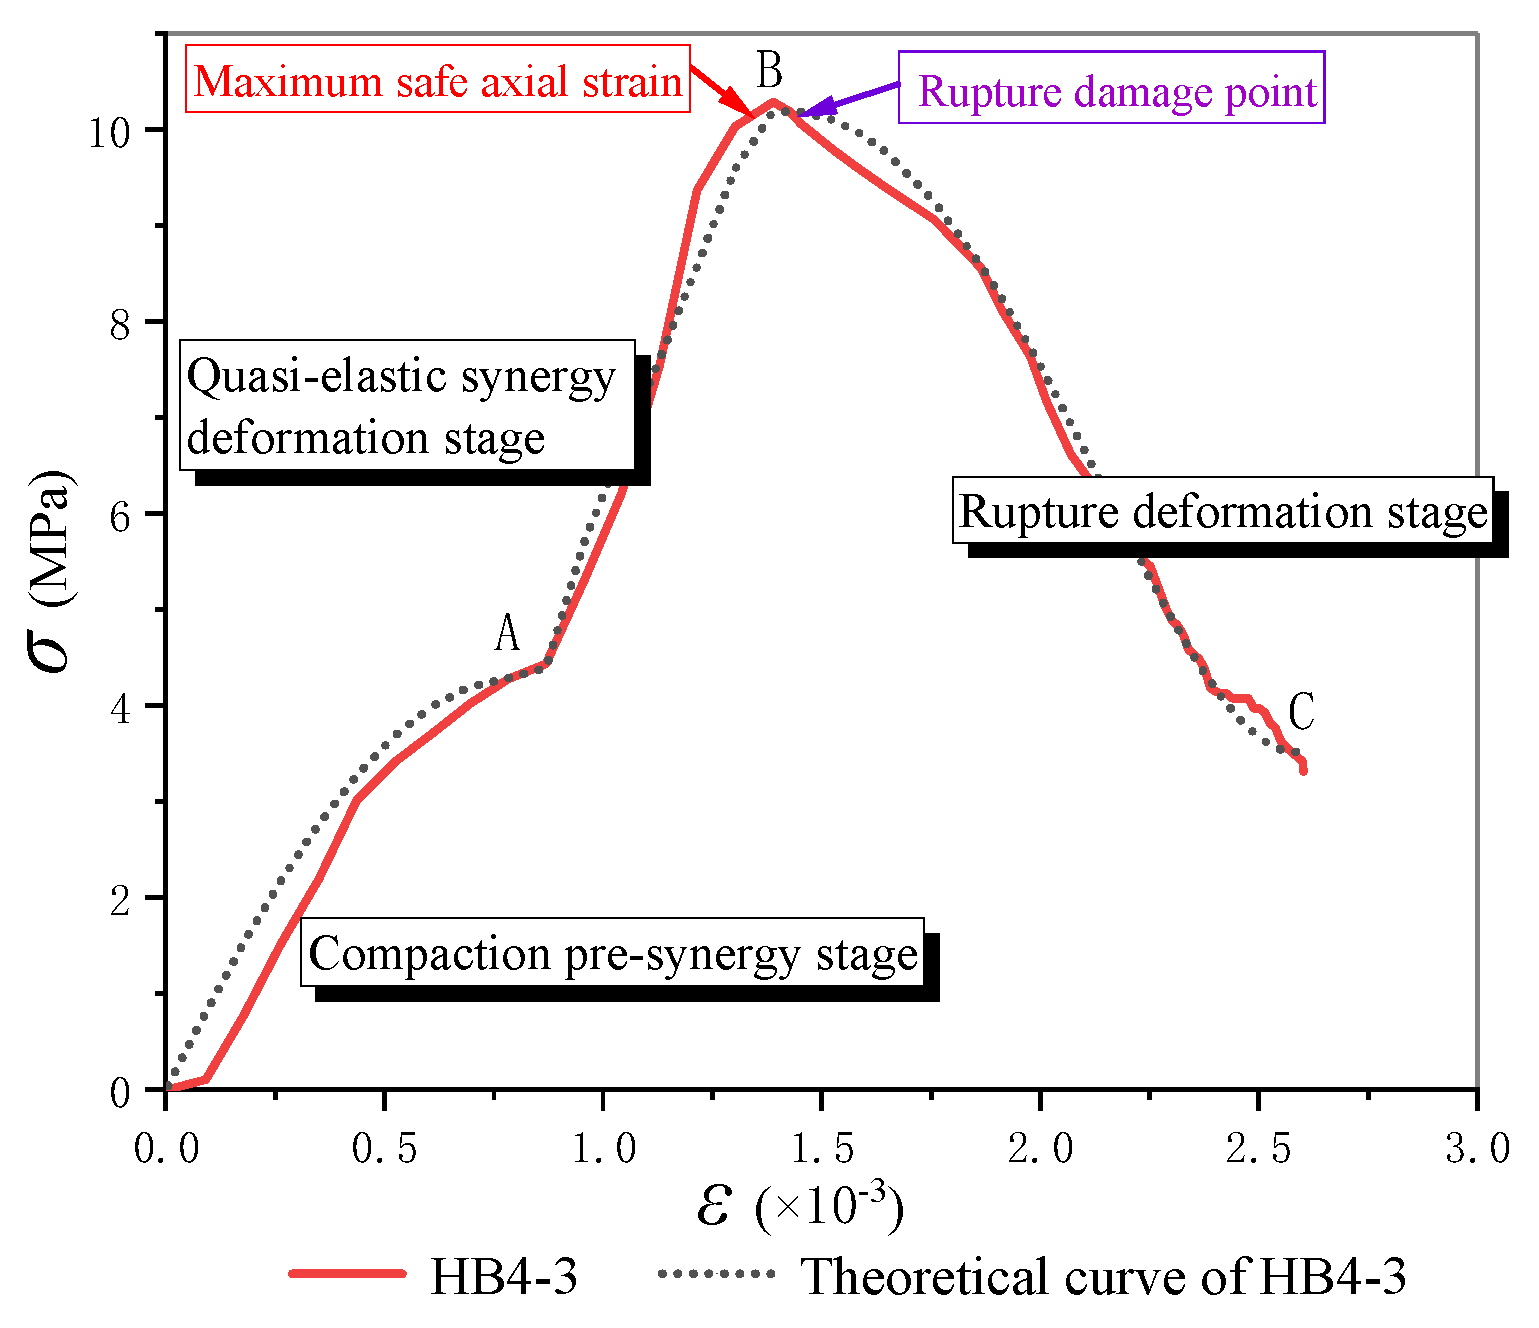
According to the stress–strain curves as well as failure characteristics of the specimens, it is found that at the cement–sand ratio of 1:6, the upper backfill is completely destroyed, while the lower red sandstone corner is slightly damaged. The backfill and red sandstone cannot achieve the role of synergy support. When the cement–sand ratio is 1:8, the stress–strain curve of the upper backfill part basically coincides with the composite specimen. The main damage of the composite is the backfill while the lower red sandstone is almost not damaged. The overall compressive strength and elastic modulus are small, and the backfill and red sandstone fail to achieve synergy support. Only when the cement–sand ratio is 1:4, the cracks occur in both the backfill and red sandstone. The composite specimens composed of red sandstone and backfill realize the synergy support and common bearing.
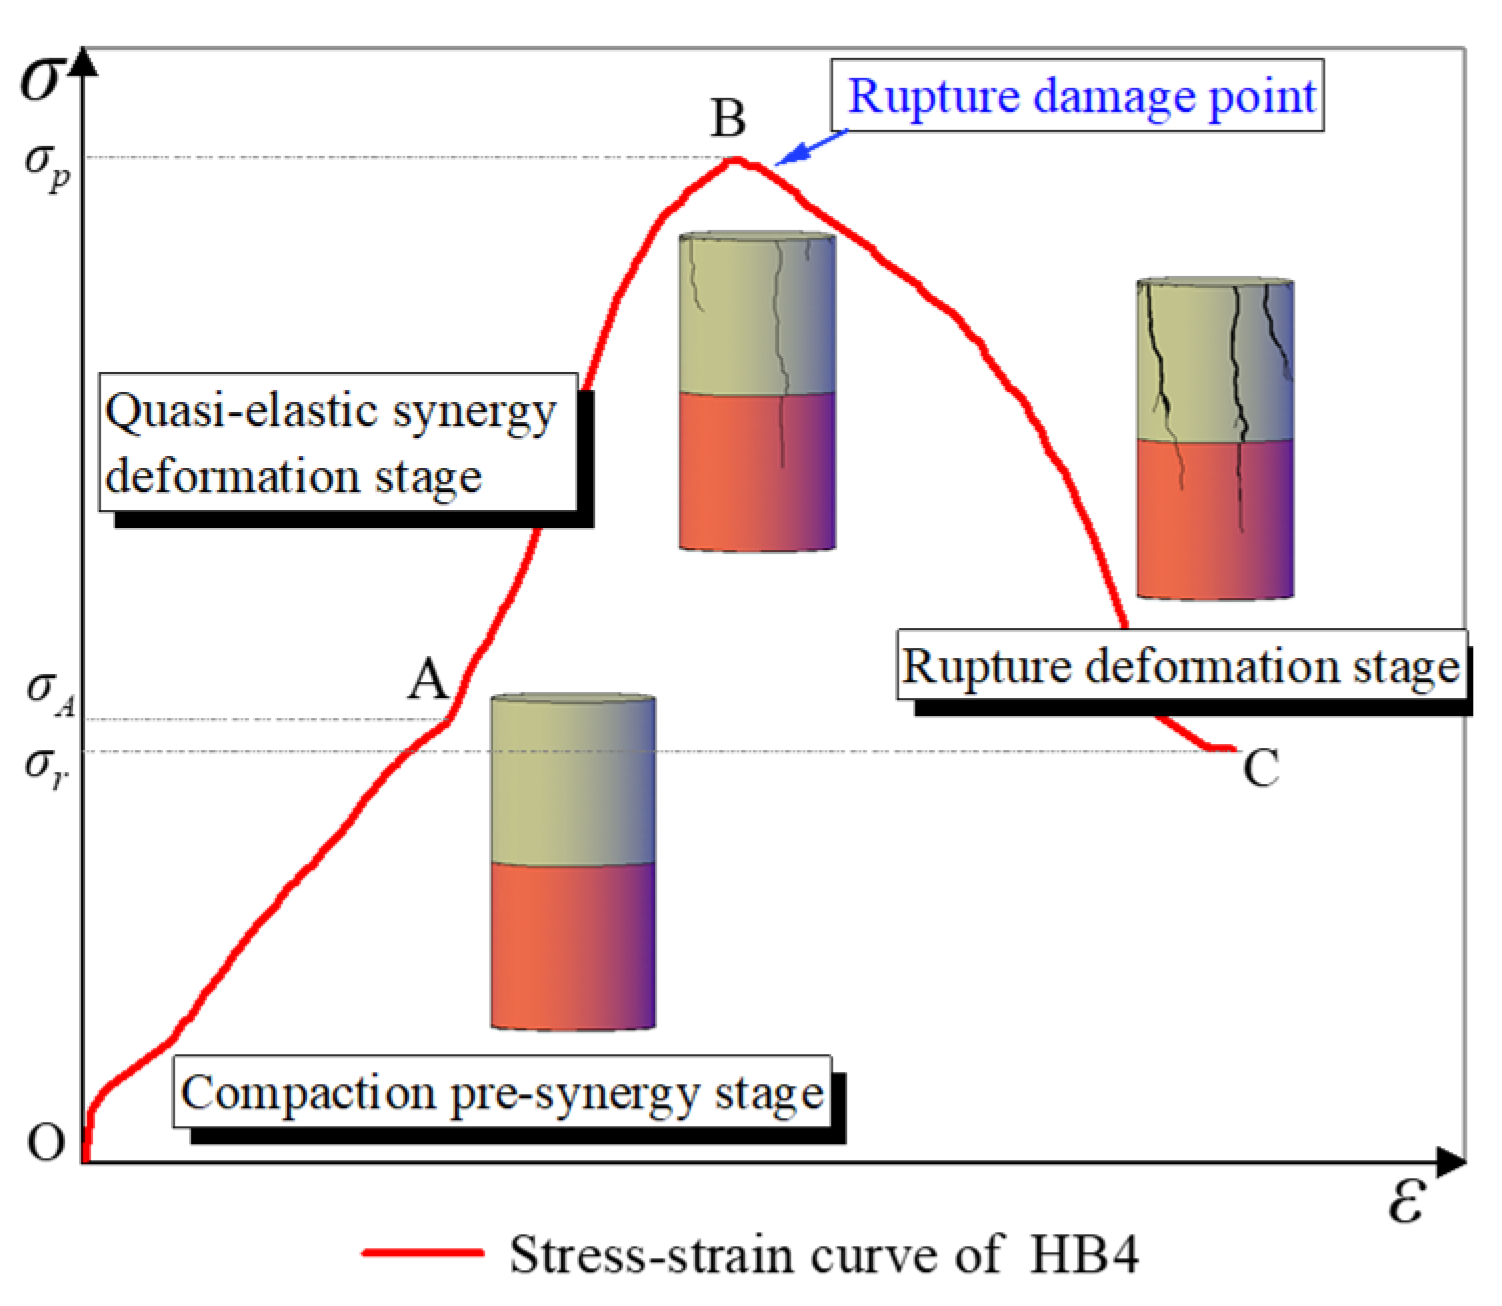
For the backfill-red sandstone combinations with the cement–sand ratio of 1:4, the loading damage can be equivalent to the coupling of two damage states of backfill and red sandstone. The first part is the damage state of the initial backfill, that is, the initial damage caused by the initial defect on the upper part of the delamination plane. The second part is the common damage state of the backfill and the loading of red sandstone part, that is, the damage caused by the continuous loading of the backfill-red sandstone combination. The third part is that the backfill and red sandstone bear together until damage and rupture expansion occur. Layered structure and load weaken the cohesion of materials with different mechanical mechanisms. Combined with the damage and failure characteristics of backfill-red sandstone combination specimens, the uniaxial compression failure process can be divided into three stages: compaction pre-synergy stage (OA), quasi-elastic synergy deformation stage (AB) and rupture deformation stage (BC) (Figure 9).

4.1. Constitutive Model in Compaction Pre-Synergy Stage (OA)

From a macroscopic point of view, the backfill-red sandstone combinations did not rupture at the beginning of the loading process. However, it can be found that due to the mutual bonding between the upper backfill and red sandstone, the microcracks at the contact surface between the backfill and the rock compacted rapidly. With the increase of strain, the stress obviously shows a non-linear elastic rise. At this time, the microcracks in the upper backfill are slowly compacted with the increase of load, and the micro elements in the internal structure of the backfill are damaged. With the continuous increase of stress, the composite specimen enters the non-linear elastic failure stage, and the stress–strain curve shows the OA segment, which is called the compaction pre-synergy stage. According to experimental data and stress–strain curve, it is identified that there is a certain relationship among the elastic modulus of the backfills, red sandstone and the combinations. In practical engineering, the elastic modulus of the backfill after curing and consolidation is lower than red sandstone. At this time, the main function of the backfill is to transfer load. Therefore, the concept of relative contribution degree is introduced to preprocess the initial weight of elastic modulus of red sandstone and backfill, that is, the contribution degree η is set. According to the bearing capacity characteristics of red sandstone and backfill during loading, the response model of their elastic modulus during initial loading is obtained:
E 0 = η 1 E c + η 2 E h
where E0 is the initial elastic modulus of the combination; η1 is the relative contribution of backfill; η2 is the relative contribution of red sandstone; Ec is the elastic modulus of the backfill; Eh is the elastic modulus of red sandstone.
Under load, the deformation mechanism of the internal meso element of the combination specimen is complex. The damage theory is introduced to characterize the change law of the meso element. At this stage, the meso element strength of backfill-red sandstone combination specimen tends to follow Loland damage model [34]. Under the action of continuous load, the relationship between stress and strain of the OA segment can be obtained:
σ ˜ = E 0 ε ( 1 D 0 ) = ( η 1 E c + η 2 E h ) ε ( 1 D 0 )
where σ ˜ is the effective stress; ε is strain; D0 is the initial damage, and the specimen has certain damage before loading. Because the current technical conditions cannot well measure the damage in the initial stage, it is considered that D0 = 0.
Therefore, the damage constitutive model of the OA segment can be obtained as follows:
σ = σ ˜ ( 1 D e )
where De is the damage variable of the OA segment.
According to the stress–strain curve of the OA segment, the microcracks in the backfill are closed under the action of load, resulting in micro element structure damage. The damage value De is expressed as:
D e = D 0 + C ε β
where C and β are the backfill material parameters.
Based on the stress–strain curve and the boundary conditions:
( i )   ε = ε p , σ = σ p ;   ( ii )   ε = ε p , d σ d ε = 0
The constant C, β is
C = 1 D 0 1 + β ε p
β = σ p ( η 1 E c + η 2 E h ) ε p σ p

4.2. Constitutive Model in Quasi-Elastic Synergy Deformation Stage (AB)

Under the action of continuous load, the backfill-red sandstone combination has no macro rupture. At the micro level, the internal deformation and failure of the upper backfill occurred slowly. The internal structure of the lower red sandstone is also damaged, resulting in micro element damage. The backfill-red sandstone combination is like linear elastic deformation, and its internal original damage begins to intensify and evolve until it exceeds the peak stress failure. The stress–strain curve shows the AB segment, which is called the quasi-elastic synergy deformation stage of backfill and red sandstone. Considering the contribution of backfill and red sandstone to the composite, the response model of elastic modulus at this stage is obtained:
E p = η 1 E c + η 2 E h
where Ep is the peak elastic modulus of composite; η 1 is the relative contribution of backfill in the AB segment; η 2 is the relative contribution of red sandstone in the AB segment.
According to the stress–strain curve of the AB segment, the damage constitutive model of stress and strain can be obtained:
σ = E p ε ( 1 D p ) = ( η 1 E c + η 2 E h ) ε ( 1 D p )
where ε is the strain of the composite specimen in section AB; Dp is the damage variable of the AB segment.
At this stage, the micro element strength of backfill-red sandstone combination specimen obeys Weibull distribution [35,36], the probability density function is
P ( F ) = { 0   , F < 0   b F 0 ( F F 0 ) b 1 exp [ ( F F 0 ) b ] , F 0
where F is the stress level of the composite specimen in the AB segment; F0 is the characteristic stress; b is the distribution parameter.
F = ( η 1 E c + η 2 E h ) ε
F 0 = ( η 1 E c + η 2 E h ) ε 0
where ε 0 is the strain parameter of the AB segment.
Thus, substituting Equations (11) and (12) into Equation (10) can obtain:
P ( ε ) = b ε 0 ( ε ε 0 ) b 1 exp [ ( ε ε 0 ) b ]
By integrating Equation (13), the damage variable expression can be obtained as follows:
D p = P ( ε ) d ε = exp ( ( ε ε 0 ) b )
Substituting Equation (14) into Equation (9) can be obtained:
σ = ( η 1 E c + η 2 E h ) ε ( 1 exp ( ( ε ε 0 ) b ) )
In the stress–strain relationship curve of the composite, the peak stress σp and the corresponding strain εp also meet the boundary conditions of Equation (5). Thus:
σ p = ( η 1 E c + η 2 E h ) ε p ( 1 exp ( ( ε p ε 0 ) ) b )
The partial differential equation obtained from Equation (15) is
d σ d ε = ( η 1 E c + η 2 E h ) ( 1 + exp ( ( ε ε 0 ) b ) ( b ( ε ε 0 ) b 1 ) )
Substitute Equation (17) into Equation (5) to obtain:
b ( ε p ε 0 ) b = 1
According to Formulas (16) and (18), it can be obtained:
ε 0 = ε p ( 1 b ) 1 b
b = 1 ln ( ( η 1 E c + η 2 E h ) ε p ( η 1 E c + η 2 E h ) ε p σ p )

4.3. Constitutive Model in Rupture Deformation Stage (BC)

After reaching the peak value, both the upper backfill and the lower red sandstone are damaged, and the backfill appears complex damage phenomena such as cracks propagation, bifurcation and detour. The cracks of the red sandstone develop rapidly and show splitting cracks in varying degrees. At this time, the stress of the composite specimen gradually weakens, and its bearing capacity decreases rapidly with the increase of axial strain. The stress–strain curve shows the BC segment, which is called the rupture deformation stage of backfill-red sandstone combination specimen. At this stage, according to D. Krajcinovic [37], it is assumed that the damage and strain principal axis coincide with the material principal axis in the process of the uniaxial compression. Assume the equivalent stress is σ ˜ = σ ( I D ) 1 , and the equivalent strain is ε ˜ = ε ( I D ) , the equation E ˜ = E ( I D ) 2 can be obtained. Thus, the constitutive equation is
{ σ } = [ E ˜ ] 1 { ε }
According to the stress–strain curve of the BC segment, the constitutive relationship of the backfill at this time is as follows:
σ = ( η 1 E c + η 2 E h ) ε ( 1 D r ) 2
where σ is the stress of the BC segment; ε is the strain of the BC segment; Dr is the damage variable of the BC segment.
Considering the residual strength of composite specimens and the damage characteristics of actual stress–strain curves, the above constitutive equation was improved:
σ = ( η 1 E c + η 2 E h ) ε ( 1 D r ) 2 + σ r D r 2
where σr is residual strength of the backfill-red sandstone combination.
For the whole process of the BC segment, severe damage will occur in the backfill-red sandstone combination after reaching the stress peak. The damage variable can be expressed as
D r = A | ε | N
where A and N are the material parameters of the composite.
Considering the boundary conditions, the following is obtained from Equation (5):
N = ( η 1 E c + η 2 E h ) 2 ( η 1 E c + η 2 E h ) ( η 1 E c + η 2 E h )
A = 1 ( 2 N + 1 ) | ε P | N

5. Model Validation

5.1. Relative Contribution Value

For determining the relative contribution value, the mechanical interaction model between backfill and red sandstone is analyzed. In order to simplify its mechanical model, lateral constraints and lateral deformation of backfill are temporarily ignored in the laboratory test, and the model shown in Figure 10 is obtained. Ec and εc are the elastic modulus and strain of backfill, Eh and εh are the elastic modulus and strain of red sandstone, respectively. Eh is significantly higher than Ec.
According to the failure characteristics of the specimens, the load in the initial stage mainly acts on the microcracks compaction process of the backfill and the surface contact between the backfill and red sandstone. Based on the characteristics of stress–strain curve and engineering experience, the relative contribution of the elastic modulus of red sandstone at this stage to the elastic modulus of the initial composite can be calculated and distributed as follows:
η 2 = | E c E h | E c E h
At this time, the relative contribution of the elastic modulus of the backfill to the elastic modulus of the initial composite is
η 1 = 1 η 2
In the next stage, with the continuous loading, the upper backfill and the lower red sandstone bear the load together. At this time, the relative contribution of the elastic modulus of the red sandstone to the elastic modulus of the composite is
η 2 = E c E h E c + E h
At this time, the relative contribution of the elastic modulus of the backfill to the elastic modulus of the composite is
η 1 = 2 η 2
In the initial stage, the microcracks in the upper backfill and the microcracks in the stratified contact surface are compacted under the action of load. This process is the full combination process of the upper backfill and the lower red sandstone, so as to achieve the purpose of synergy. The lower red sandstone bears the load and the gravity of the upper backfill, so its relative contribution is high. In the next stage, with the continuous increase of load, the upper backfill and the lower red sandstone are fully combined to achieve the synergistic support effect. In this stage, the relative contribution of the upper backfill and the lower red sandstone is basically the same. The calculation results of relative contribution are shown in Table 4.

5.2. Verification of Damage Parameters and Constitutive Equations

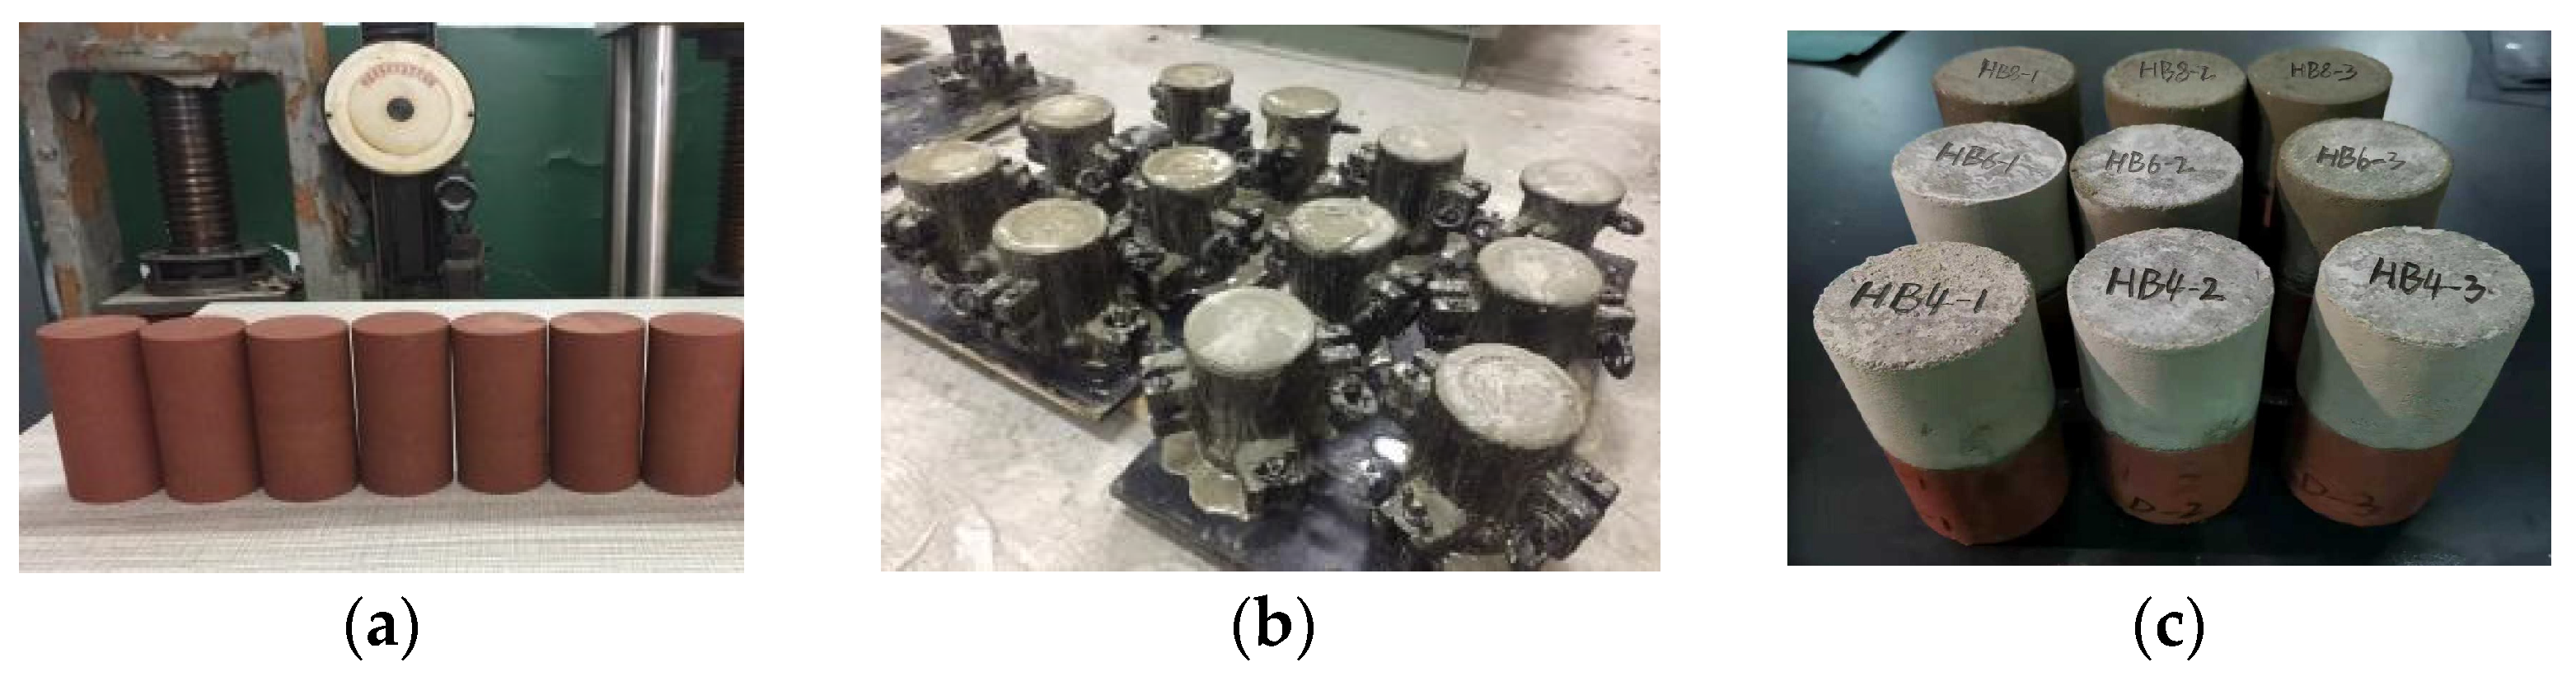
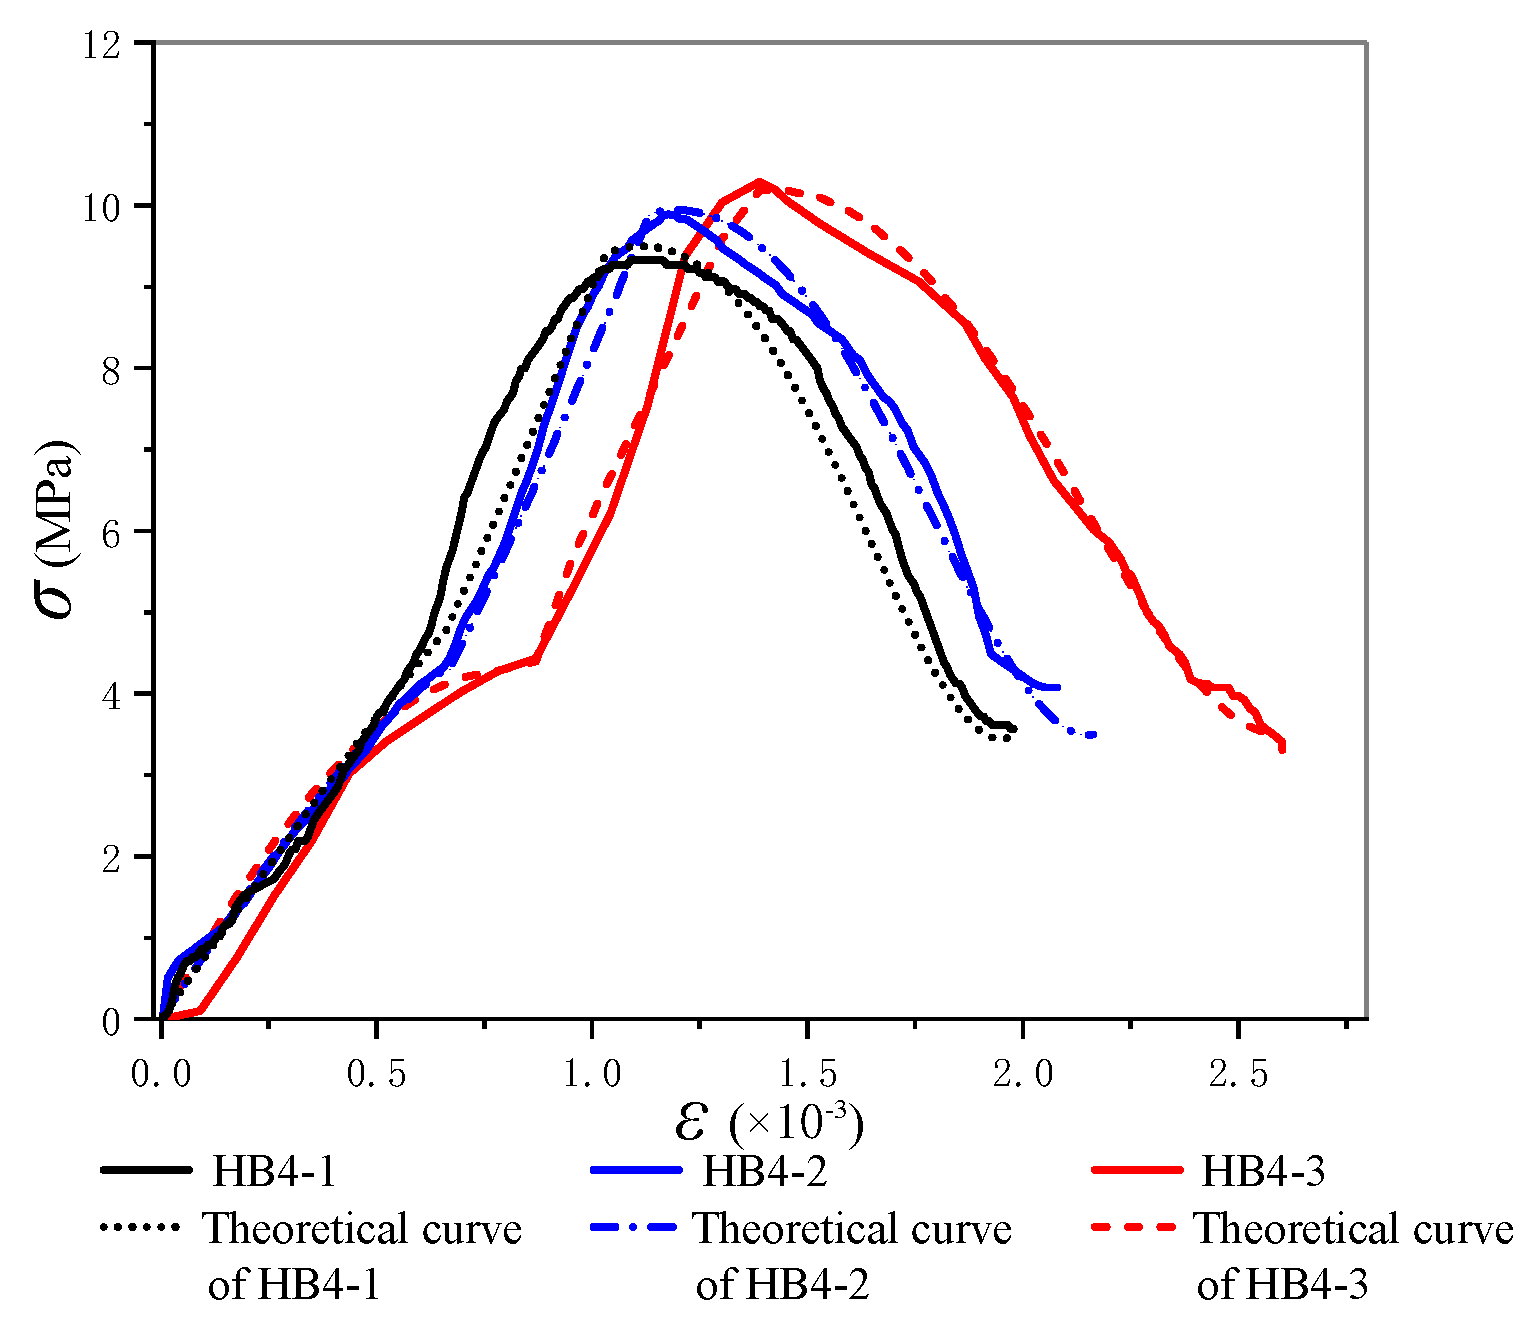
In order to verify the deduced constitutive model, three backfill-red sandstone combination specimens with the cement–sand ratio of 1:4 are compared and analyzed. The mechanical parameters of three backfill-red sandstone combination specimens are shown in Table 5.
Based on the data in Table 5, the stress value of intersections of the three-stages are calculated (
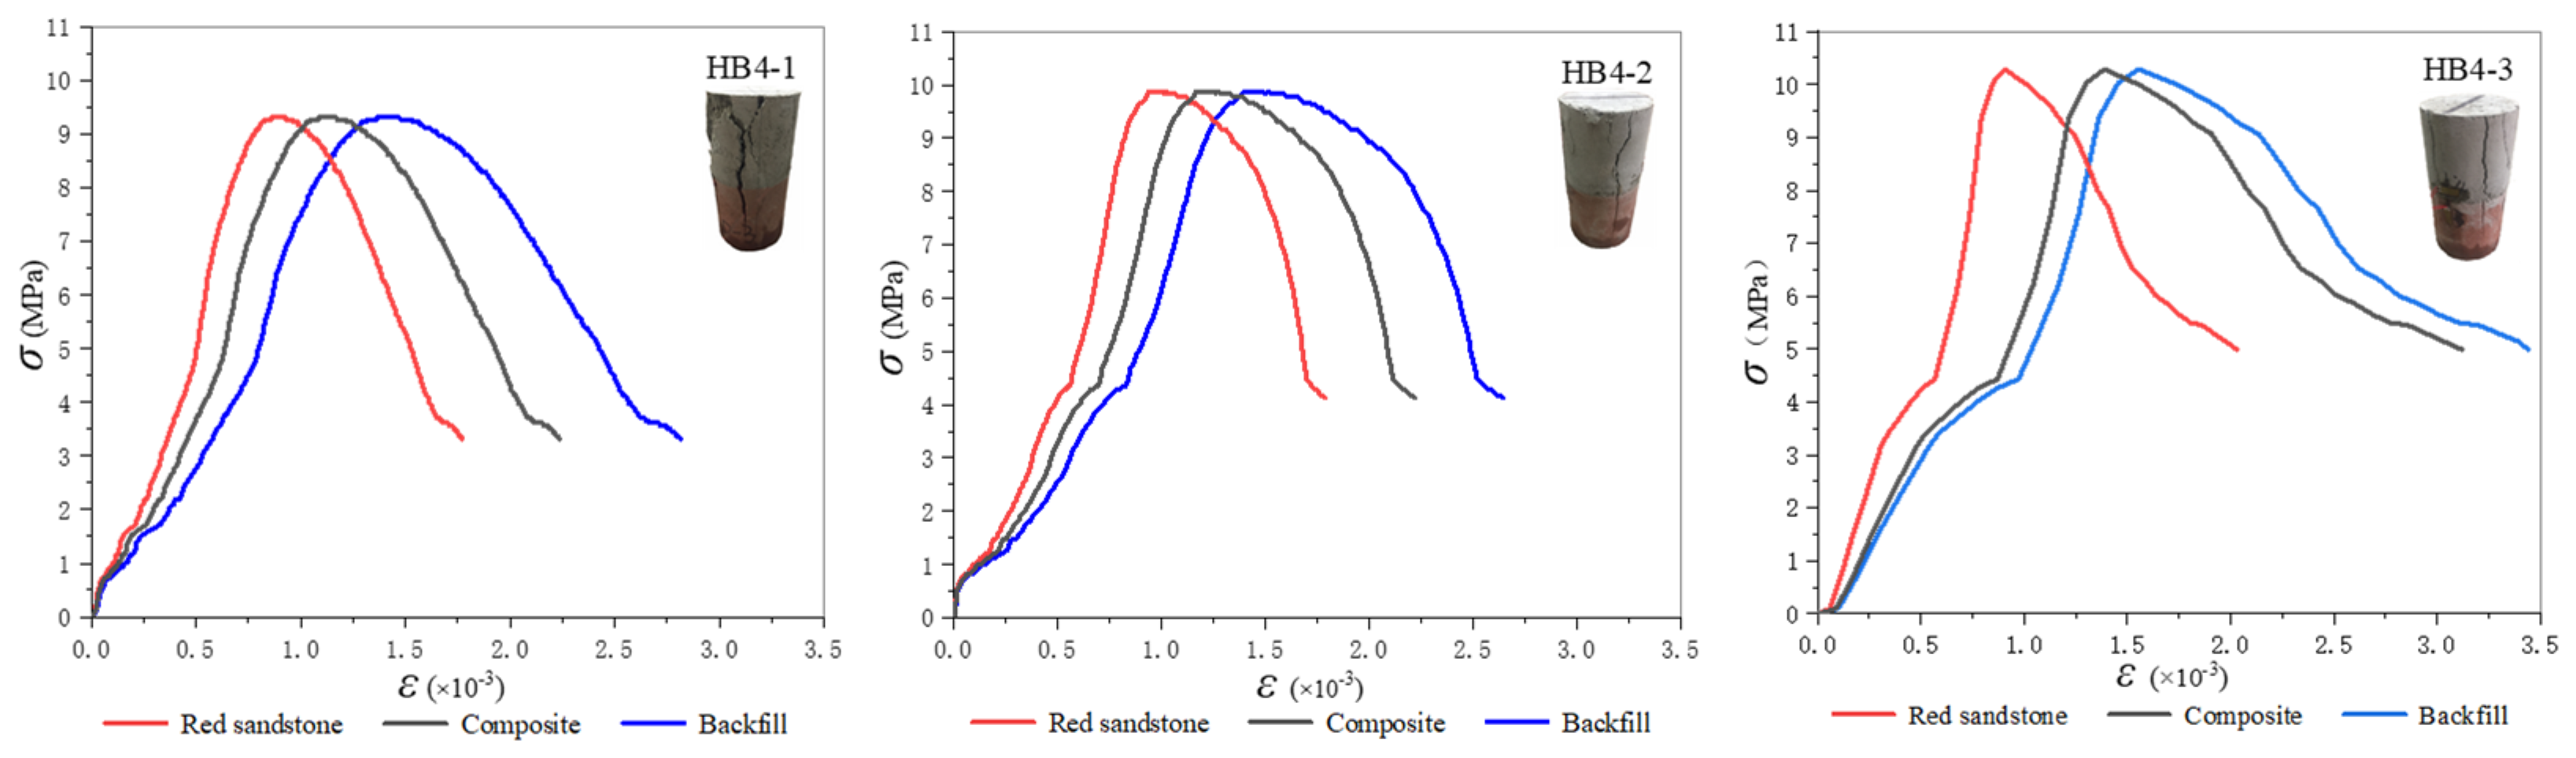
Table 6). The error between theoretical calculation and experiment value is slight. The theoretical curves of the constitutive model are constructed and compared with the test curves. As shown in Figure 11, the theoretical curves of the model are consistent with the test curves, which confirmed the validities of the proposed constitutive model to described characteristics of the whole damage deformation stage of the specimens.
It can be found that the experimental curves basically have three stages: compaction pre-synergy stage, quasi-elastic synergy deformation stage and rupture deformation stage (Figure 12). The three types of damage constitutive relations established according to these stages are in good agreement with the experimental curves. However, due to the influence of experimental environment, experimental errors and other factors, there are still some differences in each group of data. According to the damage deformation characteristics and test results in each stage, the damage constitutive equation and damage deformation characteristic diagram of each stage are obtained (Table 7).

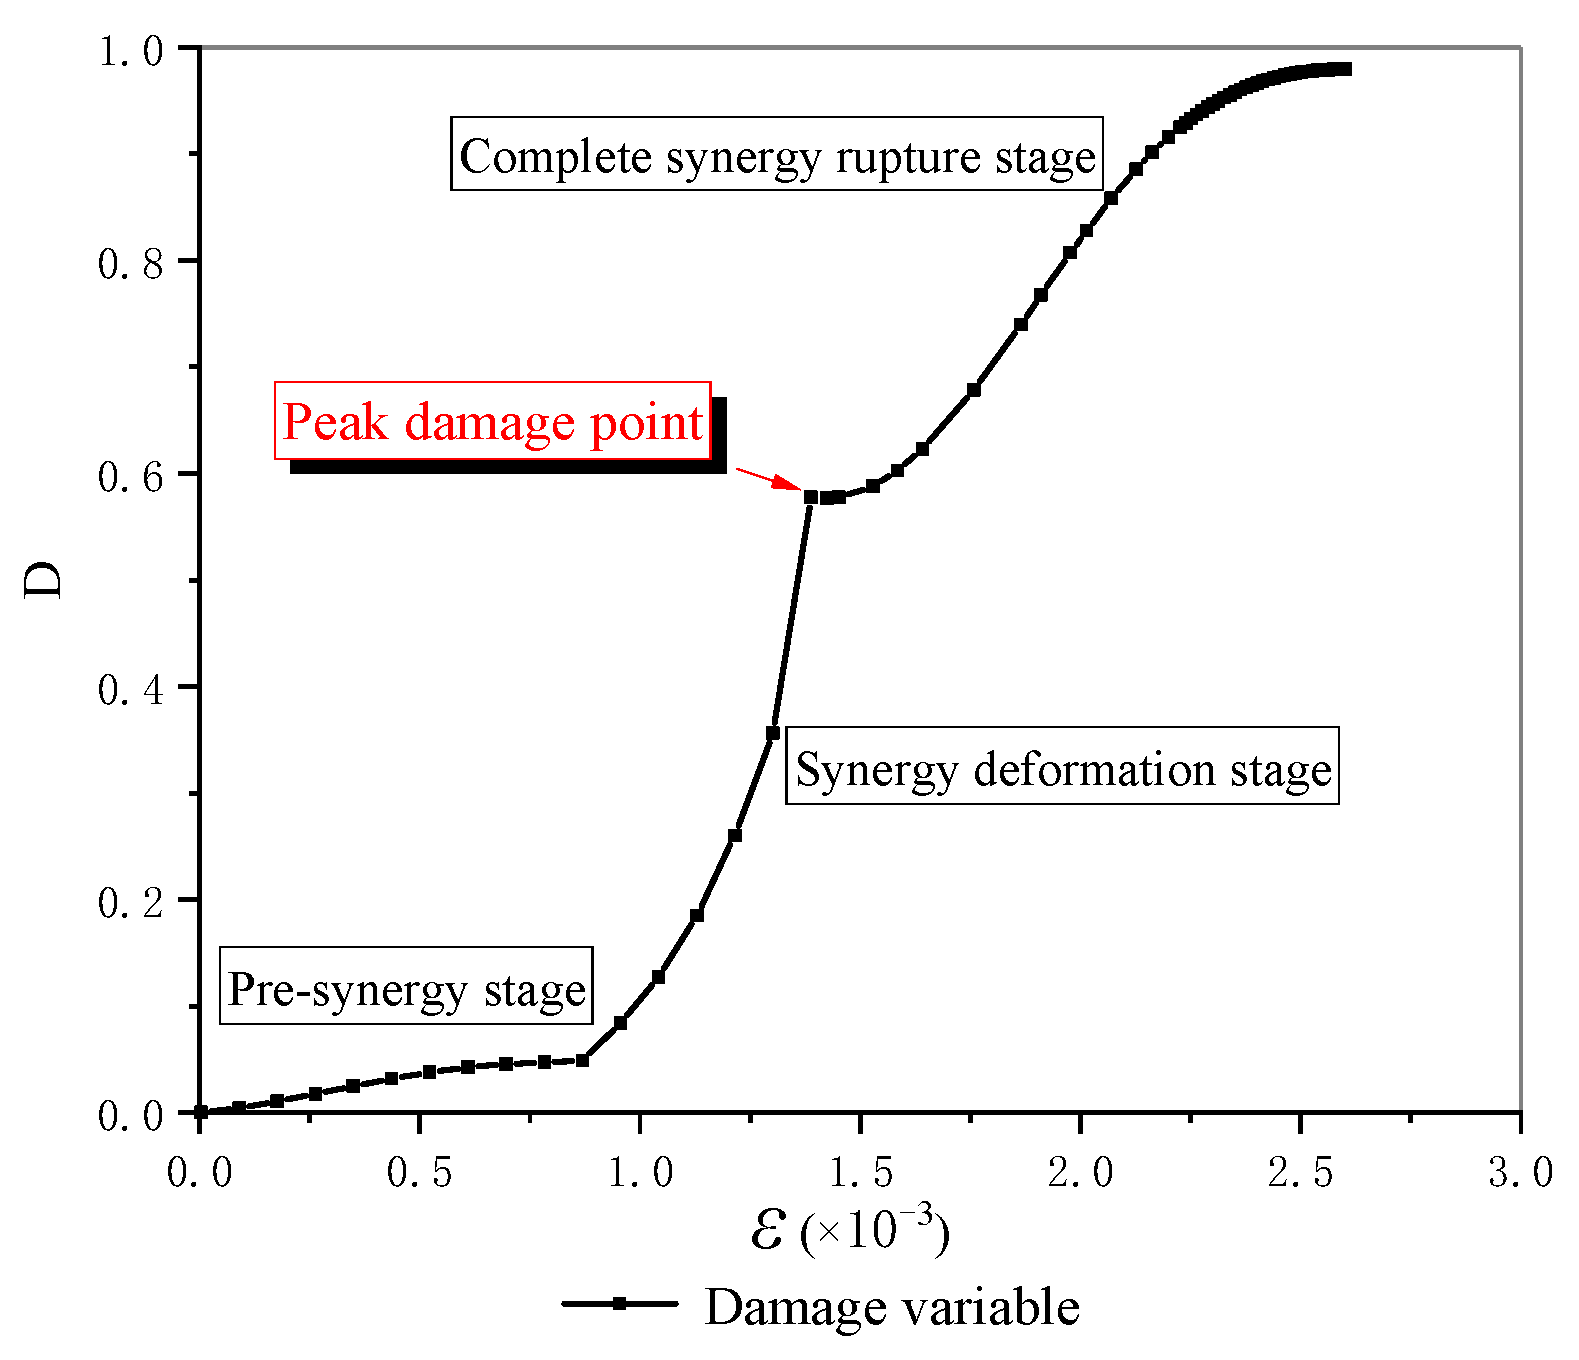
5.3. Damage Variable and Evolution Law

According to its load damage, the synergy deformation of the specimens can also be divided into three stages. The first stage is the microcracks compaction process of the upper backfill and layered contact surface. The second stage is the common bearing process of the upper backfill and the lower red sandstone. The third stage is the rupture process of backfill-red sandstone combination. The damage patterns in each stage are different. According to the established damage constitutive model, the damage evolution process of backfill-red sandstone combination can be characterized, and the relationship between damage variables and strain can be obtained, as shown in Figure 13.
According to Figure 13, it can be found that in the process of the uniaxial compression, the initial damage in the upper backfill is less than 0.1 due to the influence of microcracks. With the continuous increase of stress, the lower red sandstone and the upper backfill bear the load together. The damage increases sharply, and cracks appear after exceeding the peak stress. With the continuous action of load, the damage of backfill-red sandstone combination continued, and the specimen was completely destroyed. The macro failure patterns, micro damage variables, overall deformation and failure characteristics all prove that the backfill-red sandstone combination realize the synergistic support at the cement–sand ratio of 1:4. This provides a reference for the study of synergistic support between backfill and surrounding rock in the process of underground filling. The results also provide a basis for the damage evolution law and failure process of the synergy support between backfill and surrounding rock.

5.4. Synergy Analysis between Backfill and Red Sandstone

In the process of actual backfill mining, the backfill and surrounding rock form a combination to bear ground pressure together. This leads to an interaction system between rock mass and backfill. From the compression tests, it was found that the interaction and matching effect between the backfill and red sandstone were affected by the cement–sand ratio. The larger the cement–sand ratio, the higher the strength of the backfill and the greater load-carrying capacity of backfill-red sandstone composite. When the cement–sand ratio was 1:4, the part of backfill had the highest strength, which can fully cooperate with red sandstone to resist the load. The peak stress reached 10.29 MPa. The cracks occurred in both the backfill and red sandstone and propagated to form split failure. When the cement–sand ratio was 1:8, the backfill failed to cooperate with red sandstone. Only the backfill part of composite broke completely. Therefore, the strength of backfill is the key to realize the synergistic support for backfill mining. In the actual mining engineering, in order to save the cost, mining industry is looking always to lower cement ratio in their mixtures. To solve this problem, the new cementing material with low cost can be selected in the future to obtain the backfill with low ratio and high strength.
In this research, the backfill with cement–sand ratio 1:4 had a good matching effect with the red sandstone. During the load-carrying process, the backfill and red sandstone complemented each other and each played their own role. The two achieved synergistic support. According to stress–strain curves and failure characteristics, their functions were analyzed. The relative contribution degrees of backfill and red sandstone were proposed and calculated. The damage constitutive models were established. From the viewpoint of damage, the synergistic mechanism between the backfill and red sandstone was analyzed. In the initial stage, the backfill and red sandstone bore the load together. The interaction of two parts produced the resistance force inside them, and the internal structure was damaged. At this stage, the damage changed slowly, and it provided the foundation for the matching of the two. In the second stage, the strength of backfill matched with the red sandstone, and the first inflection point of the damage variable curve appeared. Under the stress at this point, the backfill should be broken, but in fact, there were no macroscopic cracks in it. For damage variable, the change rate accelerated with the increase of load from this point on. At the end of this stage, the second inflection point of variable damage appeared, and there was peak stress at this point. Then, in the third stage, the synergistic effect between backfill and red sandstone continued. With the continuous increase of load, the rate of damage change decreased compared with that in the previous stage. The through crack was rapidly generated and expanded, and the composite was finally damaged. The damage process reflected the synergistic support between the backfill and red sandstone; the bearing and support effect of composite was no longer dependent on one of them because their support depended on both.

6. Conclusions

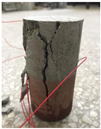
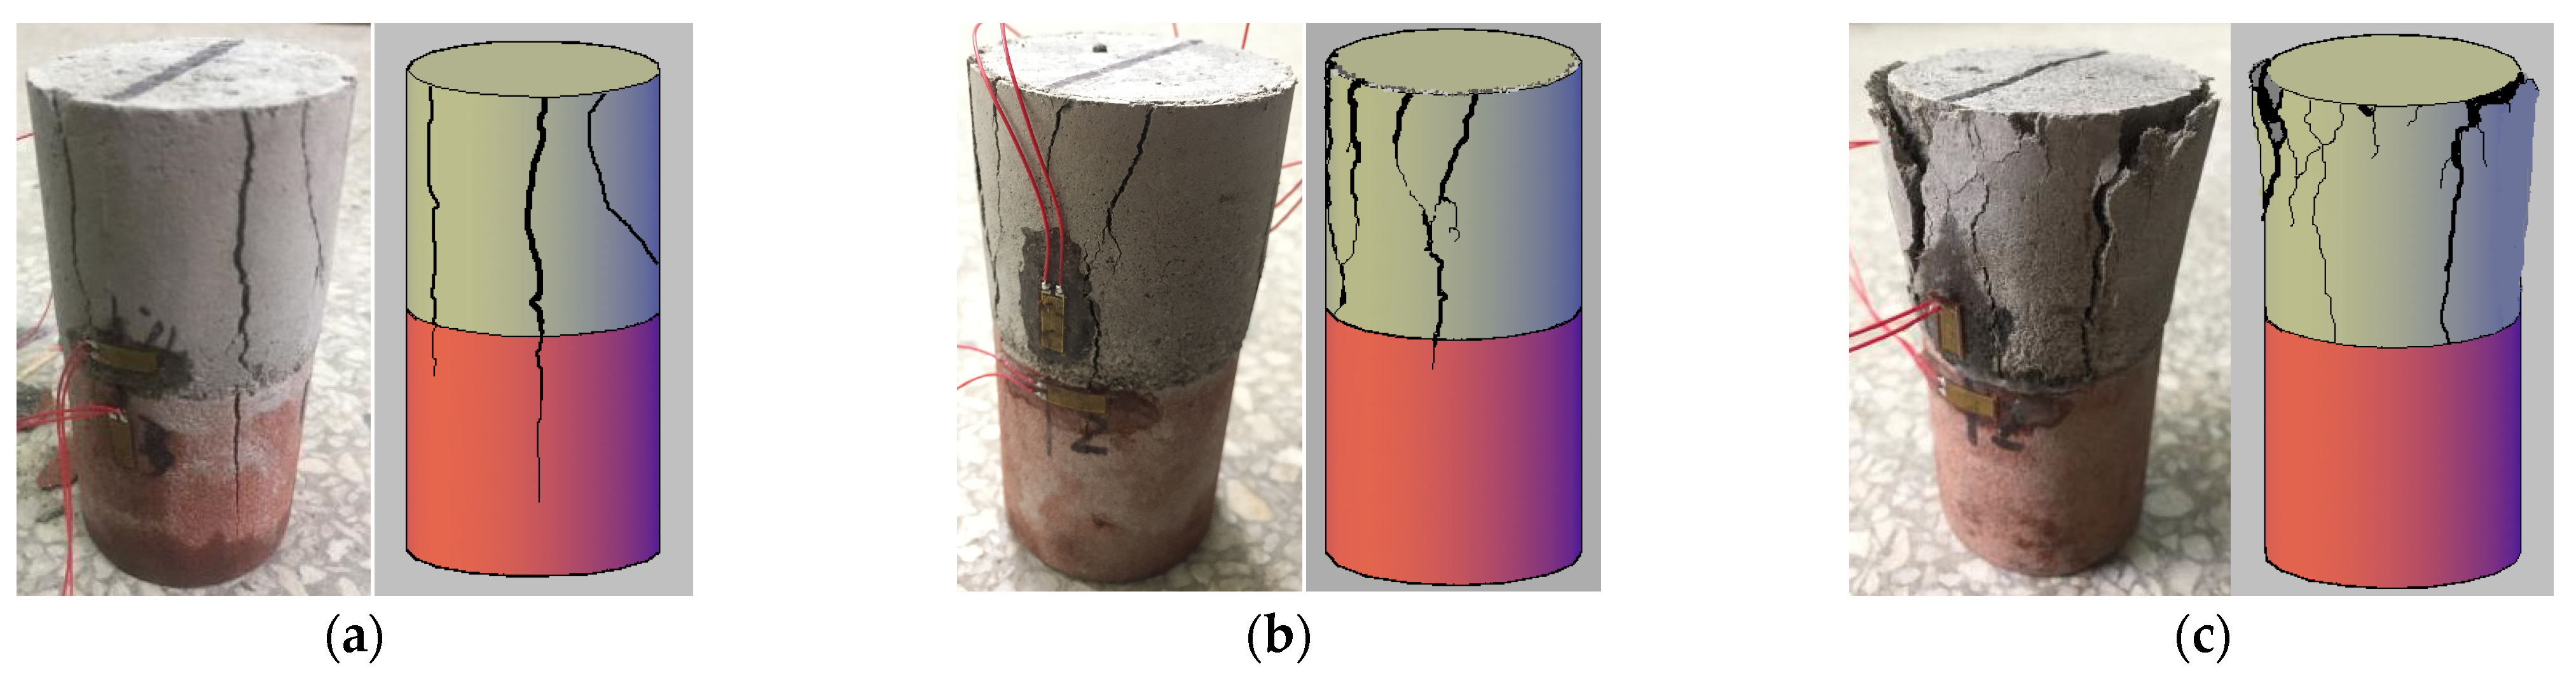
Uniaxial compression tests on the backfill-red sandstone combination with different cement–sand ratios were carried out. It was found that at the cement–sand ratio of 1:4, backfill and red sandstone realized synergistic support; the two parts interacted and restricted each other, jointly resisted external loads and played a role in common bearing. However, with the decrease of the cement–sand ratio, the stress mainly acted on the filling materials, and the deformation observed in the backfill was large while there was no obvious rupture in the red sandstone. The backfill-red sandstone combination with the cement–sand ratio of 1:4 had a splitting failure and obvious ruptures. With the cement–sand ratio of 1:6, the upper backfill of combination specimen had a V-shaped rupture, and the lower red sandstone had some small cracks. With the cement–sand ratio of 1:8, the upper backfill of the backfill-red sandstone combination had a “slope” rupture, and there were no cracks in the lower red sandstone.
According to the stress–strain curve of the specimens, the damage failure process is divided into three stages: compaction pre-synergy stage, quasi-elastic synergy deformation stage and rupture deformation stage. The damage constitutive models in each stage are established, respectively. The damage of backfill-red sandstone combination under load is equivalent to the coupling of two damage states of backfill and red sandstone. The theoretical curves obtained from the damage constitutive model are highly consistent with the experimental curves which confirmed the validities of the proposed constitutive model to describe the coupling relationship between the red sandstone and the backfill. The results obtained from this study are of great significance for accurately understanding the synergy relationship between backfill and surrounding rock and for selecting reasonable backfill strength and material ratio in goaf.

Author Contributions

Conceptualization, C.Y. and W.Z.; methodology, C.Y.; investigation, G.Z., B.Z. and Y.C.; writing—original draft preparation, C.Y. and W.Z.; writing—review and editing and supervision, W.Z., S.W. and J.G.; funding acquisition, W.Z. All authors have read and agreed to the published version of the manuscript.

Funding

This research was funded by the National Natural Science Foundation of China (Nos. 51904220, 52004196) and Science and Technology Bureau of the Beilin, Xian (GX2016).

Data Availability Statement

Not applicable.

Conflicts of Interest

The authors declare no conflict of interest.

References

  1. Li, X.B.; Gong, F.Q.; Tao, M.; Dong, L.J.; Du, K.; Ma, C.D.; Zhou, Z.L.; Yin, T.B. Failure mechanism and coupled static-dynamic loading theory in deep hard rock mining: A review. J. Rock Mech. Geotech. Eng. 2017, 9, 767–782. [Google Scholar] [CrossRef]
  2. Huang, Z.; Yilmaz, E.; Cao, S. Analysis of strength and microstructural characteristics of mine backfills containing fly ash and desulfurized gypsum. Minerals 2021, 11, 409. [Google Scholar] [CrossRef]
  3. Fang, K.; Fall, M. Shear behavior of the interface between rock and cemented backfill: Effect of curing stress, drainage condition and backfilling rate. Rock Mech. Rock Eng. 2020, 53, 325–336. [Google Scholar] [CrossRef]
  4. Razyq, N.; Luo, G.H.; Neil, R.; Andy, F.; Johns, M.L.; Fridjonsson, E.O. Understanding the microstructural evolution of hypersaline cemented paste backfill with low-field NMR relaxation. Cem. Concr. Res. 2021, 147, 106516. [Google Scholar]
  5. Hefni, M.; Hassani, F. Experimental development of a novel mine backfill material: Foam mine fill. Minerals 2020, 10, 564. [Google Scholar] [CrossRef]
  6. Yang, W.D.; Li, G.Z.; Ranjith, P.G.; Fang, L.D. An experimental study of mechanical behavior of brittle rock-like specimens with multi-non-persistent joints under uniaxial compression and damage analysis. Int. J. Damage Mech. 2019, 28, 1–33. [Google Scholar] [CrossRef]
  7. Sirdesai, N.N.; Singh, T.N.; Ranjith, P.G.; Singh, R. Effect of varied durations of thermal treatment on the tensile strength of red sandstone. Rock Mech. Rock Eng. 2017, 50, 205–213. [Google Scholar] [CrossRef]
  8. Kim, E.; Changani, H. Effect of water saturation and loading rate on the mechanical properties of red and buff sandstones. Int. J. Rock Mech. Min. Sci. 2016, 88, 23–28. [Google Scholar] [CrossRef]
  9. Khanlari, G.; Sahamieh, R.Z.; Abdilor, Y. The effect of freeze-thaw cycles on physical and mechanical properties of upper red formation sandstones, central part of Iran. Arab. J. Geosci. 2015, 8, 5991–6001. [Google Scholar] [CrossRef]
  10. Pan, X.K.; Berto, F.; Zhou, X.P. Creep damage behaviors of red sandstone subjected to uniaxial compression after high-temperature heat treatment using acoustic emission technology. Fatigue Fract. Eng. Mater. Struct. 2021, 45, 302–322. [Google Scholar] [CrossRef]
  11. Chen, D.H.; Chen, H.E.; Zhang, W.; Lou, J.Q.; Shan, B. An analytical solution of equivalent elastic modulus considering confining stress and its variables sensitivity analysis for fractured rock masses. J. Rock Mech. Geotech. Eng. 2021; in press. [Google Scholar] [CrossRef]
  12. Bustamante, R.; Rajagopal, K.R. A nonlinear model for describing the mechanical behaviour of rock. Acta Mech. 2018, 229, 251–272. [Google Scholar] [CrossRef]
  13. Zhao, Y.L.; Zhang, L.Y.; Wang, W.J.; Liu, Q.; Tang, L.M.; Cheng, G.M. Experimental study on shear behavior and a revised shear strength model for infilled rock joints. Int. J. Geomech. 2020, 20, 04020141. [Google Scholar] [CrossRef]
  14. Shahin, G.; Marinelli, S.; Buscarnera, G. Viscoplastic interpretation of localized compaction creep in porous rock. J. Geophys. Res. Solid Earth 2019, 124, 017498. [Google Scholar] [CrossRef]
  15. Kolo, I.; Rashid, K.A.; Sousa, R.L.; Lonetti, P. Computational modelling of fracture propagation in rocks using a coupled elastic-plasticity-damage model. Math. Probl. Eng. 2016, 5, 1–15. [Google Scholar] [CrossRef]
  16. Zhu, C.; He, M.C.; Jiang, B.; Qin, X.Z.; Yin, Q.; Zhou, Y. Numerical investigation on the fatigue failure characteristics of water-bearing sandstone under cyclic loading. J. Mt. Sci. 2021, 18, 3348–3365. [Google Scholar] [CrossRef]
  17. Khalij, L.; Pagnacco, E.; Troian, R. Fatigue criterion improvement of Gough and Nishihara & Kawamoto to predict the fatigue damage of a wide range of metallic materials. Int. J. Fatigue 2017, 99, 137–150. [Google Scholar]
  18. Lee, S.H.; Han, J.T. A study on comparison of strength parameters of hydrostatic pressure-dependent yield criteria. J. Korea Acad. Ind. Coop. Soc. 2016, 17, 529–535. [Google Scholar]
  19. Lin, H.; Zhang, X.; Cao, R.H.; Wen, Z.J. Improved nonlinear Burgers shear creep model based on the time-dependent shear strength for rock. Environ. Earth Sci. 2020, 79, 1–9. [Google Scholar] [CrossRef]
  20. Zhu, C.; He, M.C.; Zhang, X.H.; Tao, Z.G.; Yin, Q.; Li, L.F. Nonlinear mechanical model of constant resistance and large deformation bolt and influence parameters analysis of constant resistance behavior. Rock Soil Mech. 2021, 42, 1911–1924. [Google Scholar]
  21. Kaimonov, M.V.; Khokholov, Y.A. Selection of frozen backfill mixture composition. J. Min. Sci. 2019, 55, 857–864. [Google Scholar] [CrossRef]
  22. Shahsavari, H.; Baghani, M.; Sohrabpour, S.; Naghdabadi, R. Continuum damage-healing constitutive modeling for concrete materials through stress spectral decomposition. Int. J. Damage Mech. 2016, 25, 900–918. [Google Scholar] [CrossRef]
  23. Sainoki, A.; Mitri, H.S. Quantitative analysis with plastic strain indicators to estimate damage induced by fault-slip. J. Rock Mech. Geotech. Eng. 2018, 10, 1–10. [Google Scholar] [CrossRef]
  24. Koohestani, B.; Koubaa, A.; Belem, T.; Bussière, B.; Bouzahzah, H. Experimental investigation of mechanical and microstructural properties of cemented paste backfill containing maple-wood filler. Constr. Build. Mater. 2016, 121, 222–228. [Google Scholar] [CrossRef]
  25. Popczyk, M.K.; Jendrus, R. Impact of ash and water mixture density on the process of gob grouting in view of laboratory tests. Arch. Min. Sci. 2019, 64, 625–634. [Google Scholar]
  26. Koupouli, N.J.F.; Belem, T.; Rivard, P.; Effenguet, H. Direct shear tests on cemented paste backfill-rock wall and cemented paste backfill-backfill interfaces. J. Rock Mech. Geotech. Eng. 2016, 8, 472–479. [Google Scholar] [CrossRef] [Green Version]
  27. Fang, K.; Fall, M. Effects of curing temperature on shear behaviour of cemented paste backfill-rock interface. Int. J. Rock Mech. Min. Sci. 2018, 112, 184–192. [Google Scholar] [CrossRef]
  28. Falaknaz, N.; Aubertin, M.; Li, L. Numerical investigation of the geomechanical response of adjacent backfilled stopes. Can. Geotech. J. 2015, 52, 1507–1525. [Google Scholar] [CrossRef]
  29. Jafari, M.; Shahsavari, M.; Grabinsky, M. Experimental study of the behavior of cemented paste backfill under high isotropic compression. J. Geotech. Geoenviron. Eng. 2020, 146, 06020019. [Google Scholar] [CrossRef]
  30. Siddiquee, M.S.A.; Noguchi, T.; Hirakawa, D. Computational simulation of time-dependent behavior of soil–structure interaction by using a novel creep model: Application to a geosynthetic-reinforced soil physical model. Comput. Geotech. 2015, 66, 180–188. [Google Scholar] [CrossRef]
  31. Jafari, M.; Shahsavari, M.; Grabinsky, M. Drained triaxial compressive shear response of cemented paste backfill (CPB). Rock Mech. Rock Eng. 2021, 54, 3309–3325. [Google Scholar] [CrossRef]
  32. Pachoud, A.J.; Schleiss, A.J. Stresses and displacements in steel-lined pressure tunnels and shafts in anisotropic rock under quasi-static internal water pressure. Rock Mech. Rock Eng. 2016, 49, 1263–1287. [Google Scholar] [CrossRef]
  33. Tu, B.B.; Liu, L.; Cheng, K.L.; Zhang, B.; Zhao, Y.Z.; Yang, Q.X.; Song, K. A Constitutive Model for Cemented Tailings Backfill Under Uniaxial Compression. Front. Phys. 2020, 8, 1–9. [Google Scholar] [CrossRef]
  34. Yang, H.F.; Liu, C.L.; Jiang, J.S. Damage constitutive model of stirrup-confined recycled aggregate concrete after freezing and thawing cycles. Constr. Build. Mater. 2020, 253, 119100. [Google Scholar] [CrossRef]
  35. Klakattawi, H.S. The Weibull-Gamma distribution: Properties and applications. Entropy 2019, 21, 438. [Google Scholar] [CrossRef] [PubMed] [Green Version]
  36. Ahmad, A.B.A.; Ghazal, M.G.M. Exponentiated additive Weibull distribution. Reliab. Eng. Syst. Saf. 2020, 193, 106663. [Google Scholar] [CrossRef]
  37. Krajcinovic, D.; Trafimow, J.; Sumarac, D. Simple constitutive model for a cortical bone. J. Biomech. 1987, 20, 779–784. [Google Scholar] [CrossRef]
Figure 1. Particle size distribution of the tailings.
Minerals 12 00202 g001
Figure 2. Preparation process of backfill-red sandstone combination specimens: (a) red sandstone samples (Φ 50 mm × H 50 mm); (b) backfill with different cement–sand ratios; (c) backfill-red sandstone combination specimens.
Minerals 12 00202 g002
Figure 3. Experimental equipment.
Minerals 12 00202 g003
Figure 4. Stress–strain curves of the specimens at the cement–sand ratio of 1:4.
Minerals 12 00202 g004
Figure 5. Stress–strain curves of the specimens at the cement–sand ratio of 1:6.
Minerals 12 00202 g005
Figure 6. Stress–strain curves of the specimens at the cement–sand ratio of 1:8.
Minerals 12 00202 g006
Figure 7. Macroscopic failure phenomenon of composite specimens: (a) HB4-3, (b) HB6-1, and (c) HB8-1.
Minerals 12 00202 g007
Figure 8. Comprehensive stress–strain curves of backfill-red sandstone combination specimens with different cement–sand ratios.
Minerals 12 00202 g008
Figure 9. Stress–strain curve of backfill-red sandstone combination specimen.
Minerals 12 00202 g009
Figure 10. Mechanical analysis model of backfill-red sandstone combination specimen.
Minerals 12 00202 g010
Figure 11. Damage constitutive model compared with the test.
Minerals 12 00202 g011
Figure 12. Theoretical curve with phased characteristic diagram.
Minerals 12 00202 g012
Figure 13. Damage variable change of HB4-3.
Minerals 12 00202 g013
Table 1. Composition of iron tailings.
CompositionSiO2Al2O3Fe2O3CaOMgONa2OOther
Content (%)67.722.0520.654.663.160.51.26
Table 2. Strength characteristics of backfill.
No.Solid Content
/wt%
Cement–Sand RatioUCS (MPa)Elastic Modulus (GPa)
B4-1801:46.411.09
B4-21:46.471.12
B4-31:46.931.14
B6-11:64.210.46
B6-21:64.520.62
B6-31:64.460.57
B8-11:83.340.25
B8-21:83.360.27
B8-31:83.070.19
Table 3. Mechanical parameters of backfill-red sandstone combination specimens.
Composite
Specimen
Solid Content
/wt%
Cement–Sand
Ratio
σp (MPa)σr (MPa)εpE (GPa)
HB4-1801:49.324.081.09 × 10−38.95
HB4-29.884.131.16 × 1039.45
HB4-310.294.081.39 × 10310.77
HB6-11:67.443.572.03 × 1034.58
HB6-25.403.462.06 × 1032.43
HB6-36.323.462.03 × 1033.34
HB8-11:85.55/2.26 × 1032.57
HB8-25.40/2.18 × 1032.48
HB8-34.48/2.11 × 1032.28
Table 4. Values based on relative elastic modulus contribution.
No.Ec
(GPa)
Eh
(GPa)
η1η2E0
(GPa)
η 1 η 2 Ep
(GPa)
HB4-11.099.320.200.807.671.020.9810.24
HB4-21.129.760.210.797.940.991.0110.97
HB4-31.1411.150.210.799.050.981.0212.49
Table 5. Mechanical parameters of composite specimen.
No.σp
(MPa)
E0
(GPa)
εp
(10−3)
σr
(MPa)
Ep
(GPa)
βCbε0NA
HB4-19.327.671.094.0810.244.150.210.610.483.190.10
HB4-29.887.941.164.1210.971.930.390.941.072.940.09
HB4-310.299.051.394.0812.491.460.561.111.522.840.06
Table 6. Data table of intersections of composite specimen at each stage.
No.Actual
σA
(MPa)
OA Section
σA
(MPa)
Actual
σp
(MPa)
AB Section
σp
(MPa)
Actual
σr
(MPa)
BC Section
σr
(MPa)
HB4-14.734.529.329.494.083.45
HB4-24.334.299.889.934.083.50
HB4-34.434.3910.2910.184.123.54
Table 7. Constitutive equation and damage of each stage.
Stage DivisionDamage Constitutive ModelDamage Deformation DiagramDescription of Deformation Characteristics
Section OA: compaction pre-synergy stageConstitutive equation:
σ = ( η 1 E c + η 2 E h ) ε ( 1 C ε β )
Actual parameter equation:
σ = 9.05 ε ( 1 0.56 ε 1.46 )
Minerals 12 00202 i001At this stage, the internal microcracks of the upper backfill and its stratified contact surface with the lower red sandstone are compacted and damaged.
Section
AB:
quasi-elastic synergy deformation stage
Constitutive equation:
σ = ( η 1 E c + η 2 E h ) ε ( 1 exp ( ε ε 0 ) b )
Actual parameter equation:
σ = 12.49 ε ( 1 exp ( ε 1.52 ) 1.11 )
Minerals 12 00202 i002At this stage, there is no crack in the backfill-red sandstone combination as a whole, but the edges and corners of the upper backfill are damaged.
Section
BC:
rupture deformation stage
Constitutive equation:
σ = ( η 1 E c + η 2 E h ) ε ( 1 A ε N ) 2 + σ r ( 1 A ε N ) 2
Actual parameter equation:
σ = 12.49 ε ( 1 0.06 ε 2.84 ) 2 + 4.08 ( 1 0.06 ε 2.84 ) 2
Minerals 12 00202 i003At this stage, when the stress exceeds the peak value for a period of time, the through crack is rapidly generated and expanded. With the continuous application of load, the fissure of the backfill presents V-shaped expansion, and the phenomenon of “rib spalling” occurs locally.
Minerals 12 00202 i004
Publisher’s Note: MDPI stays neutral with regard to jurisdictional claims in published maps and institutional affiliations.

