


Fusion of Multispectral Remote-Sensing Data through GIS-Based Overlay Method for Revealing Potential Areas of Hydrothermal Mineral Resources

 , , , ,
Abstract
1. Introduction
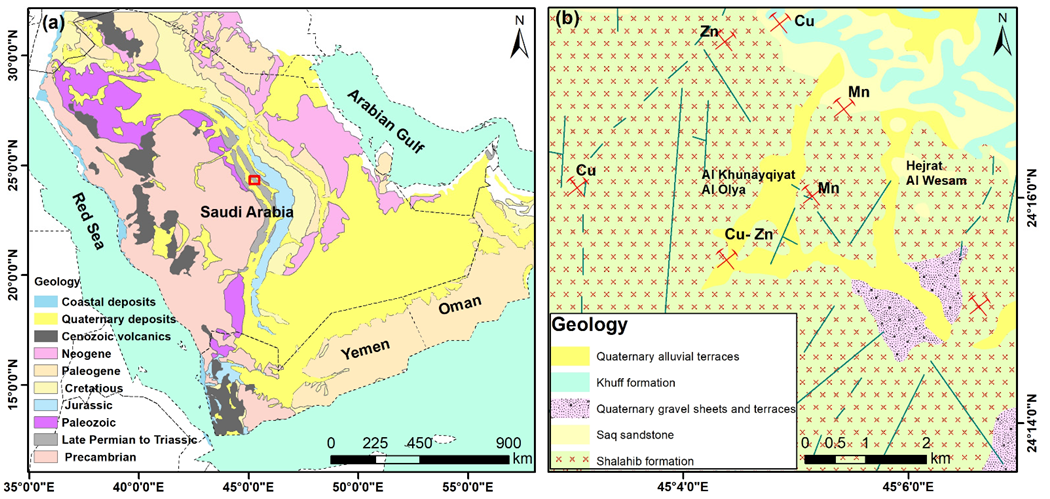
2. Study Area
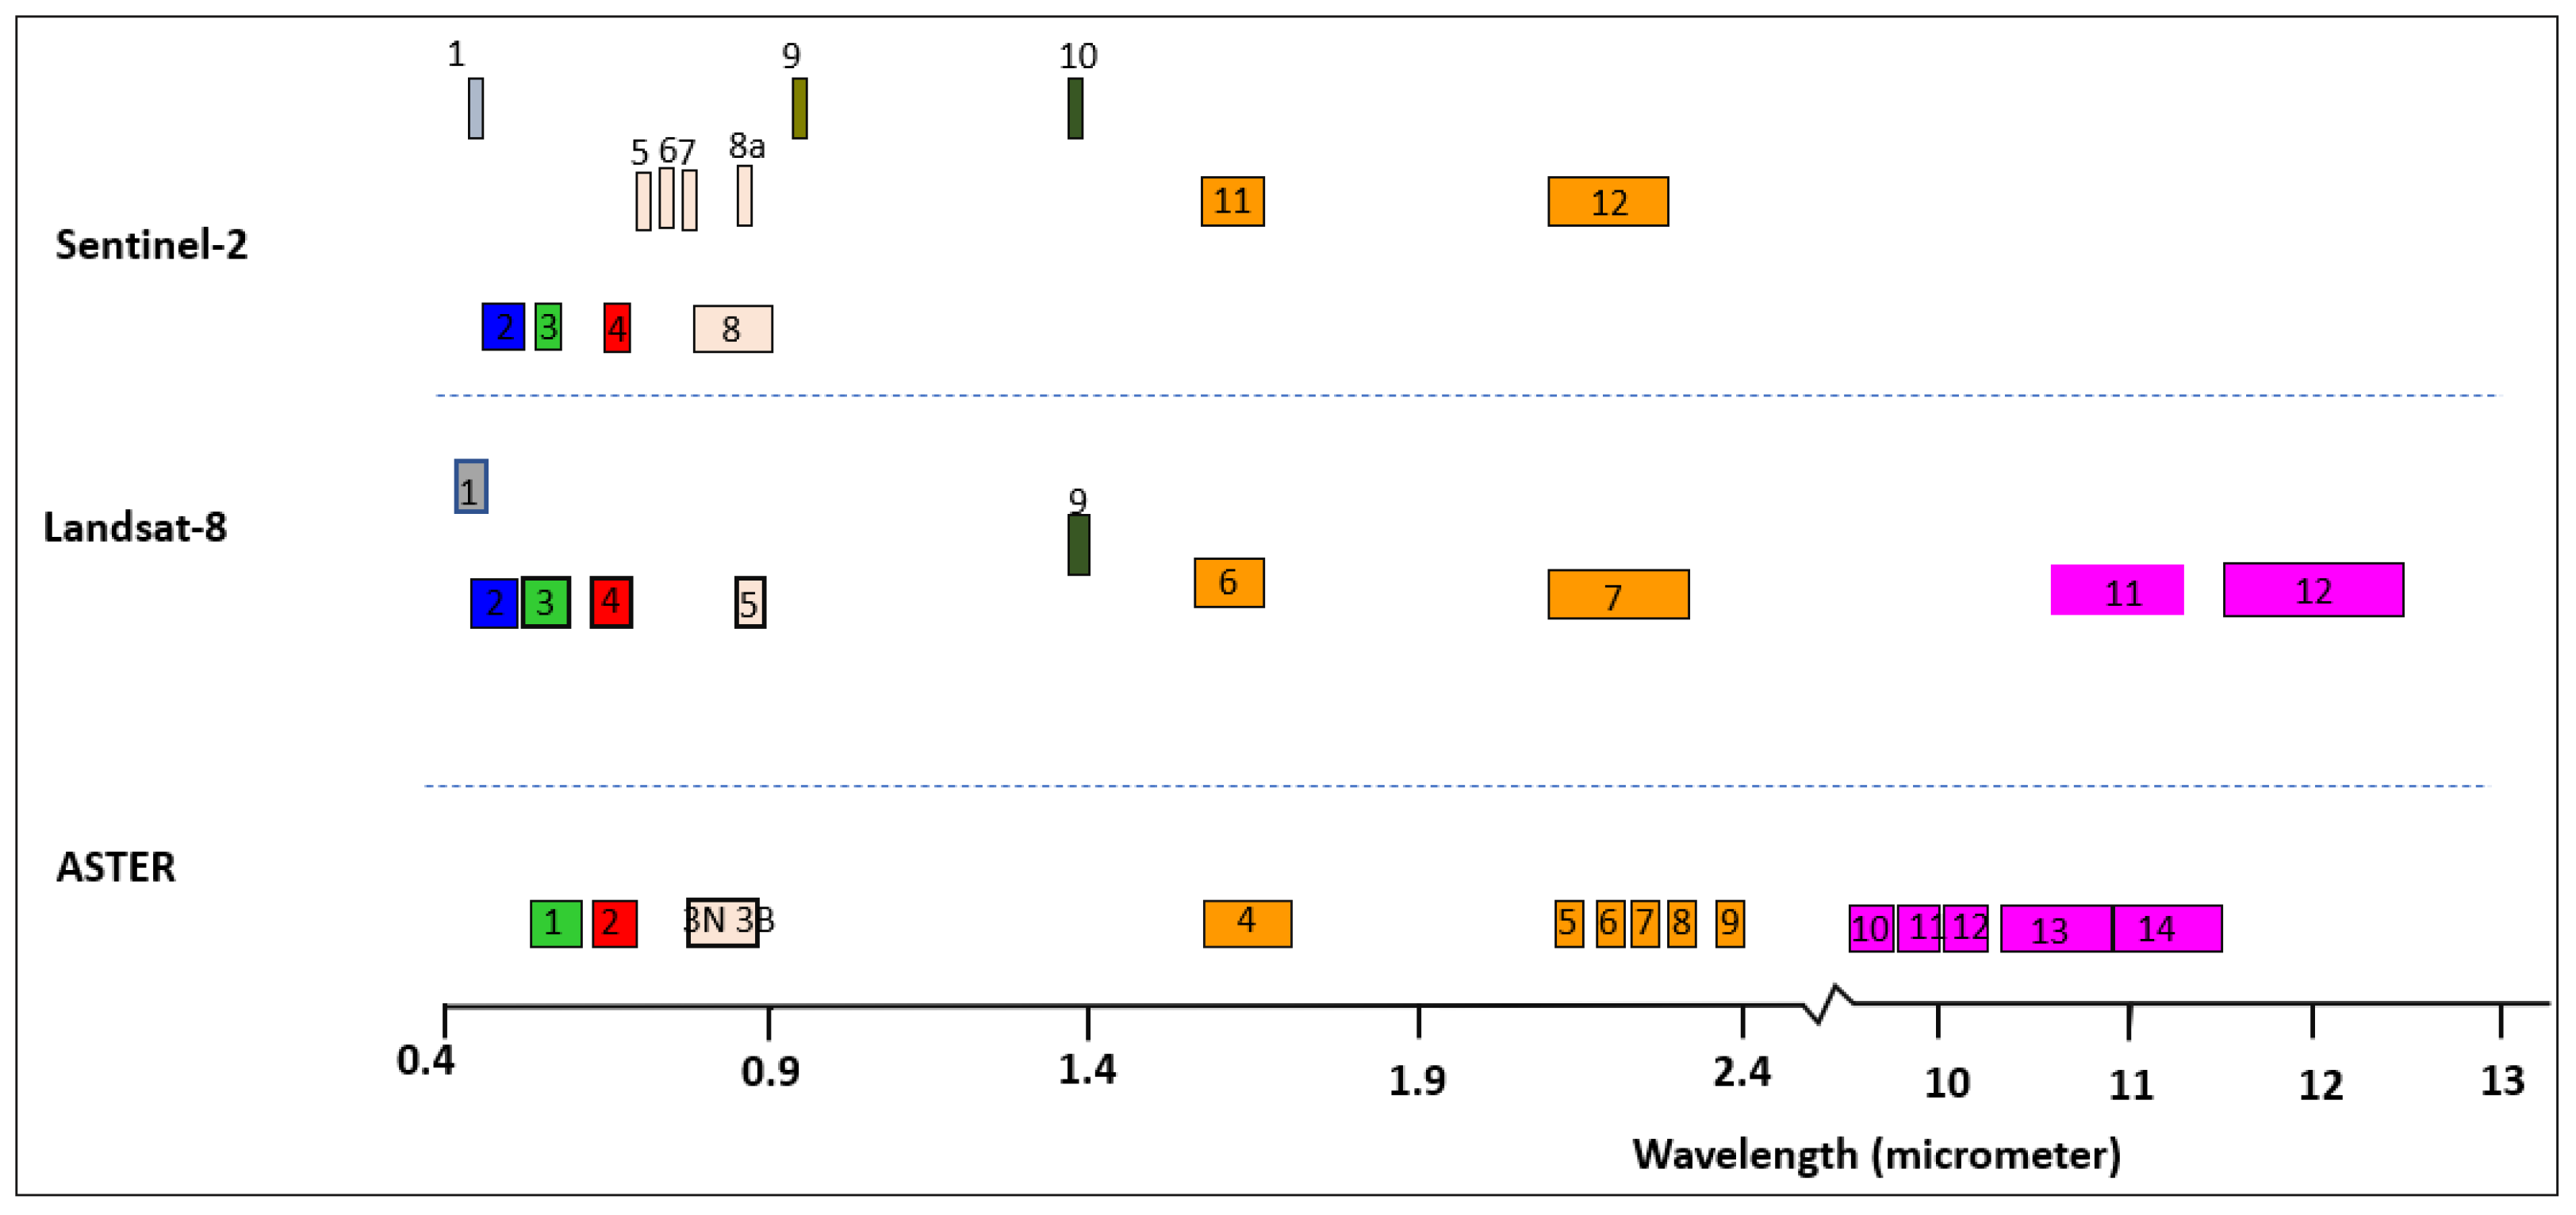
3. Data Used and Methods
4. Results
4.1. Lithologic and Structural Characteristics
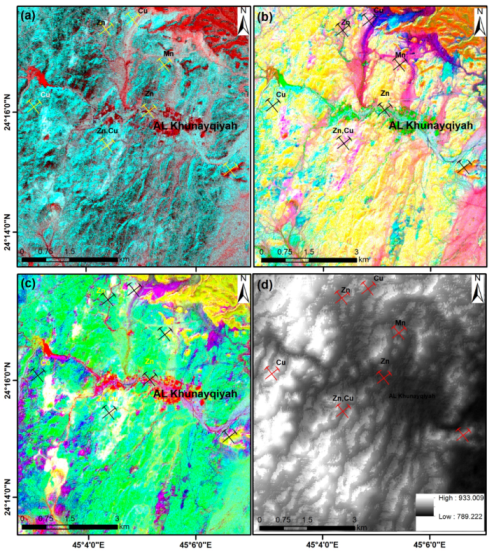
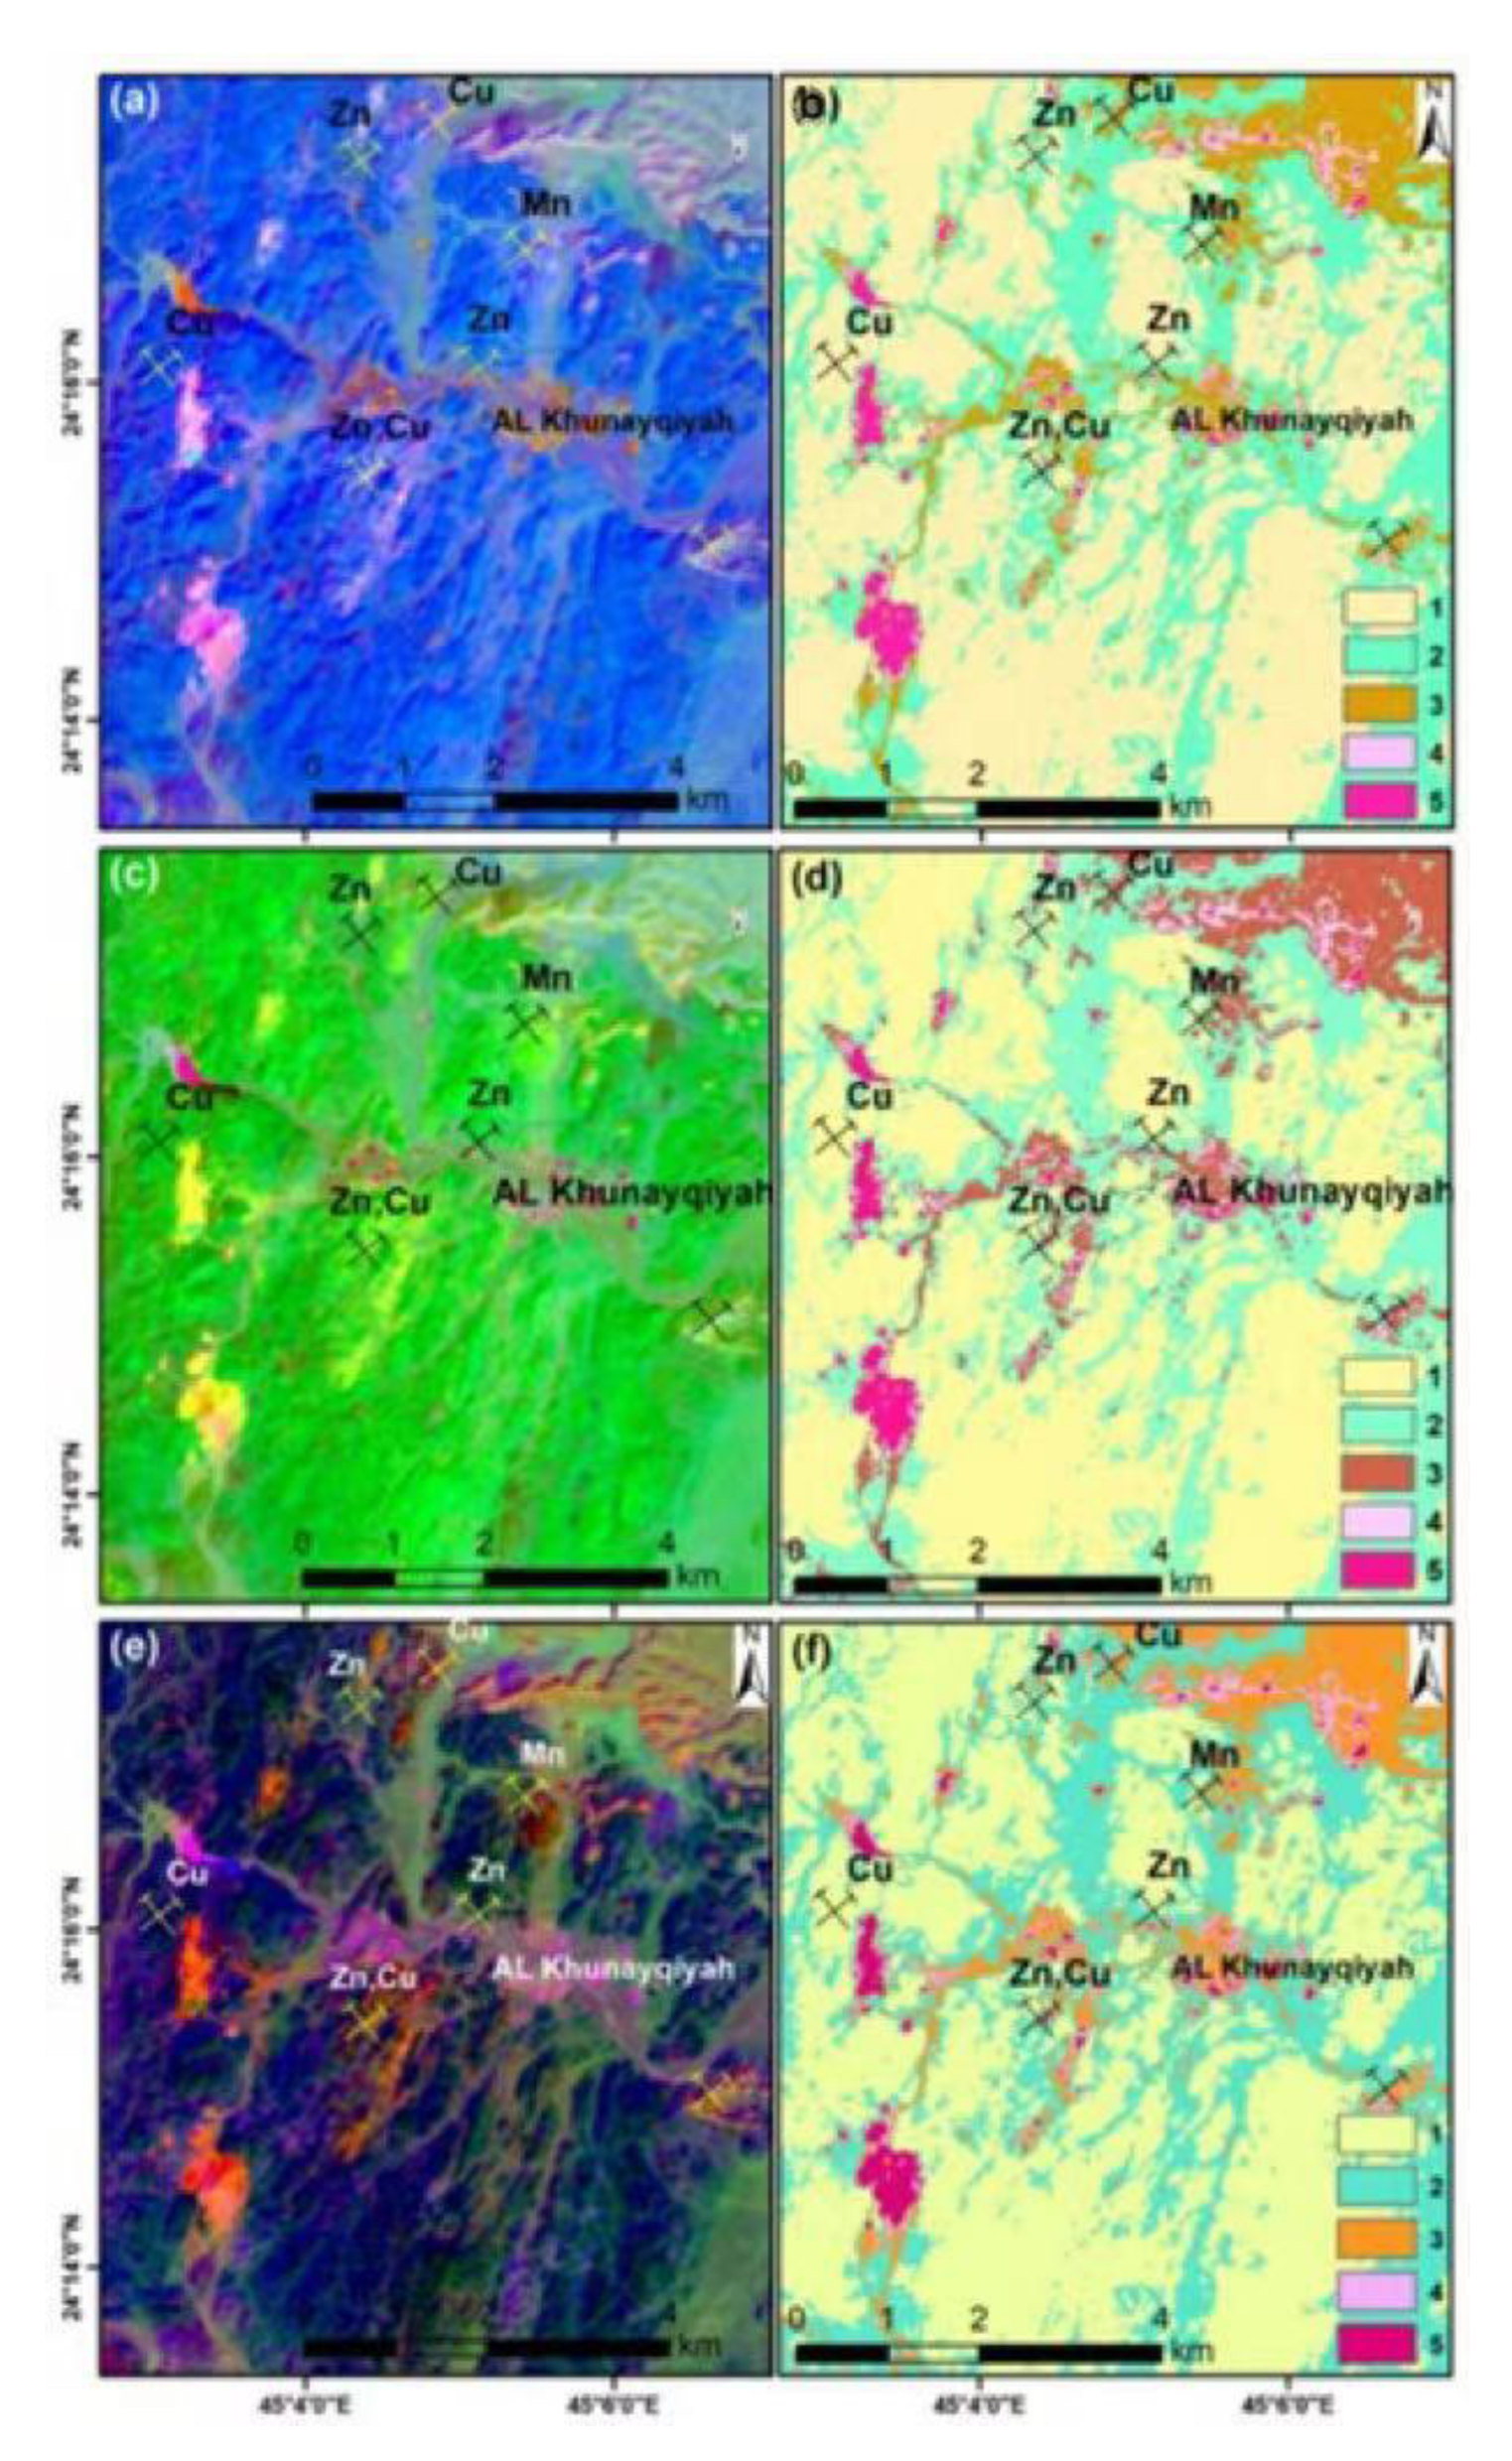
4.2. Hydrothermal Alteration Zones
4.2.1. Landsat-8
4.2.2. Sentinel-2
4.2.3. ASTER
5. XRD Analysis of Hydrothermal Alteration Zones
6. Mineral Potential Map
7. Discussion
8. Conclusions
Author Contributions
Funding
Acknowledgments
Conflicts of Interest
References
- Shi, K.; Chang, Z.; Chen, Z.; Wu, J.; Yu, B. Identifying and evaluating poverty using multisource remote sensing and point of interest (POI) data: A case study of Chongqing, China. J. Clean. Prod. 2020, 255, 120245. [Google Scholar] [CrossRef]
- Abdelkareem, M.; Al-Arifi, N. Synergy of Remote Sensing Data for Exploring Hydrothermal Mineral Resources Using GIS-Based Fuzzy Logic Approach. Remote Sens. 2021, 13, 4492. [Google Scholar] [CrossRef]
- Mars, J.C.; Rowan, L.C. Regional mapping of phyllic- and argillic-altered rocks in the Zagros magmatic arc, Iran, using Advanced Spaceborne Thermal Emission and Refl ection Radiometer (ASTER) data and logical operator algorithms. Geosphere 2006, 2, 161–186. [Google Scholar] [CrossRef]
- Abdelkareem, M.; El-Baz, F. Characterizing hydrothermal alteration zones in Hamama area in the central Eastern Desert of Egypt by remotely sensed data. Geocarto Int. 2018, 33, 1307–1325. [Google Scholar] [CrossRef]
- Crosta, A.P.; De Souza Filho, C.R.; Azevedo, F.; Brodie, C. Targeting key alteration minerals in epithermal deposits in Patagonia, Argentina, using ASTER imagery and principal component analysis. Int. J. Remote Sens. 2003, 24, 4233–4240. [Google Scholar] [CrossRef]
- Testa, F.J.; Villanueva, C.; Cooke, D.R.; Zhang, L. Lithological and Hydrothermal Alteration Mapping of Epithermal, Porphyry and Tourmaline Breccia Districts in the Argentine Andes Using ASTER Imagery. Remote. Sens. 2018, 10, 203. [Google Scholar] [CrossRef]
- Abrams, M.J.; Brown, D.; Lepley, L.; Sadowski, R. Remote sensing for porphyry copper deposits in southern Arizona. Econ. Geol. 1983, 78, 591–604. [Google Scholar] [CrossRef]
- Sabins, F. Remote Sensing Principles and Interpretation, 3rd ed.; W.H. Freeman Company: New York, NY, USA, 1997; p. 494. [Google Scholar]
- Sabins, F.F. Remote sensing for mineral exploration. Ore Geol. Rev. 1999, 14, 157–183. [Google Scholar] [CrossRef]
- Shi, X.; Al-Arifi, N.; Abdelkareem, M.; Abdalla, F. Application of remote sensing and GIS techniques for exploring potential areas of hydrothermal mineralization in the central Eastern Desert of Egypt. J. Taibah Univ. Sci. 2020, 14, 1421–1432. [Google Scholar] [CrossRef]
- Ninomiya, Y. A stabilized vegetation index and several mineralogic indices defined for ASTER VNIR and SWIR data. In Proceedings of the 2003 IEEE International Geoscience and Remote Sensing Symposium, Toulouse, France, 21–25 July 2003; pp. 1552–1554. [Google Scholar]
- Ninomiya, Y. Advanced remote lithologic mapping in ophiolite zone with ASTER multispectral thermal infrared data. In Proceedings of the 2003 IEEE International Geoscience and Remote Sensing Symposium, Toulouse, France, 21–25 July 2003; pp. 1561–1563. [Google Scholar]
- Rowan, L.C.; Mars, J.C. Lithologic mapping in the Mountain Pass, California area using advanced spaceborne ther-mal emission and reflection radiometer (ASTER) data. Remote Sens. Environ. 2003, 84, 350–366. [Google Scholar] [CrossRef]
- Azizi, H.; Tarverdi, M.; Akbarpour, A. Extraction of hydrothermal alterations from ASTER SWIR data from east Zanjan, northern Iran. Adv. Space Res. 2010, 46, 99–109. [Google Scholar] [CrossRef]
- Zhang, X.; Pazner, M.; Duke, N. Lithologic and mineral information extraction for gold exploration using ASTER data in the south Chocolate Mountains (California). ISPRS J. Photogramm. Remote. Sens. 2007, 62, 271–282. [Google Scholar] [CrossRef]
- Sultan, M.; Arvidson, R.E.; Sturchio, N.C. Mapping of serpentinites in the Eastern Desert of Egypt by using Landsat thematic mapper data. Geology 1986, 14, 995–999. [Google Scholar] [CrossRef]
- Madani, A.M. Utilization of Landsat ETM+ Data for Mapping Gossans and Iron Rich Zones Exposed at Bahrah Area, Western Arabian Shield, Saudi Arabia. J. King Abdulaziz Univ. Sci. 2009, 20, 35–49. [Google Scholar] [CrossRef]
- Ramadan, T.M.; Kontny, A. Mineralogical and structural characterization of alteration zones detected by orbital re-mote sensing at Shalatein District, SE Desert, Egypt. J. Afr. Earth Sci. 2004, 40, 89–99. [Google Scholar] [CrossRef]
- Cardoso-Fernandes, J.; Teodoro, A.C.; Lima, A.; Perrotta, M.; Roda-Robles, E. Detecting Lithium (Li) Mineralizations from Space: Current Research and Future Perspectives. Appl. Sci. 2020, 10, 1785. [Google Scholar] [CrossRef]
- El-Din, G.M.K.; El-Noby, M.E.; Abdelkareem, Z.M.; Hamimi, Z. Using multispectral and radar remote sensing data for geological investigation, Qena-Safaga Shear Zone, Eastern Desert, Egypt. Arab. J. Geosci. 2021, 14, 997. [Google Scholar] [CrossRef]
- Galvão, L.S.; Almeida-Filho, R.; Vitorello, I. Spectral discrimination of hydrothermally altered materials using ASTER short-wave infrared bands: Evaluation in a tropical savannah environment. Int. J. Appl. Earth Obs. Geoinf. 2005, 7, 107–114. [Google Scholar] [CrossRef]
- Yamaguchi, Y.; Naito, C. Spectral indices for lithologic discrimination and mapping by using the ASTER SWIR bands. Int. J. Remote Sens. 2003, 24, 4311–4323. [Google Scholar] [CrossRef]
- Gupta, R.P. Remote Sensing Geology, 2nd ed.; Springer-Verlag: Berlin/Heidelberg, Germany, 2003. [Google Scholar]
- Crowley, J.K.; Brickey, D.W.; Rowan, L.C. Airborne imaging spectrometer data of the Ruby Mountains, Montana: Mineral discrimination using relative absorption band-depth images. Remote Sens. Environ. 1989, 29, 121–134. [Google Scholar] [CrossRef]
- Zhang, N.; Zhou, K. Mineral prospectivity mapping with weights of evidence and fuzzy logic methods. J. Intell. Fuzzy Syst. 2015, 29, 2639–2651. [Google Scholar] [CrossRef]
- Harris, J.R.; Wilkinson, L.; Heather, K.; Fumerton, S.; Bernier, M.A.; Ayer, J.; Dahn, R. Application of GIS Processing Techniques for Producing Mineral Prospectivity Maps—A Case Study: Mesothermal Au in the Swayze Greenstone Belt, Ontario, Canada. Nonrenewable Resour. 2001, 10, 91–124. [Google Scholar] [CrossRef]
- Abdelkareem, M.; Othman, I.; Kamal El Din, G. Lithologic mapping using remote sensing data in Abu Marawat Area, Eastern Desert of Egypt. Int. J. Adv. Remote Sens. GIS. 2017, 6, 2171–2177. [Google Scholar] [CrossRef]
- Abdelkareem, M.K.; El-Din, G.; Osman, I. An integrated approach for mapping mineral resources in the Eastern Desert of Egypt. Int. J. Appl. Earth Obs. Geoinf. 2018, 73, 682–696. [Google Scholar] [CrossRef]
- Sun, T.; Chen, F.; Zhong, L.; Liu, W.; Wang, Y. GIS-based mineral prospectivity mapping using machine learning methods: A case study from Tongling ore district, eastern China. Ore Geol. Rev. 2019, 109, 26–49. [Google Scholar] [CrossRef]
- Campos, L.D.; de Souza, S.M.; de Sordi, D.A.; Tavares, F.M.; Klein, E.L.; Lopes, E.C.D.S. Predictive mapping of prospectivity in the Gurupi orogenic gold belt, north–northeast Brazil: An example of districtscale mineral system approach to exploration targeting. Nat. Resour. Res. 2017, 26, 509–534. [Google Scholar] [CrossRef]
- Stern, R.J.; Johnson, P.R.; Kröner, A.; Yibas, B. Neoproterozoic ophiolites of the Arabian-Nubian shield. Dev. Precambrian Geol. 2004, 13, 95–128. [Google Scholar]
- Kröner, A.; Stern, R.J. Pan-African Orogeny. Encycl. Geol. 2004, 1, 1–12. [Google Scholar]
- Stoeser, D.B.; Camp, V.E. Pan-African microplate accretion of the Arabian Shield. Geol. Soc. Am. Bull. 1985, 96, 817–826. [Google Scholar] [CrossRef]
- Johnson, P.R.; Woldehaimanot, B. Development of the Arabian-Nubian Shield: Perspectives on Accretion and Defor-Mation in the Northern East African Orogen and the Assembly of Gondwana; Geological Society, London, Special Publications: London, UK, 2003; Volume 206, pp. 289–325. [Google Scholar]
- Genna, A.; Nehlig, P.; Le Goff, E.; Guerrot, C.; Shanti, M. Proterozoic tectonism of the Arabian Shield. Precambrian Res. 2002, 117, 21–40. [Google Scholar] [CrossRef]
- Nehlig, P.; Genna, A.; Asfirane, F.; BRGM France; Guerrot, C.; Eberlé, J.; Kluyver, H.; Lasserre, J.; Le Goff, E.; Nicol, N.; et al. A review of the Pan-African evolution of the Arabian Shield. GeoArabia 2002, 7, 103–124. [Google Scholar] [CrossRef]
- Hamimi, Z.; Fowler, A.R. Najd Shear System in the Arabian-Nubian Shield. In The Geology of the Arabian-Nubian Shield; Springer: Cham, Switzerland, 2021; pp. 359–392. [Google Scholar]
- Hamimi, Z.; Abdelkareem, M.; Fowler, A.R.; Younis, M.H.; Matsah, M.; Abdalla, F. Remote sensing and structural studies of the Central Asir Shear Zone, Western Arabian Shield: Implications for the late Neoproterozoic EW Gondwana assembly. J. Asian Earth Sci. 2021, 215, 104782. [Google Scholar] [CrossRef]
- Johnson, P.R.; Andresen, A.; Collins, A.S.; Fowler, A.R.; Fritz, H.; Ghebreab, W.; Kusky, T.; Stern, R.J. Late Cryoge-nian–Ediacaran history of the Arabian–Nubian Shield: A review of depositional, plutonic, structural, and tectonic events in the closing stages of the northern East African Orogen. J. Afr. Earth Sci. 2011, 61, 167–232. [Google Scholar] [CrossRef]
- Doebrich, J.L.; Al-Jehani, A.M.; Siddiqui, A.A.; Hayes, T.S.; Wooden, J.L.; Johnson, P.R. Geology and metallogeny of the Ar Rayn terrane, eastern Arabian shield: Evolution of a Neoproterozoic continental-margin arc during assembly of Gondwana within the East African orogen. Precambrian Res. 2007, 158, 17–50. [Google Scholar] [CrossRef]
- BRGM Geoscientists. Khnaiguiyah Zinc-Copper Deposit Prefeasibility Study: Saudi Arabian Directorate General of Mineral Resources; Technical Report BRGM-TR-13-4; French Geological Survey: Orléans, France, 1994. [Google Scholar]
- Vaslet, D.; Delfour, J.; Manivit, J.; Le Nindre, Y.M.; Brosse, J.M.; Fourniquet, J. Geologic Map of the Wadi ar Rayn Quadrangle, Sheet 23H, Kingdom of Saudi Arabia; Saudi Arabian Deputy Ministry for Mineral Resources: Jeddah, Saudi Arabia, 1983. [Google Scholar]
- Mahdevar, M.R.; Ketabi, P.; Saadatkhah, N.; Rahnamarad, J.; Mohammadi, S.S. Application of ASTER SWIR data on detection of alteration zone in the Sheikhabad area, eastern Iran. Arab. J. Geosci. 2015, 8, 5909–5919. [Google Scholar] [CrossRef]
- Hosseinjani Zadeh, M.; Tangestani, M.H.; Roldan, F.V.; Yusta, I. Mineral exploration and alteration mapping using mixture tuned matched filtering approach on ASTER data at the central part of Dehaj-Sarduiyeh copper belt, SE Iran. IEEE J. Sel. Topics Appl. Earth Obs. Remote Sens. 2014, 7, 284–289. [Google Scholar] [CrossRef]
- Rowan, L.C.; Goetz, A.F.H.; Ashley, R.P. Discrimination of Hydrothermally Altered and Unaltered Rocks in Visible and Near Infrared Multispectral Images. Geophysics 1977, 42, 522–535. [Google Scholar] [CrossRef]
- Mather, P.M.; Koch, M. Computer Processing of Remotely-Sensed Images: An Introduction; John Wiley & Sons: Hoboken, NJ, USA, 2011. [Google Scholar]
- Goetz, A.F.H.; Rock, B.N.; Rowan, L.C. Remote sensing for exploration; an overview. Econ. Geol. 1983, 78, 573–590. [Google Scholar] [CrossRef]
- Inzana, J.; Kusky, T.; Tucker, R. Comparison of TM Band Ratio Images, Supervised Classifications, and Merged TM and Radar Imagery for Structural Geology Interpretations of the Central Madagascar Highlands. In Proceedings of the American Society of Photogrammetry and Remote Sensing, Annual Meeting, Abstracts with Programs, London, UK, 12–14 September 2001; p. 34. [Google Scholar]
- Kusky, T.; Ramadan, T.M. Structural controls on Neoproterozoic mineralization in the South Eastern Desert, Egypt: An integrated field, Landsat TM, and SIR-C/X SAR approach. J. Afr. Earth Sci. 2002, 35, 107–121. [Google Scholar] [CrossRef]
- Volesky, J.C.; Stern, R.J.; Johnson, P.R. Geological control of massive sulfide mineralization in the Neoproterozoic Wadi Bidah shear zone, southwestern Saudi Arabia, inferences from orbital remote sensing and field studies. Precambrian Res. 2003, 123, 235–247. [Google Scholar] [CrossRef]
- Gad, S.; Kusky, T. Lithological mapping in the Eastern Desert of Egypt, the Barramiya area, using Landsat thematic mapper (TM). J. Afr. Earth Sci. 2006, 44, 196–202. [Google Scholar] [CrossRef]
- Boardman, W.; Kruse, F.A. Automated Spectra Analysis: A Geologic Example Using AVIRIS Data, North Grapevine on Geologic Remote Sensing; Environmental Research Institute of Michigan: Ann Arbor, MI, USA, 1994; pp. 407–418. [Google Scholar]
- Joly, A.; Porwal, A.; McCuaig, T.C.; Chudasama, B.; Dentith, M.C.; Aitken, A.R.A. Mineral systems approach applied to GIS-based 2D-prospectivity modelling of geological regions: Insights from Western Australia. Ore Geol. Rev. 2015, 71, 673–702. [Google Scholar] [CrossRef]
- Carranza, E.; Hale, M.; Faassen, C. Selection of coherent deposit-type locations and their application in data-driven mineral prospectivity mapping. Ore Geol. Rev. 2008, 33, 536–558. [Google Scholar] [CrossRef]
- Carranza, E.J.M.; Laborte, A.G. Data-driven predictive mapping of gold prospectivity, Baguio district, Philippines: Application of random forests algorithm. Ore Geol. Rev. 2015, 71, 777–787. [Google Scholar] [CrossRef]
- Ge, W.; Cheng, Q.; Jing, L.; Wang, F.; Zhao, M.; Ding, H. Assessment of the Capability of Sentinel-2 Imagery for Iron-Bearing Minerals Mapping: A Case Study in the Cuprite Area, Nevada. Remote. Sens. 2020, 12, 3028. [Google Scholar] [CrossRef]
- Ramadan, E.; Feng, X.-Z.; Cheng, Z. Satellite remote sensing for urban growth assessment in Shaoxing City, Zhejiang Province. J. Zhejiang Univ. A 2004, 5, 1095–1101. [Google Scholar] [CrossRef] [PubMed]
- Ahmed, A.; Abdelkareem, M.; Asran, A.M.; Mahran, T.M. Geomorphic and lithologic characteristics of Wadi Feiran basin, southern Sinai, Egypt, using remote sensing and field investigations. J. Earth Syst. Sci. 2017, 126, 1–25. [Google Scholar] [CrossRef]
- El-Din, G.K.; Abdelkareem, M. Integration of remote sensing, geochemical and field data in the Qena-Safaga shear zone: Implications for structural evolution of the Eastern Desert, Egypt. J. Afr. Earth Sci. 2018, 141, 179–193. [Google Scholar] [CrossRef]
- Olmo, M.C.; Abarca, F.; Rigol, J.P.; Rigol-Sanchez, J.P. Development of a Decision Support System based on remote sensing and GIS techniques for gold-rich area identification in SE Spain. Int. J. Remote Sens. 2002, 23, 4801–4814. [Google Scholar] [CrossRef]
- Brandmeier, M. Remote sensing of Carhuarazo volcanic complex using ASTER imagery in Southern Peru to detect alteration zones and volcanic structures–A combined approach of image processing in ENVI and ArcGIS/ArcScene. Geocarto Int. 2010, 25, 629–648. [Google Scholar] [CrossRef]
- Bolouki, S.M.; Ramazi, H.R.; Maghsoudi, A.; Pour, A.; Sohrabi, G. A Remote Sensing-Based Application of Bayesian Networks for Epithermal Gold Potential Mapping in Ahar-Arasbaran Area, NW Iran. Remote Sens. 2020, 12, 105. [Google Scholar] [CrossRef]
- Cudahy, T.J.; Jones, M.; Thomas, M.; Laukamp, C.; Caccetta, M.; Hewson, R.D.; Rodger, A.D.; Verrall, M. Next Generation Mineral Mapping: Queensland Airborne HyMap and Satellite ASTER Surveys, 2006–2008; CSIRO Exploration and Mining: Canberra, Australia, 2008. [Google Scholar]
- Zeghouane, H.; Allek, K.; Kesraoui, M. GIS-based weights of evidence modeling applied to mineral prospectivity mapping of Sn-W and rare metals in Laouni area, Central Hoggar, Algeria. Arab. J. Geosci. 2016, 9, 373. [Google Scholar] [CrossRef]
- Gahlan, H.; Ghrefat, H. Detection of Gossan Zones in Arid Regions Using Landsat 8 OLI Data: Implication for Mineral Exploration in the Eastern Arabian Shield, Saudi Arabia. Nat. Resour. Res. 2018, 27, 109–124. [Google Scholar] [CrossRef]
- Sekandari, M.; Masoumi, I.; Pour, A.B.; Muslim, A.M.; Rahmani, O.; Hashim, M.; Zoheir, B.; Pradhan, B.; Misra, A.; Aminpour, S.M. Application of Landsat-8, Sentinel-2, ASTER andWorldView-3 Spectral Imagery for Exploration of Carbonate-Hosted Pb-Zn Deposits in the Central Iranian Terrane (CIT). Remote Sens. 2020, 12, 1239. [Google Scholar] [CrossRef]


| Eigenvector | Band 4 | Band 5 | Band 6 | Eigenvalue |
|---|---|---|---|---|
| PC1 | −0.5646 | −0.57235 | −0.59468 | 99.923 |
| PC2 | −0.7798 | 0.605985 | 0.157136 | 0.057 |
| PC3 | −0.27043 | −0.55245 | 0.788457 | 0.021 |
| Sample Name | Compound Name | Chemical Formula | Vol % |
|---|---|---|---|
| A1 | Quartz | SiO2 | 25.8 |
| Gypsum | CaSO4·2H2O | 61.9 | |
| Illite | K0.5(Al,Fe,Mg)3Si,Al)4O10(OH)2 | 9.7 | |
| Anhydrite | CaSO4 | 2.6 | |
| A2 | Quartz | SiO2 | 5.7 |
| Gypsum | CaSO4·2H2O | 90.2 | |
| Kaolinite | Al2Si2O5(OH)4/Al2O3·2SiO2·2H2O | 3.0 | |
| Anhydrite | CaSO4 | 7.1 | |
| A3 | Quartz | SiO2 | 43.1 |
| Kaolinite | Al2Si2O5(OH)4/Al2O3·2SiO2·2H2O | 18.9 | |
| Illite | KAl2Si3AlO10(OH)2 | 31.5 | |
| Anhydrite | CaSO4 | 6.6 | |
| A4 | Quartz | SiO2 | 62.50 |
| Gypsum | CaSO4·2H2O | 12.30 | |
| Illite | KAl2Si3AlO10(OH)2 | 18.8 | |
| Hematite | Fe2O3 | 6.4 | |
| A5 | Quartz | SiO2 | 41.5 |
| Gypsum | CaSO4·2H2O | 24.9 | |
| Illite | KAl2Si3AlO10(OH)2 | 3.1 | |
| Kaolinite | Al2Si2O5(OH)4/Al2O3·2SiO2·2H2O | 17.1 | |
| Hematite | Fe2O3 | 2.0 | |
| Clinochlore | Mg5Fe0·2Al2Si3O10(OH)8 | 11.3 | |
| A6 | Quartz | SiO2 | 62.8 |
| Hematite | Fe2O3 | 3.1 | |
| Illite | KAl2Si3AlO10(OH)2 | 24.5 | |
| Anhydrite | CaSO4 | 9.6 | |
| A7 | Quartz | SiO2 | 47.2 |
| Gypsum | CaSO4·2H2O | 21.2 | |
| Illite | KAl2Si3AlO10(OH)2 | 10.6 | |
| Halite | NaCl | 3.2 | |
| Bassanite | CaSO4·0.5H2O | 17.7 | |
| A8 | Quartz | SiO2 | 20.0 |
| Gypsum | CaSO4·2H2O | 72.5 | |
| Illite | KAl2Si3AlO10(OH)2 | 7.6 | |
| A9 | Quartz | SiO2 | 70.8 |
| Gypsum | CaSO4·2H2O | 21.2 | |
| Calcite | CaCO3 | 8.0 | |
| A10 | Quartz | SiO2 | 38.3 |
| Gypsum | CaSO4·2H2O | 35.8 | |
| Illite | KAl2Si3AlO10(OH)2 | 20.1 | |
| Anhydrite | CaSO4 | 5.9 | |
| A11 | Quartz | SiO2 | 48.4 |
| Gypsum | CaSO4·2H2O | 18.1 | |
| Illite | KAl2Si3AlO10(OH)2 | 15.9 | |
| Anhydrite | CaSO4 | 4.9 | |
| Hematite | Fe2O3 | 4.1 | |
| Kaolinite | Al2Si2O5(OH)4/Al2O3·2SiO2·2H2O | 8.6 | |
| A12 | Quartz | SiO2 | 57.3 |
| Albite | NaAlSi3O8 | 10.2 | |
| Illite | KAl2Si3AlO10(OH)2 | 6.4 | |
| Microcline | KAlSi3O8 | 13.6 | |
| Calcite | CaCO3 | 12.4 |
| Sample Name | Compound Name | Chemical Formula | vol % |
|---|---|---|---|
| B1 | Quartz | SiO2 | 37.5 |
| Gypsum | CaSO4.2H2O | 28.1 | |
| Kaolinite | Al2Si2O5(OH)4/Al2O3.2SiO2·2H2O | 28.1 | |
| Illite | KAl2Si3AlO10(OH)2 | 3.4 | |
| Bassanite | CaSO4·0.5H2O | 2.8 | |
| B2 | Quartz | SiO2 | 11.4 |
| Gypsum | CaSO4·2H2O | 73.0 | |
| Albite | NaAlSi3O8 | 8.7 | |
| Calcite | CaCO3 | 7.0 | |
| B3 | Quartz | SiO2 | 65.3 |
| Kaolinite | Al2Si2O5(OH)4/Al2O3·2SiO2·2H2O | 9.8 | |
| Calcite | CaCO3 | 8.2 | |
| Hematite | Fe2O3 | 0.8 | |
| Microcline | KAlSi3O8 | 15.9 | |
| B4 | Quartz | SiO2 | 4.3 |
| Gypsum | CaSO4·2H2O | 91.8 | |
| Kaolinite | Al2Si2O5(OH)4/Al2O3·2SiO2·2H2O | 3.8 | |
| B5 | Quartz | SiO2 | 29.9 |
| Albite | NaAlSi3O8 | 70.1 | |
| B6 | Quartz | SiO2 | 3.1 |
| Gypsum | CaSO4·2H2O | 77.0 | |
| Kaolinite | Al2Si2O5(OH)4/Al2O3·2SiO2·2H2O | 19.2 | |
| Anatase | TiO2 | 0.6 | |
| B7 | Quartz | SiO2 | 75.3 |
| Gypsum | CaSO4·2H2O | 4.5 | |
| Illite | KAl2Si3AlO10(OH)2 | 12.8 | |
| Kaolinite | Al2Si2O5(OH)4/Al2O3·2SiO2·2H2O | 5.9 | |
| Anhydrite | CaSO4 | 1.5 | |
| B8 | Quartz | SiO2 | 47.3 |
| Gypsum | CaSO4·2H2O | 21.3 | |
| Kaolinite | Al2Si2O5(OH)4/Al2O3·2SiO2·2H2O | 2 | |
| Calcite | CaCO3 | 3.2 | |
| Albite | NaAlSi3O8 | 4.6 | |
| Minamite | (Na,Ca)1-xAl3(SO4)2(OH)6 | 2.4 | |
| Halite | NaCl | 0.8 | |
| B9 | Quartz | SiO2 | 31.3 |
| Gypsum | CaSO4·2H2O | 49.2 | |
| Kaolinite | Al2Si2O5(OH)4/Al2O3·2SiO2·2H2O | 6.4 | |
| Illite | KAl2Si3AlO10(OH)2 | 4.1 | |
| Albite | NaAlSi3O8 | 8.9 |
Publisher’s Note: MDPI stays neutral with regard to jurisdictional claims in published maps and institutional affiliations. |
© 2022 by the authors. Licensee MDPI, Basel, Switzerland. This article is an open access article distributed under the terms and conditions of the Creative Commons Attribution (CC BY) license (https://creativecommons.org/licenses/by/4.0/).
Share and Cite
Alarifi, S.S.; Abdelkareem, M.; Abdalla, F.; Abdelsadek, I.S.; Gahlan, H.; Al-Saleh, A.M.; Alotaibi, M. Fusion of Multispectral Remote-Sensing Data through GIS-Based Overlay Method for Revealing Potential Areas of Hydrothermal Mineral Resources. Minerals 2022, 12, 1577. https://doi.org/10.3390/min12121577
Alarifi SS, Abdelkareem M, Abdalla F, Abdelsadek IS, Gahlan H, Al-Saleh AM, Alotaibi M. Fusion of Multispectral Remote-Sensing Data through GIS-Based Overlay Method for Revealing Potential Areas of Hydrothermal Mineral Resources. Minerals. 2022; 12(12):1577. https://doi.org/10.3390/min12121577
Chicago/Turabian StyleAlarifi, Saad S., Mohamed Abdelkareem, Fathy Abdalla, Ismail S. Abdelsadek, Hisham Gahlan, Ahmad. M. Al-Saleh, and Mislat Alotaibi. 2022. "Fusion of Multispectral Remote-Sensing Data through GIS-Based Overlay Method for Revealing Potential Areas of Hydrothermal Mineral Resources" Minerals 12, no. 12: 1577. https://doi.org/10.3390/min12121577
APA StyleAlarifi, S. S., Abdelkareem, M., Abdalla, F., Abdelsadek, I. S., Gahlan, H., Al-Saleh, A. M., & Alotaibi, M. (2022). Fusion of Multispectral Remote-Sensing Data through GIS-Based Overlay Method for Revealing Potential Areas of Hydrothermal Mineral Resources. Minerals, 12(12), 1577. https://doi.org/10.3390/min12121577