Article

Study on Explicit–Implicit Simulation and In-Situ Measurement of Floor Failure Law in Extra-Thick Coal Seams

1
CCTEG Xi’an Research Institute (Group) Co., Ltd., Xi’an 710077, China
2
State Key Laboratory for Geomechanics and Deep Underground Engineering, China University of Mining and Technology, Xuzhou 221116, China
3
Shanxi Ningwu Yushupo Coal Industry Co., Ltd., Ningwu, Xinzhou 036700, China
4
Key Laboratory of In-Situ Property Improving Mining of Ministry of Education, Taiyuan University of Technology, Taiyuan 030024, China
*
Author to whom correspondence should be addressed.
Minerals 2022, 12(12), 1511; https://doi.org/10.3390/min12121511
Submission received: 24 October 2022 / Revised: 20 November 2022 / Accepted: 23 November 2022 / Published: 26 November 2022
(This article belongs to the Special Issue Green Mining of Coal Mine in China)

Abstract

:
A reliable numerical simulation method and large-scale in-situ test method for super-thick coal seams are very important to determine the failure range of mining floors, which is often the basis to protect Ordovician limestone water, an important drinking water source for people in North China. This paper takes Yushupo Coal Mine as an example; the explicit–implicit coupling simulation method and the corresponding double scalar elastic–plastic constitutive model were established to predict the failure depth of the floor numerically, and verified by the full section borehole stress–strain in-situ testing method. The results show that the explicit–implicit coupling numerical program and the double scalar elastoplastic constitutive model are suitable for predicting the floor failure depth under the condition of extra-thick coal seams. In this condition, the overburden moves violently, resulting in a loading–unloading–reloading process with large stress variation amplitude in the mining floor, which leads to serious rock failure compared with that of medium-thick coal seam conditions. In Yushupo 5105 working face, the floor failure starts to develop from 9.3–24.2 m ahead of the coal wall of working face, and the failure depth no longer increases after 35 m behind the coal wall, with the maximum failure depth of 28 m; the envelope line of the floor failure depth presents an inverted saddle distribution. The above research results lay a foundation for further protecting the Ordovician limestone water, and realizing green coal mining.

1. Introduction

The annual coal supply in Shanxi accounts for about 25% of China’s [1], while the per capita water resource in Shanxi is only 380 m3, far below the internationally recognized limit of serious water shortage of 1000 m3 per capita [2]. Large scale coal mining has seriously damaged precious groundwater resources of Shanxi-Ordovician limestone water [3]. Floor grouting is the main technology for green coal mining (i.e., realizing safe mining and protecting the water source of Ordovician limestone at the same time). The key to its effectiveness is that the reasonable grouting layer is based on an accurate prediction of the failure depth of the mining floor.
At present, the research on the failure depth of the mining floor mainly includes numerical simulation and in-situ experiment research. As far as the former is concerned, Zhu et al. [4] obtained an analytical solution to the stress in the floor using an elasticity model, and verified the results using the “strain method”. Zhang et al. [5] used a similar simulation test method to obtain the fracture thickness of the mine floor. Zhu and Wei [6], using the ideal elastic-brittle constitutive model, obtained the damaged thickness of the coal seam floor by numerical simulation, based on the premise that damage will occur when the stress in the rock exceeds the strength limit. In addition, Liu et al. [7] and Song and Liang [8] simplified the mining floor as an infinite half plane, applied vertical stress at the boundary of the goaf, and calculated the stress distribution using elastic mechanics theory. Chen et al. [9] and Shi et al. [10] used elastoplastic mechanics theory to calculate the failure depth of the mining floor under different coal mine conditions through FLAC software. Ma et al. [11] and Li et al. [12] used elastic damage theory to study the development depth of floor fractures in the mining process of the working face based on the Mohr Coulomb criterion.
The maximum failure depth of the floor can be calculated quickly through simulation calculation, but the underground rock structure is complex, and the disturbance to the surrounding rock during coal mining is different, leading to great uncertainty in the research of the theoretical level. In order to obtain the accurate results, further in-situ tests on the failure range of the full-section floor should be carried out [13]. The in-situ test methods for the failure depth of the floor mainly include the drilling water injection method [14,15], the microseismic monitoring method [16], and the drilling stress–strain method [17]. The drilling water injection method requires the cooperation of drilling rigs during the test process, which is difficult to construct, and the borehole is easy to collapse. Due to the influence of the monitoring principle, the microseismic monitoring method has high requirements for the underground environment and low testing accuracy, which is not applicable to the monitoring of the destruction depth of all the mine floor. The borehole stress–strain method technology is relatively mature, and compared with other testing methods, it has obvious advantages, including better reflecting the actual change of the stratum, being free from human misjudgment and interference, obtaining more authentic and reliable data, and shorter monitoring time.
However, most of the in-situ tests mentioned above only tested 3–9 measuring points, so it is difficult to obtain the failure distribution of the whole section of the mining floor. More importantly, the above models were based on the same assumption; that is, the mining roof and floor were assumed to be continuous media, and the rock constitutive relations under monotonic loading were adopted. In fact, underground coal mining will inevitably lead to the floor pressure in front of the working face, the pressure relief in the goaf, and then the compression stress with the overburden fracture and fall. The stress variation amplitude of the floor rock will become larger with the increase of coal seam thickness. Under the condition of this huge thick coal seam, it is not only necessary to deeply study the rock mechanical characteristics and constitutive theory under the condition of “large stress variation amplitude”, but is also needed to deeply study the numerical simulation method applicable to the floor failure caused by overburden movement. Taking the 5105 working face of the Yushupo Coal Mine as the engineering background, this paper established the loading–unloading constitutive model and the corresponding explicit–implicit coupling numerical simulation method to predict floor failure depth, which is verified by the stress–strain in-situ tests. It provides technical support for realizing high efficiency and green mining of huge thick coal seams in water resource poor areas.

2. Numerical Simulation Method

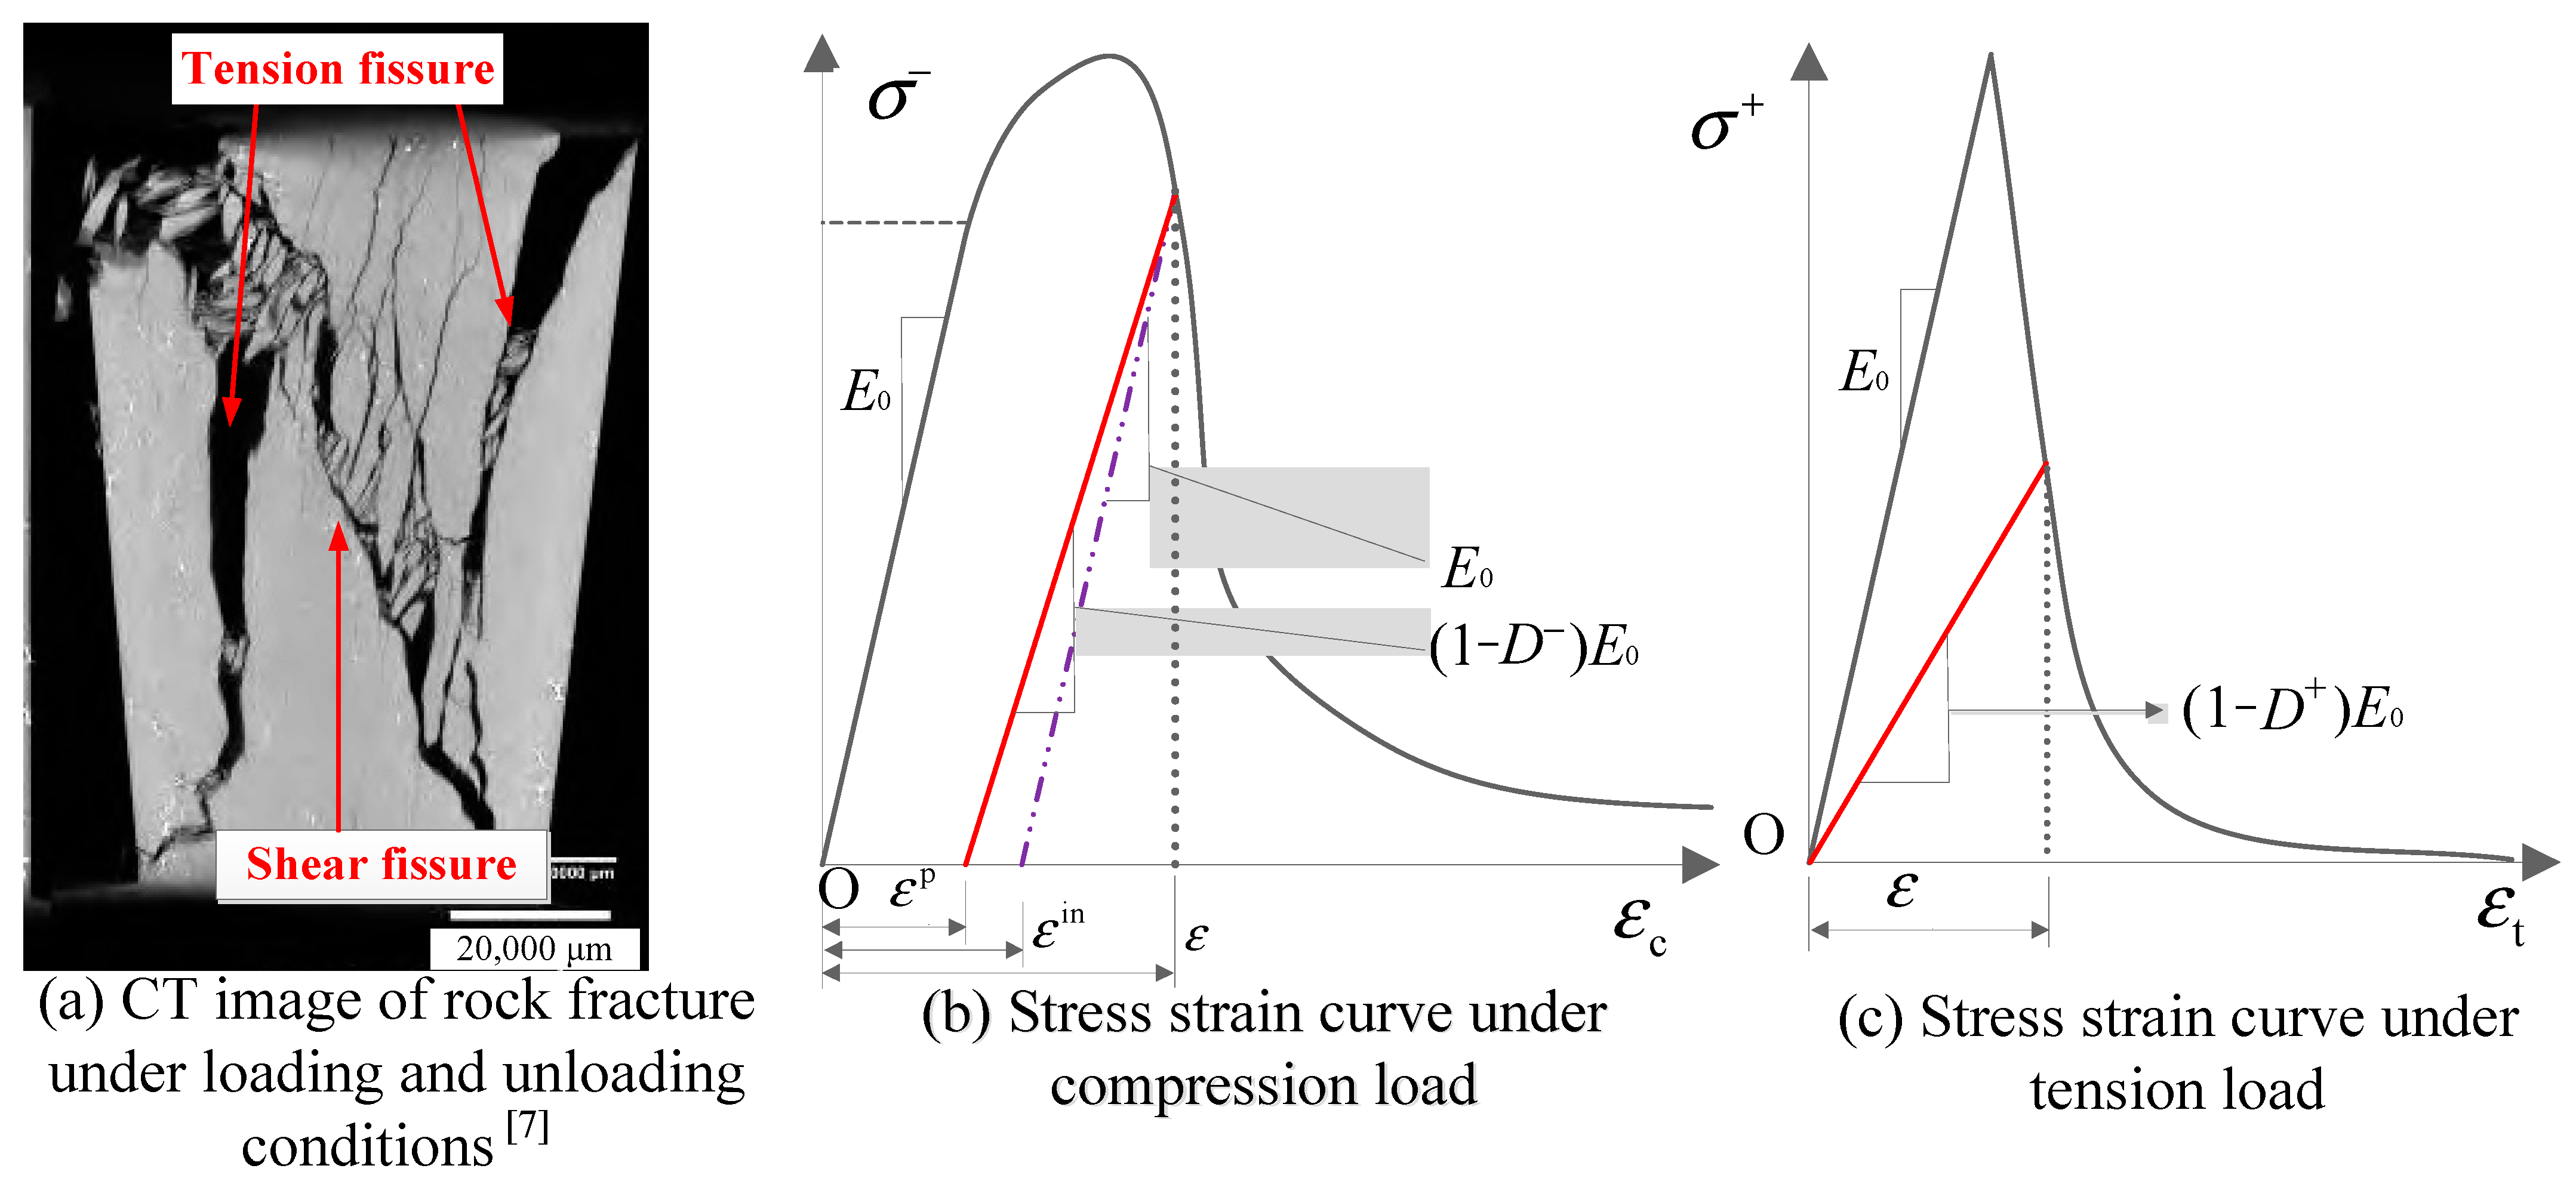
2.1. Plastic Damage Constitutive Relation under Cyclic Loading and Unloading

In the loading and unloading process of high stress variation amplitude, the coal seam floor is more prone to plastic damage failure than monotonic loading [18]. Therefore, for the problem of mining floor failure depth under the condition of extra-thick coal seams, it is necessary to establish a double scalar elasto-plastic damage constitutive relationship under loading and unloading conditions to replace the classical monotonic loading constitutive model.
In the process of loading, the rock has experienced elastic deformation and plastic damage. The constitutive equation in the elastic deformation stage conforms to the generalized Hooke's law [19]. In the plastic damage stage, the nonlinear deformation of the rock is not only caused by the propagation of micro defects (i.e., damage), but also related to the plastic slip of cement [20]. In addition, considering that tension and shear are the two basic failure modes of rock failure (Figure 1a), it is necessary to establish a double scalar elastoplastic damage constitutive relationship reflecting tension and shear failure.
Use the following methods to separate the tensile and shear stress from the stress vector. First, tensile stress is defined as positive, and compressive stress is defined as negative, respectively, and introduces a function:
σ = ( σ + | σ | ) / 2 = { σ , σ > 0 0 , σ 0
According to the spectral decomposition of stress tensor [21], the stress tensor σ is divided into tension ( σ + ) and compression ( σ ) stress vectors.
σ = σ + + σ
Here, the tension stress vector and compression stress vector are defined as:
σ + = i = 1 3 σ i n i   n i ,   σ = σ σ +
where σi and ni (i = 1, 2, 3) denote the magnitude of three principal stresses and the vector of principal direction, respectively.
The tension and compression damage variable are marked as D+ and D, respectively. According to a hypothesis proposed by Rubin [22], elastic and plastic Helmholtz free energies are not coupled under isothermal and adaptive conditions; the Helmholtz free energy can be decomposed into elastic parts He and plastic parts Hp:
H ( ε e , D + , D , ε eq p , + , ε eq p , ) = H e ( ε e , D + , D ) + H p ( D + , D , ε eq p , + , ε eq p , )
where, ε e is the elastic strain vector; ε eq p , + , ε eq p , are equivalent tensile and shear plastic strain, respectively. D+ and D are tension and compression damage variables, respectively. The experimental data show that the ε eq p , + is not significant, so it can be assumed ε eq p , + = 0 . Furthermore, He and Hp can be decomposed into He+ and He−, Hp+ and Hp−, and the expression is
{ H e ( ε e , D + , D ) = H e + ( ε e , D + ) + H e ( ε e , D ) H p ( D + , D , ε eq p , + , ε eq p , ) = H p + ( D + , ε eq p , + ) + H p ( D , ε eq p , )
Specifically,
{ H e ± = ( 1 D ± ) σ ± ε e / 2 H p ± = ( 1 D ± ) 0 ε p σ ± d ε p
Combining the Clausius–Duhem inequality [23], and considering the randomness of ε e , Equation (4) is simplified as follows:
σ = H e ( ε e , D + , D ) ε e
Introducing Equations (5) and (6) into Equation (7), the double scalar elastoplastic damage constitutive equations are obtained, and its expression is
σ = ( I D ) : E 0 : ( ε ε p )
where σ is the stress vector; E0 is the elastic stiffness matrix; ε and ε p are total and plastic strain vector, respectively; I is the unit matrix; the fourth-order tensor D is
D = D + N + + D ( I N + )
and,
N + = i = 1 3 h ( σ i ) n i   n i   n i   n i
where h is the Heaviside function, the expression is
h ( σ ) = { 1 , σ > 0 0 , σ 0
Under the condition of pure compressive stress, Equation (8) can be visualized as Figure 1b, and the expression is:
ε p , = ε in , D σ / [ ( 1 D ) E 0 ]
where ε p , is the plastic strain caused by compressive stress; ε in , is the inelastic strain, and the expression is:
ε in , = ε σ / E 0
Under the condition of pure tensile stress, Equation (8) can be visualized as Figure 1c, and the expression is:
σ + = ( 1 D + ) E 0 ε +
In order to obtain the unknown parameter of Equation (8), that is, the nodes displacement, it is necessary to study the evolution of ε p by the plastic mechanics theory, including loading function (Equation (15)) and plastic potential function (Equation (16)).
F = 1 1 α ( q 3 α p + β ( ε p ) σ i max γ σ i max ) σ eq ( ε eq p , ) = 0
where, α = ( σ B / σ U 1 ) / ( 2 σ B / σ U 1 ) , β = σ eq ( ε eq p , ) / σ eq + ( D + ) ( 1 α ) ( 1 + α ) , γ = 3 ( 1 K c ) / ( 2 K c 1 ) , p = trace ( σ ) / 3 , q = 2 ( S : S ) / 3 , and S = σ p I .
Here, σ i max (I = 1, 2, 3) is the maximum principal stress, σ B / σ U is the ratio of yield stress under triaxial compression to yield stress under uniaxial compression, and σ eq + and σ eq is the equivalent tension and compression stress, respectively; when Kc = 0.667, the shape of Equation (15) in the π plane is close to the hexagon corresponding to the Mohr–Coulomb yield criterion.
The expression of plastic potential function is
G = ( δ σ U tan ψ ) 2 + q 2 p tan ψ
where δ is a parameter controlling the curvature of q p curve in the meridional plane in the tensile section, which can be generally taken as 0.1; σU is the tensile strength of the coal matrix; and ψ is the dilatancy angle.
Based on Equations (15) and (16), and combined with the theory of plastic mechanics and the corresponding numerical calculation method, the ε p can be obtained.

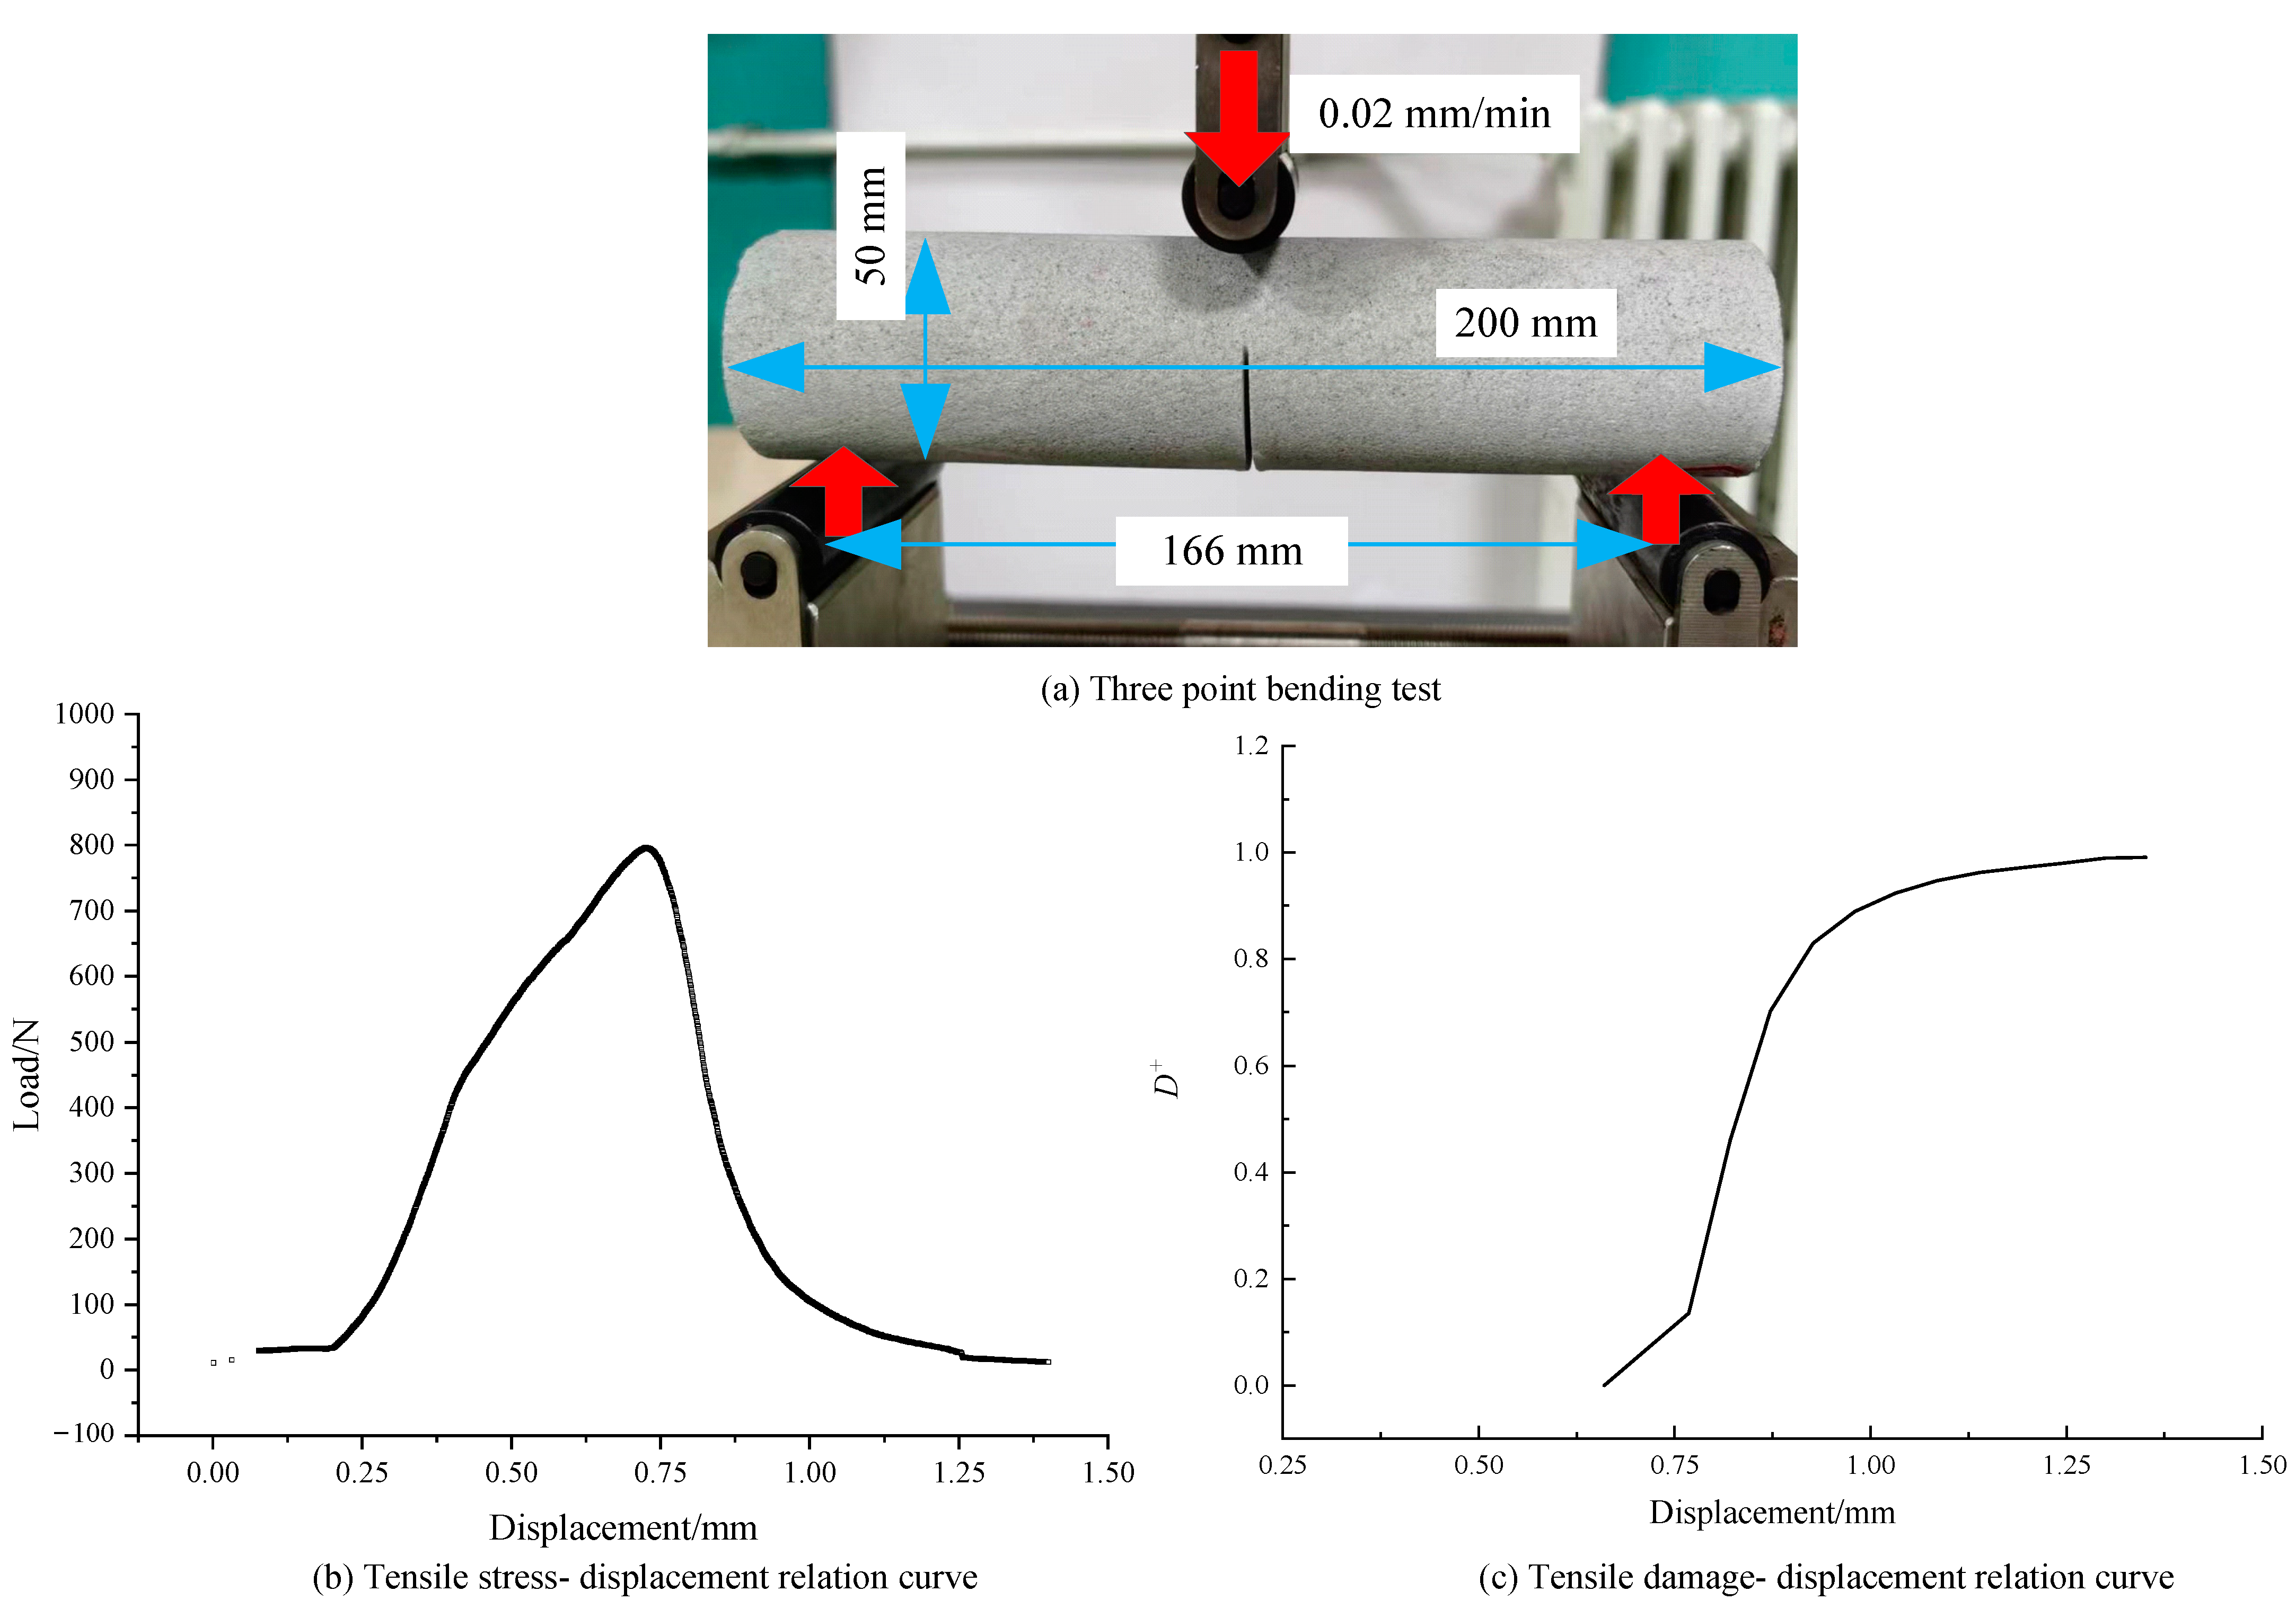
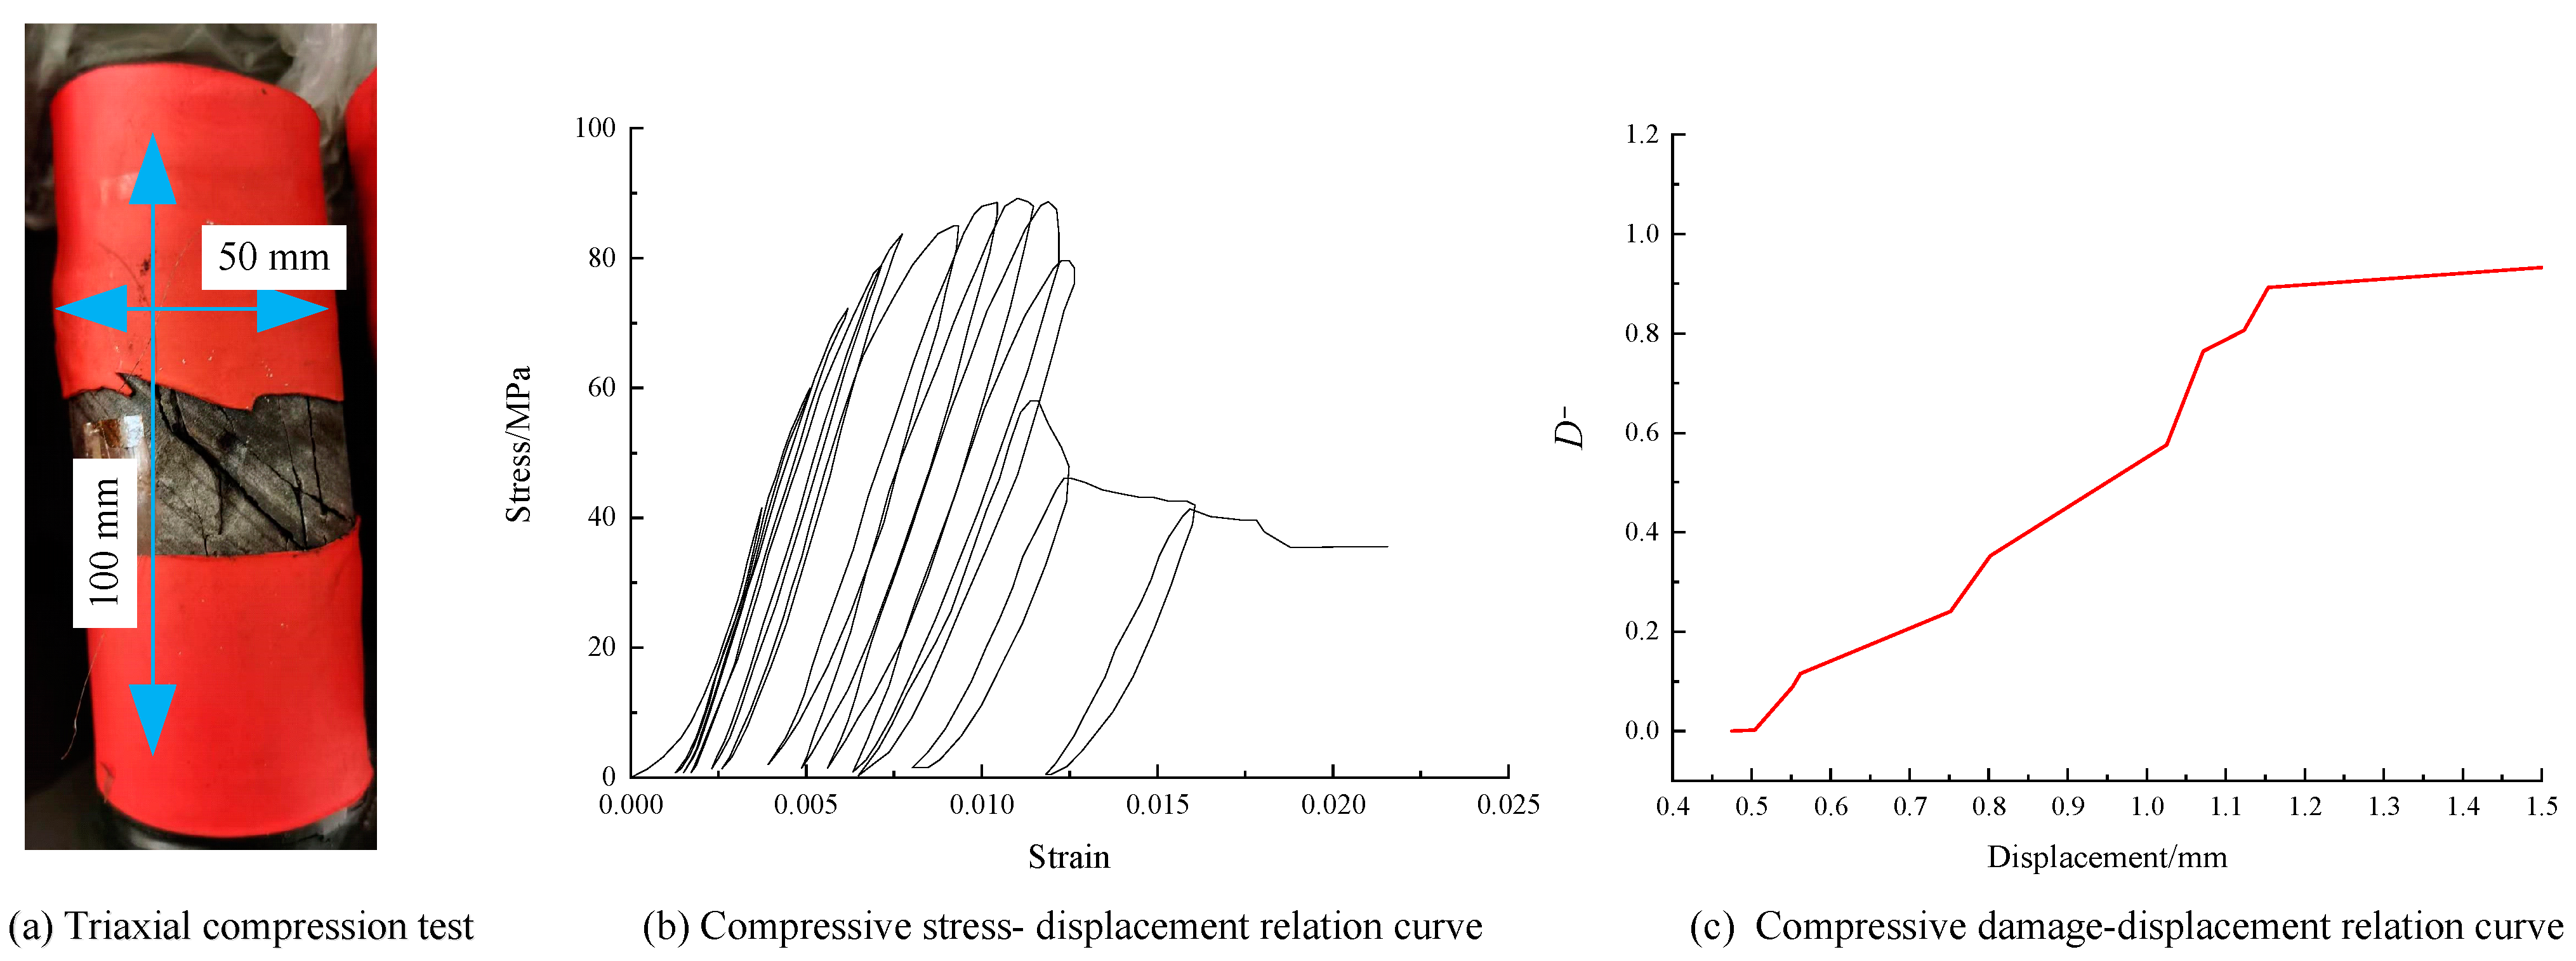
2.2. Parameter Identification

The tension load-displacement curve was obtained through three point bending experiments (Figure 2a), and then the tension damage-displacement relationship curve was obtained through Equation (12), as shown in Figure 2c. The numerical calculation results under tension load are shown in Figure 3. In the compression experiment, the confining pressure was set to 6 MPa according to the ground stress. The compressive stress–strain curve was obtained by a cyclic loading and unloading compression test. The plastic strain was obtained directly from the unloading curve. On this basis, the compression damage variable-displacement relationship curve (Figure 4c) was obtained by Equation (13). Other mechanical parameters were obtained from the load-displacement curve, as shown in Table 1. The specific process of the cyclic loading and unloading compression test was as follows: simultaneously applied lateral pressure and axial pressure up to 6 MPa at the loading rate of 0.05 MPa/s, and then applied the cyclic loading and unloading process. In the elastic deformation stage, the load gradient of 15 kN was a cycle, the loading rate was 0.5 kN/s, and the axial unloading rate was controlled at 2.0 kN/s. When the load reached about 75% of the peak strength, the unloading was controlled by circumferential deformation. The circumferential displacement gradient of 0.2 mm was a cycle. At this time, the axial loading rate was 0.001 mm/s and the unloading rate was 2.0 kN/s. The experimental results obtained are shown in Figure 4b.

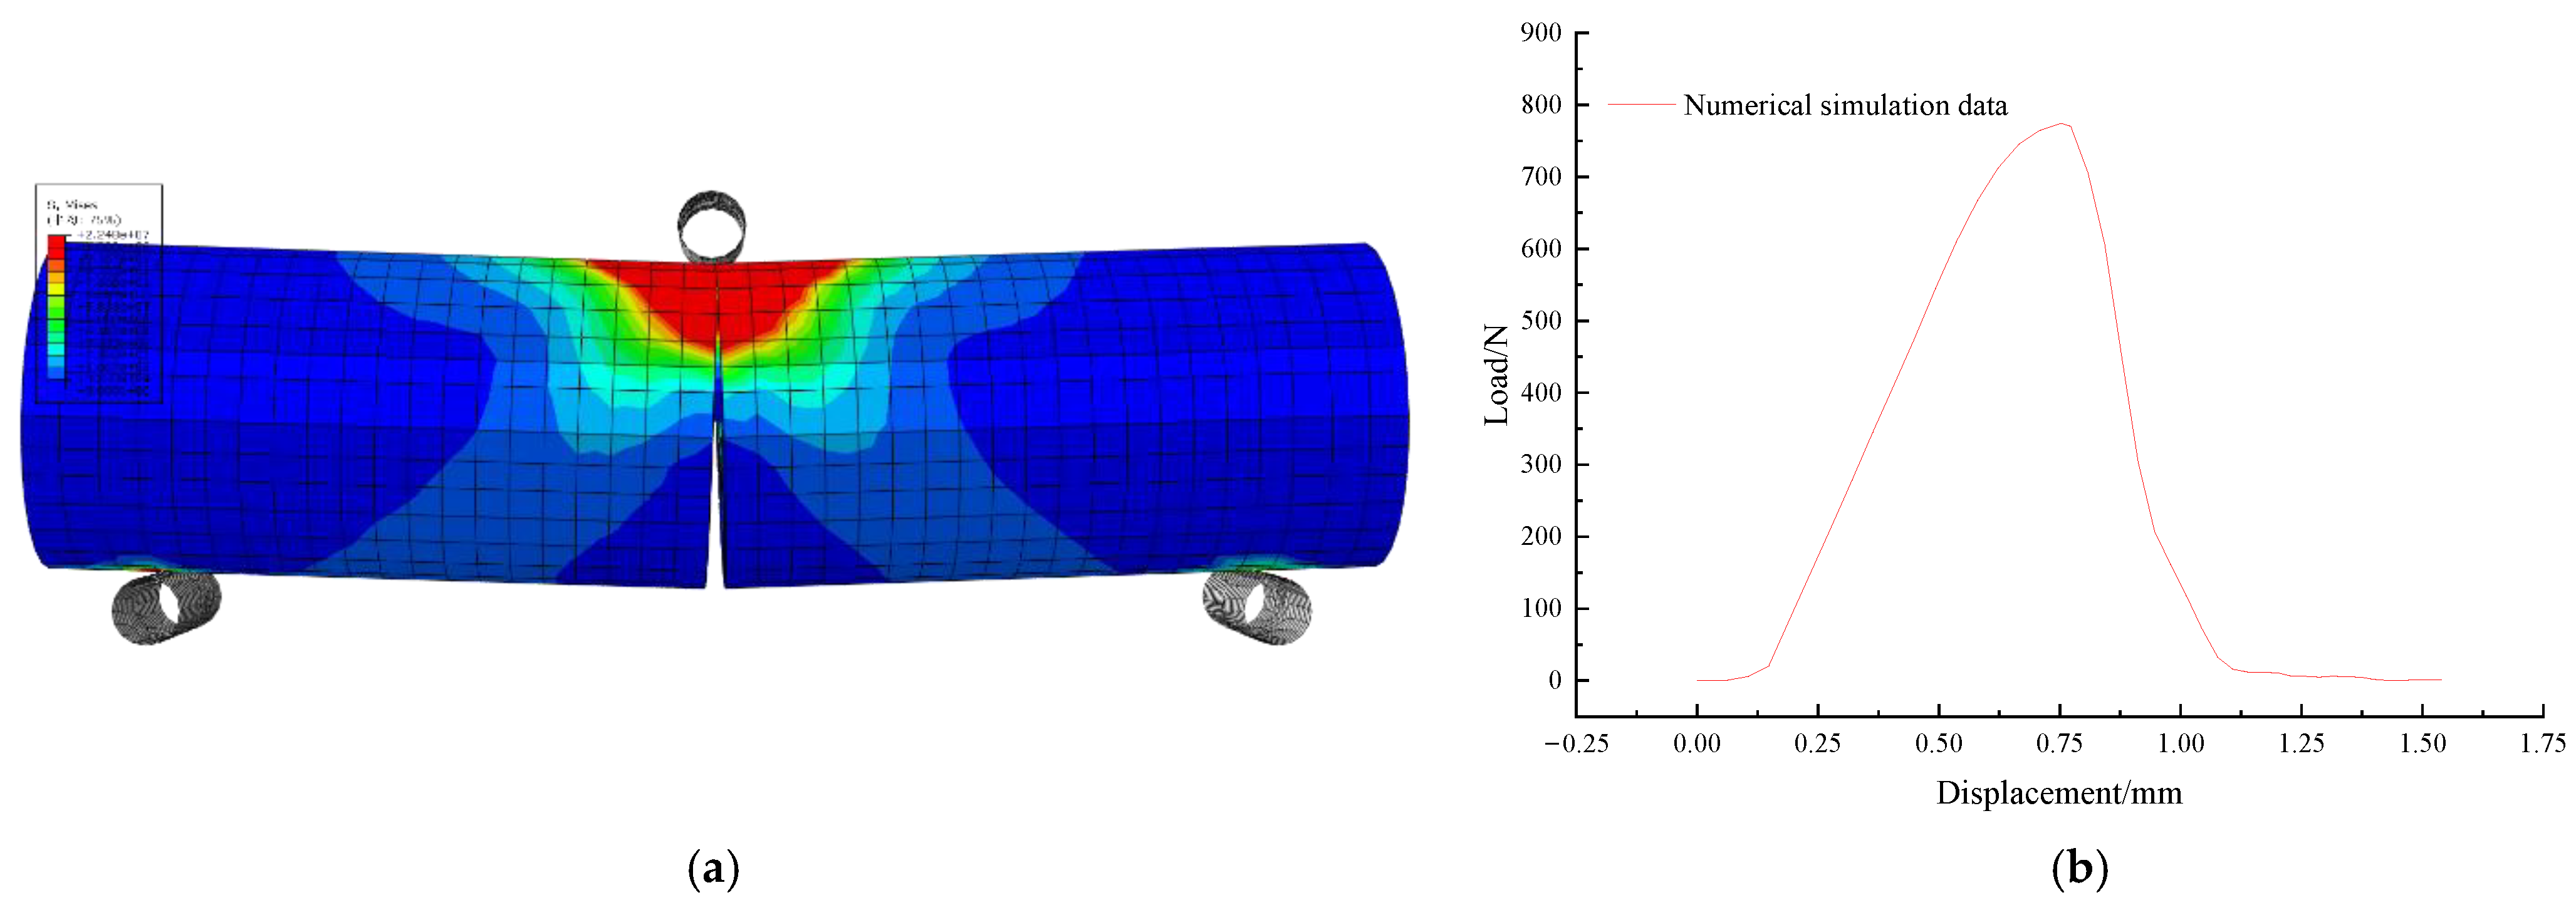
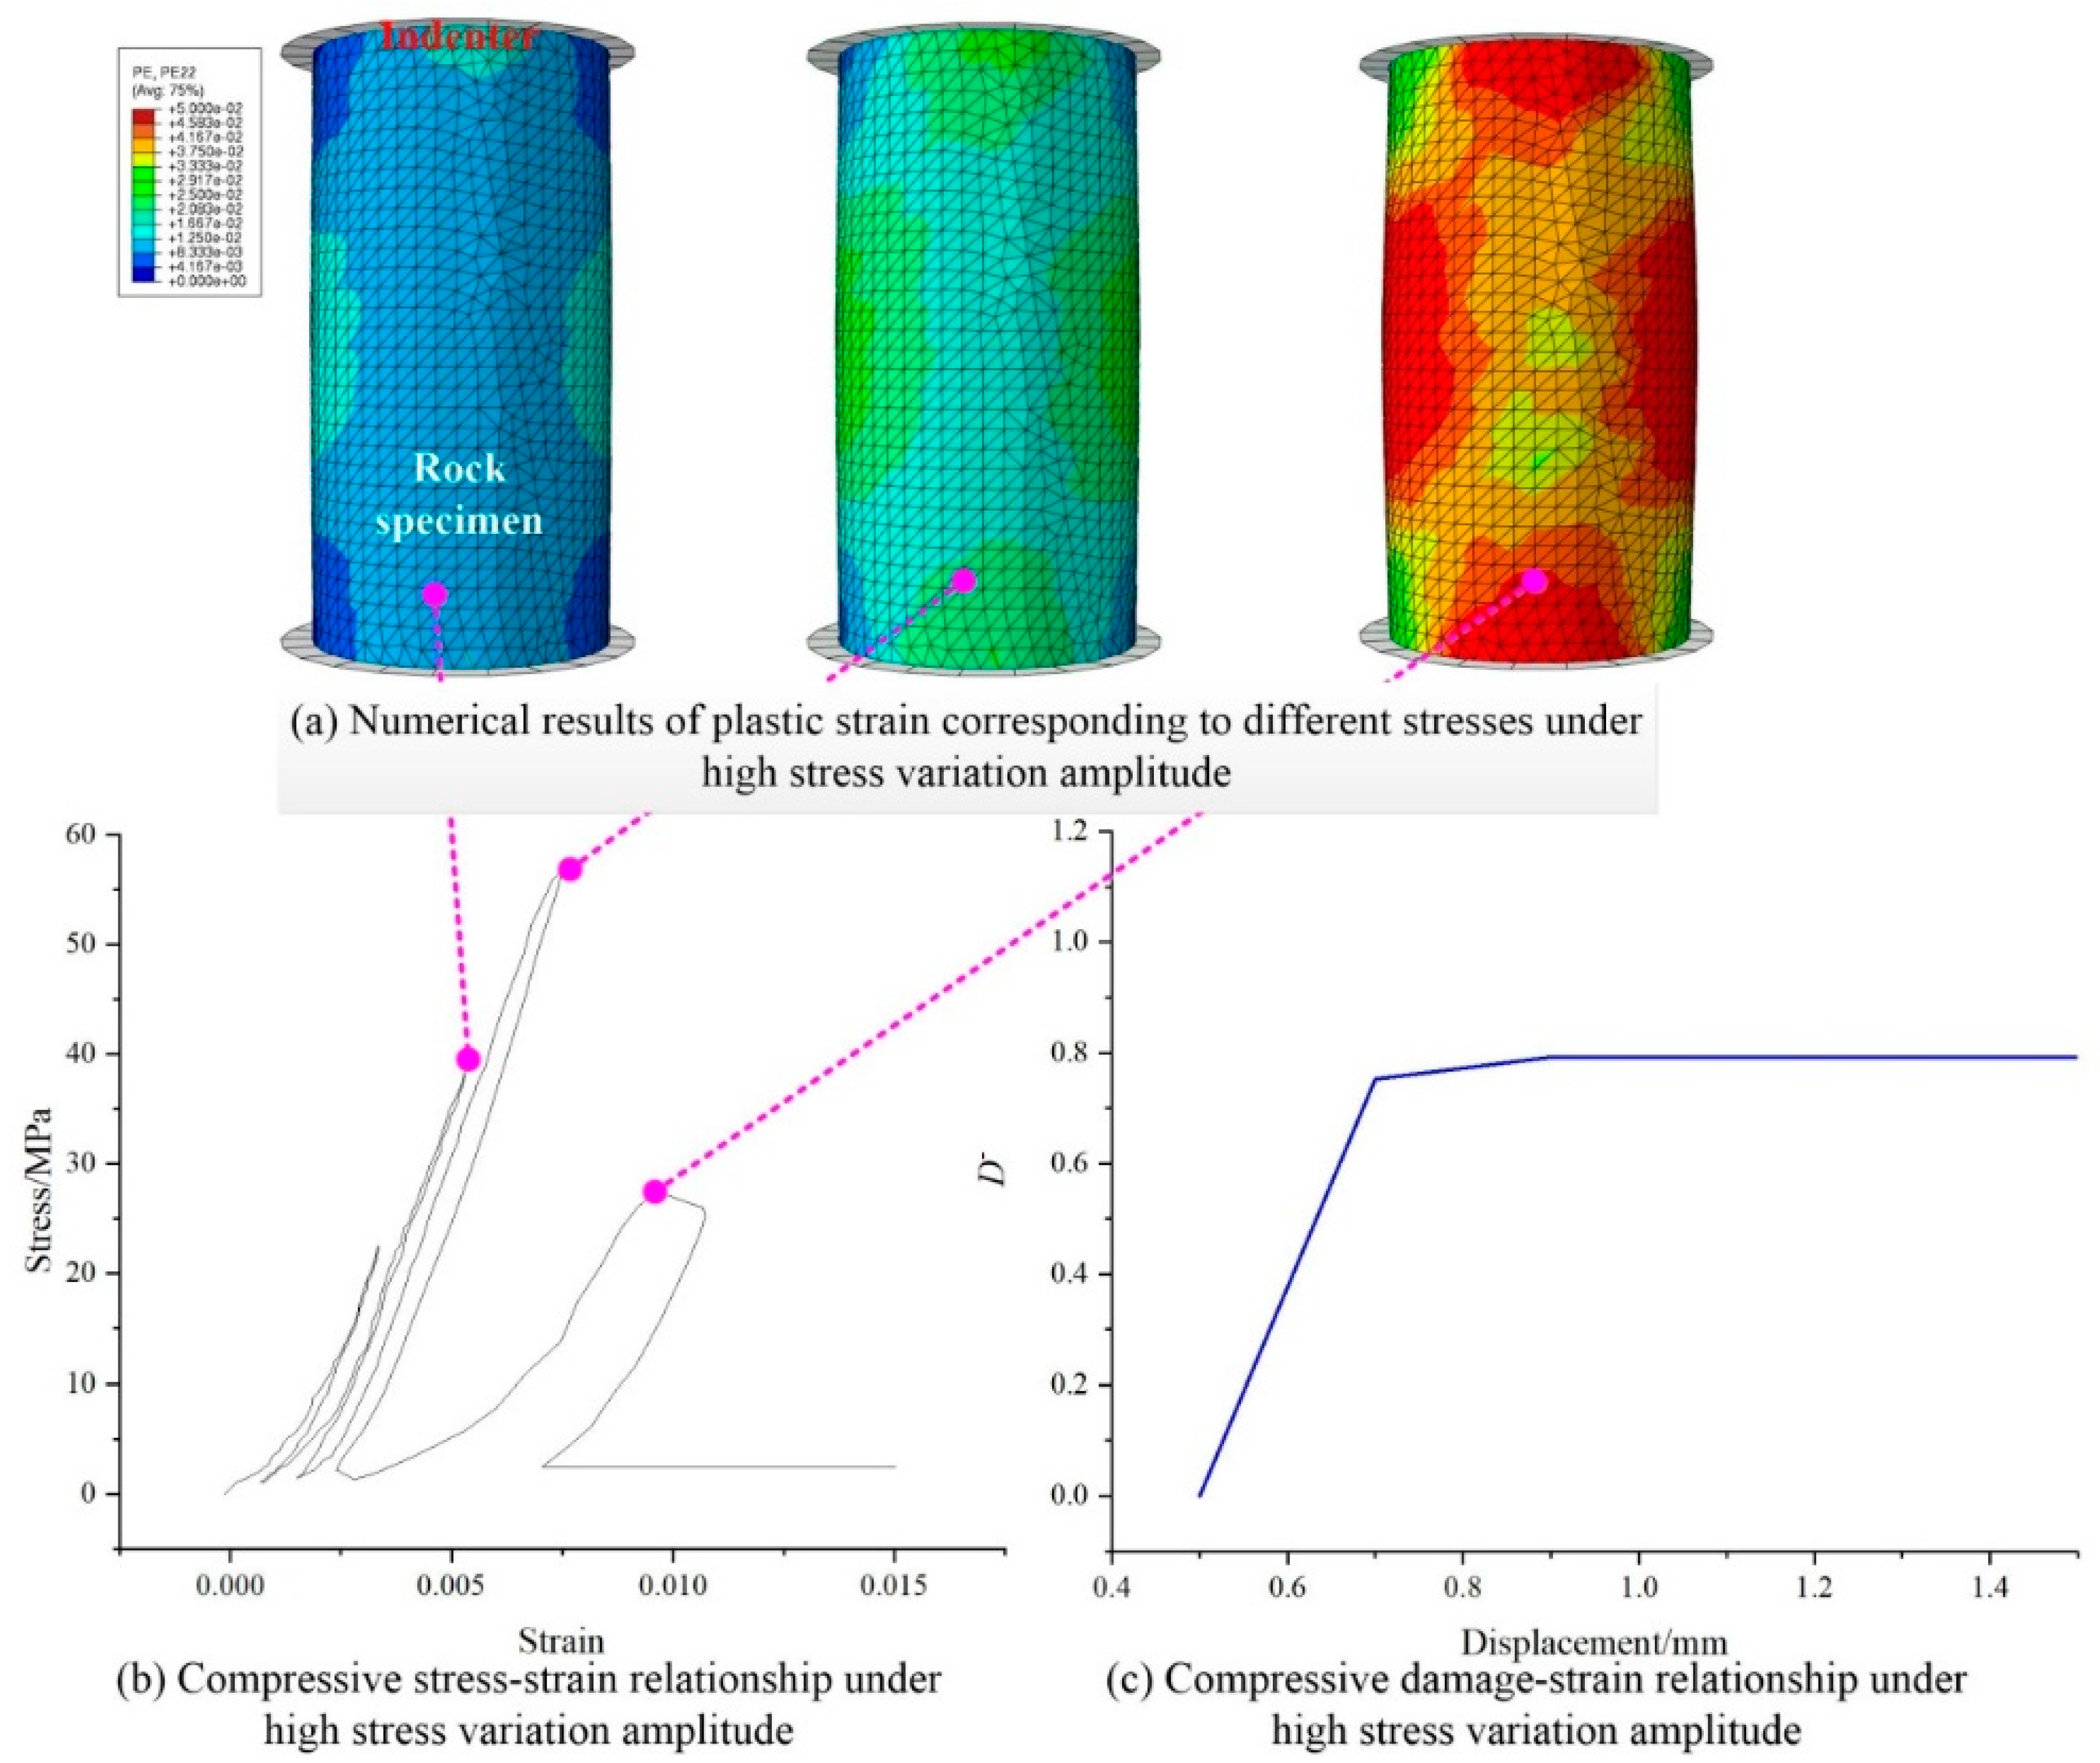
2.3. Verification of Constitutive Equations under High Stress Variation Amplitude

The constitutive equations under tension load have been verified by Li et al. [24]. The constitutive equation under compression can be verified by cyclic loading and unloading tests under the condition of high stress variation amplitude. The loading and unloading test process under the high stress variation amplitude is consistent with Figure 4b, but the load gradient in the elastic deformation stage is increased from 15 kN to 30 kN, while in the plastic damage stage, the circumferential displacement gradient is increased from 0.2 mm to 0.4 mm. The experimental results are shown in Figure 5b.
According to the rock samples’ size and loading conditions, the numerical model was established as shown in Figure 5a. In the model, a rigid circular plate was used to simulate the loading of the triaxial pressure testing machine. The diameter of the loaded cylinder rock sample was 50 mm and the height was 100 mm. According to the experimental results in Figure 5b, record the plastic strain results when the axial stress was 23 MPa, 39 MPa, 58 MPa, or the axial displacement was 1.2 mm, as shown in Figure 5a. Compared with Figure 5a,b, the difference of plastic strain values under each cycle were 16.6%, 11.3%, 17.5%, respectively. This proves the rationality of the constitutive equation under the condition of large stress variation amplitude.

3. Numerical Simulation

This section takes the engineering geological conditions of the 5105 working face in the Yushupo Coal Mine as the background, a numerical calculation model was established, and the plastic zone depth of the mining floor based on the constitutive equation was calculated.

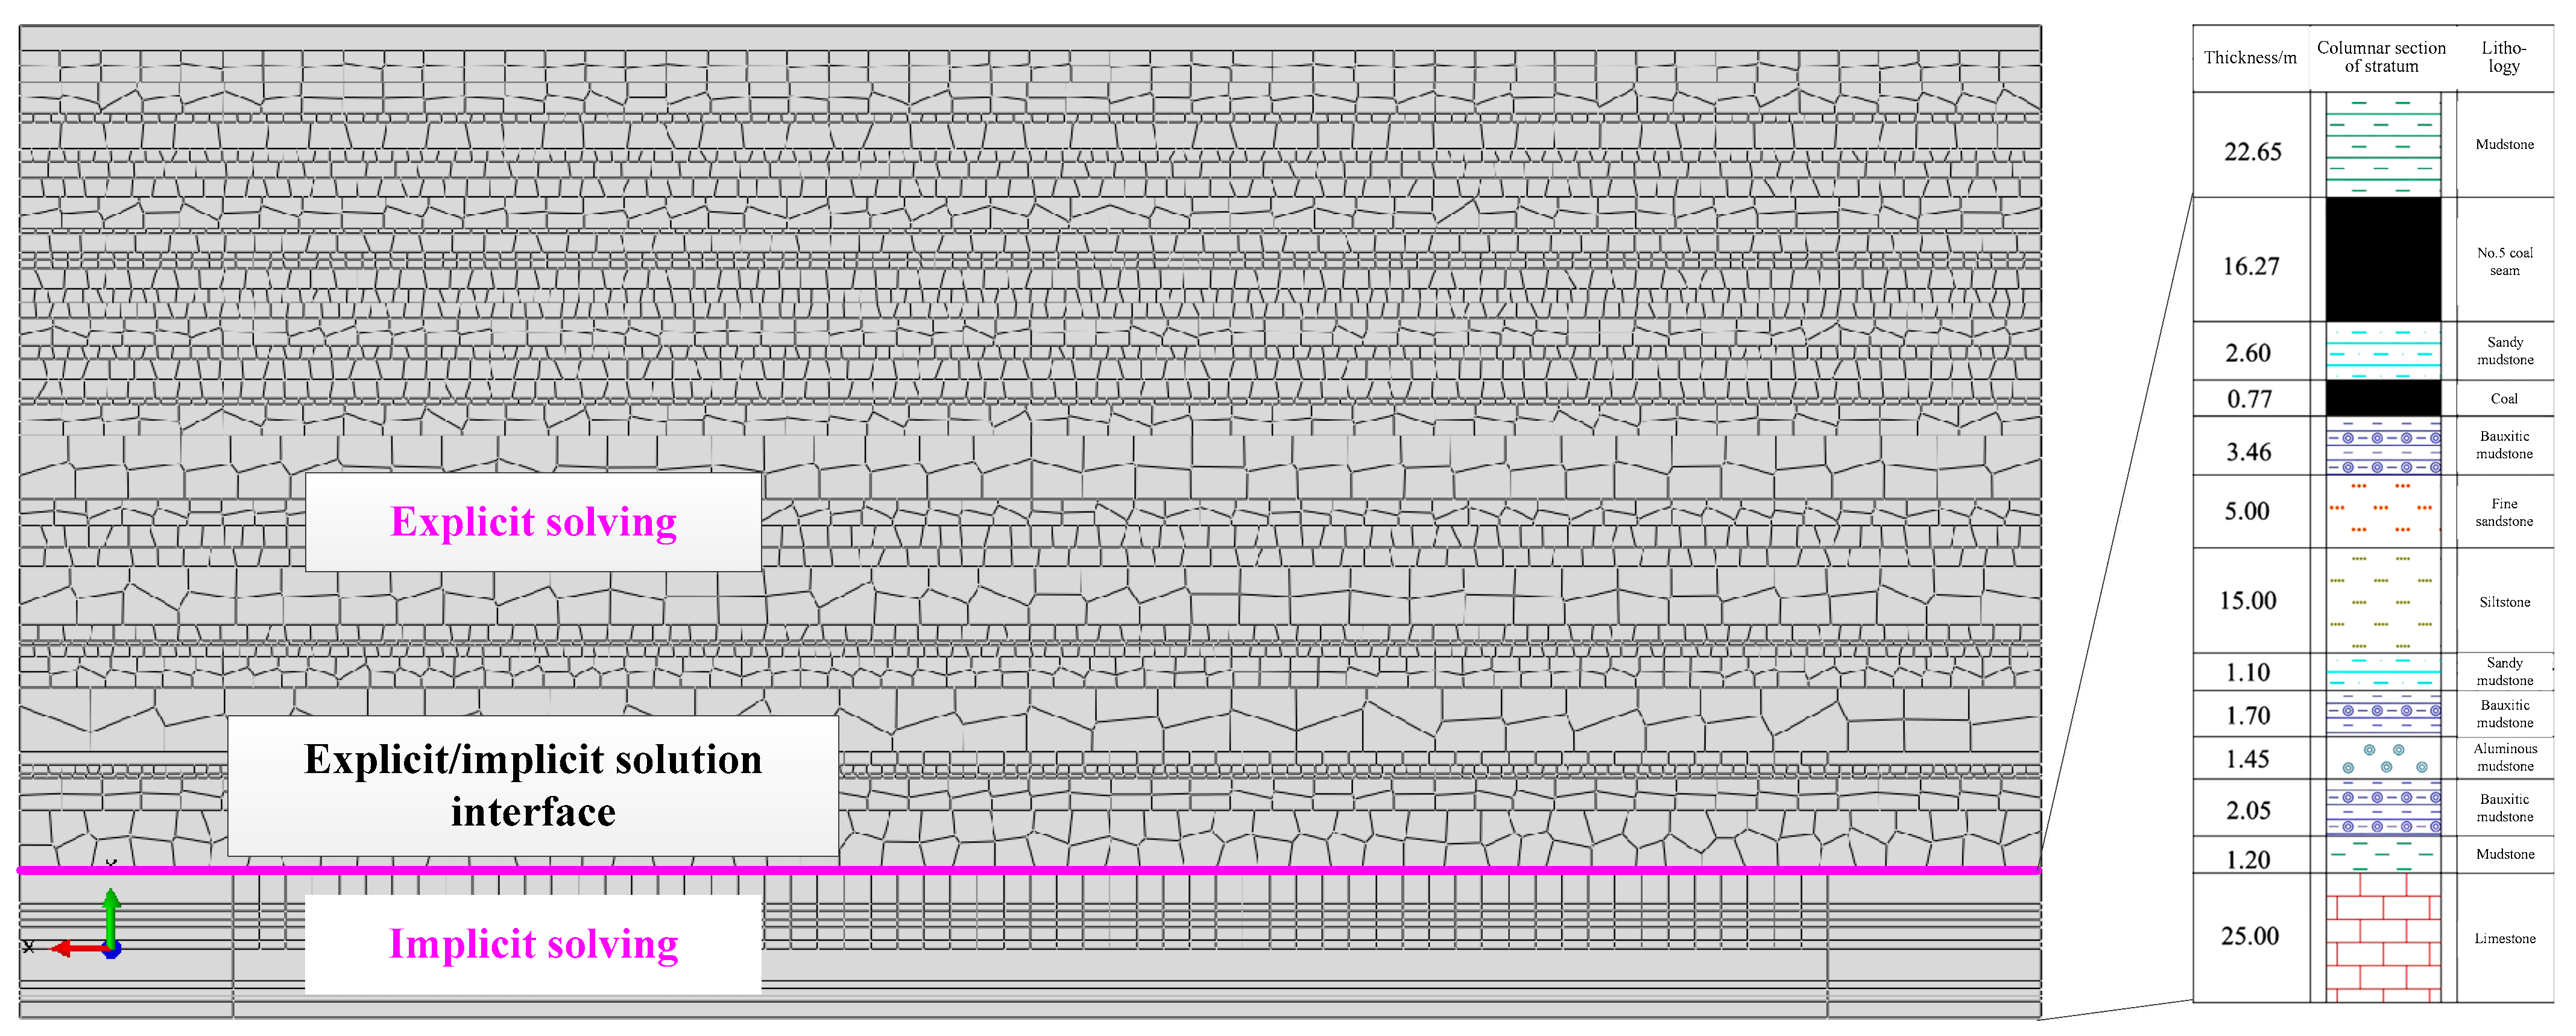
3.1. Geological Characteristics and Numerical Calculation Model of Yushupo Mine

The Yushupo Mine, located in Ningwu County, northwest of Shanxi Province (Figure 6), is mainly mining No. 5 coal seam. The average thickness of the coal in Working Face 5105 is 16 m, and the mining depth is 381 m. In order to qualitatively analyze whether the Ordovician limestone water has an impact on the mine production, through microscopic identification, it is determined that the rock specimen is generally bluish gray, with a massive structure and a small amount of light gray patches (Figure 7). The rock is mainly composed of dolomite and a small amount of rock fragments. Dolomite is in the form of subhedral rhombohedral allomorphic particles, with the size of mud crystals < 0.01 mm. A small amount of mud crystals with recrystallization of 0.01–0.05 mm can be seen locally. The particles are closely inlaid and have no directional characteristics, and it is the main mineral that constitutes the rock. The rock fragments are mainly calcite, angular or sharp angular, and distributed in scattered directions. The suture is mostly serrated and filled with iron mud. The rock is partially metasomatized by calcite. The fractures between rock fragments are the main storage space of karst water. This means that the Ordovician limestone aquifer in the Yushupo Coal Mine has good water abundance, which is a major hidden danger in coal safety production.
More seriously, the distance between the coal and the Ordovician limestone aquifer is only 32.3 m, which is mainly composed of mudstone, sandstone, and limestone (Figure 8). Once the failure depth of the mining floor is too large, it will lead to serious floor water inrush disaster; at the same time, it will lead to a great waste of drinking water sources (i.e., Ordovician limestone water).
In order to study the failure depth of the mining floor, a numerical calculation model was established, as shown in Figure 8. The size of the model is long × wide × height = 600 m × 270 m × 400 m. Horizontal constraints were applied to the left and right sides of the model, and vertical constraints were applied to the bottom. Gravity loads were applied to the whole model, and the lateral pressure coefficient was set as 0.67. The mechanical parameters of sandstone were determined according to Section 2, while the mechanical parameters of other rock formations are determined according to the literature [24].
As is known, the overburden rock breaks and moves significantly after coal mining, while the floor appears to have more floor heave and failure without a significant movement effect. In order to reduce the cost of numerical calculation, an explicit numerical solution was adopted for the roof, and then the load caused by the overburden collapse was converted to the nodes of floor (Figure 9); the depth of the plastic zone in the floor was calculated through the implicit numerical solution.

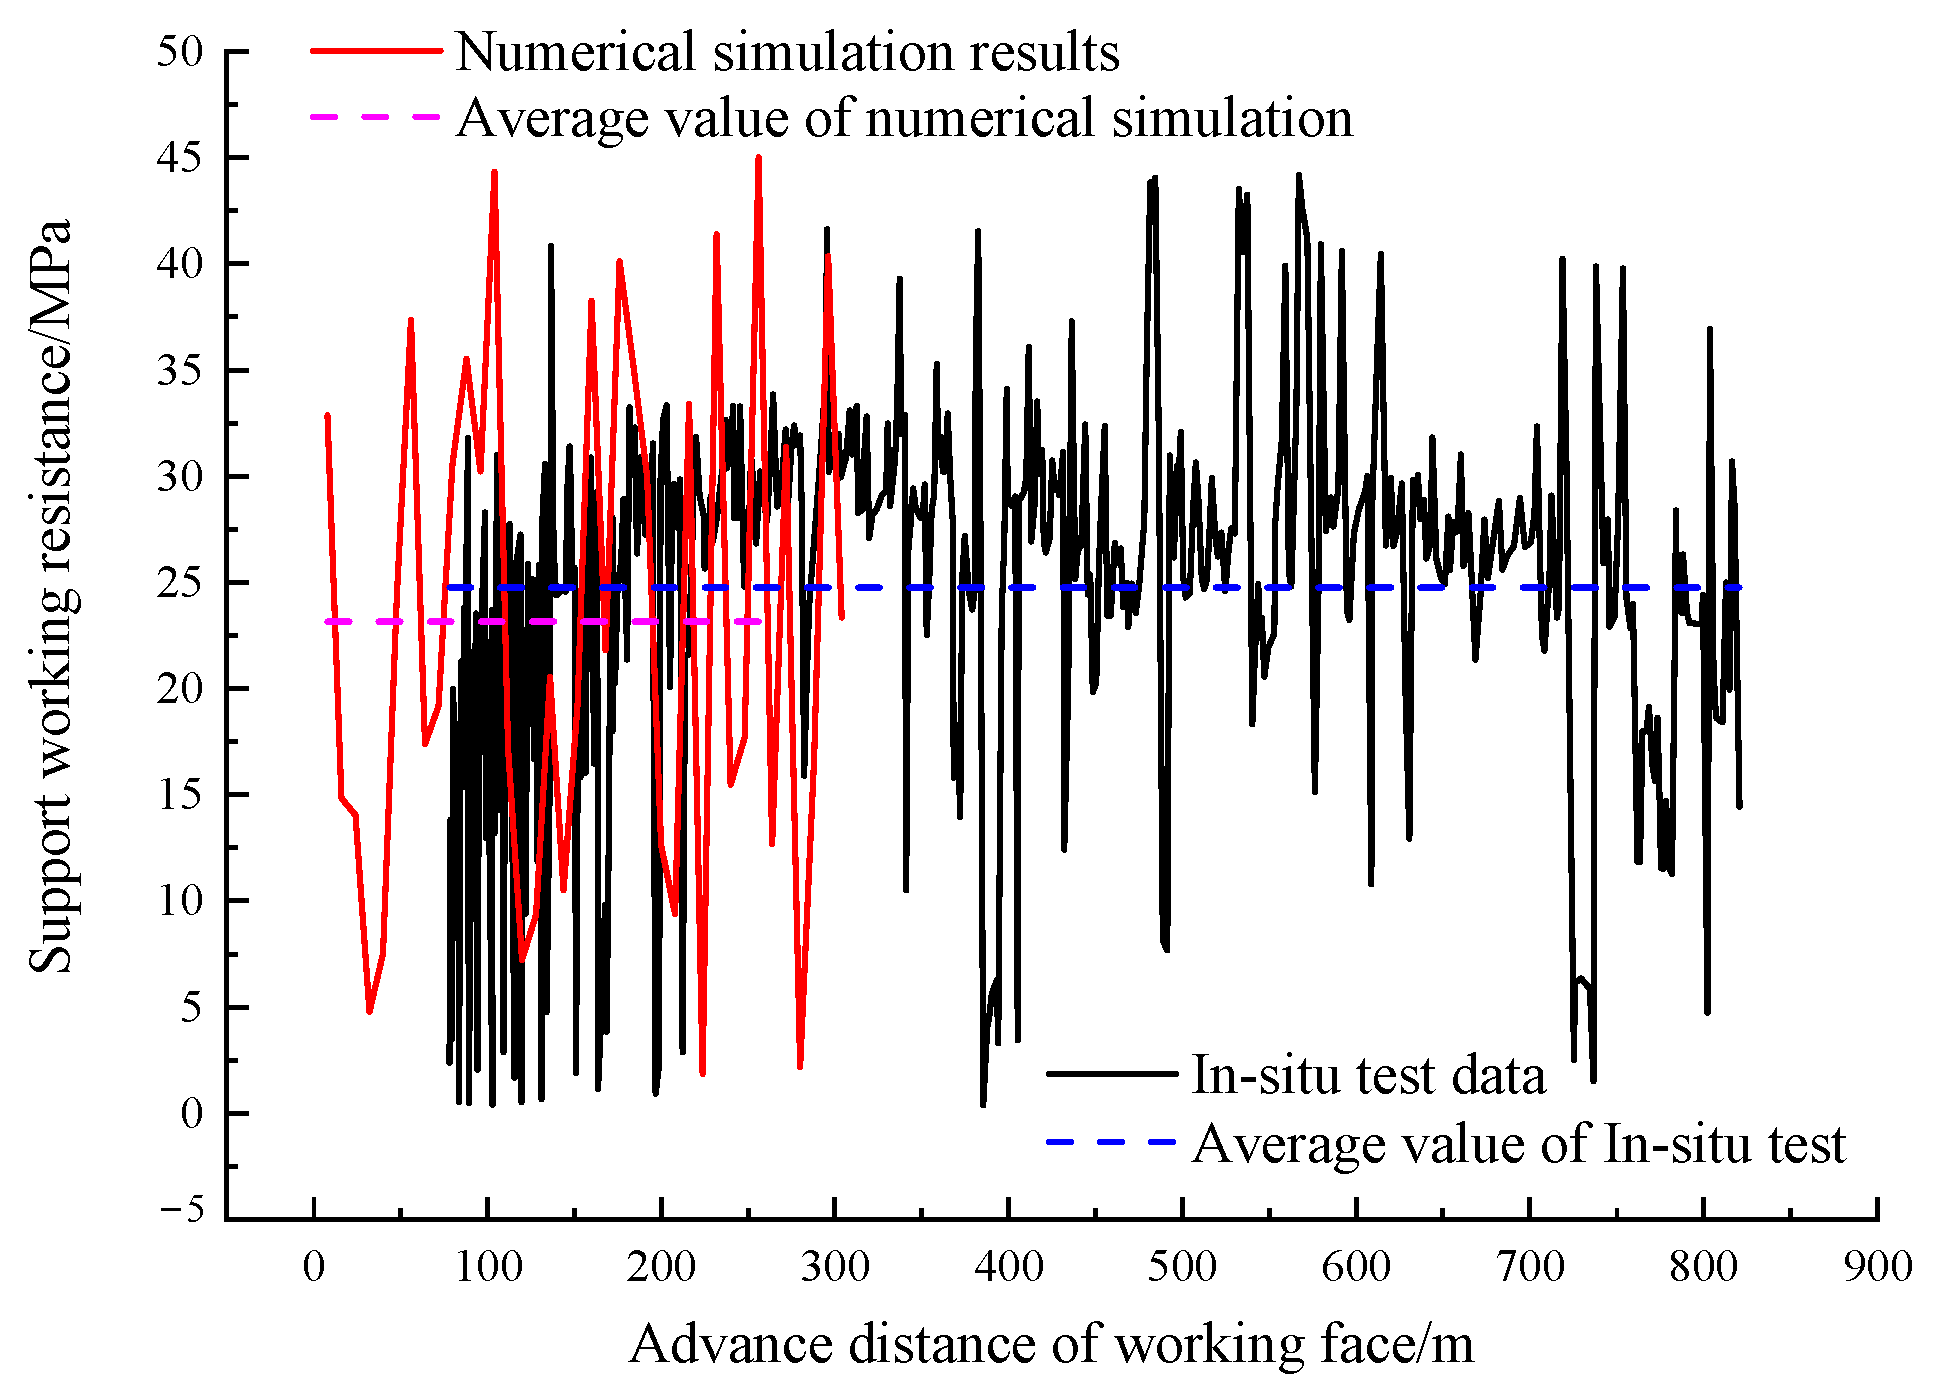
3.2. Numerical Simulation Results

Through the explicit and implicit coupling numerical simulation method, the results of the overburden movement and the failure depth of the floor during the mining advance of the 5105 working face were obtained, as shown in Figure 9.
Figure 9a showed that when the working face advanced to 100 m, the immediate roof and the main roof were completely broken. At this time, concentrated vertical stress was generated at 25 m ahead of the coal wall of the working face, and the maximum value was about 22 MPa. Pressure relief occurred within the goaf area of 0–10 m behind the working face. Then, the floor pressure stress gradually increased with the roof collapse; the maximum concentrated pressure stress of about 13 MPa appears at about 40 m behind the working face. In this process of compression-pressure relief-recompression, the plastic zone of the floor was about 16 m ahead of the working face, and the floor failure depth was about 22 m.
When the working face advanced to 200 m (Figure 9b), the key layer of roof sandstone and the sub key layer of sandy mudstone were broken, resulting in a concentrated stress of up to 30 MPa within 20 m in front of the working face. The floor was depressurized within the goaf area of 0–10 m behind the working face. Then, with the collapse of the roof, the pressure stress of the floor gradually increased, and the maximum concentrated pressure stress of about 20 MPa appeared at about 30 m behind the working face. In this process of compression, pressure relief, and recompression, the plastic zone of the floor was generated about 18m ahead of the coal wall of the working face. The failure depth of the floor was deepened to 25 m, and the maximum plastic strain reached 0.053.
When the working face advanced to 300 m, the key layer of roof sandstone reached the critical overhanging distance, while the rock layer above the sandstone remained relatively complete, resulting in a large area of tensile stress zone in the rock layer above the key layer. Under this complex stress state of tension and compression, the cracks in the overburden rock expanded in a large range, resulting in a concentrated stress of up to 30 MPa within 60 m of the working face. The floor was depressurized within the goaf area of 0~10 m behind the working face. Then, with the collapse of the roof, the pressure stress of the floor gradually increased, and the maximum concentrated pressure stress of about 20 MPa appeared at about 40 m behind the working face. In this process of compression, pressure relief, and recompression, the plastic zone of the floor was about 17 m ahead of the working face, and the failure depth of the floor was deepened to 28 m.
When the working face advanced to 400 m, the mudstone of the immediate roof and the siltstone of the main roof broke synchronously; a concentrated stress of up to 37 MPa appeared within 20 m in front of the working face. The floor was depressurized within the goaf area of 0–10 m behind the working face. Then, with the collapse of the roof, the pressure stress of the floor gradually increased, and the maximum concentrated pressure stress of about 17 MPa appeared at about 30 m behind the working face. In this process of compression, pressure relief, and recompression, the plastic zone of the floor was about 17 m ahead of the coal wall of the working face, and the damage depth of the floor was deepened to 28 m.

4. In-Situ Tests

Borehole stress–strain techniques were employed to monitor the actual failure depth of the mining floor. By counting the strain of sensors at different depths during the advancing process of the working face, the failure depth of the floor can be determined.

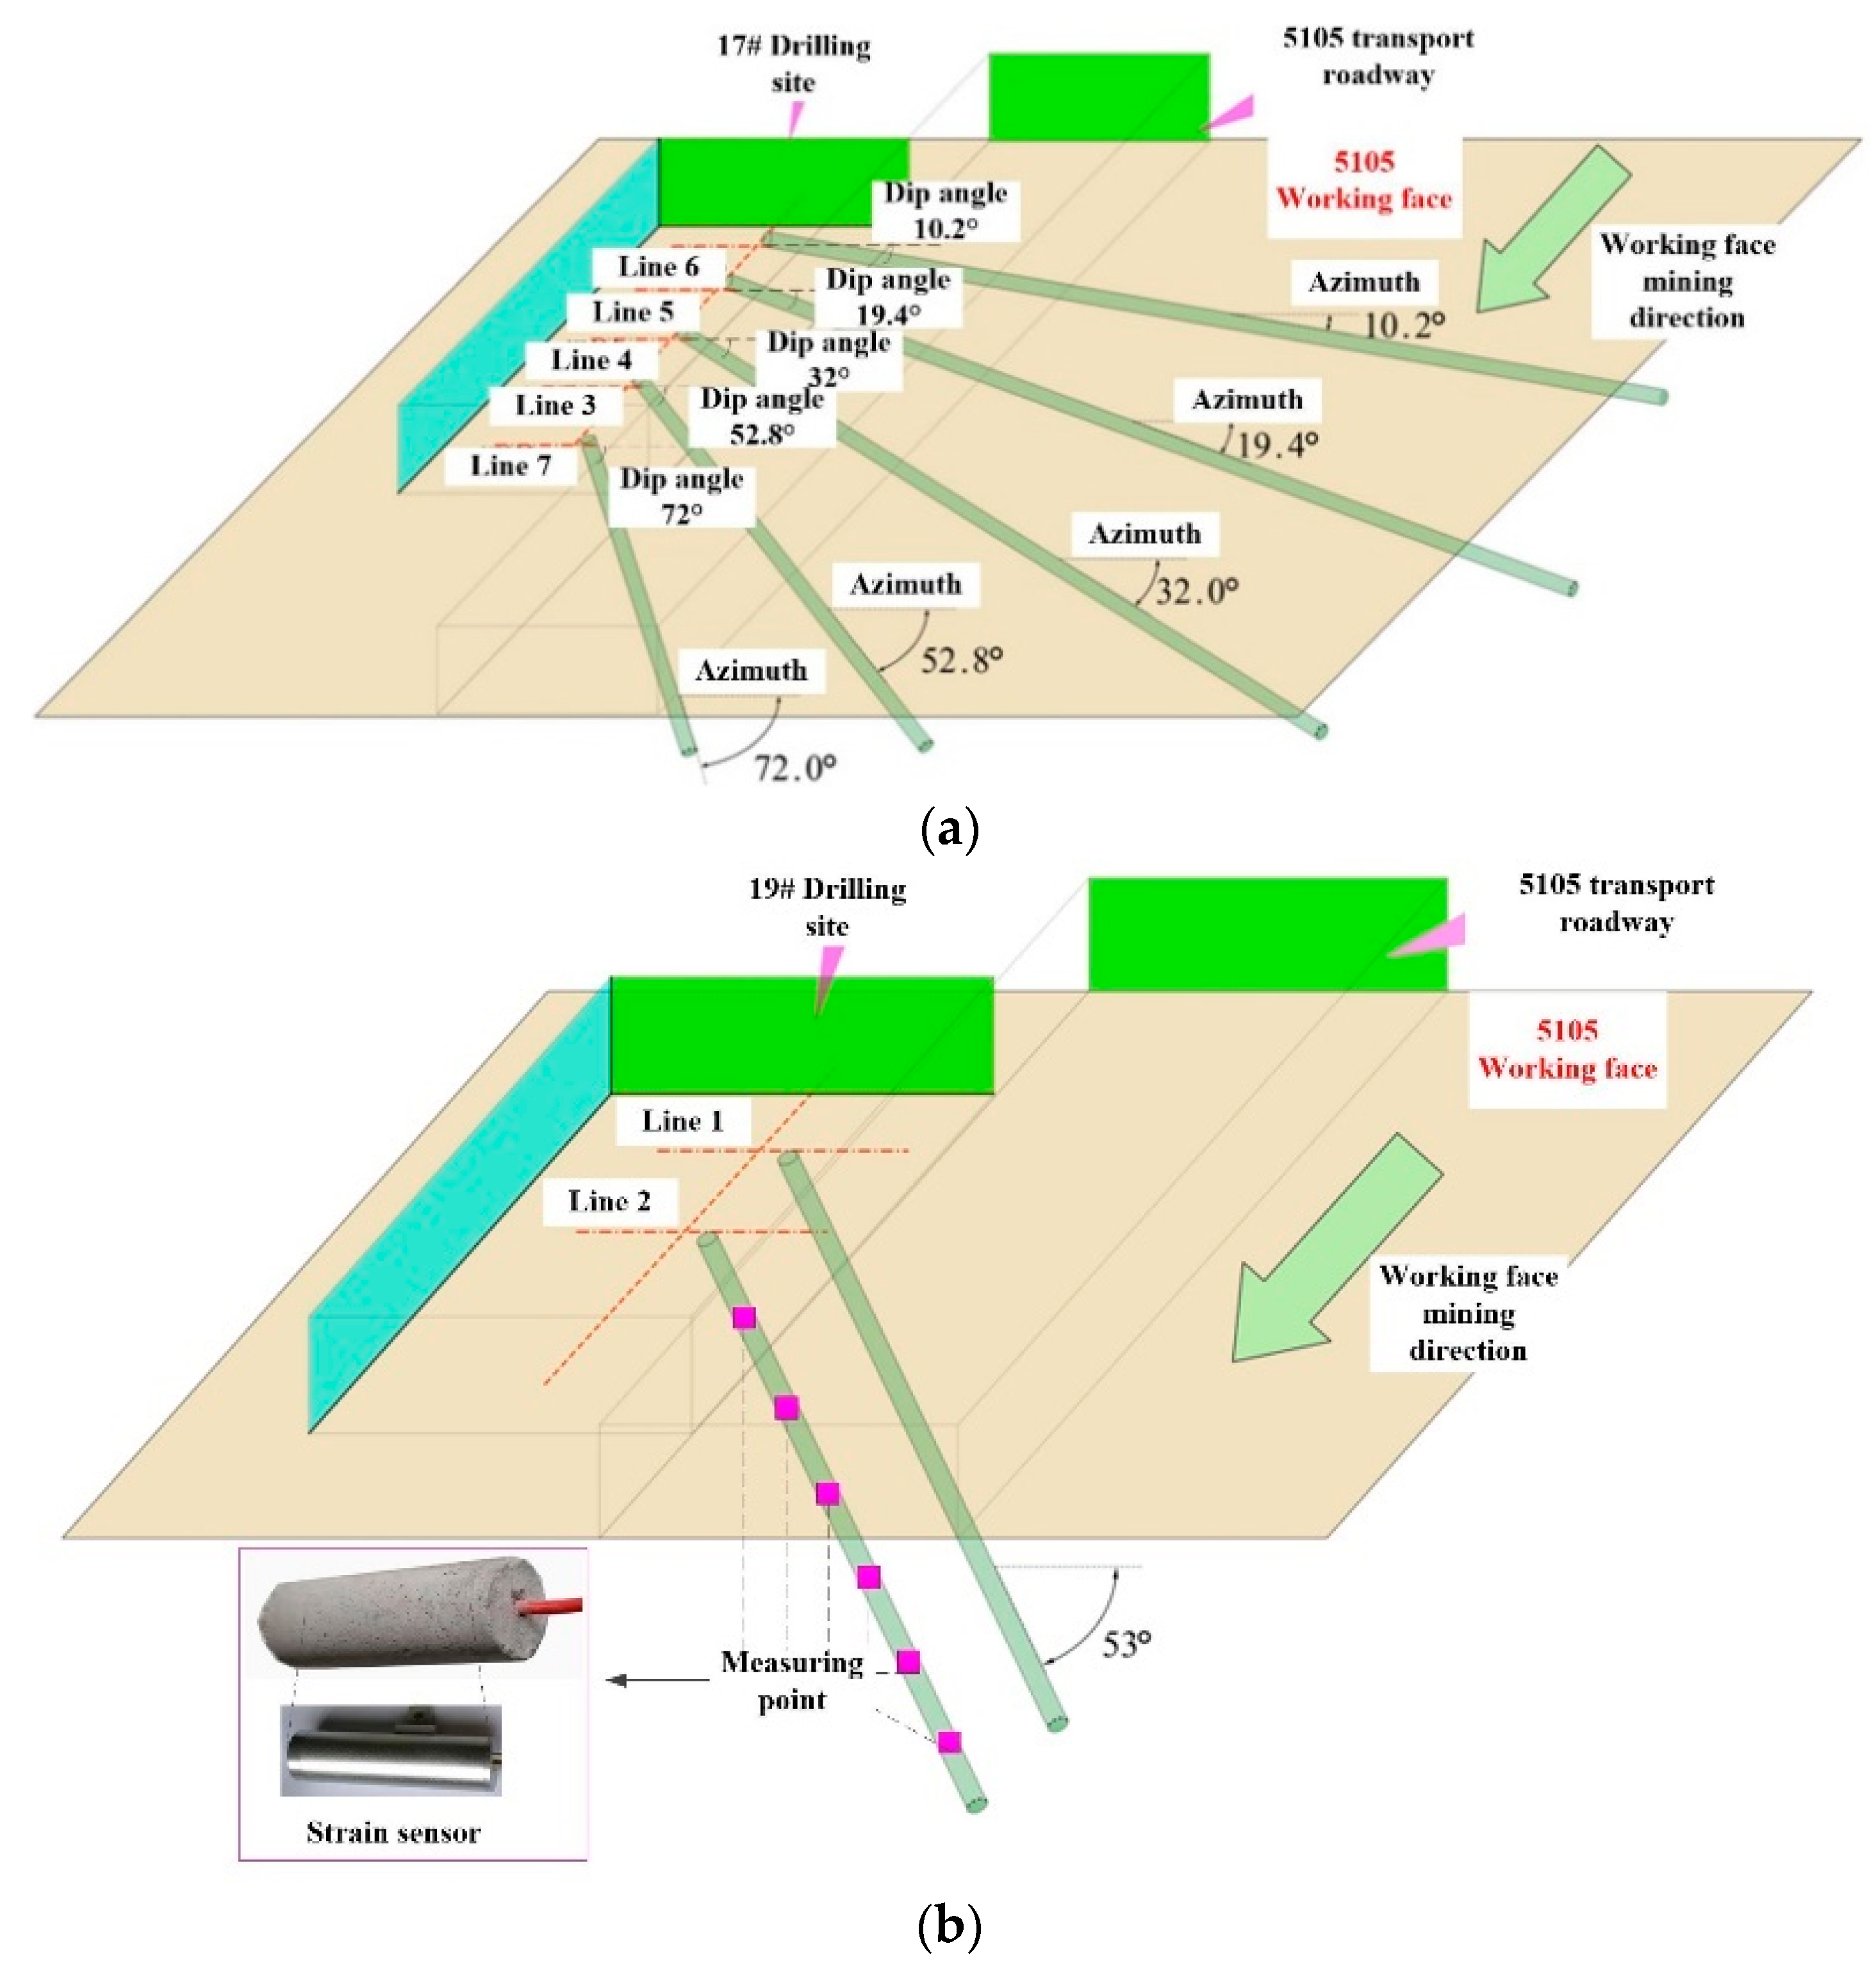
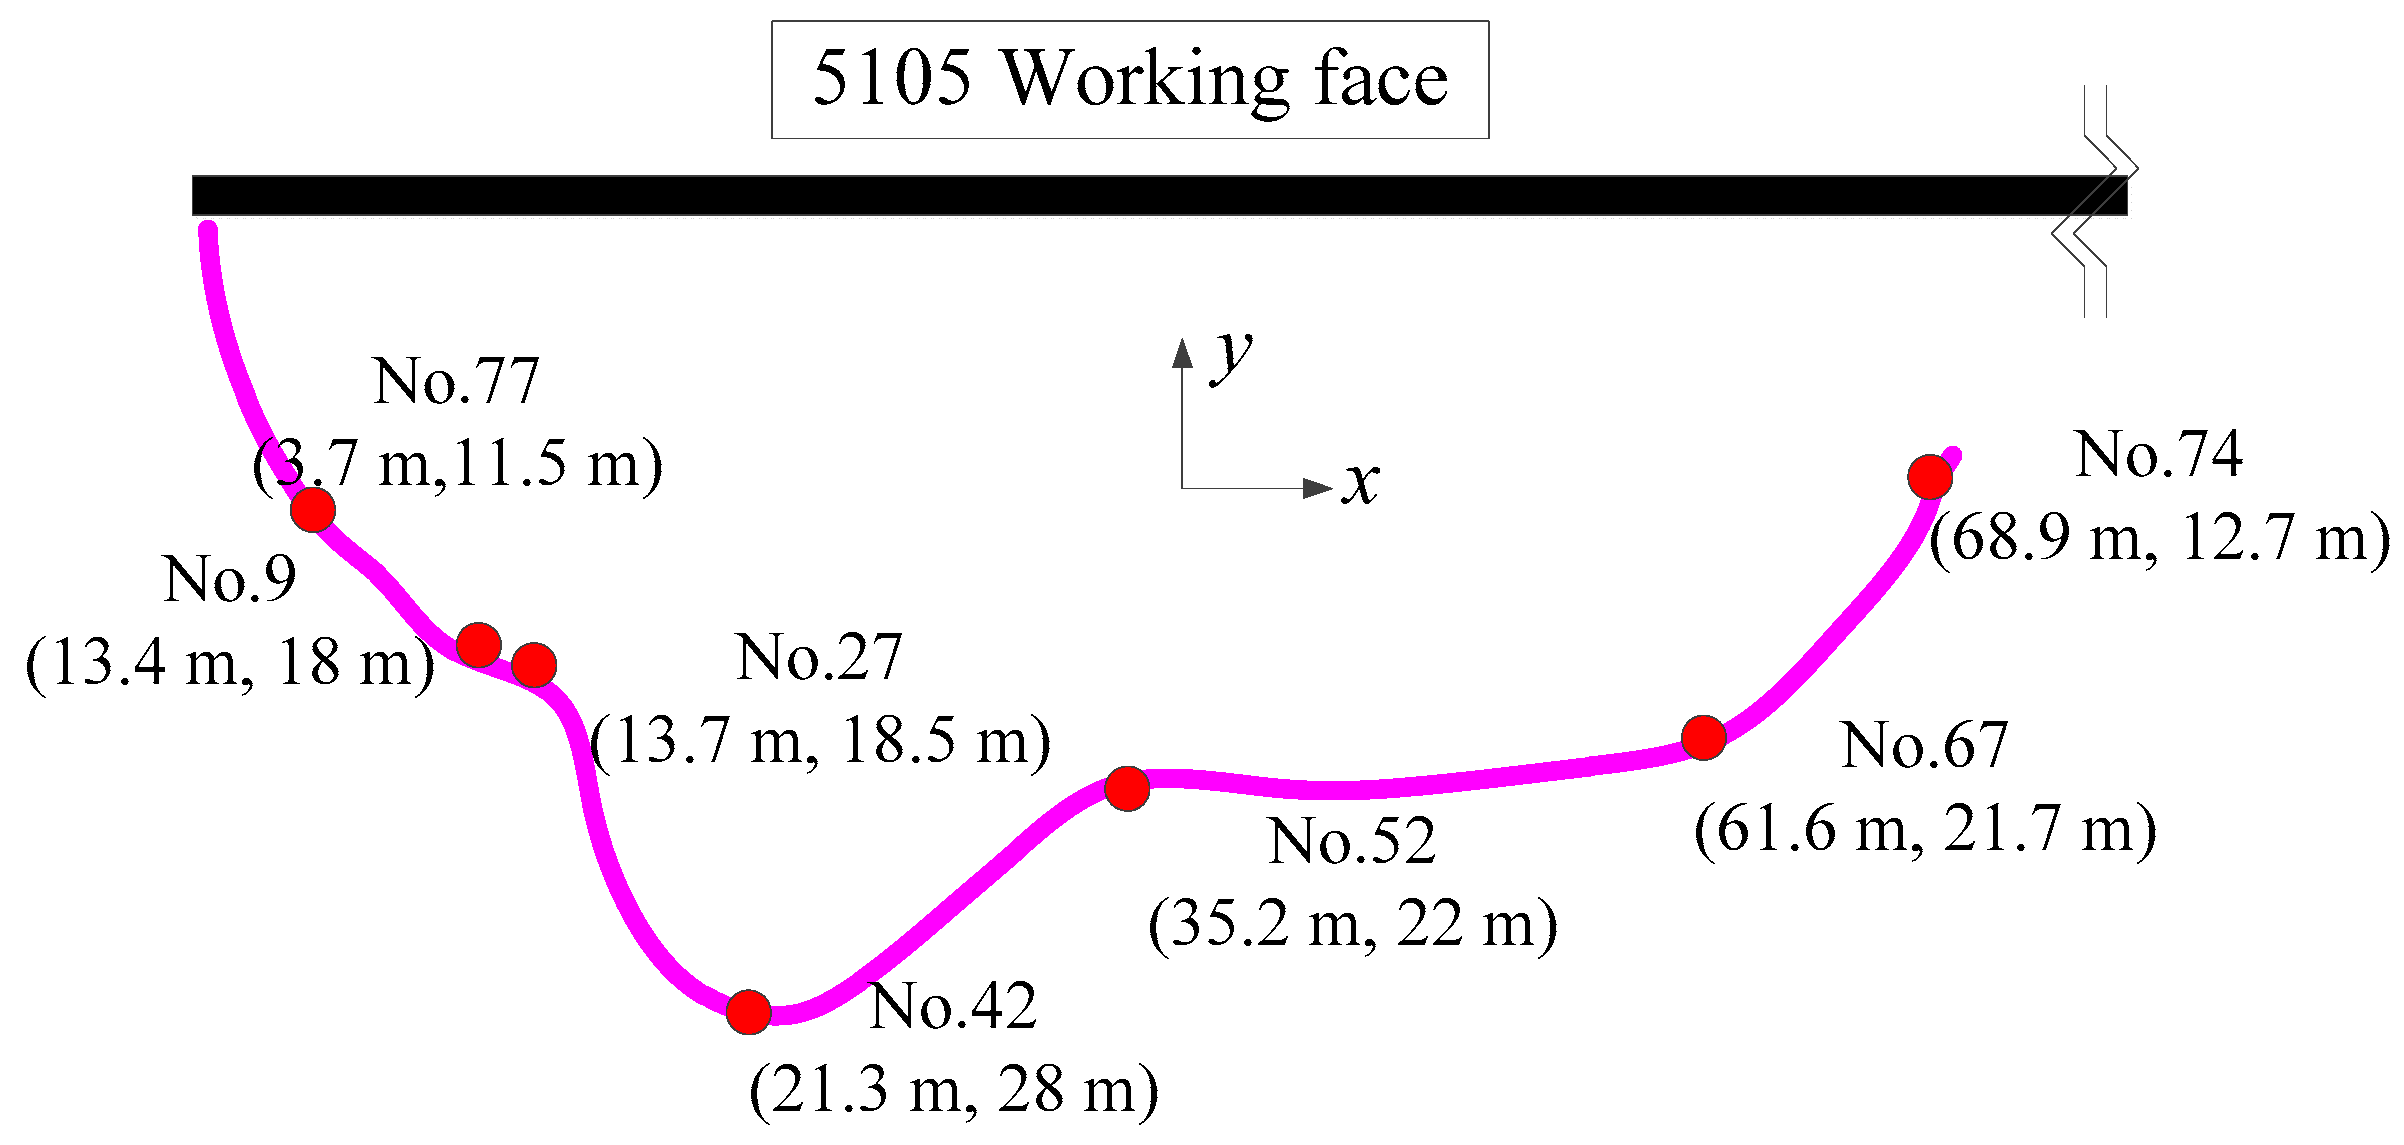
4.1. Measured Process

In order to measure the failure depth of the mining floor, according to the mining plan of the 5105 working face, and referring to the above numerical results (Figure 9), the measuring points were arranged in the J17 and J19 drilling site of transport roadway (Magenta box in Figure 6). A total of 91 stress strain sensors were arranged in the 7 boreholes (Figure 10), and the number and spacing of each sensor are shown in Table 2. The data started being recorded when the distance between the working face and the measuring point was 50 m, and then the data was collected every day for continuous monitoring for 120 days.

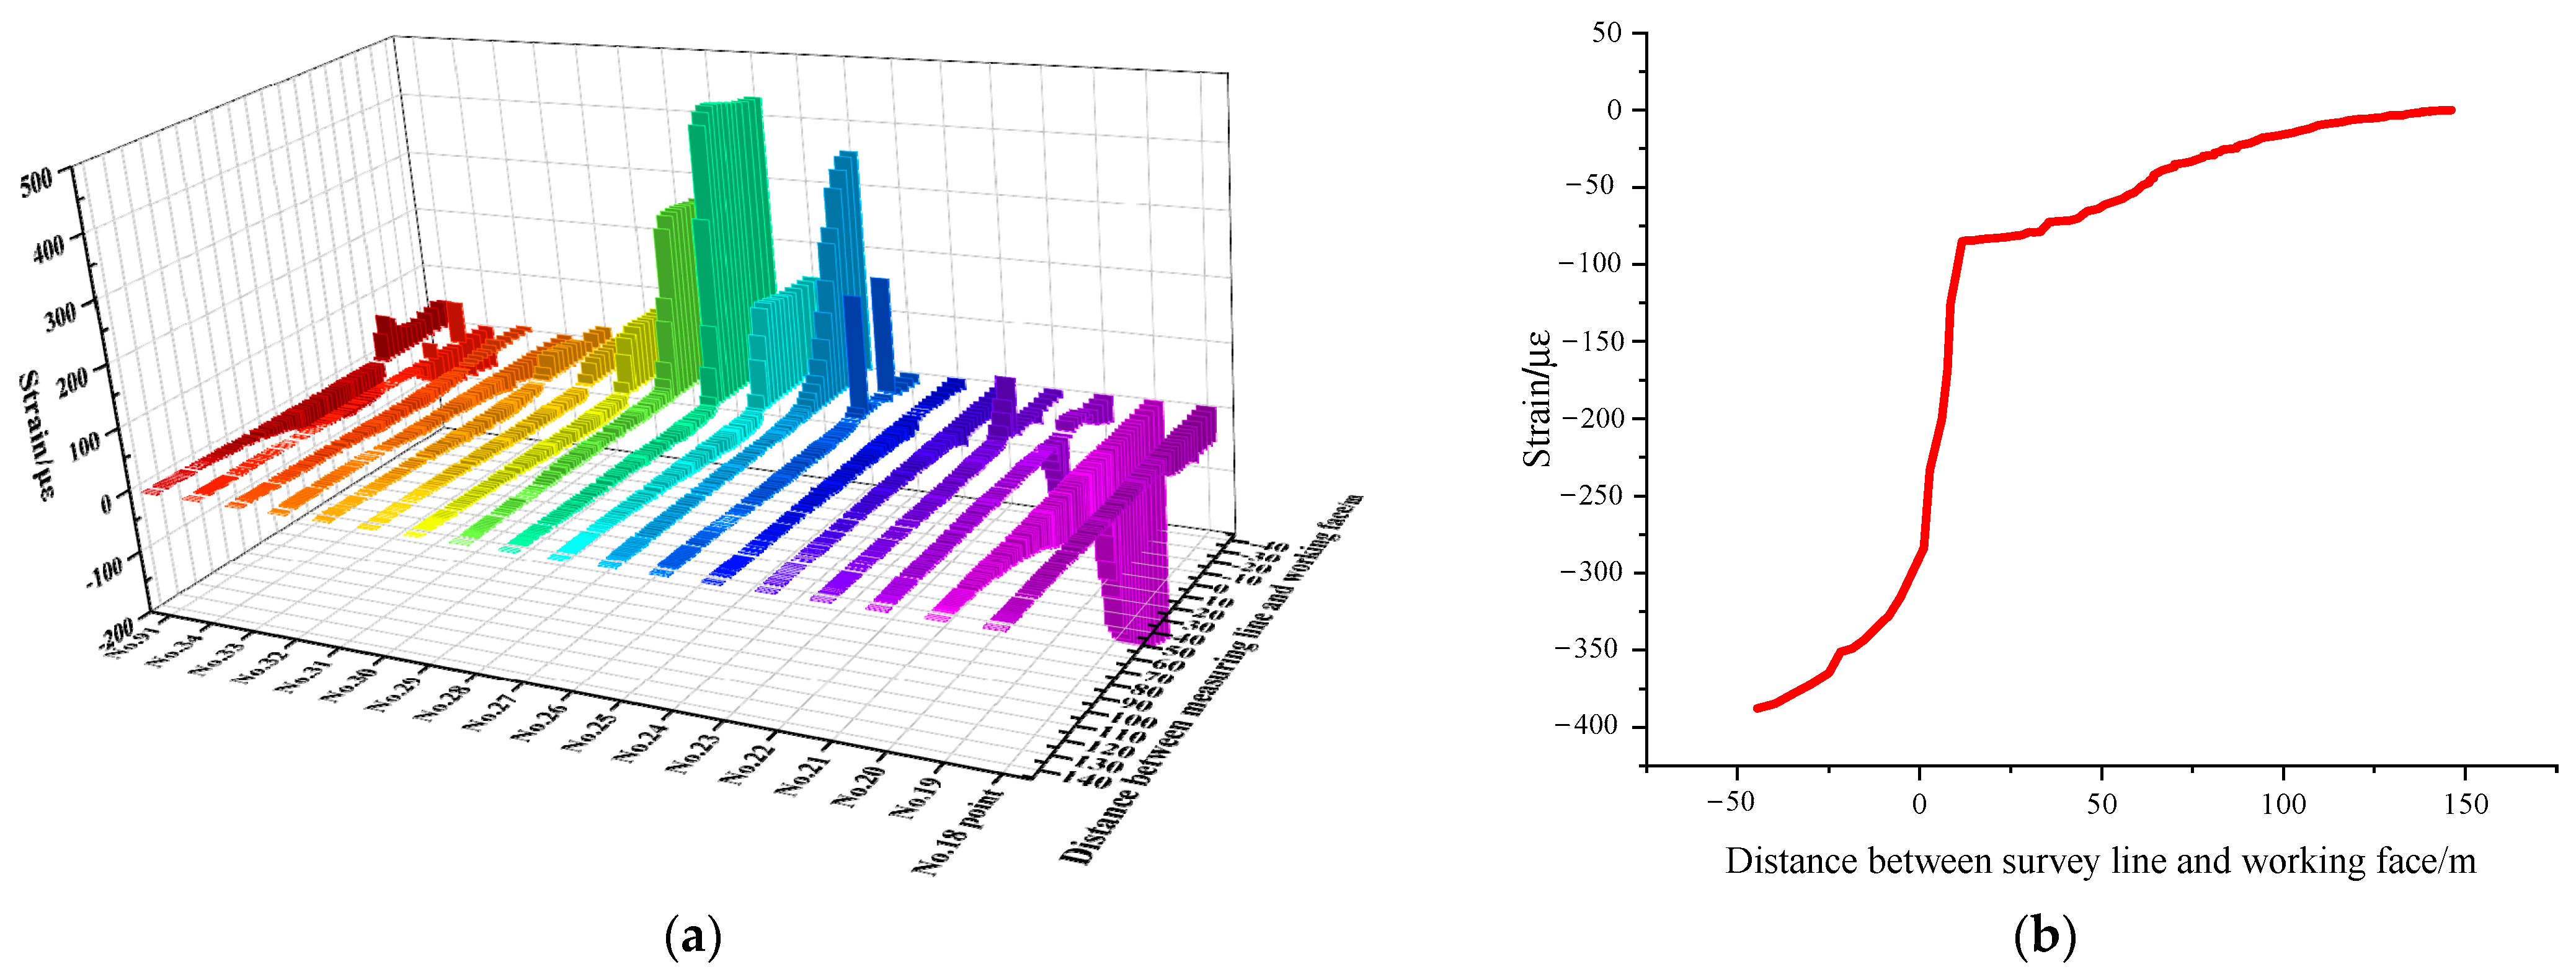
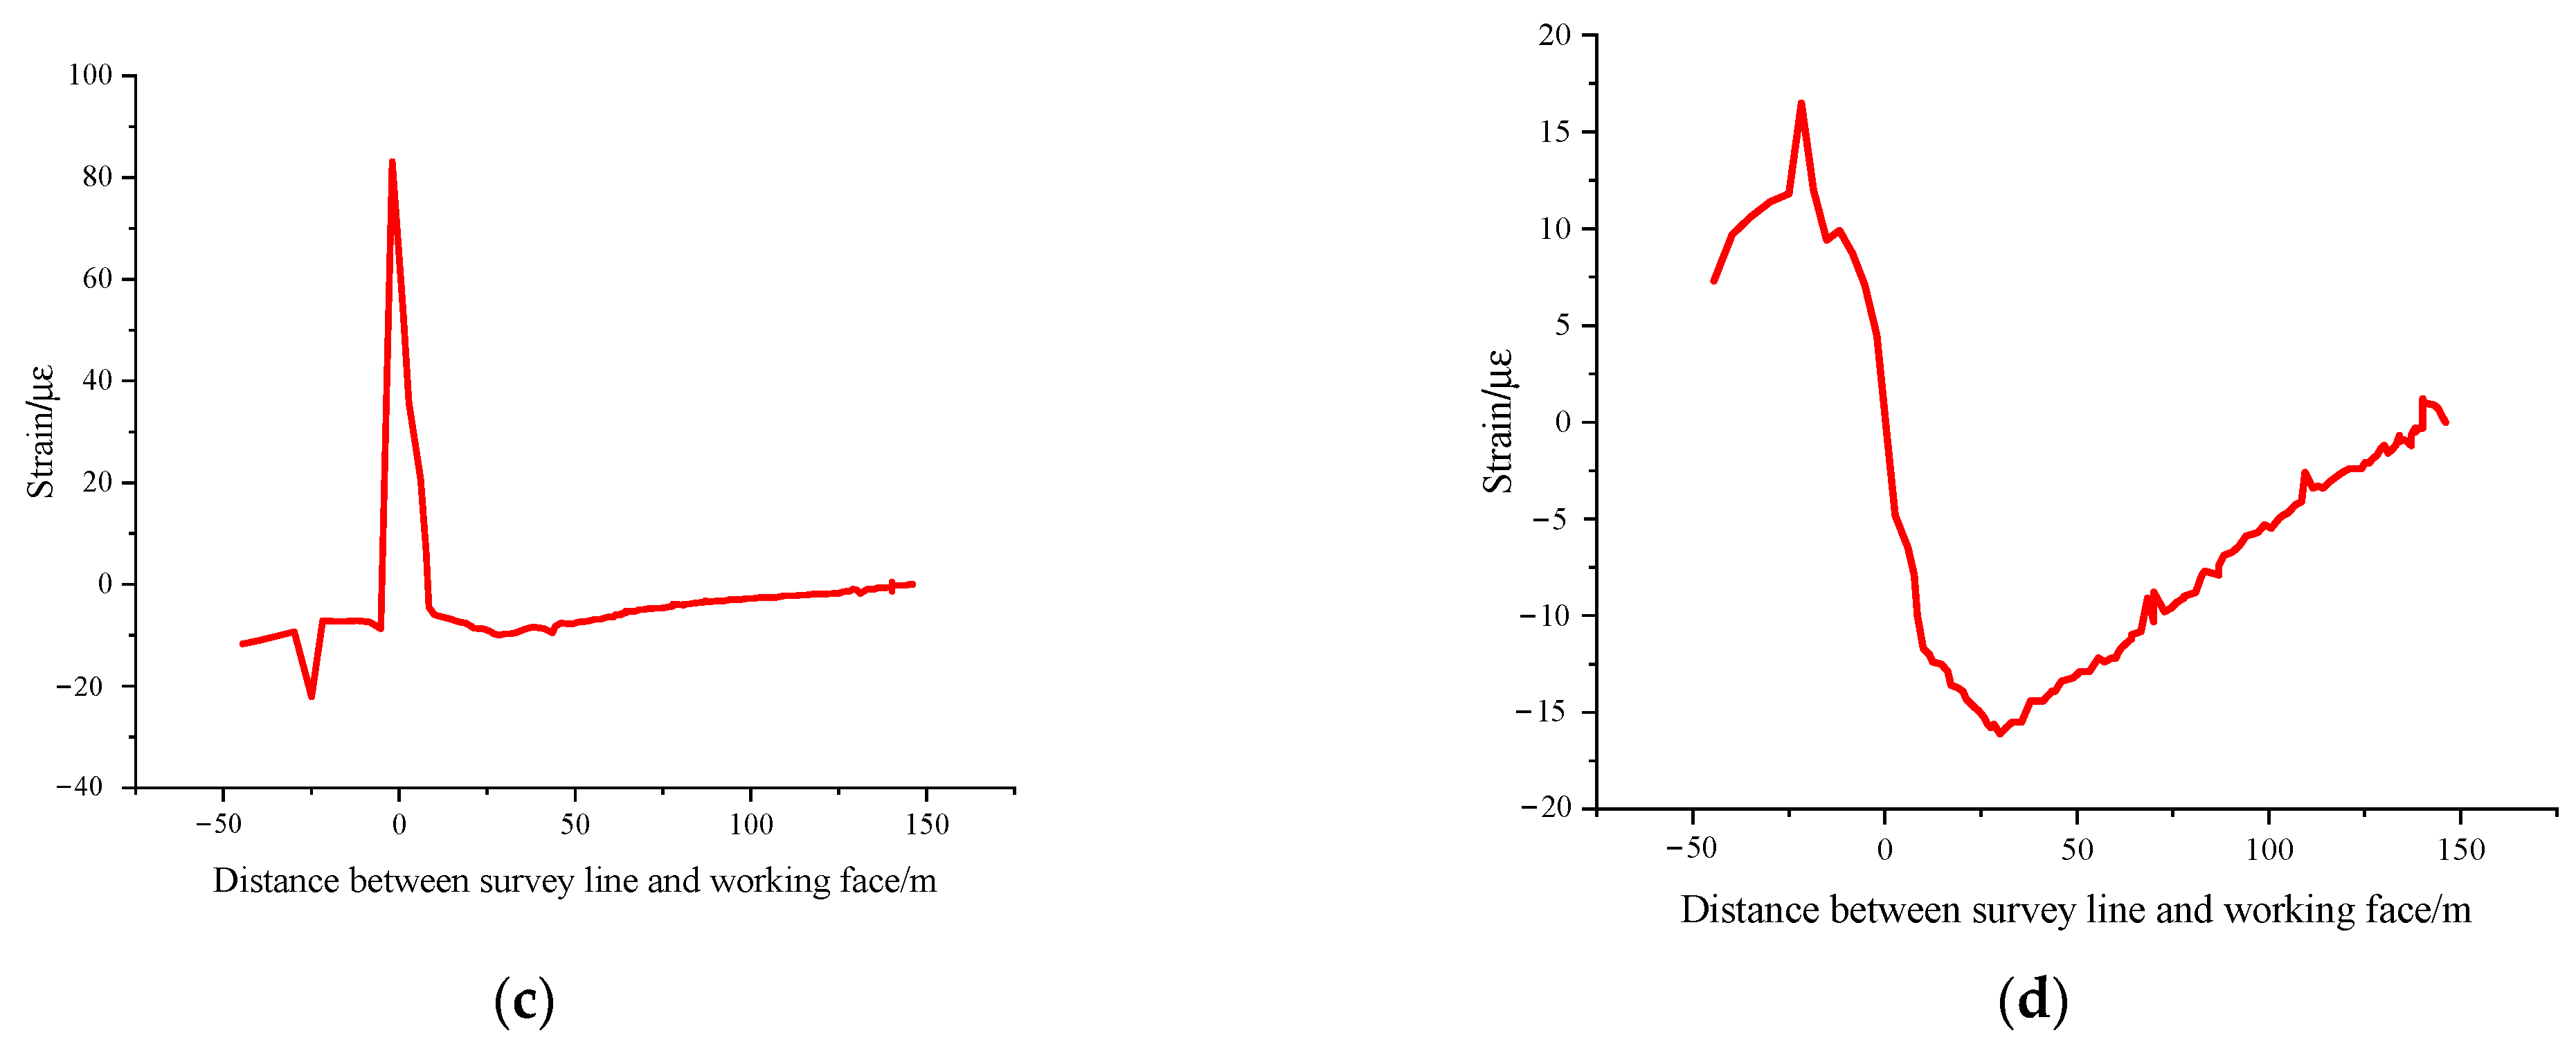
4.2. Measured Results and Analysis

The relationship between the strain of each measuring point and the advancing distance of the working face was analyzed, and then the envelope of the floor failure depth under the mining influence was obtained.
Figure 11a shows the relationship between the strain of each measuring point in Line 1 and the advancing distance of the working face. Based on the strain of each measuring point, considering the azimuth of the measuring lines and the distance between each measuring point and working face, it can be seen that the failure of the mining floor occurred 11.6 m ahead of the working face. However, as the working face advanced to the measuring point, the stress state of the floor quickly changed from compression to tension (Figure 11c), and the tension strain only occurred within the goaf area of 4–8 m behind the working face. Then, with the collapse and compaction of the roof, the tension strain of the floor was converted into compression strain. As the working face continued to advance and was far away from the measuring point, the influence of floor disturbance was obviously weakened. When the working face was advanced 25–35 m beyond the measuring point, the floor rock was basically no longer affected by the collapse and compaction of the overburden, and the failure depth of the floor was no longer extended to the deep. The maximum failure depth of the 5105 working face floor was 28 m.
Specifically, for 18# and 19# measuring points (Figure 11a,b), the strain values began to decrease at 10–11.6 m ahead of the working face, and the strain values decreased from 370 to 320. This was because the coal within 10 m ahead of the working face had plastic deformation due to mining pressure, which led to the reduction of coal bearing capacity, and led to the reduction of the floor compressive stress within this range. When the working face passed away the measuring point, the strain of the measuring point decreased rapidly from 320 to 75 (19# measuring point). However, the strain cannot be converted into tensile strain due to the serious failure of the floor rock. Moreover, the measuring point was under the concentrated compressive stress condition of the coal pillar near the 5105 transport roadway (Figure 10b and Figure 11b).
For 21#–24# measuring points (Figure 11a,c), the compressive strain occurred at 16 m in front of the working face, and the maximum value is −22. As the working face passed the measuring point, the floor rock strain had significant compression-tensile strain transformation, and the strain value increased from −22 to +83. This is because the floor rock has a certain degree of compression failure under the advance pressure, while the pressure released in the goaf. With the collapse and compaction of the overburden, the floor rock in the measuring point interval gradually recovered to the initial compression state, and the strain change value during this process did not exceed 200.
For No. 25–28 measuring points (Figure 11a), the floor rock in this area was just within the “O ring” range (i.e., an annular pressure relief area surrounding the boundary of goaf); the roof rock in this area was in an insufficient collapse state, and the floor rock was in a state of pressure relief, so the tensile strain of the floor rock was up to 470 at the No. 30 measuring point.
Correspondingly, although the strain corresponding to No. 29–34 and No. 91 measuring points increased or decreased amplitude (Figure 11a,d), the strain variation amplitude was small, no more than 50. It can be seen from the laboratory tests of tension and compression experiments that the rock was still in an elastic deformation state at this time. Based on the above data, it was considered that the maximum vertical depth of the floor failure at line 1 was 18.5 m, and the horizontal distance from the roadway was 13.7 m.
The strain data obtained from other measuring lines have a similar variation law with that in Figure 11. Figure 12a shows the relationship between the strain of each measuring point in Line 4 and the advancing distance of the 5105 face. It can be seen that the strain of the measuring points changed significantly at the distance of 9.3–24.2 m ahead of the working face. The maximum strain of the No. 48 measuring point was 3269, 15.5 m in front of the working face, while the maximum strain of the No. 52 measuring point in the “O-ring” reached 15,157. The above data shows that the floor failure depth gradually increased from No. 48 until it reached the maximum at the No. 52 measuring point; the floor failure depth was 22 m, and the horizontal distance to the roadway was 35.2 m.
In addition, according to the measured data of tensile and compressive strains, the maximum floor failure depth was 18–18.5 m at Line 2, and the horizontal distance between this location and the roadway was 13.4–13.7 m (Figure 12b). At Line 3, the maximum floor failure depth was 28 m, and the horizontal distance between this location and the roadway was 21.3 m (Figure 12c). At Line 5, the maximum floor failure depth was 22 m, and the horizontal distance between this location and the roadway was 35.2 m (Figure 12d).

5. Discussion

This paper focuses on the floor failure depth under the conditions of caving mining of extra-thick coal seams. For this reason, the double scalar elastoplastic constitutive equations were established, the explicit–implicit coupling numerical algorithm was adopted, and the borehole stress–strain in-situ monitoring technology including 91 measuring points was employed to detect the floor failure depth. On this basis, the failure law of the mining floor was studied. The research shows that under the condition of caving mining of extra-thick coal seams, the floor bears the stress of compression-unloading-recompression with greater variation compared with the medium-thick coal seam, which leads to the greater failure depth of the floor. To our knowledge, the explicit–implicit coupling numerical algorithm based on the double scalar elasto-plastic constitutive equation and the full section in-situ test were used for the first time in the study of the failure depth of the mining floor.
As is known, underground coal mining will inevitably lead to the floor pressure in front of the working face, the pressure relief in the goaf, and then the compression with the rupture and falling of the overburden. During the above loading and unloading process, the stress variation amplitude of the floor rock is large. It is not only necessary to deeply study the rock mechanical characteristics and constitutive theory under the condition of "large stress amplitude", but is also needed to deeply study the numerical simulation method applicable to the floor failure caused by overburden movement. Classical theories of the elasticity mechanics theory [7,8], the elastic-plastic mechanics theory [9,10], and the elastic damage theory [11,12], as well as classical numerical methods based on continuum assumption, including finite element [25] and finite difference [26] numerical simulation methods, have been used previously for prediction. However, the floor failure depth under the condition of extra-thick coal seams cannot be predicted from those theories, because they were conducted by the lack of influence of the compression-unloading-compression process (Equations (12) and (14)) caused by the overburden fracture and collapse (Figure 9). The new double scalar elastic-plastic damage constant equations verified by laboratory tests (Figure 5), and combined with the explicit–implicit coupling numerical algorithm, make the simulation results more meaningful.
In addition, it is also necessary to carry out full section in-situ monitoring of the failure range of the mining floor in the condition of the extra- thick coal seam. Through the numerical simulation method and in-situ test method, we can obtain the working resistance of hydraulic support, so as to verify the reliability of the numerical simulation (Figure 13). More importantly, the in-situ test conducted by 7 survey lines with different dip angles, azimuth angles, and 91 survey points, not only clearly reflects that the floor stratum is in the state of compression-relief-recompression stress due to overburden fracture and collapse during mining advance, thus emphasizing the necessity of establishing the constitutive theory under large stress variation amplitude, but also shows that the failure of the mining floor is in the inverted saddle distribution form (magenta curve in Figure 14). It is of great significance to further optimize the floor grouting scheme and protect the Ordovician limestone water resources. To date, most scholars have studied the floor failure depth under the condition of “medium-thick coal seam”, and obtained the Huainan Coal Mine (7.4 m thick coal seam) [7], Yungaishan Coal Mine (4 m thick coal seam) [27], and Huaibei Coal Mine (3.2 m thick coal seam) [28], which are close to the mining depth of the Yushupo Coal Mine, with floor failure depths of only 21 m, 15 m, and 17.3 m, respectively. More importantly, they ignored the fact that the failure depth of the mining floor at different positions is very different. It is difficult to obtain the envelope of the failure depth of the mining floor through only 3–5 in-situ test points.
A double scalar elastoplastic damage constitutive equation suitable for large stress variation was established. By using the explicit–implicit coupling simulation method, combined with the full section in-situ stress–strain tests, the floor failure depth under the condition of extra-thick coal seams was studied. The results show that under the condition of extra-thick coal seams, the floor failure depth is much greater than that of medium- thick coal seams, and the mining floor failure occurs 5.2–24.2 m ahead of the working face, while in the inclined direction, the floor failure zone presents an inverted saddle type distribution, the maximum failure depth reaches 28 m, and the horizontal distance from the transportation chute is 21.3 m (Figure 13). The numerical simulation results are close to the in-situ test results, reflecting the rationality of the constitutive equations and the explicit–implicit coupling simulation method. The above research results lay a foundation for further protecting the Ordovician limestone water, and realizing green coal mining.

6. Conclusions

(1) The explicit–implicit coupling numerical program and the double scalar elastoplastic damage constitutive model are suitable for the numerical calculation of the floor failure depth under the condition of extra-thick coal seams.
(2) Under the mining condition of extra-thick coal seams, the overburden moves violently, resulting in a loading-unloading-reloading process with large stress variation amplitude in the floor, which leads to a failure depth of the mining floor far greater than that caused by medium-thick coal seams.
(3) In the Yushupo 5105 working face of extra-thick coal seams, the envelope line of the floor failure depth presents an inverted saddle distribution. The floor failure starts to develop from 9.3–24.2 m ahead of the working face, and the failure depth no longer increases after 35 m behind the working face, with the maximum failure depth of 28 m.

Author Contributions

Conceptualization, G.G.; Methodology, G.G. and Z.W.; Software, H.L. (Hao Li); Validation, Z.W., S.Q. and Y.Z.; Formal Analysis, H.L. (Hanjiang Lyu); Investigation, G.G.; Resources, S.Q.; Data Curation, Y.H.; Writing—Original Draft Preparation, H.L. (Hao Li); Writing—Review & Editing, Y.Z.; Visualization, Y.H.; Supervision, G.G. and Z.W.; Project Administration, G.G.; Funding Acquisition, G.G. All authors have read and agreed to the published version of the manuscript.

Funding

This research was funded by Shaanxi Natural Science Basic Research Program Project, grant number 2020JM-715, 2022SF-046.

Data Availability Statement

Not applicable.

Acknowledgments

Author thank any experts and editors who have worked hard on this manuscript.

Conflicts of Interest

The authors declare no conflict of interest.

References

  1. Zhu, Y.; Jiang, S.; Zhao, Y.; Li, H.; He, G.; Li, L. Life-cycle-based water footprint assessment of coal-fired power generation in China. J. Clean. Prod. 2020, 254, 120098. [Google Scholar] [CrossRef]
  2. Varis, O.; Vakkilainen, P. China’s 8 challenges to water resources management in the first quarter of the 21st Century. Geomorphology 2001, 41, 93–104. [Google Scholar] [CrossRef]
  3. Shen, N.; Pang, A.; Li, C.; Liu, K. Study on ecological compensation mechanism of Xin’an spring water source protection zone in Shanxi Province, China. Procedia Environ. Sci. 2010, 2, 1063–1073. [Google Scholar] [CrossRef] [Green Version]
  4. Zhu, S.Y.; Jiang, Z.Q.; Hou, H.L.; Xiao, W.G.; Yao, P. Analytical model and application of stress distribution on mining coal floor. J. Chin. Univ. Min. Technol. 2008, 18, 13–17. [Google Scholar] [CrossRef]
  5. Zhang, P.S.; Yan, W.; Zhang, W.Q.; Shen, B.T.; Wang, H. Mechanism of water inrush due to damage of floor and fault activation induced by mining coal seam with fault defects under fluid-solid coupling mode. Chin. J. Geotech. Eng. 2016, 38, 877–889. [Google Scholar]
  6. Zhu, W.C.; Wei, C.H. Numerical simulation on mining-induced water inrushes related to geologic structures using a damage-based hydromechanical model. Environ. Earth Sci. 2011, 62, 43–54. [Google Scholar] [CrossRef]
  7. Liu, C.; Zhang, P.; Ou, Y.; Yao, D.; Tian, Y. Analytical stress analysis method of interbedded coal and rock floor over confined water: A study on mining failure depth. J. Appl. Geophys. 2022, 204, 104720. [Google Scholar] [CrossRef]
  8. Song, W.; Liang, Z. Theoretical and numerical investigations on mining-induced fault activation and groundwater outburst of coal seam floor. Bull. Eng. Geol. Environ. 2021, 80, 5757–5768. [Google Scholar] [CrossRef]
  9. Chen, Y.; Tang, L. Main controlling factors to determine depth of failure zone in complete floor of coal seam based on field measurements. Arab. J. Geosci. 2022, 15, 101. [Google Scholar] [CrossRef]
  10. Shi, S.; Miao, Y.; Wu, H.; Xu, Z.; Liu, C. The Stress Evolution of Adjacent Working Faces Passing through an Abandoned Roadway and the Damage Depth of the Floor. Energies 2022, 15, 5824. [Google Scholar] [CrossRef]
  11. Ma, K.; Sun, X.Y.; Tang, C.A.; Yuan, F.Z.; Wang, S.J.; Chen, T. Floor water inrush analysis based on mechanical failure characters and microseismic monitoring. Tunn. Undergr. Space Technol. 2021, 108, 103698. [Google Scholar] [CrossRef]
  12. Li, A.; Liu, Y.; Mou, L.; Li, K. Numerical analysis and case study on the mitigation of mining damage to the floor of no. 5 coal seam of Taiyuan Group by grouting. J. South. Afr. Inst. Min. Metall. 2018, 118, 461–470. [Google Scholar] [CrossRef]
  13. Mei, Q.I.U.; Longqing, S.H.I.; Xiaoge, Y.U.; Weifu, G.A.O.; Yongkui, S.H.I. On preventing the high pressure water-inrush from floor with paste-like backfill mining. J. Min. Saf. Eng. 2016, 33, 409–414+422. [Google Scholar]
  14. Li, H.; Bai, H.; Wu, J.; Meng, Q.; Ma, K.; Wu, L.; Meng, F.; Wang, S. A set of methods to predict water inrush from an ordovician karst aquifer: A case study from the Chengzhuang mine, China. Mine Water Environ. 2019, 38, 39–48. [Google Scholar] [CrossRef]
  15. Xue, W.F.; Wang, S.J.; Huang, K.J.; Ji, R.J.; Liu, M.L.; Ren, Y.L.; Xi, X.P.; Wang, F. Theoretical analysis and field measurement of floor failure in gob side entry of cutting roof in confined water mine area. J. China Coal Soc. 2020, 45, 581–588. [Google Scholar]
  16. Hou, E.K.; Fan, J.C.; Xie, X.S.; Long, T.W.; Zhuang, H.L.; Wang, J.H.; Fan, Z.G. Development characteristics of water-conducting fractured zone in deep coal seam based on microseismic monitoring. Coal Geol. Explor. 2020, 48, 89–96. [Google Scholar]
  17. Duan, H. Analysis on Failure Features and Failure Depth of Coal Seam Floor During Mining Process. Coal Sci. Technol. 2014, 42, 17–20. [Google Scholar]
  18. Liu, X.; Chai, Z.; Liu, X.; Yang, Z.; Xin, Z. Study on pore fracture propagation and unloading failure characteristics of siltite under cyclic loads. J. China Coal Soc. 2022, 47 (Suppl. 1), 77–89. [Google Scholar]
  19. Enakoutsa, K. New applications of a generalized Hooke’s law for second gradient materials. Theor. Appl. Mech. Lett. 2015, 5, 129–133. [Google Scholar] [CrossRef] [Green Version]
  20. Meng, Q.; Zhang, M.; Han, L.; Pu, H.; Nie, T. Effects of acoustic emission and energy evolution of rock specimens under the uniaxial cyclic loading and unloading compression. Rock Mech. Rock Eng. 2016, 49, 3873–3886. [Google Scholar] [CrossRef]
  21. Steinke, C.; Kaliske, M. A phase-field crack model based on directional stress decomposition. Comput. Mech. 2019, 63, 1019–1046. [Google Scholar] [CrossRef]
  22. Rubin, M.B. A new approach to modeling the thermomechanical, orthotropic, elastic-inelastic response of soft materials. Mech. Soft Mater. 2019, 1, 3. [Google Scholar] [CrossRef] [Green Version]
  23. Komar, L.A.; Svistkov, A.L. Thermodynamics of Elastic Material with Relaxing Heat Flux. Mech. Solids 2020, 55, 584–588. [Google Scholar] [CrossRef]
  24. Li, H.; Liang, W.; Wang, J.; Cao, W.; Wu, P.; Ma, K.; Wei, J.; Li, J. Research on main controlling factors and its influencing laws on hydraulic fracture network in the fractured soft and low-permeability coal. J. Nat. Gas Sci. Eng. 2021, 95, 104147. [Google Scholar] [CrossRef]
  25. Li, A.; Ma, Q.; Lian, Y.; Ma, L.; Mu, Q.; Chen, J. Numerical simulation and experimental study on floor failure mechanism of typical working face in thick coal seam in Chenghe mining area of Weibei, China. Environ. Earth Sci. 2020, 79, 118. [Google Scholar] [CrossRef]
  26. Meng, X.; Liu, W.; Zhao, J.; Ding, X. In situ investigation and numerical simulation of the failure depth of an inclined coal seam floor: A case study. Mine Water Environ. 2019, 38, 686–694. [Google Scholar] [CrossRef]
  27. Chen, Y.; Zhu, S.; Wang, Z.; Li, F. Deformation and failure of floor in mine with soft coal, soft floor, hard roof and varying thicknesses of coal seam. Eng. Fail. Anal. 2020, 115, 104653. [Google Scholar] [CrossRef]
  28. Hu, Y.; Li, W.; Wang, Q.; Liu, S.; Wang, Z. Study on failure depth of coal seam floor in deep mining. Environ. Earth Sci. 2019, 78, 697. [Google Scholar] [CrossRef]
Figure 1. CT scanning image of rock failure mode and diagram of stress–strain relationship curve under pure compression and tension conditions.
Minerals 12 01511 g001
Figure 2. Rock mechanics experimental data under tensile load.
Minerals 12 01511 g002
Figure 3. Rock mechanics numerical simulation data under tensile load. (a) Numerical model; (b) Tensile load-displacement curve.
Minerals 12 01511 g003
Figure 4. Rock mechanics experimental data under compression load.
Minerals 12 01511 g004
Figure 5. Verification results of constitutive model.
Minerals 12 01511 g005
Figure 6. Location of Yushupo Coal Mine.
Minerals 12 01511 g006
Figure 7. Weak calcitized argillaceous dolomite of the floor in Yushupo Mine.
Minerals 12 01511 g007
Figure 8. Numerical calculation model.
Minerals 12 01511 g008
Figure 9. Distribution of roof stress and floor plastic zone under different mining advance distance. (a) Advancing distance is 100 m; (b) Advancing distance is 200 m; (c) Advancing distance is 300 m; (d) Advancing distance is 400 m; (e) Advancing distance is 400 m (cross section).
Minerals 12 01511 g009
Figure 10. Line layout of working face 5105. (a) 17# drilling site; (b) 19# drilling site.
Minerals 12 01511 g010
Figure 11. The relationship between strain and advancing distance of each measuring point in survey Line 1. (a) Strain change of each measuring points on Line 1; (b) Strain change of No. 19 measuring point; (c) Strain change of No. 21 measuring point; (d) Strain change of No. 33 measuring point.
Minerals 12 01511 g011aMinerals 12 01511 g011b
Figure 12. The relationship between strain and advancing distance of each measuring point in Line 2–5. (a) Line 4; (b) Line 2; (c) Line 3; (d) Line 5.
Minerals 12 01511 g012aMinerals 12 01511 g012b
Figure 13. Comparison between in-situ test and simulation results of working resistance of hydraulic support.
Minerals 12 01511 g013
Figure 14. Envelope line of floor failure depth of 5105 working face.
Minerals 12 01511 g014
Table 1. Material parameters.
E0/GPaμψσB/σU σ eq + / MPa σ eq / MPa
6.580.19281.323.8531.50
Table 2. Layout of measuring line and measuring point.
Drilling SiteLine NumberNumber of Measuring
Points
Measuring Point
Number
Measure-Point Distance/m
J1911818–34, 912.0
2181–7, 902.2
J1731135–453.3
41446–584.2
51459–726.1
6373–7533.4
71476–891.9
Publisher’s Note: MDPI stays neutral with regard to jurisdictional claims in published maps and institutional affiliations.

