1. Introduction
Weakly consolidated rocks are usually rich in clay minerals, which have low strength and high water sensitivity. When weakly consolidated rock encounters water, water molecules enter the interlayer and interparticle interfaces of the rock, resulting in the expansion of the cambium and interparticle and the destruction of the complete structure of the rock [
1,
2,
3]. During the mining coal working face process, the overburden of the coal seam deforms under the disturbance of mining. The pores and fractures in weakly consolidated rock mass expand, leading to significant changes in the mechanical properties and permeability characteristics of rock mass [
4,
5,
6]. After the changes in the rock permeability characteristics, the effect of seepage water leads to the deterioration of the macroscopic mechanical strength and microstructure of weakly consolidated rock [
7,
8,
9]. Therefore, it is of great significance for the safe and efficient mining of coal resources in weakly consolidated strata to study the rock seepage mechanism during coal mining in weakly consolidated strata and deeply analyze the seepage characteristics and influencing factors of weakly consolidated rock mass under mining-induced stress.
Yu et al. analyzed the change law of rock permeability with axial strain and volumetric strain in the whole stress–strain process, and deeply discussed the influence of the brittle–ductility transformation process of rock on permeability [
10]. Wang et al. observed the microstructure of sandstone, analyzed its mineral content, and summarized the seepage characteristics of sandstone in triaxial compression tests under different seepage pressure conditions [
11]. Wang et al. obtained the formula between the volumetric strain and permeability of rock by conducting triaxial seepage and stress coupling tests on low-permeability rock [
12]. Zhang et al. studied the permeability characteristics of soft rock under the action of periodically varying osmotic pressure [
13].
In order to understand the coal seam mining process, especially in the coal and rock stress path, and through the analysis of three typical mining methods, Xie et al. revealed the pressure distribution law of the front edge of the rock platform and determined the stress path characteristics of the dynamic environment of mining coal or rock, providing a basis for the laboratory testing of underground engineering rock mass. By studying the coupling mode of “stress field–fracture field–seepage field” in rock mass under different mining methods, a relationship between an increasing rate of permeability and volumetry strain was deduced [
14]. Miao et al. proposed the concept of “mining-induced rock mass mechanics” on the basis of analyzing the mining dynamic characteristics of layered rock mass, which provided an effective description for studying the seepage characteristics of rock mass under mining action and the seepage characteristics of rock mass destroyed after mining. Seepage experiments on the complete stress–strain process and the non-Darcy flow of post-peak rock and broken rock were carried out [
15]. Peng et al. used the triaxial rock mechanics test system to analyze the permeability change rule of sandstone in the whole stress–strain process and the porosity of rock under different confining pressures and found that both the porosity and permeability of rock decreased with an increase in the confining pressure [
16]. The above research results show the basic variation law of rock permeability under different conditions. However, the seepage characteristics of weakly consolidated formation rocks under mining stress are still relatively unknown. In particular, for the Jurassic coal measure strata rocks in Northwest China, due to their short petrogenesis time, loose cementation structure, and low mechanical strength, it is necessary to further study the variation rules and influencing factors of permeability so as to ensure the safety of mine production.
On the basis of previous studies, a triaxial compression permeability test was carried out using an MTS815 testing machine to study the deformation and permeability evolution of weakly consolidated rock under mining-induced stress by collecting Jurassic strata rock samples in the Ili mining area, China. In addition, the factors influencing the seepage characteristics of weakly cemented rocks were analyzed from the aspects of microstructure and mineral composition. These analyses are helpful for determining the seepage law of weakly consolidated rock and have important significance to guide coal mining in weakly consolidated strata.
3. Test Results and Analysis
3.1. Stress–Strain and Permeability Relationship of Weakly Consolidated Rocks
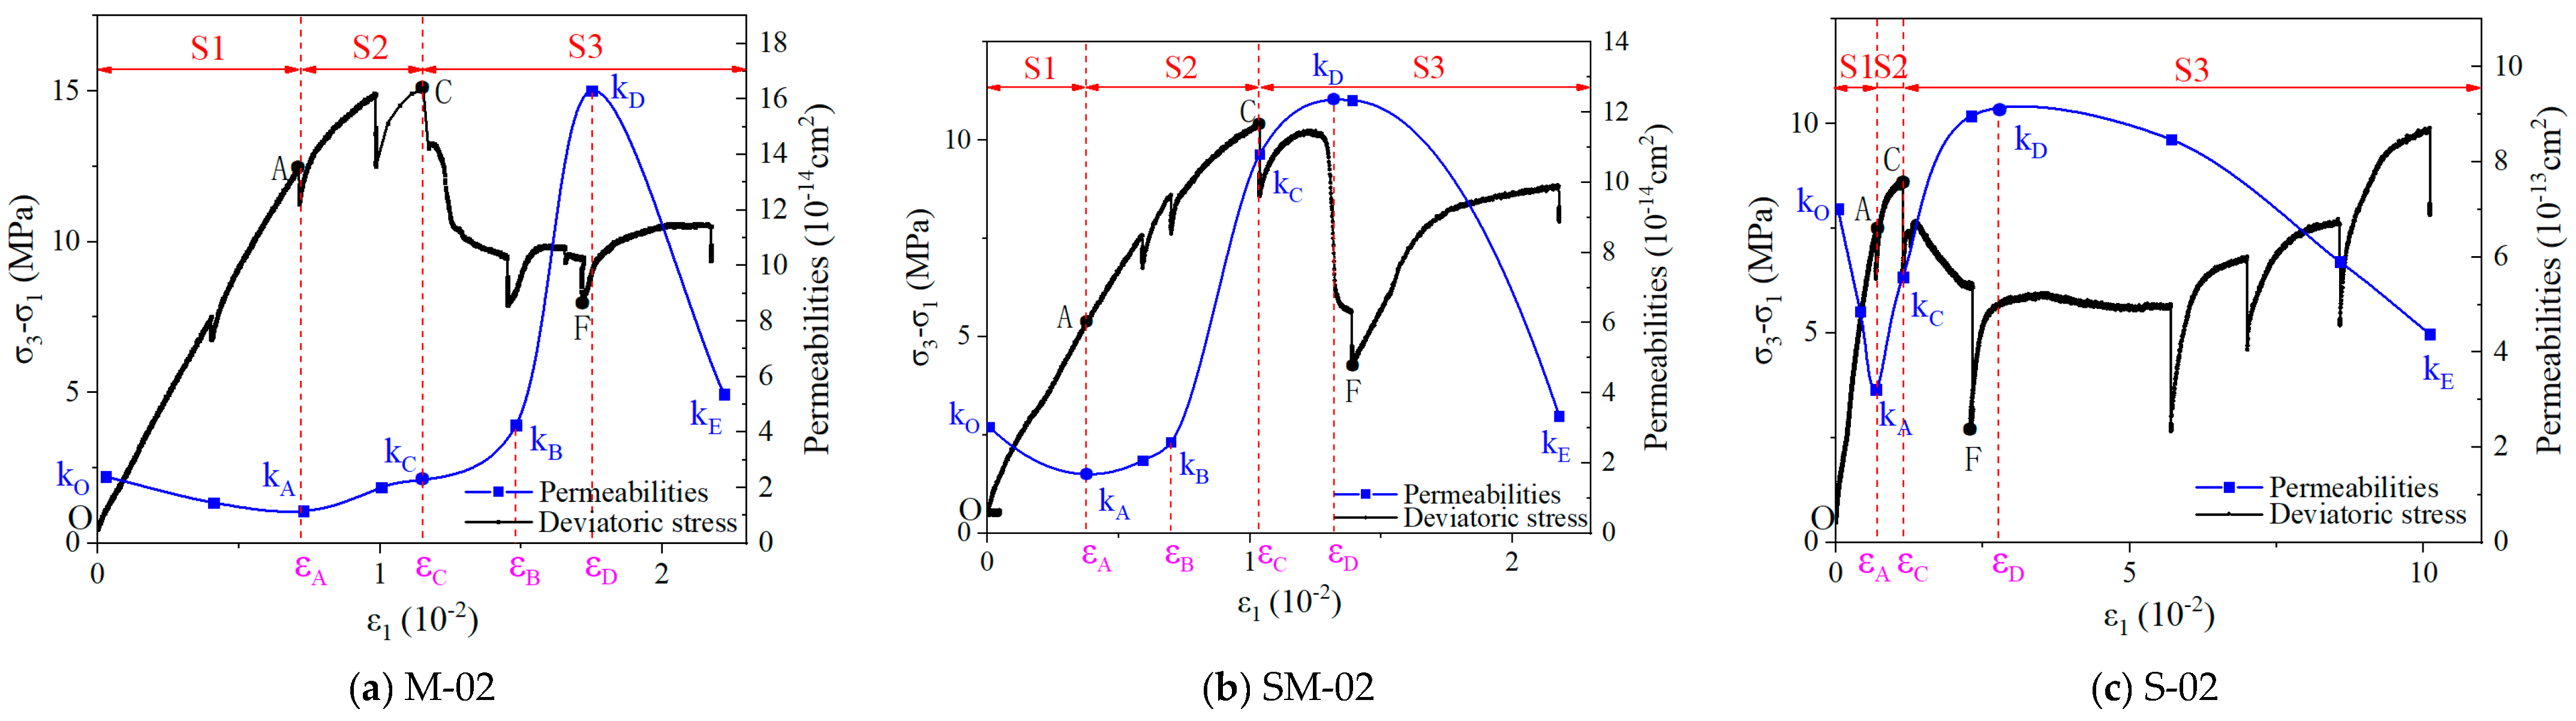
Figure 3 shows the stress–strain–seepage curve of the three types of rock samples under constant confining pressure loading, whereas
Figure 4 shows the stress–strain seepage curve of the three types of rock samples under mining-induced stress path loading. In order to characterize the permeability variation of rock samples during loading according to the triaxial compression deformation characteristics of rock, the experimental process was divided into three stages: volume compression stage (S1), yield stage (S2), and post-peak stage (S3), with the yield point and stress peak point as the boundary points [
2].
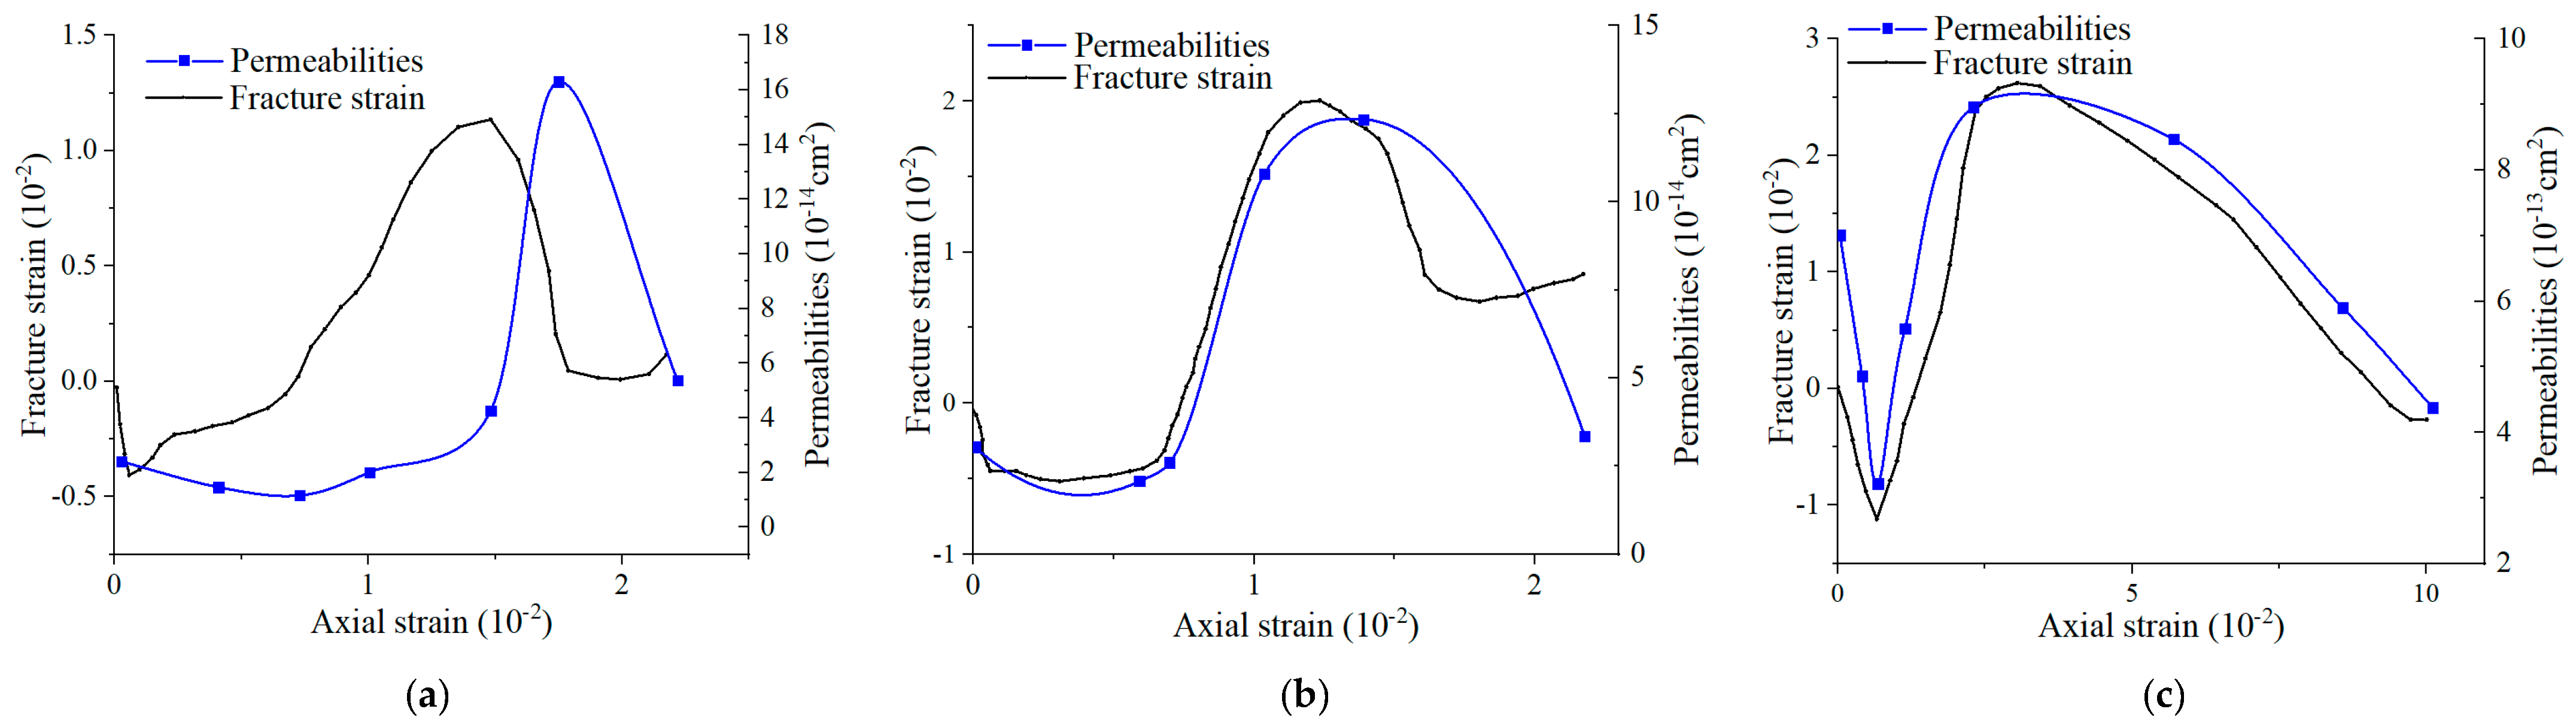
Under the condition of constant confining pressure, the permeability evolution of the weakly cemented rock samples had obvious stage characteristics with the rock deformation. (1) In the volumetric compression stage (S1), the internal primary pores and cracks of the rock sample gradually closed, and the permeability of the rock specimen gradually decreased until it reached the minimum value. (2) In the yield stage (S2), the internal microfractures of the rock sample gradually developed, the permeability of the specimen began to increase, the stress gradually reached the peak strength, and the rock sample was damaged. (3) In the post-peak stage (S3), penetration cracks caused by the failure of the specimens led to a rapid increase in permeability, and finally, the permeability of the sandstone and sandy mudstone gradually became stable, as shown in
Figure 3b,c, but mudstone permeability still increases gradually and does not reach the peak, as shown in
Figure 3a.
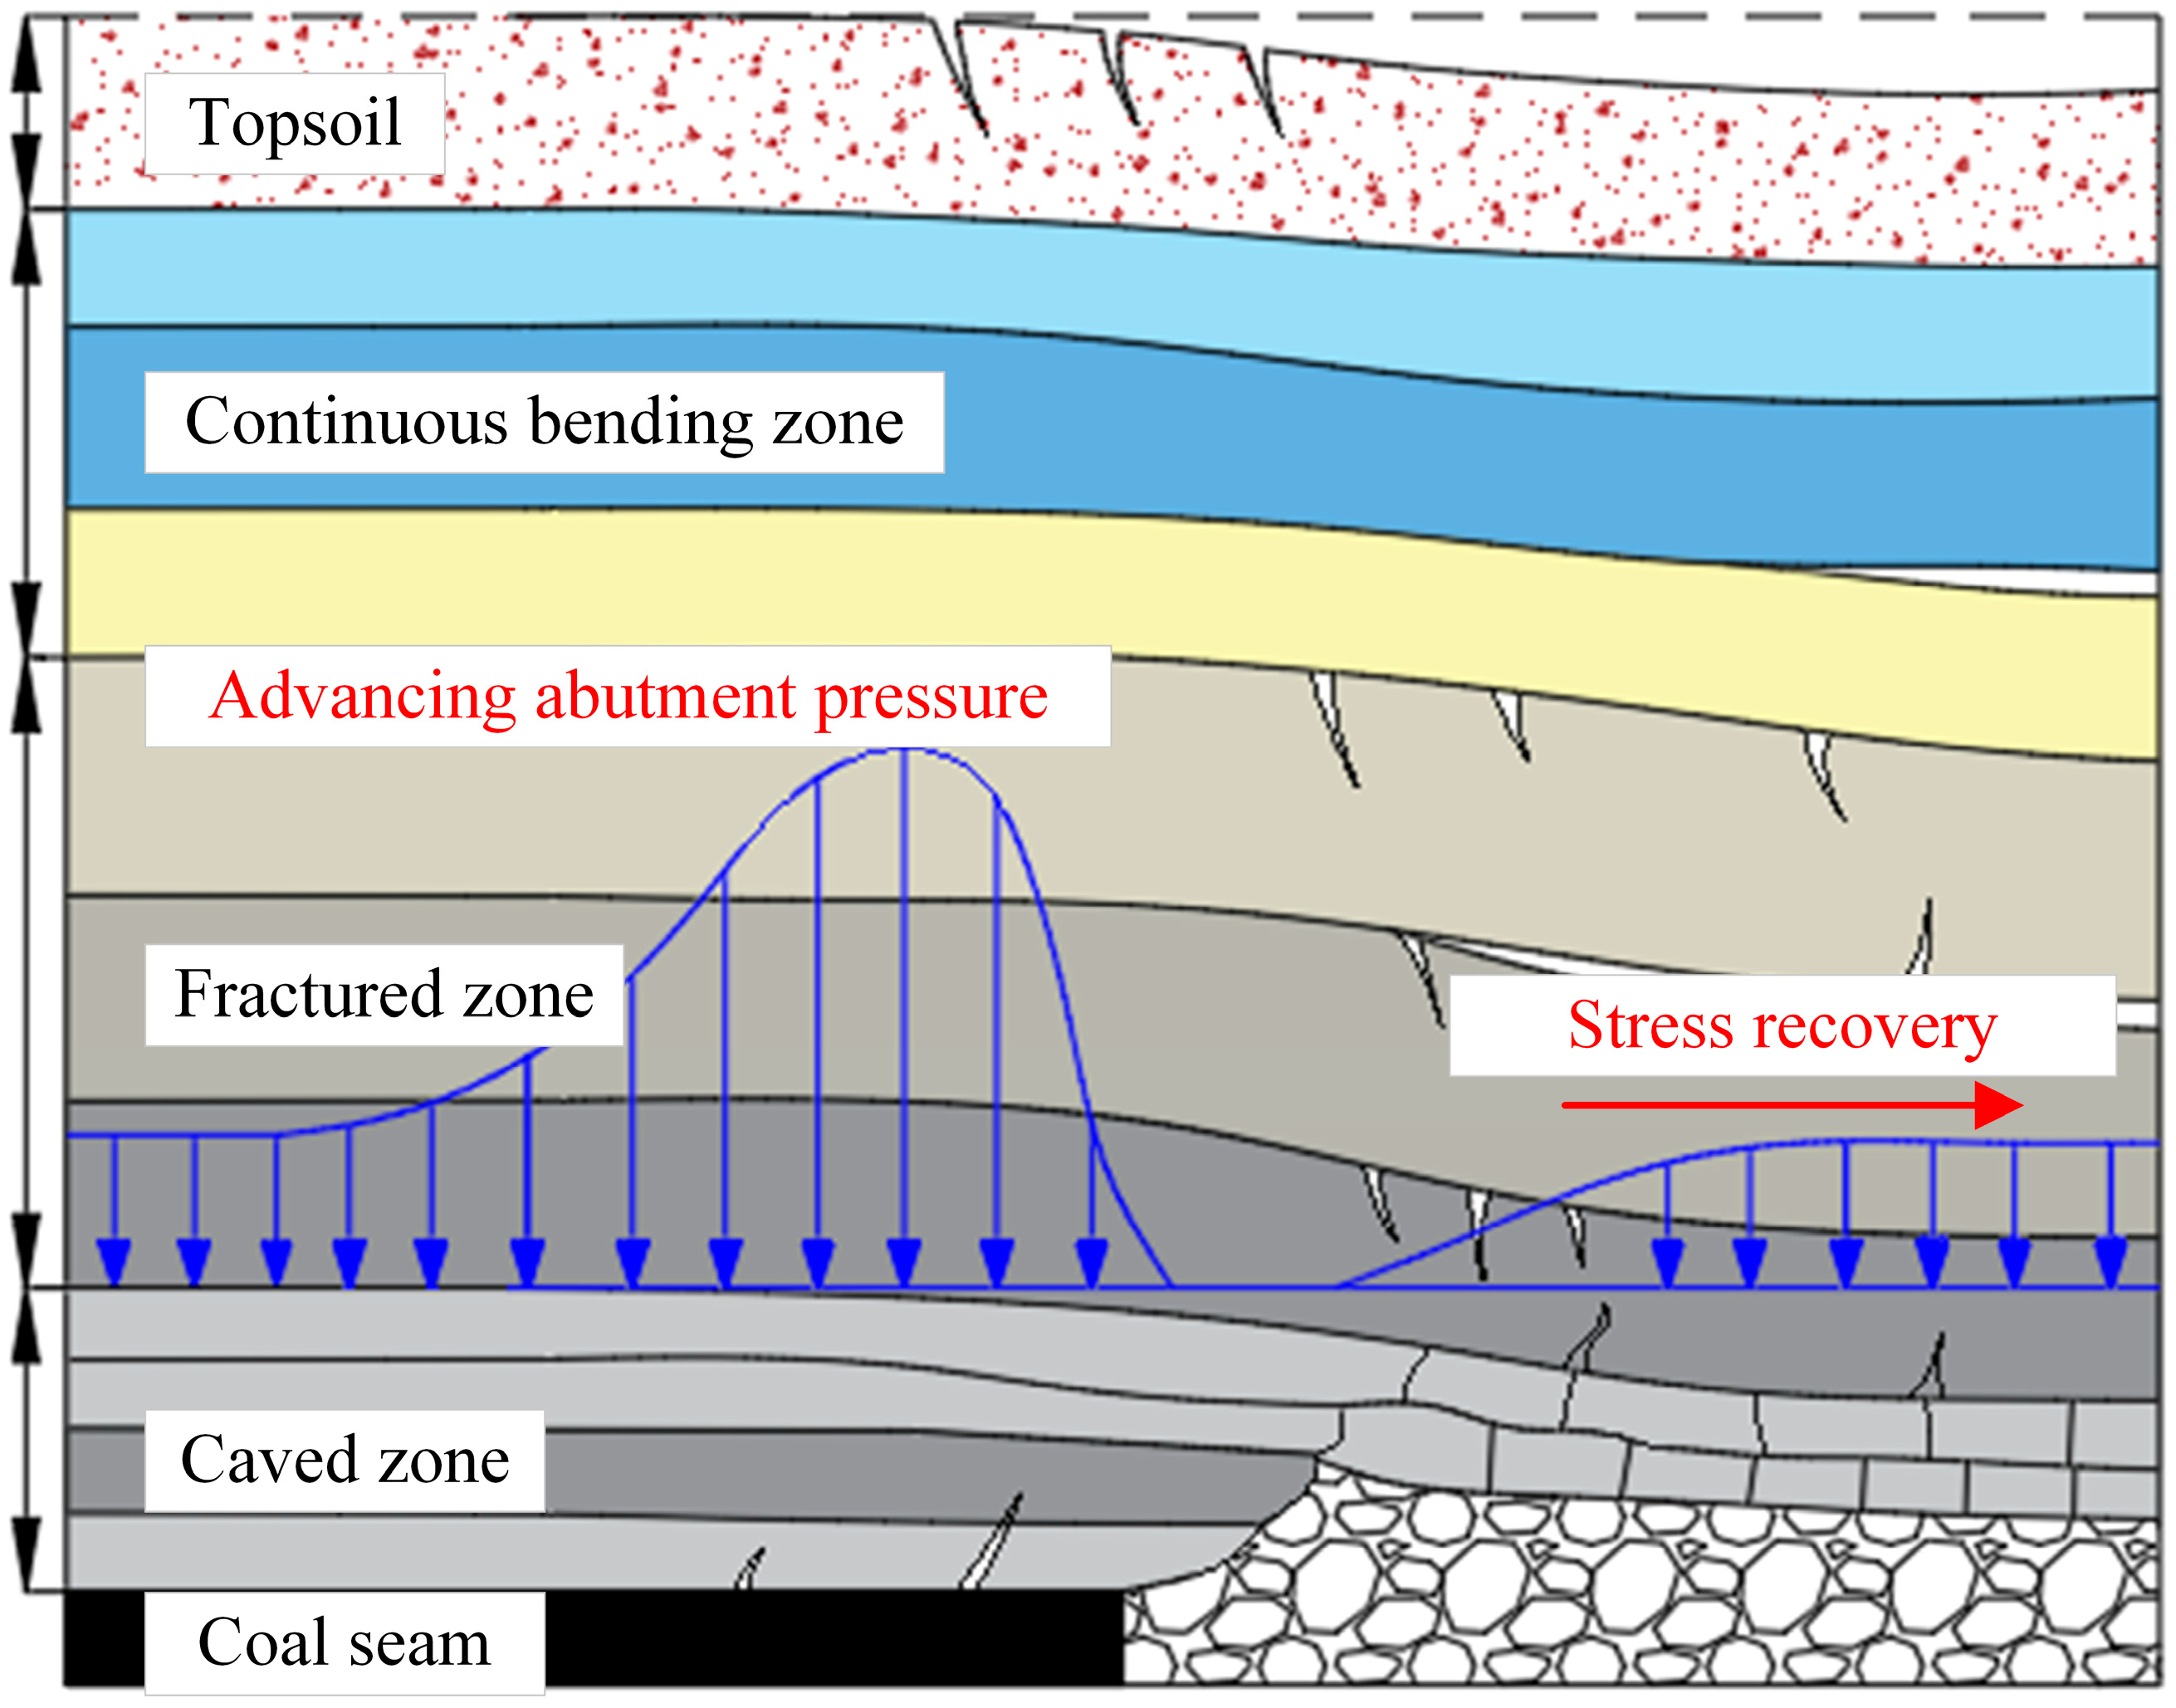
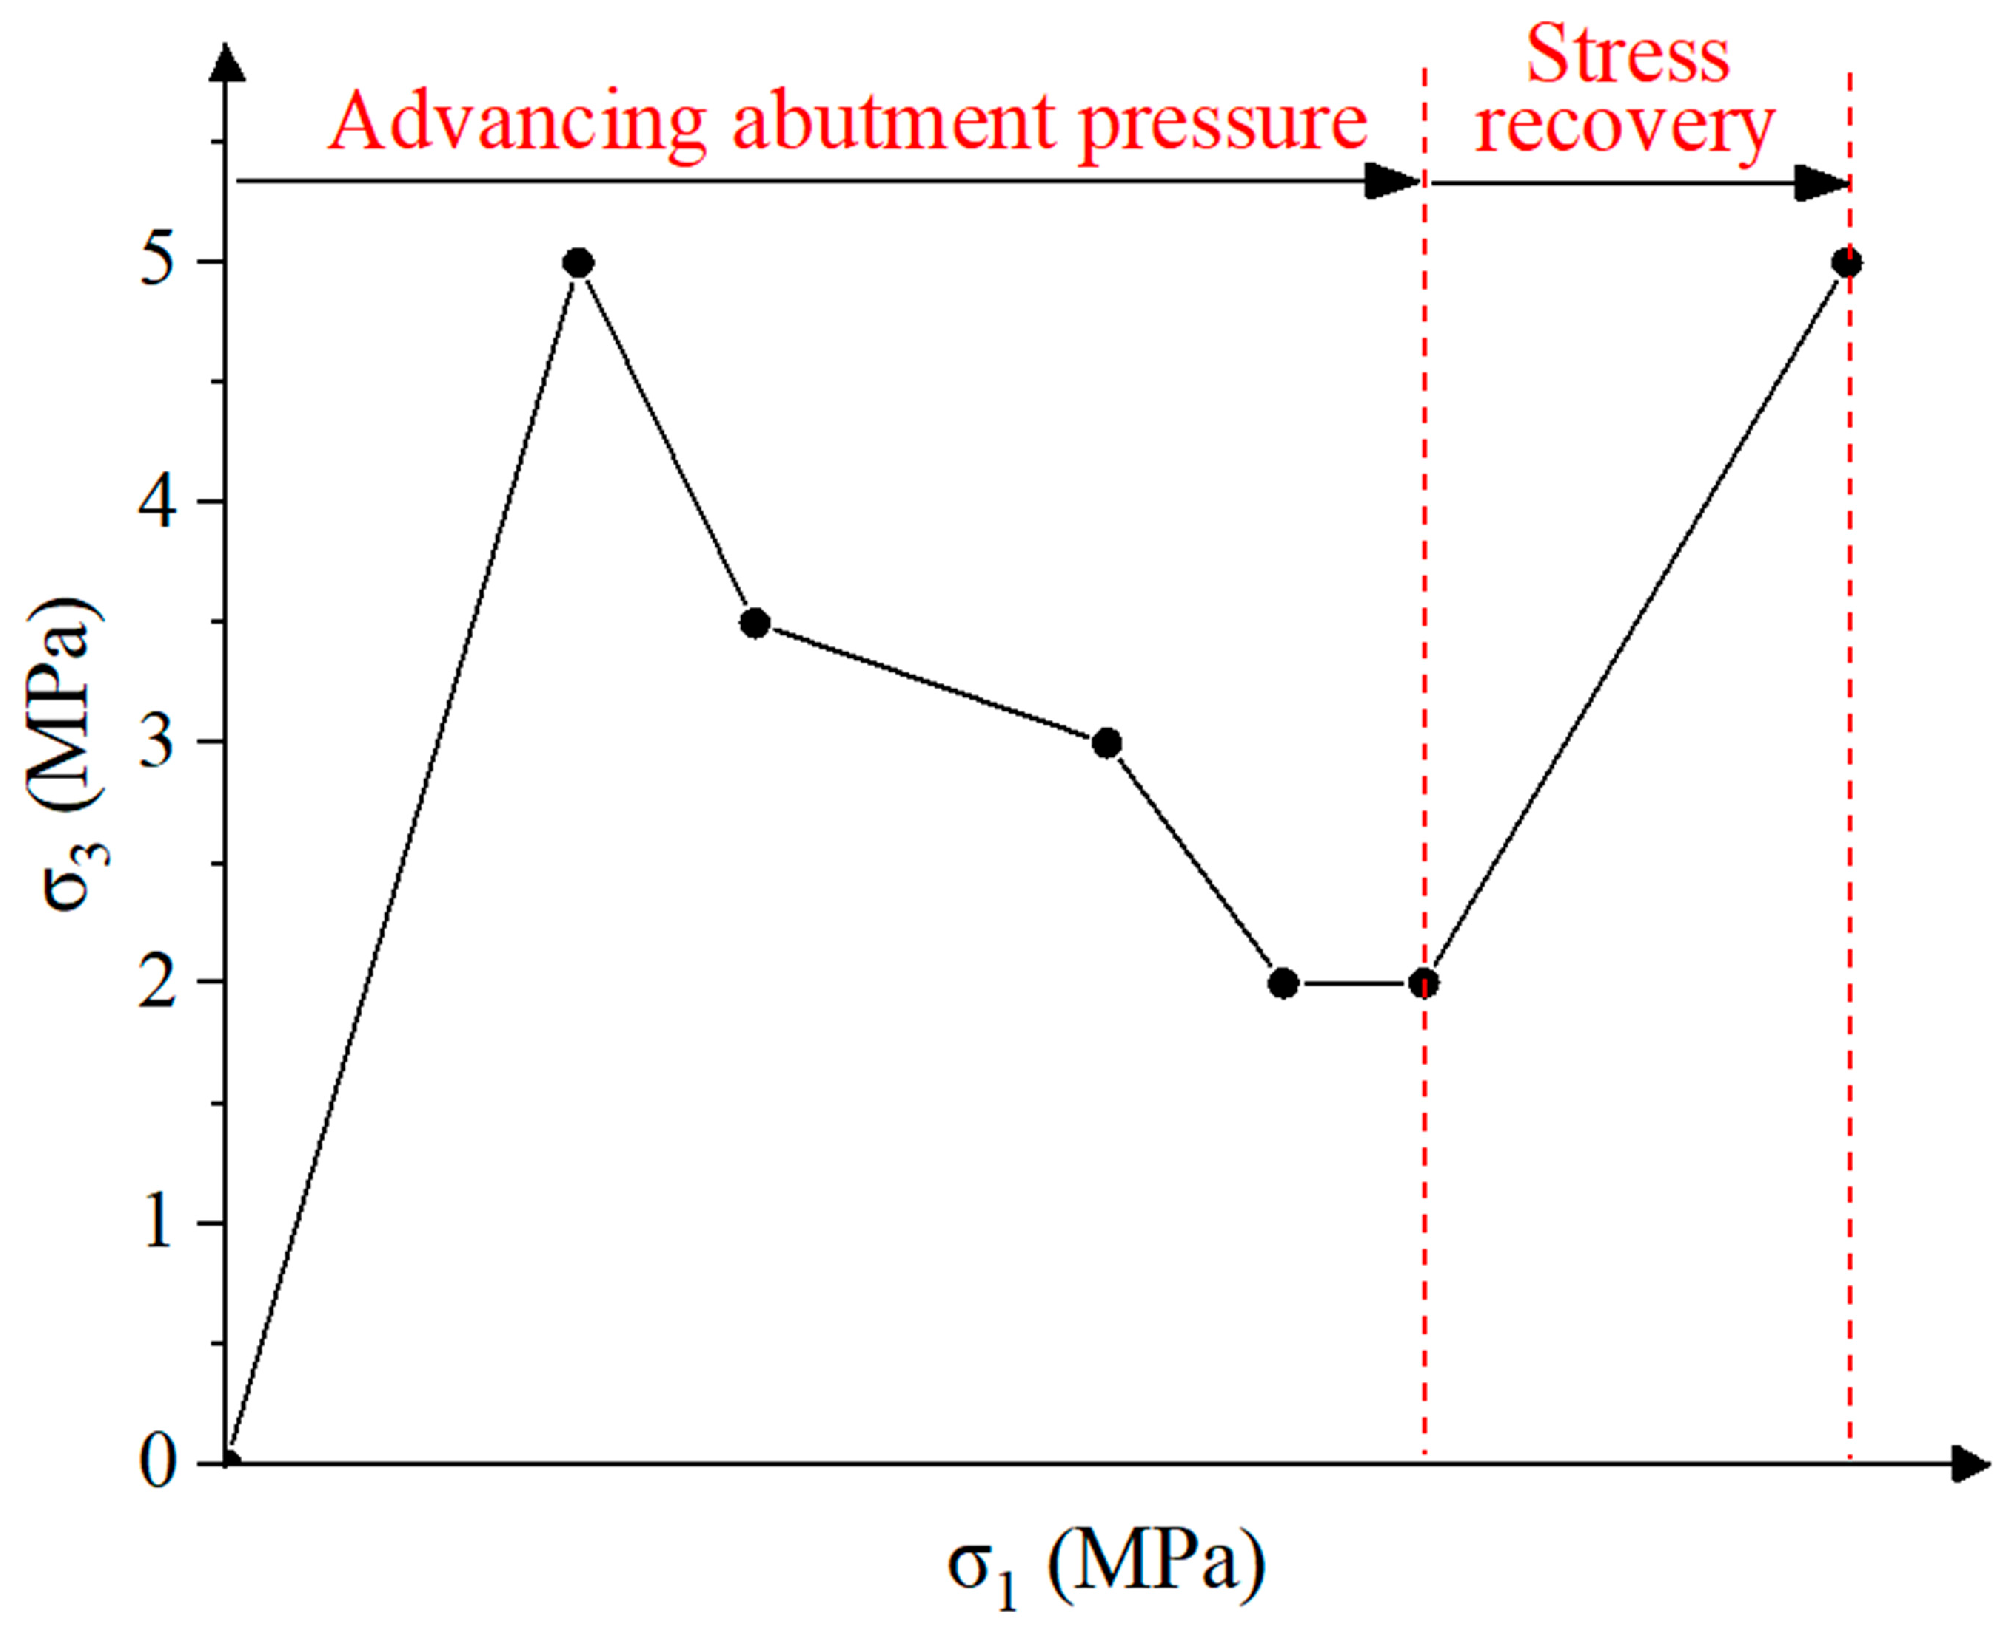
Compared to the seepage characteristics of the weakly consolidated rock samples under constant confining pressure, the permeability evolution under the mining-stress path had the following characteristics: (1) Under the mining stress, the strain in the volume compression stage of the weakly consolidated rock was less than 0.7%, which is relatively low compared to that under constant confining pressure. (2) The curve characteristics of the three kinds of rocks were quite different in the yield stage. At this stage, the fractures of the rock samples began to develop, and the permeability growth rate of mudstone was relatively slow, whereas those of the sandy mudstone and sandstone gradually increased. (3) The post-peak stage was mainly composed of the development process of penetrating fractures and the stress recovery process. When the rock sample reached the ultimate strength, failure occurred, and a large number of penetrating cracks were generated, which led to a rapid increase in the permeability of the rock sample. As the confining pressure of the rock samples began to increase, the volume of the rock samples began to compress gradually, and the stress of the rock samples also began to increase gradually. The internal spreading cracks and penetrating cracks of the rock samples began to close slowly, which led to a gradual decrease in the permeability of the rock samples.
In order to characterize the relationship between the stress–strain and permeability of the weakly consolidated rock, the permeability of six points, namely the initial point, yield point, mutation point, peak stress point, peak permeability point, and end point, are respectively represented by k
0, k
A, k
B, k
C, k
D, and k
E.
εA,
εB,
εC, and
εD are the strain values of the corresponding points. The strain ratio at the yield point (R
y), the strain ratio at the failure point (R
f), and the ratio of the permeability growth rate (R
p) of the two loading methods are shown in
Table 2.
The permeability evolution characteristics under the two loading paths were compared, and the effects of mining-induced stress path loading on the permeability and strain were significant. The ratios of the strain at the yield point under mining-induced stress to the strain at the yield point under constant confining pressure (Ry) were 0.33, 0.43, and 0.79 for the mudstone, sandy mudstone, and sandstone, and the ratios of the strain at the failure point under mining-induced stress to the strain at the failure point under constant confining pressure (Rf) were 0.48, 0.52, and 0.72, respectively. The above results show that the mining-induced stress path loading mode promoted the fracture development rate of the weakly consolidated rock, making the rock reach the yield point faster and causing the rock sample to be more prone to failure. In the process of failure, the growth rate of the rock permeability was greatly increased. The permeability growth rates of mudstone, sandy mudstone, and sandstone under mining stress (Rp) were 54.74 times, 4.15 times, and 3.39 times that of the rock under constant confining pressure, respectively. The permeability of the weakly consolidated rock was significantly affected by confining pressure and had a negative correlation with it.
3.2. Failure Morphology Analysis of Weakly Consolidated Rock Samples
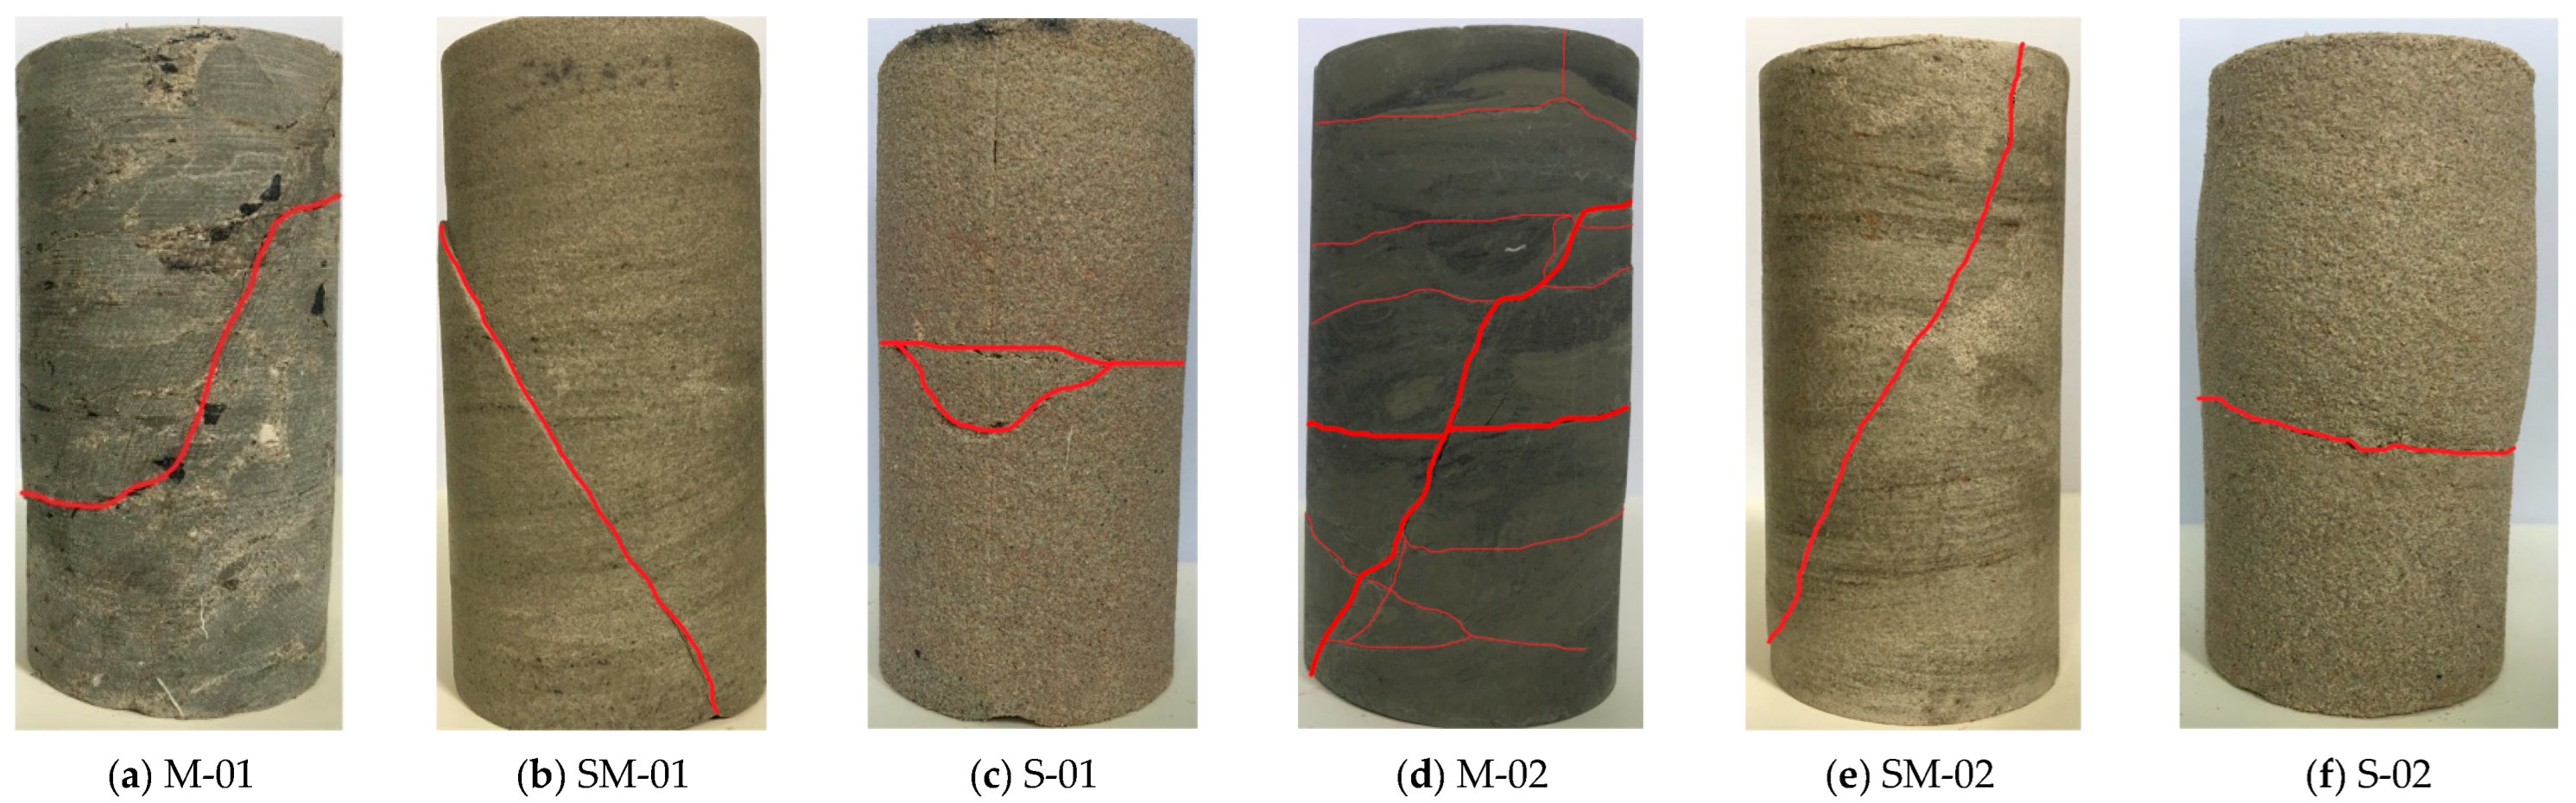
The failure patterns of the mudstone, sandy mudstone, and sandstone samples under the two loading modes are shown in
Figure 5. Under the condition of constant confining pressure, the failure form of the mudstone was mainly shear failure, and the specimen had many small cracks caused by the fracture, as shown in
Figure 5a. The failure mode of the sandy mudstone was mainly shear failure, and the main fracture sloped upward from the bottom after testing, as shown in
Figure 5b. There were two gentle shear cracks in the middle of the sandstone, and obvious plastic extrusion occurred. The integrity of the rock sample was relatively good, and the ratio of the residual strength to the peak strength was high, as shown in
Figure 5c.
Under the condition of mining-induced stress, the mudstone sample had several fractures mainly characterized by tension–shear failure, as shown in
Figure 5d. A shear failure fracture with an angle of 60° between the sandy mudstone and the horizontal plane appeared, as shown in
Figure 5e. In addition to the shear failure of the sandstone, which was mainly caused by the micro-inclined fracture in the middle, there were also obvious expansion phenomena, such as plastic extrusion, as shown in
Figure 5f.
By comparison, it was found that the failure degree of the mudstone was high under mining-induced stress, and the number of cracks in the whole rock sample was significantly higher than that in the mudstone sample under constant confining pressure. The failure angle of the sandy mudstone increased obviously, and the fracture ran through the whole rock sample. The plastic deformation of the sandstone was obvious, and the capacity of the circumferential expansion increased.
3.3. Seepage Characteristics of Weakly Consolidated Rock under Mining-Induced Stress Path
According to the test results of the stress, strain, and permeability of the three kinds of samples, it can be seen that the loading mode of the mining-induced stress path had a significant influence on the strain–seepage characteristics of the weakly consolidated rock. In addition, the seepage characteristics of the mudstone, sandy mudstone, and sandstone under the action of mining stress were also obviously different. In order to directly reflect the seepage characteristics of the mudstone, sandy mudstone, and sandstone under mining operation, the maximum permeability growth factor (M), the magnitude of the change in permeability (N), and permeability recovery rate (Pr) were defined to describe the permeability curve change characteristics. The maximum permeability increase factor is M = kD/k0; the magnitude of the change in permeability is N = (kD − kA)/k0; the permeability recovery rate is Pr = (kD − kE)/(εE − εD).
As can be seen in
Table 3, the initial permeability (k
0) rates of the mudstone, sandy mudstone, and sandstone were 2.40 × 10
−14cm
2, 3.03 × 10
−14cm
2, and 7.01 × 10
−13cm
2, respectively. The initial permeability of the mudstone and sandy mudstone was less than 1.00 × 10
−13cm
2, indicating that the unfractured mudstone and sandy mudstone had lower permeability and better water isolation performance [
2]. By comparison, the permeability change range and permeability recovery rate of the three types of rocks were different, and they decreased in the order of mudstone, sandy mudstone, and sandstone. The maximum permeability growth times (M) of the three samples were 6.79, 4.09, and 1.28, respectively, and the magnitude of the change in permeability (N) were 6.33, 3.40, and 0.82, respectively. This shows that the lower the initial permeability of weakly cemented rock is, the greater the permeability variation.
In the stress recovery stage, the permeability of the mudstone and sandy mudstone could recover quickly, whereas the process of the sandstone returning to the original rock stress was relatively slow. The permeability recovery rates (Pr) of the mudstone, sandy mudstone, and sandstone were 2.35 × 10⁻¹¹ cm2, 11.18 × 10⁻¹² cm2, and 5.86 × 10⁻¹² cm2, respectively. It can be seen that the permeability recovery rates (kE) of the mudstone, sandy mudstone, and sandstone decreased successively. The permeability rates of the mudstone and sandy mudstone after restoration were 5.32 × 10⁻¹⁴ cm2 and 3.25 × 10⁻¹⁴ cm2, and the permeability after restoration was greater than the initial permeability. However, the permeability of the restored sandstone was 4.37 × 10⁻¹³ cm2, which is less than the initial permeability.
3.4. Permeability Hysteresis Analysis of Weakly Consolidated Rock under Mining-Induced Stress Path
It can be seen in
Figure 4 that the permeability curves of the mudstone and sandy mudstone first experienced a period of slow growth, whereas the sandstone did not have this stage. The permeability surge point of the mudstone was after the stress peak point. The permeability spike point of the sandy mudstone was before the stress peak. The permeability spike point of the sandstone basically coincided with the yield point before the stress peak. This shows that the permeability of the mudstone and sandy mudstone lagged behind the fracture state of the rock. According to the crack strain model [
19,
20], the permeability of the rock is mainly affected by the degree of crack development. For rock specimens under triaxial compression, the volumetric strain
εv can be expressed as:
where
ε1 and
ε3 are the axial and annular strains of rock, respectively.
The volume strain can be divided into two parts: one is the volume strain
εcv caused by crack closure, initiation, opening, and penetration during loading. The other part is the elastic volumetric strain
εev at the same stress level. The crack volumetric strain can be obtained by subtracting the elastic volumetric strain from the total volumetric strain, and the calculation formula is:
where E is the elastic modulus and the average slope of the stress–strain curve is taken. The elastic modulus of mudstone, sandy mudstone, and sandstone is 1.49 GPa, 1.08 GPa, and 0.83 GPa, respectively;
ν is Poisson’s ratio,
ν =
ε3/
ε1;
σ1 and
σ3 are the axial and lateral stresses, respectively.
Figure 6 shows the volumetric strain curves of the fractures in the mudstone, sandy mudstone, and sandstone under mining-induced stress. It can be seen that the fit degree of the crack volume–strain curve and the permeability curves of the mudstone, sandy mudstone, and sandstone increased successively. The permeability curve of the mudstone lagged behind the volume–strain curve of the rock crack, indicating that the permeability of the mudstone did not increase rapidly after the development of cracks, and there was a strong lag in the change of mudstone permeability.
4. Analysis of Influence Factors on Seepage Characteristics of Weakly Consolidated Rocks
The permeability changes of the mudstone, sandy mudstone, and sandstone were different at each stage of the mining stress, and there was a strong lag in the mudstone. In order to explore the factors affecting the permeability characteristics of the weakly consolidated rocks, X-ray diffraction (XRD) and scanning electron microscopy (SEM) were used to further study the mineral composition and microstructure of the three kinds of rocks.
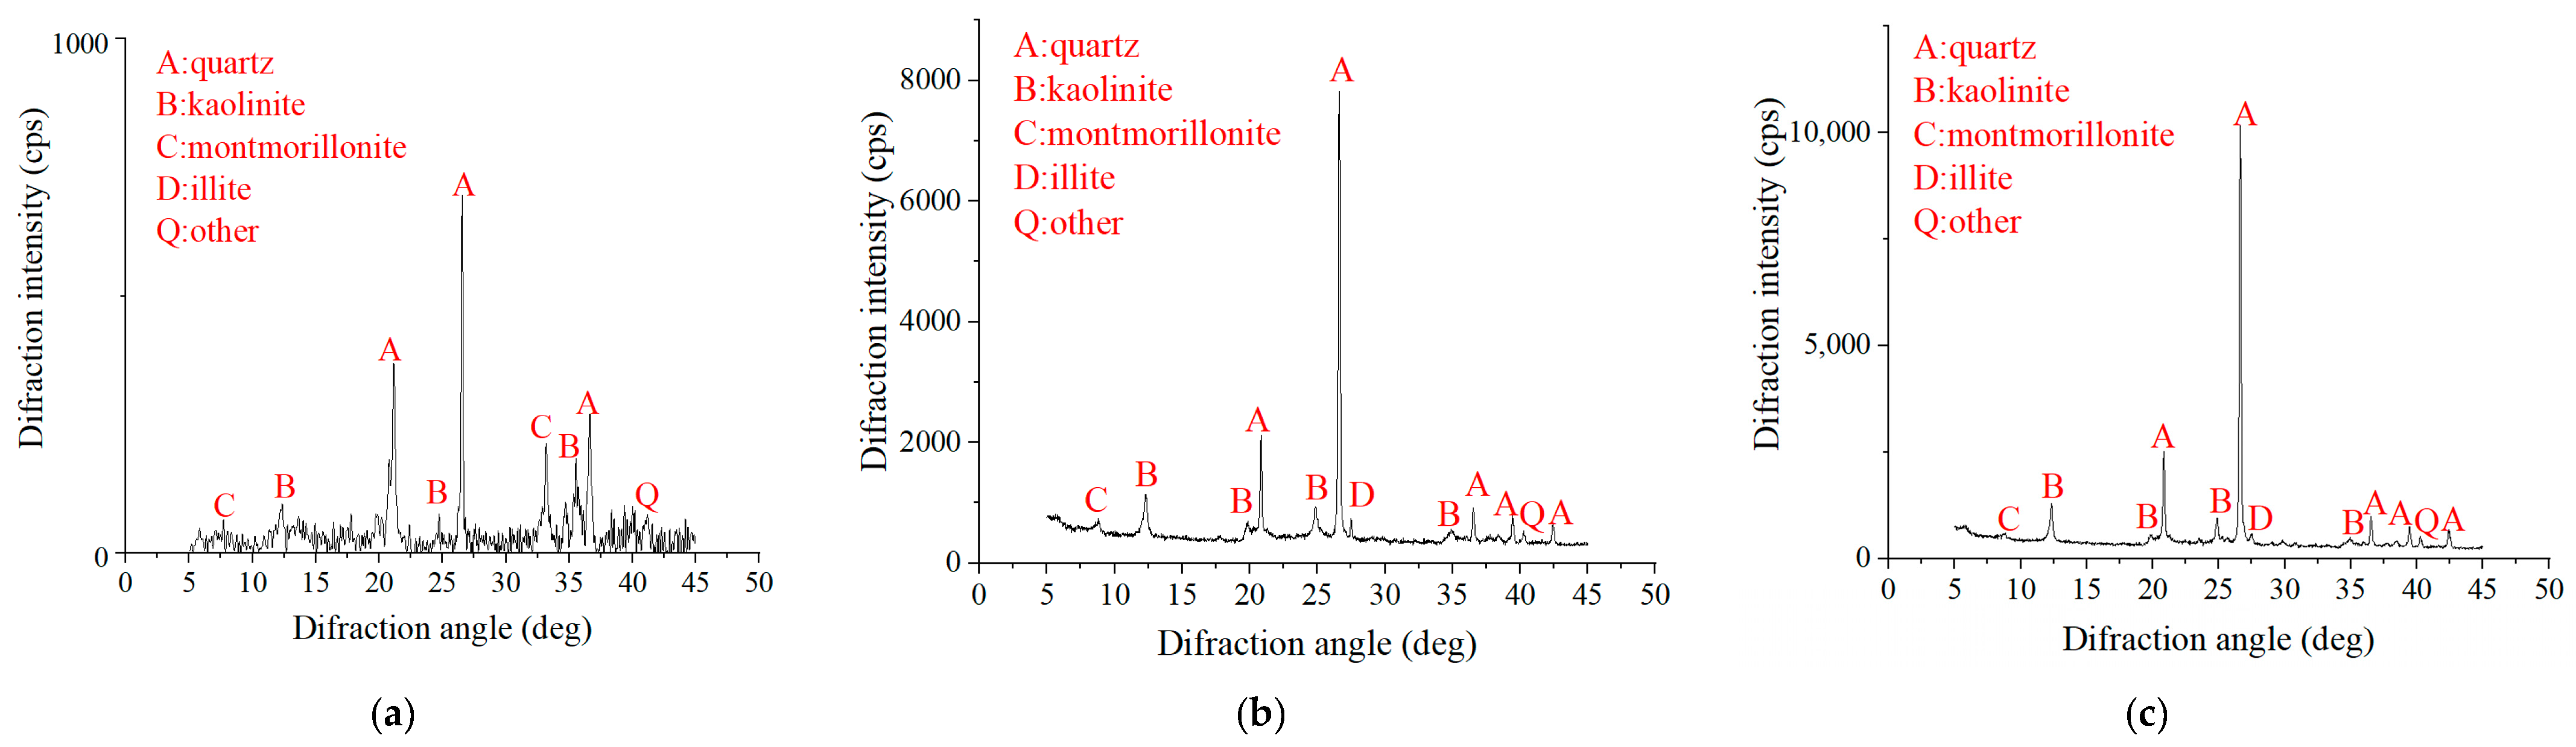
An XRD test was used to analyze the mineral components of the weakly consolidated mudstone, sandy mudstone, and sandstone, and the diffraction pattern is shown in
Figure 7. The XRD test results show that the mudstone was rich in clay minerals, such as kaolinite, montmorillonite, and illite, whereas the sandy mudstone and sandstone were dominated by kaolinite and illite. The contents of clay minerals in the three samples are shown in
Table 4. The proportions of clay minerals in the mudstone, sandy mudstone, and sandstone were 71%, 36%, and 25%, respectively. The clay minerals of the mudstone were mainly composed of kaolinite, an illite/montmorillonite mixed layer, and illite, accounting for 30.53%, 34.79%, and 5.68% of the total clay minerals, respectively. Kaolinite was the main clay mineral in the sandy mudstone, and its clay mineral content was 24.84%. Kaolinite was the main clay mineral in the sandstone, and its content was 17.25%. The clay mineral content of the mudstone was 1.97 times that of the sandy mudstone and 2.84 times that of the sandstone. The clay mineral content of the mudstone, sandy mudstone, and sandstone decreased successively, whereas the permeability increased gradually, indicating that the permeability and clay mineral contents had a negative correlation.
The SEM results of the weakly consolidated mudstone, sandy mudstone, and sandstone are shown in
Figure 8. There were certain primary pores in the weakly cemented rocks. The structure of the rock mineral particles was loose and the outline is clearly visible. The clastic fillings were filled in the pore structure, and the cementation type was mainly pore-filling cementation. Under the magnification of 2000 times, it was observed that the internal structure of the sandstone was loose and there were many pores. The particle size of the sandstone was large, mainly distributed between 20 and 75 μm, and the particles were disordered. It can be clearly seen that the flocculent montmorillonite was distributed on the particle surface and the bulk kaolinite was filled in the pores. Compared to the sandstone, the internal structure of the sandy mudstone was closer, with a small number of pores, and the particle size was mainly distributed between 8 and 15 μm. The internal structure of the mudstone was dense, but there were also a few tiny pores, and the particle size was small, mainly distributed between 5 and 12 μm. When magnified to 8000 times, it was observed that the maximum pore spacing of the sandstone was 30.02 μm, a small amount of a flocculent illite/montmorillonite mixed layer filled in the pores, and the particle cementation degree was poor. The pore spacing of the sandy mudstone was 15–23 μm, and there was a lot of flocculent illite/montmorillonite mixed layer filling between the pores. The pore spacing of the mudstone was 21.78 μm, and the pores were small. There was also a lot of flocculent illite/montmorillonite mixed layer and flake illite on the surface of the rock sample, and the particle cementation degree was good.
The content of clay minerals in the sandstone was small, its structure was loose, and it had many internal pores. However, the mudstone had high clay mineral content and a dense internal structure, which may be the main factors leading to the low permeability and strong water isolation performance of mudstone. Due to the loose structure and voids in the rock samples, the rock was compressed after the triaxial compression test began, resulting in the initial permeability of most rock samples being more than twice the minimum permeability. Under the mining-induced stress path, the pore structure of the mudstone and sandy mudstone first transformed from the compact state to the loose state, and gradually recovered after the stress recovery. However, the permeability of the rock sample after the stress recovery was greater than the initial permeability because the integrity of the rock sample was destroyed by the penetrating cracks. There were many pores and large pore spacing in the sandstone, and the decrease in the pore spacing in the sandstone after stress recovery led to the final permeability being less than the initial permeability.
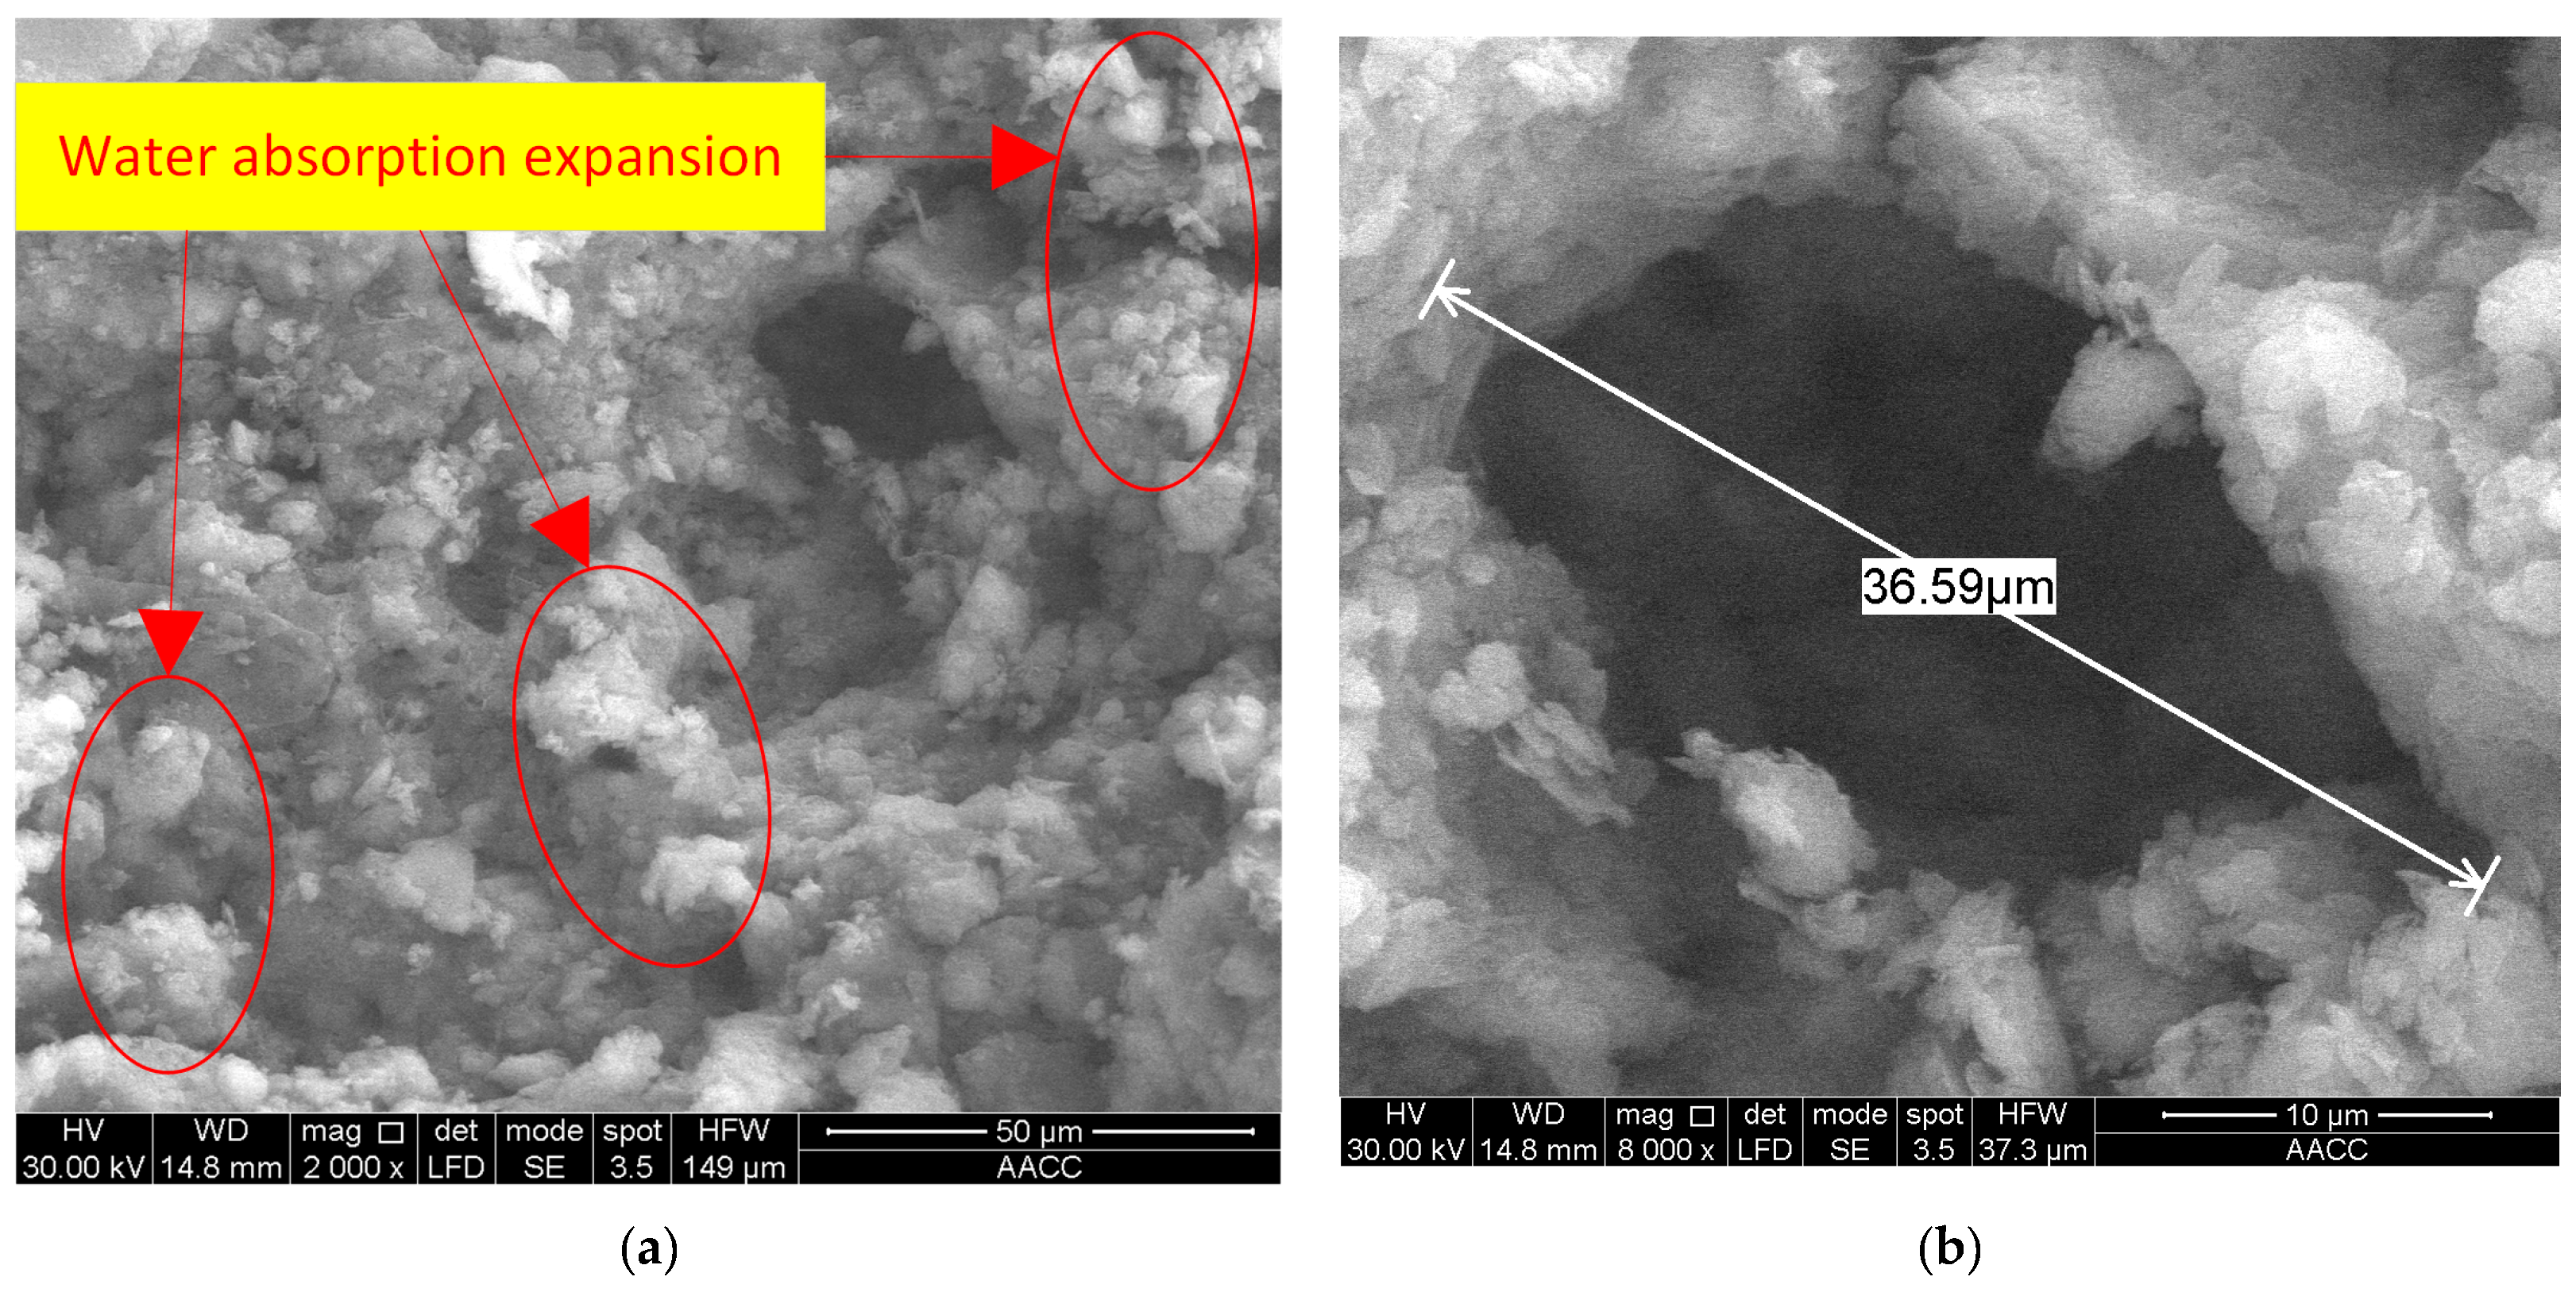
Due to the high clay content of the rock samples, they easily reacted with water. In order to study the change characteristics of the microstructure of the rock after water exposure, scanning electron microscopy (SEM) was used to study the microstructure of the saturated water samples.
It can be observed in
Figure 9 that the surface of the sandy mudstone was very uneven under the condition of the saturated water, and some large particles (20–40 μm) were exposed. The internal structure was relatively close, but there were many pores. The larger pores had less filling, and the smaller pores had more filling between the particles. The surface of the mudstone was not very smooth in the saturated state, and some large particles (10–20 μm) were exposed. Compared to the mudstone samples in the natural state, the internal structure was relatively compact, a large amount of filling existed between the pores and the particles, and there was no pore larger than 20 μm at 8000 times magnification. By comparing the SEM images of the natural state and the saturated state, the following was found: (1) The white flocculent montmorillonite expanded in the saturated state of the mudstone and sandy mudstone. (2) The surface of the mudstone and sandy mudstone was rough under saturated conditions, whereas the surface was relatively smooth and compact under natural conditions. (3) In the saturated state, the clay minerals of the mudstone and sandy mudstone moved with the water flow and filled into the smaller fractures.
Because clay minerals exhibit obvious expansion and slime characteristics when encountering water, clay minerals will disperse and migrate under the action of water [
21]. Combined with weak cemented rock in the process of the triaxial compression test, the factors affecting the permeability lag are as follows: (1) The volume compression stage, which gradually occurred in the sample of natural pore closure, did not yet form a new crack. The second infiltration of water caused the clay minerals to expand, and the mud, after the expansion of the clay minerals filled in the primary pores. As a result, the permeability gradually decreased until the minimum permeability was reached. The higher the clay mineral content, the longer the clay mineral expansion and the mud process lasts. (2) When entering the yield stage, fractures developed gradually, leading to a gradual increase in permeability. However, the development of cracks caused the clay minerals to make contact with the water more fully, which made the clay minerals expand and migrate, thus blocking the seepage channel. Therefore, in the yield stage of mudstone and sandy mudstone, the permeability first increased steadily, and then increased rapidly with the rock failure to a certain extent, whereas the sandstone did not have a stable growth process.
In conclusion, in the triaxial compression permeability test, the weakly cemented rock mainly shows the following two characteristics: on the one hand, the mechanical strength of the rock is greatly reduced after water immersion; on the other hand, with the development of cracks, the interaction between clay minerals and water becomes more sufficient, which leads to the hysteresis of rock permeability curve and affects the seepage characteristics of the rock. The content of clay minerals determines the degree of hysteresis and the seepage characteristics of the rock mass.


