Article

Petrophysical Database for European Pegmatite Exploration—EuroPeg

1
Geological Survey of Norway, 7040 Trondheim, Norway
2
terratec Geophysical Services GmbH & Co. KG, 79423 Heitersheim, Germany
*
Author to whom correspondence should be addressed.
Minerals 2022, 12(12), 1498; https://doi.org/10.3390/min12121498
Submission received: 3 November 2022 / Revised: 18 November 2022 / Accepted: 21 November 2022 / Published: 24 November 2022
(This article belongs to the Special Issue Petrology and Mineralogy of Pegmatite Deposits)

Abstract

:
Granitic pegmatites contain natural concentrations of a variety of raw materials invaluable for modern technologies and a green and sustainable society. The most abundant ones are silicon for high-purity quartz applications, and indispensable lithium for today’s batteries. However, the exploration of these target materials in Europe is underdeveloped, causing high dependencies on non-European supply chains. The European Commission Horizon 2020 project GREENPEG (GA no. 869274) is addressing the exploration of buried, small-scale pegmatite deposits in Europe through the development of innovative new exploration toolsets. One component of these toolsets is petrophysical data of pegmatite ores and their wall rock. These data are essential to supplement and ground-truth non-invasive geophysical investigations and deposit modeling. Both important tools in mineral exploration can then be used in a more targeted and cost-effective way. Petrophysical parameters measured on drill core and field samples and acquired through geophysical borehole logging are compiled in the first database for European Pegmatite deposits: EuroPeg_PetroDB. Samples are supplemented with meta-information, and the database is comprehensively structured in an easy-to-use format. Supporting the initiative of FAIR data, EuroPeg is freely accessible on an open data repository. The sample content and petrophysical measurements are described, followed by the structure and usability of the database.

1. Introduction

Granitic pegmatites are resource-rich deposits and are especially valuable for the so-called green technologies and the transition to more sustainable energy. The deposits have natural concentrations of Li, high-purity quartz for silica and metallic Si, ceramic feldspar, rare earth elements, Ta, Be, and Cs. Silicon is essential for photovoltaics and the growing demand of Li-ion batteries in all their applications relies on an increasing supply of Li. Europe depends heavily on the global market, dominated by China, Australia, the USA, and African countries, posing a risk to the European economy [1].
In Europe, these deposits are underexplored. One of the reasons is that pegmatites are commonly considered as geophysically invisible because the physical property contrasts between pegmatites and their wall rocks are too small to distinguish using geophysical methods. Because pegmatites are generally non-magnetic, have no distinctive density, and contain insufficient metallic minerals to be conductive ([2,3,4] and citations therein), an entire branch of usually important geophysical exploration methods (e.g., gravity, magnetic, and electromagnetic surveys) is rendered potentially unsuitable. However, a few studies have reported that geophysical methods were successfully used to locate pegmatites, specifically mineralized zones within a pegmatite. Trueman and Černý (1982) [5], for example, showed that they could clearly distinguish the wall zones from the spodumene-rich core in the Canadian Tanco pegmatite using gravity measurements. The spodumene-rich core showed a high gravity in comparison to the wall rocks. Gupta and Wadge (1986) [6] described a gravity survey used to model the size, location, and dip direction of the pegmatite-bearing Allison Lake batholith. These measurements and the following modeling facilitated the definition of the “pegmatite zone” itself at the province to district scale. The applicability of different methods depends strongly on the overall setting. Most of the time, geophysical methods are indirectly used to locate pegmatites. Especially in early-stage exploration, e.g., at the province and district scale, large-scale structures in combination with special lithologies that are considered as potentially pegmatite-bearing are targeted by geophysical surveys. In particular, airborne surveys with magnetics, radiometrics, and EM measurements are used for this purpose (e.g., [7,8,9]).
Due to the reluctant exploration so far, there is significant potential to find unknown and even buried deposits in Europe. The combination of modern-day instrumentation, measurement sensitivities, and innovative workflows is promising for exploring buried pegmatites. The European Commission Horizon 2020 GREENPEG project (GA number 869274) is taking up the challenge and developing multi-method exploration toolsets for the identification of European, buried, small-scale (0.01–5 million m3) pegmatite ore deposits [10]. Of relevance are the Nb-Y-F (NYF) and Li-Cs-Ta (LCT) types, classified by Černý 1991 [11] in terms of their chemistry and rare metal abundance. A comprehensive understanding of the petrophysical properties of different pegmatite types and adjacent wall rocks is a crucial aspect of these toolsets and the motivation for the database presented here. A better knowledge of the petrophysics enables the right choice of geophysical exploration tools based on deposit-specific characteristics, maximizes success rates, and therewith contributes to more efficient exploration. Preliminary results of the GREENPEG project indicate a much higher complexity of pegmatite deposits and that the petrophysical contrast between pegmatite and host-rock can vary significantly. Depending on the geological and mineralogical pegmatite genesis, petrophysical contrasts indeed become measurable. Resistivity measurements do look promising and a newly developed instrument utilizing the piezoelectric effect of quartz crystals shows potential. Both methods provide promising results in the search for buried pegmatites of the LCT- and NYF-chemical type, especially in established pegmatite fields. Borehole logging on an LCT-type deposit indicates a possible use of seismic velocities to distinguish between albitized and mineralized spodumene pegmatite. Furthermore, the investigated LCT pegmatites show a prominent thorium signature that might make them recognizable by radiometric surveys. We come back to this later in the text. However, as the project is still ongoing and the data are still being assessed, we do not go into detail, as these first results need further investigation and verification. The final outcomes and methodologies will be published in several publications to come.
The EuroPeg_PetroDB (European Pegmatites Petrophysical DataBase, short EuroPeg) presented here compiles for the very first time the most common petrophysical parameters of pegmatite deposits and their wall rocks. By making these data freely available, we contribute to the open data policy of the European Commission, support FAIR data (Findable, Accessible, Interoperable, and Reusable data), and provide valuable information to pegmatite research as well as exploration companies in Europe. Open and FAIR petrophysical data are not that common yet. The national petrophysical database of Norway, hosted at the Geological Survey of Norway (NGU), is freely accessible but currently does not include all the relevant meta-information and is, of course, restricted to Norwegian samples. The recently released P3 database [12] follows the same principles as the EuroPeg database in terms of open and FAIR data, though the motivation behind P3 is geothermal applications. EuroPeg is specialized in that it contains only samples in direct relation to pegmatite ores and aims to provide a comprehensive overview of potential petrophysical contrasts between pegmatite and its host rock in various geological and mineralogical settings.
The first version of EuroPeg was released in April 2022 as part of a project deliverable [13]. Since then, a significant amount of additional data has been processed, and the scientific content of the database has been extended, resulting in the new release of Version 2.0 presented here.

2. Sample Collection

The current database version contains only samples collected and analyzed from demonstration and test sites of the GREENPEG project [10]. The samples are from pegmatite locations in five countries: Austria, Ireland, Norway, Portugal, and Spain. Samples were either collected in the field during the project’s field campaigns in 2020 and 2021 or taken from drill cores.

2.1. Austria

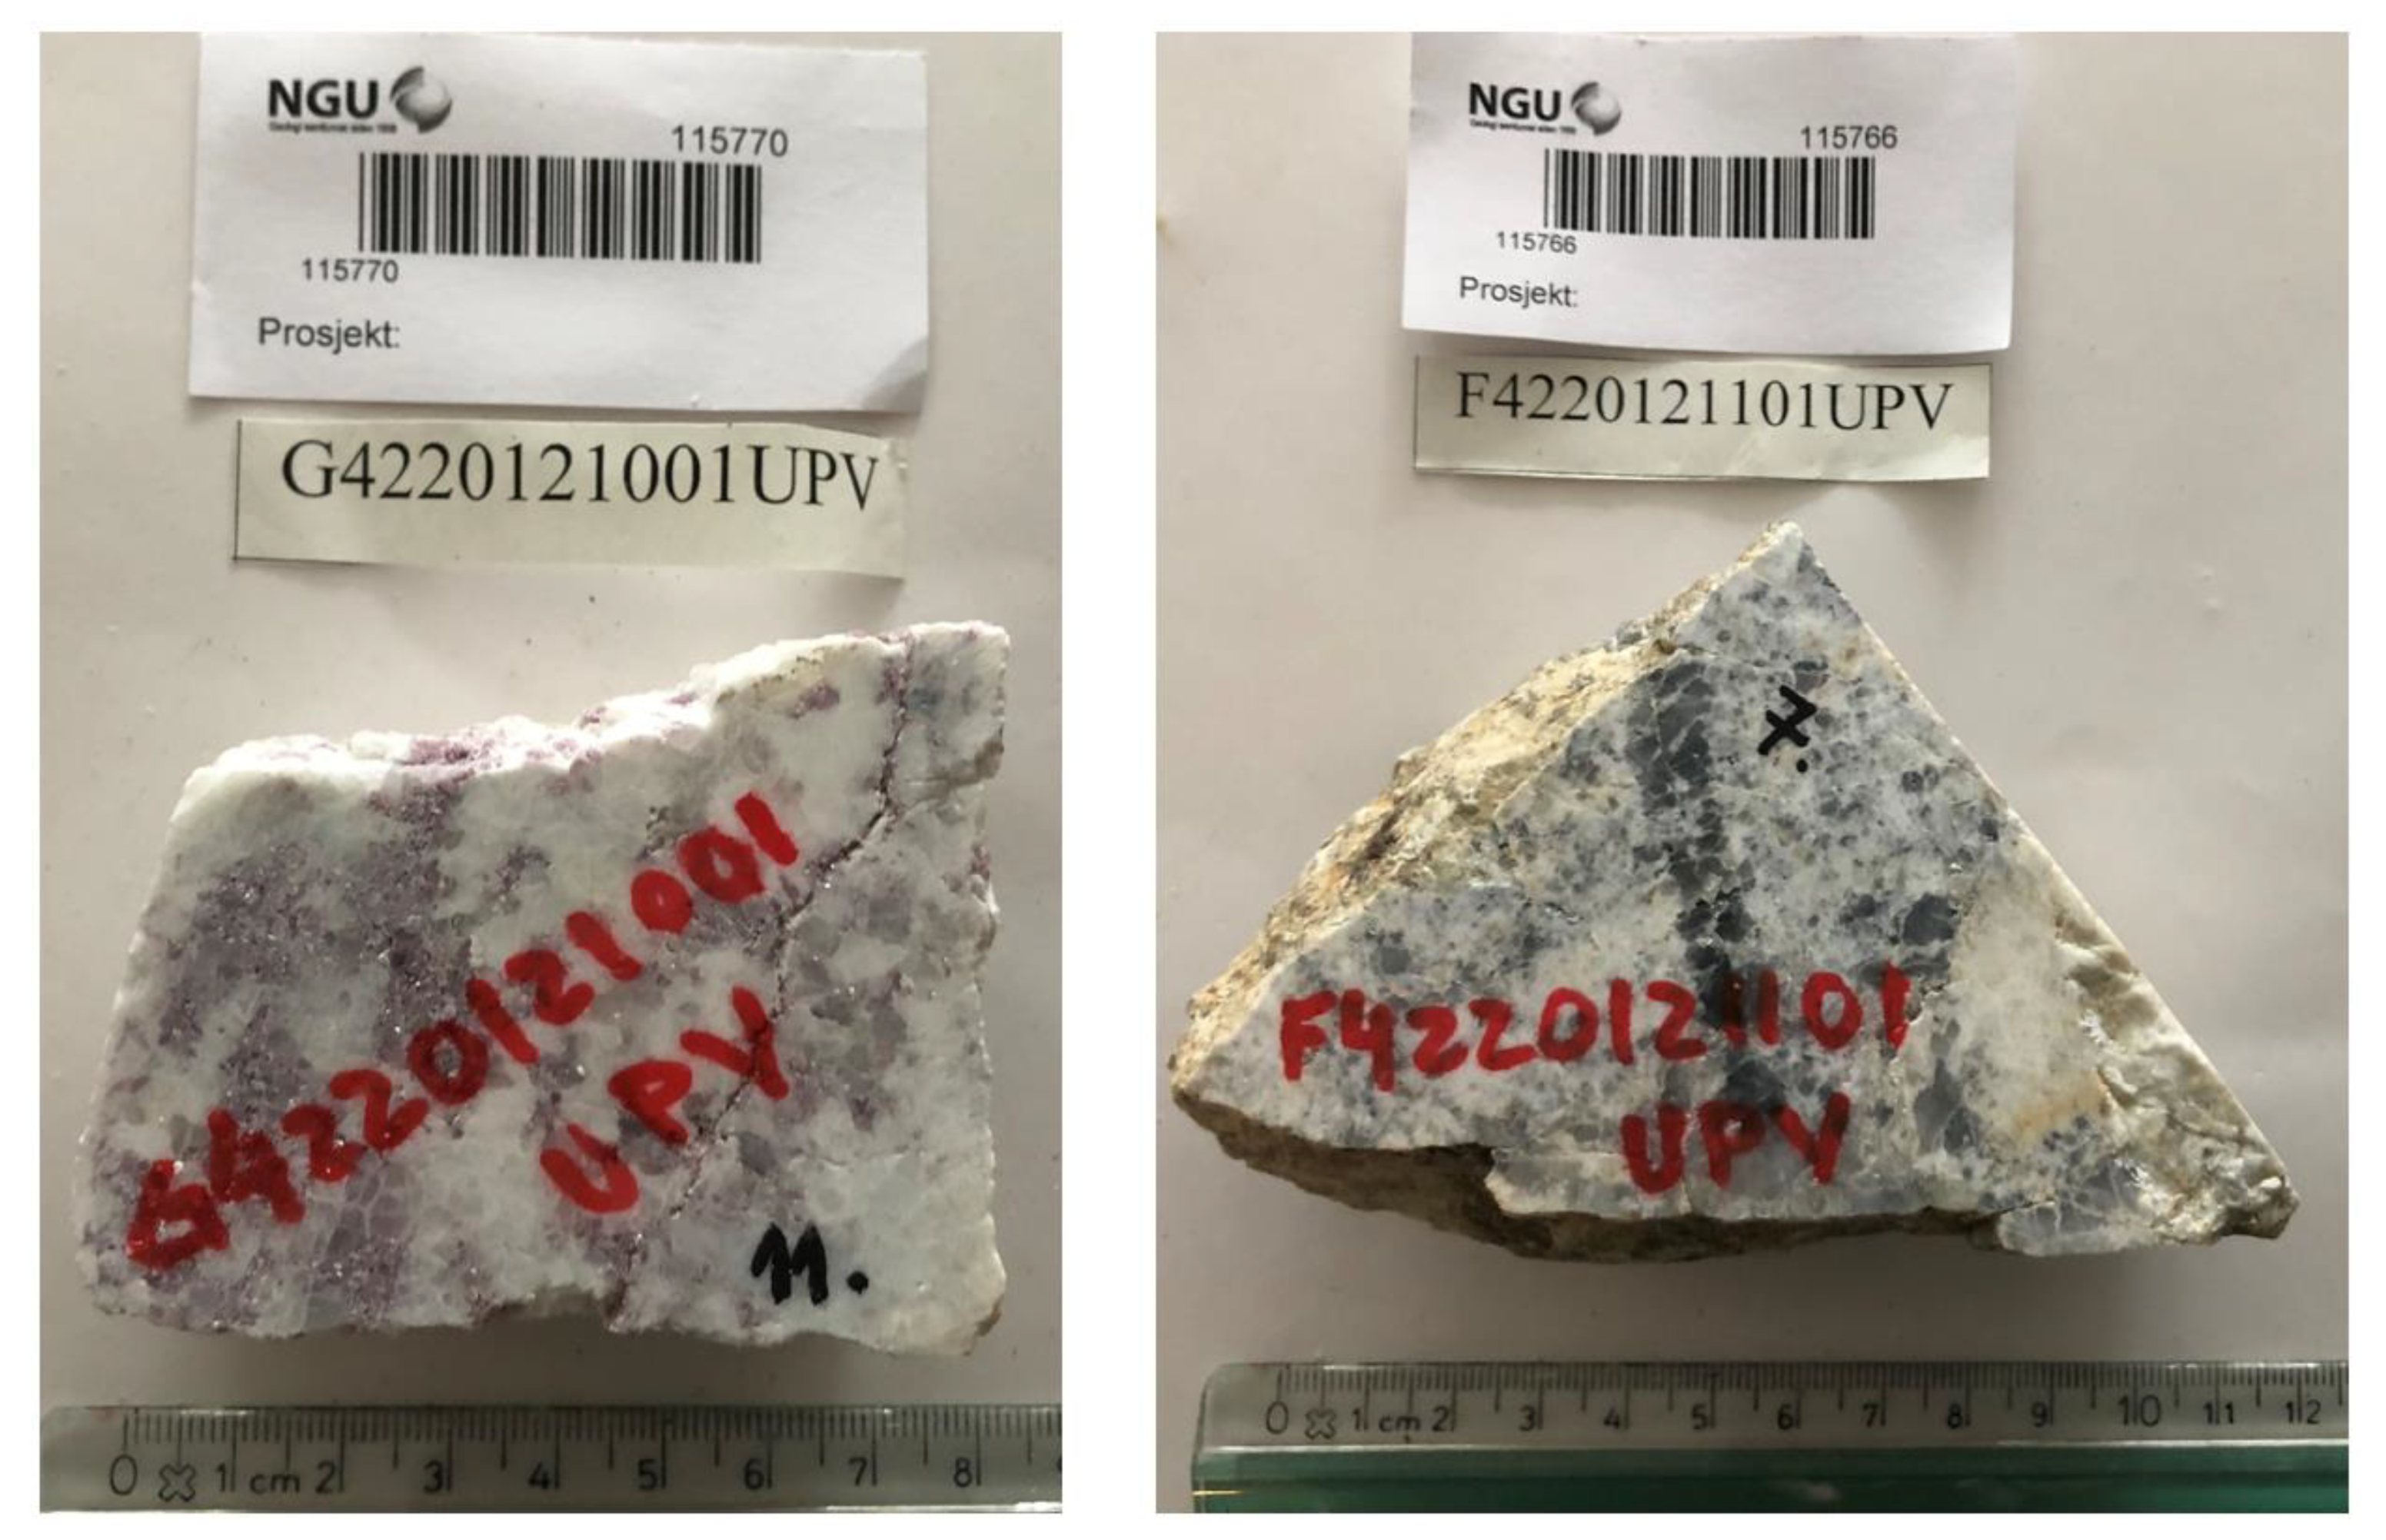
At the Wolfsberg site in Austria, an underground mine exposing spodumene pegmatites has been made accessible by European Lithium (ECM) to the GREENPEG project partners. It gives a unique insight into the setting and contact relationship of pegmatites with their wall rocks. The dyke-like pegmatites are hosted in two different wall rocks: mica schist and amphibolite (Figure 1, [14]). Ca. 150 boreholes were drilled at the site over recent decades. For the database, 36 drill core samples from nine boreholes were analyzed and nine boreholes were logged. Four additional samples were collected in the underground mine. The exact locations of the boreholes are confidential and only roughly indicated on the map in Figure 2.

2.2. Ireland

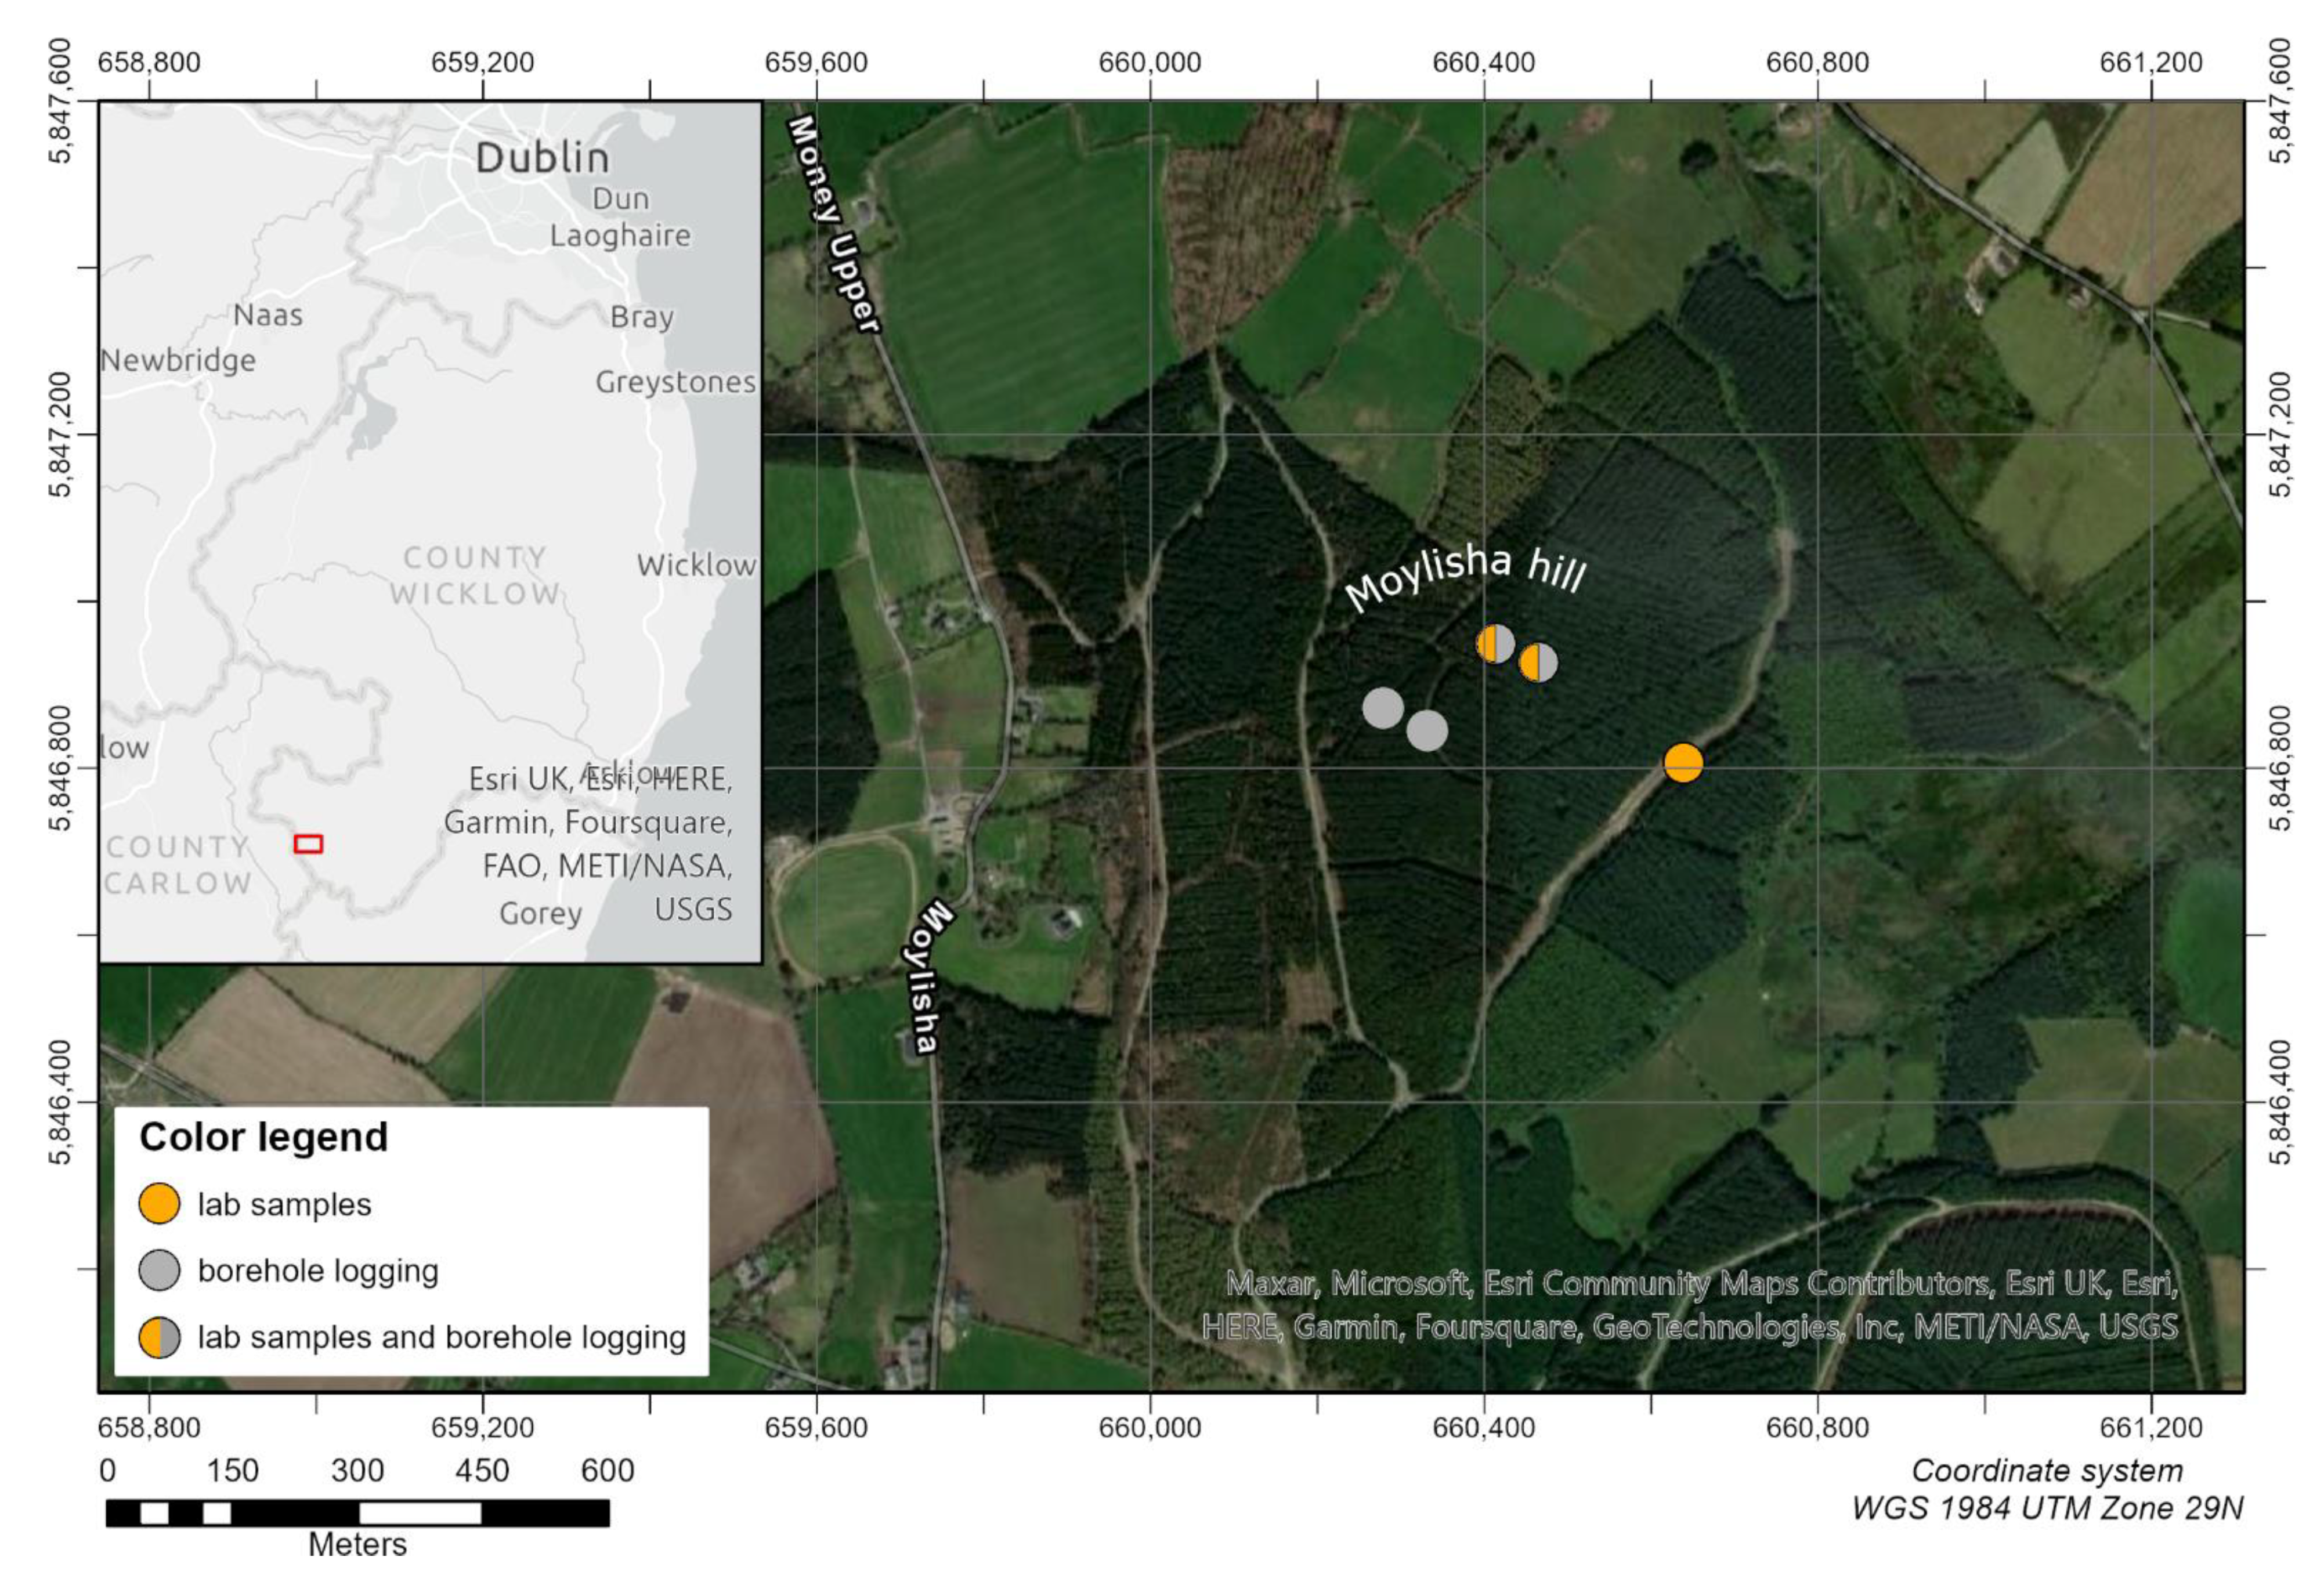
At the South Leinster site in Ireland, GREENPEG project partner Blackstairs Lithium Limited (BLL) carried out a drilling campaign at the Moylisha prospect from April to June 2021 [15]. Boreholes were drilled within porphyritic granite hosting a number of LCT-type pegmatites, such as spodumene, albitized, and simple (granitic) pegmatites (Figure 3, [16]). The dip in the inclined drilled holes ranges from ~20° to 46° near the surface. The depth of the drill holes is on the order of 183 m to 345 m. Six boreholes were geophysically logged by project partner terratec Geophysical Services in 2021, and three of these drill cores were sampled for petrophysical analyses (Figure 4).

2.3. Norway

At the Norwegian site in Tysfjord, drilling campaigns were carried out from the 1970s to the 1990s, covering some of the known NYF-type pegmatite occurrences. The Tysfjord pegmatites are characterized by high-purity, coarse-grained quartz, and feldspar [17]. The vintage drillholes have a small diameter (5 cm) and were not designed for geophysical logging. In 2005, a 780 m long borehole was drilled near the village Drag (Figure 5) and borehole logging was carried out in 2006 and 2009. However, the dataset is incomplete and as of now not included in the database. After 2005, no new core material from the Tysfjord area was made available.
Drill cores from Norwegian boreholes are stored and accessible at the National Drill Core and Sample Centre at Løkken in central Norway (https://www.ngu.no/en/topic/national-drill-core-and-sample-centre (accessed on 20 November 2022)). Here, samples were collected for the petrophysical measurements in May and June 2021. In addition, field samples were collected, mainly around the Jennyhaugen and Håkonhals open-pit mines. Two examples of NYF-type pegmatite specimens from the Tysfjord drill cores are shown in Figure 6; sample locations are shown in Figure 5.

2.4. Portugal and Spain

The pegmatite sites in Portugal and Spain are secondary test sites in the GREENPEG project, and only a limited number of field samples were collected and analyzed for the petrophysical database. No drill core samples were available, and no existing or new boreholes were accessible for geophysical logging.
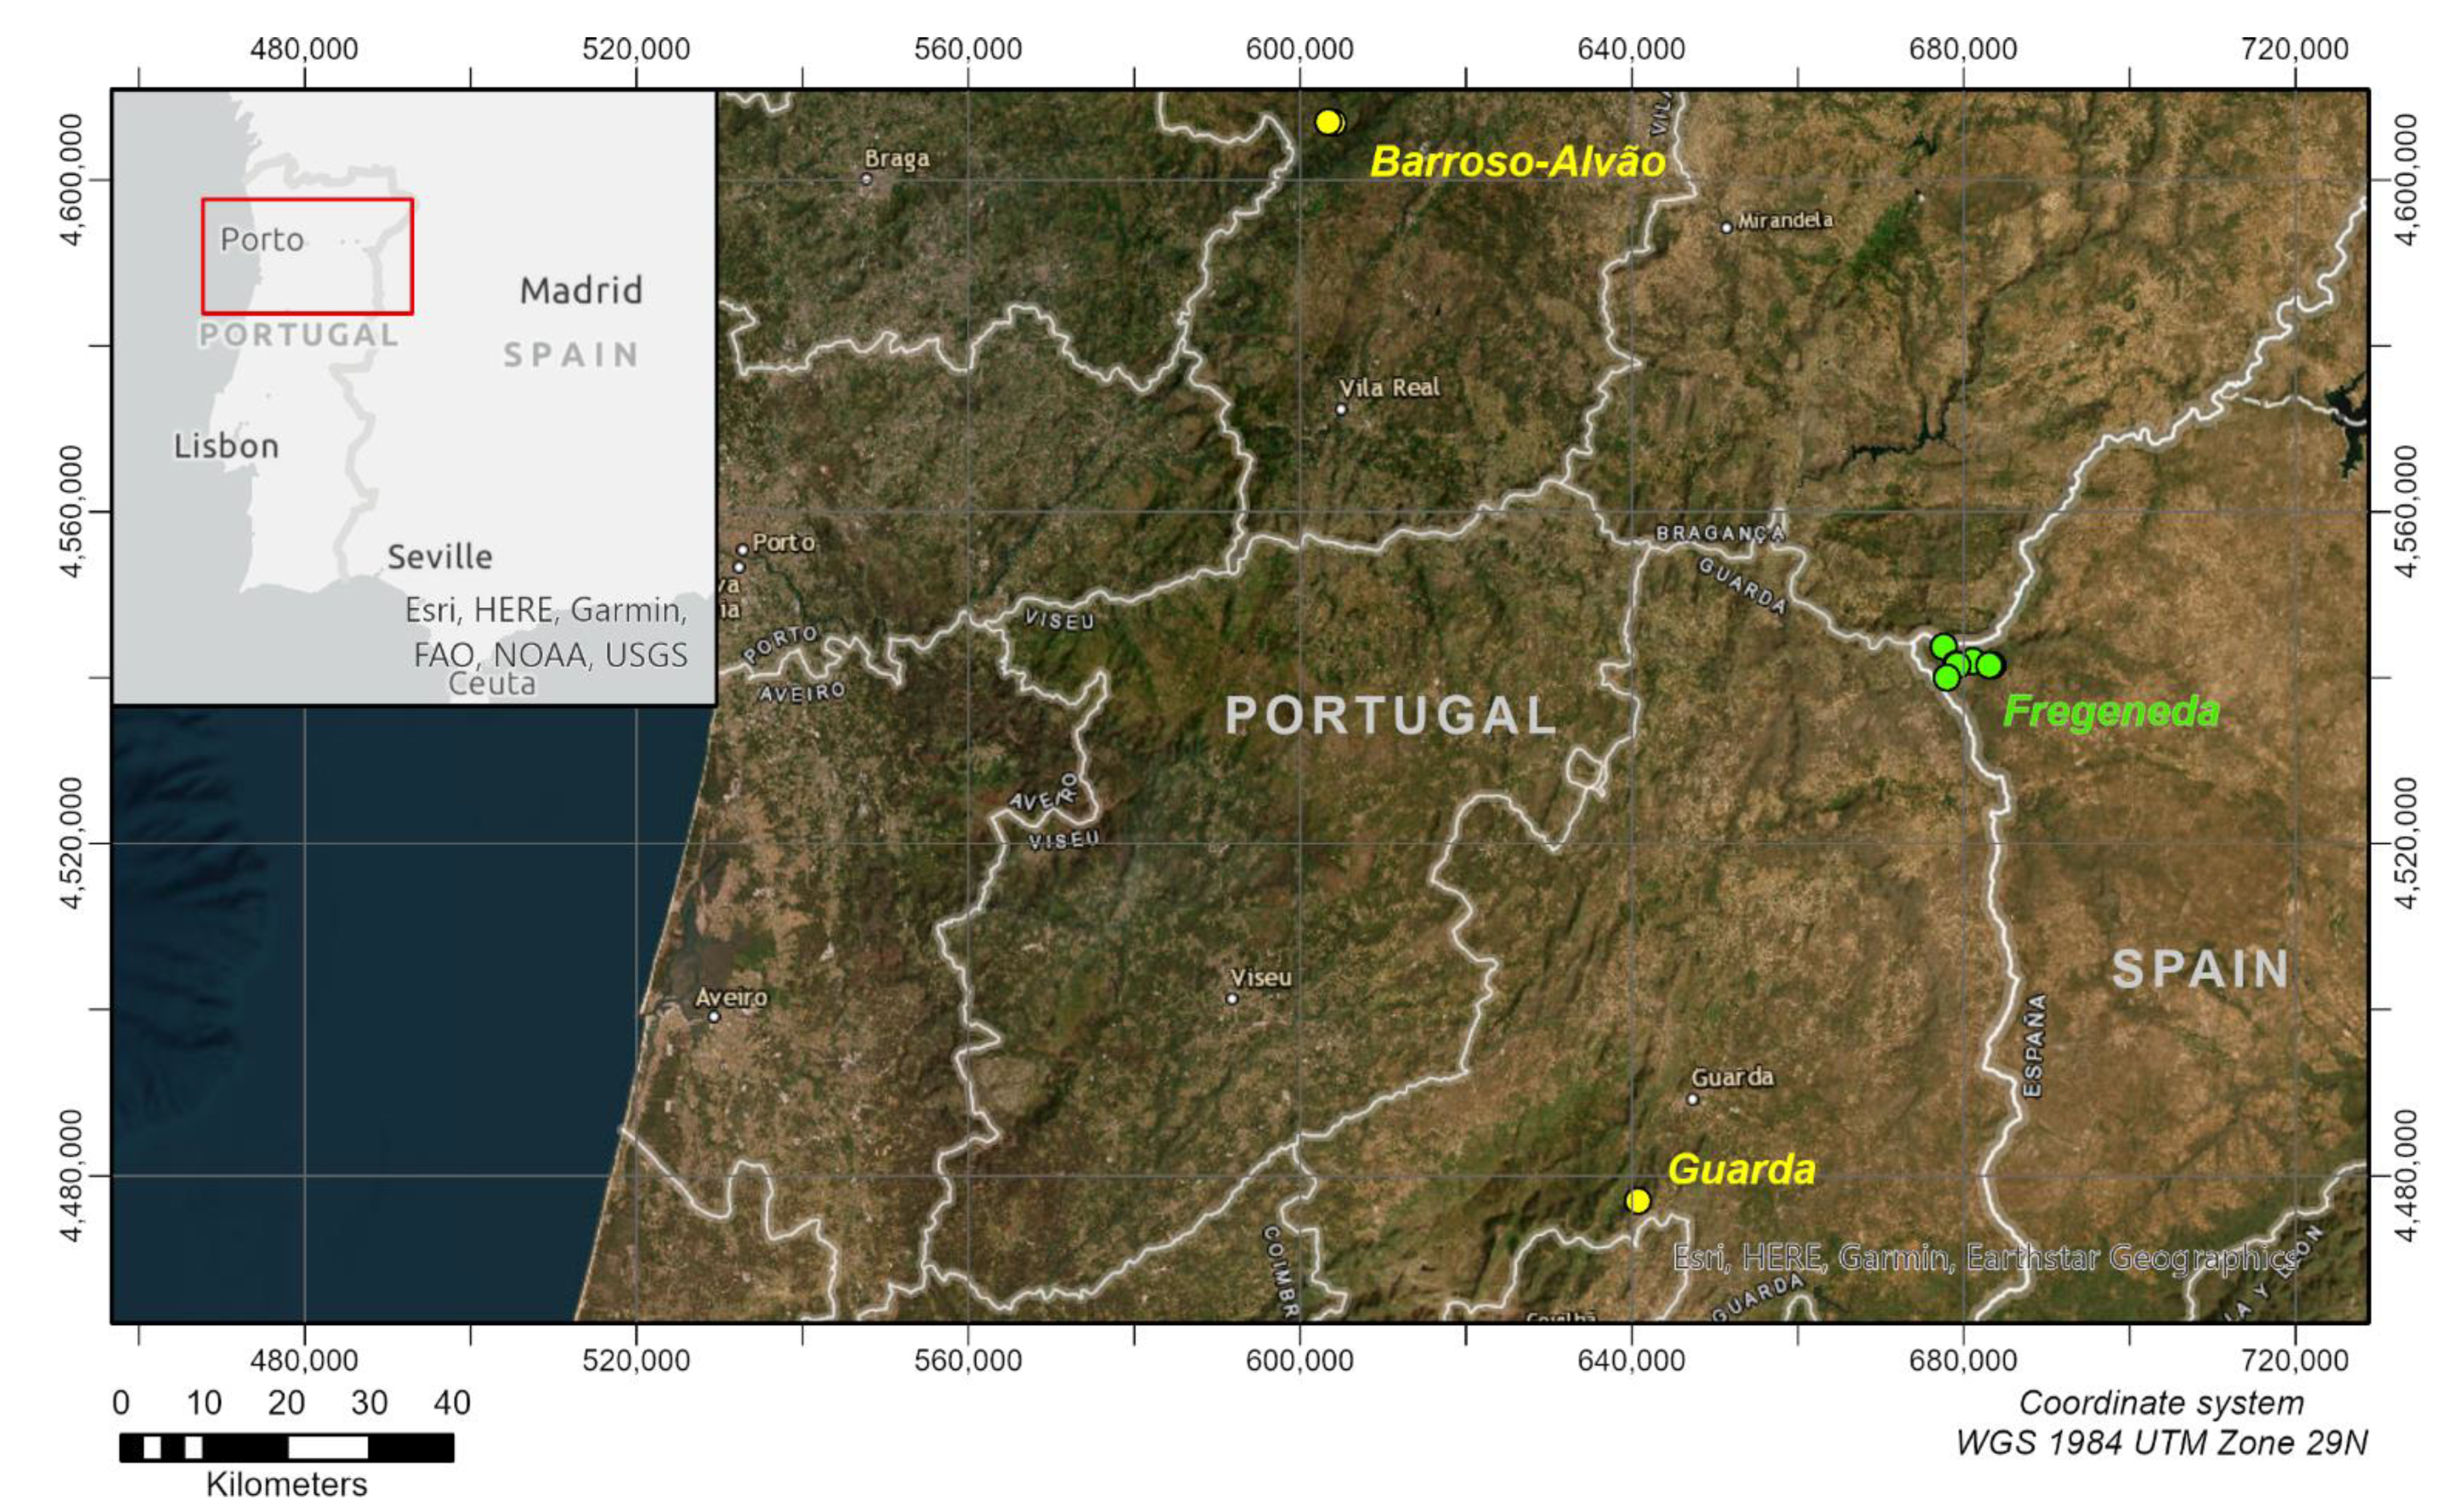
The sites (Figure 7) host spodumene pegmatite deposits in mica schist and monzogranitic wall rock (Portugal), and siliciclastic metasedimentary wall rocks (Spain) [18]. Two pegmatite examples are shown in Figure 8.

3. Petrophysical Measurements

The database contains three measurement methods: laboratory analysis, handheld measurements, and geophysical borehole logging. The first two methods were performed on hand samples, while the third was carried out in boreholes, measuring the surrounding rocks in situ. Data extraction from the borehole logs follows two different schemes. One is to complement sample measurements, while the second is an optimized approach to display the vast amount of information comprised in the densely sampled borehole logs. Consequently, the applied methods provide different parameters with varying accuracy.

3.1. Laboratory Analysis

Hand specimens were analyzed in the petrophysical laboratory of NGU. Thus far, all samples in the database have been analyzed at this laboratory ensuring that the results are optimally comparable. Furthermore, analyses carried out at NGU’s laboratory are quality-assured and follow the ISO/IEC 17025 standard.
Volume, density, pore volume, and open porosity were measured according to the European standard EN 1936:2006 (E) with a Sartorius AX 4202 precision scale. The measurement uncertainty is 0.01 g. Open porosity is expressed by the ratio of the volume of open pores to the apparent volume of the sample. Magnetic susceptibility was measured with a method developed in-house at NGU in 2015 [19]. Measurements were given in 10−6 SI. Magnetic remanence was estimated using the FGM3D sensors and the FGM3D DT data acquisition system from Sensys. The measurement uncertainties for both magnetic parameters depend on the measuring range (Table 1). When measuring samples with a remanence >140 A/m, the uncertainty may be higher than indicated in the table and is not documented as of date.
Thermal conductivity was measured with a TCi Thermal Conductivity Analyzer (with MTPS sensor). Specific heat capacity was calculated using directly measured thermal effusivity, density, and thermal conductivity. The calibration method Ceramics-HR was applied, allowing a measurement range of 1.1–29 W/mK with a 2.5% relative uncertainty (when a Pyroceram 40 TCi control sample was used). Water was used as a contact between the sample and the sensor.

3.2. Handheld Measurements

In addition to the standardized laboratory measurements, hand specimens were analyzed with a handheld gamma ray spectrometer. The Super-Spec 125 instrument from Radiation Solutions Inc. (Mississauga, ON, Canada) with a 103 cm3 NaI crystal was used. Data were recorded over 3 min intervals and then averaged. The accuracy was approximately 0.7–0.8 ppm for uranium and thorium, and about 0.2% for potassium. It was mainly influenced by the shape of the sample. Future measurements will be carried out in a lead-shielded housing to increase accuracy. In such a housing, the influence of background radiation is minimized and small sample sizes are less problematic.

3.3. Geophysical Borehole Logging

Within the GREENPEG project, two wireline downhole geophysical logging and measurement campaigns were performed in several boreholes at the sites in Ireland and Austria between October 2020 and October 2021. No boreholes were available for logging in Norway or at the sites in Portugal and Spain. The applied borehole probes measure with a sample interval of 1 to 10 cm over the entire borehole length and, therefore, provide a high-resolution in situ dataset of the rock formation (Table 2). The lateral penetration depth ranges from a few centimeters to a few meters depending on the measuring method and parameter.
The data were processed with the WellCAD Software (5.5) from ALT (Advanced Logic Technology SA, Redange, Luxembourg). The Spectral Gamma Ray data were additionally pre-processed using the Gamman Software (1.49.96.815), released by Medusa Sensing BV, Groningen, The Netherlands. The software implements the Full Spectrum Analysis (FSA) method, which comprises the mathematically most efficient method to derive nuclide concentrations from gamma ray spectra. For each borehole, a multiparameter composite log was created.
With this dataset, drill core samples were first supplied with geophysical logging measurements from the respective depth intervals in the boreholes (see Section 3.3.1). Secondly, data were supplied over the individual sections of the lithological units (see Section 3.3.2).

3.3.1. Petrophysical Data from Borehole Logging over Core Sample Intervals

From the resulting multiparameter composite logs, data of 12 parameters (see Table 2) were extracted from those depth intervals of the borehole where core samples were taken for laboratory analysis. However, the core samples analyzed in the laboratory cannot be directly correlated with the borehole logging results without careful evaluation and a thorough depth check. The core depth provided at the drill core storage boxes strongly depends on drilling depth accuracy, a common geographical reference, and possible core losses during the drilling. The borehole measurements with continuous readings over the entire depth can normally be used to increase the quality control of the core depth. To supplement the laboratory measurements on samples, the logging data were adjusted manually to the core sections used for the petrophysical database where necessary. This was performed using the image data from the optical and acoustical scanner, which provide a 360° image of the borehole wall. However, small uncertainties in depth remain, so the depth section in the logs does not cover the exact 100% of the depth interval of the laboratory samples, but a little less. Considering that borehole measurements determine rock properties of a certain rock volume around the measurement point within the borehole, the laboratory measurement can never reproduce the borehole measurement environments. Nevertheless, the borehole data complement the drill core sample database by providing in situ parameters from the drillhole. An average of the respective parameters collected over the depth intervals of the laboratory samples is given in the database.

3.3.2. Petrophysical Data from Borehole Logging over Lithological Units

The sample analysis and data extraction described above contain only a very small part of the total amount of available logging data. Not all logged boreholes were sampled; if core samples were taken, they cover only a fraction of the full borehole length. This means that much more valuable logging data are available and to be included in the presented database.
We developed a scheme to extract representative data from all available logged boreholes. The main criterion for representativeness was the lithology interval thickness. First, using the optical and acoustic image data where available, a depth correction was performed to the lithological logs, initially logged using the core depths. Subsequently, 14 geophysical parameters (see list in Table 2) were read out over the lithological intervals throughout the borehole. The mean value over the interval, the maximum value, and the standard deviation were calculated or extracted. All parameters are represented by these three values in the database. The minimum value is not given, because it often goes down to a non-representative zero measurement due to the measurement and processing conditions. Only lithologic intervals with a thickness equal to or greater than 0.5 m were considered for the database. The remaining, more minor depth errors, thus, do not distort the values in the database, and only pegmatite dykes that are of economic interest were considered. Some logging methods reach a larger rock volume during the measurement; by considering units greater than 0.5 m, superposition effects with the neighboring lithologies can be minimized. For calculating the mechanical properties (Shear Modulus, Young’s Modulus, Bulk Modulus) from P- and S-wave slowness in µs/m, density values averaged over the lithological units from the NGU laboratory measurements were used for the South Leinster site (for values, see database). In Wolfsberg, the density measurements of the NGU laboratory could be supplemented by measurements collected during the core description. The density was determined according to Archimedes’ principle with a non-regular sample rate of less than 20 cm.

4. Results

The primary outcome of the presented work is the database itself. The current version contains 147 laboratory samples and 456 geophysical logging entries. Its design and a few application examples are given to demonstrate its use.

4.1. Database

4.1.1. Meta-Information

The core content of the database is the petrophysical information and analysis described above. In addition, meta-information for all samples and borehole intervals is included and described in the following.
Lab nr. is a distinct number that a sample gets assigned when entering a laboratory. For now, the database contains only samples analyzed at the NGU laboratory.
Sample ID is the ID usually given to a sample according to the project, field campaign, or personal nomenclature. It is assigned by the person responsible for sampling.
Location, Area, and Country are the names related to the original location of the sample at different scales. Area can be, for example, geographical regions or municipalities. Location can be city or settlement names.
Sample type distinguishes between core samples and field samples. In the case of core samples, the drillhole ID is also provided here.
Photo contains a link to an image file with the photograph of the sample. Samples were photographed with a scale and either the Lab nr., Sample ID, or both.
UTM zone, UTM X, and UTM Y define the original field location of a sample. Easting and northing are UTM coordinates in the reference system WGS 1984, given in meters. Locations were mostly measured with handheld GPS and an accuracy of ±3 m.
Elevation is only used for field samples and gives the elevation above sea level in meters. The elevation is taken from local DEMs based on the measured GPS locations. Samples from underground mines are not given an elevation, due to high uncertainty.
Drillhole onset elevation is used for samples taken from a drill core and given in meters. Here also, values are taken from local DEMs, and the accuracy is limited by the handheld GPS location. In addition, some drillholes start from within underground mines. In this case, no elevation is given, due to high uncertainty.
Drillhole from and Drillhole to defines the depth interval in meters in the drillhole from which a sample was taken. These values often have higher accuracy than the drillhole onset elevation measurement because, once extracted, the drill core is usually examined in great detail with a resolution independent of its absolute position.
Description gives lithological information about the sample. Samples were collected and classified by different people and the amount of information given here varies. When descriptions start with a “?”, the lithology is not precisely identified, and the sample has yet to undergo thin section analysis.
Lithology (general) is a lithology code following a generalized classification into primary lithologies, e.g., pegmatite, amphibolite, and granite.
Lithology (detailed) is a more detailed lithology code that sub-categorizes the samples, e.g., based on the main mineralization of the pegmatite. This code also includes the sample location because deposits from different sites may have different characteristics and need to be distinguished during analyses. A legend for the lithology codes is included in the database.
Pegmatite family, zoning gives further information regarding the classification of a sample. The pegmatites and corresponding wall rocks are distinguished between the chemical NYF- and LCT-types or families. The zoning indicates if the sample belongs to the core-, intermediate-, or wall-rock zone of the deposit (e.g., [11,16]). Some, but not all, pegmatites form a halo, which is also part of the zoning. Some of the petrophysical properties are altered in the litho-geochemical halo of the pegmatite. However, halos do not form sharp boundaries. Chemical enrichment of incompatible elements (Li, Cs, Rb, Sn, W, U, and Th) define the halo decline with distance from the pegmatite; some elements decline more rapidly than others. There is a continuum between the wall rock and halo and the given zoning in the database might not be absolute.

4.1.2. Confidentiality or Restrictions

The aim of this open-access database is of course to compile and provide all available information. However, samples might be subject to confidentiality and the amount of information or analysis results presented in the database is restricted. In the current version of the database, restrictions were given for the core sample and borehole positions in Austria (Figure 2). Here, the exact locations of the drillholes were not released. This proves as a disadvantage for a spatial integration of petrophysics, e.g., in a deposit model. On the other hand, the information is available and relevant for statistics or analytical purposes.

4.1.3. Format, Access, and Versioning

The EuroPeg database is an open-access dataset under the Creative Commons Attribution 4.0 International (CC-BY-4.0) license. It can be freely downloaded from the open data repository Zenodo (www.zenodo.org (accessed on 20 November 2022)). The repository originates from the EC-founded OpenAIRE project to support EC’s Open Data policy. Zenodo is hosted and maintained by CERN and was launched in 2013.
In addition to assigning a digital object identifier (DOI) to uploaded datasets to support reuse and correct referencing, the repository also accommodates dataset updates with versioning. The versioning allows two types of references for a dataset: the full dataset history (all versions) or one specific version. This is a very useful option because the database is intended to be filled with more samples from other European pegmatite deposits over time. Planned is an annual update, provided that new data are made available to the authors. A distinction will be made between major and minor updates, depending on the type and number of changes. For example, minor error fixes and new data would only result in a new subversion, whereas major format and content changes would result in a new main version.
The first database version (1.0) [20] was uploaded to the repository as part of a project deliverable in early 2022. Version 2.0 of the dataset, as described and discussed here, is released together with this manuscript. The database is currently provided as an Excel file, which is the most versatile and easy-to-use format. Upcoming versions are planned to be provided as GIS geodatabases as well, offering straight-away usability in existing GIS projects. The current Excel file has three sheets: (1) The petrophysical database compiled from hand specimens and coinciding borehole logging intervals (147 entries), (2) averaged properties for lithology units along boreholes, purely based on the geophysical borehole logging (456 entries), and (3) a legend with short descriptions of the lithology codes. The Excel file is zip-compressed with a folder containing the sample photos, the initial technical report [13], and a metadata file.
The overall structure of the database is designed to be (1) easily readable and (2) allow for systematic statistical evaluations. Readability is provided by plausible sorting of the samples and content. The three different measurement methods described under Section 2.2 are color-coded and summarized under extended headers. Its use in systematic statistical evaluations is supported by ensuring that the relevant information is concise and machine-readable. For example, a descriptive header is supplemented by short labels that can be directly used as variables in a script or code. To select relevant samples for individual studies, we provided two types of lithology codes in addition to the more informative sample description. In addition, distinguishing samples depending on the pegmatite chemistry (LCT or NYF) and what zone of the deposit they belong to is included in the sorting or extraction options.

4.2. Application Examples

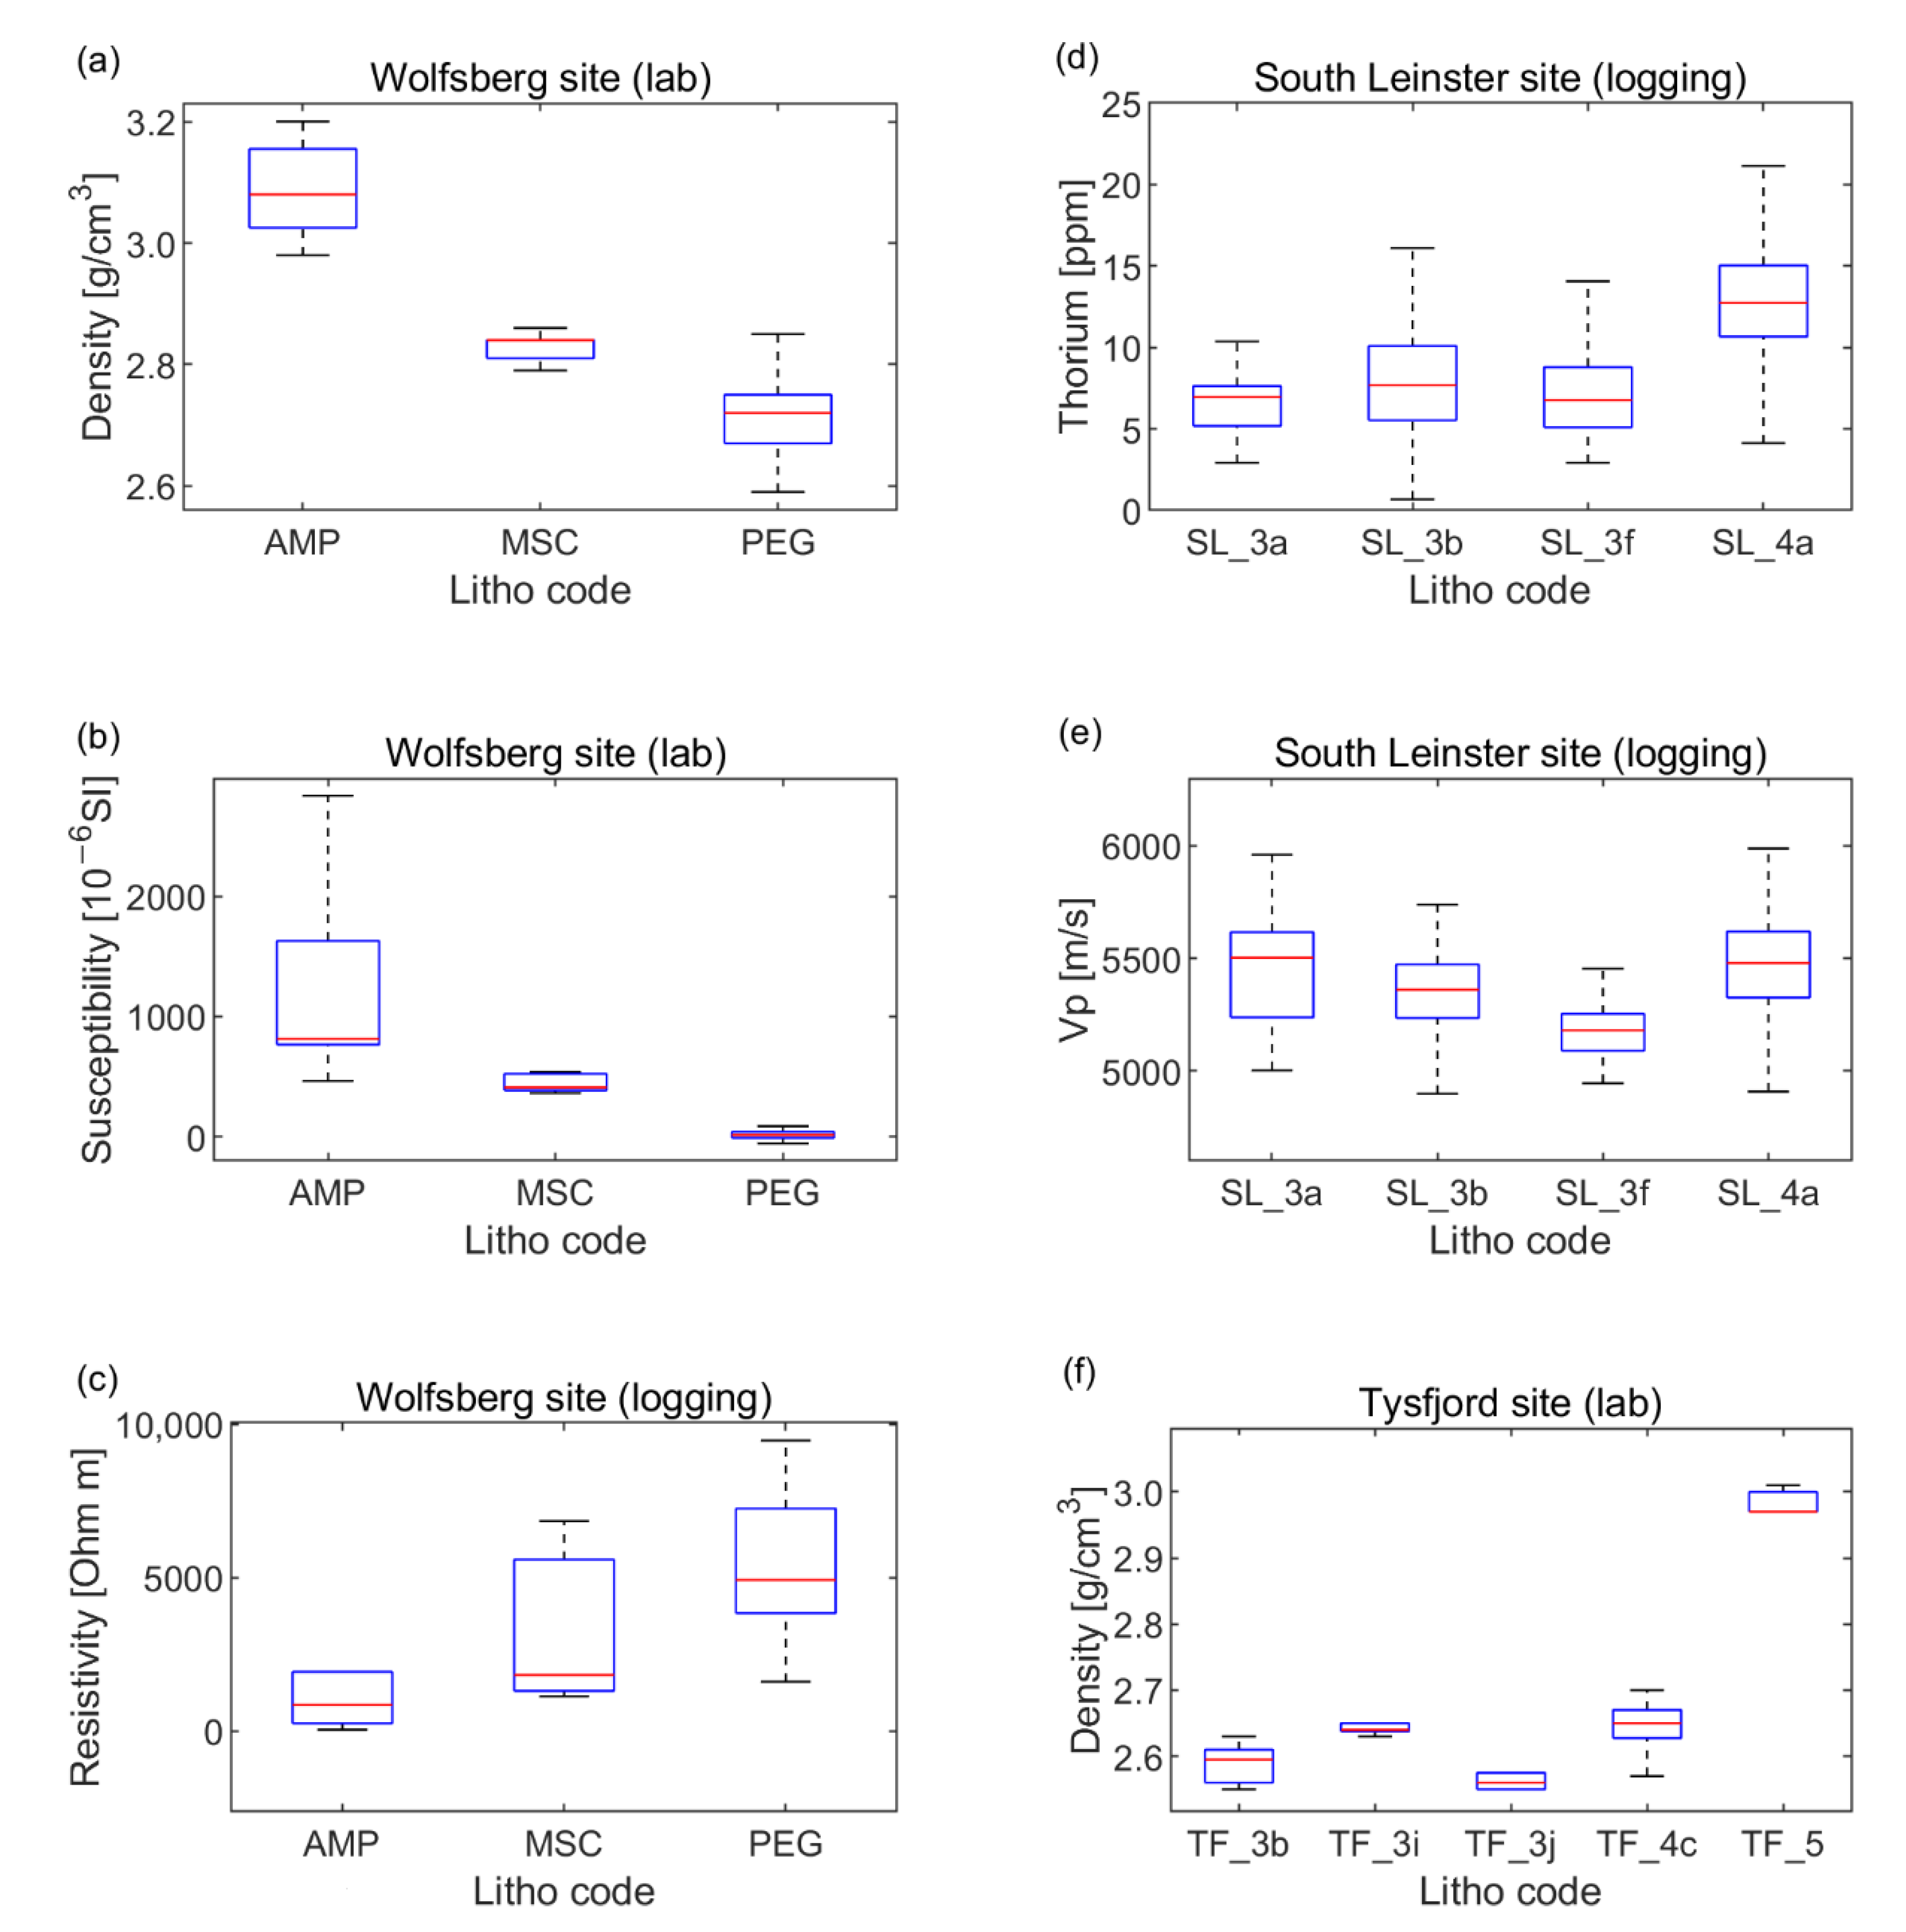
Statistical plots of physical properties can be created directly (machine-readable) from the present consistent dataset due to the way the database is designed (see Section 4.1.3). Correlations of the petrophysical properties of the individual pegmatite sites as well as of different pegmatite types (LCT and NYF) allows a better geophysical understanding of these and, thus, a targeted matching of the geophysical exploration methods used. The following Figure 9 gives some examples of correlations found between the properties and the lithologies. The presentation here is limited to a few parameters and only demonstrates the usability and applicability. More detailed discussion and interpretation of the GREENPEG project data will follow in future publications.
Figure 9 contains two examples from laboratory data and one example from borehole logging from the Wolfsberg site, where the deposit is an LCT-type pegmatite (Figure 9a–c). The spodumene pegmatites can be clearly distinguished from the two host rocks mica schist and amphibolite. From the laboratory measurements, density and magnetic susceptibility are useful properties. The mica schist-hosted pegmatites (MHP) show median contrasts of 0.1 g/cm3 and 0.0004 SI to their host rock. For amphibolite-hosted pegmatites (AHP), the contrasts are even larger at 0.36 g/cm3 and 0.0008 SI. In general, these contrasts are large enough to model and distinguish pegmatites and host rock from gravity and magnetic surveys. However, the overall setting and geometry of the pegmatites are crucial factors. The pegmatites of the Wolfsberg deposit are narrow and often only 1–2 m or less wide, with an approximate maximum thickness of 5 m. This is a challenge for potential field modeling when the dykes are at depth, and it might make this approach at this specific site most likely less suitable. Resistivity measurements from borehole logging are another important parameter. Again, a clear separation of the pegmatites from their host rocks can be observed, 3000 Ohm*m and 4000 Ohm*m for MHP and AHP, respectively. If the pegmatites are at least several meters thick and are not deeper than 100 m below the surface, the contrast in resistivity could possibly allow a detection by electrical resistivity tomography measurements.
Borehole logging data from the site in South Leinster (LCT-type pegmatite) show lower ThO2 values for pegmatite than the surrounding host rock of porphyritic granites (Figure 9d). This is valid for all pegmatite varieties of spodumene, albitized, and simple pegmatite. Their medians lie between 6.8 and 7.7 ppm, whereas porphyritic granite has a median of 12.7 ppm. The measurements show a wider overall distribution but the medians are clearly separated. According to this observation, buried but thick near-surface pegmatite dykes could possibly be traced with surface geophysical measurements of spectral gamma.
Observing the Vp velocity for the South Leinster site, spodumene and albitized pegmatites show a clear contrast of ~250 m/s. This contrast is large enough to differentiate albitized from mineralized spodumene pegmatite. Albitized pegmatites can also be distinguished from simple pegmatites and porphyritic granites (Figure 9e).
The densities of the Tysfjord pegmatites, which are NYF-type pegmatites, allow one to distinguish between granitic, quartz, and feldspar pegmatites (Figure 9f). Measurements for the quartz (core zone of the pegmatite) and feldspar (intermediate zone) show very little variation. Densities for the metagranitic wall rock, however, are spread over a larger interval. The measurements overlap partly with the pegmatite densities but are higher on average. Amphibolite, present in the wall rock at the Håkonhals mine, can be clearly distinguished from the pegmatites and granitic rocks in the surroundings. The contrast between quartz and feldspar is almost 0.1 g/cm3. This is enough to distinguish the quartz core of a pegmatite from a surrounding feldspar, given that the overall setting is favorable for a ground gravity survey. Here, parameters such as depth and size of the target are of relevance but also the survey conditions (i.e., terrain, vegetation).
These examples present a first look at the database content and what kind of information can be extracted. A lot of potential is still unexplored. By identifying possible new correlations between petrophysical parameters, we expect to gain a much better geophysical understanding of pegmatites and their host rocks. In the future, this systematic approach will help to choose and apply geophysical methods in a more target-oriented way.

5. Discussion

The database is a valuable tool for pegmatite ore research and exploration. Usually considered as geophysical non-responders, modern and high-precision measurements of physical properties as well as a better geological and mineralogical understanding of pegmatite deposits provide new possibilities for geophysical exploration methods targeting these resources. EuroPeg compiles a wide range of parameters for the very first time in one comprehensive dataset and will support the European pegmatite community in developing future exploration methodologies and workflows. The data are eligible for quantitative analyses to discover trends and correlations for different deposit types. In addition, the complementary spatial and meta-information allow data integration in subsurface and deposit models. EuroPeg is not intended to be a purely scientific tool. Based on the petrophysical data, exploration companies get an indication of which geophysical methods can be considered at all and will provide potential results at their specific deposit setting. Without this database and with only limited and unstructured literature concerning geophysical methods for pegmatite exploration, this was not possible until now. The data can add meaning and value to the classical airborne geophysical data by linking it to ground observations (samples). As the petrophysical contrast between pegmatites and host rock is crucial, both have been included in the database. However, even if showing reasonable contrasts, forward modeling studies with varying pegmatite geometries and thicknesses at increasing depths would be useful to estimate the resolution of each geophysical method. Special conditions such as weathering should also be included as they can strengthen or weaken a contrast.
The database itself is not without limitations, which lie mainly in the uncertainty of the measurements. The laboratory measurements follow a standard and are carried out with great care to achieve the most reliable results. Handheld radiometric measurements are influenced by the measuring conditions, i.e., the quality of shielding. The uncertainties of borehole geophysics depend on the sensor accuracies and that the depth correction is performed thoroughly. The information in the database is transferred from analysis reports and log readouts. This was carried out as carefully as possible to avoid errors.
During the remainder of the GREENPEG project, more samples from the demonstration and test sites might be analyzed. However, the database should not be limited to these and has been developed to grow over time and beyond GREENPEG project data. Expansion of the database can only occur if researchers provide their sample data. Do not hesitate to contact the corresponding author regarding new input. Expected standards and accuracies for measurements are described above (Section 3). The necessary information required for a sample to be added, particularly the meta-information, may be found in Section 4.1.1 and in the metadata file that accompanies the dataset. The set-up and versioning scheme of the dataset are designed to accommodate data from other laboratories and with different borehole logging probes. Readers and users of the database are also encouraged to communicate potential errors in the database to the authors. Corrections will be implemented with the next update.
Samples analyzed in the petrophysical laboratory of NGU are currently not affiliated with an International Generic Sample Number (IGSN). This number is a globally unique and persistent identifier for material samples (https://www.igsn.org/ (accessed on 20 November 2022)), similar to DOIs, and a further step toward FAIR data. Assigning it to the samples and including this identifier in the database could be a valuable future upgrade of EuroPeg.

Author Contributions

C.H. is responsible for the manuscript design, initial database design, and the Zenodo database management. C.H. and C.M.P. are responsible for writing the manuscript and content of the database. The laboratory data were collected and processed by NGU, and the borehole logging data were acquired and processed by terratec Geophysical Services. All authors have read and agreed to the published version of the manuscript.

Funding

This research was funded by the European Commission’s Horizon 2020 innovation program under grant agreement No. 869274, project GREENPEG New Exploration Tools for European Pegmatite Green-Tech Resources.

Data Availability Statement

The dataset can be freely accessed and downloaded from the open-access data repository Zenodo (https://zenodo.org/record/7347371(accessed on 20 November 2022)) and can be used under a CC-BY-4.0 license. The download includes the dataset and a metadata file. Please refer to the dataset as follows: Haase, Claudia, Brönner, Marco, Pohl, Claudia M., Osinska, Marta, & Gellein, Jomar (2022). EuroPeg_PetroDB: A petrophysical database of European pegmatite ores and wall rocks (2.0) [Data set]. Zenodo. https://doi.org/10.5281/zenodo.7347371 (accessed on 20 November 2022).

Acknowledgments

We thank European Lithium (ECM) in Austria and Blackstairs Lithium Limited (BLL) in Ireland for providing us with samples from their drill cores. Thanks to Axel Müller, Julian Menuge, Kerstin Saalmann, Marco Brönner, Ralf Steiner, William Keyser, and Encarnación Roda-Robles for collecting, describing, and sending us the samples. Many thanks to Marta Osinska and Jomar Gellein from NGU for the lab measurements and for taking the sample photos. We would also like to thank Anna Liinamaa-Dehls, Marco Brönner, and Klaus Brauch for reviewing the draft manuscript, as well as two anonymous reviewers that helped us to greatly improve the manuscript.

Conflicts of Interest

The authors declare no conflict of interest. The funders had no role in the design of the study; in the collection, analyses, or interpretation of data; in the writing of the manuscript; or in the decision to publish the results.

References

  1. European Commission. Critical Raw Materials. Available online: https://single-market-economy.ec.europa.eu/sectors/raw-materials/areas-specific-interest/critical-raw-materials_en (accessed on 20 November 2022).
  2. Bradley, D.C.; McCauley, A.D.; Stillings, L.M. Mineral-Deposit Model for Lithium-Cesium-Tantalum Pegmatites; U.S. Geological Survey Scientific Investigations Report 2010–5070–O; US Geological Survey: Reston, VA, USA, 2017; 48p. [CrossRef] [Green Version]
  3. Galeschuk, C.; Vanstone, P. Exploration Techniques for Rare-Element Pegmatite in the Bird River Greenstone Belt, Southeastern Manitoba. In Proceedings of the Exploration 07: Fifth Decennial International Conference on Mineral Exploration, Toronto, ON, Canada, 9–12 September 2007; Milkereit, B., Ed.; pp. 823–883. [Google Scholar]
  4. Steiner, B.M. Tools and Workflows for Grassroots Li–Cs–Ta (LCT) Pegmatite Exploration. Minerals 2019, 9, 499. [Google Scholar] [CrossRef] [Green Version]
  5. Trueman, D.L.; Černý, P. Exploration for Rare-Element Granitic Pegmatites. In Granitic Pegmatites in Science and Industry: Mineralogical Association of Canada, Short Course Handbook; Černý, P., Ed.; Mineralogical Association of Canada: Quebec, QC, Canada, 1982; Volume 8, pp. 463–493. [Google Scholar]
  6. Gupta, V.K.; Wadge, D.R. Gravity study of the Birch, Uchi, and Red lakes area, District of Kenora (Patricia Portion); Ontario Geological Survey, Report 252; Ontario Ministry of Northern Development and Mines: Sudbury, ON, Canada, 1986; 98p.
  7. Eberle, D.G.; Daudi, E.X.F.; Muiuane, E.A.; Nyabeze, P.; Pontavida, A.M. Crisp clustering of airborne geophysical data from the Alto Ligonha pegmatite field, northeastern Mozambique, to predict zones of increased rare earth element potential. J. Afr. Earth Sci. 2012, 62, 26–34. [Google Scholar] [CrossRef]
  8. McKechnie, C.L.; Annesley, I.R.; Ansdell, K.M. Geological Setting, Petrology, and Geochemistry of Granitic Pegmatites and Leucogranites Hosting U-Th-REE Mineralization at Fraser Lakes Zone B, Wollaston Domain, Northern Saskatchewan, Canada. Explor. Min. Geol. 2013, 21, 1–26. [Google Scholar]
  9. Ahtola, T.; Kuusela, J.; Käpyaho, A.; Kontoniemi, O. (Eds.) Overview of Lithium Pegmatite Exploration in the Kaustinen Area in 2003–2012; Geological Survey of Finland, Report of Investigation; Geological Survey of Finland: Espoo, Finland, 2015; Volume 220, 28p. [Google Scholar]
  10. Müller, A.; Reimer, W.; Wall, F.; Williamson, B.; Menuge, J.; Brönner, M.; Haase, C.; Brauch, K.; Pohl, C.; Lima, A.; et al. GREENPEG—Exploration for Pegmatite Minerals to Feed the Energy Transition: First Steps towards the Green Stone Age; Geological Society: London, UK, 2022; Volume 526. [Google Scholar] [CrossRef]
  11. Černý, P. Rare-element granitic pegmatites. Part I: Anatomy and internal evolution of pegmatite deposits. Geosci. Can. 1991, 18, 49–81. [Google Scholar]
  12. Bär, K.; Reinsch, T.; Bott, J. The PetroPhysical Property Database (P3)—A global compilation of lab-measured rock properties. Earth Syst. Sci. Data 2020, 12, 2485–2515. [Google Scholar] [CrossRef]
  13. Haase, C.; Brönner, M.; Pohl, C.M.; Osinska, M.; Gellein, J. EuroPeg_PetroDB: A Petrophysical Database of European Pegmatite Ores and Wall Rocks; NGU Report 2022.017; Geological Survey of Norway: Trondheim, Norway, 2022; 15p. [Google Scholar]
  14. Göd, R. The spodumene deposit at “Weinebene”, Koralpe, Austria. Mineral. Depos. 1989, 24, 270–278. [Google Scholar] [CrossRef]
  15. Hart, E.; Fegan, T. PL 4032 Review Report, Work Conducted between August 2019 and June 2021; Blackstairs Lithium Ltd.: County Wicklow, Ireland, 2021; 70p. [Google Scholar]
  16. Barros, R.; Kaeter, D.; Menuge, J.F.; Skoda, R. Controls on chemical evolution and rare element enrichment in crystallising albite-spodumene pegmatite and wallrocks: Constraints from mineral chemistry. Lithos 2020, 352–353, 105289. [Google Scholar] [CrossRef]
  17. Müller, A.; Husdal, T.; Sunde, Ø.; Friis, H.; Andersen, T.; Johnsen, T.; Werner, R.; Thoresen, Ø.; Olerud, S. Norwegian Pegmatites I: Tysfjord-Hamarøy, Evje-Iveland, Langesundsfjord. Geological Guides 6; Geological Society of Norway: Trondheim, Norway, 2017; 125p, ISBN 978-82-8347-020-8. [Google Scholar]
  18. Roda-Robles, E.; Villaseca, C.; Pesquera, A.; Gil-Crespo, P.P.; Vieira, R.; Lima, A.; Garate-Olave, I. Petrogenetic relationships between Variscan granitoids and Li-(F-P)-rich aplite-pegmatites in the Central Iberian Zone: Geological and geochemical constraints and implications for other regions from the European Variscides. Ore Geol. Rev. 2018, 95, 408–430. [Google Scholar] [CrossRef]
  19. Koziel, J.; Geological Survey of Norway, Trondheim, Norway. Personal communication, 2022.
  20. Haase, C.; Brönner, M.; Pohl, C.; Osinska, M.; Gellein, J. EuroPeg_PetroDB: A petrophysical database of European pegmatite ores and wall rocks, (1.0) [Data set]. Zenodo, 2022. [Google Scholar] [CrossRef]
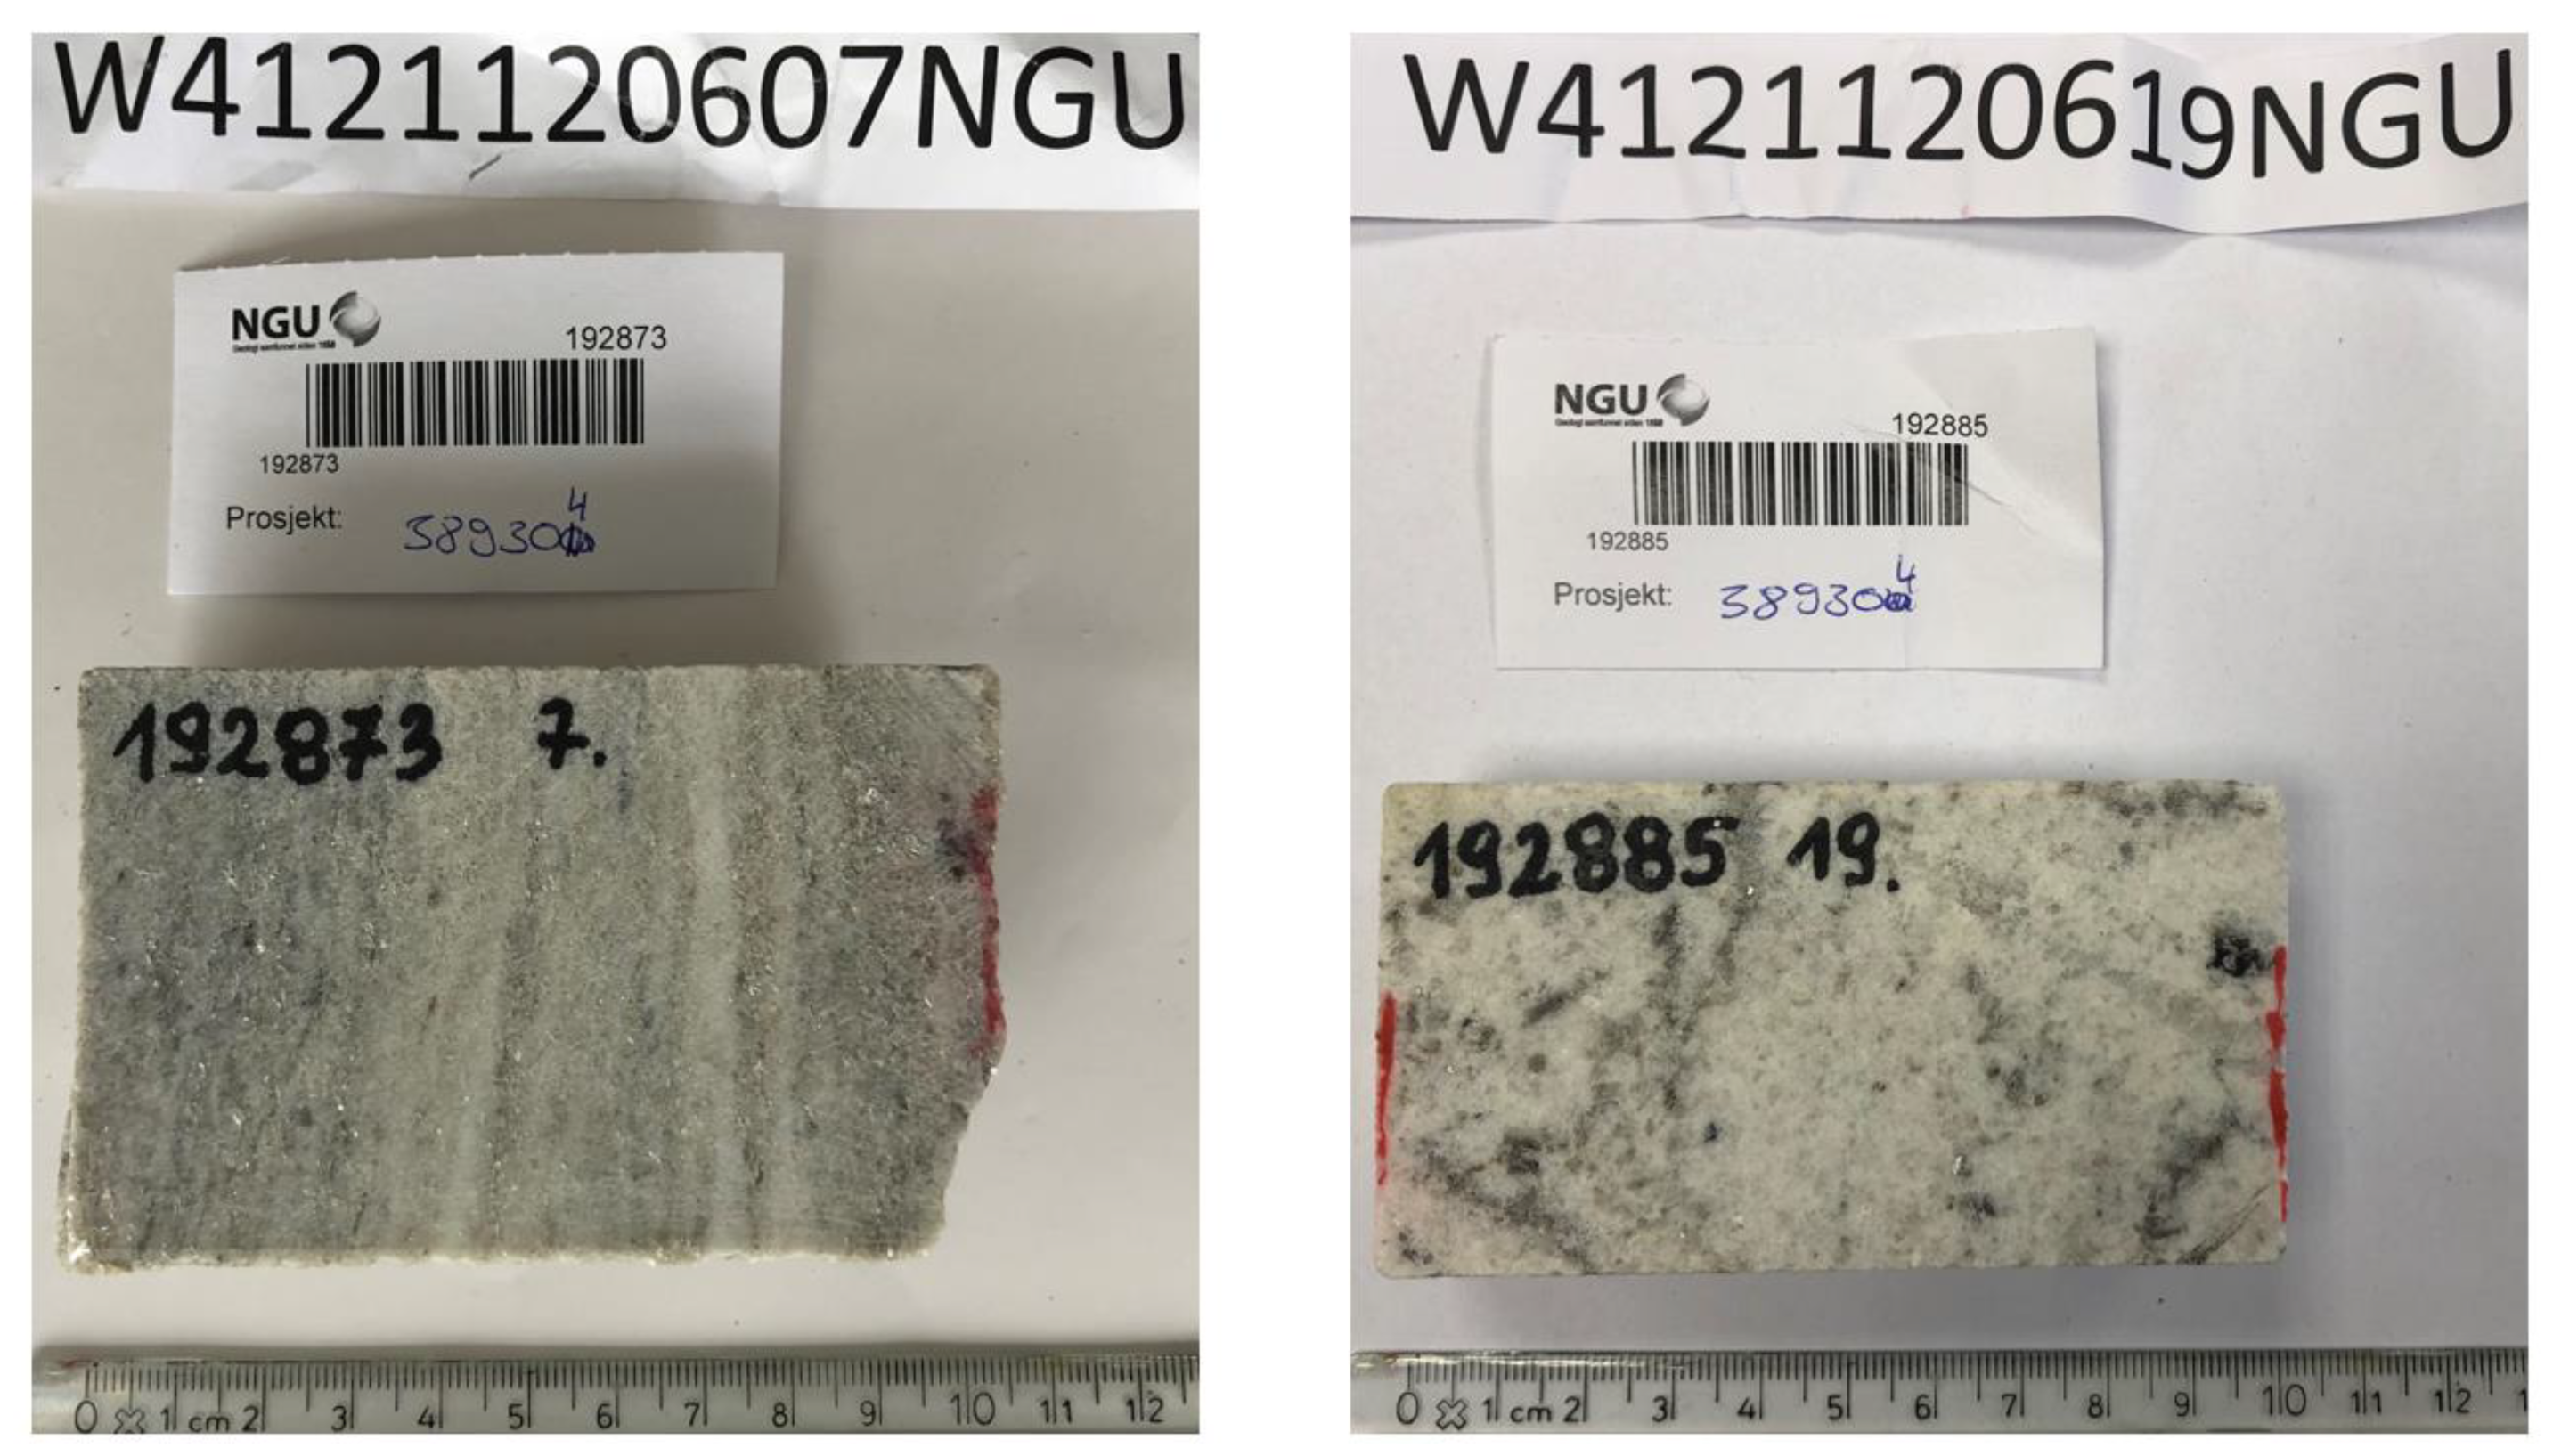
Figure 1. Photographs of two drill core samples from the LCT-type pegmatite at the Wolfsberg site, Austria. Left: Strongly foliated, mica schist-hosted spodumene pegmatite. Right: Non-foliated, amphibolite-hosted spodumene pegmatite.
Minerals 12 01498 g001
Figure 2. Sample locations from the Austrian site in Wolfsberg. Small circles indicate the locations of field samples from the mine. Large circles indicate the approximate locations of the confidential boreholes. The red frame in the inset map outlines the location map.
Minerals 12 01498 g002
Figure 3. Photographs of three drill core samples from the LCT-type pegmatite in South Leinster (Ireland). Top: Albitized pegmatite. Bottom left: Simple pegmatite with granophyric textures. Bottom right: Spodumene pegmatite.
Minerals 12 01498 g003
Figure 4. Location map with the sample sites in South Leinster (Ireland). All locations are borehole sites. The red frame in the inset map outlines the location map.
Minerals 12 01498 g004
Figure 5. The Tysfjord area in Norway with the locations of the samples for the petrophysical database indicated by orange dots. The dot cluster in the west is at the Håkonhals mine. The cluster in the east is at the Jennyhaugen mine and pegmatite occurrences in the surroundings. The red frame in the inset map outlines the location map.
Minerals 12 01498 g005
Figure 6. Photographs of two drill core samples from the Håkonhals mine at Tysfjord hosting NYF-type pegmatites. Top: Quartz core of the pegmatite. Bottom: Wall zone of the pegmatite.
Minerals 12 01498 g006
Figure 7. Locations of the database samples from the LCT-type pegmatite sites in Portugal (yellow) and Spain (green). The red frame in the inset map outlines the location map.
Minerals 12 01498 g007
Figure 8. Photographs from LCT-type pegmatites from the Portuguese and Spanish sites. Left: Lepidolite pegmatite from Gonçalo, Portugal. Right: Petalite pegmatite from Hinojosa de Duero, Spain.
Minerals 12 01498 g008
Figure 9. Selected examples from the database visualized as boxplots. Within each box, the central, red mark indicates the median. The top and bottom of the box indicate the 25th and 75th percentile, respectively. Extreme data points are indicated by the whiskers; outliers were removed. (ac) Data examples from the Wolfsberg site in Austria. (d,e) Examples from borehole logging data from the Irish site in South Leinster. (f) Data example from the Tysfjord site in Norway. Properties are plotted against the lithology codes used in the database (general and detailed): AMP: Amphibolite, MSC: Mica schist, PEG: Pegmatite. SL: South Leinster, TF: Tysfjord, 3a: Spodumene pegmatite, 3b: Simple (granitic) pegmatite, 3f: Albitized pegmatite, 3i: Quartz pegmatite, 3j: Feldspar pegmatite, 4a: Porphyritic granite, 4c: Metagranite, 5: Amphibolite. The full list of codes is given in the database itself [18].
Minerals 12 01498 g009
Table 1. Measurement uncertainties for different measuring ranges of magnetic susceptibility and remanence.
PropertyMeasuring RangeRelative Uncertainty (%)
Magnetic susceptibility (10−6 SI)<10060
100–10006
1000–100,0000.6
>100,0000.1
Magnetic remanence (mA/m)<140,0007.5
Table 2. Overview of the borehole probes applied, and the parameters used for the petrophysical database for each tool.
ProbeManufacturerParameter Used for DatabaseSample Rate
Dual Induction (DIL38)LIM LOGGING SA, LuxembourgFormation conductivity, long-spaced receiver coils1 cm
Uranium Exploration (UEP42)LIM LOGGING SA, LuxembourgFormation resistivity, Chargeability1 cm
Magsus (QL40-MGS)ALT—Advanced Logic Technology, LuxembourgMagnetic susceptibility1 cm
Spectral Gamma (GRS42)LIM LOGGING SA, LuxembourgSpectral Gamma Ray (K2O, U3O8, ThO2-content)10 cm
Full Wave Form Sonic (QL40-FWS)ALT—Advanced Logic Technology, LuxembourgFull Wave Form Sonic (Vp, Vs, Vp/Vs Ratio, Poisson’s Ratio, Shear Modulus *, Young’s Modulus *, Bulk Modulus *), total count natural Gamma Ray5 cm
* Only petrophysical values from borehole logging over lithological units (see Section 3.3.2).
Publisher’s Note: MDPI stays neutral with regard to jurisdictional claims in published maps and institutional affiliations.