Abstract
In pegmatites containing abundant petalite and spodumene, such as those from the Barroso–Alvão (BA) aplite-pegmatite field, calibrating a portable laser-induced breakdown spectroscopy (pLIBS) equipment to identify and analyze these minerals may be challenging. Forty-nine samples of spodumene, petalite and spodumene + quartz were collected from 22 aplite-pegmatites from the BA field and sent for inductively coupled plasma-mass spectroscopy analysis. One calibration for both spodumene and petalite has been proven to be impossible since almost all the LIBS intensity ratios, including for Li, overlapped on both minerals. Thus, three calibrations were developed: one qualitative to distinguish both minerals and two more quantitative, specifically made for each mineral. The first LIBS calibration only has Fe since it is the sole element with intensity ratios different enough to distinguish both minerals. Eleven calibration lines were created: Li, Al, Si, Be, Na, P, K, Mn, Fe, Rb and Cs; however, only the Li, Al, and Si have consistent errors below 20%. Thin sections were produced and observed with optical microscopy and cathodoluminescence (CL) to control the purity and mineral paragenesis of the samples. The petalite pellets were also controlled with cold CL since petalite crystals often present fine spodumene and quartz inclusions.
1. Introduction
The rising market of the lithium (Li) batteries used in a wide variety of products, from electric cars to smartphones and laptops, is feeding a crescent Li demand, increasing the risk of Li supply failure and skyrocketing the Li prices [1]. The mining and exploration companies keep investing in lithium exploration to find new deposits and try to meet this demand. Exploration tools such as handheld laser-induced breakdown spectroscopy (LIBS) are practical field tools that quantify Li and identify Li mineralization in a short-time analysis, requiring less than 5–10 s. However, for LIBS to work properly and provide reliable results, it requires calibrations with high accuracy and precision specifically made for each type of mineral that will be analyzed. Theoretically, each pegmatite field has its own geochemical signature, meaning that the same mineral can have slight differences in the crystal matrix shared by all the aplite-pegmatites of the same field. This study considers the necessity of a specialized calibration using the example of one of the Li deposits with the most potential in Western Europe, the Barroso–Alvão (BA) aplite-pegmatite field, in Northern Portugal, which contains a large quantity of two Li minerals: spodumene (LiAlSi2O6) and petalite (LiAlSi4O10).
Our study found that using one calibration for both spodumene and petalite does not provide accurate results for either mineral. However, thanks to Fe, one of the trace elements of spodumene, it was possible to develop three different calibrations and successfully analyze both minerals: calibration 1 (Fe_Barroso) to distinguish spodumene from petalite, and calibrations 2 (Pet_Barroso) or 3 (Spd_Barroso) to measure the lithium content and the other constituent elements of petalite (pet) and spodumene (spd).
2. Geological Setting
The Barroso–Alvão aplite-pegmatite field is located in the Northwest of the Iberian Peninsula, where hundreds of aplite-pegmatites, some spodumene-rich, other petalite-rich and Li-barren can be found mixed and without an apparent regional zonation (Figure 1). The aplite-pegmatites are emplaced in Silurian metasediments from the parautochtonous units of the Galiza Trás-os-Montes Zone (GTMZ). The GTMZ tectonic setting is due to the Variscan Orogeny (370 to 290 Ma), defined by a succession of three main deformation phases D1, D2 and D3, where the maximum metamorphic conditions correspond to the andalusite zone [2]. The emplacement of some aplite-pegmatites is controlled by the D2 and can be locally deformed by D3 (N130° and NS to N10°), whereas others have their emplacement controlled by D3. Therefore, the emplacement of the pegmatitic melt seems to have been ante- to sin-D3, with regional metamorphic conditions of 300 to 350 MPa, and temperatures reaching 500–550 °C [3]. Some aplite-pegmatites appear to have filled sub-horizontal and sub-vertical weakness zones, such as shear zones, and can be found parallel to each other in echelon-like structures.
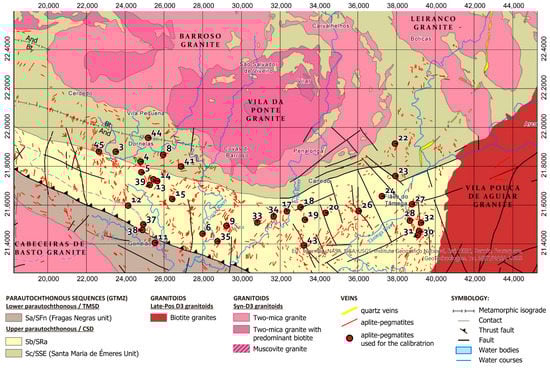
Figure 1.
Geologic map of the Barroso–Alvão aplite-pegmatite field with the location of the pegmatites used for the LIBS calibrations (red dots). Coordinates system: ETRS 1989 Portugal TM06. Adapted from Rodríguez Fernández, et al. [4], Agência Portuguesa do Ambiente [5,6], Sant’Ovaia, et al. [7] and Ribeiro, et al. [8]. © Agência Portuguesa do Ambiente (APA). Available online: https://sniamb.apambiente.pt/content/geo-visualizador (accessed on 19 July 2022).
3. Spodumene and Petalite Petrography
The shear zones, besides being able to control the aplite-pegmatites emplacement, can also affect their Li mineralogy, Li distribution and mineralogical texture. Therefore, the shear zones may form alignments of fine mixtures of spodumene + quartz, corresponding to Li-rich zones where Li has been concentrated both in spodumene-rich and petalite-rich aplite-pegmatites. These fine-grained mixtures can be difficult to identify as two different minerals since they look homogenous to the naked eye [9,10,11,12,13,14]. The breakdown of petalite into spodumene + quartz (SQI—Spodumene Quartz Intergrowth) is also a common phenomenon in the petalite-rich aplite-pegmatites of the BA aplite-pegmatite field.
Currently, it is assumed that not all the aplite-pegmatites from the BA field are coetaneous [15]. At least two different pulses of crystallization have been recognized. Lithium-aluminosilicates (spodumene and petalite) have been found in aplite-pegmatites belonging to the two pulses, with different textural relationships among them. Three generations of spodumene and two of petalite have been found (Figure 2). The first generation of spodumene is primary (Figure 2, example 1) and occurs in the aplite-pegmatites crystallized during the first pulse. The associated pegmatitic melt was Sn-poorer and Fe-richer than the next pulse of melt that formed aplite-pegmatites containing primary petalite (Figure 2, example 2). These later aplite-pegmatites present a significant amount of cassiterite, which was mined for Sn during World War II. Now they are commonly found as old mining works that left narrow holes in the landscape in the place where the aplite-pegmatites outcropped. A second generation of petalite can also be found surrounding other minerals from the matrix of aplite-pegmatites, including primary spodumene [13,16] (Figure 2, example 1B). The second generation of spodumene is the spodumene and quartz intergrowths formed through the breakdown of the primary petalite (Figure 2, example 2A–C). Later, a third generation of spodumene (subsolidus) was formed favored by regional deformation and can be found in aplite-pegmatites belonging to the two pulses as alignments of fine aggregates of spodumene and quartz or acicular crystals of spodumene (<100 μm) growing around crystal contacts or crosscutting other crystals (Figure 2, example 1A and Figure 2, example 1D).
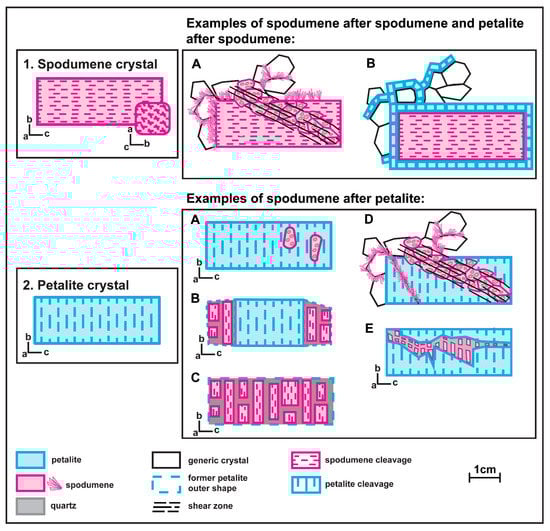
Figure 2.
Examples of the distinct spodumene and petalite textures found in the aplite-pegmatites of the Barroso–Alvão pegmatite field.
4. Materials and Methods
Forty-nine samples were used for the LIBS calibration with crystals collected from the BA aplite-pegmatite field: B—petalite; C—spodumene; and D—mixtures of spodumene and quartz.
The samples were retrieved from 22 aplite-pegmatites from Li-barren and Li-rich aplite-pegmatites containing spodumene and/or petalite. There was a total of 15 petalite crystals from 9 aplite-pegmatites, 19 spodumene crystals from 11 aplite-pegmatites, and 14 mixtures of spodumene and quartz from 9 aplite-pegmatites. Some of these aplite-pegmatites contributed to all three types of crystal samples: B, C and D.
All the crystal samples were photographed and divided into three parts: 1/3 was kept in crystal form (Figure 3) and the other 2/3 were milled with a mortar grinder Retsch Mortar Grinder RM 200 (Retsch GmbH, Haan, Germany) and sifted with a Retsch Test Sieve (Retsch GmbH, Haan, Germany) to <125 μm of grain size. From the sifted sample, ½ was pressed with the hydraulic press Specac Atlas Manual (Specac Ltd., Orpington, England) at 10 tons during 45 s into 13 mm diameter pellets (0.6 to 0.7 g) (Figure 4). The other ½ was sent to the certificated laboratory ActLabs, in Ancaster, ON, Canada, to be analyzed using inductively coupled plasma mass spectrometry (ICP-MS). To control the quality of the Actlabs results, we also sent (with other names) two duplicates (one of a spodumene crystal and another of a mixture of the spodumene and quartz), two blanks (hydrothermal quartz from the Panasqueira mine) and a Standard Reference Materials (SRM): NIST SRM 182—Petalite.
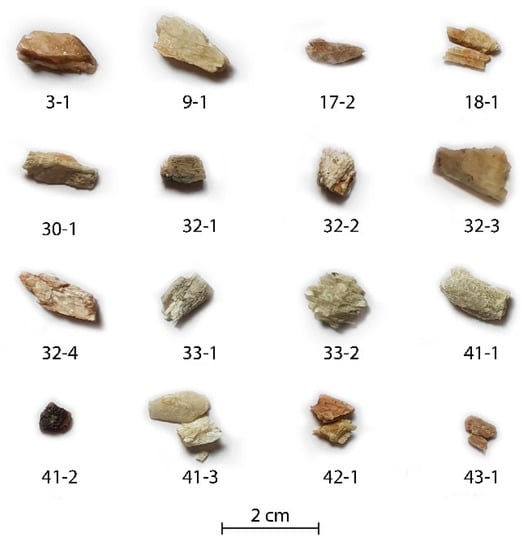
Figure 3.
Spodumene crystals (after dividing them into three parts) from the aplite-pegmatites: 3, 9, 17, 18, 30, 32, 33, 41, 42 and 43 (the numbers after the dash correspond to the identification number of the crystal collected from each aplite-pegmatite, since sometimes more than one crystal was collected from the same aplite-pegmatite).
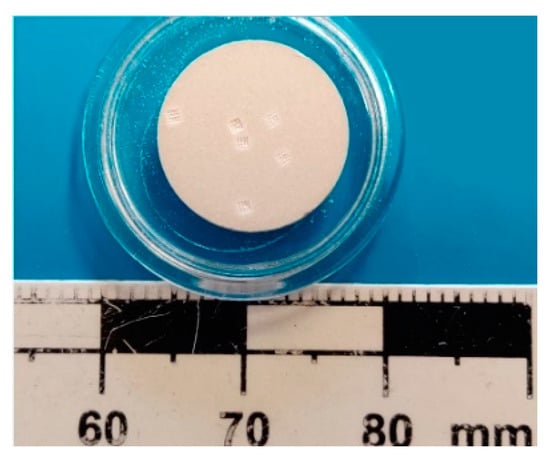
Figure 4.
Spodumene pressed pellet used for the LIBS calibration.
The Al, Li, K and Si results from ICP-MS used for the pLIBS calibration were from sodium peroxide fusion (Actlabs package: Ore-Assays—8-Peroxide ICP-OES + ICP-MS), where the ActLabs procedure consisted in fusing the samples in a zirconium crucible, dissolving them in purified water, acidifying them with concentrated nitric and hydrochloric acids, and analyzing them with an ICP-MS and ICP-OES (inductively coupled plasma optical emission spectrometry). As QA and QC, ActLabs also prepared and analyzed a duplicate at each 10th sample, and a blank at every 30th sample.
The As, Be, Cs, Ca, Fe, Ga, Mn, Na, Nb, Ni, P, Pb, Rb, Sn, Sr, Ta, Tl, U and Zn results from ICP-MS were obtained by digesting the samples with four acids (HF, HClO4, HNO3 and HCl), (package: 4-Acid “Near Total” Digestion—UT-6M). According to ActLabs, the digestion of the samples started with hydrofluoric, followed by a mixture of nitric and perchloric acids, and after heating the samples to incipient dryness, they were brought back into solution using aqua regia. Only then were the samples analyzed with ICP-MS.
When the selected crystals from the BA aplite-pegmatite field were sufficiently large (>2 × 1 cm), a fourth piece was saved to produce thin sections and check the sample purity. Thus, six thin sections were made: four petalites (from the aplite-pegmatites 5, 38, 41 and 44) and two mixtures of spodumene and quartz (from the aplite-pegmatites 4 and 8). No pure spodumene crystal was made into a thin section due to their smaller size.
The thin sections and all the petalite pellets were observed under cold-cathodoluminescence (CL) microscopy with a cold cathode electron gun Citl Mk 4 coupled to a Nikon OPTIPHOT-POL polarizing microscope. The goal was to verify the purity of the petalite pellets since petalite and spodumene are often found together in the BA field. CL can easily show spodumene next to petalite since their luminescence intensity is very different, even if the material is milled into fine powders. As much as 5 kV in CL is sufficient to see the bright luminescence of spodumene; however, see the dark blue luminescence of petalite, the voltage must be increased to 9–10 kV.
The observations from CL led to an X-ray diffraction (XRD) analysis on the NIST SRM 182 (petalite) performed at the National Laboratory of Energy and Geology (LNEG, São Mamede de Infesta, Portugal), with a Panalytical Diffractometer XPERT-PRO, equipped with a PW3050/60 goniometer, with a Theta-2Theta geometry and X-ray tube with a copper (Cu) anticathode.
The ICP-MS chemical results from ActLabs were uploaded to our handheld SciAps Z-300 LIBS in a .csv file using the software Profile Builder to build the calibration curves to analyze the samples.
The LIBS equipment SciAps Z-300 analyzes the samples by focusing a pulsed laser (5 mJ per pulse, 1064 nm Nd:YAG laser) on its surface and forming a plasma that vaporizes small spots of the sample in an atmosphere of Argon (10–11 psi). A portion of the plasma light (emitted by excited atomic and ionic species in the plasma) is then directed into the inbuilt spectrometer system (with a resolution of 190–950 nm) that disperses the light and records the emission signals producing a spectrum. Most elements have at least a few strong emission lines and the wavelengths of those emission lines are the identification parameters. The location of the emission lines at specific wavelengths, the intensity of the lines and the relative intensities of the lines is what is used to analyze the spectrum to determine the composition of the sample after creating the calibration curves [17,18].
The acquisition settings for the calibration were the following: 12 locations (4 locations by 4 locations, total size of the area analyzed = 0.5 × 0.5 mm), spot size of 50 μm, 1 clean shot per location, 4 data shots per location, test rate of 10 Hz.
Construction of Calibration Lines for the Handheld LIBS
The following tables contain the data from the ICP-MS analysis uploaded in the handheld LIBS to produce the calibration lines used in the Spd_Barroso calibration (Table 1) to analyze spodumene, Pet_Barroso calibration (Table 2) to analyze petalite and Fe_Barroso calibration (Table 1 and Table 2) to use in case of not knowing whether the mineral is spodumene or petalite.

Table 1.
Geochemical results of spodumene (spd) from the ICP-MS used on the “Spd_Barroso” and “Fe_Barroso” calibrations of the portable LIBS.
Table 2.
Petalite (pet) chemical results from the ICP-MS (inductively coupled plasma mass spectrometry) used on the “Pet_Barroso” and “Fe_Barroso” calibrations of the portable LIBS (laser-induced breakdown spectroscopy).
For each calibration, three shots were performed in the same spot for each pellet to avoid surface contamination. The 3rd shot of each sample was used to create the calibration lines for the chemical elements detected both in ICP-MS and LIBS in spodumene and petalite: Li, Al, Si, Be, Na, P, K, Mn, Fe, Ga, As, Rb, Sr, Nb and Sn.
The calibration lines were produced by plotting each sample in an XY-chart with the ICP-MS concentration against the Intensity Ratio (IR) of that element in the spectra.
In the LIBS spectra, each chemical element displays certain peaks at specific wavelengths with different intensities. The IR was calculated by dividing the total area of the peaks by the total area of all the peaks in the spectra. For example, Li in the spectra of spodumene and petalite has three main peaks (610 nm, 670 nm and 810 nm). The sum of the area of the three peaks divided by all the peaks in the spectra is equal to the IR of Li in the sample.
Theoretically, less concentration should result in a lower IR and a higher concentration in a higher IR.
5. Results
5.1. Petrography of the Thin sections
5.1.1. Petalite Crystal 1 of the Aplite-Pegmatite 38 (Also Known as Gondiães 91)
The sample 38-B1 (Figure 5) was almost pure petalite except for a part with spodumene and quartz crosscutting the petalite crystal, just as in example E of spodumene after petalite, from Figure 2. The petalite from the thin section did not show signs of deformation, hydrothermal alteration or weathering.
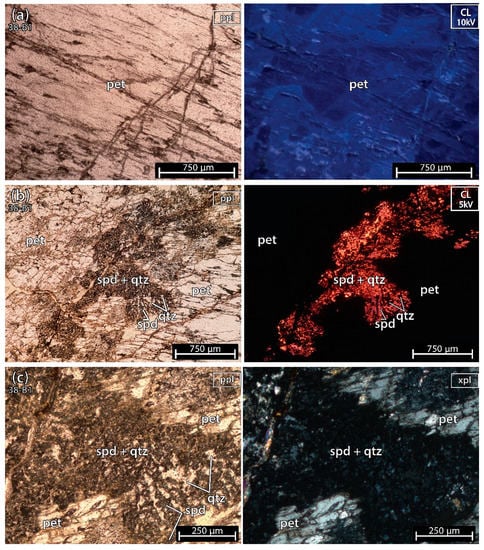
Figure 5.
Microphotographs in parallel polarized light (ppl), crossed polarized light (xpl) and cold cathodoluminescence (CL) microscopy from a petalite (pet) fragment of the crystal sample 1 of the aplite-pegmatite 38 (38-B1). Although most of the sample is petalite, there is an alignment of spodumene (spd) and quartz (qtz) crosscutting the petalite crystal from one side of the thin section to the other. (a) petalite; (b,c) spodumene and quartz mixture crosscutting the petalite crystal.
Since spodumene has a very strong luminescence in cathodoluminescence (CL) (bright orange to purple) (Figure 5b), it is easy to find it next to petalite that has a dark blue luminescence (Figure 5a). Petalite will look black and overshadowed by the strong luminescence of spodumene. To see the blue luminescence of petalite, it needs to be distant from spodumene. In CL, quartz also looks almost black next to spodumene since it has a very dark luminescence and is commonly found intergrowing with spodumene. Thus, the petalite sample 38-B1, used for ICP-MS and LIBS, could contain traces of spodumene and quartz mixed within the petalite, as it was later demonstrated by the CL microscopy on the petalite pellets.
5.1.2. Petalite Crystal 2 of the Aplite-Pegmatite 5 (Also Known as 59-AL-023)
The sample 5-B2 (Figure 6) was almost pure petalite except for a microscopic fine spodumene and quartz inside one of the petalite fractures (similar to example A, of spodumene after petalite, from Figure 2). Locally petalite was altered into micas and clay.
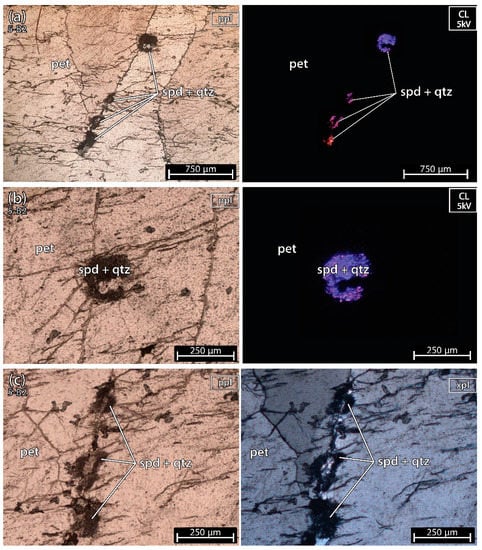
Figure 6.
Microphotographs in parallel polarized light (ppl), crossed polarized light (xpl) and cold cathodoluminescence (CL) microscopy (CL) from a petalite (pet) fragment of the crystal sample 1 of the aplite-pegmatite 38 (38-B1). (a–c) spodumene + quartz in a fracture of petalite. In CL, the color of spodumene varies from bright purple to orange, while petalite and quartz look almost black next to spodumene observed at 5–6 kV.
The petalite in this sample was deformed, showing undulose extinction, and in CL the spodumene had a purple-to-orange luminescence (Figure 6a,b in CL). The purple luminescence of spodumene could be related to the deformation and formation of this type of fine spodumene + quartz association. Cathodoluminescence in silicates is known to be used to recognize brittle or ductile deformation phases, pressure dissolutions, relict structures, and recrystallizations [21].
The pellet 5-B2 also shows some spodumene in the CL microscopy, as was observed in the thin section (Figure 11).
5.1.3. Petalite Crystal 2 of the Aplite-Pegmatite 41 (Also Known as NOA)
Sample 41-B2 (Figure 7) was pure petalite and did not have undulose extinction recrystallization and/or alteration. Despite the sample not having spodumene, previous studies have identified its presence in this aplite-pegmatite (e.g., Dias [13], identified as AL-56).
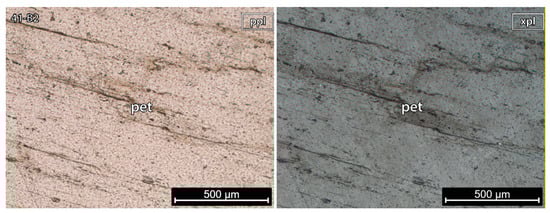
Figure 7.
Microphotographs in parallel polarized light (ppl) and crossed polarized light (xpl) from a petalite (pet) fragment of the crystal sample 2 of the aplite-pegmatite 41 (41-B2). This is a pure petalite crystal without any traces of other minerals.
The petalite pellet 41-B2 observed in CL microscopy did not have any spodumene (Figure 11).
5.1.4. Petalite Crystal 2 of the Aplite-Pegmatite 44 (Also Known as Antigo)
Sample 44-B2 (Figure 8), besides containing several crystals of petalite, also contained a part of the aplite-pegmatite rock where quartz, plagioclase, white micas, Fe-Mn phosphates and apatites could be seen. In CL, next to petalite (dark blue color) at 10 kV, the quartz looked black, the micas and the Fe-Mn phosphates non-luminescent, the plagioclases dark green and the apatite had a bright greenish yellow luminescence (Figure 8a).
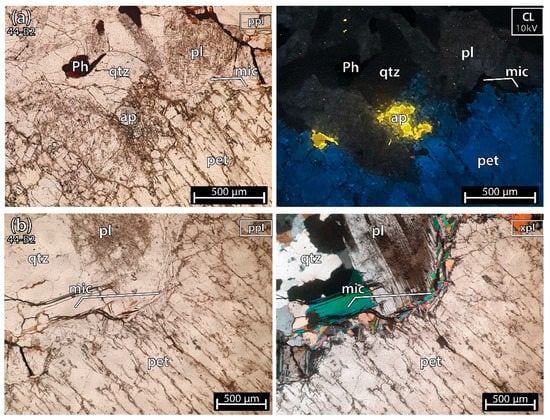
Figure 8.
Microphotographs in parallel polarized light (ppl), crossed polarized light (xpl) and cold cathodoluminescence (CL) microscopy from a petalite (pet) fragment of the crystal sample 2 of the aplite-pegmatite 44 (44-B2), also known as Antigo. This sample contains a great amount of other minerals such as: (a) plagioclases (pl), quartz (qtz), Fe-Mn phosphates (Ph) and apatites (ap); (b), white micas (mic), plagioclases (pl), quartz (qtz).
The crystals of petalite did not host any spodumene or quartz, and had some micas along the contacts (Figure 8b). Thus, if the rest of the 44-B2 sample used for ICP-MS and LIBS also only had petalite, the petalite could be relatively pure, as was demonstrated by the CL performed in the 44-B2 pellet.
In CL at 10 kV, the petalite has a dark blue luminescence, the plagioclases are dark green, the quartz is almost non-luminescent, the white micas and the Fe-Mn phosphates seem non-luminescent and the apatites are bright greenish yellow.
5.1.5. Mixture of Spodumene and Quartz 2 of the Aplite-Pegmatite 8 (Also Known as 59-AL-52)
Sample 8-D2 (Figure 9) was almost only spodumene and quartz except for a small altered part with clay and micas.
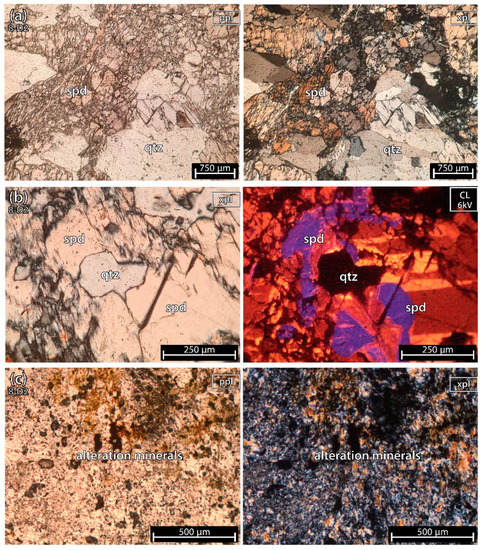
Figure 9.
Microphotographs from a fragment of a mixture of spodumene (spd) and quartz (qtz) sample 2 of the aplite-pegmatite 8 (8-D2), also known as 59-AL-52. (a) parallel polarized light (ppl) and crossed polarized light (xpl). (b) xpl and cold cathodoluminescence (CL) microscopy (CL). This sample is almost all pure spodumene and quartz, except for a small portion of alteration minerals composed of clays and micas (c). In cold-CL microscopy, at 6 kV, spodumene has three main colors: yellow, orange and purple. All three colors have a similar strong luminescence. The quartz looks black next to the strong luminescence of spodumene.
5.1.6. Mixture of Spodumene and Quartz 2 of the Aplite-Pegmatite 4 (Also Known as 59-AL-22)
Sample 4-D2 (Figure 10), besides containing a part with fine spodumene + quartz (grain size < 500 μm) (Figure 10a,b), also comprises a part of the aplite-pegmatite rock with abundant feldspar, quartz, micas and minor apatite (with grains measuring up to 2 cm in size—Figure 10c).
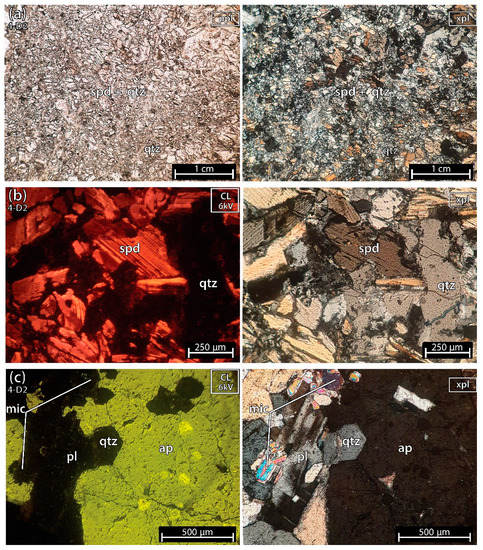
Figure 10.
Microphotographs in parallel polarized light (ppl), crossed polarized light (xpl) and cold cathodoluminescence (CL) microscopy from a fragment of a mixture of spodumene (spd) and quartz (qtz) from sample 2 of the aplite-pegmatite 4 (4-D2), also known as 59-AL-22. (a,b) Mixtures of fine spodumene and quartz. (c) aplite-pegmatite rock constituted by abundant plagioclase (pl), quartz, white mica (mic), and several crystals of apatite (ap) with sizes between 100 μm and 2 cm.
5.2. Petalite Pellets Analyzed with Cold-Cathodoluminescence Microscopy
The petrography performed on the petalite thin sections 38-B1 and 5-B2 (Figure 5 and Figure 6) had already alerted us to spodumene and quartz inside the petalite crystals.
CL was chosen to check the purity of the petalite pellets since this method can easily differentiate petalite from spodumene even if the minerals are milled into fine powders (<125 μm of grain size), as their luminescence intensity is very different (Figure 11). Spodumene always has a bright luminescence (with a color between orange and purple) and petalite has a dark luminescence (in shades of blue) [22,23].
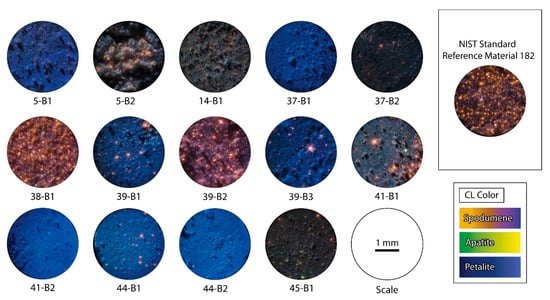
Figure 11.
Microphotographs in cold cathodoluminescence (CL) of the petalite pellets made with the different samples of the aplite-pegmatites of the BA field. The CL color of petalite is blue, spodumene has CL colors between orange and purple, and apatite goes from green to yellow. Spodumene and apatite have a very strong luminescence and petalite has a weak luminescence. All pictures were taken with the same acceleration voltage (approximately 6 kV) [11,13,16,19,20].
According to the CL observations (Figure 11) and based on the visual percentage estimation, the summarized results are the following (Figure 12):
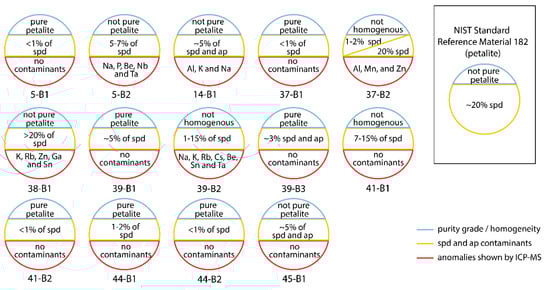
Figure 12.
Summarization of the cold cathodoluminescence (CL) observations, based on visual percentage estimation of petalite, spodumene (spd) and apatite (ap). Since the strong luminescence of spd and ap usually creates a halo of light around it (making them seem larger), the results from the visual estimation are probably overestimated.
Detailed CL observations complementing Figure 12:
- sample 5-B1 was essentially pure petalite with less than 1% of possible spodumene and other bright minerals;
- sample 5-B2 had a destroyed surface after the LIBS ablation. However, it was possible to see approximately 5%–7% of bright orange minerals, probably spodumene. The rest of the material was very dark. This could be the result of the pellet being destroyed and the shadows formed by the irregular surface hiding the luminescence of the petalite. Alternatively, the sample could contain several non-luminescent or poorly luminescent minerals. However, since the ICP-MS results for this sample indicated positive anomalies in Na, P, Be, Nb and Ta, the last option is the most likely (Table 2);
- sample 14-B1 had around 5% of bright luminescent minerals, some green and some orange in CL, probably spodumene and apatite. The blue luminescence of the rest of the material was weaker than some of the other petalite pellets, possibly indicating the presence of other non-luminescent or poorly luminescent minerals. Since the ICP-MS results indicated positive anomalies in Al, K and Na, this could indicate the presence of feldspars and micas mixed with the petalite (Table 2).
- sample 37-B1 was essentially pure petalite with less than 1% of bright orange minerals, probably spodumene;
- sample 37-B2 had zones that were essentially pure petalite (with 1%–2% of spodumene) and zones with aggregates of around 1mm in size of what seems to be spodumene + quartz (Figure 13). In the ICP-MS results, this sample had a positive anomaly in Al, Mn, and Zn (Table 2);
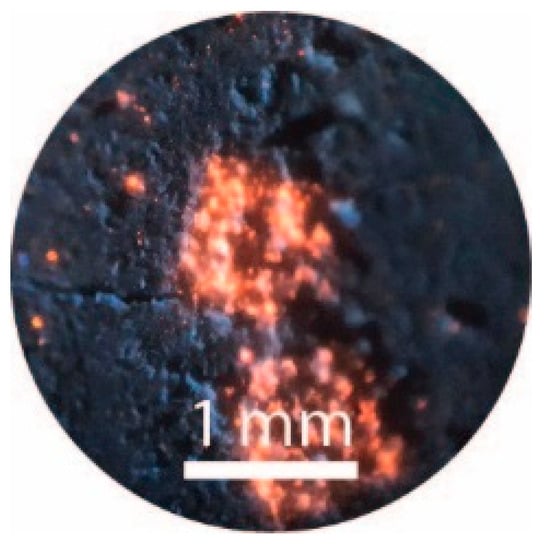 Figure 13. Micro-photograph in cold cathodolumi-nescence (CL) of spodumene + quartz aggregates in the sample 37-B2.
- sample 38-B1 seemed to have more than 20% of spodumene, since it had a high amount of bright orange minerals. Besides, the ICP-MS results indicated the possible presence of other minerals, such as feldspar and micas, since this sample contained positive anomalies in K, Rb, Zn, Ga and Sn;
- sample 39-B1 was essentially petalite with about 5% of spodumene;
- sample 39-B2 had some zones richer and other zones poorer in strong luminescent minerals, thus varying from 1 to 15% of what seems to be spodumene grains. In the ICP-MS results, this sample also had a positive anomaly in Na, K, Rb, Cs, Be, Sn and Ta (Table 2);
- sample 39-B3 was pure petalite with approximately 3% of other bright minerals, including probable spodumene;
- sample 41-B1 had some zones richer and other zones poorer in strong luminescent minerals, thus varying from 7 to 15% of what seemed spodumene grains;
- sample 41-B2 was essentially pure petalite with less than 1% of bright orange minerals;
- sample 44-B1 was almost pure petalite with 1%–2% of bright orange minerals;
- sample 44-B2 was essentially pure petalite with less than 1% of bright orange minerals;
- sample 45-B1 had around 5% of strong luminescent minerals, some bright orange, others bright green. The CL luminescence of this pellet was darker than the other petalites, but the ICP-MS results from this sample did not have any significant anomalies.
Therefore, according to the CL analysis, the purest petalite pellets should be the 5-B1, 14b-1, 37-b1, 39-B1, 39-B3, 45-B1, and the samples with more than 5% of other minerals are 5-B2; 37-B2; 38-B1, 39-B2; 41-B1 and the NIST SRM 182.
5.3. NIST SRM 182 (Petalite)
Since the visual estimation from CL seemed to indicate that the NIST SRM 182 (petalite) contained a large amount of spodumene (Figure 11), an analysis of X-ray diffraction (XRD) was performed in this SRM. The XRD results showed that approximately 90% was petalite, 6% was spodumene, 4% was quartz and that there was <1% of phyllosilicates (Figure 14).
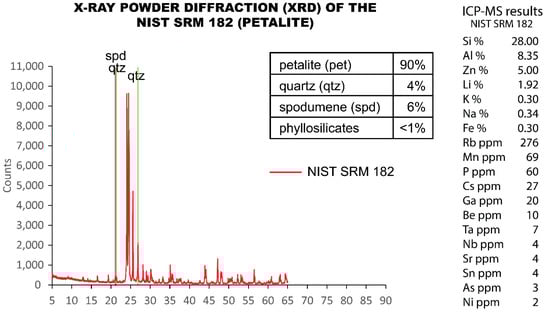
Figure 14.
X-ray powder diffraction (XRD) analysis performed on the NIST SRM 182 (petalite) compared to the ICP-MS analysis. ICP-MS errors of the quality control samples sent to Actlabs.
For QC of the ICP-MS analysis, the following samples were sent to the Actlabs laboratories: one duplicate of spodumene (03-C1/03-C2), one duplicate of the mixture of spodumene and quartz (08-D2/08-D3) and one sample with NIST SRM 182 (petalite).
The errors (Table 3) resulting from the comparison between the duplicates and the certified Li content of the NIST SRM 182 (petalite) for the main constituents of the different minerals were:
Table 3.
ICP-MS errors in the samples sent for quality control (QC).
- spodumene: 16% of error for Si, 0% of error for Al, 1% of error for Li and 11% of error for Fe;
- spodumene and quartz mixture: 18% of error for Si, 1% of error for Al, 3% of error for Li and 0% of error for Fe;
- NIST SRM 182 (petalite): 5% for Li.
The silica (Si) and iron (Fe) errors of the ICP-MS for spodumene were excessively high (16% for Si and 11% for Fe) and negatively affected the calibrations of the portable (p)LIBS. The Si significant errors of the ICP-MS prevent distinguishing spodumene from petalite based on their Si contents (Figure 15). Other techniques, even qualitative ones such as the energy dispersive X-Ray from scanning electron microscopy (EDS-SEM), can easily distinguish a spodumene from a petalite since their Si and Al contents are very different. The theoretical values for spodumene are Si 30.18% and Al 14.50%, and for petalite, Si 36.72% and Al 8.75%.
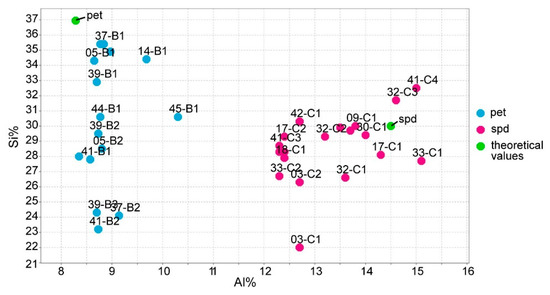
Figure 15.
ICP-MS analysis of Si using Al for all the spodumene and petalite samples used on the calibrations of the portable laser-induced breakdown spectroscopy (pLIBS).
5.4. ICP-MS Errors from the Duplicates Made by Actlabs
Even the errors from the laboratory itself show that the Si from the ICP-MS cannot be trusted since the Si from the duplicates produced by ActLabs for petalite had an error of 26% (Table 4), and Fe had an error of 10% for spodumene (Table 5).
Table 4.
ICP-MS errors from the duplicates made in Actlabs for the major elements of petalite, spodumene and quartz with the method FUS-Na2O2.
Table 5.
ICP-MS errors from the duplicates made in Actlabs for the trace-elements of K-feldspar, petalite, spodumene and quartz with the method 4 Acid “Near Total” digestion.
6. Discussion
6.1. Implications of the Petalite Pellets Analysis with Cathodoluminescence
As feared, the CL demonstrated a high amount of bright orange minerals in some petalite pellets (samples 38-B1, 39-B2 and even the NIST SRM 182, Figure 11). From our petrographic results, these are spodumene minerals (thin sections 38-B1 and 5-B2) (Figure 5 and Figure 6). Since spodumene was intergrown with quartz in the thin sections, the pellets will probably also have quartz (almost non-luminescent in CL and almost black next to spodumene and petalite). However, if spodumene and quartz are the result of the petalite breakdown, then quartz will be in less quantity than spodumene. This would explain the identical chemical composition to that of petalite if the volumetric proportions are approximately 60% spodumene and 40% quartz [24] (Table 6):
Table 6.
Breakdown of petalite into spodumene and quartz intergrowth (SQI).
This could also explain why although NIST SRM 182 has the same chemical composition as that of petalite, it has a different mineralogical composition as demonstrated by some strong luminescent minerals in CL together with weak luminescent minerals (Figure 11). Therefore, the SRM 182 is not a pure petalite mineral as confirmed using XRD (Figure 14).
The presence of spodumene and quartz in the petalite samples could be a problem for the pLIBS equipment since this equipment can be very sensitive to changes in the matrix that can cause the spectra to change by altering the area of the peaks disproportionately to the element concentration [25]. Thus, these samples must be analyzed with extra precautions.
The bright green dots observed in CL in some of the petalite pellets are probably apatite since it is common to find apatite in the aplite-pegmatites of the BA field, as was observed in the thin section of sample 4-D2 (Figure 10c).
6.2. Identifying Spodumene, Petalite and Mixtures of Spodumene and Quartz Based on Their Chemical Composition
The Li, Si and Al contents of spodumene and petalite should be sufficient to distinguish both minerals if the analysis method has accurate results (unlike the Si from ICP-MS). However, it may be difficult to distinguish a petalite from fine mixtures of spodumene and quartz (often invisible to the naked eye in the BA field) if they have SQI proportions [24]. Thankfully, in nature, the minerals will hardly have this theoretical composition since minor substitutions commonly occur in their crystal structure. For example, spodumene crystals in nature always have some significant amount of Fe and/or Mn substituting some of the Al in their crystal structure. As for petalite, it is usually more difficult for other elements to enter its crystal structure, although it can also happen [26,27,28].
The spodumene from the BA field always has more Fe than Mn (Fe > 1%), which is also evidenced by their color, which is never pink and is always cream-colored or greenish, and the petalite from the BA field always has low Fe contents (Fe < 1%) (ICP-MS analysis from Table 1 and Table 2 [16].
Therefore, with the Fe and Al contents from the ICP-MS chemical analysis, it was possible to distinguish these three types of materials (Figure 16, produced in the IoGas software with the Auto-Domain tool), since the Al contents of spodumene will always be greater than the Al contents of petalite and greater than the Al contents of the mixtures of spodumene and quartz (the presence of quartz dilutes Al), whereas petalite will always have less Fe than spodumene.
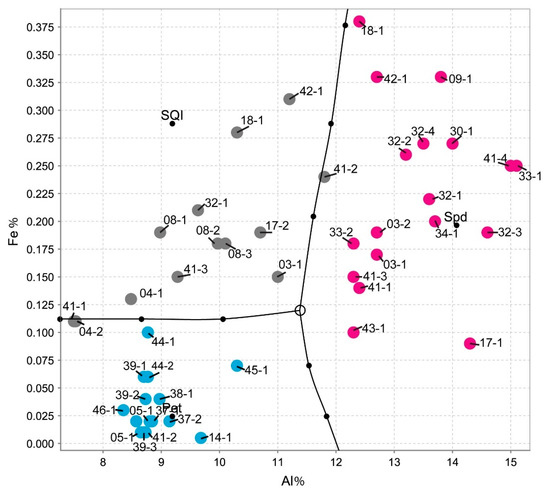
Figure 16.
Differentiating spodumene from petalite and from spodumene + quartz mixtures based on the Al and Fe content from the ICP-MS analysis (graph made in the IoGas software with Auto-Domain tool from the analysis tab, with common covariance matrix, coarse accuracy, and no limit in the cutoff M distance). The pink dots are spodumene crystal samples, the grey are mixtures of spodumene and quartz samples and the blue are petalite crystal samples.
Theoretically, with a calibrated handheld LIBS, the same should be possible. However, there was a problem. All the chemical elements with detectable peaks in the spectra (Figure A1) of the pLIBS had overlapping intensity ratios (IR) for spodumene and petalite, except for Fe (Figure 17). Since Al also had overlapping IR, it was impossible to use the pLIBS to separate the fine mixtures of spodumene and quartz from single spodumene crystals (Figure 18). Furthermore, analyzing a spodumene and petalite with a single calibration for both minerals did not work, especially for Li, one of the elements with more overlapping IR (Figure 19). However, Fe solved this problem. Three calibrations were developed for spodumene and petalite: one to analyze spodumene (Figure 20) another to analyze petalite (Figure 21) and another one to distinguish spodumene from petalite by using their different Fe contents (Fe was the only element where one calibration line was possible for both minerals). This worked because the LIBS intensity ratios (IR) for Fe are always higher in spodumene (IR ≥ 0.0038) than in petalite (IR < 0.0038) (Figure 17). This way the Fe_Barroso calibration can guide you to choose the right calibration since an IR of 0.0038 corresponds to 0.128% of Fe by the produced calibration curve: y = −0.0076 + 31.8368x + 1028.9114x2. Thus, every time a petalite is analyzed with the Fe_Barroso calibration, the Fe result will be less than 0.128% indicating that the Pet_Barroso calibration should be used, and the Fe will be greater than 0.128% in a spodumene indicating that the Spd_Barroso calibration should be used.
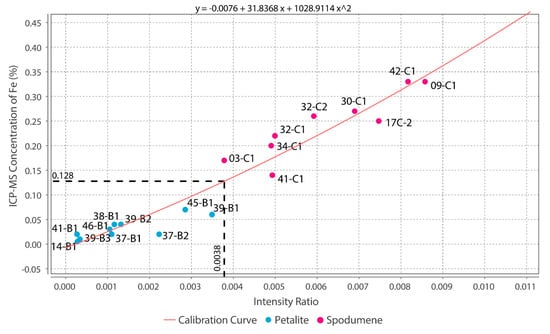
Figure 17.
Successful separation of the pLIBS Fe intensity ratios for the spodumene and petalite samples of the Barroso–Alvão aplite-pegmatite field.
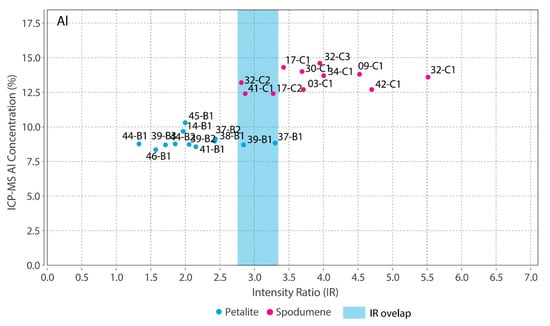
Figure 18.
Overlap of the pLIBS Al intensity ratios for the spodumene and petalite samples of the Barroso–Alvão aplite-pegmatite field.
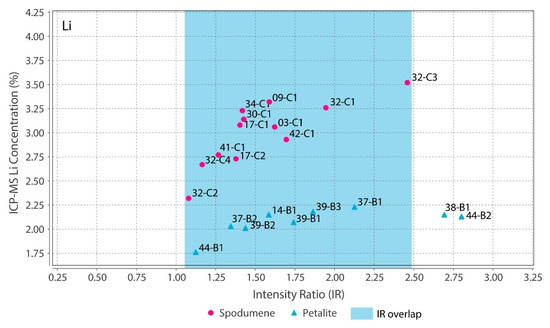
Figure 19.
Overlap of the pLIBS Li intensity ratios for the spodumene and petalite samples of the Barroso–Alvão aplite-pegmatite field.
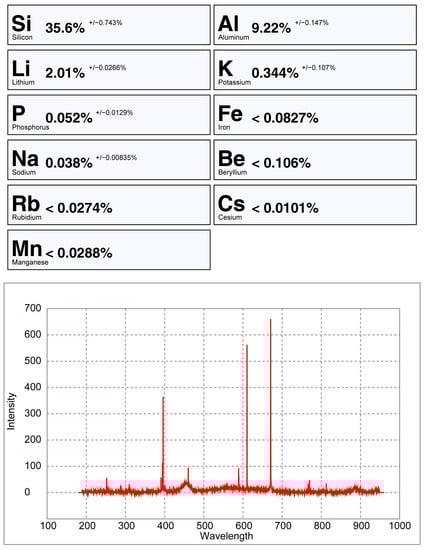
Figure 20.
pLIBS analysis of the spodumene sample 32-C1 with the Spd_Barroso calibration.
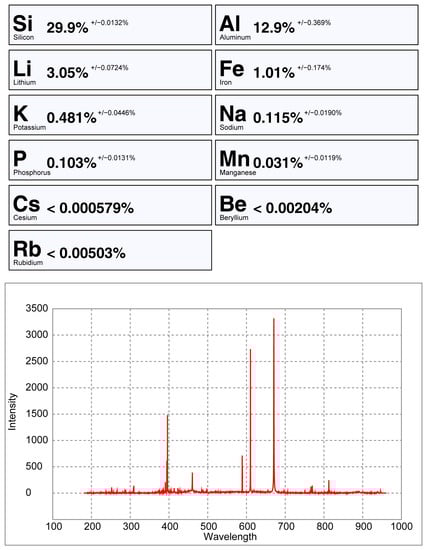
Figure 21.
pLIBS analysis of the petalite sample 38-B1 with the Pet_Barroso calibration.
Having two different calibrations for both minerals means that all the other chemical elements have at least two different calibration lines for each element, one only for spodumene and another only for petalite. For example, the equation of the calibration line for Li in spodumene is y = 1.9248 + 0.7010x and the calibration line for Li in petalite is y = 1.7937 + 0.1535x.
6.3. LIBS Results
From all the chemical elements analyzed using ICP-MS for the spodumene and petalite samples from the BA field, only the following elements have detectable peaks in the pLIBS spectra: Li, Al, Si, Li, Fe, K, P, Na, Rb, Mn, Cs and Be. The peaks for Be, Rb, Cs and Be are very small and easily get lost in the background signal of the spectra (Figure 20, Figure 21 and Figure A1).
Only the major elements of spodumene and petalite (Al, Si and Li) have accuracy greater than 0.8 (Figure 22) and consistent errors below 20% (Figure 23). All the other analyzed elements have greater errors. As for Fe, despite having large errors, the contents were always consistently higher in spodumene than in petalite. This is because the Fe contents of the BA petalites are so low that even the LIBS sometimes has difficulty quantifying it, resulting in values below the Limit of Detection (LOD). On the other hand, Fe from the BA spodumenes is always easily detected.
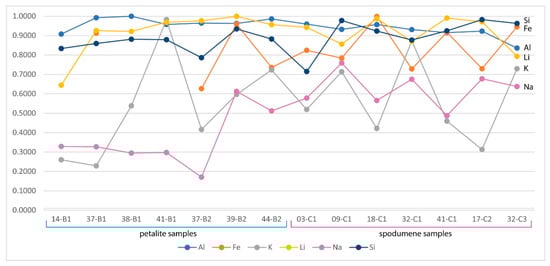
Figure 22.
LIBS accuracy compared to the ICP-MS analysis for the spodumene and petalite samples from the Barroso–Alvão aplite-pegmatite field.
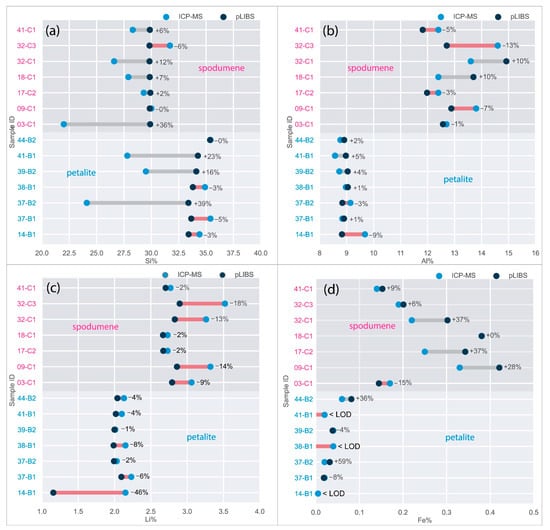
Figure 23.
Percentage of the errors of the pLIBS compared to the ICP-MS results for (a) Al, (b) Si, (c) Li and (d) Fe with the Spd_Barroso calibration and Pet_Barroso calibration. LOD (Limit of Detection).
The Spd_Barroso and the Pet_Barroso calibration were also tested in seven different potassium feldspars to evaluate if samples without Li could be giving false positives while using these two calibrations. As can be seen in Figure 24, Figure 25 and Figure 26, the Li results were always very low (<0.8% Li). Therefore, even if a K-feldspar is analyzed by mistake with the pLIBS (because they may sometimes have a similar appearance to petalite), the Li results will indicate that the analyzed mineral is not a petalite, nor a spodumene. This was possible because the IRs of Li from the K-feldspars were different from the IRs of Li from the spodumenes and petalites. Thus, it was possible to create one more calibration curve for Li inside the Spd_Barroso and Pet_Barroso. This new curve was made from the IRs and concentrations of K-feldspars. As for the K result for K-feldspars, since K also has overlapping IRs for spodumene, petalite and K-feldspars, the K in the K-feldspars has unreliable results that can change from 10 to 2% of K.
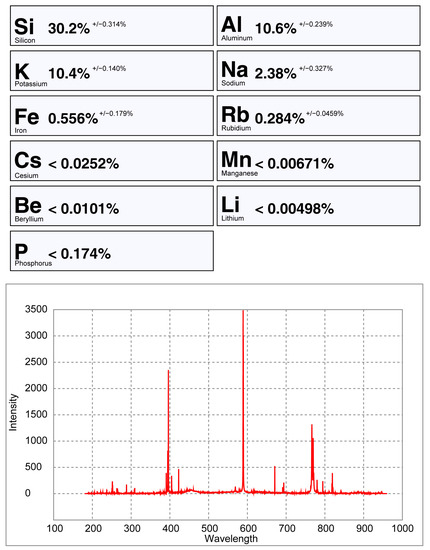
Figure 24.
pLIBS analysis of a potassium feldspar with the Spd_Barroso calibration.
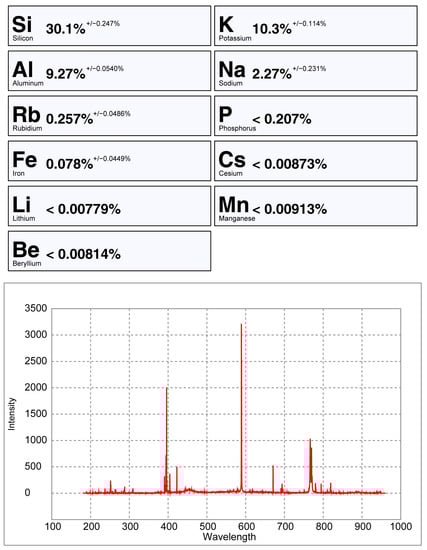
Figure 25.
pLIBS analysis of a potassium feldspar with the Pet_Barroso calibration.
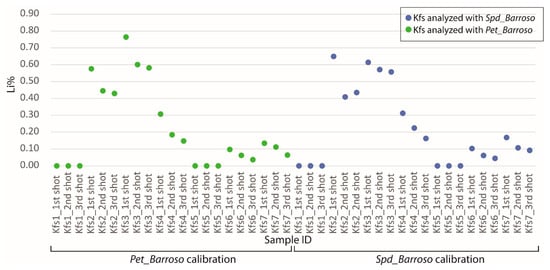
Figure 26.
Li results from the pLIBS by analyzing three times seven distinct potassium felspars (Kfs) with the Pet_Barroso (green dots) and the Spd_Barroso (blue dots) calibrations.
6.4. Comparing the Handheld LIBS Spectra of a Crystal Versus a Pellet of Spodumene
Performing an analysis with a handheld LIBS can become a challenge if the crystal has a reflecting surface. This can cause the equipment to stop shooting and give a warning of no sample detected. Milling the sample solves this issue but requires sample preparation. Another way to overcome this issue is by painting the surface of the crystal with a graphite pencil, which has a known composition (carbon) and forces the equipment to start the analysis. However, the resulting spectrum usually has a lower intensity stronger background signal and even the main peaks have different proportions from those of the pellets (Figure 27 and Figure 28). Roughening the surface of the crystal helps with the “no sample detection” problem and with the spectra intensity. Thus, shooting the crystal several times in the same place has the advantage of helping to roughen the surface and cleaning it from superficial contaminations possibly attached to the surface.
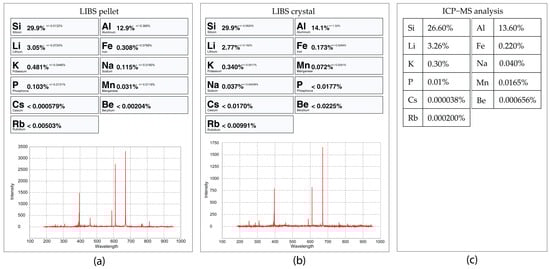
Figure 27.
LIBS analysis of the spodumene sample 32-C1 in pellet (a) compared with the crystal sample (b) and the ICP-MS analysis (c). These LIBS analyses were performed with the Spd_Barroso calibration.
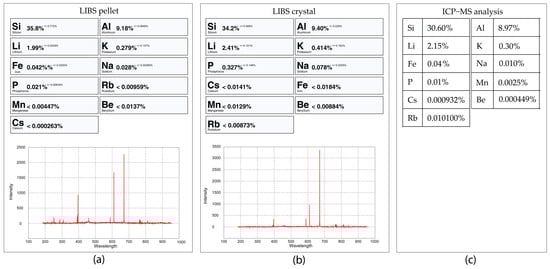
Figure 28.
pLIBS analysis of the petalite sample 38-B1 in pellet (a) compared with the crystal sample (b) and the ICP-MS analysis (c). These LIBS analyses were performed with the Pet_Barroso calibration.
Analyzing a crystal versus analyzing a pellet can also provide different results since the analysis of a pellet will be closer to a bulk analysis of the crystal than the crystal analysis made in one place (0.5 × 0.5 mm) of the crystal surface. Local analyses are more dependent on the trace-element variations along the crystals, such as variations in the Fe and Mn contents. Fe can easily substitute Al in the crystal structure of spodumene (LiAlSi2O6) in different concentrations along the crystal; thus, a single crystal can have Fe-richer zones and Fe-poorer zones [28]. Other examples of minor or trace elements that can be found in spodumene are Cr, V, Ga, Mn, Co, Ni, Cu, Sn, Ge, Rb, Be, Ga, Zn, Ta, Nb and Sc [29]. Another aspect to be considered is that small contaminations of other minerals can also be attached to the crystal surface, such as a small micas or Fe and Mn oxides (a common phenomenon in the samples from the BA field). Such contaminations, when milled together with the crystal, are scattered and diluted both in the pellet or the ICP-MS analyses. When using the pLIBS, the user usually chooses the cleaner spot, which results in different concentrations of the trace elements. Since the results from the ICP-MS and the pLIBS analysis on the pellets are both from milled crystals, they should be closer than the LIBS analysis performed on the crystals. Noticeable differences between the crystal and pellet analysis are for example, the facts that the spectrum from the crystal 3-C2 that has more Al than the pellet, 17-C2 has more Fe on the pellet than in the crystal, 18-C2 seems to have more Na in the pellet than in the crystal, and 32-C2 has more Na, Al and Fe in the pellet than in the crystal.
7. Conclusions
This work successfully developed a new set of calibrations for a handheld LIBS to analyze and identify spodumene and petalite from the BA field.
In fieldwork, it is possible to check if there are Li-minerals in an outcrop with these three calibrations by directly analyzing the crystal. This could be carried out by choosing the Spd_Barroso or Pet_Barroso calibration and if the mineral has the Li content of a spodumene or a petalite (~2%–3% of Li), then the Fe_Barroso calibration should follow to check what mineral it is and if the right calibration was chosen.
Since petalite has less Li than spodumene, a body with only petalite will have a lower Li content than a deposit with only spodumene. Each aplite-pegmatite should be carefully analyzed since it is possible to have only one of these minerals in one zone, another in depth, or on the other side of the outcrop. Using a pLIBS in outcrops should only be carried out for the first stages of exploration to identify aplite-pegmatites with Li-mineralization. However, the pLIBS can also be used in drilling cores to learn the Li-mineralization and distribution of the full body.
For a precise analysis of the mineral contents, it is recommended to collect samples, and then mill, press and re-analyze them again in a controlled environment.
This study allowed us to conclude the following:
- The intensity ratios (IR) determined by dividing the total area of the peaks for one element by the total area of all the peaks in the spectra resulted in identical IRs for spodumene and petalite. This forced the creation of two calibration lines for each mineral for all the chemical elements, except for Fe, which was the only element with distinct IRs for both minerals. Thus, it was only possible to successfully distinguish and analyze spodumene and petalite because petalite had always more Fe than spodumene and IRs greater than 0.0038 (Figure 17);
- To distinguish between spodumene and petalite, the calibration Fe_Barroso must be used. For a more complete chemical analysis, the Spd_Barroso calibration must be used if Fe > 0.1%, and the Pet_Barroso calibration if Fe < 0.1%;
- The Fe calibration cannot be used carelessly in other pegmatite fields without first learning the chemical signature of the trace elements of spodumene and petalite for that field because there are petalites that can have higher Fe content than 0.1% (e.g., 0.99% of Fe in a Fe-bearing petalite from a pegmatite with spodumene and quartz from the eastern Transbaikal region, Russia [27]);
- The distinction of fine mixtures of spodumene and quartz from single crystals of spodumene and petalite was possible with the Fe and Al results from ICP-MS. However, the pLIBS could not distinguish the spd + qtz mixtures from spodumene due to the overlapped IR for Al (Figure 18);
- Although LIBS is easily affected by changes in the crystal structure, the presence of spodumene in the petalite pellets did not seem to affect the results, as shown by samples 38-B1 and 39-B2, where Li and Al had errors of less than 30% when compared to ICP-MS (Figure 23);
- Analyzing pellets and crystals with a pLIBS has different results (Figure 27 and Figure 28). In the pellets, the trace elements are averaged because of the homogenized material, while the trace elements may vary along a crystal. The ICP-MS results will be more similar to a pellet than to a spot analysis in a crystal. Therefore, when calibrating a LIBS with ICP-MS analysis, it is better to use pellets instead of crystals;
- The crystal surface reflectiveness (flat or transparent) can be a problem for the pLIBS, since the equipment may not detect the sample or produce low intensity spectra with strong background signal, masking the smaller peaks and producing inaccurate results for the trace elements. Milling the samples and pressing them into pellets helps with this issue;
- The presence of quartz also seems to affect the spectra intensity even if the minerals are milled, as was observed with the spectra of the pellets of the mixtures of spodumene and quartz (Figure A1);
Author Contributions
Conceptualization, F.D., R.R., F.G. and A.L.; methodology, F.D., R.R., F.G. and A.L.; formal analysis, F.D., R.R., F.G. and A.L.; investigation, F.D., R.R., F.G. and A.L.; resources, A.L.; data curation, F.D., R.R., F.G. and A.L.; validation, F.D., R.R., F.G. and A.L., writing—original draft preparation, F.D.; writing—review and editing, all remaining authors; visualization, F.D., R.R., F.G. and A.L.; supervision, T.M., E.R.-R. and A.L.; project administration, A.L.; funding acquisition, A.L. All authors have read and agreed to the published version of the manuscript.
Funding
This work was funded by the European Commission’s Horizon 2020 innovation programme under grant agreement no. 869274 by the project GREENPEG New Exploration Tools for European Pegmatite Green-Tech Resources. This work was co-funded through the project CAVALI—Cadeia de Valor do Lítio, reference POCI-01-0247-FEDER-047728, cofinanced by FEDER—Fundo Europeu de Desenvolvimento Regional, in the scope of the Programa Portugal 2020, through COMPETE 2020—Programa Operacional. This work was co-funded through the project INOVMINERAL 4.0—Tecnologias Avançadas e Software para os recursos Minerais, reference POCI-01-0247-FEDER-046083, cofinanced by FEDER—Fundo Europeu de Desenvolvimento Regional, in the scope of the Programa Portugal 2020, through COMPETE 2020—Programa Operacional. The work is co-funded by national funds through FCT—Fundação para a Ciência e Tecnologia, I.P., in the framework of the ICT project with the references UIDB/04683/2020 and UIDP/04683/2020. Filipa Dias and Ricardo Ribeiro are financially supported within the compass of their respective Ph.D. theses, ref. 2020.05534.BD and ref. SFRH/BD/140266/2018, by national funds from MCTES through FCT, and co-financed by the European Social Fund (ESF) through POCH—Programa Operacional Capital Humano—and the NORTE 2020 regional program.
Data Availability Statement
The data is not publicly available due to confidentiality reasons.
Acknowledgments
The authors gratefully acknowledge the comments from three anonymous reviewers and the academic editor. We would also like to thank the people from INECTEC and Maria Irene Costa for allowing us to use their laboratory and respective tools. We are also grateful for the support of Ariane Mendes Pinto, who helped us produce the pellets used in this study.
Conflicts of Interest
The authors declare no conflict of interest.
Appendix A

Figure A1.
pLIBS spectra for the pellets of the spodumene (spd) sample 32-C3 (pink spectra) compared to the petalite (pet) sample 38-B1 (blue spectra) and to the spodumene and quartz (SQ) sample 18-D1 (black spectra).
Figure A1.
pLIBS spectra for the pellets of the spodumene (spd) sample 32-C3 (pink spectra) compared to the petalite (pet) sample 38-B1 (blue spectra) and to the spodumene and quartz (SQ) sample 18-D1 (black spectra).

References
- IEA. The Role of Critical Minerals in Clean Energy Transitions; IEA: Paris, France, 2021. [Google Scholar]
- Charoy, B.; Noronha, F. Rare-element (Li-rich) granitic and pegmatitic plutons: A primary or superimposed signature? Rev. Bras. De Geociências 1999, 29, 3–8. [Google Scholar] [CrossRef]
- Ribeiro, M.A. Estudo Litogeoquímico das Formações Metassedimentares Encaixantes de Mineralizações em Trás-os-Montes Ocidental. Implicações Metalogénicas; Faculdade de Ciências da Universidade do Porto: Porto, Portugal, 1998. [Google Scholar]
- Rodríguez Fernández, L.R.; López Olmedo, F.; Oliveira, J.T.; Medialdea, T.; Terrinha, P.; Matas, J.; Martín-Serrano, A.; Martín Parra, L.M.; Rubio, F.; Marín, C.; et al. Mapa Geológico de Espanha e Portugal. Escala 1:1 000 000. IGME 2015. © Instituto Geológico y Minero de España (IGME); © Laboratório Nacional de Energia e Geologia (LNEG). Available online: https://info.igme.es/cartografiadigital/geologica/ (accessed on 29 January 2021).
- Agência Portuguesa do Ambiente. Massas de Água Superficiais Rios de Portugal Continental: Conjunto de Dados Geográfico SNIAmb. Available online: https://sniamb.apambiente.pt/content/geo-visualizador (accessed on 6 July 2019).
- Agência Portuguesa do Ambiente. Massas de Água Superficiais Rios Albufeiras de Portugal Continental Conjunto de Dados Geográfico SNIAmb. Available online: https://sniamb.apambiente.pt/content/geo-visualizador (accessed on 19 July 2022).
- Sant’Ovaia, H.; Ribeiro, M.A.; Martins, H.C.B.; Noronha, F. Notícia explicativa da Carta geológica de Portugal na escala 1:50000—Folha 6D—Vila Pouca de Aguiar. 2011. Available online: https://geoportal.lneg.pt/pt/dados_abertos/cartografia_geologica/cgp50k/ (accessed on 30 September 2019).
- Ribeiro, M.A.; Martins, H.C.B.; Almeida, A.; Noronha, F. Notícia Explicativa da Folha 6-C- Cabeceiras de Basto. Carta Geológica de Portugal na Escala 1/50 000; Instituto Geológico e Mineiro: Lisboa, Portugal, 2000; p. 48. [Google Scholar]
- Noronha, F.; Ribeiro, M.A.; Almeida, A.; Dória, A.; Guedes, A.; Lima, A.; Martins, H.C.; Sant’Ovaia, H.; Nogueira, P.; Martins, T.; et al. Jazigos Filonianos Hidrotermais e Aplitopegmatíticos Espacialmente Associados a Granitos (Norte de Portugal). In Geologia de Portugal; Dias, R., Araújo, A., Terrinha, P., Kullberg, J.C., Eds.; Escolar Editora; Volume Volume I—Geologia Pré-mesozóica de Portugal: Lisboa, Portugal, 2013; pp. 403–438. [Google Scholar]
- Charoy, B.; Lhote, F.; Dusausoy, Y.; Noronha, F. The Crystal Chemistry of Spodumene in Some Granitic Aplite-Pegmatite of Northern Portugal. Can. Mineral. 1992, 30, 639–651. [Google Scholar]
- Lima, A. Estrutura, Mineralogia e Génese dos Filões Aplitopegmatíticos com Espodumena da Região do Barroso-Alvão; University of Porto: Porto, Portugal, 2000. [Google Scholar]
- Martins, T. Multidisciplinary Study of Pegmatites and Associated Li and Sn-Nb-Ta Mineralisation from the Barroso-Alvão Region; Faculty of Sciences of University of Porto: Porto, Portugal, 2009. [Google Scholar]
- Dias, F. Lithium Mineralizations of Barroso-Alvão Aplite-Pegmatite Field. Master’s Thesis, Faculty of Sciences of the University of Porto, Porto, Portugal; p. 2016.
- Lima, A.; Dias, F. Spodumene and Quartz Intergrowth—Textural and Genesis Point of View. In Proceedings of the EGU2019, Vienna, Austria, 7–12 April 2019; 21, p. 13404. [Google Scholar]
- Martins, T.C.; Lima, A.M.C.; Vieira, R.C. Barroso-Alvão Pegmatite-Aplite Field: A Case Study in Northern Portugal. Crystallization Processes in Granitic Pegmatites. In Proceedings of the International Meeting: Crystallization Processes in Granitic Pegmatite, Elba, Italy, 23–29 May 2005; 2005; pp. 21–22. [Google Scholar]
- Charoy, B.; Noronha, F.; Lima, A. Spodumene-petalite-eucryptite; mutual relationships and pattern of alteration in Li-rich aplite-pegmatite dykes from northern Portugal. Can. Mineral. 2001, 39, 729–746. [Google Scholar] [CrossRef]
- Cremers, D.A.; Radziemski, L.J. Handbook of Laser-Induced Breakdown Spectroscopy; John Wiley & Sons, Ltd.: Chichester, UK, 2006. [Google Scholar]
- Ribeiro, R.; Capela, D.; Ferreira, M.; Martins, R.; Jorge, P.; Guimarães, D.; Lima, A. X-ray Fluorescence and Laser-Induced Breakdown Spectroscopy Analysis of Li-Rich Minerals in Veins from Argemela Tin Mine, Central Portugal. Minerals 2021, 11, 1169. [Google Scholar] [CrossRef]
- Dias, C. Abordagem Multidisciplinar às Mineralizações de Lítio no Campo Aplito-Pegmatítico do Barroso-Alvão, Norte de Portugal. Master’s Thesis, Faculty of Sciences of the University of Porto, Porto, Portugal, 2016. [Google Scholar]
- Tucker Vasques, J. Lithogeochemistry and Prospection of Lithium-Bearing Pegmatites and Their Host-Rocks. Master’s Thesis, Faculty of Sciences of the University of Porto, Porto, Portugal, 2021. [Google Scholar]
- Pagel, M.; Barbin, V.; Blanc, P.; Ohnenstetter, D. Cathodoluminescence in Geosciences; Springer: Berlin/Heidelberg, Germany; New York, NY, USA, 2000. [Google Scholar]
- Dias, F.; Lima, A. Cathodoluminescence characteristics of spodumene and petalite from the Iberian massif pegmatites. In Proceedings of the Jornadas do ICT, Faculdade de Ciências da Universidade do Porto—Zoom Meeting, Porto, Portugal, 11–12 February 2021. [Google Scholar]
- Wise, M.A.; Brown, C.D. Cathodoluminescence (CL) Microscopy—A Technique for Understanding The Dynamics of Pegmatite Crystallization. Can. Mineral. 2019, 57, 821–823. [Google Scholar] [CrossRef]
- Černý, P.; Ferguson, R.B. The Tanco pegmatite at Bernic Lake, Manitoba; IV, Petalite and spodumene relations. Can. Mineral. 1972, 11, 660–678. [Google Scholar]
- Lepore, K.H.; Fassett, C.I.; Breves, E.A.; Byrne, S.; Giguere, S.; Boucher, T.; Rhodes, J.M.; Vollinger, M.; Anderson, C.H.; Murray, R.W.; et al. Matrix Effects in Quantitative Analysis of Laser-Induced Breakdown Spectroscopy (LIBS) of Rock Powders Doped with Cr, Mn, Ni, Zn, and Co. Appl. Spectrosc. 2017, 71, 1–27. [Google Scholar] [CrossRef] [PubMed]
- Černý, P.; London, D. Crystal Chemistry and Stability of Petalite; Tmpm Tschermaks Mineralogische Und Petrographische Mitteilungen; Springer: New York, NY, USA; Volume 31, pp. 81–96.
- Deer, W.A.; Howie, R.A.; Zussman, J. Rock-Forming Minerals: Silica Minerals, Volume 4B; Geological Society: London, UK, 2004. [Google Scholar]
- Deer, W.A.; Howie, R.A.; Zussman, J. Rock-Forming Minerals: Single-Chain Silicates. Volume 2A; Geological Society: London, UK, 1978. [Google Scholar]
- Claffy, E.W. Composition, tenebrescence and luminescence of spodumene minerals. Am. Mineral. 1953, 38, 11–12. [Google Scholar]


Disclaimer/Publisher’s Note: The statements, opinions and data contained in all publications are solely those of the individual author(s) and contributor(s) and not of MDPI and/or the editor(s). MDPI and/or the editor(s) disclaim responsibility for any injury to people or property resulting from any ideas, methods, instructions or products referred to in the content. |
© 2023 by the authors. Licensee MDPI, Basel, Switzerland. This article is an open access article distributed under the terms and conditions of the Creative Commons Attribution (CC BY) license (https://creativecommons.org/licenses/by/4.0/).