Article

Numerical Simulation of Gas–Liquid Two-Phase Flow CFD–PBM Model in a Micro–Nanobubble Generator

1
National Engineering Research Center for Environment-Friendly Metallurgy in Producing Premium Non-Ferrous Metals, GRINM Group Corporation Limited, Beijing 100088, China
2
GRINM Resources and Environment Tech. Co., Ltd., Beijing 100088, China
3
General Research Institute for Nonferrous Metals, Beijing 100088, China
4
GRIMAT Engineering Institute Co., Ltd., Beijing 101407, China
5
Bin Long Mining Pte. Ltd., Beijing 100083, China
*
Author to whom correspondence should be addressed.
Minerals 2022, 12(10), 1270; https://doi.org/10.3390/min12101270
Submission received: 31 August 2022 / Revised: 30 September 2022 / Accepted: 5 October 2022 / Published: 8 October 2022
(This article belongs to the Special Issue Progress of Reagents in Minerals Flotation)

Abstract

:
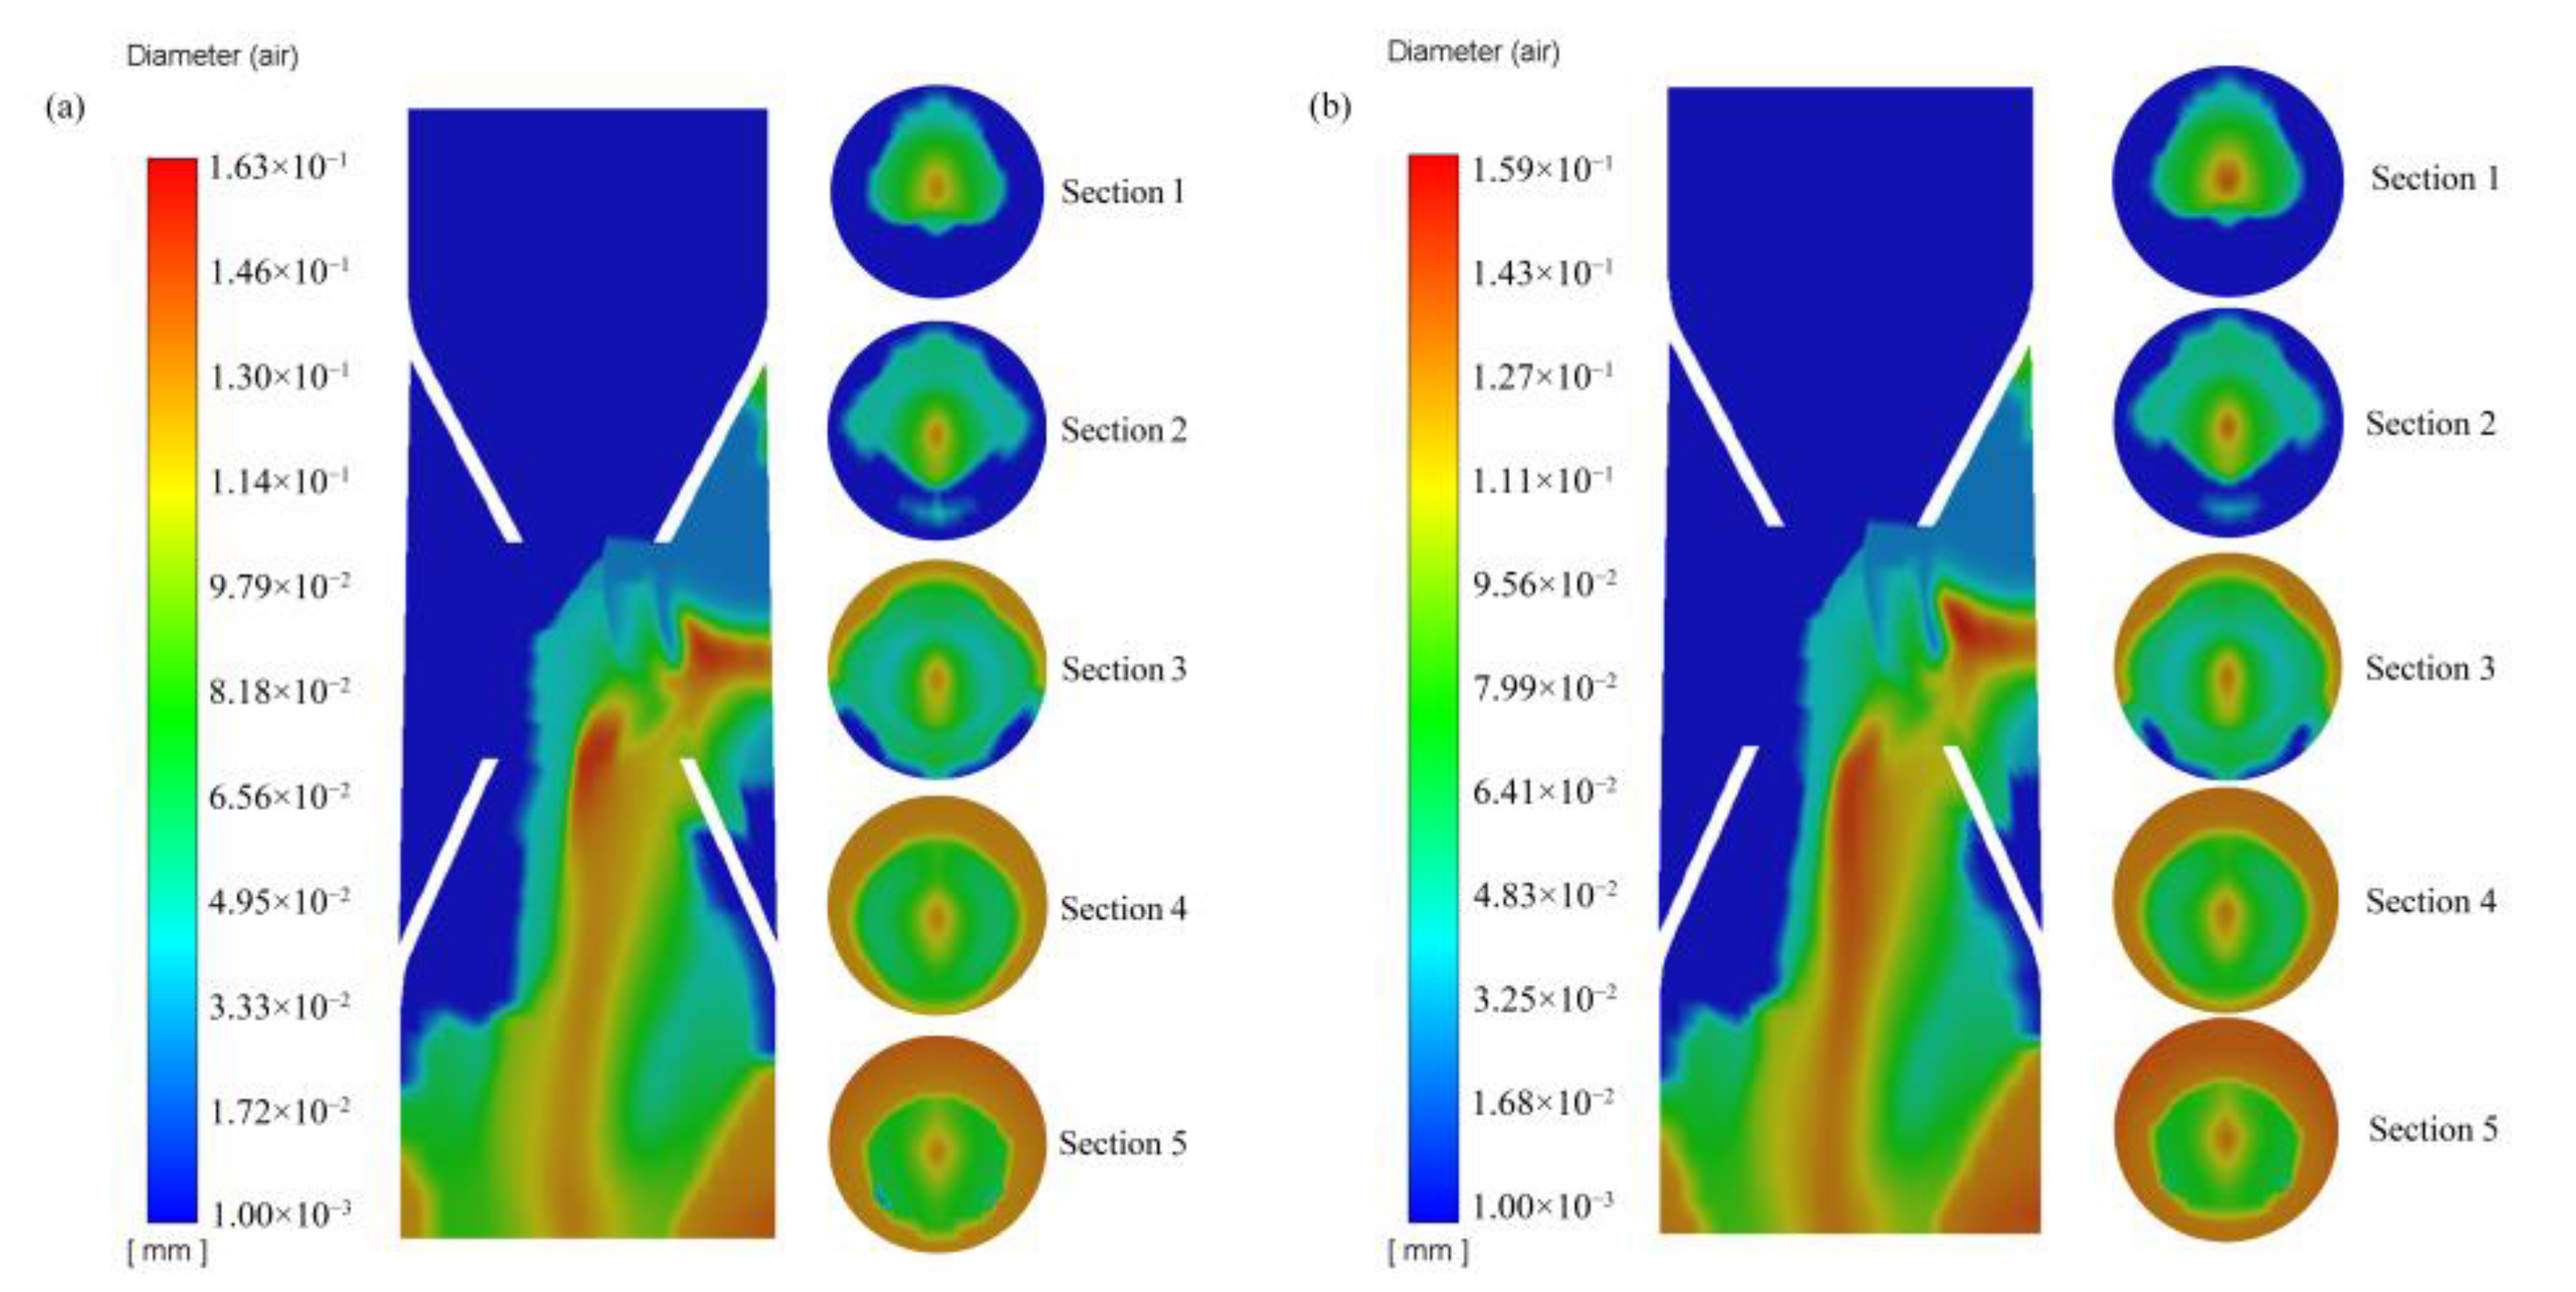
A micro–nanobubble generator is the most critical component of micro–nano flotation equipment. Understanding the bubble generation characteristics in the generator plays a vital role in optimizing the performance of the device and improving the flotation of fine-grained minerals. In this study, to explore the generation and evolution of bubbles in the micro–nanobubble generator of a cyclonic jet flotation cell, the flow field parameters of the gas–liquid two-phase flow inside the generator were solved using CFD–PBM combined with Luo’s population balance model. The internal bubble size was in the range of 0.99 μm to 140 μm. After the gas entered the generator from the suction pipe, it mainly moved in the center of the tube, and the diameter of the bubbles was relatively large at this time. With the bubble movement, large bubbles in the center were broken into small bubbles and then moved toward the periphery of the tube. Thereafter, the smaller-diameter bubbles gathered and formed large-diameter bubbles. The average diameter of the generated bubbles gradually increased from approximately 30 to 110 μm.

1. Introduction

With the continuous development of resources, the embedded particle size of valuable minerals in ore is continuously reduced, and it is difficult for conventional flotation processes to entirely recover these fine-grained minerals. The key to the recovery of minerals by flotation is the efficient collision of minerals with rising air bubbles. Fine-grained minerals are small in size and have a low probability of collision with minerals; large specific surface area and high surface energy, useful minerals are prone to non-selective agglomeration with gangue; fine-grained minerals have high solubility, and there are inevitably more ions in the pulp, which are easy to interact with. Thus, the competitive adsorption of the collector occurs. These factors lead to fine-grained minerals having a poor flotation effect. Therefore, scholars have studied shear flocculation flotation [1], carrier flotation [2], selective flocculation flotation [3], and micro–nanobubble flotation [4] to improve the flotation effect of fine-grained minerals.
The concept of “interface nanobubbles” was first proposed in 1994. Parker et al. [5] used a highly sensitive surface force apparatus to measure the distance between neutral hydrophobic surfaces prepared with covalently modified glass. The force was found to be attractive at very large surface separations, with discontinuities or steps in the force curve. The researchers argued that the long-distance gravitational force between hydrophobic surfaces is due to the bridging of submicroscopic air bubbles, and that the force discontinuity appears to be due to the continuous bridging of air bubbles on the surface, pointing out that the air bubbles are microscopic cavities formed after mechanical agitation or contact caused by collapse. Lou [6] generated nanobubbles on the surface of highly oriented pyrolytic graphite (HOPG) by injecting a solution of water and ethanol into the battery instead of pure ethanol and obtained clear nanobubble images using AFM. With the in-depth study of nanobubbles, researchers found that nanobubbles can exist in bulk for a long time, which is contrary to the very short life of nanobubbles calculated using the classical Laplace equation and observed under AFM. The contact angle of nanobubbles is much larger than that of macro bubbles. In order to explain this phenomenon, assumptions and mechanisms such as line tension [7], dynamic equilibrium mechanism [8], interface contamination layer [9], three-phase contact line (TPCL) pinning theory [10], and tight gas layer model have been proposed [11].
By contrast, the micro–nanobubble flotation process can be used to effectively recover fine-grained minerals. Many studies have shown that micro–nanobubbles have a large specific surface area, high surface energy, and good selectivity and tend to adhere to the surface of hydrophobic solids [12,13,14,15]. When micro–nanobubbles are close to each other, an air bridge is formed, causing the micro–nanobubbles to move close to each other. The agglomeration of granular minerals strengthens the floating process [16,17]; the micro–nanobubbles significantly reduce the bubble rising speed, increasing the gas holdup and probability of adhesion of bubble particles and thus reducing the detachment probability [18]. Thus far, the micro–nanobubble flotation process has been applied in a variety of mineral flotation strategies. Tao et al. [19] used nanobubbles for the anionic reverse flotation of hematite and found that nanobubbles could significantly improve the recovery rate of concentrates. Indeed, it has been found that combining microbubbles with coarser microbubbles significantly improves the flotation efficiency of very fine particles [20,21]. Etchepare et al. [22] studied the flotation effect of nanobubbles on Fe(OH)3 colloidal precipitation and nanoparticles. Owing to the strong lifting force of microbubbles, the flotation speed was relatively fast, but the separation effect was not as good as that of nanobubbles. The use of nanobubbles in combination with microbubbles has been show to overcome the problem of the slow rise of nanobubbles. Therefore, the micro–nanobubble-generating device used is critical, and it is essential to determine the bubble size variation law in the micro–nanobubble generator. Tsave et al. [23] combined the large-scale bubbles generated by conventional flotation with the microbubbles produced from water electrolysis. They found that the microbubbles attached to the surfaces of the fine particles were conducive to the attachment of regular-sized bubbles and thereby improved the flotation recovery rate of the particles. Taghavi et al. [24] studied the flotation of phosphate rocks in the presence of nanobubbles. Their study revealed that in the presence of nanobubbles, the flotation recovery rate and concentrate grade were significantly improved. Zhang et al. [25] stated that NB-treated rutile had a higher recovery with lower collector requirements and a higher flotation rate. The particles exhibited a pronounced aggregation behavior and high adhesion probability.
To date, some studies have found that treated nanobubbles had an improved effect on flotation. Li et al. [26] proposed an efficient method for the treatment of high-ash fine coal using positively charged nanobubbles (PCNBs) and polyaluminum chloride (PAC). Compared with NB alone, when using PCNBs and PAC, the recovery of combustibles was improved, whereas the recovery of ash was reduced. The presence of PCNBs intensifies the aggregation of fine coal particles, thereby enhancing the recovery of combustibles. Zhang et al. [27] compared the flotation of kaolinite using water, water containing pure nanobubbles (NBs), and amine-coated NBs (CNBs). The results showed that when using CNBs, it was more favorable for high-silica planes of kaolinite to be exposed, and the subsequent adsorption of amines on these planes of kaolinite aggregates (flocs) resulted in significantly improved kaolinite flotation. Therefore, the micro–nanobubble-generating device is key, and it is necessary to determine the bubble size variation mechanism in the micro–nanobubble generator used.
Population balance model (PBM) solution methods can usually be divided into three classes: those utilizing the discretization of the internal coordinates, stochastic methods, and methods based on moments. PBM is often used to study the particle size distribution of the dispersed phase in multiphase flows [28,29,30,31]. Many researchers have applied this model to study the gas–liquid two-phase flow in a bubble column and investigated the effect of liquid viscosity on the hydrodynamics in bubble columns. Researchers were able to successfully predict the relationships existing among the gas holdup, volume fraction, and fluid viscosity under homogeneous and heterogeneous conditions [32]. Some discovered that with an increase in the apparent gas velocity, the rates of both bubble coalescence and fragmentation increase, making the bubble size distribution wider [33]. PBM can successfully predict the change in droplet size distribution in the simulation application of a stirring tank [34]. The analysis of the simulation data led to the finding that the use of a six-inclined-blade up-pumping turbine in a double-blade agitation tank helps bubble dispersion [35]. Zhang et al. [36] used an improved CFD–PBM coupled model to predict the effect of operating pressure on the bubble size distribution, which became smaller and more uniform at elevated pressures.
In this study, the gas–liquid two-phase flow numerical simulation was performed on the bubble generator of a cyclonic jet flotation column using the coupling of PBM with CFD. The internal gas-phase distribution and bubble diameter distribution were obtained, and the evolution process of the bubble inside the generator is analyzed. The mineralization process of flotation provided a specific reference.

2. Materials and Methods

The micro–nanobubble generator used was based on a laboratory cyclonic jet flotation cell, as shown in Figure 1a. The nozzle was at the center of the suction pipe. The diameter of the nozzle outlet was 9 mm, the throat diameter was 12.5 mm, the distance between the mouth and throat was 15 mm, and the diameter of the air inlet was 8 mm, as shown in Figure 1b.
For the numerical simulation, we took ANSYS V19.0 CFD Premium (ANSYS Inc, Pittsburgh, KS, USA) as the computing platform, imported the grid into FLUENT, selected the Euler–Euler two-fluid model, selected the Realizable κ–ε model [37,38] for the turbulence model. Then, according to the research of the jet generator, the researchers determined the range on bubble size generated by the generator [39,40,41,42], and then added the PBM model to divide the size of the bubble group, as shown in Table 1.
The medium scheme simulated the flow field characteristics in the bubble generator with clean water/air. Among these, water (liquid) was used as the main phase. The density value was 998 kg/m3 and the viscosity value was 8 × 10⁻⁴ kg/m3·s. The air sucked by the partial vacuum was used as the secondary phase, and the parameters remained default; namely, the density value was 1.225 kg/m3 and the viscosity value was 1.789 × 10⁻⁵ kg/m3·s. The liquid phase inlet was set as the velocity inlet. The inlet had an optimum velocity of 6.5 m/s during the actual flotation, while a group with a velocity of 7.5 m/s was the control. The suction port was set as the pressure inlet and the pressure was 0 pas; the outlet was designated as a pressure outlet. In the simulation process of the jet bubble generator, according to the three-dimensional coordinate system of the physical model, the gravitational acceleration was set to 9.81 m/s2 along the Z-axis direction, and the wall was set as a no-slip wall [30].

3. Mathematical Model

3.1. Gas–Liquid Two-Phase Flow Model

The two-phase flow field in the micro–nanobubble generator conformed to the continuum and satisfied the continuum equation:
ϱ   A t + G   A z = 0
True density:
ϱ = ϱ g   f g + ϱ l   ( 1     f g )
Mass flow rate:
G = f g   ϱ g   w g + ( 1     f g )   ϱ l   w l
In these equations, t is time (s) and ρ is density (kg∙m−3).
Momentum equation:
G t + 1 A   A   ϱ   1     f   w 1 2 + ϱ g   f g   w g z = P z     τ o P A     ϱ g   gsin θ
In the formula: τ o   P = τ og   P g + τ ol   P l .

3.2. Interphase Force Model for Gas–Liquid Two-Phase Flow

The interphase force was the interfacial force between the gas and liquid phases and determined the motion law of the gas and liquid in the generator, including the drag force, virtual mass force, and lift force.

3.2.1. Drag Force

In the flow field of this generator, the liquid exerted a drag force on the bubble, which was opposite the direction of the bubble movement, and the resistance experienced by a single bubble depended on the shape and size of the bubble, the interface properties, and the number of surrounding bubbles [43]. The resistance to the rise of a single bubble was as follows:
f D z   = C D   π 4   d B   2 1 2   ϱ L   ( u G     u L )   u G     u L )
The estimation of bubble group resistance was made more complicated by the presence of other bubbles around. The force on the bubble group was as follows:
F D z = N   f D z = ε G   ϱ L   3 C D 4 d B   ( u G     u L )   u G     u L )
The value of CD may be different for different foams and foam groups. This is because the shape and size of the bubbles in the bubble group are very different from those of isolated bubbles. In addition, the flow structure around the bubble changes when it becomes part of a swarm.

3.2.2. Virtual Mass Force

The bubble group squeezes the liquid inside the generator. In turn, the liquid exerts a force on the bubble, which is called virtual mass force [43], and the formula for this is as follows:
F V z = ε G   C V   ϱ L   D Dt   ( u G     u L )
where CV is the virtual mass force coefficient, and CV = 0.5 for particles in an ideal fluid.

3.2.3. Lift Force

Lift force is the resulting force in the vertical and moving directions due to the asymmetric flow field while the bubble rises. The lift force model of Tomiyama [44] is as follows:
F T =     C T   ϱ L   π d 3 6   u G     u L )   ×   rotu L
where the lift force coefficient:
C T =   min   0 . 288   tan   h   0 . 121   Re ,   f ( E 0 d ) ]   for   E 0 d   <   4 f E 0 d                               for   4   E 0 d     10 . 7  
f E 0 d   =   0.00105 E 0 d 3     0.0159   E 0 d 2     0.0204   E 0 d + 0.474

3.3. Turbulence Model

The liquid flow in a generator is usually considered to be turbulent and is generally described by the κ–ε turbulence model in the simulation calculation. The κ–ε turbulence model includes the Standard κ–ε model, the RNG κ–ε model, and the Realizable κ–ε model. The model is also commonly used to describe the Reynolds stress model.
Standard κ–ε model:
ϱ   κ t + ϱ   κ   u i x i = x j   μ + μ t σ k   κ x j + G k     ϱ   ε
ϱ   κ t + ϱ   ε   u i x i = x j   μ + μ t σ ε   ε x j + C 1 ε   ε κ   G k     C 2 ε   ϱ   ε 2 κ
where κ is the turbulent kinetic energy; ε is the dissipation rate; and the empirical constants are Cμ = 0.09, σk = 1, C = 1.44, and C = 1.92. The standard κ–ε model has been extensively tested and successfully applied in solving many engineering problems. However, when used for a vigorous swirl which flows around σε = 1.3 curved walls or curved streamlines, it produces a certain level of distortion.
RNG κ–ε model:
ϱ   κ t + ϱ   κ   u i x i = x j   α k   ( μ + μ t )   κ x j + G k     ϱ   ε
ϱ   κ t + ϱ   ε   u i x i = x j α ε   ( μ + μ t )   ε x j + C 1 ε *   ε κ   G k     C 2 ε   ϱ   ε 2 κ
where Cμ = 0.0845, αk = αε = 1.39, and C = 1.68. Compared with the standard κ–ε model, the RNG κ–ε model considers the rotation and swirl flow in the average flow by correcting the turbulent viscosity and can handle flows with high strain rates and high values of streamline curvature.
Realizable κ–ε model:
ϱ   κ t + ϱ   κ   u i x i = x j   ( μ + μ t σ ε )   κ x j + G k     ϱ   ε
ϱ   κ t + ϱ   ε   u i x i = x j   ( μ + μ t σ ε )   ε x j + ϱ   C 1   E   ε     ϱ   C 2   ε 2 κ + v   ε
where σk = 1.0, σε = 1.2, and C2 = 1.9. The Realizable κ–ε model has been effectively applied to many types of flow modes, including models of rotationally uniform shear flow, free flow of jet and mixed flow, and flow in pipes.
Reynolds stress model:
ε t + ϱ   u j   ε x j = x j   C s   ϱ   κ ε   u i   u j ¯   ε x i + C ε 1   ε κ   G     C ε 2   ε 2 κ
In this model, the constants are Cs = 0.15, Cε1 = 1.34, and Cε2 = 1.8. The Reynolds stress model is widely used in turbulent flows such as uniform turbulent flows, free jets, sidewall jets, wakes, and two-dimensional and three-dimensional pipe flows.

3.4. Population Balance Model

3.4.1. Bubble Population Balance Model

Assuming that the bubbles in the generator satisfy the population balance model of Luo [45,46], the following description can be used:
n   V ,   t t +   [ u b   n   V ,   t ] = B C ,   V     D C ,   V + B B ,   V     D B ,   V
where n(V, t) is a number-based density function (the unit is m−4), and ub is the bubble velocity.
B C ,   V = 1 2   0 ν n   V     V ,   t   n   V ,   t   c   ( V     V     ,   V   dV
B C ,   V = 1 2   0 ν n   V     V ,   t   n   V ,   t   c   ( V     V ,   V   dV
B B V = ν β   V V   b   V   n   V ,   t   dV
D B ,   V = b V   n   V ,   t
where BC, V is the source term of the combination of bubbles V   and V     V into bubble V; DC, V is the combination of bubble V and V for the source term of the disappearance of V; BB, V is the source term of the bubble V broken to generate V; DB, V is the source term of the bubble V when broken; and V disappeared.

3.4.2. Bubble Break-Up Model

In this study, the bubble break-up model of Luo [45,46] was used. The turbulent vortex not only had energy but also a specific scale. The general rate model of fluid-particle break-up in a turbulent flow is as follows:
Ω B v :   vf B   V = λ min d P B   ( v :   vf BV ,   λ ) ω ˙ B ,   λ v   d λ
ω ˙ B ,   λ v = π 4   ( d + λ ) 2   u ¯ λ   n ˙ λ   n
The bubble breakage frequency model is as follows:
P B   v   :   v   f B   V ,   λ = 1     0 χ c exp   (   χ )   d   χ = exp     12   c f   σ β   ϱ c   ε 2 3   ξ 11 3   d 5 3
A particle of size v breaks into a particle of size vfBV with the breakage rate:
Ω B v :   v   f B   V ( 1     ε d )   n = c 4   ε d 2 1 / 3   ξ min 1 ( 1 + ξ ) 2 ξ 11 / 3   exp   12   c f   σ β   ϱ L   ε 2 3   ξ 11 3   d 5 3   d ξ
where ω ˙ B ,   λ v is the collision frequency, P B ( v :   v   f B   V . ,   λ ) is the coalescence probability, n ˙ λ is the number of vortices, u ¯ λ is the turbulent velocity of a vortex of size λ, ξ min = λ min d     11 . 4   ~   31 . 4 , and “β” generally takes the value 2.047.

3.4.3. Bubble coalescence model

This study adopts the coalescence model of Luo [39,40]:
C   ( d i ,   d j ) = ω ˙ C   ( d i ,   d j )   P C   ( d i ,   d j ) / ( n d i ,   n d j )
ω ˙ C ( d i ,   d j ) = π 4 ( d i   + d j ) 2   u ¯ ij   n d i   n d j
The coalescence efficiency model is as follows:
P C d i ,   d j = exp   c 1   [ 0 . 75   1 + x ij 2   1 + x ij 3 ] 0 . 5 ( ϱ g ϱ l + 0 . 5 ) 0 . 5   ( 1 + x ij ) 3 We ij 0 . 5
where ω ˙ C d i , d j is the collision frequency of two groups of bubbles with diameters di and dj, and c1 is the coalescence coefficient. Weij is the Weber number and xij is the particle size ratio of the two groups of bubbles whose diameters are di and dj, respectively.

4. Numerical Simulation of Gas–Liquid Two-Phase Flow in Micro–Nanobubble Generator

4.1. Meshing

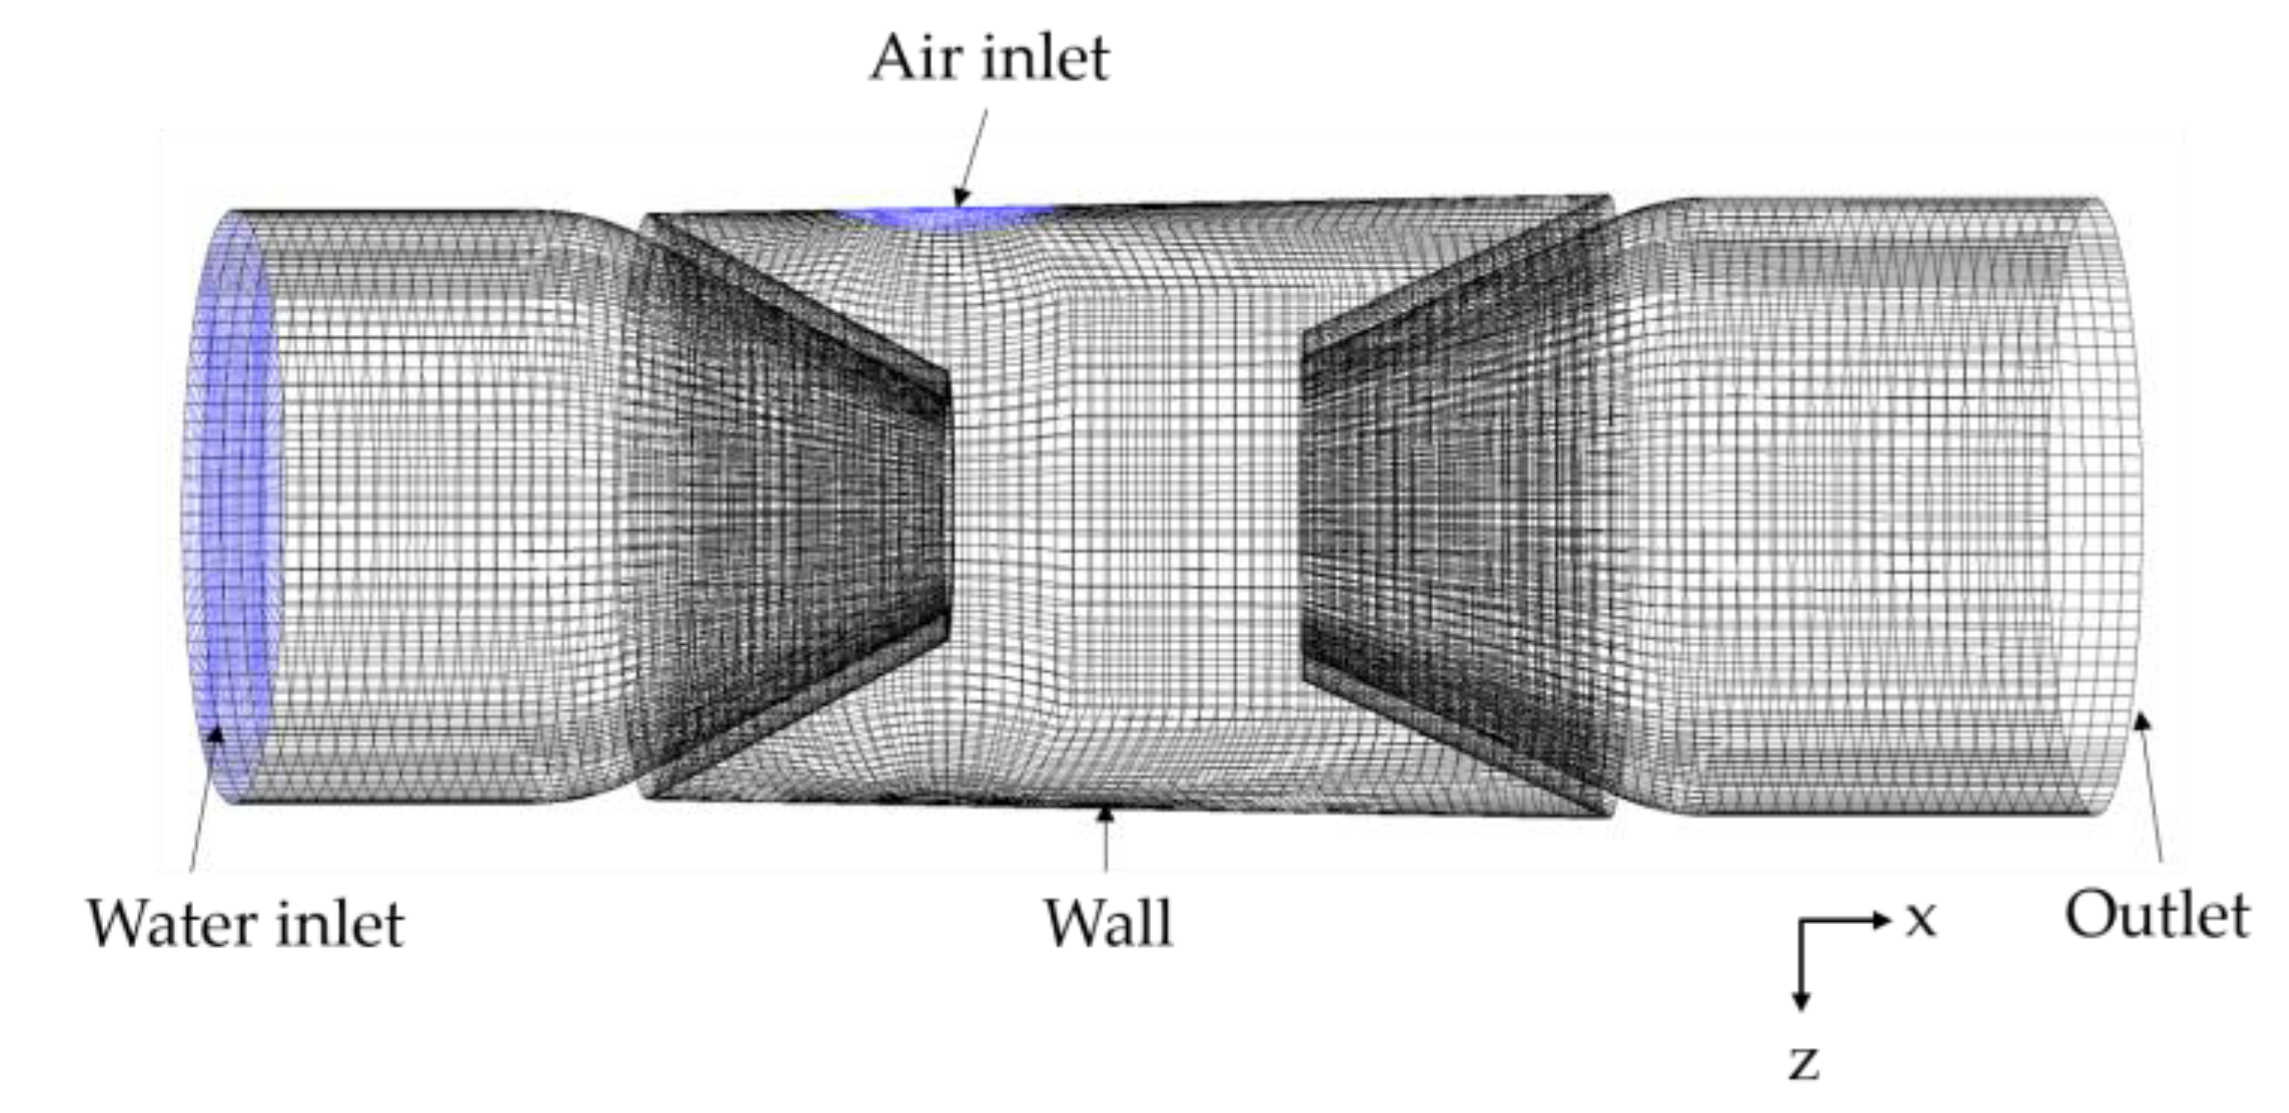
The three-dimensional model of the generator is imported to the Integrated Computer Engineering and Manufacturing (ICEM). We repaired the model through geometry in the ribbon, then generated the boundary interface, created a block through the blocking option in the ribbon, and captured the projected points to achieve appropriate correlation results. Then, we segmented the Blocking, and finally we completed the mesh generation in the Mash option. To ensure the quality of the simulation solution, the bubble generator was divided into a structured grid, and the nozzle and throat were encrypted, as shown in Figure 2, which shows a computational mesh with 409,462 mesh cells. We checked the mesh quality in the Edit Mash option and obtained a mean quality of 0.8267, which is very close to 1, meaning that the mesh quality was good.

4.2. Two-Phase Flow Simulation Results and Analysis

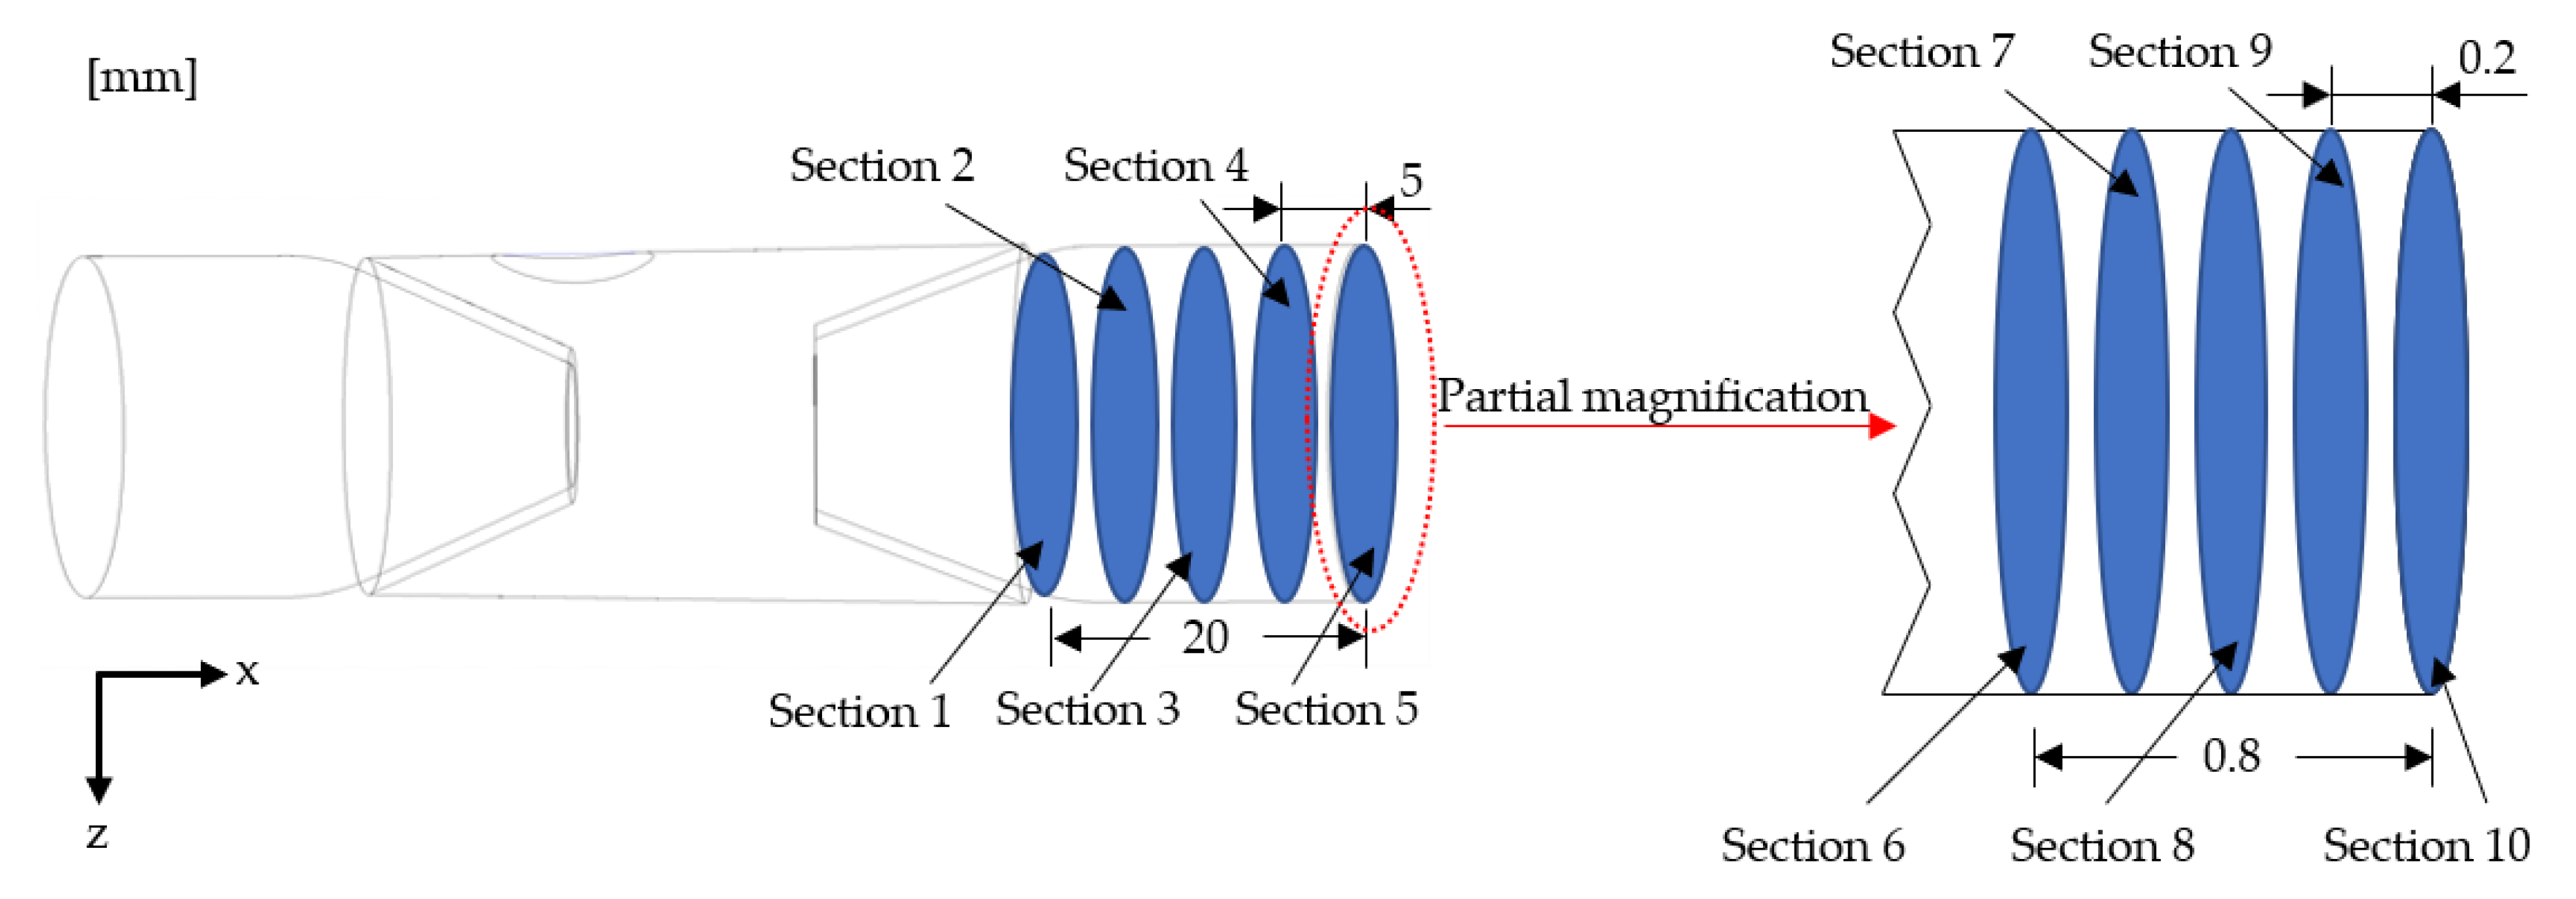
For convenience of observation, the transverse inlet direction was assumed to be the positive direction of the x-axis. We took 20 mm from the Outlet as Section 1, and then took a section every 5 mm to obtain Sections 1, 2, 3, 4, and 5. Then, we took 0.8 mm from the Outlet as Section 6 and took a section every 0.2 mm to obtain Sections 6, 7, 8, 9, and 10. As shown in Figure 3.
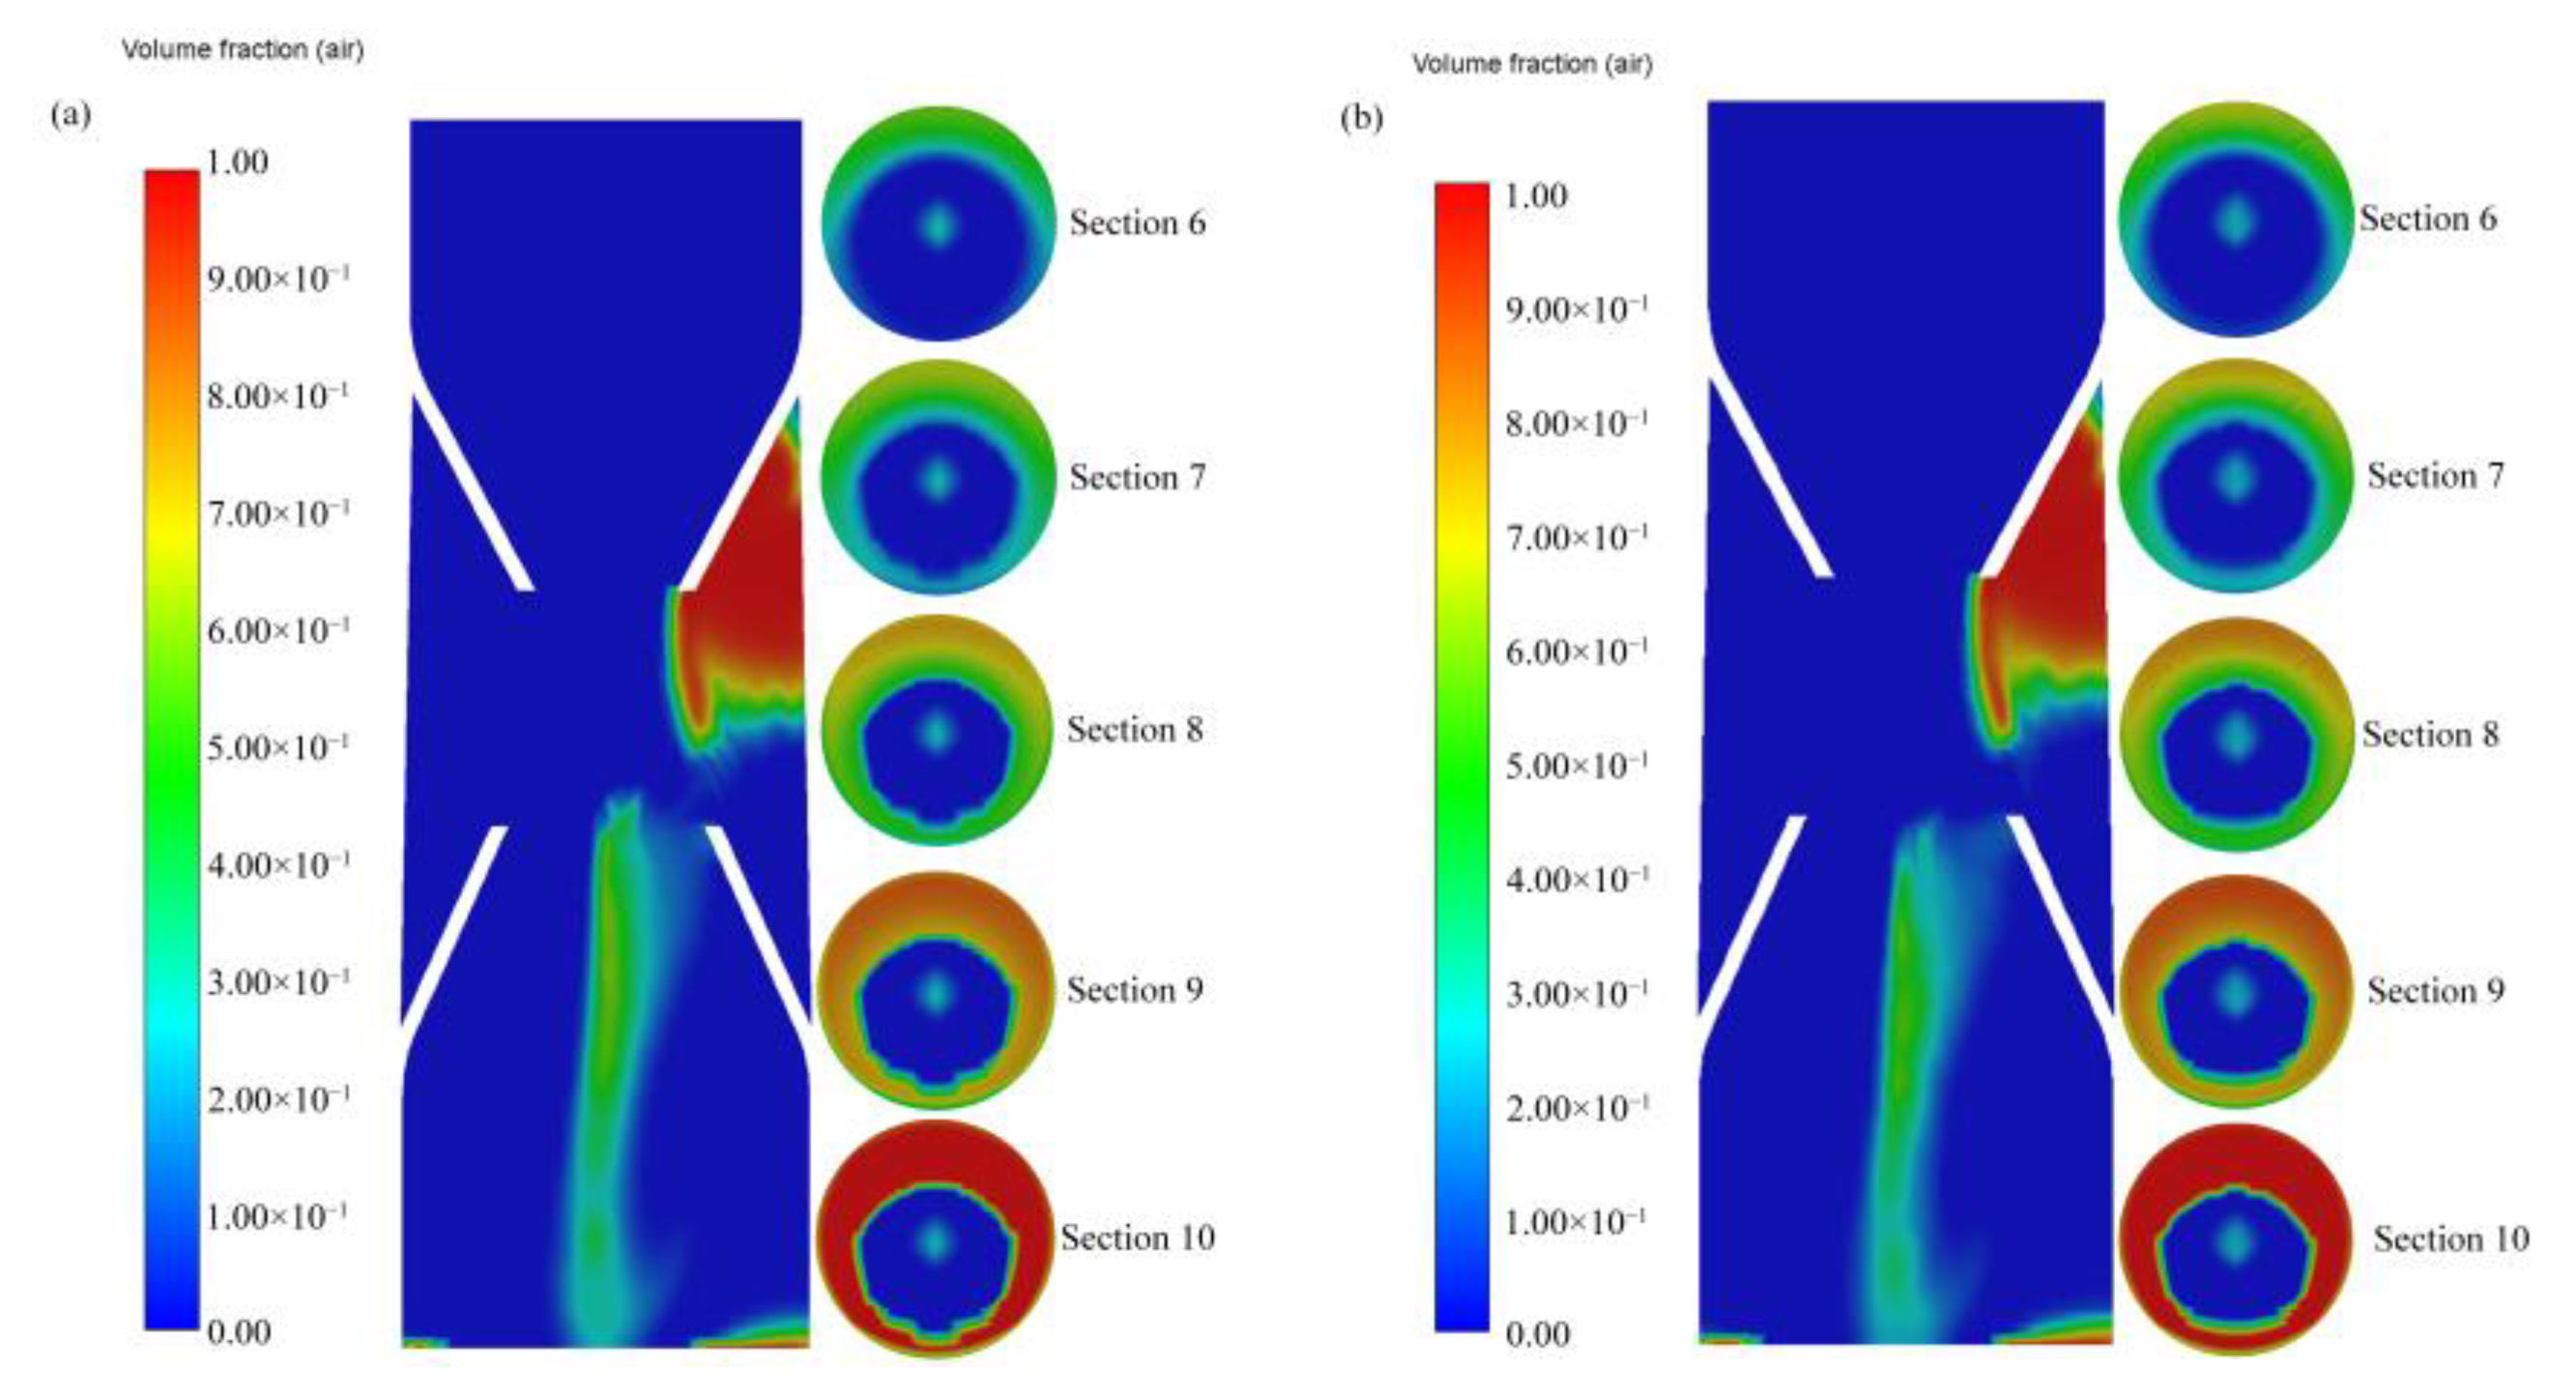
As the gas-phase distribution in Sections 1–4 did not change significantly, Sections 6–10 were used for analysis. From the sectional cloud diagram of the tube in Figure 4, it can be seen that the gas gathered to a great extent on the air inlet side and was driven to move at the center of the tube under the influence of the high-speed jet at the nozzle, and the gas content on the wall near the outlet increased. From the gas distribution cloud map of the generator section, it can be seen that the gas holdup at the center of the tube did not change much, whereas the gas content at the wall increased gradually. After the gas entered the generator from the suction pipe, it mainly moved at the center of the pipe. After moving to the static mixing zone, the gas gradually moved to the wall. As it moved to the outlet, the gas distribution changed from being concentrated at the center to being concentrated at the pipe wall.
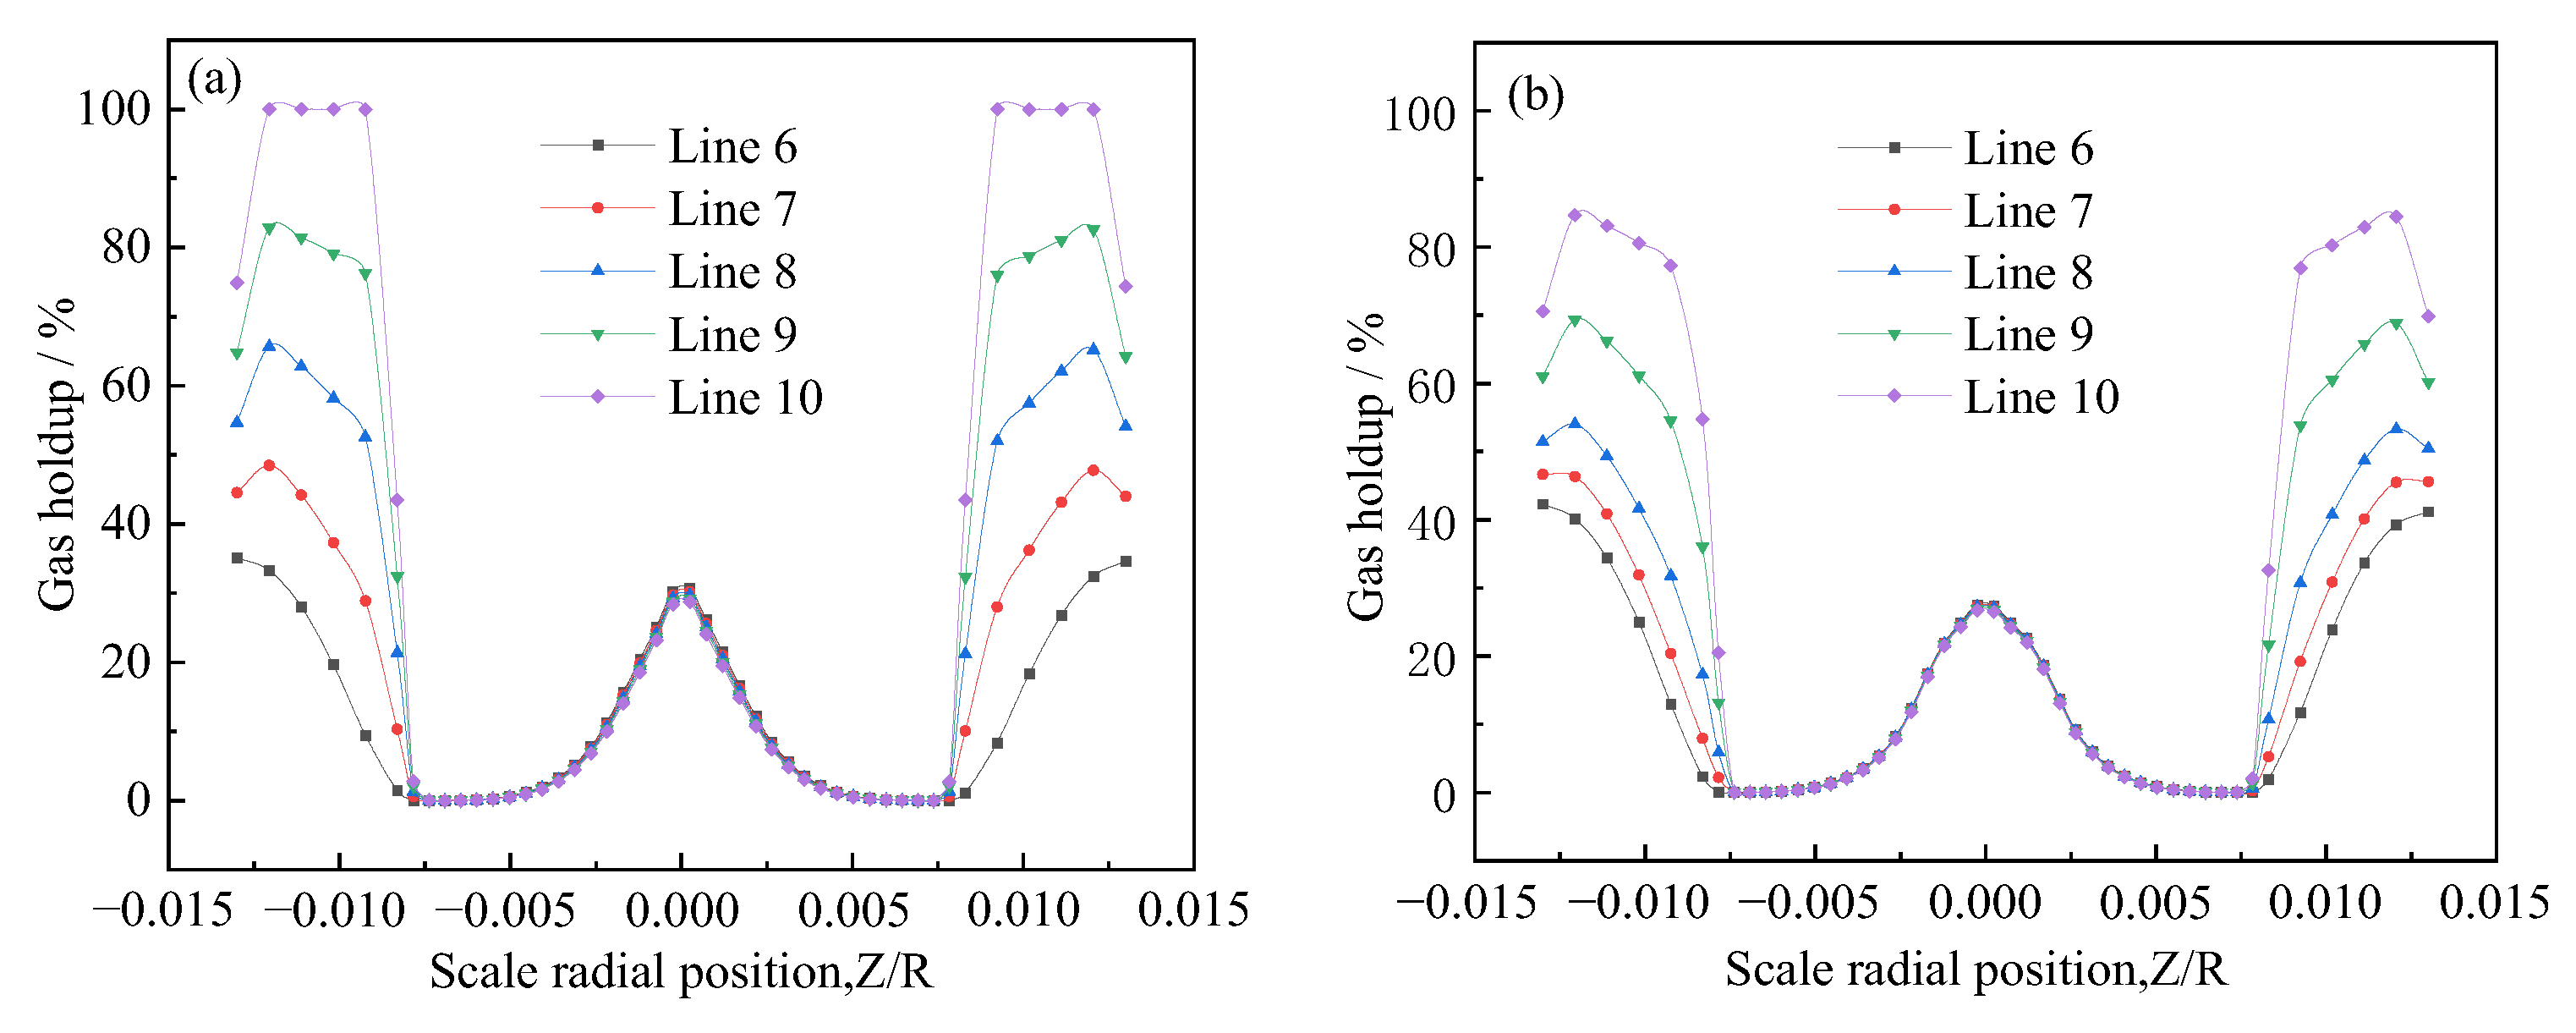
Five sections were selected at the lateral center of Sections 6–10, which were Line 6, Line 7, Line 8, Line 9, and Line 10. Figure 5a,b show that the gas accumulated more at both ends and was lower near the wall. A certain amount of gas was also observed in the center due to the jet. When the inlet flow rate was 6.5 m/s, the gas content near the wall was higher than when the inlet flow rate was 7.5 m/s. Moreover, at an inlet flow rate of 7.5 m/s, the gas content at the center of the pipe was higher than that at an inlet flow rate of 6.5 m/s. This was because the flow velocity at the center increased along with the inlet flow rate, which pulled in more air bubbles moving in flow in the center.
Figure 6 shows a cloud diagram of the diameter distribution of bubbles generated in the bubble generator when the inlet flow velocity was 6.5 m/s and 7.5 m/s. The cross-section cloud diagram in Figure 6 shows that the bubble diameter was constantly increasing. Figure 3 demonstrates that most of the gas was mainly distributed in the center of the tube at Sections 1–4. From the comparison of the cross-section bubble diameter cloud diagram, it can be seen that the bubbles were constantly moving towards the wall. This is consistent with Liu et al. [39], who found that the bubbles move toward the wall at the diffuser tube from the radial velocity of the bubbles when simulating the jet microbubble generator. Finally, the gas-phase distribution at the outlet exhibited the pattern shown in Figure 4. This may be because the breaking efficiency was greater than the coalescence efficiency at the beginning; hence, bubble breaking was the dominant process. The greater-diameter bubbles located in the center first broke into small ones and then moved to the periphery of the tube. Then, bubble coalescence started to dominate, and small-diameter bubbles coalesced to form large-diameter bubbles until the bubbles collapsed, merged, and equilibrated. As only one suction port was available, large-diameter bubbles on the wall near the suction port end were observed in the cloud map, and the gas tended to move towards this region. This was consistent with Liu et al. [39], who found that there was eccentricity in the movement of bubbles in a jet microbubble generator with a single-pipe air intake structure.
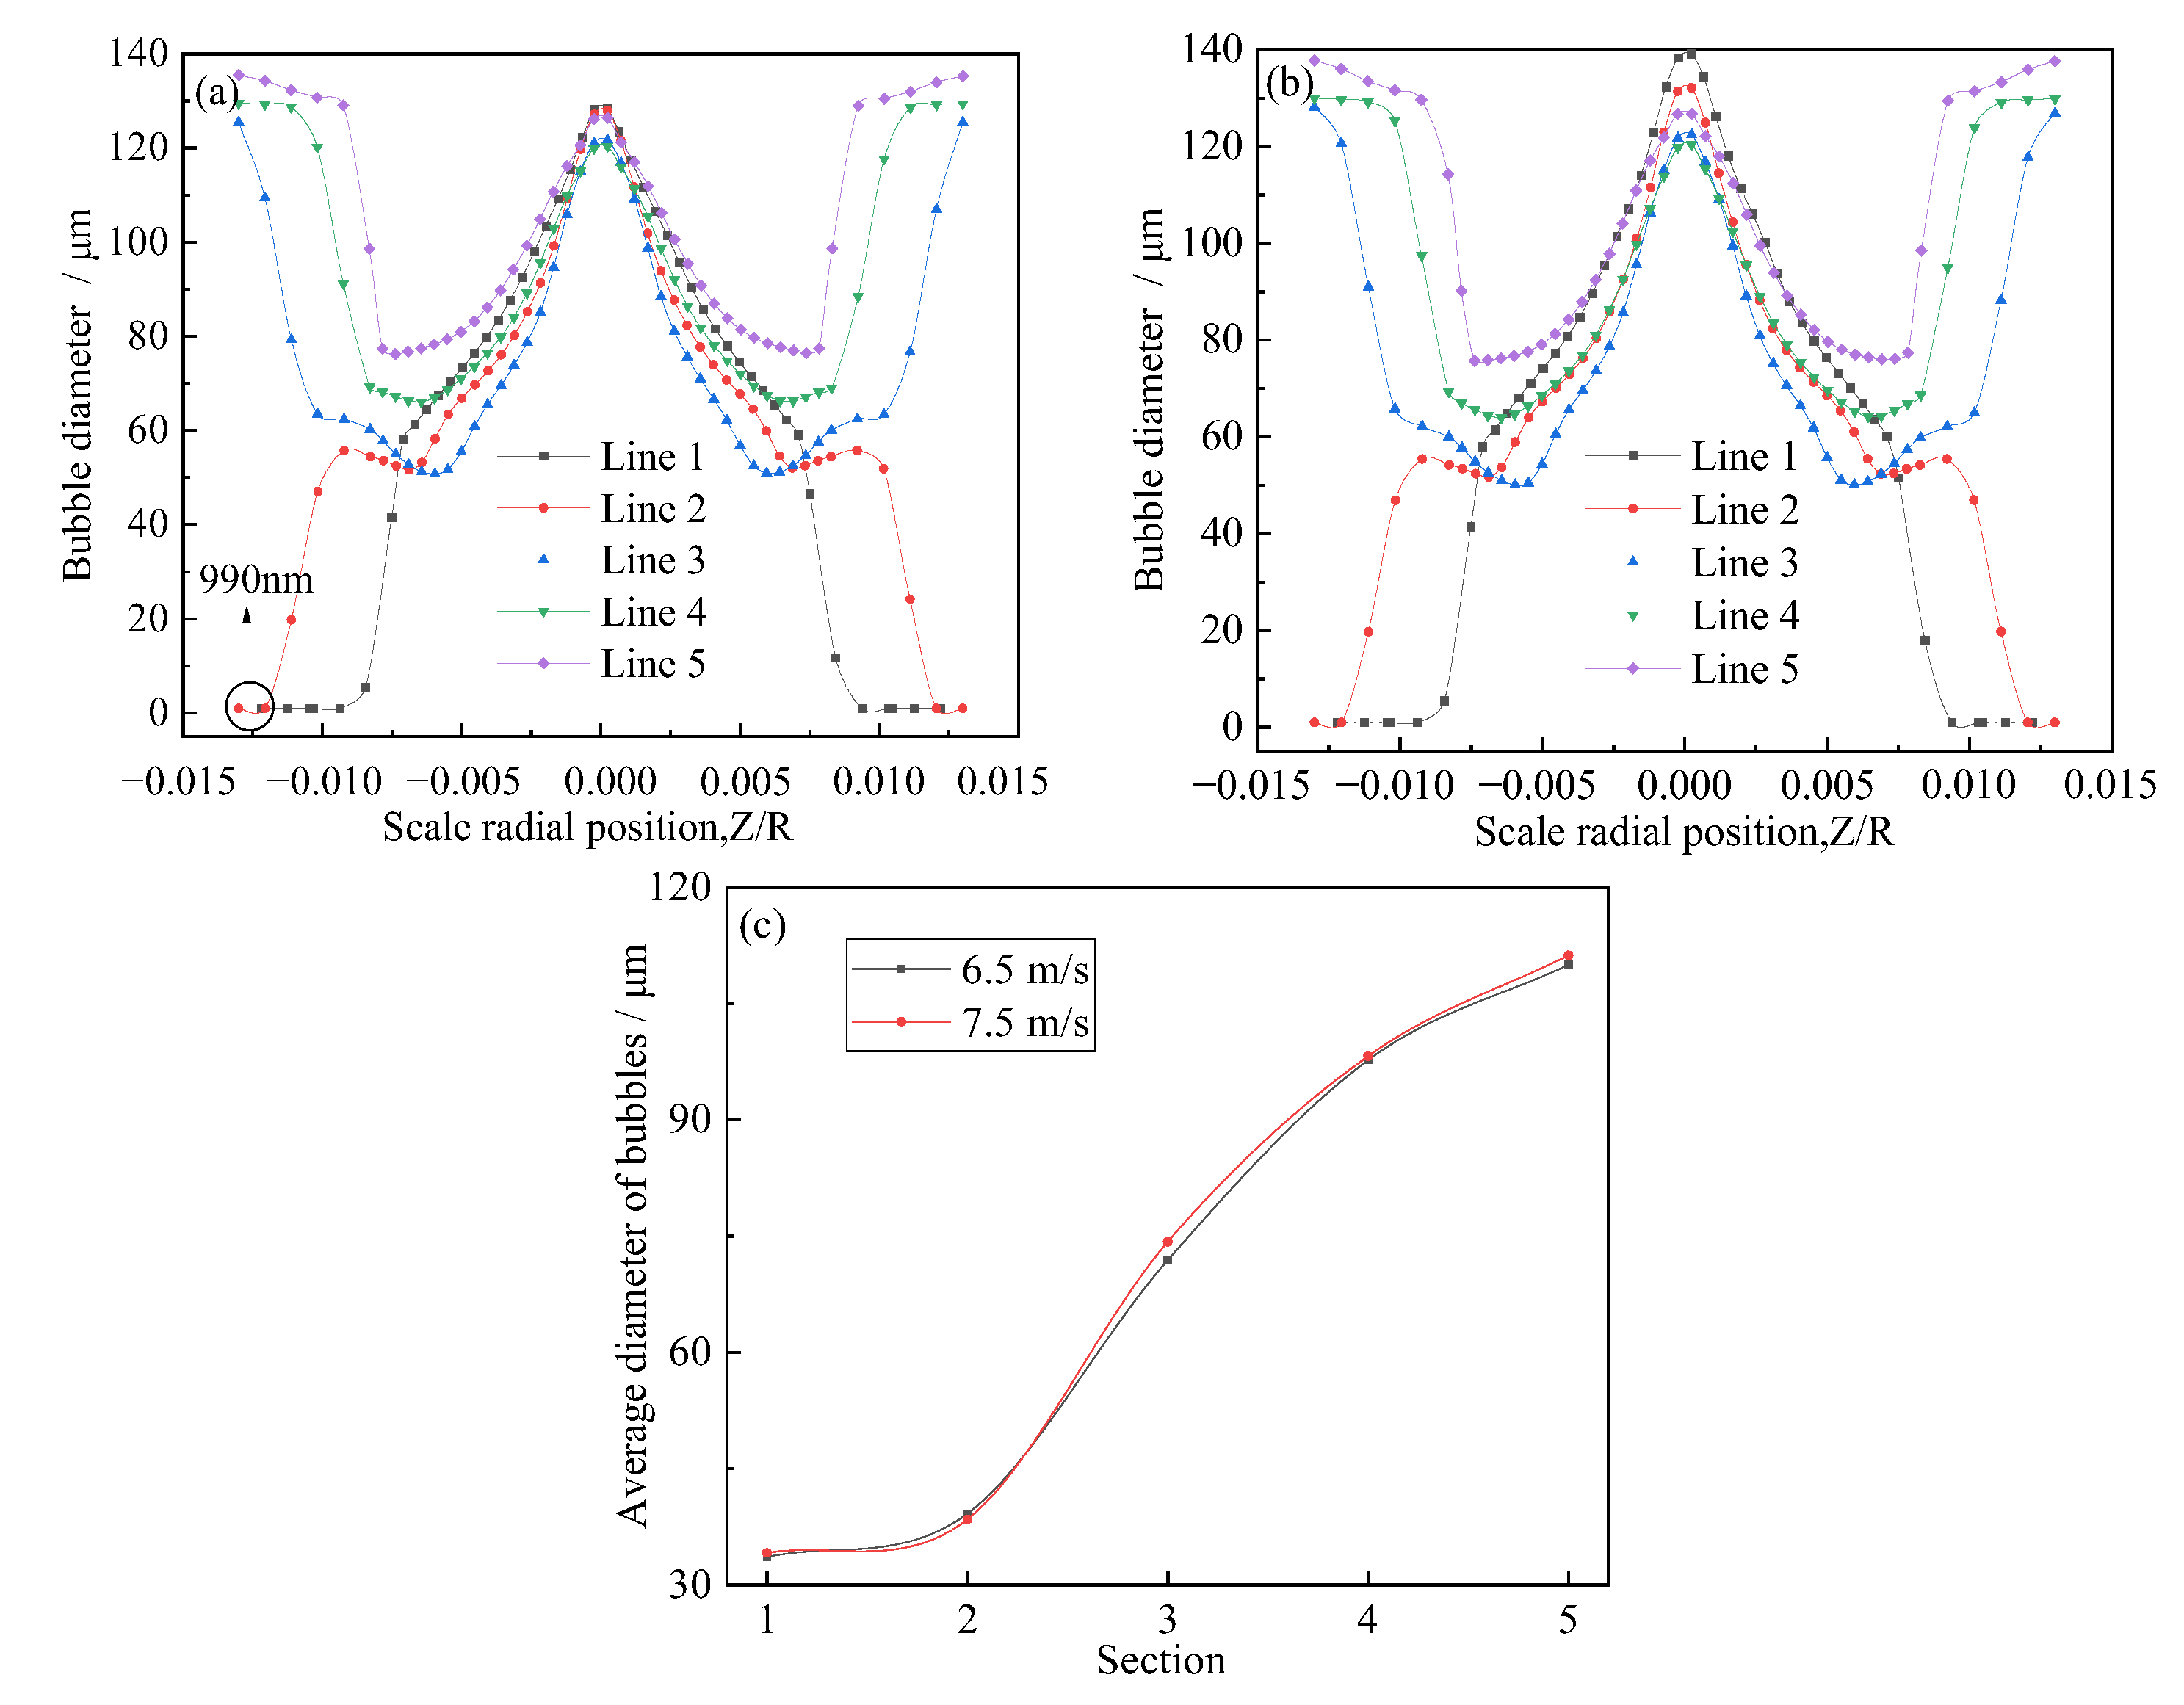
Five cross-sections at the lateral center of Sections 1–5, which were Line 1, Line 2, Line 3, Line 4, and Line 5, were taken. Figure 7a,b show that the diameter of the bubble inside the generator was approximately within the range of 0.99 μm to 140 μm, while the diameter of the bubbles at the wall and center of the tube was larger. The bubble diameter at both ends of Line 1 and Line 2 was the smallest and could reach 0.99 μm. Bubbles at the walls of Line 3, Line 4, and Line 5 gradually coalesced to form larger ones. By contrast, the bubble diameter at the center of Line 1 was larger than at the wall. From Figure 7c, it was clear that the bubble diameter increased from an average diameter of 30 μm to one of approximately 110 μm. The average diameter of the bubbles did not increase rapidly from Sections 1 to 2, while from Section 2 to Section 5, the bubble diameter increased sharply, and the growth rate was particularly prominent from Sections 2 to 4.

5. Conclusions

In this study, to explore the generation and evolution processes of bubbles in the micro−nanobubble generator, the geometric modeling of the micro−nanobubble generator of the laboratory cyclone jet flotation cell was performed, and the gas−liquid two-phase modeling was applied using the CFD–PBM model. The numerical flow simulation, size distribution, and motion evolution process of bubbles inside the generator were obtained.
(1)
After the gas entered the generator from the suction pipe, it mainly moved along the center of the pipe. After moving to the static mixing zone, most of the gas still gathered in the center of the pipe, and a small amount of gas slowly moved toward the wall. When approaching the outlet, a large amount of gas started to move toward the wall, meaning that the gas was mainly distributed on the wall at the outlet.
(2)
Inhaled gas creates large-size bubbles at the center of the tube. By contrast, the bubble size at the pipe wall was smaller. As the bubbles moved to the outlet, the bubble size at the wall increased. The crushing efficiency was greater than the coalescence efficiency, and bubble breaking was the dominant process. The relatively large bubbles located in the center were broken into small ones and then move to the periphery of the tube. Thereafter, bubble aggregation dominated, and small bubbles coalesced to form relatively large bubbles. The average diameter of the generated bubbles gradually increased from approximately 30 to 110 μm, and the growth rate of the bubbles from Sections 2 to 4 was particularly prominent. Additionally, the minimum diameter of the bubbles was about 0.99 μm.
This study is the first phase of research on this type of generator, and subsequent studies on mineralized bubbles will be carried out.

Author Contributions

Conceptualization, W.X., W.L., and B.L.; methodology, W.X., W.L., and Y.S.; software, W.X. and J.W. (Jianwei Wang); validation, W.X., W.L., and K.L.; formal analysis, W.X. and Y.S.; investigation, W.X. and K.L.; writing—original draft preparation, W.X.; writing—review and editing, W.L. and Y.S.; visualization, W.X.; supervision, W.L. and B.W.; project administration, W.L., B.W., and J.W. (Jiankang Wen). All authors have read and agreed to the published version of the manuscript.

Funding

This work was financially supported by the National Key Research and Development Project (No. 2022YFC2904202, No. 2018YFC1900301 and 2018YFC1900304), the enterprise-entrusted research on Microbubble Flotation Technology of Low-Grade Ore, and the National Natural Science Foundation of China (No. 52104269).

Data Availability Statement

Not applicable.

Conflicts of Interest

The authors declare no conflict of interest.

Nomenclature

AArea[m2]
aSpecific interfacial area[m−1]
BBirth rate[m−3 s−1]
BB, VThe source term of the bubble broken to generate V[–]
BC, VThe source terms combined into bubble V[–]
cConstant value[–]
CDDrag force coefficient[–]
CTLift force coefficient[–]
CVVirtual mass force coefficient[–]
DB, VThe source term of the bubble V broken[–]
DC, VThe source term of the disappearance of V[–]
dbBubble diameter[m]
fDzThe drag force on a single bubble[N]
FDzThe drag force on the bubble group[N]
FVzVirtual mass force[N]
FTLift force[N]
gGravitational acceleration[m/s2]
pPressure[Pa]
PBThe bubble breakage frequency[–]
PCThe bubble coalescence frequency[–]
TTemperature[K]
tTime[s]
vVelocity[m/s]
xiRepresentative volume for the ith size range[m3]
WeijWeber number[–]
αVolume fraction[–]
βDimensionless daughter size distribution[–]
εTurbulent energy dissipation rate[m2/s3]
κCell specific constant[–]
λPower parameter[–]
µDynamic viscosity[Pa s]
νKinematic viscosity[m2/s]
ρDensity[kg/m3]
ΤReynolds stress tensor[Pa]
χThe dimensionless energy[–]
χcThe critical dimensionless energy for breakup[–]

References

  1. Forbes, E. Shear, selective and temperature responsive flocculation: A comparison of fine particle flotation techniques. Int. J. Miner. Process. 2011, 99, 1–10. [Google Scholar] [CrossRef]
  2. Valderrama, L.; Rubio, J. High intensity conditioning and the carrier flotation of gold fine particles. Int. J. Miner. Process. 1998, 52, 273–285. [Google Scholar] [CrossRef]
  3. Hao, H.Q.; Li, L.X.; Somasundaran, P.; Yuan, Z.T. Adsorption of pregelatinized starch for selective flocculation and flotation of fine siderite. Langmuir 2019, 35, 6878–6887. [Google Scholar] [CrossRef] [PubMed]
  4. Chipakwe, V.; Sand, A.; Chelgani, S.C. Nanobubble assisted flotation separation of complex Pb–Cu–Zn sulfide ore–assessment of process readiness. Sep. Sci. Technol. 2022, 57, 1351–1358. [Google Scholar] [CrossRef]
  5. Parker, J.L.; Claesson, P.M.; Attard, P. Bubbles, cavities, and the long-ranged attraction between hydrophobic surfaces. J. Phys. Chem. 1994, 98, 8468–8480. [Google Scholar] [CrossRef]
  6. Lou, S.; Gao, J.; Xiao, X.; Li, X.; Li, G.; Zhang, Y.; Li, M.; Sun, J.; Li, X.; Hu, J. Studies of nanobubbles produced at liquid/solid interfaces. Mater. Charact. 2002, 48, 211–214. [Google Scholar] [CrossRef]
  7. Ducker, W.A. Contact angle and stability of interfacial nanobubbles. Langmuir 2009, 25, 8907–8910. [Google Scholar] [CrossRef] [PubMed]
  8. Liu, Y.; Zhang, X. Nanobubble stability induced by contact line pinning. J. Phys. Chem. 2013, 138, 014706. [Google Scholar] [CrossRef] [PubMed]
  9. Peng, H.; Birkett, G.R.; Nguyen, A.V. Origin of interfacial nanoscopic gaseous domains and formation of dense gas layer at hydrophobic solid–water interface. Langmuir 2013, 29, 15266–15274. [Google Scholar] [CrossRef] [Green Version]
  10. Weijs, J.H.; Lohse, D. Why surface nanobubbles live for hours. Phys. Rev. Lett. 2013, 110, 054501. [Google Scholar] [CrossRef] [PubMed]
  11. Yang, S.; Bao, S.; Liu, C.; Yuan, D.; Huang, W. An analytical model of the growth of invisible bubbles on solid surfaces in a supersaturated solution. Chem. Eng. Sci. 2020, 215, 114968. [Google Scholar] [CrossRef]
  12. Nazari, S.; Shafaei, S.Z.; Gharabaghi, M.; Ahmadi, R.; Shahbazi, B.; Fan, M. Effects of nanobubble and hydrodynamic parameters on coarse quartz flotation. Int. J. Min. Sci. Technol. 2019, 29, 289–295. [Google Scholar] [CrossRef]
  13. Sobhy, A.; Tao, D. Nanobubble column flotation of fine coal particles and associated fundamentals. Int. J. Miner. Process. 2013, 124, 109–116. [Google Scholar] [CrossRef]
  14. Cui, R. Study on the Improvement of Low-Rank Coal and Its Semi-Coke Adsorption on Congo Red Dye by Micro-Nano Bubbles. Master’s. Thesis, China University of Mining and Technology, Xuzhou, China, 2020. [Google Scholar]
  15. Ma, F.; Zhang, P.; Tao, D. Surface nanobubble characterization and its enhancement mechanisms for fine-particle flotation: A review. Int. J. Miner. Metall. Mater. 2022, 29, 727–738. [Google Scholar] [CrossRef]
  16. Ahmadi, R.; Khodadadi, D.A.; Abdollahy, M.; Fan, M. Nano–microbubble flotation of fine and ultrafine chalcopyrite particles. Int. J. Min. Sci. Technol. 2014, 24, 559–566. [Google Scholar] [CrossRef]
  17. Mitra, S.; Hoque, M.M.; Evans, G.; Nguyen, A.V. Direct visualisation of bubble-particle interactions in presence of cavitation bubbles in an ultrasonic flotation cell. Miner. Eng. 2021, 174, 107258. [Google Scholar] [CrossRef]
  18. Fan, M.; Tao, D.; Honaker, R.; Luo, Z. Nanobubble generation and its applications in froth flotation (part II): Fundamental study and theoretical analysis. Min. Sci. Technol. 2010, 20, 159–177. [Google Scholar] [CrossRef]
  19. Tao, D.; Wu, Z.; Sobhy, A. Investigation of nanobubble enhanced reverse anionic flotation of hematite and associated mechanisms. Powder Technol. 2021, 379, 12–25. [Google Scholar] [CrossRef]
  20. Tussupbayev, N.K.; Rulyov, N.N.; Kravtchenco, O.V. Microbubble augmented flotation of ultrafine chalcopyrite from quartz mixtures. Miner. Process. Extr. Metall. 2016, 125, 5–9. [Google Scholar] [CrossRef]
  21. Rulyov, N.N.; Filippov, L.O.; Kravchenko, O.V. Combined microflotation of glass beads. Colloids. Surf. 2020, 598, 124810. [Google Scholar] [CrossRef]
  22. Etchepare, R.; Azevedo, A.; Calgaroto, S.; Rubio, J. Removal of ferric hydroxide by flotation with micro and nanobubbles. Sep. Purif. Technol. 2017, 184, 347–353. [Google Scholar] [CrossRef]
  23. Tsave, P.K.; Kostoglou, M.; Karapantsios, T.D.; Lazaridis, N.K. A Hybrid Device for Enhancing Flotation of Fine Particles by Combining Micro-Bubbles with Conventional Bubbles. Minerals 2021, 11, 561. [Google Scholar] [CrossRef]
  24. Taghavi, F.; Noaparast, M.; Pourkarimi, Z.; Nakhaei, F. Comparison of mechanical and column flotation performances on recovery of phosphate slimes in presence of nano-microbubbles. J. Cent. South Univ. 2022, 29, 102–105. [Google Scholar] [CrossRef]
  25. Zhang, Z.; Ren, L.; Zhang, Y. Role of nanobubbles in the flotation of fine rutile particles. Miner. Eng. 2021, 172, 107140. [Google Scholar] [CrossRef]
  26. Li, P.; Zhang, M.; Yao, W.; Xu, Z.; Fan, R. Effective Separation of High-Ash Fine Coal Using Water Containing Positively Charged Nanobubbles and Polyaluminum Chloride. ACS Omega. 2022, 7, 2210–2216. [Google Scholar] [CrossRef]
  27. Zhang, M.; Li, P.; Yao, W.; Xu, Z.; Fan, R. Enhanced kaolinite flotation using amine coated nanobubbles. Colloids Surf. A Physicochem. Eng. Asp. 2022, 638, 128296. [Google Scholar] [CrossRef]
  28. Wang, Z.; Wang, L.; Meng, H. CFD–PBM numerical simulation on the break-up and coalescence process of dispersed phase droplet in Kenics static mixer. Chin. J. Process. Eng. 2021, 21, 935–943. [Google Scholar]
  29. Zhang, W. Numerical Simulation of Gas–Liquld (Solid) Flow in Terephthalic Acid Reactor Using CFD–PBM Coupled Model. Master’s Thesis, Beijing Institute of Petrochemical Technology, Beijing, China, 2021. [Google Scholar]
  30. Gao, S.; Xu, Y.; Li, J.; Ye, S.; Huang, W. Simulation study of microbubbles break-up and coalescence in centrifugal pump based on TFM-PBM coupling model. CIESC J. 2021, 72, 5082–5093. [Google Scholar]
  31. Duan, W.; Wang, C.; Zheng, Q. CFD–PBM simulation of three-phase flow in the mixing zone of a centrifugal contactor. J. Fluid Mech. 2021, 49, 25–32. [Google Scholar]
  32. Xing, C.; Wang, T.; Wang, J. Experimental study and numerical simulation with a coupled CFD–PBM model of the effect of liquid viscosity in a bubble column. Chem. Eng. Sci. 2013, 95, 313–322. [Google Scholar] [CrossRef]
  33. Jia, X. CFD–PBM Coupled Simulation of Two Phase Flow in Coal Liquefaction Bubble Column Reactor. Master’s Thesis, East China University of Science and Technology, Shanghai, China, 2020. [Google Scholar]
  34. Li, D.; Buffo, A.; Podgórska, W.; Marchisio, D.L.; Gao, Z. Investigation of droplet breakup in liquid–liquid dispersions by CFD–PBM simulations: The influence of the surfactant type. Chin. J. Chem. Eng. 2017, 25, 1369–1380. [Google Scholar] [CrossRef]
  35. Wang, S.; Bu, Q.; Luan, D.; Zhang, Y.; Li, L.; Wang, Z.; Shi, W. Study on gas–liquid flow characteristics in stirred tank with dual-impeller based on CFD-PBM coupled model. Chin. J. Chem. Eng. 2021, 38, 63–75. [Google Scholar] [CrossRef]
  36. Zhang, B.; Kong, L.; Jin, H.; He, G.; Yang, S.; Guo, X. CFD simulation of gas–liquid flow in a high-pressure bubble column with a modified population balance model. Chin. J. Chem. Eng. 2018, 26, 1350–1358. [Google Scholar] [CrossRef]
  37. Alam, H.S.; Sutikno, P.; Fauzi Soelaiman, T.A.; Sugiarto, A.T. CFD-PBM Coupled modeling of bubble size distribution in a swirling-flow nanobubble generator. Eng. Appl. Comp. Fluid 2022, 16, 677–693. [Google Scholar] [CrossRef]
  38. Ren, F.; Noda, N.A.; Ueda, T.; Sano, Y.; Takase, Y.; Umekage, T.; Tanaka, H. CFD-PBM approach for the gas-liquid flow in a nanobubble generator with honeycomb structure. J. Disper. Sci. Technol. 2019, 40, 306–317. [Google Scholar] [CrossRef]
  39. Liu, Y. Measurement and Numerical Simulation of Gas–Liquid Two Phase Flow in Jet Micro–Bubble Generator. Master’s Thesis, China University of Mining and Technology, Xuzhou, China, 2018. [Google Scholar]
  40. Wu, M.; Song, H.Y.; Liang, X.; Huang, N.; Li, X.B. Generation of micro-nano bubbles by self-developed swirl-type micro-nano bubble generator. Chem. Eng. Process. 2022, 181, 109136. [Google Scholar] [CrossRef]
  41. Wu, M.; Yuan, S.Y.; Song, H.Y.; Li, X.B. Micro-nano bubbles production using a swirling-type venturi bubble generator. Chem. Eng. Process. 2022, 170, 108697. [Google Scholar] [CrossRef]
  42. Deng, X.W.; Lv, B.; Cheng, G.; Lu, Y. Mechanism of micro/nano-bubble formation and cavitation effect on bubbles size distribution in flotation. Physicochem. Probl. Miner. Process. 2020, 56, 504–512. [Google Scholar] [CrossRef]
  43. Thakre, S.S.; Joshi, J.B. CFD simulation of bubble column reactors: Importance of drag force formulation. Chem. Eng. Sci. 1999, 54, 5055–5060. [Google Scholar] [CrossRef]
  44. Tomiyama, A.; Tamai, H.; Zun, I.; Hosokawa, S. Transverse migration of single bubbles in simple shear flows. Chem. Eng. Sci. 2002, 57, 1849–1858. [Google Scholar] [CrossRef]
  45. Luo, H. Coalescence, Breakup and Liquid Circulation in Bubble Column Reactors. Ph.D. Thesis, The University of Trondheim, Trondheim, Norway, 1993. [Google Scholar]
  46. Luo, H.; Svendsen, H.F. Theoretical model for drop and bubble breakup in turbulent dispersions. AIChE J. 1996, 42, 1225–1233. [Google Scholar] [CrossRef]
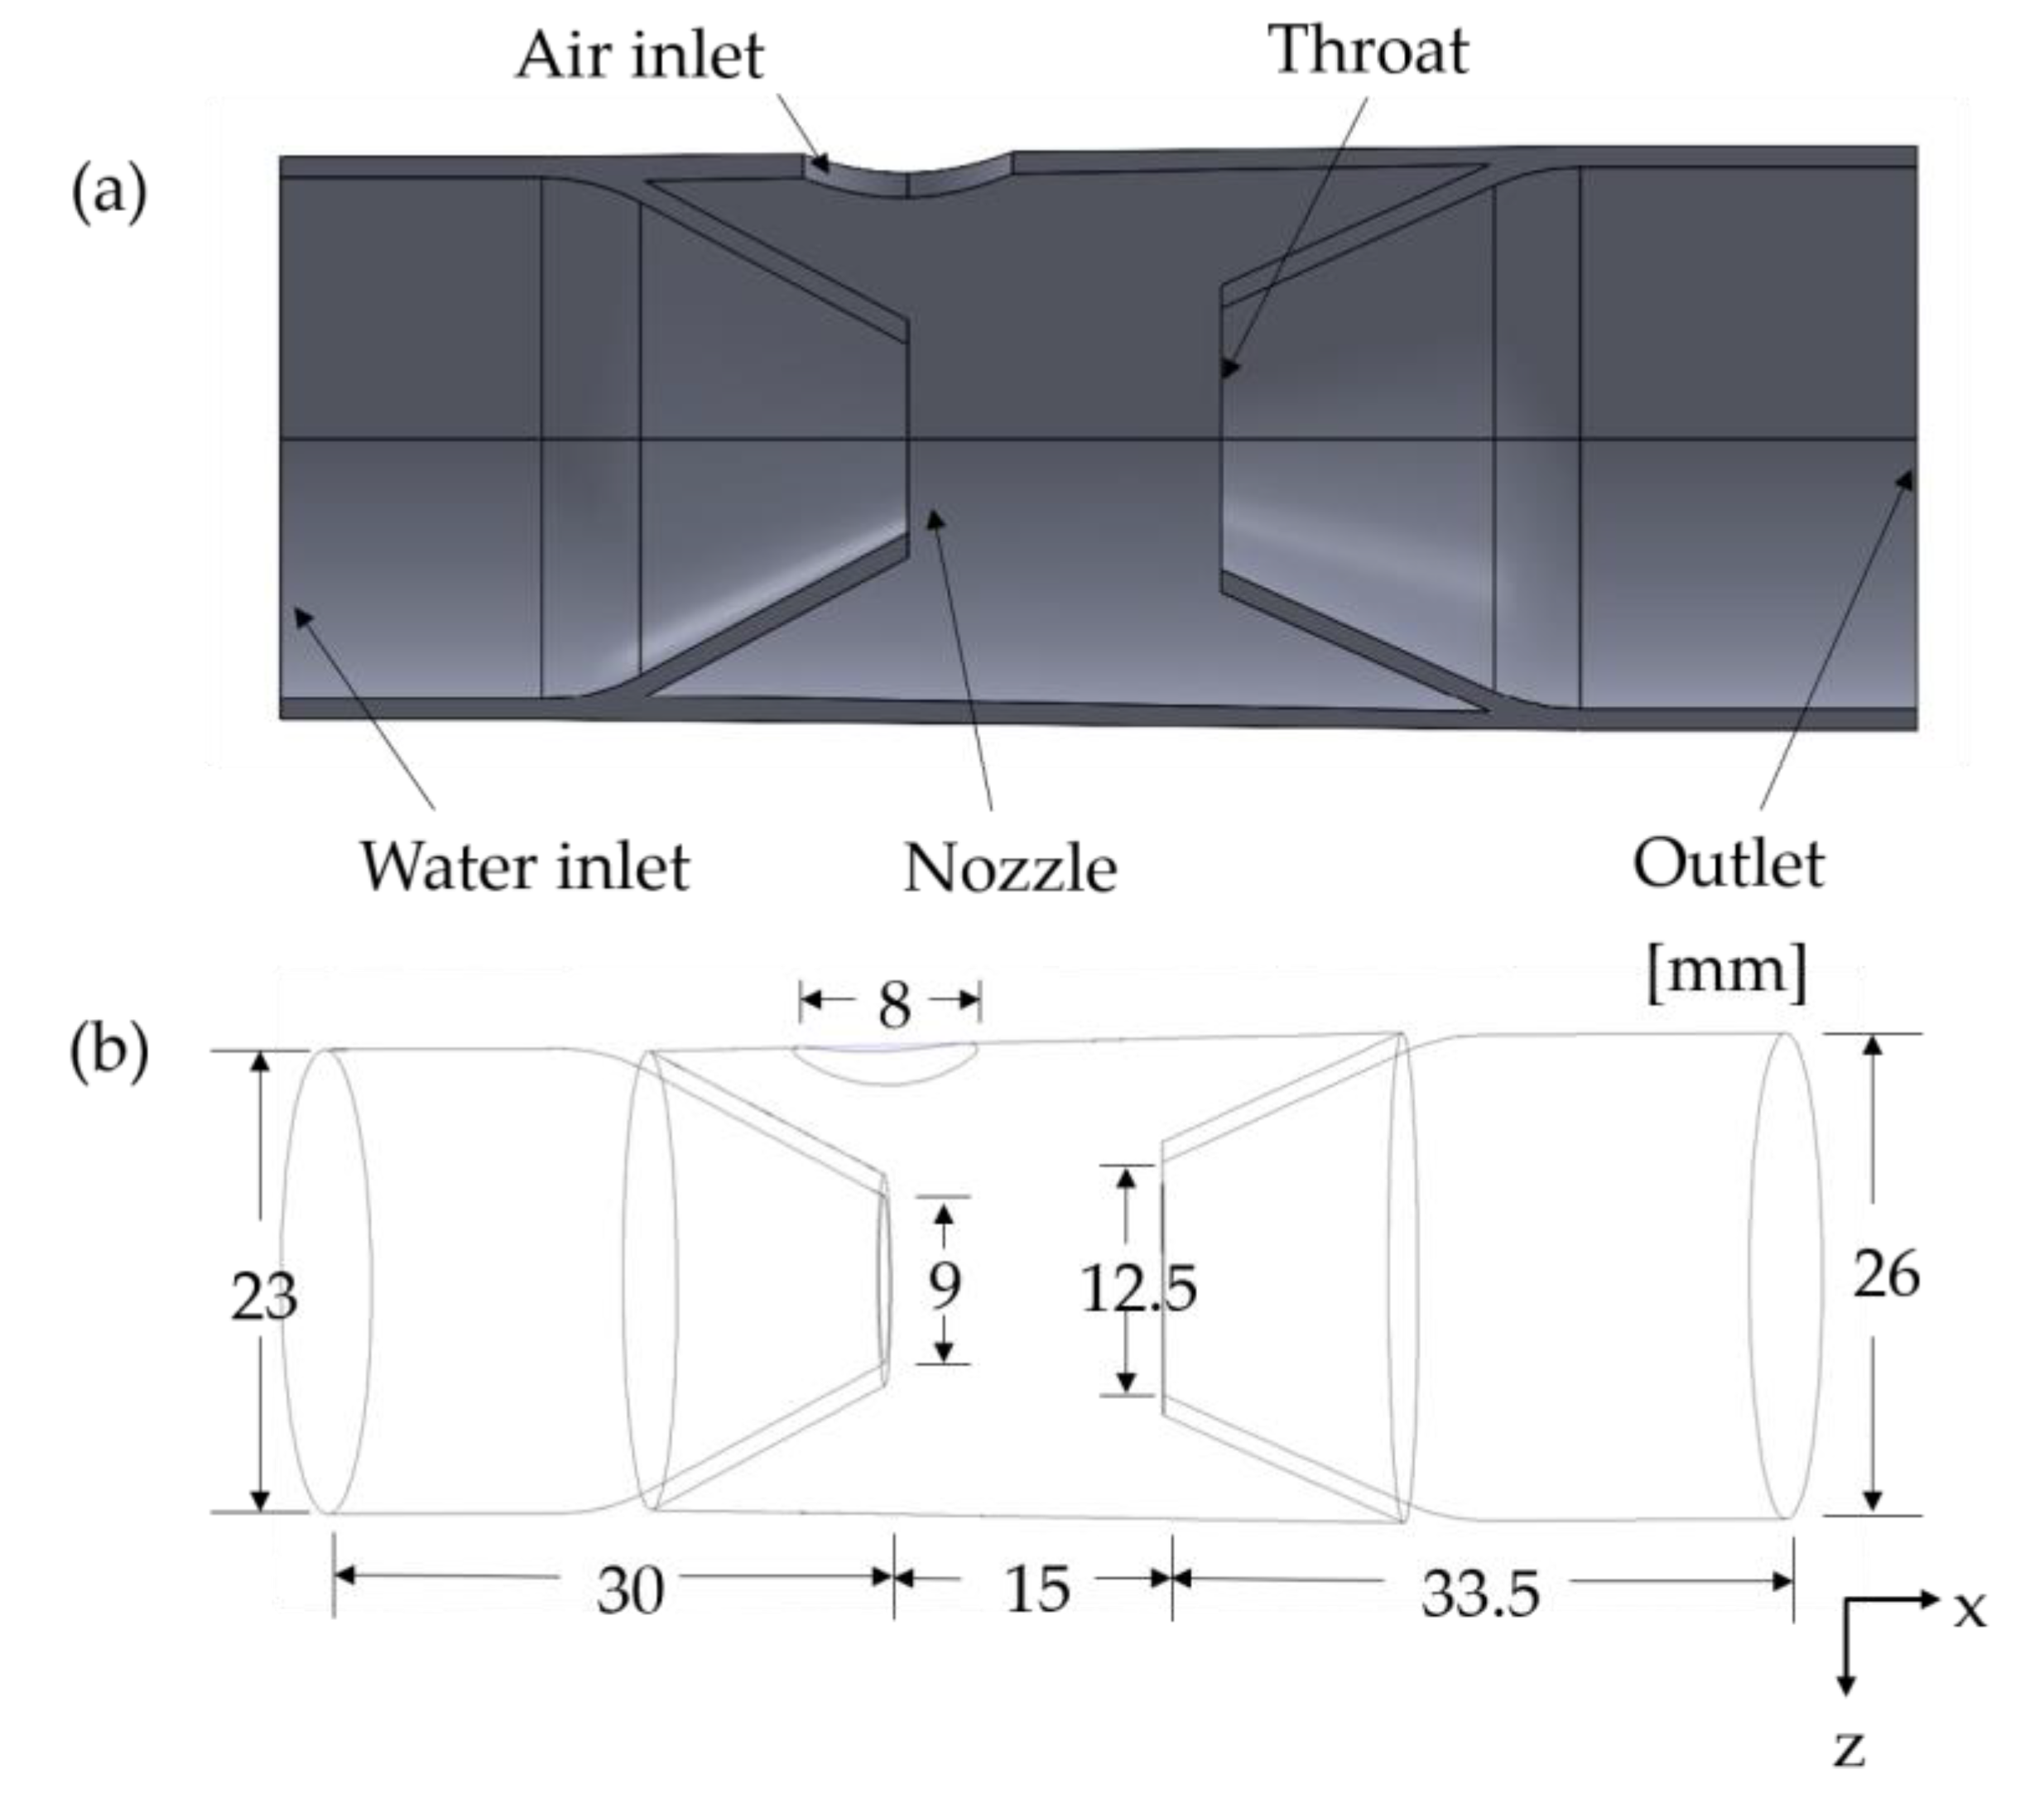
Figure 1. The micro–nanobubble generator’s (a) sectional view and (b) dimension drawing.
Minerals 12 01270 g001
Figure 2. Mesh model.
Minerals 12 01270 g002
Figure 3. Schematic diagram of section division.
Minerals 12 01270 g003
Figure 4. Cloud map of gas-phase distribution at an (a) inlet flow velocity 6.5 m/s and (b) inlet flow velocity 7.5 m/s.
Minerals 12 01270 g004
Figure 5. Distribution diagram of gas holdup at different sections at an (a) inlet flow velocity 6.5 m/s and (b) inlet flow velocity 7.5 m/s.
Minerals 12 01270 g005
Figure 6. Program of the bubble diameter distribution at (a) inlet flow velocity 6.5 m/s and (b) inlet flow velocity 7.5 m/s.
Minerals 12 01270 g006
Figure 7. Distribution of bubble diameters at different sections at an (a) inlet flow velocity 6.5 m/s, (b) inlet flow velocity 7.5 m/s, (c) inlet flow velocity 6.5 m/s, and 7.5 m/s average diameter of bubbles at different sections.
Minerals 12 01270 g007
Table 1. Discrete bubble sizes in PBM.
Bubble GroupDiameter/mm
Bin-01.024
Bin-10.512
Bin-20.256
Bin-30.128
Bin-40.064
Bin-50.032
Bin-60.016
Bin-70.008
Bin-80.004
Bin-90.002
Bin-100.001
Publisher’s Note: MDPI stays neutral with regard to jurisdictional claims in published maps and institutional affiliations.