Article

Chemical, Microstructural and Morphological Characterisation of Dentine Caries Simulation by pH-Cycling

by
Juan Sebastián Zuluaga-Morales
1,*,
María Victoria Bolaños-Carmona
1,
Carolina Cecilia Cifuentes-Jiménez
1 and
Pedro Álvarez-Lloret
2
1
Department of Stomatology, Faculty of Dentistry, University of Granada, 18071 Granada, Spain
2
Department of Geology, Faculty of Geology, University of Oviedo, 33005 Oviedo, Spain
*
Author to whom correspondence should be addressed.
Minerals 2022, 12(1), 5; https://doi.org/10.3390/min12010005
Submission received: 1 November 2021 / Revised: 12 December 2021 / Accepted: 15 December 2021 / Published: 21 December 2021
(This article belongs to the Special Issue Bone and Teeth Mineral Properties in Mammals)

Abstract

:
In vitro simulation of natural caries is of great importance in dental research for the development of more effective clinical treatments. The pH-cycling (pHc) procedure consists of a dynamic caries process with alternating de-remineralisation periods. The current research aims to evaluate the effects of the pHc procedure on mineral dentine properties in comparison with sound dentine and natural residual caries. For this purpose, dentine slices from human third molars were submitted to cycling periods of 14 and 28 days. The chemical composition, morphological and microstructural properties of the dentine samples were examined by infrared and Raman spectroscopies, X-ray diffraction, and scanning electron microscopy techniques. In addition, the depth of the demineralisation front was evaluated by Masson’s trichrome (MT) staining. The results showed that the pHc procedure led to notable changes in the mineral composition and the crystalline characteristics with respect to sound dentine and some extent to natural caries. The MT results revealed that pHc 28 yields a deeper lesion than pHc 14, simulating potential progression of natural caries. The results of this study provide a better understanding of the mechanisms of demineralisation that could occur in an in vivo environment and provide a standardised substrate similar to natural residual caries.

1. Introduction

Teeth are composed of different mineralised structures (enamel, dentine, and cementum) and pulp (soft tissue with formative, nutritive, protective, and reparative functions on dentine) [1]. These structures can be anatomically divided into the crown (i.e., visible part of the tooth) and the root (surrounded by the periodontium). The dentine-pulp complex is covered by the enamel in the crown and by cementum in the dental root [2]. Enamel is composed of 96% w/w mineral, 4% w/w organic matrix (including proteins and lipids), and a minor amount of water [3], while dentine consists of 70–75% w/w mineral, 18–21% w/w organic matrix, and 4–12% w/w water [4]. The mineral phase in human teeth is mainly presented as hydroxyapatite (HAp), whose chemical composition is commonly expressed as Ca5(PO4)3OH, and allows various ionic substitutions (i.e., F, Na+, Mg+2, and CO32) in its crystal lattice [5,6]. Organic matrix proteins are synthesised and secreted by specialised cells. These organic molecules play an important role in regulating tooth mineralisation and determining their chemical and structural properties. Amelogenin, ameloblastine, enamelin, and MMP-20 (metalloproteinases matrix) are the main organic constituents in enamel. On the other side, the organic matrix present in dentine consists of collagen types I, III, IV, and VI, dentine glycoproteins, phosphoproteins, sialoproteins, SLRPs (proteoglycans), and matrix metalloproteinases [6].
Dental caries is are the result of the acid attack on dental tissues as a by-product of the metabolism of bacterial plaque biofilm [7]. Caries represent a complex disease determined by the combination of various biological, behavioural, psychosocial, and environmental factors [8]. In the caries process, the enamel is demineralised by organic acids (mainly lactic acid) produced by biofilm bacteria from the metabolism of fermentable carbohydrates. The pH reduction initially provokes a white spot lesion in the enamel, which results in the formation of microcavitations as demineralisation progresses. Wide cavitations are visible when the caries process reaches the dentine structure [9]. For in vitro research, many protocols have been developed for artificial caries induction, such as static models by acid solution/gel (e.g., lactic or acetic acid), microbiological models (using some bacteria related to caries processes, such as Streptococcus mutans and Lactobacillus spp.), and dynamic models such as pH-cycling (pHc) [10]. These procedures attempt to simulate the inorganic and organic transformations that occur during the natural caries development process.
Caries simulation is also of great importance for the investigation of several clinical dental issues (i.e., application of adhesives, compatible materials, etc.) since the composition and structure of dentine caries may influence the mechanical properties of teeth [11,12], and the features of the adhesive system [13,14]. Moreover, residual caries is are left under restorations after selective (incomplete) caries removal in order to reduce the risk of pulpal exposure and post-operative pulpal symptoms [15]. Specifically, the pHc procedure consists of alternating demineralisation and remineralisation periods, simulating the mechanism of mineral loss and restoration that takes place during the caries process in the oral cavity [10,16]. Previous studies aimed to evaluate artificial caries-affected dentine (CAD) induction by using pHc [17,18]. To date, only Schwendicke et al. [19] have evaluated the suitability of residual caries induction by comparing different static and microbiological models through microradiographic and nano-hardness analysis. Based on that, it is necessary to accurately assess the physicochemical alterations that occur in dentine during the de-remineralisation process by means of the pHc procedure.
Several analytical techniques provide valuable information about the chemical composition and microstructural characteristics of dental mineralisation. For the chemical characterisation at a molecular level, Raman and FTIR spectroscopies have been widely used in dentistry for the investigation of mineral disorders and pathologies of oral hard and soft tissues [20,21], as well as for the characterisation of many dental biomaterials [22,23]. Additionally, analyses based on X-ray diffraction techniques allow the determination of several crystalline properties of the mineralised structures of the tooth (i.e., crystalline phases, crystallite size, and degree of demineralisation) [24,25]. Furthermore, scanning electron microscopy (SEM) is frequently used in dentistry for the microstructural analysis of hard dental tissues [26], periodontal research [27], and biomaterials [28]. Moreover, Masson’s trichrome (MT) is a staining protocol used in histology that allows the identification of certain cationic elements presented in mineralised type I collagen, distinguishing between intact and demineralised tissues [29]. The combined application of these techniques for the characterisation of mineralised tissues can be used for the detailed study of alterations caused by the de-remineralisation processes, such as those occurring in dental caries.
According to the World Health Organization (WHO), dental caries remain a major health problem in most industrialised countries, in which 60–90% of children and a significant adult population are still affected [30]. Obtaining standardised natural caries for in vitro dental research is a complex process and the pHc procedure has the advantage of simulating a dynamic carious process in which demineralisation is higher than remineralisation. Therefore, the current study aims to evaluate the feasibility of the pHc procedure at different experimental times as a dynamic method to simulate natural residual caries lesions in dentine. For this purpose, the current research attempts to determine the compositional, microstructural, and morphological characteristics in dentine demineralisation during pHc in comparison with the alterations produced in the natural caries process. A better understanding of the demineralisation processes involved in dental caries will lead to more effective clinical strategies and the development of novel methods and approaches for science, engineering, and medicine.

2. Materials and Methods

2.1. Experimental Design and Sample Preparation

This study was approved by the Research Ethics Committee of the University of Granada (Spain) with number 942/CEIH/2019 (Approval date 27 January 2020). Initially, 69 sound (non-carious and no structural defects) third molars and 23 carious permanent molars stored in thymol solution (0.05%) were randomly selected from a pool of teeth. Teeth with occlusal caries were included following ICDAS #5 criterion (distinct cavity with visible dentine) [31,32]. Since the caries lesions reached deep dentine, the depth of the lesions was set above the pulp chamber. In this in vitro study, sound teeth were randomly allocated into three groups (n = 23) according to the substrate-factor: (1) negative control/sound dentine (SD): immersion in distilled water at room temperature (2) artificial caries induction with a pHc model for 14 days (pHc 14); and (3) artificial caries induction with a pHc model for 28 days (pHc 28). The natural carious teeth were considered as a positive control.
The crown of sound teeth was sectioned mesiodistally using a low-speed microtome (Buehler, IL, USA) with a diamond disc (Benetec Limited, Beaconsfield, United Kingdom) under constant water cooling to obtain 1 mm thick coronal dentine slices. Dentine slices were sequentially ground with 600, 1200, 2500, and 4000-grit silicon carbide papers. The carious molars were partially excavated until the slightly moist, leathery, carious dentine remaining in the proximity of the pulp (i.e., residual caries) was reached. Roots of carious teeth were removed. Slices of residual caries were obtained and ground according to the procedure previously described from occlusal surface until 1 mm thickness, measured by a digital micrometer (Mitutoyo, Kawasaki, Japan).

2.2. Artificial Caries Induction (pHc)

Slices were drilled near the edge with a round diamond bur (Komet #802-314-010, Komet-Brasseler, Lemgo, Germany) in a high-speed handpiece (Kavo Supertorque Lux 660B, Kaltenbach & Voigt GmbH, Biberach, Germany) under constant water cooling to allow the pending immersion through a wire into the test tubes. For the artificial caries induction, the pHc was performed using 20 mL of a demineralising solution (2.2 mM CaCl2, 2.2 mM NaH2PO4, and 50 mM acetic acid adjusted to a pH of 4.8) for 8 h and 20 mL of a remineralising solution (1.5 mM CaCl2, 0.9 mM NaH2PO4 and 0.15 M KCl adjusted to a pH 7.0) for 16 h, as proposed by Marquezan et al. [18]. The solutions were renewed daily and the slices were rinsed with deionised water after each immersion. This pHc procedure was carried out at two experimental times for 14 and 28 days at room temperature without agitation. All reagents for solutions were supplied by Sigma-Aldrich (St. Louis, MO, USA) (>99.0% pure).

2.3. Attenuated Total Reflectance Infrared Spectrometry Analyses

Samples (n = 10 per group) were analysed using a JASCO 6200 (Jasco Inc., Easton, MD, USA) FTIR spectrometer equipped with a diamond-tipped ATR accessory (ATR Pro ONE, JASCO Inc., Easton, MD, USA). The ATR-FTIR spectra were recorded in absorbance mode with a resolution of 1 cm−1 over 124 scan accumulations using a 400–4000 cm−1 spectral range. Overlapping peaks were resolved by a second derivate method within each sectioned band using curve fitting software PeakFit v4.12 (Systat Software, San Jose, CA, USA). The degree of smoothing was applied in a range of 10–25% and the peak area fitting by the mixed Gaussian-Lorentzian function. The curve fitting was accepted when r2 achieved values higher than 0.95. This procedure was used to calculate the relative peak areas within the carbonate (855–890 cm−1; v2 CO32−) and phosphate (890–1150 cm−1; v1, v3 PO43−) bands. In addition, the following parameters were calculated from the area ratios: (1) MinCO3 (band area ratio: v2 CO32−/v1, v3 PO43−): relative amount of carbonate to phosphate in mineral [33,34]; (2) Degree of mineralisation (band area ratio: v1, v3 PO43−/Amide I): relative amount of phosphate mineral to the organic matrix (1640 cm−1 band) [34]; and (3) Crystallinity index (CI): calculated as the ratio between the sub-bands areas at 1030 cm−1 (high crystalline apatite phosphates) to 1020 cm−1 (poorly crystalline apatite phosphates) within the v1, v3 PO43− region [34,35].

2.4. Raman Spectrometry Analyses

Samples (n = 10 per group) were analysed with a JASCO NRS-5100 (Jasco Inc., Easton, MD, USA) Raman spectrometer equipped with an optical Olympus microscope. Spectra were acquired using a 785 nm red diode laser in a spectral range of 300–1800 cm−1 with a resolution of 1 cm−1 and an exposure time of 10 s with 5 accumulations. The measurements of the Raman spectra were performed following the same procedure described above for the ATR-FTIR analyses. The following parameters were calculated: (1) Carbonate to phosphate (amplitude ratio: 1070 cm−1/959 cm−1): degree of carbonate substitution type B in the apatite lattice structure [36]; (2) Phosphate to CH2 (amplitude ratio: 959 cm−1/1450 cm−1), as a mineral to the organic ratio: phosphate symmetrical stretch-band to CH2 wagging mode of side-chains of collagen molecules [36,37]; and (3) Crystallinity Index: calculated as the full width at half maximum (FWHM) at 959 cm−1, main v1 phosphate (PO43−) absorption band [38].

2.5. Two Dimensional X-ray Diffraction Analyses

Two-dimensional X-ray diffraction (2D-XRD) patterns were obtained (n = 5 per group) using an X-ray diffractometer (Bruker D8 DISCOVER, Billerica, MA, USA) equipped with a 2D detector (DECTRIS PILATUS 3 100K-A, Baden-Dätwill, Switzerland) with Cu Kα radiation at 50 kV and 30 mA. The 2θ scanning angle ranged from 20° to 60°, considering 19 steps and 40 s/step and focusing with an X-ray pin-hole collimator of 0.5 mm in diameter. The analysed spots in dentine surfaces (three spots per sample) were selected employing an optical microscope equipped with a laser reference. The diffraction intensities concentrated in arcs (corresponding to specific d-spacing) were integrated into a unidimensional 2Theta scan. The crystallite size for HAp crystals was determined by measuring the full width at half maximum (FWHM) of the (002) diffraction peaks displayed at approximately 25.9° in the 2Theta pattern. The crystallite size (d) is related to the volume-averaged measurement of the crystalline domains (XRD—Crystallinity Index). For this purpose, the Debye-Scherrer method was employed to estimate crystallite size measurements [39]:
d = /β cos θ
where d corresponds to the crystallite size (expressed in nm), λ is the wavelength of X-ray source (λ = 1.5418 Å), K is the Scherrer’s constant, assumed as a factor K = 0.89, and β is the line broadening (FWHM) for (002) diffraction reflection.

2.6. Scanning Electron Microscopy

Three specimens per group were fixed in 2.5% glutaraldehyde at pH 7.4 for 12 h at 4 °C. After fixation, samples were immediately immersed in a PBS solution at pH 7.4 for 1 h (applying 20 min cycles) and rinsed in distilled water for 1 minute. Subsequently, samples were dehydrated in ascending grades of ethanol (50%, 70%, 90%, and 96%) for 20 min at each step. Finally, the samples were immersed in 100% ethanol for two one-hour cycles. The prepared specimens were mounted on aluminum stubs and carbon-coated using ion sputtering equipment. Electron microscope imaging was carried out using a scanning electron microscope (JEOL JSM-5600, Peabody, MA, USA) operated at 20 kV voltage and 10 mA current. Energy dispersive x-ray spectroscopy (EDS) was employed to estimate the phosphorus (P) and calcium (Ca) relative concentrations on the dentine surfaces.

2.7. Masson’s Trichrome Staining

Three additional specimens per group were longitudinally sectioned in slices for histological analyses (i.e., Masson’s trichrome). Slices were fixed in a glass holder with a photocuring adhesive (Technovit 7210 VLC; Heraeus Kulzer GmbH Co., Werheim, Germany) and sequentially grounded with silicon carbide papers from 1200 to 4000-grit to a thickness of approximately 10 µm. Slices were stained with Masson’s trichrome protocol and examined in an optical microscope (BH-2; Olympus, Tokyo, Japan) at 50× magnification. The width of the red-coloured band, corresponding to demineralised dentine with exposed collagen, was measured in each section. For this purpose, three different width measurements were performed by one single blinded examiner using ImageJ 1.50 software (National Institutes of Health, Bethesda, MD, USA). MT analysis was not possible to perform for the positive control group (natural caries) due to the loss of the carious tissue during the polishing of the sections.

2.8. Statistical Analyses

Characterisation parameters were expressed using mean ± standard deviation (SD). The data normal distribution was checked by the Shapiro-Wilk test. Parametric (one way-ANOVA with Tukey and Games-Howell post hoc) and non-parametric (Kruskal-Wallis and Mann-Whitney) tests were applied according to the distribution normality. The significance level was established at p < 0.05. Statistical analyses were performed using SPSS 25.0 (SPSS Inc., Chicago, IL, USA) software.

3. Results

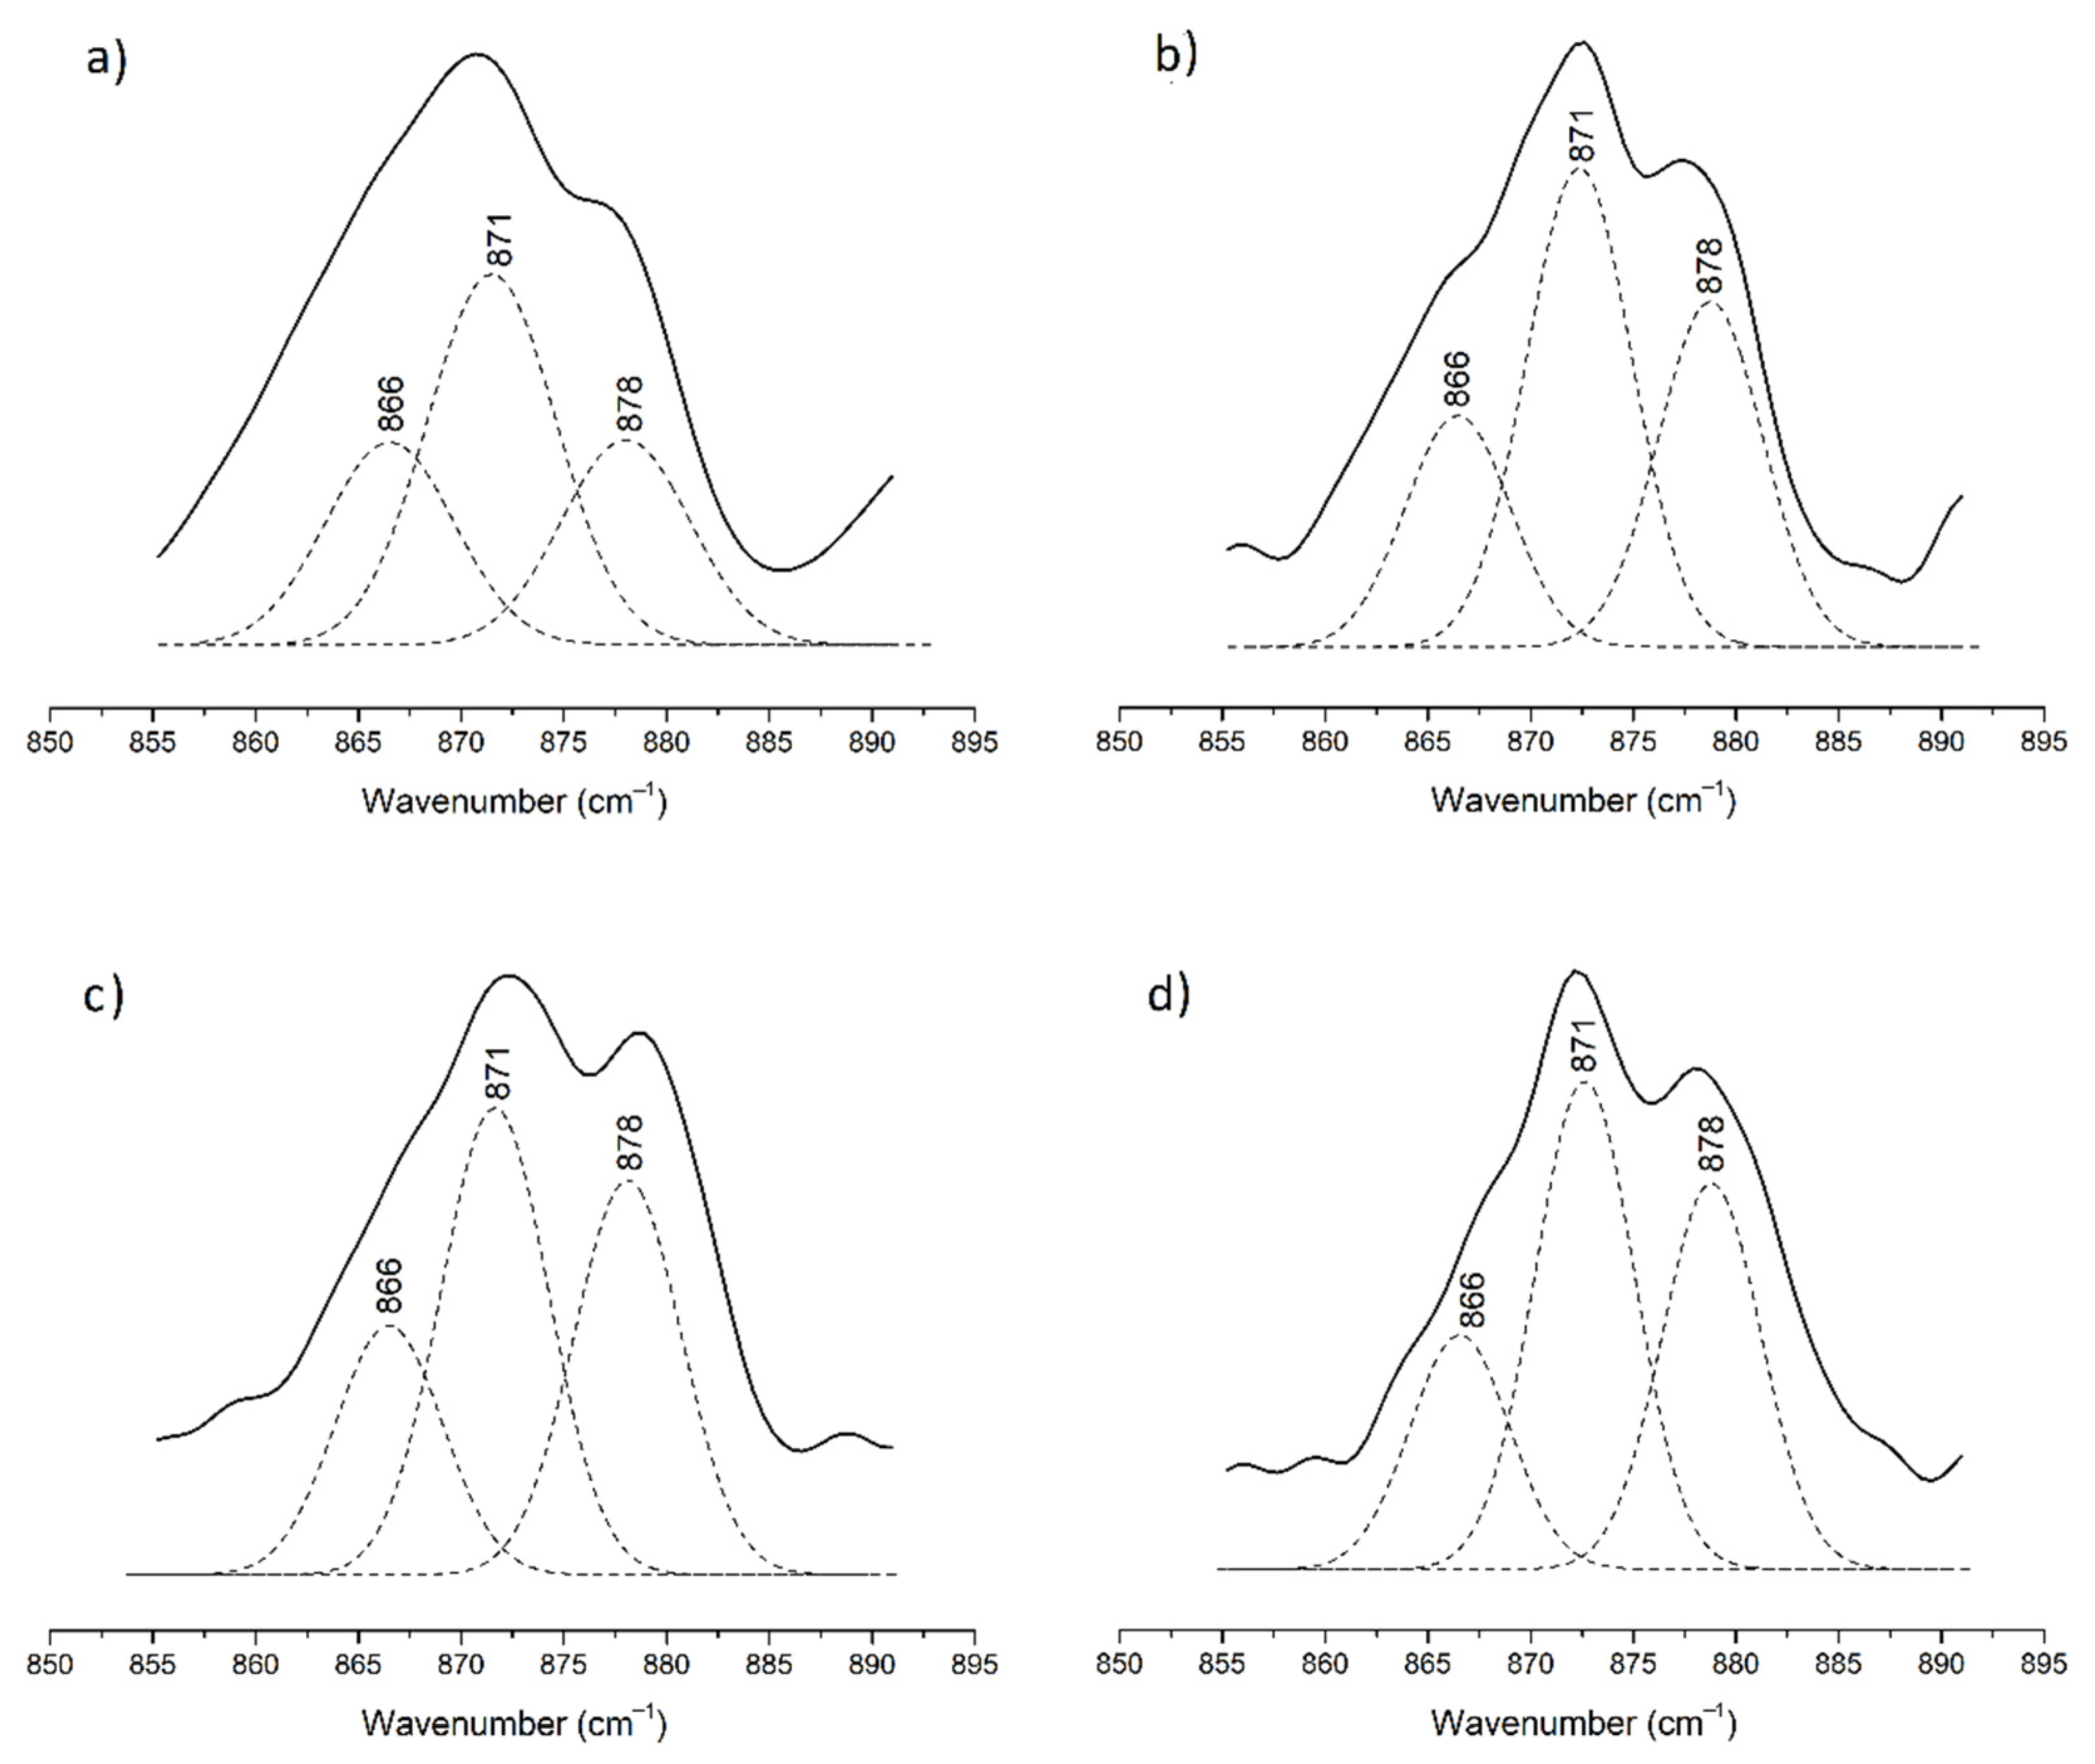
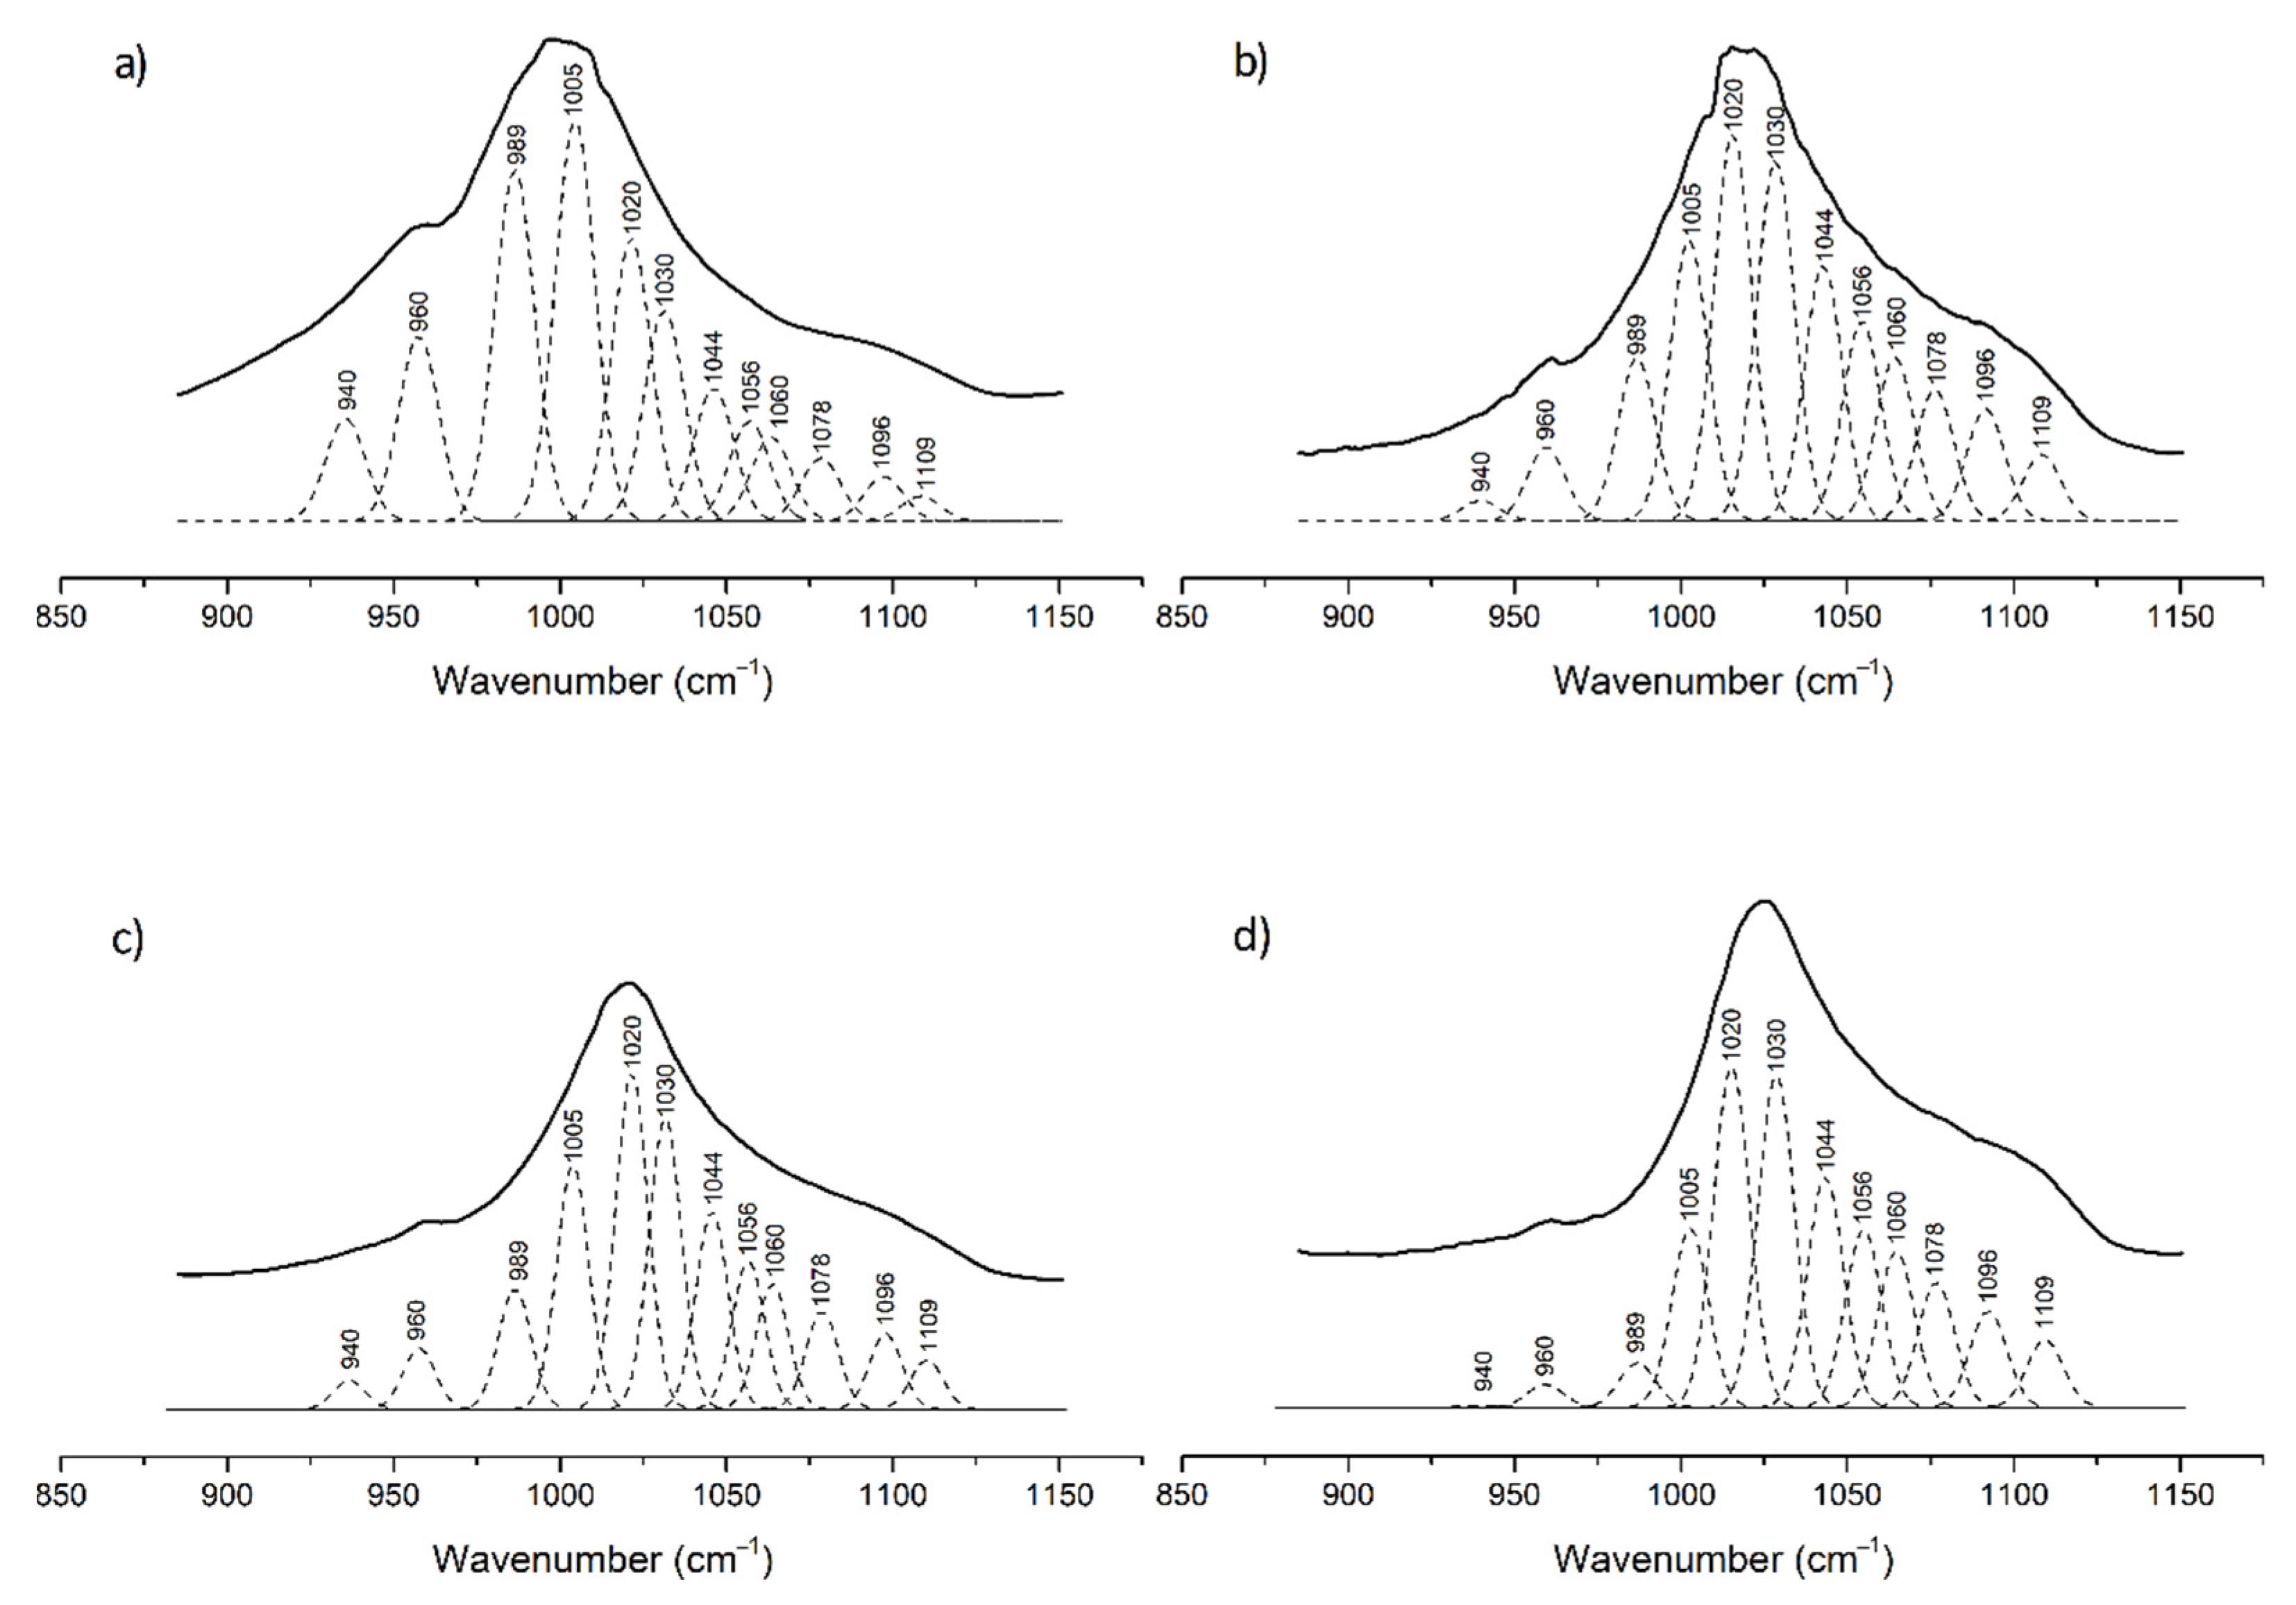
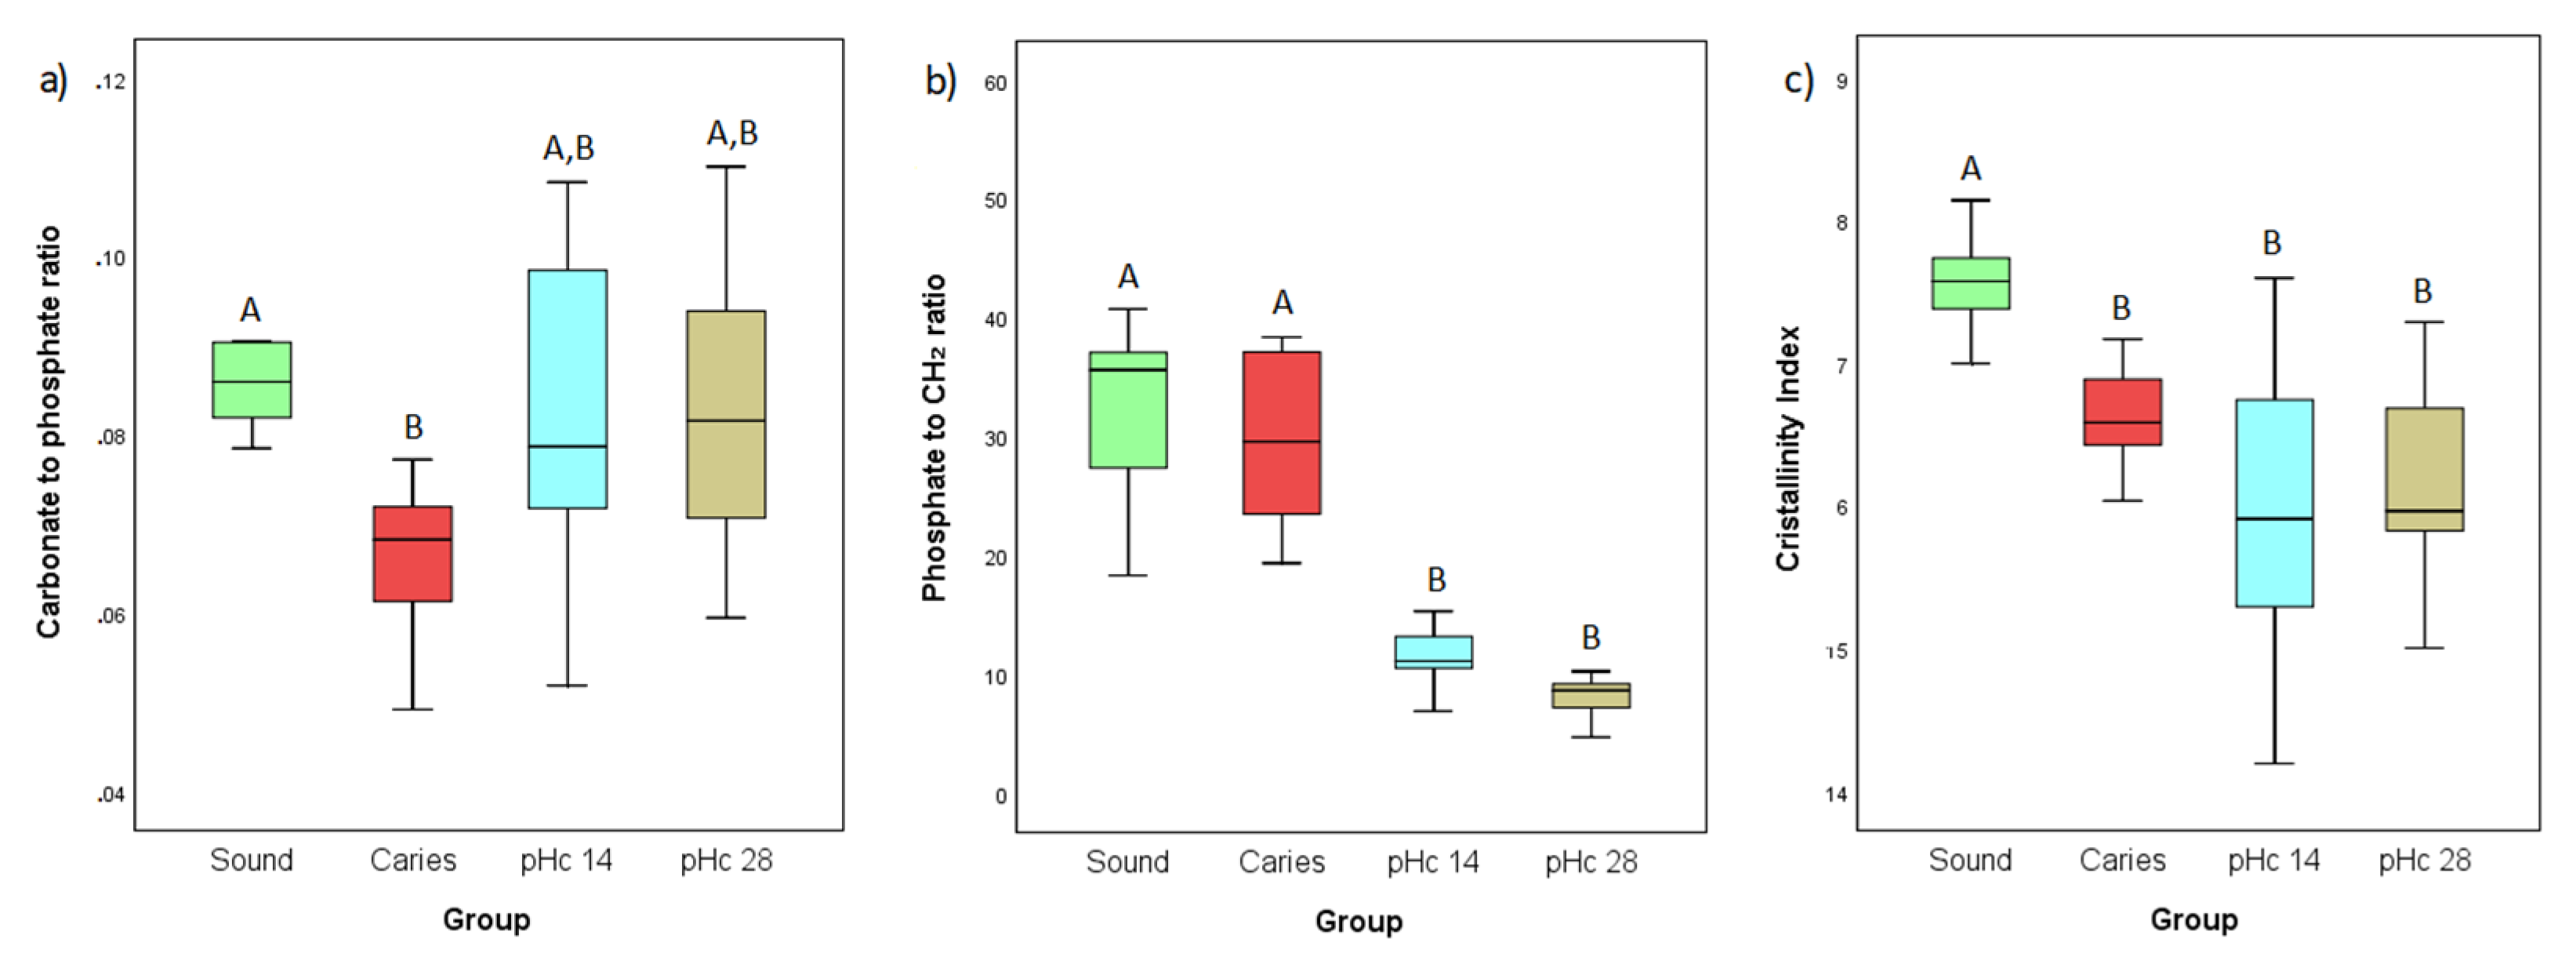
3.1. ATR-FTIR Analyses
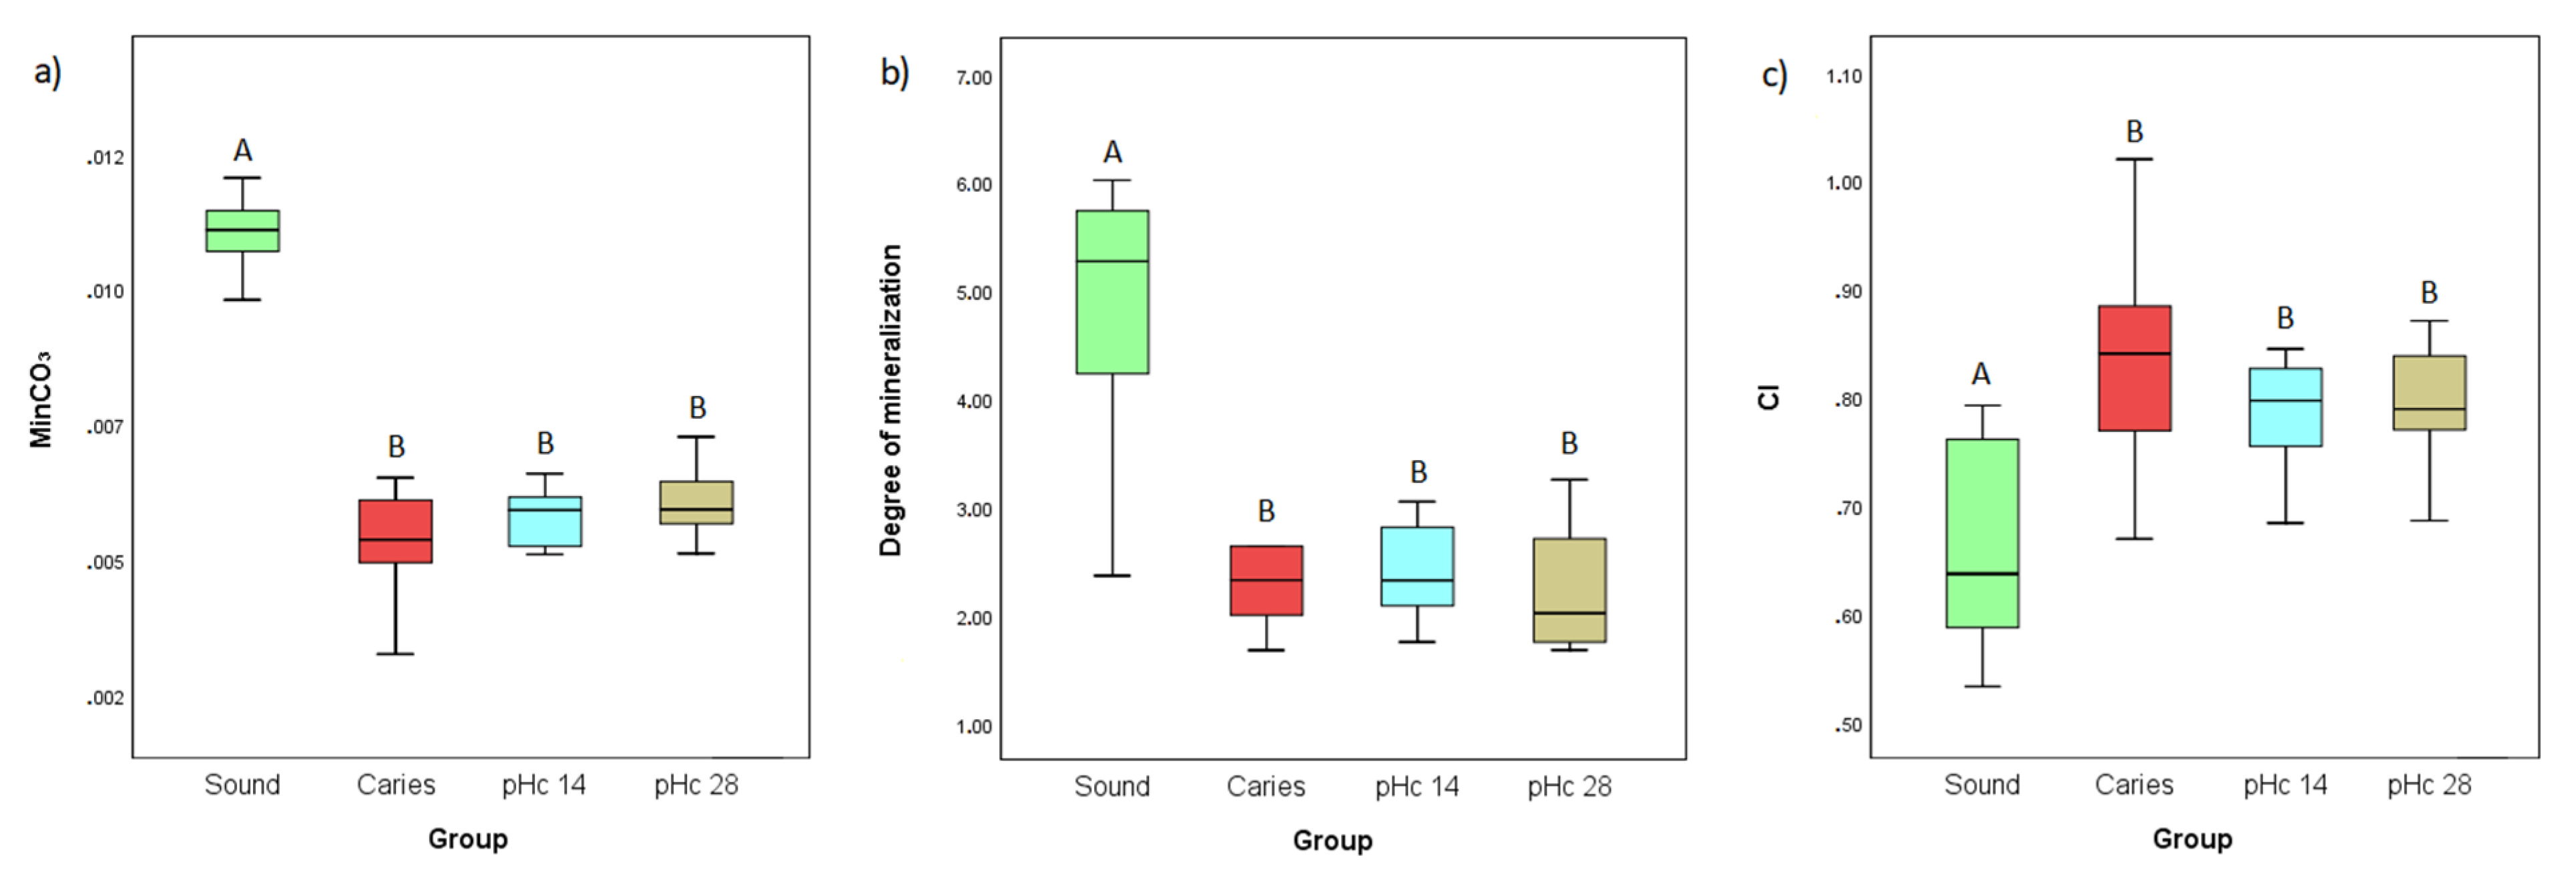
Figure 1 shows the peak profiles and assignments within the carbonate absorption band (v2 CO32−; 855–890 cm−1) in sound dentine, natural caries, and pHc groups. A stretching and a slight increase in the relative amplitude of the peak profiles at 866 cm−1 (unstable-labile carbonate) and 878 cm−1 (type A carbonate—OH substitution) is observed in natural caries and pHc groups compared with sound dentine. Table 1 presents the relative area values and statistical differences for the peaks measured in the v2 CO32− carbonate band. For P1_CO3_a866 cm−1 (unstable-labile carbonate) and P2_CO3_a871 cm−1 (type B carbonated—PO43−) substitution, a decrease in values is observed for the natural caries group and pHc groups compared to the sound dentine group, although for the latter it does not reach statistically significant values. On the other hand, P3_CO3_a878 cm−1 shows significant differences, presenting higher values in caries, pHc 14, and pHc 28 groups compared to sound dentine.
Figure 2 shows the peak profiles and assignments within the phosphate absorption band (v1, v3 PO43−; 890–1150 cm−1) in sound, caries, and pHc groups. Several changes are observed in natural caries and pHc groups with respect to sound dentine, such as a relative decrease in the amplitude of the peaks in the region from 940 cm−1 to 1005 cm−1, and an increase in the amplitude of the peaks from 1020 cm−1 to 1109 cm−1. Statistical results and differences of the relative areas for the measured peaks within the phosphate band are displayed in Table 1. From peaks P1 to P4 (PO4_a940 cm−1 to PO4_a1005 cm−1) there is a significant decrease in the values of the relative area for caries, pHc 14, and pHc 28 groups with respect to sound dentine. Conversely, there is an increase in the values from P5 to P12 (PO4_a1020 cm−1 to PO4_a1109 cm−1) in the same correspondence between groups. These differences between natural caries and the pHc groups (14 and 28 days) compared to sound dentine are statistically significant, except for the P4_PO4_a1005 cm−1. On the other hand, there are no significant differences when comparing natural caries with the pHc groups, as well as comparing the pHc groups with each other (14 and 28 days).
Regarding the ATR-FTIR variables represented in Figure 3, the values of the carbonate to phosphate in mineral (Figure 3a: MinCO3) and the degree of mineralisation (Figure 3b) show a decrease in caries and pHc groups with respect to the sound dentine group. Conversely, the Crystallinity Index (Figure 3c: CI) displays higher values compared to the previous relationship (i.e., sound dentine vs. caries and pHc groups). On the other hand, for all parameters, statistical analyses reveal significant differences between sound dentine vs. natural caries and pHc groups. Furthermore, there are no differences for these variables between natural caries and the pHc groups, as well as between the pHc groups (14 vs. 28 days pHc groups).

3.2. Raman Analyses

Figure 4 shows the variables obtained from the Raman spectra analysis. The values of the carbonate-phosphate ratio (Figure 4a) show a decrease in the caries group, with statistically significant differences with respect to the negative control group (sound dentine). The phosphate to CH2 ratio (Figure 4b) indicates a decrease in both pHc groups (14 and 28 days) compared with the sound dentine and caries groups. The Crystallinity Index obtained by Raman spectroscopy (FWHM of the phosphate band ∼960 cm−1) shows higher values in the sound dentine compared with caries and pHc groups.

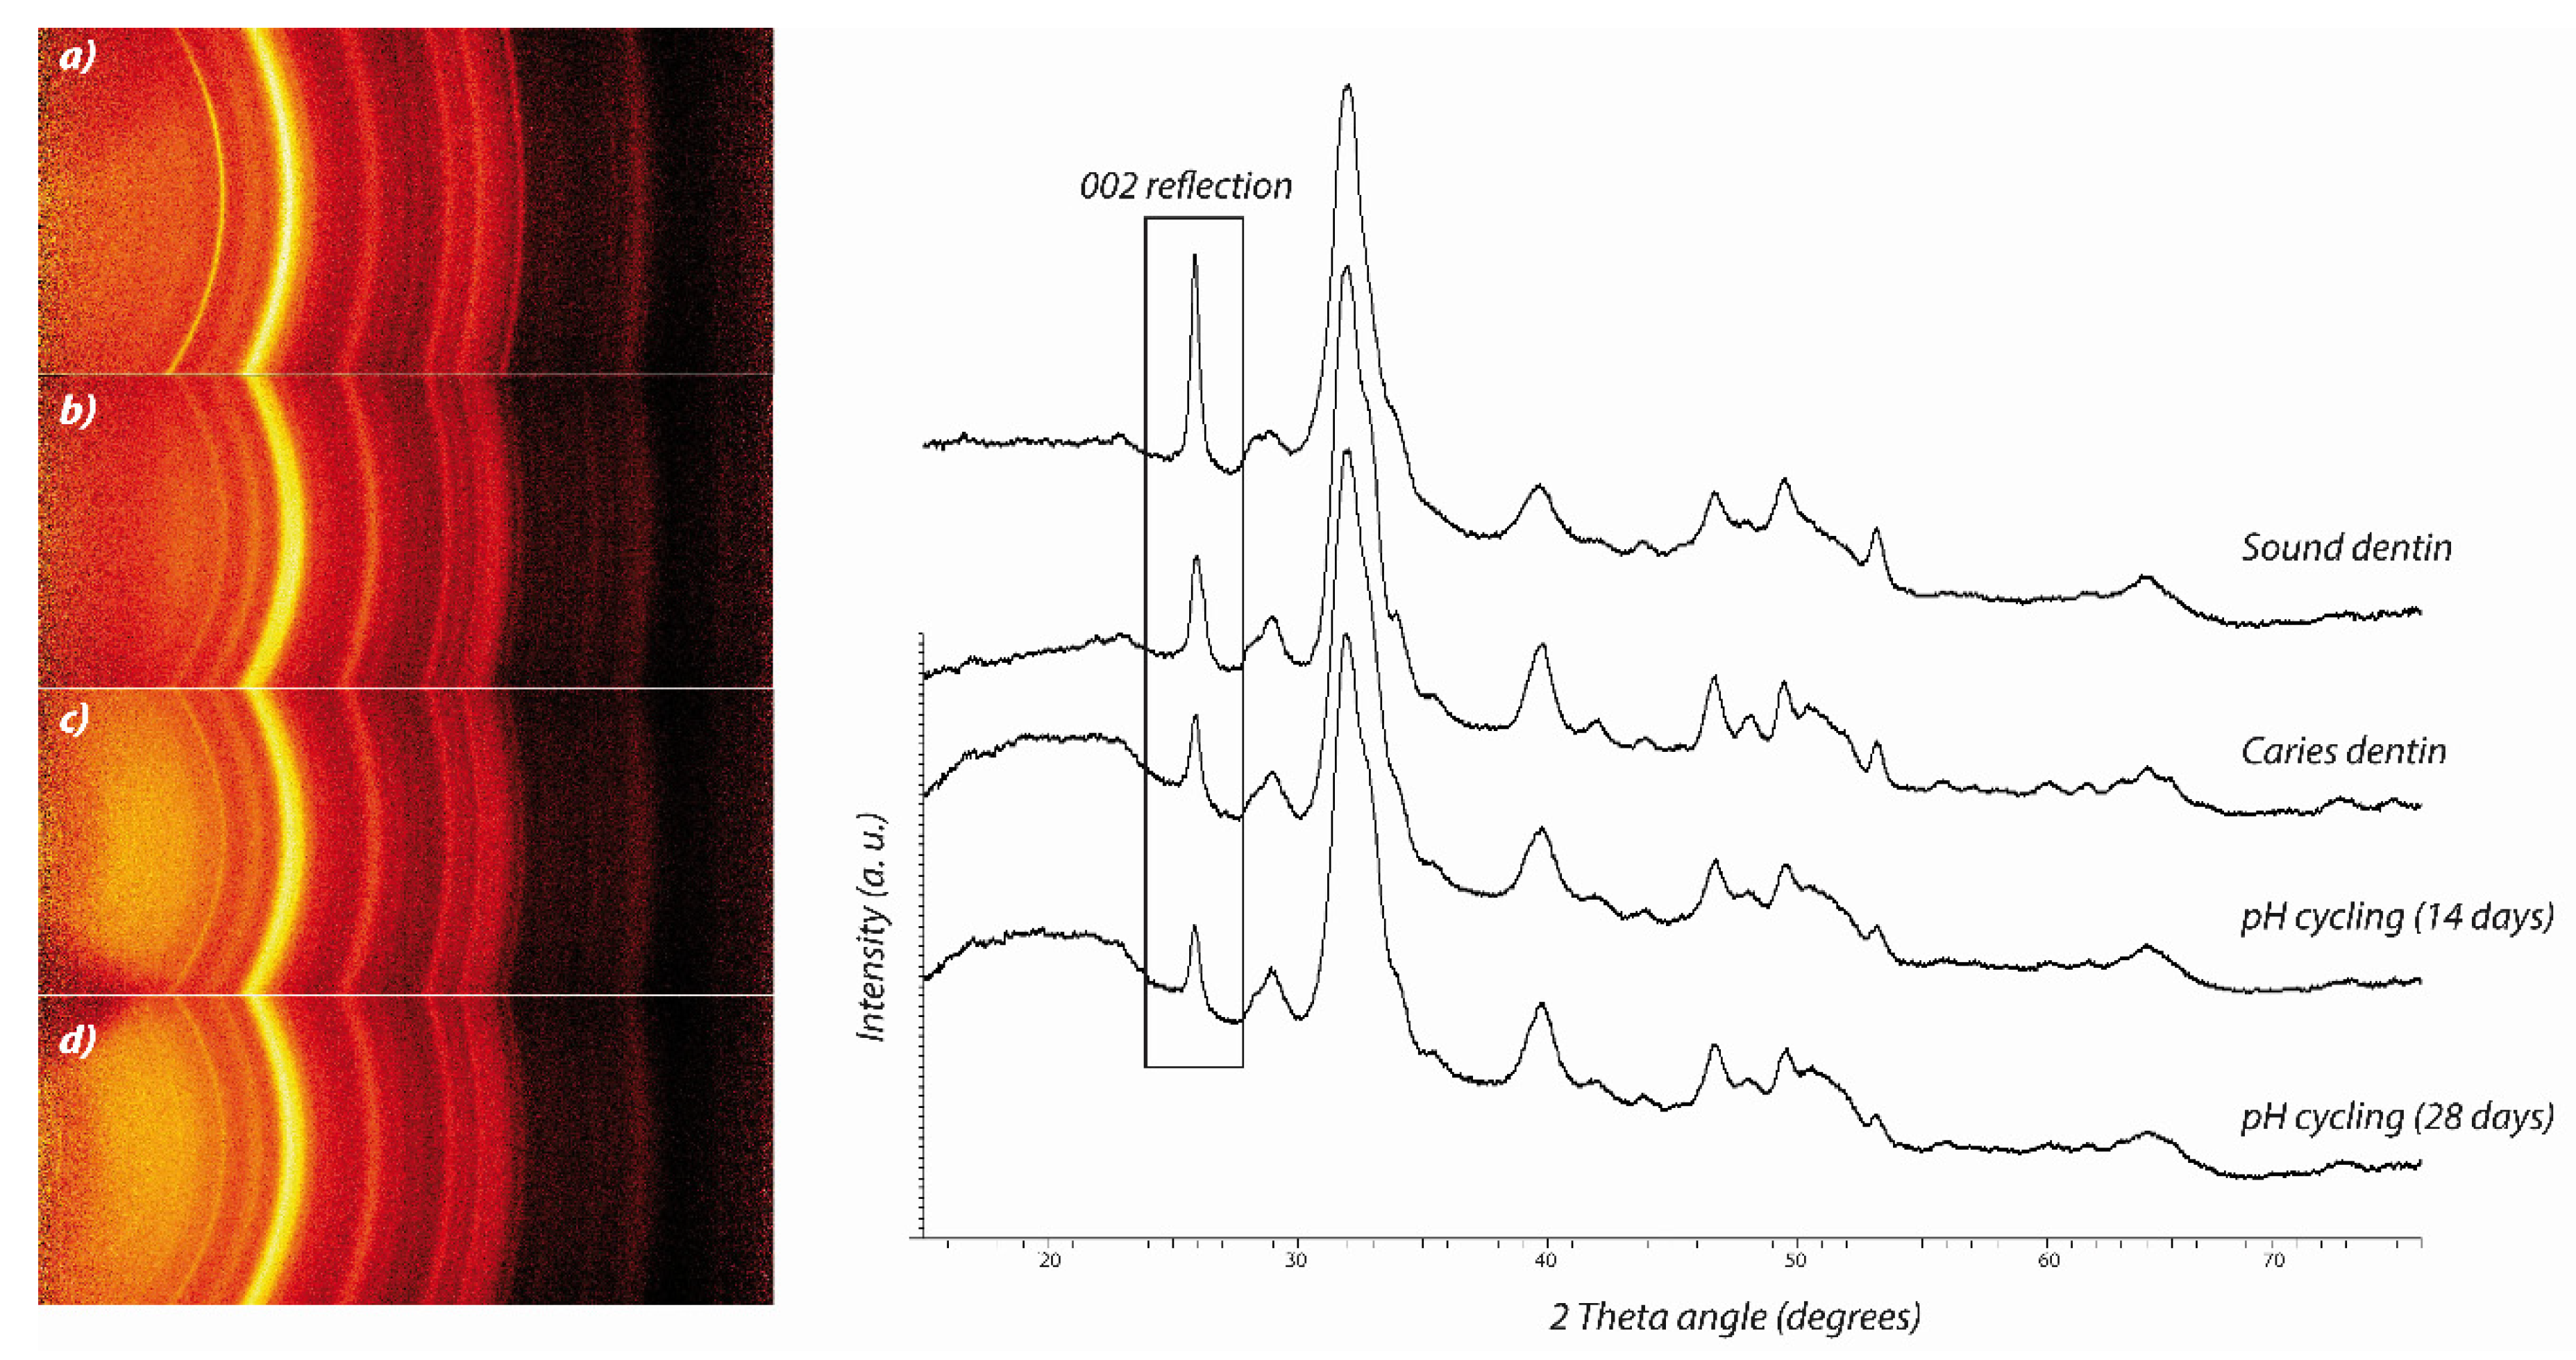
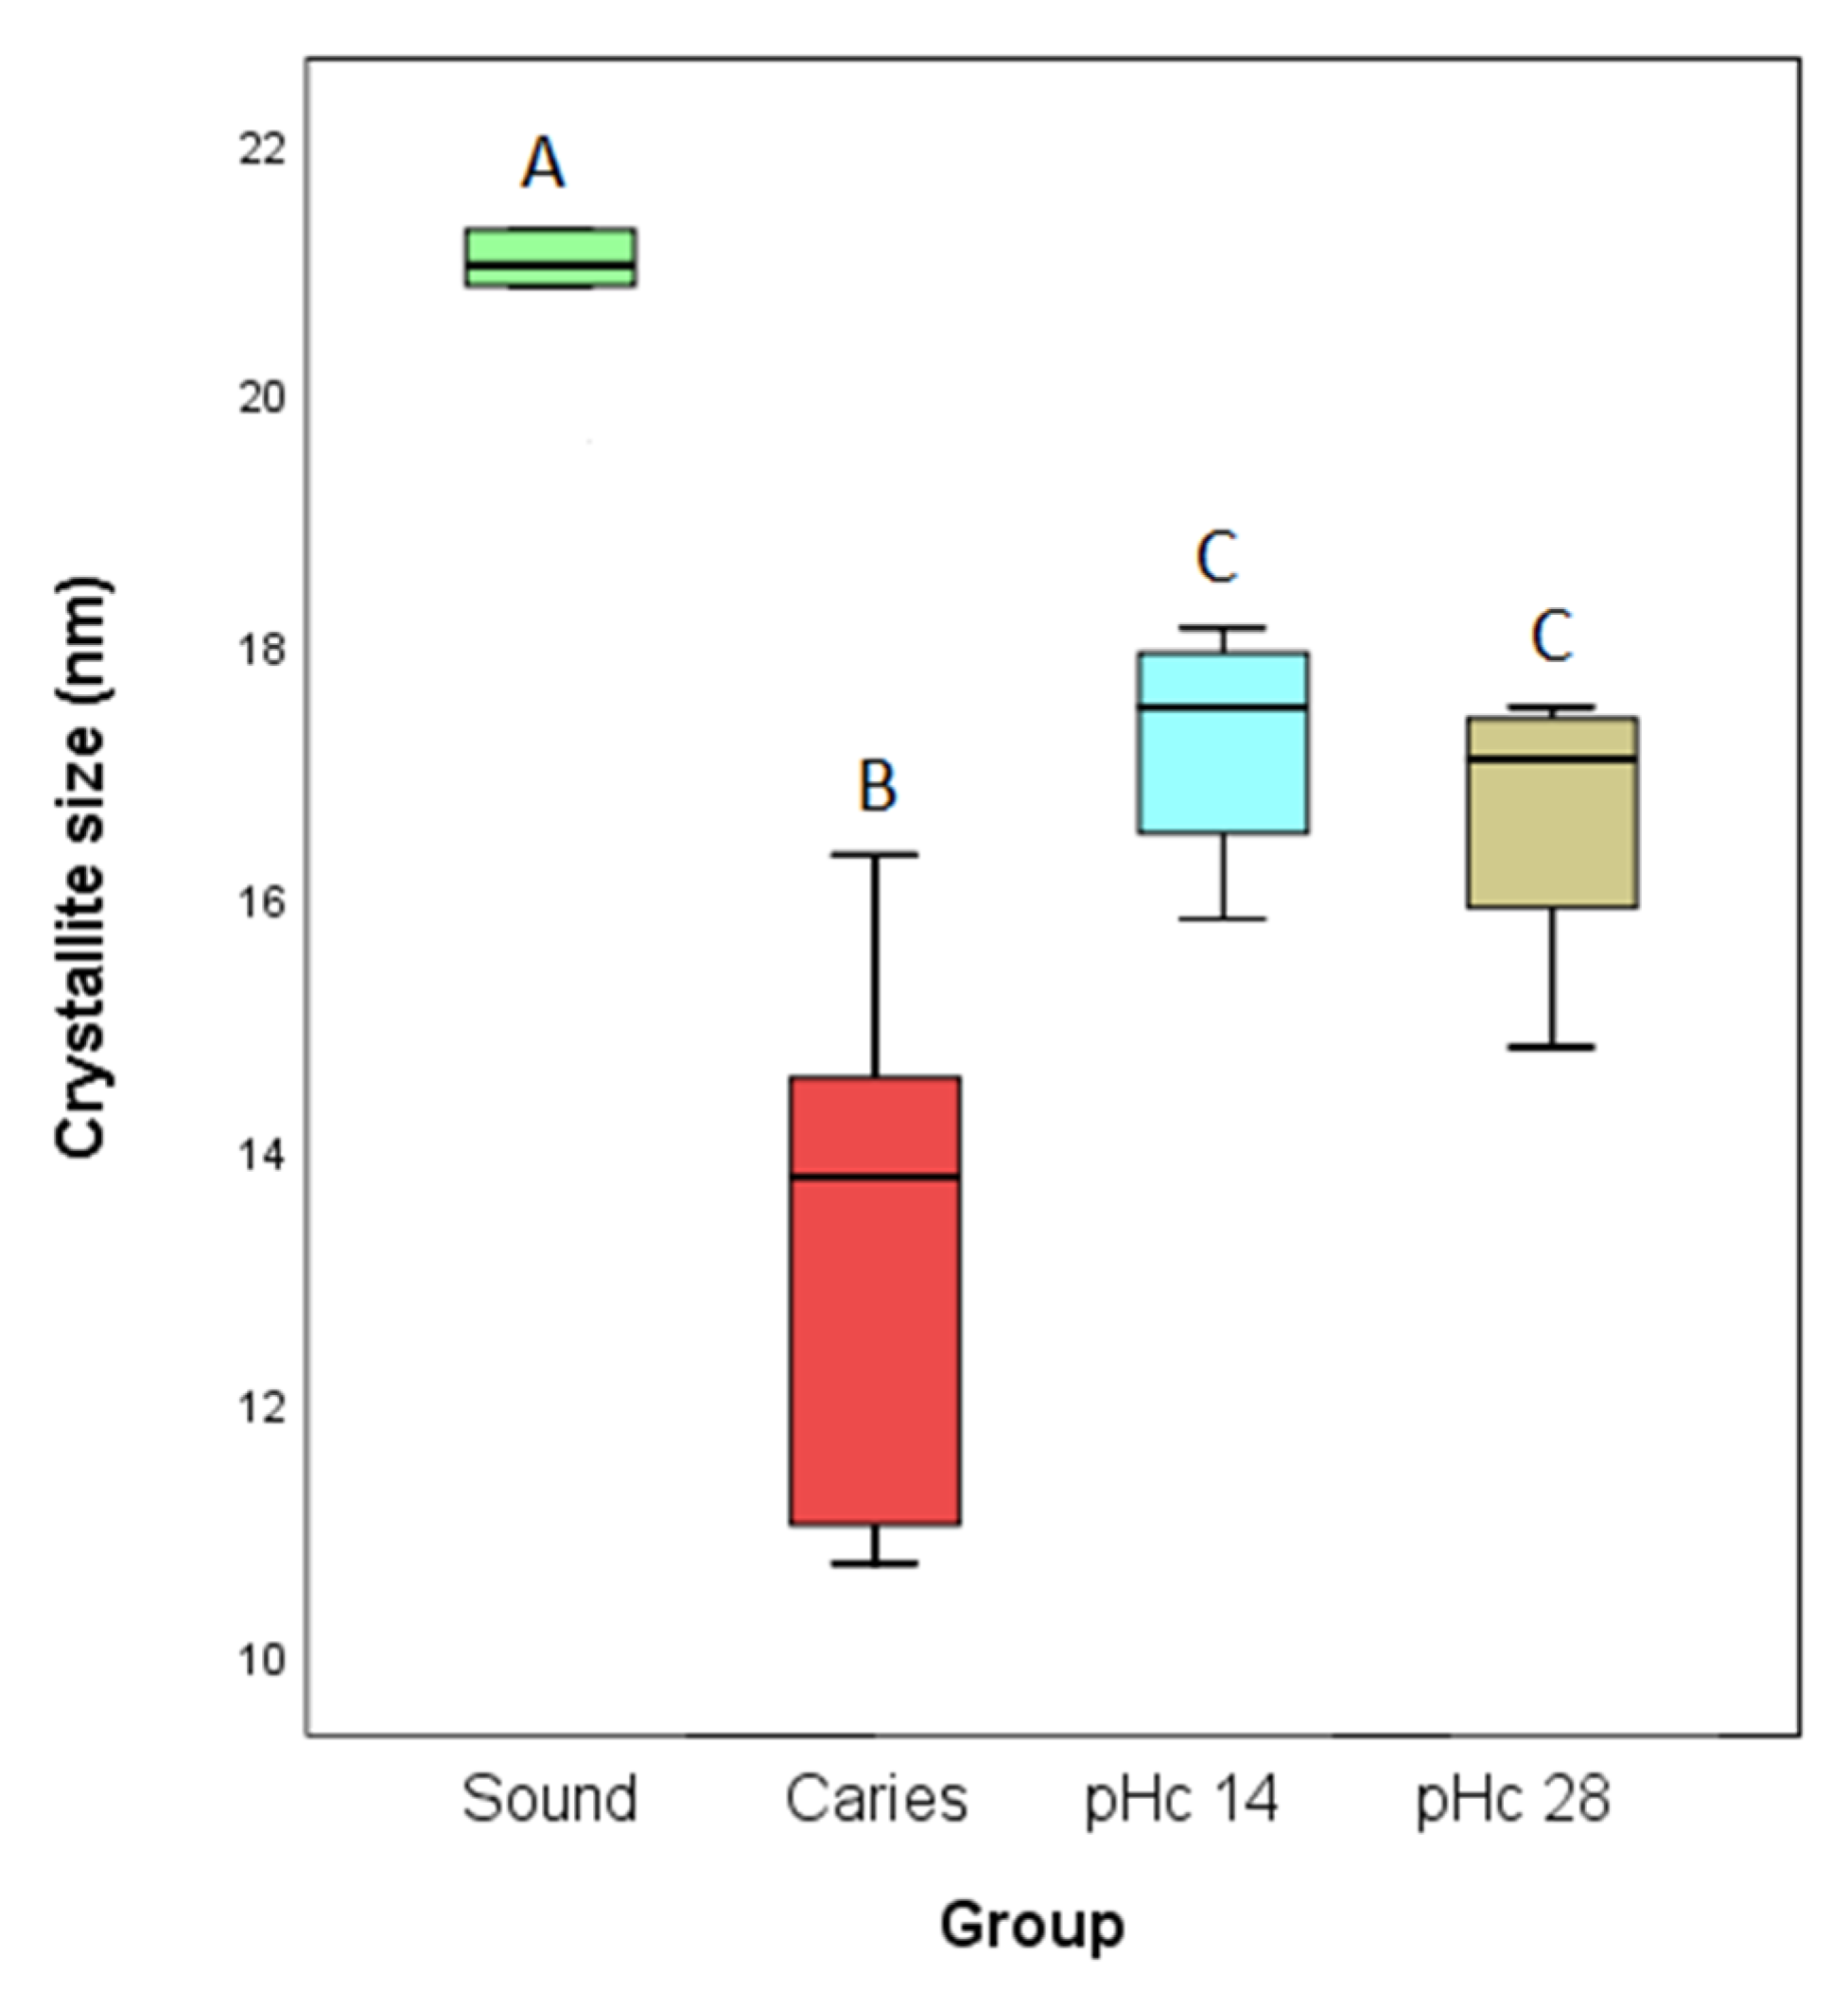
3.3. X-ray Diffraction Analyses

The crystalline properties of the mineral component in dentine were studied using bidimensional X-Ray diffraction patterns (2D-XRD). Figure 5 shows the 2D-XRD patterns and the integrated 2Theta (i.e., unidimensional scan) for the sound dentine, caries, and pH-cycling for 14 and 28 days. The XRD peak profiles, related to HAp crystal diffraction, observed in sound dentine were sharper than the samples subjected to pHc and caries groups. Crystallite size measurements (i.e., estimation of the size of the coherently scattering domains of crystals) for the mineral dentine are reported in Figure 6. The results indicate that the crystallite size for dentine HAp crystals in pHc groups decreases compared to sound dentine, with smaller crystalline values in carious dentine.

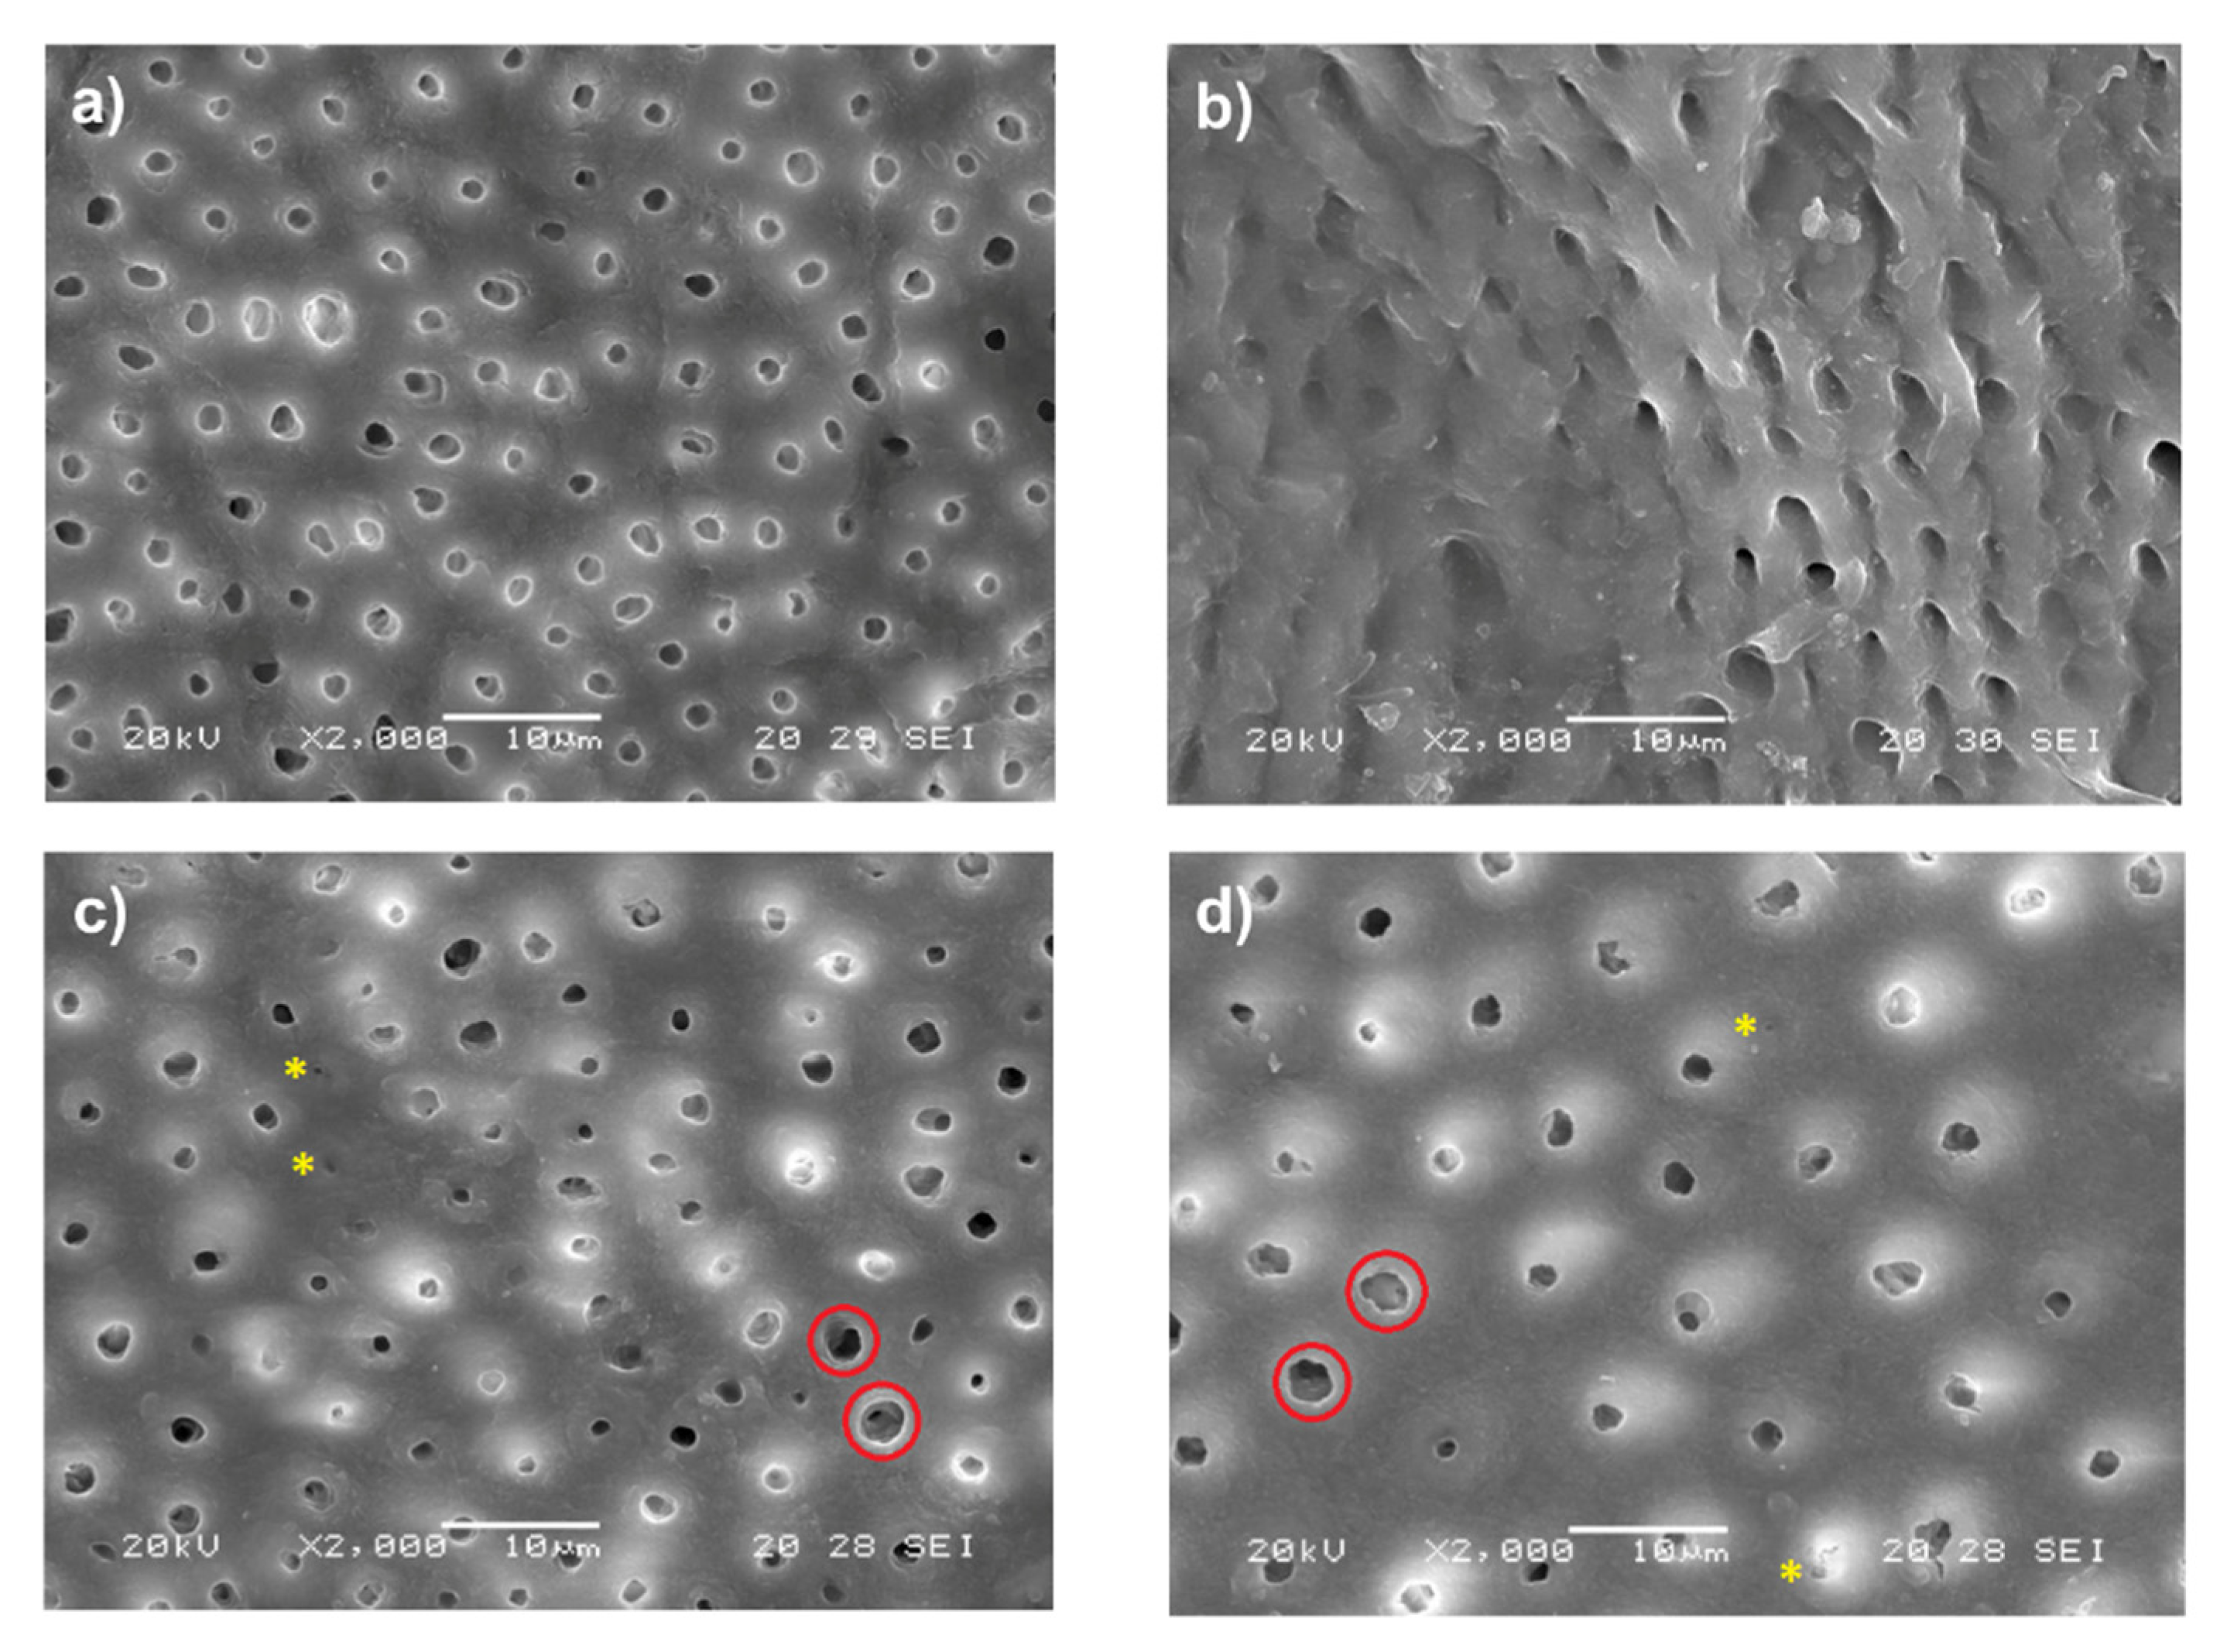
3.4. Scanning Electron Microscopy Analyses

Representative SEM images of the dentine surfaces of all experimental groups are shown in Figure 7. Morphological analyses indicate a smooth and regular surface in sound dentine, pHc 14, and pHc 28 groups. Dentine demineralised using pHc procedures (14 and 28 days) presents occlusion and extensive opening of some dentinal tubules. On the other hand, natural caries SEM images show an irregular and rough surface with open dentinal tubules and collapsed collagen areas. Furthermore, EDS reveals lower values of Ca and P wt% for natural caries and both pHc groups with respect to sound dentine (Table 2).

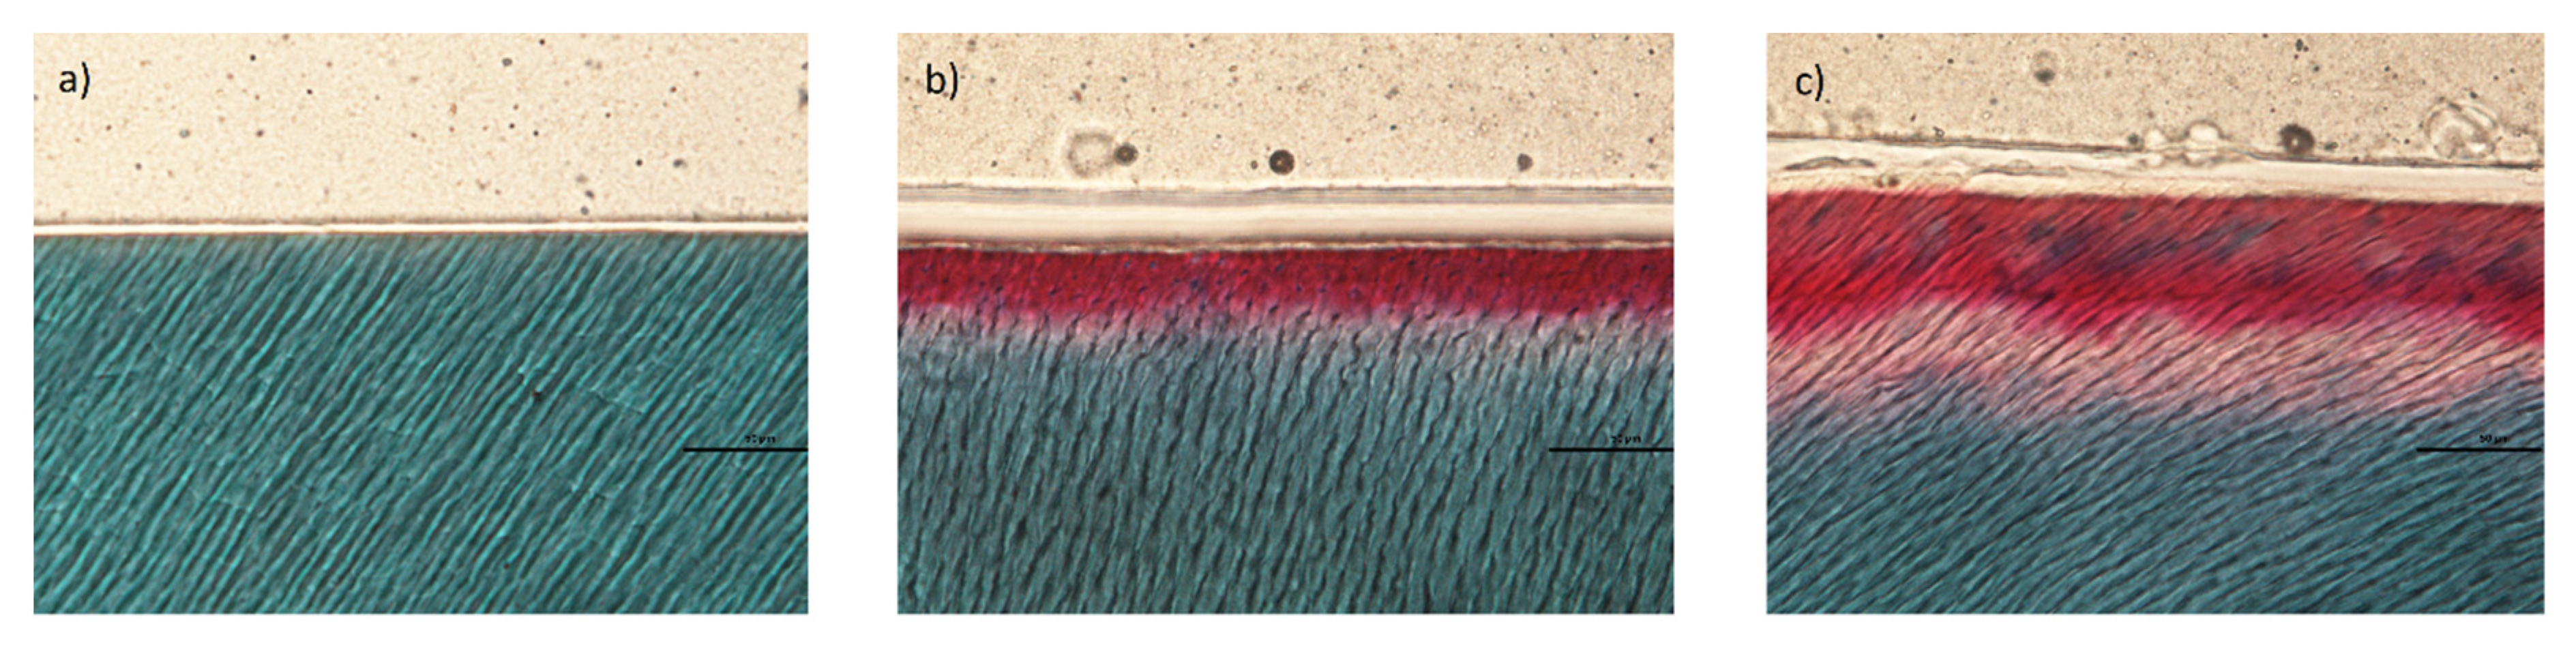
3.5. Masson’s Trichrome

Depth of dentine demineralisation by pHc in 14 and 28 days was evaluated by MT staining protocol. This technique allows the identification of mineralised collagen type I by staining intact collagen green and demineralised collagen red colours (Figure 8). The depth of the demineralisation (red band) showed a wider depth in pHc 28 (mean ± SD: 86.71 ± 10.9 µm) compared with pHc 14 group (mean ± SD: 42.07 ± 3.74 µm).

4. Discussion

Dental caries is a natural in vivo demineralisation process controlled by bacterial metabolic activity. The in vitro simulation of a carious lesion by means of a standardised procedure provides results of great interest for dental investigation. In this research, we evaluated a pHc method at different experimental times (i.e., 14 and 28 days) for the induction of natural residual caries. The comprehensive analysis of pHc treated dentine revealed mineral alterations at the compositional, microstructural, and morphological levels that resemble to some extent the characteristics of natural caries. These characteristics are also critical in the performance of minimal intervention clinical treatments, where residual caries (soft or firm/leather) is are left at the bottom of the caries cavity for avoiding pulpal exposure and postoperative symptoms [8,15]. Furthermore, pHc, as natural caries, affect the mechanical properties of teeth [46,47], the behaviour of adhesive systems [48,49], and the response of many other dental treatments. Therefore, it is important to identify the morphological and histological similarities by pHc procedure in relation to the depth of the carious dentine for the effective application of materials in dental restoration.
Several methods have been developed to simulate the caries process under controlled conditions such as acidified gel-solutions, microbiological models, and pHc procedures, with several limitations like the incomplete simulation of intraoral conditions, the complexity in formulating the composition and volume of saliva, the impossibility of mimicking solid surface area/solutions ratios, etc. [50,51]. However, the pHc procedure, by simulating de-remineralisation cycles, is generally accepted and employed in dental research due to the technically simple method and reproducible results [51]. The demineralisation cycles correspond to the period in which teeth are exposed to bacterial acids, while the remineralisation cycles correspond to the remineralising action of saliva between the acidic exposures [52]. Several variations in the pHc procedure have been applied that influence the resulting lesions, such as immersion/exposure times, temperature, solution agitation, pH, and duration (days). It has been demonstrated that the amount of mineral dissolution changes as a function of pH and immersion time [53,54]. Additionally, a few studies [55,56] have explored pHc effects in times beyond 14 days, established by Marquezan et al. [18], for residual caries induction, without further comparison with the chemical and structural characteristics of natural caries. Thereby, the extension of the pHc time of 8 h demineralisation/16 h remineralisation (i.e., 28 days as proposed in the present study) should also induce surface and subsurface changes, similar to the natural caries process, which are also critical in the dentine response to clinical treatments.
Infrared (IR) and Raman spectroscopies have been widely applied to analyse the chemical functional groups in teeth structures [57]. In the current research, ATR-FTIR and Raman spectrometric analysis showed differences in the molecular groups related to the organic and inorganic components of the pHc-treated and caries dentine samples with respect to the control group (i.e., sound dentine). Regarding ATR-FITR analyses, these results showed a decrease in the degree of mineralisation and MinCO3, as well as an increase in the crystallinity in natural caries and in both pHc groups compared to sound dentine. The reduction in the degree of mineralisation may be explained by the dissolution of HAp through the acids of the demineralisation process, caused by bacterial metabolism in the case of natural caries and the chemical action of solutions in the pHc procedure, which produces H+ ions and yields HPO42 ions as end products of this dissolution mechanism [10]. Furthermore, Marin et al. indicate that demineralised dentine under acidic solutions does not exhibit changes in the organic component (i.e., absorption bands related to amide groups) [53]. These results are similar to a previous study that employed ATR-FTIR to compare the chemical composition of human and bovine dentine submitted to pHc for 3, 7, and 14 days [54]. In addition, it should also be considered that in natural caries there is a breakdown of the dentine organic matrix due to the activity of metalloproteinases [58,59]. Thus, the low values of the degree of mineralisation for residual natural caries observed by ATR-FTIR may be the result of the combined effect of the degradation of exposed collagen and mineral loss. Raman analyses also presented a similar relationship in the degree of mineralisation for both pHc groups, considering the variable phosphate to CH2 absorption bands (i.e., mineral/matrix). However, the sound and carious dentine showed no differences for the previous variable, which may be due to the excessive heat produced by Raman laser in the organic matrix of the natural caries samples [60]. The carbonate/phosphate mineral substitution results showed how the incorporation of these molecular groups lead to a distortion of the crystalline structure causing a decrease in apatite crystallinity (in Raman analyses) as a result of the decrease of non-stoichiometric apatites containing HPO42, CO32, and vacancies at the structural level [37]. Additionally, our results indicated an inverse relationship between the crystallinity indexes (CI variables) obtained by ATR-FTIR and Raman spectroscopies. On the one hand, an increase in the 1030/1020 ratios (obtained by ATR-FTIR analyses), as observed for natural caries and pHc groups, has been related to a higher mineral maturity, i.e., a higher proportion of apatitic compared to the non-apatitic domains in the mineral composition [61]. This specific distribution in the phosphate groups in different crystalline environments is confirmed from the differential dissolution of the various crystalline vibrational modes obtained from the detailed ATR-FTIR analysis (see below for further description). On the other hand, the differences observed in the CI obtained from Raman spectroscopy relate specifically to the crystallinity associated with the structural organisation of the apatite lattice [62]. This relationship coincides with the crystallite size parameters determined from XRD measurements.
Detailed ATR-FTIR analysis of the integrated areas of carbonate (v2 CO32) and phosphate (v1, v3 PO43) absorption bands allowed us to determine the selective dissolution of the mineral components in natural caries and the groups exposed to pHc. In the carbonate band (800–890 cm−1), a higher dissolution of unstable carbonate groups was observed in favour of a higher relative concentration of type A carbonate for caries and pHc groups. This preferential dissolution of the labile carbonate species (866 cm−1) is related to the readily soluble domains of the apatite crystals with respect to the type A and B structural positions [63]. The most pronounced absorption band of the phosphate groups (900–1200 cm−1) in the FTIR spectra allowed us to analyse the distribution of different crystalline phosphate environments during dissolution. It should be emphasised that the mineral phases associated with mineralised tissues (i.e., bone and teeth) have many of the characteristics of poorly crystalline apatite [64]. In the current research, the differential dissolution of the phosphate vibrational modes may be due to the arrangement of labile or poorly organised molecular positions in the crystal structure, being similar between the carious dentine, and pHc groups. Moreover, the preferential dissolution of the more soluble fractions of apatite and the resulting metastability can lead to the formation of other calcium phosphate phases with different solubility rates. The solubility of non-stoichiometric biological apatites is complicated by the uncertainty of their composition and structure lattice defects [65] controlling the dissolution rate of phosphates from different crystalline environments.
The analysis of 2D-XRD pattern samples provides detailed information on the mineral crystallinity related to crystallite size (i.e., crystalline domains) of the apatite crystals in the dentine structure. Note that the calculated 2Theta patterns (integrated with unidimensional XRD scans) show highly anisotropic peak broadening (FWHM) as bio-apatite crystals are elongated along the c-axis (i.e., 002 reflections). The obtained results indicate a greater decrease in crystallite size in the carious group compared to sound dentine, with a smaller reduction in the pHc groups. Apatite solubility and dissolution behaviour will be closely related to sub-structural parameters, as crystallite size and lattice imperfections largely determine crystal chemistry [66,67]. Previous studies indicated that the less crystalline mineral fraction is preferentially removed in cortical bone minerals during acid-induced demineralisation [68]. In addition, these surface crystallinity variations have been previously proposed as a rough estimation of the reaction front advancement by demineralisation-induced variations [66]. It should also be noted that the effect of increased sub-partial demineralisation on the dentine surface resulted in an increasing area of surface crystal exposed to demineralisation, allowing the altered extension to progress in depth. During this mineral dissolution, the collagen structure may serve as a scaffold for mineral growth, favouring the precipitation of calcium phosphate phases which is essential for the remineralisation of demineralised dentine in clinical treatments.
At the morphological level, SEM images of the dentine surface show significant differences between the carious dentine and the pHc treated groups. Natural caries present characteristics, such as the yielding of an irregular surface and the collapse of collagen zones, that the pHc chemical model is not capable of simulating. For this purpose, other in vitro studies have employed collagenases in the remineralising solution [69] or performed a microbiological model in which bacteria produce collagenases [18] with the aim to affect the organic matrix. In our research, the pHc groups show a larger opening of the dentine tubules compared with the sound dentine due to the effect of demineralisation, agreeing with other studies that performed similar artificial methods to simulate dentine caries [18,70]. Along with this higher aperture of the dentinal tubules, the pHc solutions may diffuse more easily, allowing a greater advance in the depth of the mineral dissolution front with pHc time. In addition, occluded tubules are also observed on the dentine surface of the pHc groups, although to a lesser extent, due to the deposition of crystals inside the dentine tubules [17,71]. The results obtained by EDS are similar to other investigations in which the relative Ca and P values were lower in the pHc demineralised dentine relative to the sound dentine [72,73]. The study of the inorganic/organic component relation at the subsurface level may provide more insight into the alteration depth during the pHc treatments.
The Masson’s trichrome (MT) images allow us to study the depth of the demineralisation front with pHc time. The MT results showed a cross-section of the dentine structure in which a greater thickness of the demineralised surface (i.e., the red band in the staining with exposed collagen) in the pHc 28-day cycle compared with the pHc 14-day cycle. The lack of consistency of the carious dentine samples did not allow the MT tests to be performed on these samples, although the progression of this alteration would depend directly on the time of development of this natural demineralisation process [74]. These results demonstrate how a controlled procedure of artificial lesion creation can lead to subsurface mineral loss and also allow the prediction of the chemical and structural characteristics of the induced lesions. The maintenance of the collagen structure by the pHc protocol can contribute to subsequent in vitro dental procedures (i.e., adhesion behaviour and remineralisation substances) which are not possible with demineralisation occurring in natural caries.

5. Conclusions

Dental caries is a pathological demineralisation process that affects the mineralised dental structures. This mineral dissolution process also occurs in other biological tissues during various physiological processes (i.e., bone remodelling). The development of a controlled in vitro dentine demineralisation procedure, in our case by the pHc method, provides insight into the chemical and structural alterations that may occur during residual natural caries formation. The knowledge acquired in this study can help to better understand the mechanisms determining the rate-control of dissolution and subsurface demineralisation process in carious dentine. The performance of the pHc protocol at different experimental times could be useful as a tool for simulating the advance of the in vivo demineralisation process caused by the metabolism of bacterial biofilm.
Based on the similarities between natural residual caries and artificial caries performed by pHc method at different times, such standardised substrate can be employed as a suitable starting material for multiple dental investigations. This procedure will allow the development of minimally invasive strategies, which involve more conservative caries removal techniques, as well as the design and application of remineralisation products and other restoration materials.

Author Contributions

Conceptualization, J.S.Z.-M., M.V.B.-C. and P.Á.-L.; methodology, J.S.Z.-M., M.V.B.-C. and C.C.C.-J.; software, J.S.Z.-M. and P.Á.-L.; formal analysis, J.S.Z.-M., M.V.B.-C. and P.Á.-L.; investigation, J.S.Z.-M., M.V.B.-C., C.C.C.-J. and P.Á.-L.; resources, M.V.B.-C. and P.Á.-L.; data curation, J.S.Z.-M. and P.Á.-L.; writing-original draft preparation, J.S.Z.-M.; writing-review and editing, M.V.B.-C. and P.Á.-L.; visualization, M.V.B.-C. and P.Á.-L.; supervision, P.Á.-L.; project administration, M.V.B.-C. and P.Á.-L.; funding acquisition M.V.B.-C. and P.Á.-L. All authors have read and agreed to the published version of the manuscript.

Funding

This research was funded by PID2020-116660GB-I00 by the Ministry of Economy and Competitiveness (MINECO) of the Spanish Government and the European Regional Development Fund (ERDF)-NextGeneration-EU program.

Institutional Review Board Statement

The study was conducted according to the guidelines of the Declaration of Helsinki and approved by the Institutional Review Board (or Ethics Committee) of the University of Granada (protocol code: 942/CEIH/2019).

Informed Consent Statement

Not applicable.

Data Availability Statement

Data available on request from the corresponding author.

Acknowledgments

We acknowledge CIC (University of Granada) and SCT (University of Oviedo) and the staff for their technical support and assistance.

Conflicts of Interest

The authors declare no conflict of interest.

References

  1. Nelson, S.J. Introduction to Dental Anatomy. In Wheeler’s Dental Anatomy, Physiology, and Occlusion; Elsevier, Saunders: St. Louis, MO, USA, 2015; pp. 1–19. [Google Scholar]
  2. De La Dure-Molla, M.; Fournier, B.P.; Manzanares, M.C.; Acevedo, A.C.; Hennekam, R.C.; Friedlander, L.; Boy-Lefèvre, M.-L.; Kerner, S.; Toupenay, S.; Garrec, P.; et al. Elements of morphology: Standard terminology for the teeth and classifying genetic dental disorders. Am. J. Med. Genet. Part A 2019, 179, 1913–1981. [Google Scholar] [CrossRef] [Green Version]
  3. Curzon, M.E.J.; Featherstone, J.D.B. Chemical composition of enamel. In CRC Handbook of Experimental Aspects of Oral Biochemistry; Lazari, E., Levy, B., Eds.; CRC Press: Boca Raton, FL, USA, 1983; pp. 123–134. [Google Scholar]
  4. Carlson, S.J. Vertebrate dental structures. In Skeletal Biomineralization: Patterns, Processes and Evolutionary Trends; Carter, J.G., Ed.; Van Nostrand: New York, NY, USA, 1990; Volume 1, pp. 531–556. [Google Scholar]
  5. LeGeros, R.Z.; LeGeros, J.P. Phosphate minerals in human tissues. In Phosphate Minerals; Nriagu, J.O., Moore, P.B., Eds.; Springer: Berlin/Heidelberg, Germany, 1984; pp. 351–385. [Google Scholar]
  6. Nanci, A. Structure of the oral tissues. In Ten Cate’s Oral Histology: Development, Structure and Function; Nanci, A., Ed.; Elsevier: St. Louis, MO, USA, 2018; pp. 18–45. [Google Scholar]
  7. Selwitz, R.H.; Ismail, A.I.; Pitts, N.B. Dental caries. Lancet 2007, 369, 51–59. [Google Scholar] [CrossRef]
  8. Machiulskiene, V.; Campus, G.; Carvalho, J.C.; Dige, I.; Ekstrand, K.R.; Jablonski-Momeni, A.; Maltz, M.; Manton, D.J.; Martignon, S.; Martinez-Mier, E.A.; et al. Terminology of dental caries and dental caries management: Consensus report of a workshop organized by ORCA and cariology research group of IADR. Caries Res. 2020, 54, 7–14. [Google Scholar] [CrossRef] [PubMed]
  9. Pitts, N.B.; Zero, D.T.; Marsh, P.D.; Ekstrand, K.; Weintraub, J.A.; Ramos-Gomez, F.; Tagami, J.; Twetman, S.; Tsakos, G.; Ismail, A. Dental caries. Nat. Rev. Dis. Primers 2017, 3, 17030. [Google Scholar] [CrossRef] [Green Version]
  10. Skucha-Nowak, M.; Gibas, M.; Tanasiewicz, M.; Twardawa, H.; Szklarski, T. Natural and controlled demineralization for study purposes in minimally invasive dentistry. Adv. Clin. Exp. Med. 2015, 24, 891–898. [Google Scholar] [CrossRef] [PubMed] [Green Version]
  11. Zheng, L.; Hilton, J.F.; Habelitz, S.; Marshall, S.J.; Marshall, G.W. Dentin caries activity status related to hardness and elasticity. Eur. J. Oral Sci. 2003, 111, 243–252. [Google Scholar] [CrossRef] [PubMed]
  12. Lenzi, T.L.; Soares, F.Z.; Tedesco, T.K.; de Oliveira Rocha, R. Is it possible to induce artificial caries-affected dentin using the same protocol to primary and permanent teeth? J. Contemp. Dent. Pract. 2015, 16, 638–642. [Google Scholar] [CrossRef]
  13. Scholtanus, J.D.; Purwanta, K.; Dogan, N.; Kleverlaan, C.J.; Feilzer, A.J. Microtensile bond strength of three simplified adhesive systems to caries-affected dentin. J. Adhes. Dent. 2010, 12, 273–278. [Google Scholar] [CrossRef]
  14. Shibata, S.; Vieira, L.C.C.; Baratieri, L.N.; Fu, J.; Hoshika, S.; Matsuda, Y.; Sano, H. Evaluation of microtensile bond strength of self-etching adhesives on normal and caries-affected dentin. Dent. Mater. J. 2016, 35, 166–173. [Google Scholar] [CrossRef] [PubMed] [Green Version]
  15. Schwendicke, F.; Dörfer, C.E.; Paris, S. Incomplete caries removal: A systematic review and meta-analysis. J. Dent. Res. 2013, 92, 306–314. [Google Scholar] [CrossRef]
  16. Ehrlich, H.; Koutsoukos, P.G.; Demadis, K.D.; Pokrovsky, O.S. Principles of demineralization: Modern strategies for the isolation of organic frameworks. Part I. Common definitions and history. Micron 2008, 39, 1062–1091. [Google Scholar] [CrossRef] [PubMed]
  17. Erhardt, M.C.G.; Rodrigues, J.A.; Valentino, T.A.; Ritter, A.V.; Pimenta, L.A.F. In vitro μTBS of one-bottle adhesive systems: Sound versus artificially-created caries-affected dentin. J. Biomed. Mater. Res.-Part B Appl. Biomater. 2008, 86, 181–187. [Google Scholar] [CrossRef]
  18. Marquezan, M.; Corrêa, F.N.P.; Sanabe, M.E.; Rodrigues Filho, L.E.; Hebling, J.; Guedes-Pinto, A.C.; Mendes, F.M. Artificial methods of dentine caries induction: A hardness and morphological comparative study. Arch. Oral Biol. 2009, 54, 1111–1117. [Google Scholar] [CrossRef]
  19. Schwendicke, F.; Eggers, K.; Meyer-Lueckel, H.; Dörfer, C.; Kovalev, A.; Gorb, S.; Paris, S. In vitro induction of residual caries lesions in dentin: Comparative mineral loss and nano-hardness analysis. Caries Res. 2015, 49, 259–265. [Google Scholar] [CrossRef]
  20. Ramakrishnaiah, R.; Ur Rehman, G.U.; Basavarajappa, S.; Al Khuraif, A.A.; Durgesh, B.H.; Khan, A.S.; Ur Rehman, I. Applications of Raman spectroscopy in dentistry: Analysis of tooth structure. Appl. Spectrosc. Rev. 2015, 50, 332–350. [Google Scholar] [CrossRef]
  21. Wang, R.; Wang, Y. Fourier transform infrared spectroscopy in oral cancer diagnosis. Int. J. Mol. Sci. 2021, 22, 1206. [Google Scholar] [CrossRef] [PubMed]
  22. Zhang, J.; Boyes, V.; Festy, F.; Lynch, R.J.M.; Watson, T.F.; Banerjee, A. In-vitro subsurface remineralisation of artificial enamel white spot lesions pre-treated with chitosan. Dent. Mater. 2018, 34, 1154–1167. [Google Scholar] [CrossRef] [Green Version]
  23. Daood, U.; Swee Heng, C.; Neo Chiew Lian, J.; Fawzy, A.S. In vitro analysis of riboflavin-modified, experimental, two-step etch-and-rinse dentin adhesive: Fourier transform infrared spectroscopy and micro-Raman studies. Int. J. Oral Sci. 2015, 7, 110–124. [Google Scholar] [CrossRef]
  24. Guven, Y.; Tuna, E.B.; Dincol, M.E.; Aktoren, O. X-ray difrraction analysis of MTA-Plus, MTA-Angelus and DiaRoot BioAggregate. Eur. J. Dent. 2014, 8, 211–215. [Google Scholar] [PubMed]
  25. Zhao, I.S.; Mei, M.L.; Li, Q.L.; Lo, E.C.M.; Chu, C.H. Arresting simulated dentine caries with adjunctive application of silver nitrate solution and sodium fluoride varnish: An in vitro study. Int. Dent. J. 2017, 67, 206–214. [Google Scholar] [CrossRef] [Green Version]
  26. Barbosa-Martins, L.F.; de Sousa, J.P.; de Castilho, A.R.F.; Puppin-Rontani, J.; Davies, R.P.W.; Puppin-Rontani, R.M. Enhancing bond strength on demineralized dentin by pre-treatment with selective remineralising agents. J. Mech. Behav. Biomed. Mater. 2018, 81, 214–221. [Google Scholar] [CrossRef] [PubMed]
  27. Kawamura, R.; Mizutani, K.; Lin, T.; Kakizaki, S.; Mimata, A.; Watanabe, K.; Saito, N.; Meinzer, W.; Iwata, T.; Izumi, Y.; et al. Ex vivo evaluation of gingival ablation with various laser systems and electroscalpel. Photobiomodulation Photomed. Laser Surg. 2020, 38, 364–373. [Google Scholar] [CrossRef] [PubMed] [Green Version]
  28. Pabst, A.M.; Müller, W.E.G.; Ackermann, M. Three-dimensional scanning electron microscopy of maxillofacial biomaterials. Br. J. Oral Maxillofac. Surg. 2017, 55, 736–739. [Google Scholar] [CrossRef]
  29. Stape, T.H.S.; Tjäderhane, L.; Marques, M.R.; Aguiar, F.H.B.; Martins, L.R.M. Effect of dimethyl sulfoxide wet-bonding technique on hybrid layer quality and dentin bond strength. Dent. Mater. 2015, 31, 676–683. [Google Scholar] [CrossRef]
  30. Petersen, P.E.; Bourgeois, D.; Ogawa, H.; Estupinan-Day, S.; Ndiaye, C. The global burden of oral diseases and risks to oral health. Bull. World Health Organ. 2005, 83, 661–669. [Google Scholar]
  31. Ismail, A.I.; Sohn, W.; Tellez, M.; Amaya, A.; Sen, A.; Hasson, H.; Pitts, N.B. The International Caries Detection and Assessment System (ICDAS): An integrated system for measuring dental caries. Community Dent. Oral Epidemiol. 2007, 35, 170–178. [Google Scholar] [CrossRef] [Green Version]
  32. Braun, A.; Guiraud, L.M.J.C.; Frankenberger, R. Histological validation of ICDAS II and radiological assessment of occlusal carious lesions in permanent teeth. Odontology 2017, 105, 46–53. [Google Scholar] [CrossRef]
  33. Paschalis, E.P.; DiCarlo, E.; Betts, F.; Sherman, P.; Mendelsohn, R.; Boskey, A.L. FTIR microspectroscopic analysis of human osteonal bone. Calcif. Tissue Int. 1996, 59, 480–487. [Google Scholar] [CrossRef]
  34. Mata-Miranda, M.M.; Guerrero-Ruiz, M.; Gonzalez-Fuentes, J.R.; Hernandez-Toscano, C.M.; Garcia-Andino, J.R.; Sanchez-Brito, M.; Vazquez-Zapien, G.J. Characterization of the biological fingerprint and identification of associated parameters in stress fractures by FTIR spectroscopy. BioMed Res. Int. 2019, 2019, 1241452. [Google Scholar] [CrossRef] [Green Version]
  35. Imbert, L.; Gourion-Arsiquaud, S.; Villarreal-Ramirez, E.; Spevak, L.; Taleb, H.; van der Meulen, M.C.H.; Mendelsohn, R.; Boskey, A.L. Dynamic structure and composition of bone investigated by nanoscale infrared spectroscopy. PLoS ONE 2018, 13, e0202833. [Google Scholar] [CrossRef]
  36. Levallois, B.; Terrer, E.; Panayotov, Y.; Salehi, H.; Tassery, H.; Tramini, P.; Salehi, H.; Cuisinier, F. Molecular structural analysis of carious lesions using micro-Raman spectroscopy. Eur. J. Oral Sci. 2012, 120, 444–451. [Google Scholar] [CrossRef]
  37. Toledano, M.; Toledano-Osorio, M.; Guerado, E.; Caso, E.; Aguilera, F.S.; Osorio, R. Biochemical assessment of nanostructures in human trabecular bone: Proposal of a Raman microspectroscopy based measurements protocol. Injury 2018, 49, S11–S21. [Google Scholar] [CrossRef] [PubMed]
  38. Slimani, A.; Nouioua, F.; Desoutter, A.; Levallois, B.; Cuisinier, F.J.G.; Tassery, H.; Terrer, E.; Salehi, H. Confocal Raman mapping of collagen cross-link and crystallinity of human dentin–enamel junction. J. Biomed. Opt. 2017, 22, 086003. [Google Scholar] [CrossRef]
  39. Cullity, B.D.; Stock, S.R. Elements of X-ray Diffraction, 3rd ed.; Prentice-Hall: Upper Saddle River, NJ, USA, 2001. [Google Scholar]
  40. Paschalis, E.P. Fourier transform infrared imaging of bone. In Bone Research Protocols; Helfrich, M.H., Ralston, S.H., Eds.; Human Press: Totowa, NJ, USA, 2012; pp. 517–525. ISBN 9781617794155. [Google Scholar]
  41. Neto, A.S.; Fonseca, A.C.; Abrantes, J.C.C.; Coelho, J.F.J.; Ferreira, J.M.F. Surface functionalization of cuttlefish bone-derived biphasic calcium phosphate scaffolds with polymeric coatings. Mater. Sci. Eng. C 2019, 105, 110014. [Google Scholar] [CrossRef] [PubMed]
  42. Liu, Y.; Wang, Y. Proanthocyanidins’ efficacy in stabilizing dentin collagen against enzymatic degradation: MALDI-TOF and FTIR analyses. J. Dent. 2013, 41, 535–542. [Google Scholar] [CrossRef] [Green Version]
  43. Rodriguez-Navarro, A.B.; Romanek, C.S.; Alvarez-Lloret, P.; Gaines, K.F. Effect of in ovo exposure to PCBs and Hg on clapper rail bone mineral chemistry from a contaminated salt marsh in coastal Georgia. Environ. Sci. Technol. 2006, 40, 4936–4942. [Google Scholar] [CrossRef] [PubMed] [Green Version]
  44. Magne, D.; Weiss, P.; Bouler, J.M.; Laboux, O.; Daculsi, G. Study of the maturation of the organic (type I collagen) and mineral (nonstoichiometric apatite) constituents of a calcified tissue (dentin) as a function of location: A fourier transform infrared microspectroscopic investigation. J. Bone Miner. Res. 2001, 16, 750–757. [Google Scholar] [CrossRef] [PubMed]
  45. Paschalis, E.P.; Mendelsohn, R.; Boskey, A.L. Infrared assessment of bone quality: A review. Clin. Orthop. Relat. Res. 2011, 469, 2170–2178. [Google Scholar] [CrossRef] [PubMed] [Green Version]
  46. Curylofo-Zotti, F.A.; Tanta, G.S.; Zucoloto, M.L.; Souza-Gabriel, A.E.; Corona, S.A.M. Selective removal of carious lesion with Er:YAG laser followed by dentin biomodification with chitosan. Lasers Med. Sci. 2017, 32, 1595–1603. [Google Scholar] [CrossRef]
  47. Velo, M.M.D.A.C.; Magalhães, A.C.; Shiota, A.; Farha, A.L.H.; Grizzo, L.T.; Honório, H.M.; Wang, L. Profile of high-fluoride toothpastes combined or not with fuctionalized tri-calcium phosphate on root dentin caries control: An in vitro study. Am. J. Dent. 2018, 31, 290–296. [Google Scholar]
  48. Lenzi, T.L.; Soares, F.Z.M.; Raggio, D.P.; Pereira, G.K.R.; Rocha, R.D.O. Dry-bonding etch-and-rinse strategy improves bond longevity of a universal adhesive to sound and artificially-induced caries-affected primary dentin. J. Adhes. Dent. 2016, 18, 475–482. [Google Scholar] [CrossRef]
  49. Nicoloso, G.F.; Antoniazzi, B.F.; Lenzi, T.L.; Soares, F.Z.M.; Rocha, R.D.O. The bonding performance of a universal adhesive to artificially-created caries-affected dentin. J. Adhes. Dent. 2017, 19, 317–321. [Google Scholar] [CrossRef] [PubMed]
  50. White, D.J. The comparative sensitivity of intra-oral, in vitro, and animal models in the “profile” evaluation of topical fluorides. J. Dent. Res. 1992, 71, 884–894. [Google Scholar] [CrossRef]
  51. Buzalaf, M.A.R.; Hannas, A.R.; Magalhães, A.C.; Rios, D.; Honório, H.M.; Delbem, A.C.B. pH-cycling models for in vitro evaluation of the efficacy of fluoridated dentifrices for caries control: Strengths and limitations. J. Appl. Oral Sci. 2010, 18, 316–334. [Google Scholar] [CrossRef]
  52. Goettsche, Z.S.; Ettinger, R.L.; Wefel, J.S.; Hogan, M.M.; Harless, J.D.; Qian, F. In vitro assessment of 3 dentifrices containing fluoride in preventing demineralization of overdenture abutments and root surfaces. J. Prosthet. Dent. 2014, 112, 1257–1264. [Google Scholar] [CrossRef] [PubMed]
  53. Marin, E.; Hiraishi, N.; Honma, T.; Boschetto, F.; Zanocco, M.; Zhu, W.; Adachi, T.; Kanamura, N.; Yamamoto, T.; Pezzotti, G. Raman spectroscopy for early detection and monitoring of dentin demineralization. Dent. Mater. 2020, 36, 1635–1644. [Google Scholar] [CrossRef]
  54. Enrich-Essvein, T.; Benavides-Reyes, C.; Álvarez-Lloret, P.; Bolaños-Carmona, M.V.; Rodríguez-Navarro, A.B.; González-López, S. Influence of de-remineralization process on chemical, microstructural, and mechanical properties of human and bovine dentin. Clin. Oral Investig. 2021, 25, 841–849. [Google Scholar] [CrossRef]
  55. Hong, L.; Ettinger, R.L.; Watkins, C.A.; Wefel, J.S. In vitro evaluation of fluoride varnish on overdenture abuments. J. Prosthet. Dent. 2003, 89, 28–36. [Google Scholar] [CrossRef] [PubMed]
  56. Darling, L.A.; Ettinger, R.L.; Wefel, J.S.; Cooper, S.H. Prevention of demineralization by CO2 and Er, Cr:YSGG laser irradiation of ovedenture abutments. Am. J. Dent. 2006, 19, 227–230. [Google Scholar]
  57. Salehi, H.; Terrer, E.; Panayotov, I.; Levallois, B.; Jacquot, B.; Tassery, H.; Cuisinier, F. Functional mapping of human sound and carious enamel and dentin with Raman spectroscopy. J. Biophotonics 2013, 6, 765–774. [Google Scholar] [CrossRef] [PubMed]
  58. Tjäderhane, L.; Larjava, H.; Sorsa, T.; Uitto, V.J.; Larmas, M.; Salo, T. The activation and function of host matrix metalloproteinases in dentin matrix breakdown in caries lesions. J. Dent. Res. 1998, 77, 1622–1629. [Google Scholar] [CrossRef]
  59. Chaussain-Miller, C.; Fioretti, F.; Goldberg, M.; Menashi, S. The role of matrix metalloproteinases (MMPs) in human caries. J. Dent. Res. 2006, 85, 22–32. [Google Scholar] [CrossRef]
  60. Tsuda, H.; Ruben, J.; Arends, J. Raman spectra of human dentin mineral. Eur. J. Oral Sci. 1996, 104, 123–131. [Google Scholar] [CrossRef]
  61. Farlay, D.; Panczer, G.; Rey, C.; Delmas, P.D.; Boivin, G. Mineral maturity and crystallinity index are distinct characteristics of bone mineral. J. Bone Miner. Metab. 2010, 28, 433–445. [Google Scholar] [CrossRef] [Green Version]
  62. Lin, S.Y.; Li, M.J.; Cheng, W.T. FT-IR and Raman vibrational microspectroscopies used for spectral biodiagnosis of human tissues. Spectroscopy 2007, 21, 1–30. [Google Scholar] [CrossRef]
  63. Rey, C.; Collins, B.; Goehl, T.; Dickson, I.R.; Glimcher, M.J. The carbonate environment in bone mineral: A resolution-enhanced Fourier transform infrared spectroscopy study. Calcif. Tissue Int. 1989, 45, 157–164. [Google Scholar] [CrossRef]
  64. Boskey, A.L. Mineralization of bones and teeth. Elements 2007, 3, 385–391. [Google Scholar] [CrossRef]
  65. Dowker, S.E.P.; Anderson, P.; Elliot, J.C.; Gao, X.J. Crystal chemistry and dissolution of calcium phosphate in dental enamel. Mineral. Mag. 1999, 63, 791–800. [Google Scholar] [CrossRef]
  66. Danilchenko, S.N.; Moseke, C.; Sukhodub, L.F.; Sulkio-Cleff, B. X-ray diffraction studies of bone apatite under acid demineralization. Cryst. Res. Technol. 2004, 39, 71–77. [Google Scholar] [CrossRef]
  67. Berna, F.; Matthews, A.; Weiner, S. Solubilities of bone mineral from archaeological sites: The recrystallization window. J. Archaeol. Sci. 2004, 31, 867–882. [Google Scholar] [CrossRef]
  68. Dominguez-Gasca, N.; Benavides-Reyes, C.; Sánchez-Rodríguez, E.; Rodríguez-Navarro, A.B. Changes in avian cortical and medullary bone mineral composition and organization during acid-induced demineralization. Eur. J. Mineral. 2019, 31, 209–216. [Google Scholar] [CrossRef]
  69. Hiraishi, N.; Sono, R.; Islam, M.S.; Otsuki, M.; Tagami, J.; Takatsuka, T. Effect of hesperidin in vitro on root dentine collagen and demineralization. J. Dent. 2011, 39, 391–396. [Google Scholar] [CrossRef] [PubMed]
  70. Sereda, G.; VanLaecken, A.; Turner, J.A. Monitoring demineralization and remineralization of human dentin by characterization of its structure with resonance-enhanced AFM-IR chemical mapping, nanoindentation, and SEM. Dent. Mater. 2019, 35, 617–626. [Google Scholar] [CrossRef]
  71. Erhardt, M.C.; Lobo, M.M.; Goulart, M.; Coelho-de-Souza, F.H.; Valentino, T.A.; Pisani-Proenca, J.; Conceicao, E.N.; Pimenta, L.A. Microtensile bond strength of etch-and-rinse and self-etch adhesives to artificially created carious dentin. Gen. Dent. 2014, 62, 56–61. [Google Scholar]
  72. Kucukyilmaz, E.; Savas, S.; Akcay, M.; Bolukbasi, B. Effect of silver diamine fluoride and ammonium hexafluorosilicate applications with and without Er: YAG laser irradiation on the microtensile bond strength in sound and caries-affected dentin. Lasers Surg. Med. 2016, 48, 62–69. [Google Scholar] [CrossRef]
  73. Fathy, S.M. Remineralization ability of two hydraulic calcium-silicate based dental pulp capping materials: Cell-independent model. J. Clin. Exp. Dent. 2019, 11, e360–e366. [Google Scholar] [CrossRef] [PubMed]
  74. Shivakumar, K.M.; Vidya, S.K.; Chandu, G.N. Dental caries vaccine. Indian J. Dent. Res. 2009, 20, 99–106. [Google Scholar] [CrossRef] [PubMed]
Figure 1. ATR-FTIR peaks profile in the carbonate absorption band v2 CO32: (a) sound dentine, (b) carious dentine, (c) pH cycling (pHc) for 14 days, and (d) pHc for 28 days. The three peaks assignment correspond to unstable-labile carbonate (∼866 cm−1), type B carbonate (∼871 cm−1), and type A carbonate (∼878 cm−1) [33,40].
Minerals 12 00005 g001
Figure 2. ATR-FTIR peaks profile in the phosphate absorption band (v1, v3 PO43−): (a) sound dentine, (b) carious dentine, (c) pHc for 14 days, and (d) pHc for 28 days. Peaks assignment: ∼940 cm−1 (v1 P-O symmetry stretching mode), ∼960 cm−1 (v1 PO43−), ∼996 cm−1 (PO43− in apatite environment), ∼1005 cm−1 (v3 PO43−), ∼1020 cm−1 (v3 PO43− in poorly crystalline apatites), ∼1030 cm−1 (v3 PO43− in stoichiometric apatites), ∼1044 cm−1 (HPO42− containing apatites and type B carbonated substitution), ∼1056 cm−1 (T2 vibrational modes of apatites), ∼1060 cm−1 (v3 PO43− in poorly crystalline apatites), ∼1075 cm−1 (v3 PO43− in poorly crystalline apatites), ∼1100 cm−1 (v3 PO43− in poorly crystalline apatites), and ~1109 cm−1 (poorly crystalline apatites) [33,41,42,43,44,45].
Minerals 12 00005 g002
Figure 3. Results for ATR-FTIR mineralisation variables. (a) MinCO3 (carbonate to phosphate ratio), (b) Degree of mineralisation (mineral to organic ratio), and (c) Crystallinity index (CI). Different uppercase letters show statistical differences between groups (p < 0.05).
Minerals 12 00005 g003
Figure 4. Results for Raman mineralisation variables. (a) Carbonate to phosphate ratio, (b) Carbonate to CH2 ratio, and (c) Crystallinity Index. Different uppercase letters show statistical differences among groups (p < 0.05).
Minerals 12 00005 g004
Figure 5. 2D-XRD patterns and integrated 2Theta scan: (a) sound dentine, (b) carious dentine, (c) pH cycling (14 days), and (d) pH cycling (28 days). The (002) diffraction peak considered for the crystallite size measurements is indicated in the unidimensional patterns.
Minerals 12 00005 g005
Figure 6. Results for crystallite size measurements by the integration of 2D-XRD patterns. Different uppercase letters show statistical differences among groups (p < 0.05). Values are expressed in nanometers (nm).
Minerals 12 00005 g006
Figure 7. SEM images: (a) sound dentine, (b) carious dentine, (c) pHc (14 days), and (d) pHc (28 days). Red circles indicate some extensive opening tubules in both pHc groups. Yellow asterisks mark some occluded dentinal tubules in pHc 14 and pHc 28 groups. Scale bar: 10 µm.
Minerals 12 00005 g007
Figure 8. Masson’s trichrome images: (a) sound dentine, (b) pHc (14 days), and (c) pHc (28 days). The red band indicates demineralised collagen type I. Scale bar: 50 µm.
Minerals 12 00005 g008
Table 1. Mean and standard deviation (SD) of relative areas for peaks in carbonate (v2 CO32) and phosphate (v1, v3 PO43) ATR-FTIR absorption bands. Different superscript capital letters show statistical differences among groups (p < 0.05).
Wavenumber (cm−1)Sound (n = 10)Caries (n = 10)pHc 14 (n = 10)pHc 28 (n = 10)
P1_CO3_a866 0.386 ± (0.073) A0.248 ± (0.072) B0.227 ± (0.047) B0.197 ± (0.075) B
P2_CO3_a8710.474 ± (0.068) A0.458 ± (0.115) A0.457 ± (0.039) A0.449 ± (0.051) A
P3_CO3_a8780.140 ± (0.029) A0.294 ± (0.083) B0.316 ± (0.052) B0.353 ± (0.068) B
P1_PO4_a9400.080 ± (0.019) A0.006 ± (0.007) B0.012 ± (0.004) B0.009 ± (0.005) B
P2_PO4_a9600.129 ± (0.014) A0.031 ± (0.019) B0.037 ± (0.008) B0.030 ± (0.009) B
P3_PO4_a9960.205 ± (0.021) A0.056 ± (0.036) B0.062 ± (0.014) B0.050 ± (0.018) B
P4_PO4_a10050.192 ± (0.037) A0.146 ± (0.037) A.B0.144 ± (0.013) B0.134 ± (0.015) B
P5_PO4_a10200.131 ± (0.016) A0.223 ± (0.027) B0.227 ± (0.028) B0.231 ± (0.020) B
P6_PO4_a10300.085 ± (0.008) A0.186 ± (0.030) B0.176 ± (0.012) B0.183 ± (0.012) B
P7_PO4_a10440.047 ± (0.011) A0.099 ± (0.020) B0.094 ± (0.007) B0.100 ± (0.008) B
P8_PO4_a10560.031 ± (0.009) A0.060 ± (0.013) B0.059 ± (0.007) B0.060 ± (0.008) B
P9_PO4_a10600.028 ± (0.009) A0.052 ± (0.012) B0.054 ± (0.008) B0.056 ± (0.007) B
P10_PO4_a10780.032 ± (0.007) A0.052 ± (0.010) B0.058 ± (0.010) B0.061 ± (0.008) B
P11_PO4_a10960.026 ± (0.004) A0.053 ± (0.010) B0.047 ± (0.004) B0.050 ± (0.006) B
P12_PO4_a11090.017 ± (0.005) A0.037 ± (0.009) B0.031 ± (0.009) B0.036 ± (0.006) B
Table 2. The relative concentration of calcium (Ca) and phosphorus (P) on the dentine surfaces expressed as weight % for all experimental groups.
GroupElementWeight (%)
Sound dentineCa27.82
P14.10
Caries groupCa17.40
P8.87
pHc 14Ca23.08
P11.68
pHc 28Ca22.78
P11.36
Publisher’s Note: MDPI stays neutral with regard to jurisdictional claims in published maps and institutional affiliations.

