Article

Mineral Composition of Prospective Section of Wufeng-Longmaxi Shale in Luzhou Shale Play, Sichuan Basin

1
Shale Gas Research Institute of Petrochina Southwest Oil&Gas Field Company, Chengdu 610051, China
2
Key Laboratory of Shale Gas Evaluation and Exploitation of Sichuan Province, Chengdu 610051, China
3
Key Laboratory of Shale Gas and Geoengineering, Institute of Geology and Geophysics, Chinese Academy of Sciences, Beijing 100029, China
4
Innovation Academy of Earth Science, Chinese Academy of Sciences, Beijing 100029, China
*
Author to whom correspondence should be addressed.
Minerals 2022, 12(1), 20; https://doi.org/10.3390/min12010020
Submission received: 26 October 2021 / Revised: 17 December 2021 / Accepted: 20 December 2021 / Published: 23 December 2021

Abstract

:
Currently, Luzhou in the Sichuan Basin is a focal point for shale-gas exploration and development in China. However, a lack of detailed research on the mineral composition of the Wufeng Formation-Longmaxi Formation (WF-LF) shale is hindering the extraction of deep-buried shale gas in the Luzhou shale play. Herein, a field emission scanning electron microscope (FESEM) equipped with the Advanced Mineral Identification and Characterization System (AMICS) software was employed to analyze the mineral composition of the WF-LF shale from six wells in Luzhou. Quartz was the dominant mineral type, (16.9–87.21%, average 51.33%), followed by illite, calcite, dolomite, and pyrite. Our study revealed that (1) quartz content showed a moderate positive correlation with the total organic carbon (TOC) content, indicating that the quartz found in the shale is mostly of biological origin; and (2) the sum content of siliceous minerals and carbonaceous minerals was moderately positively correlated with the brittleness index (BRIT) in well SS1H2-7 and in the well group of RS8 and RS5, indicating that the siliceous minerals and carbonaceous minerals had an active effect on reservoir compressibility. Finally, according to the mineralogical features of each sublayer, we identified four types of reservoirs to determine their scope for exploration.

1. Introduction

The Sichuan Basin is the largest commercial shale-gas production region in China [1]. Following the success of shale gas plays in Fuling, Changning, Weiyuan, and other locations, shale-gas exploration and development projects are now targeting deep-buried reserves [2]. The Luzhou shale play in south Sichuan Province, where the basal depth of the Longmaxi Formation is between 3500 and 4500 m, is a promising shale-gas reservoir depocenter [3]. It is currently a focal point for the exploration and development of deep-buried shale gas in the Sichuan Basin. Due to shale being a dense fine-grained sedimentary rock [4,5,6], it is difficult to generate industrial gas flows. Chinese and international experiences of developing shale gas have shown that almost all shale reservoirs require hydraulic fracturing to achieve commercial exploitation. Furthermore, previous studies have shown that the mineral composition of shale is an essential factor that affects the fracturing outcomes [7,8,9]. Thus, identifying the mineral components of shale is a key step in the process of selecting promising shale gas plays.
Previous studies have shown that the total organic carbon (TOC) content of shale in the Sichuan Basin ranges from 0.35 to 18.4% with an average of 2.52%. Shales with TOC values greater than 2% account for 45% of the total shale unit [10]. Organic matters are mainly type I and II1. Shales are commonly highly over-matured. Their equilibrated vitrinite values are reported to range from 2.4% to 4.2% [11]. Compared with conventional reservoirs, the mineral composition of shale reservoirs is more complex. Other than organic minerals, the main constituents of the Wufeng Formation-Longmaxi Formation (WF-LF) shale in the Sichuan Basin are siliceous minerals (quartz and K-feldspar), clay minerals (illite and chlorite), and authigenic non-clay minerals (chiefly carbonate and sulfate minerals) [12,13].
As a sub region of the Sichuan Basin, some studies of Luzhou play have been reported. Chen et al. [14] evaluated the reservoir in Luzhou play from the TOC, thermal maturity and thickness of shale, pointing out that mineralogy, porosity, geomechanics, and friability need to be analyzed further. Jiang et al. [15] discussed the controlling factors of marine shale gas differential enrichment, but the mineral characteristics were not finely analyzed. Li et al. [16] carried out some sampling studies in Luzhou play as well as other areas of the southern Sichuan Basin. This gave a preliminary insight of the mineralogy of shale in Luzhou play. Despite the former studies, the mineral characteristics of the WF-LF shale in Luzhou play have not been investigated in detail, which has hindered the exploration and development of deep-buried shale gas in this region.
Various rock parameters are affected by mineral composition. Porosity shows a positive association with quartz and TOC contents [17,18]. Porosity and pore diameters also can be determined by the organic matter–mineral associations [19]. The theoretical maximum adsorption capacity of shale is mainly controlled by the mineral composition, especially clay and TOC [20,21]. Abnormal well logging values, such as the high-GR section in the WF-LF formation, are closely related to mineral components [22].
The most common techniques applied to analyze shale are X-ray diffraction (XRD), energy dispersive X-ray spectroscopy (EDS), and automated mineral analysis (AMA). XRD provides qualitative or semi-quantitative analyses of the composition of shale minerals using X-ray diffraction. It is a common method for rapidly analyzing shale mineral content [23,24,25,26]. However, the XRD test requires the sample to be ground into powder, thus, destroying the original characteristics of the mineral [27,28]. Moreover, the accuracy of XRD’s identification of complex clay minerals is restricted; therefore, it has limited application in shale analysis. EDS excites the characteristic X-rays on the sample surface by an electron beam to form an X-ray energy spectrum. According to the energy spectrum, the element information in the sample can be analyzed to further obtain the mineral information of the sample. Many studies have used this method to analyze mineral types in scanning electron microscope (SEM) images [29,30,31]. However, EDS is not suited to perform quantitative mineralogical analysis over a large area. The AMA technique adapts the single-point analysis of EDS to multi-point analysis, which solves the problem of conducting quantitative mineralogy over a large area, and it provides original mineral distribution maps. Reliable AMA technologies include Advanced Mineral Identification and Characterization System (AMICS) from Bruker (https://www.bruker.com/en/products-and-solutions/elemental-analyzers/eds-wds-ebsd-SEM-Micro-XRF/software-amics-automated-mineralogy-system.html, accessed on 22 November 2021), Quantitative Evaluation of Materials by Scanning Microscopy (QEMSCAN) from FEI, TESCAN Integrated Mineral Analyzer (TIMA), RoqSCAN from CGG, and Mineralogy by Artificial Intelligence Powered Scanning Electron Microscopy) (MaipSCAN) from Rock Scientific [32,33,34,35,36], all of which have helped elevate shale mineral analysis to new heights. It is worth noting that artificial intelligence technology has proven its effectiveness in the field of oil and gas engineering, and will be better used in the mineral analysis in the future [37].
In this study, we used the AMICS software to conduct detailed analysis of the mineral composition of the WF-LF shale from six wells in the Luzhou Shale play, providing mineral content data from the Wufeng Formation and the 1–4 sublayers of the 1st sub-member of the 1st member of the Longmaxi Formation (abbreviated respectively as L111, L112, L113, L114 below), along with a mineral distribution map. Based on the AMICS results, we compared the mineral composition of each sublayer of the wells and analyzed the relationship between mineral composition and the total organic carbon (TOC), U/Th ratio, and brittleness index (BRIT). We also evaluated the advantages and disadvantages of the mineral composition of each sublayer from an engineering perspective.

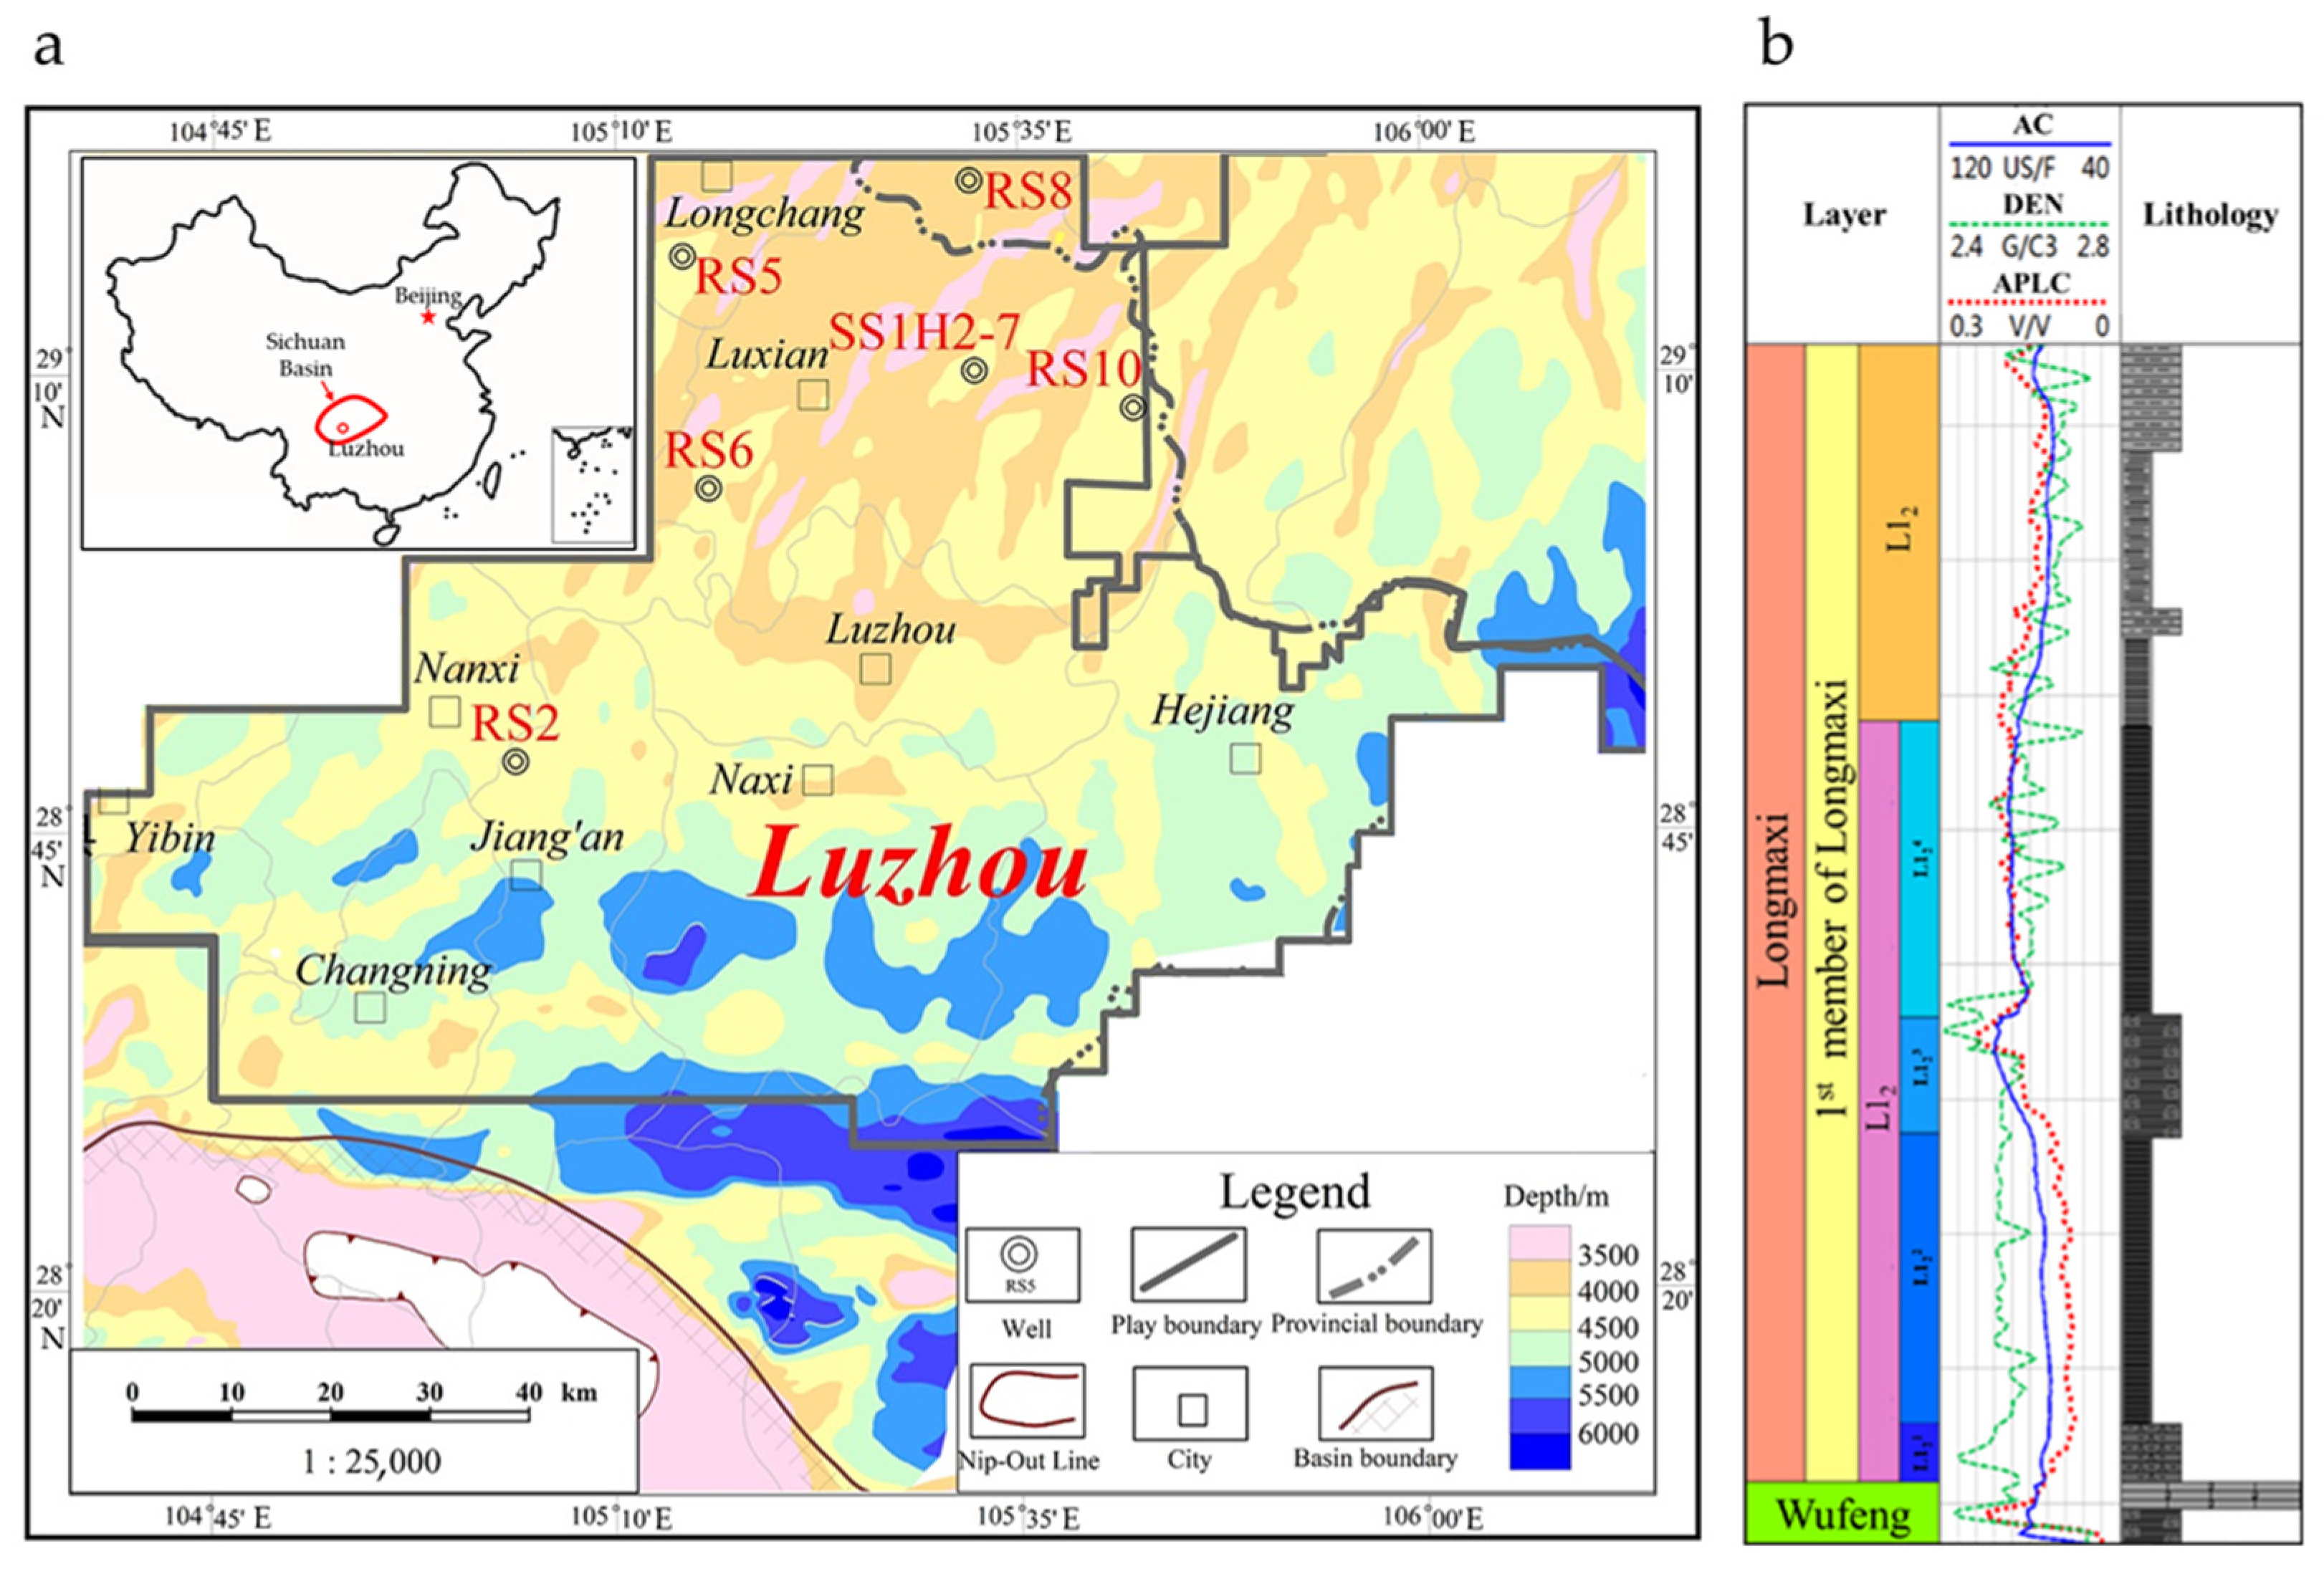
2. Geological Setting

The Luzhou shale play is located in the low fold belt in south Sichuan, between the southern slope of the central Sichuan paleo-uplift and the downwarp-fold belt in southeast Sichuan. Running north to south, it has an echeloned comb-like anticline structure. The northeastern part of the study area is close to a tectonic transition zone, with strong folding, producing many low and steep anticlinal zones. The syncline structures in this area are wider and gentler, and the area occupied by synclines is more than 20 times that occupied by anticlines. At the beginning of the depositional period in the Late Ordovician, the area of the Upper Yangtze Craton, where the Sichuan Basin is located, shrank due to the continuously rising Leshan-Longnüsi paleo-uplift and central Guizhou Oldland. As a result, during the early Middle Ordovician, the area changed from a wide sea area to a confined one, consisting of two ridges and a depression. Notably, the sedimentary base is higher in the southeast and lower in the northwest, and therefore, the sea area gradually deepened from southeast Sichuan to Luzhou. During the Longmaxi period of the Early Silurian, the central Guizhou uplift expanded, connecting with the Kangdian Oldland to the west, and an embryonic form of the Xuefeng underwater paleo-uplift appeared to the east. In addition, further underwater paleo-uplift occurred in central Sichuan, causing the sedimentary water body in the Luzhou area to deepen, resulting in a confined epicontinental sea environment (continental shelf) [38].
In this study, the sedimentary thickness of the WF-LF shale in the Luzhou shale play is 500–650 m, much thicker than the WF-LF shale in the Fuling and Changning shale-gas fields (190–450 m). The basal depth of the Wufeng Formation in the Luzhou shale play is between 3500 and 4500 m, with the depth increasing gradually from north to south (Figure 1). The main gas-producing strata included the L114, L113, L112, L111, and WF substrata. The main lithology of the area was black carbonaceous shale, black carbonaceous calcareous shale, gray-black calcareous shale, and black-gray silty shale.

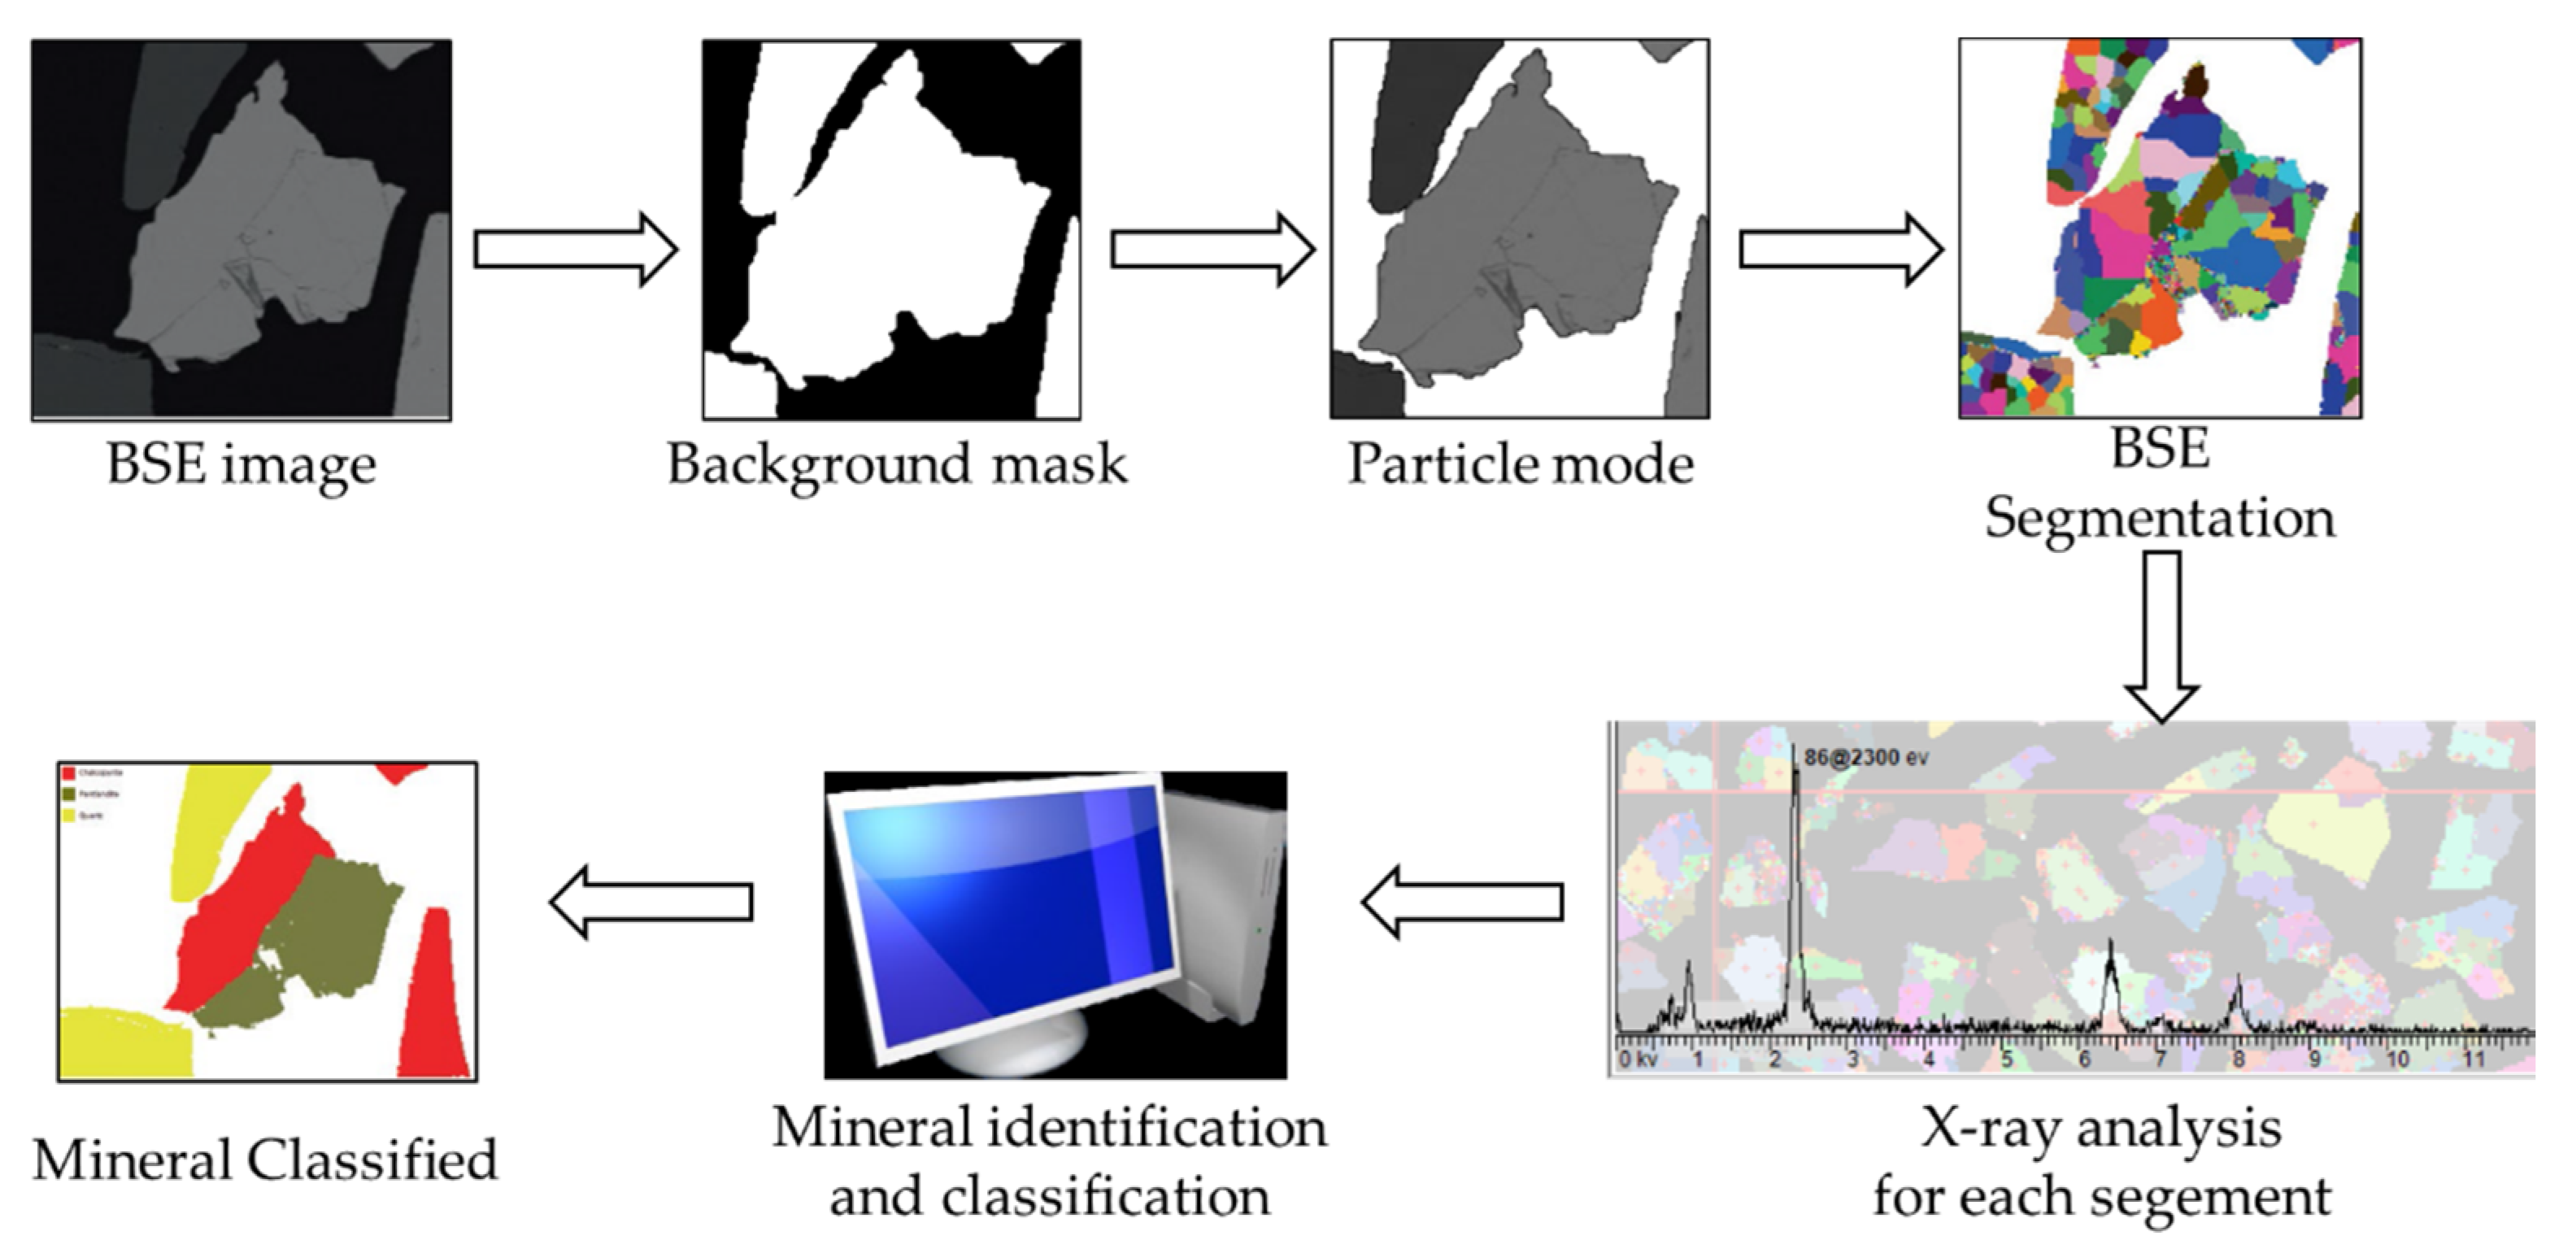
3. Samples and Methods
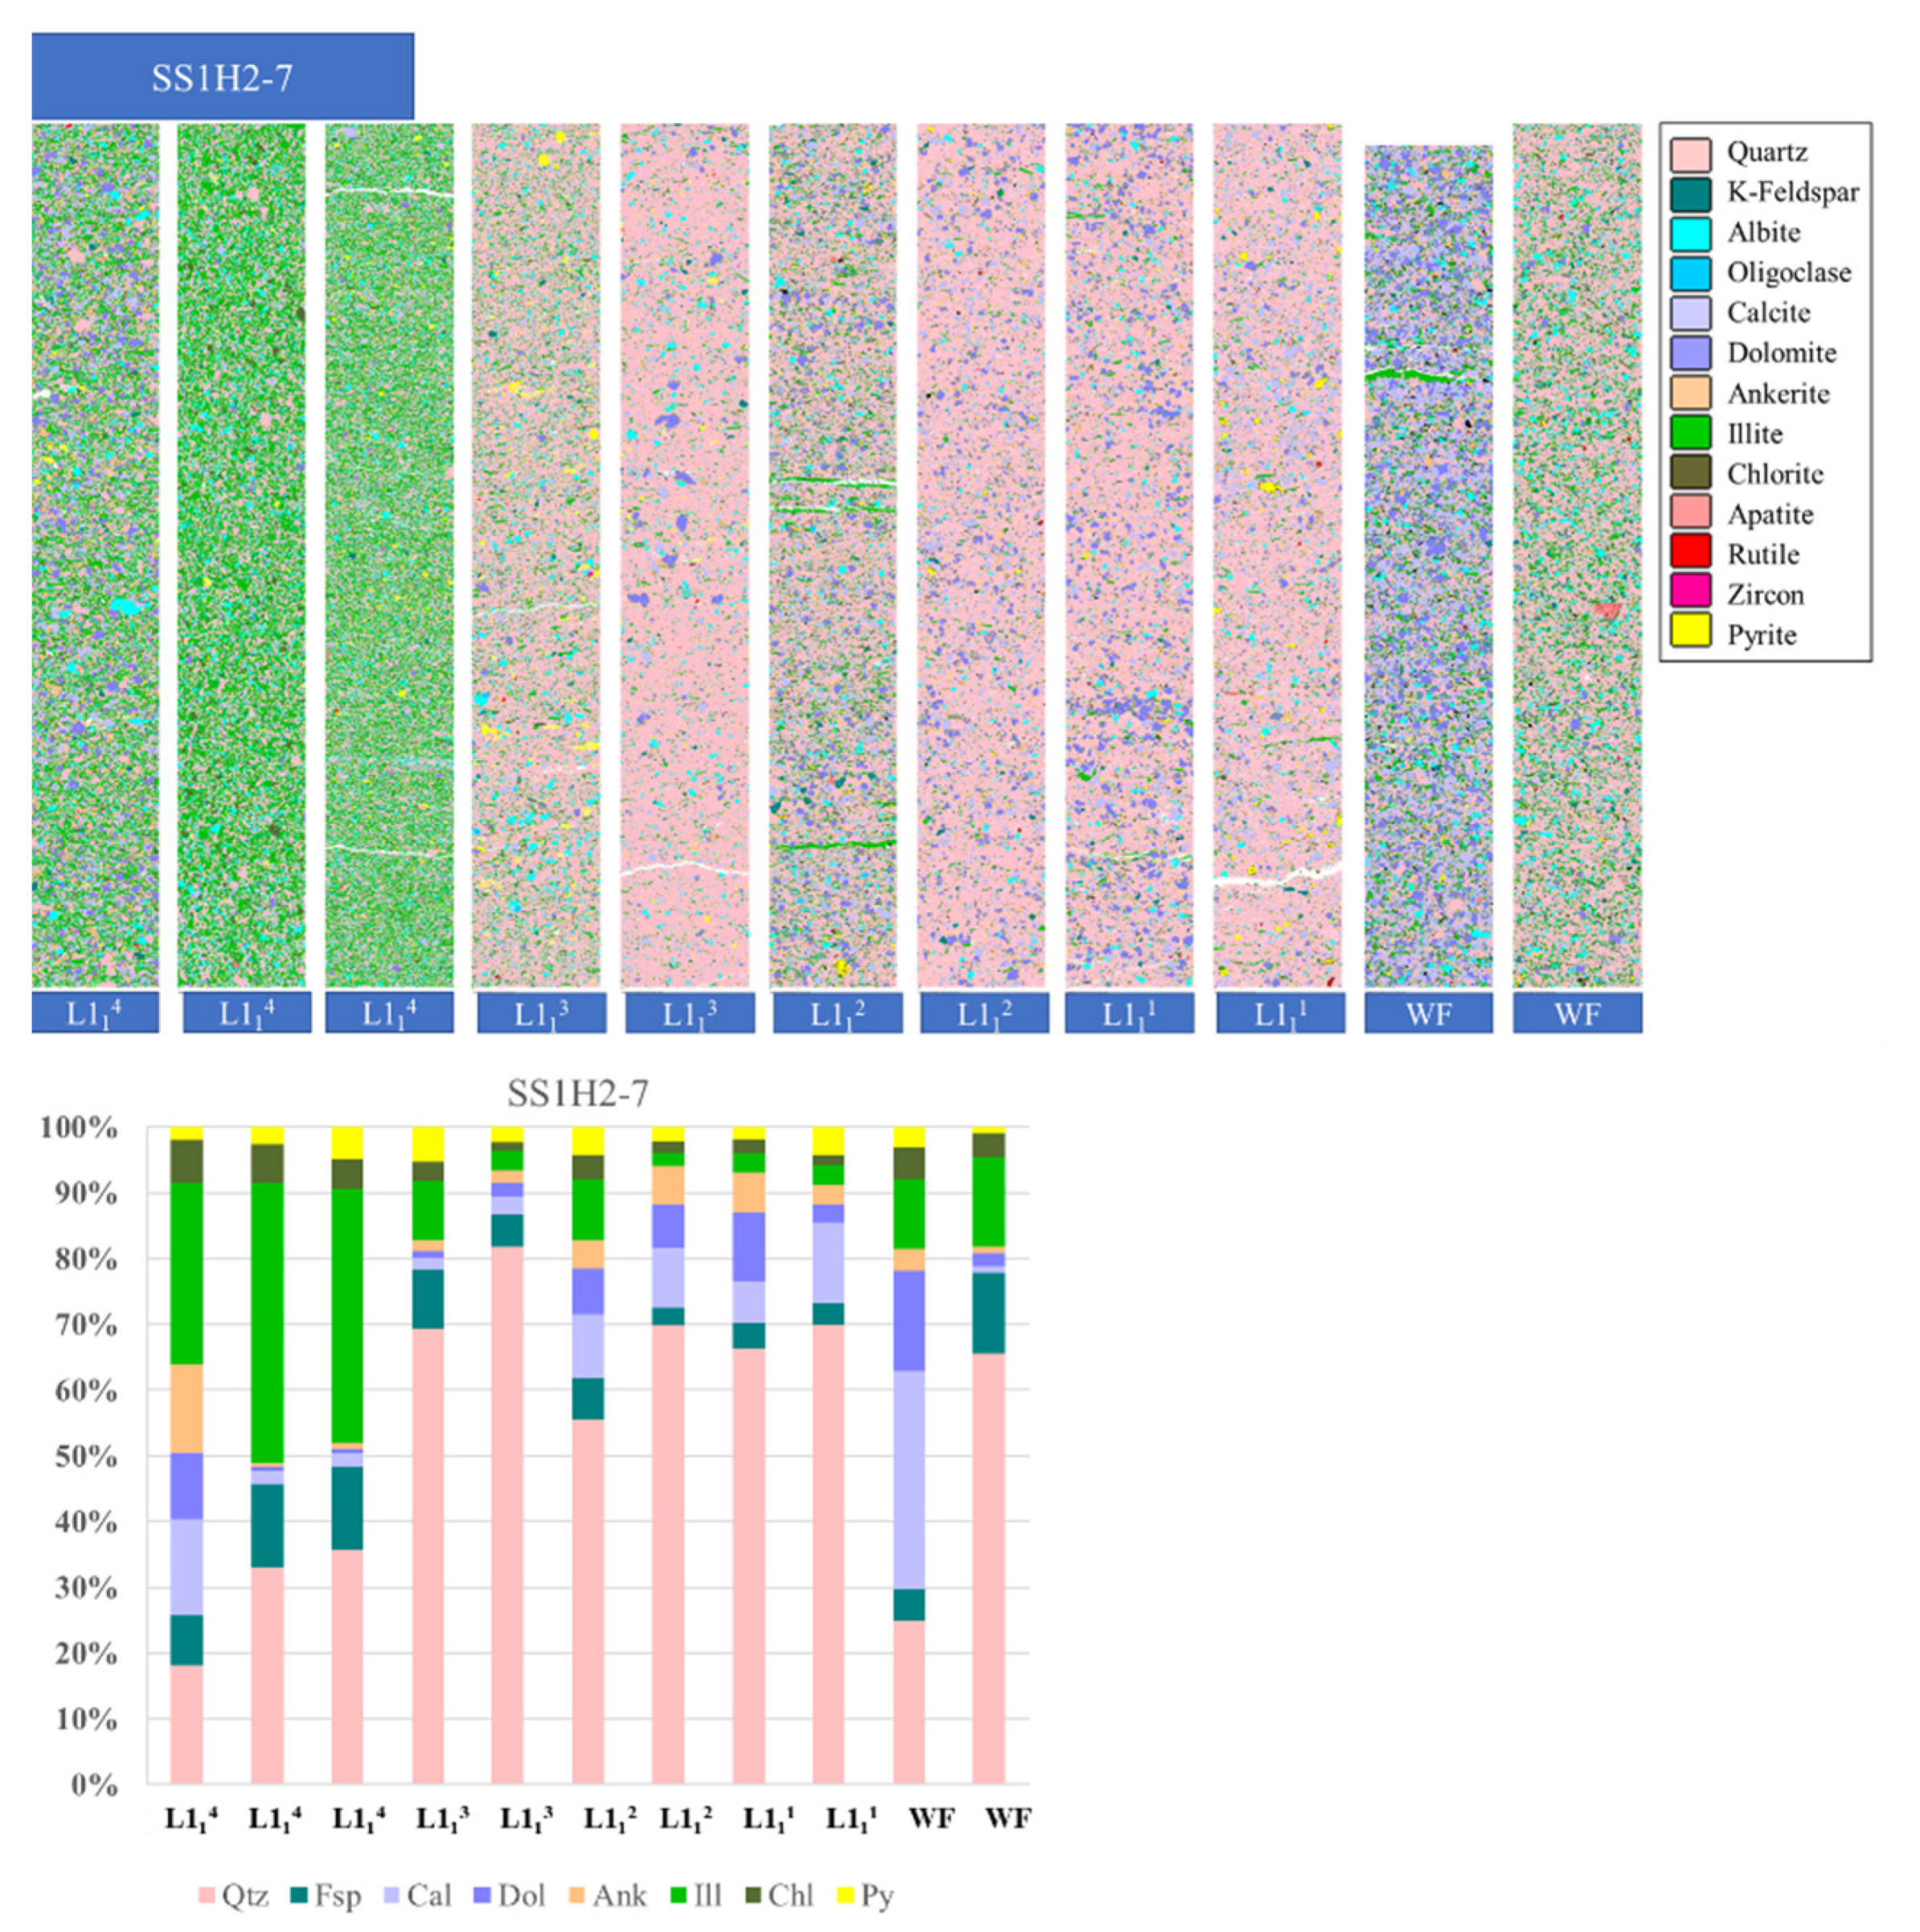
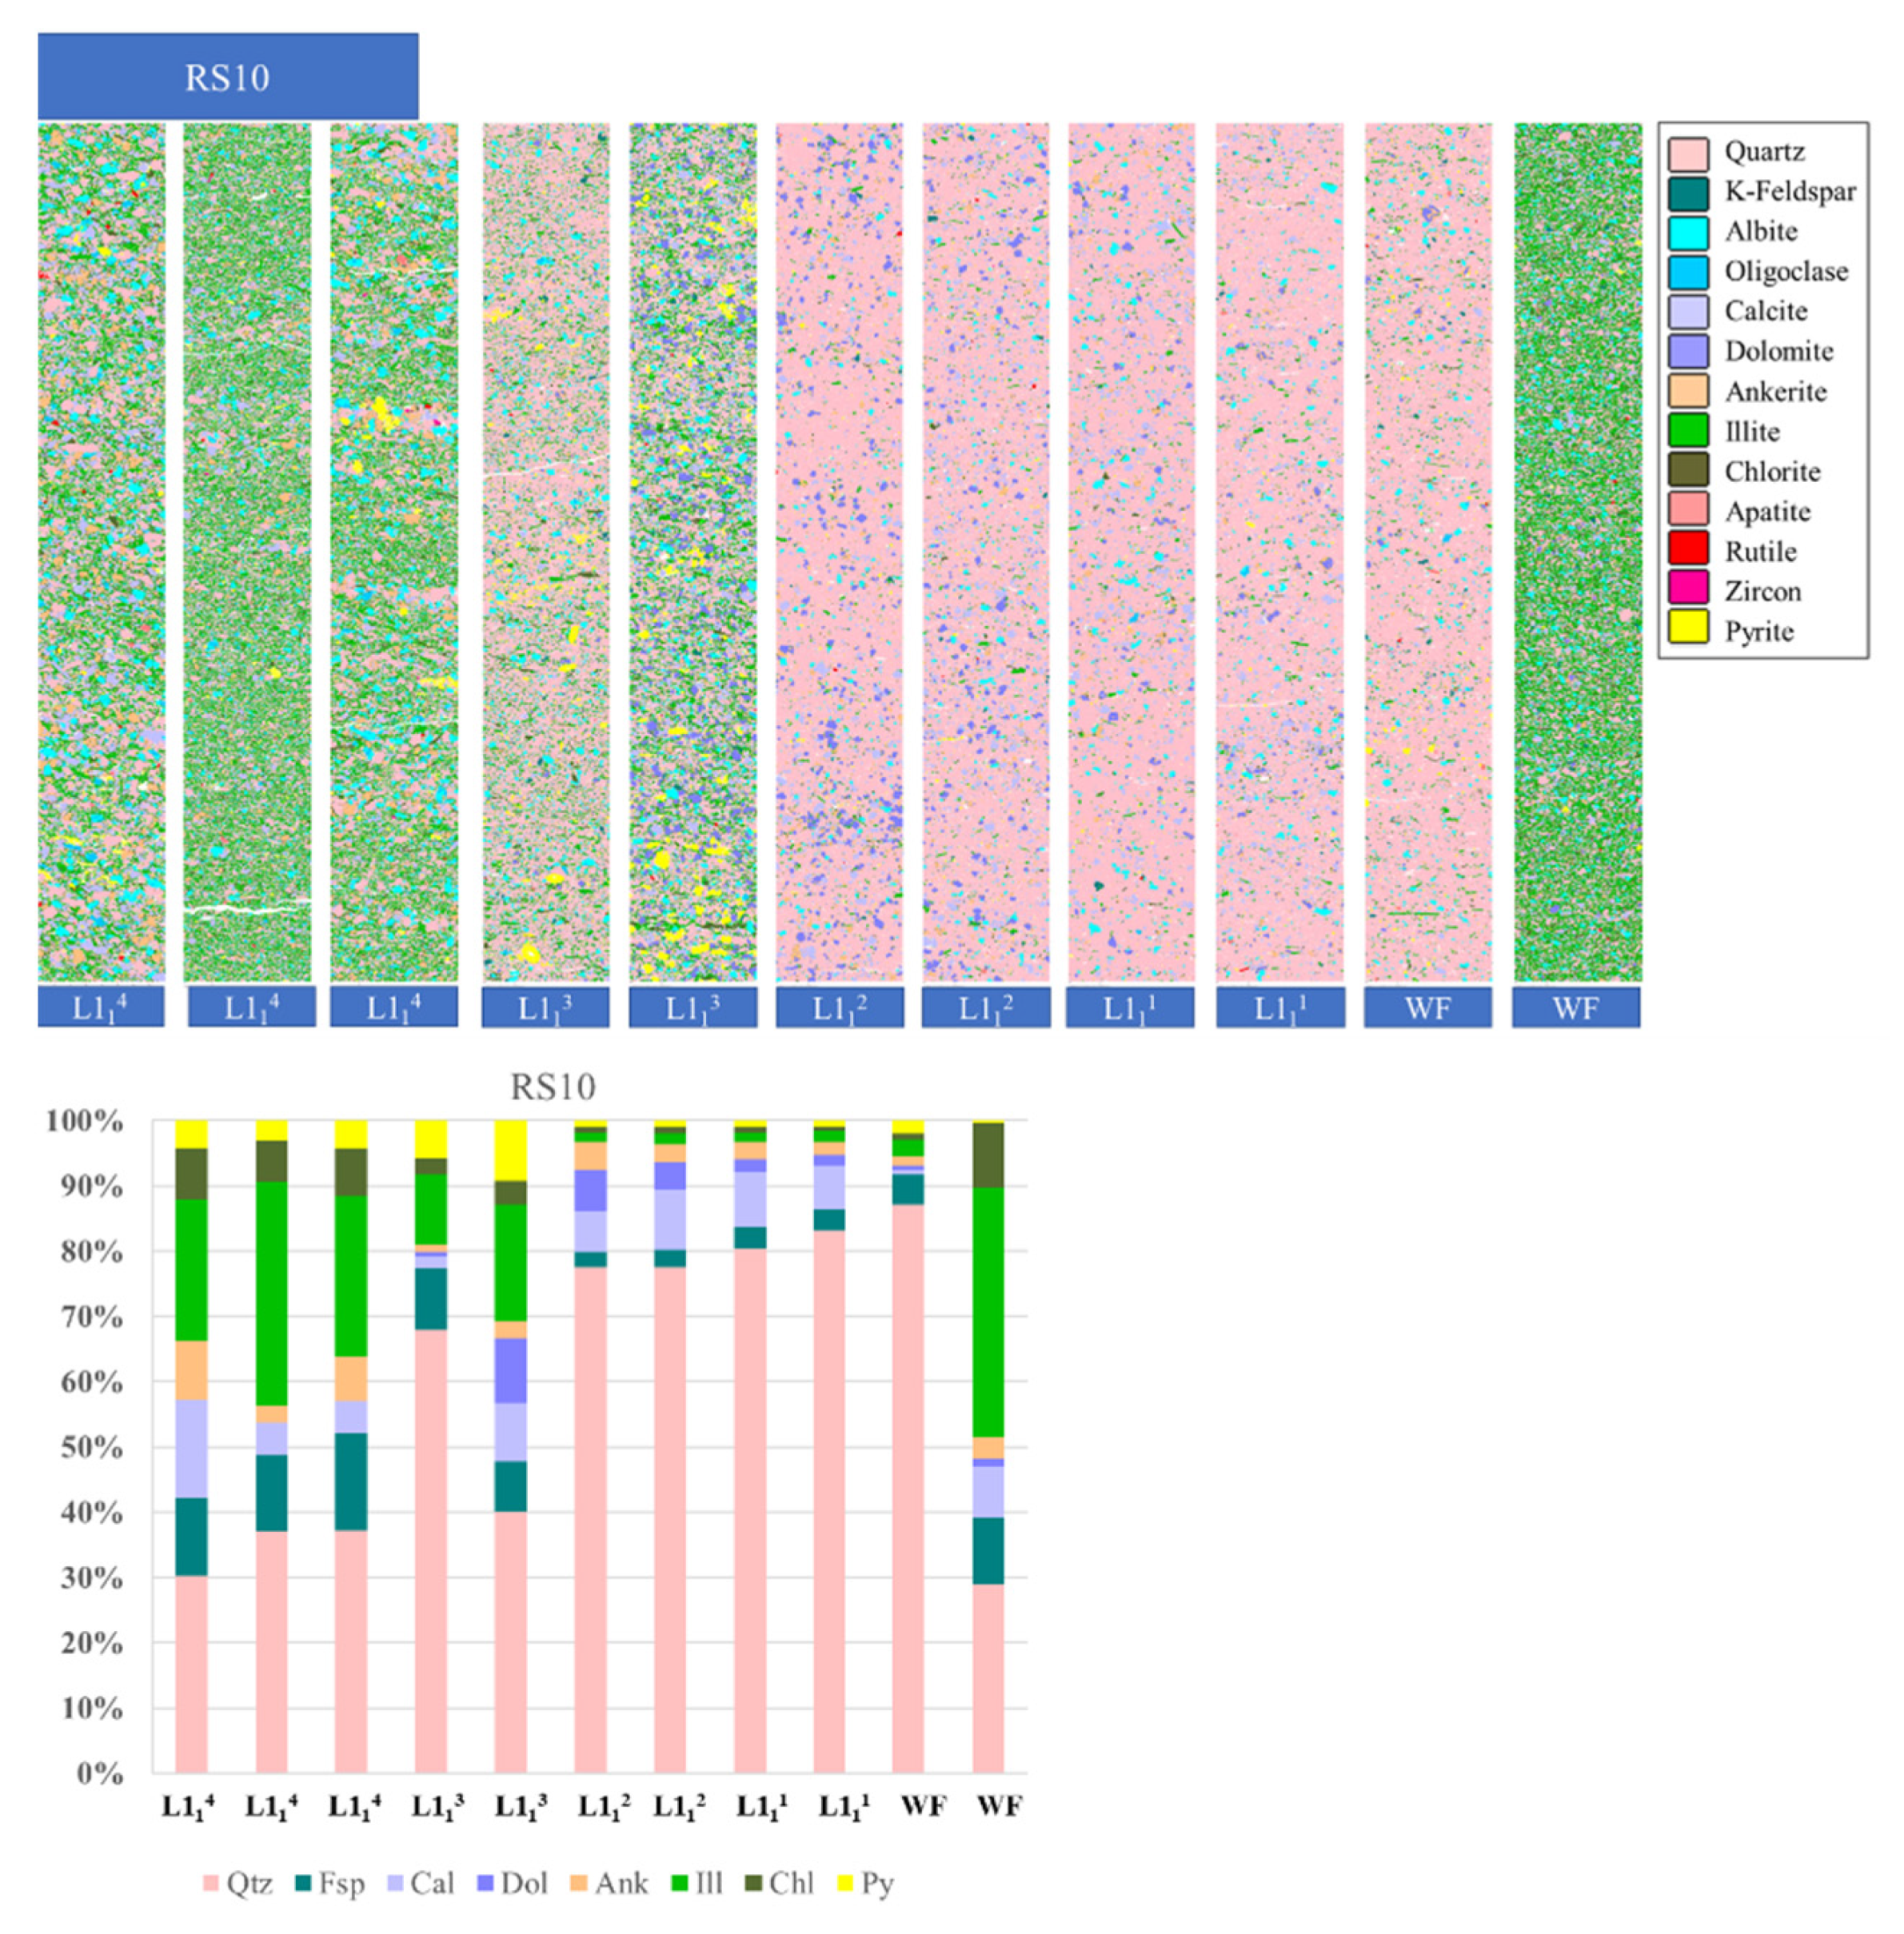
The samples consisted of cores taken from six wells, from the first sub-member of the first member of the Longmaxi Formation to the Wufeng Formation (L11-WF). The locations of the sampled wells are shown in Figure 1. A total of 63 samples were taken, comprising of 3 samples from L114, 1–2 from L113, 1–2 from L112, 2 from L111, and 2 from WF at each well. TOC, U/Th and BRIT data of Well RS5, SS1H2-7, and RS8 were collected from commercial well logging interpretation results, and they are shown in Table 1.
The AMICS Particle mode was used for mineral analysis. AMICS integrates Zeiss field emission scanning electron microscopy (FESEM), Bruker high-resolution EDS, and an analysis software; AMICS (version: 2.5.6.411, Bruker, Billerica, MA, USA) can perform high-resolution, automated, quantitative mineral analysis of a large area across all mineral families. Prior to the AMICS analysis, argon-ion polished and carbon-coated rock samples were transferred into an SEM. Figure 2 shows the schematic diagram of AMICS mineral analysis process. The area to be analyzed was first scanned using backscatter electrons (BSE). Then, based on the gray-level difference in the BSE images, mineral boundaries were identified. Additionally, EDS data within different boundaries were collected and compared with standard minerals to quantitatively identify the mineral types, content, and distribution characteristics of different minerals found in the study area. In this study, the AMICS analysis area of each sample was up to 400 µm ∗ 2700 µm, with the identification accuracy being 1 µm2.

4. Results

The AMICS results showed that the mineral types of L11-WF mainly consisted of siliceous minerals, namely, quartz, K-feldspar, albite, and oligoclase; carbonate minerals, namely, calcite, dolomite, and ankerite; clay minerals, namely, illite and chlorite; and other minerals such as apatite, pyrite, rutile, and zircon. Because the proportions of apatite, rutile, and zircon were all relatively low, we have disregarded them. Once we combined K-feldspar, albite, and oligoclase under the category of “feldspar,” the normalized relative percentages of the primary minerals were calculated. We also calculated the normalized relative percentages for the three endmembers of the siliceous, carbonate, and clay minerals. Table 2 shows that quartz content in the L11-WF sublayers ranged from 16.9% to 87.21%, with an average of 51.33%, making it the dominant mineral type. The subordinate mineral was illite (1.49% to 51.6%; average of 17.76%). The averages for calcite, dolomite, and pyrite are 7.88%, 5.60%, and 3.24%, respectively. The mineral content and distribution results for each sublayer of each well are as follows.
In well RS5 (Figure 3), the L114 sublayer was primarily composed of illite (36.00–51.60%), followed by quartz (20.70–27.89%); and the upper section of this sublayer had obvious pyrite formation. Overall, the L113 sublayer was dominated by quartz (86.10% in the upper section), decreasing to approximately 38.50% in the lower section. The most prominent feature of the lower section was the abundant formation of pyrite (13.49%). The L112 sublayer was also dominated by quartz (approximately 55.30%), followed by illite (18.91%). The L111 sublayer was also dominated by quartz (41.47–64.37%), followed by carbonate minerals (dolomite and ankerite). The upper section of the WF was dominated by quartz (64.23%), followed by calcite. The quartz content of the lower section was calculated to be 25.78%, and illite was the dominant mineral (46.87%).
In well SS1H2-7 (Figure 4), the L114 sublayer was mainly composed of illite (27.57–42.63%). Quartz was the subordinate mineral (18.26–35.60%). The upper section contained more calcite, dolomite, and ankerite, but their contents decrease considerably in the lower section. The L113 sublayer was dominated by quartz (69.37–81.83%). The upper section contained more clay minerals than the lower section, but it had lower carbonate mineral content than the lower section. The L112 sublayer was also dominated by quartz (55.49–69.91%). The calcite content was relatively high, and we also observed illite bands in the upper section. The L111 sublayer was also mainly composed of quartz (66.39–69.98%), followed by dolomite and calcite. The upper section of the WF was dominated by calcite (~33.22%), followed by quartz. The lower section was dominated by quartz (65.63%), followed by illite.
In well RS10 (Figure 5), the L114 sublayer consisted mainly of quartz (30.36–37.28%), followed by illite (21.80–34.48%). Overall, we observed a high content of feldspar. The calcite content was slightly higher in the upper section. The L113 sublayer was dominated by quartz (40.05–67.86%), followed by illite. There was notably more calcite, dolomite, and ankerite in the lower section than the upper section. Pyrite was abundant in this sublayer as well. From the L112 sublayer to the upper section of the WF, the mineral characteristics were very similar. Quartz dominated this member (77.56–87.21%), followed by carbonate minerals, such as calcite, dolomite, and ankerite. The content of clay minerals was low in this sublayer. In the lower part of the WF, illite was the dominant mineral (38.00%), followed by quartz (29.02%).
In well RS8 (Figure 6), the upper and lower sections of the L114 sublayer were dominated by illite (45.68–47.84%), followed by quartz. In the middle section, quartz was dominant (30.85%), followed by illite, and the total content of carbonate minerals, such as calcite and dolomite, was also higher in this middle section. In the L113 sublayer quartz was dominant (62.80–69.49%), followed by illite. The L112 sublayer was generally dominated by quartz. The lower section had quartz content of 84.89%, which was significantly higher than that in the upper section, while the upper section had higher illite and dolomite content than the lower section. Overall, the L111 sublayer was dominated by quartz, but the upper section had a higher proportion than the lower section; furthermore, and the lower section contained more calcite and illite than the upper section. In general, the WF was dominated by quartz in both the upper (77.12%) and lower sections (51.16%). Notably, the illite content was higher in the lower section (16.60%) of the WF, compared to the upper section (2.65%).
In well RS6 (Figure 7), the upper and middle sections of the L114 sublayer were dominated by illite (28.48–43.21%). The contents of quartz and illite were similar (26.98–31.83%). The lower section was dominated by quartz (41.95%), while the content of illite was 29.05%. In sublayer L113, the content of quartz content was the highest (62.80–69.49%), followed by illite. The L112 sublayer was mainly composed of quartz (61.57–74.31%), followed by illite (less than 10%). The L111 sublayer was predominantly composed of quartz (55.49–56.07%). The upper section had a higher calcite content of 13.88%, and the lower section had a higher illite content (12.40%). The upper section of the WF was dominated by calcite (33.41%), followed by quartz. The lower section was dominated by quartz (67.40%), followed by illite.
In well RS2 (Figure 8), the upper section of the L114 sublayer was dominated by illite (51.56%), whereas the middle and lower sections were dominated by feldspar (34.91–49.15%). The L113 sublayer contained mostly quartz (62.75%), with lower quantities of feldspar and illite. The content of quartz in the L112 sublayer (37.22%) was slightly higher than the illite content (30.20%). The L111 sublayer was dominated by quartz, with the quartz content in the upper section being 44.53%, and dolomite was the subordinate mineral. The quartz content of the lower section was 74.10%, and illite was the subordinate mineral. The upper section of the WF was similar to the lower section of sublayer L111, because it was composed chiefly of quartz (65.66%), with a lower content of illite. The lower section of the WF was mainly composed of calcite (43.79%) and dolomite (26.59%), with the quartz content being 24.53%.

5. Discussion

5.1. Comparison of Mineral Composition of Sublayers between Wells

Figure 9f shows that the RS5, SS1H2-7, and RS10 wells were located in the northern part of the study area, running from northwest to southeast, at gradually increasing depths. In the RS5 and SS1H2-7 wells, sublayer L114 (Figure 9a) mainly consisted of clay minerals, with the average clay mineral contents being 48.21% and 43.27%, respectively, whereas the average content of siliceous minerals in the wells were 33.27% and 41.42%, respectively. In the RS10 well, the L114 sublayer consisted mainly of siliceous minerals (49.59%), and the average clay mineral content was 35.42%. This indicated that, as the depth increased, the content of siliceous minerals increased and that of clay minerals decreased. In addition, in all the three wells, carbonate minerals were more abundant in the upper section of sublayer L114, due to the shallow-water sedimentary environment of the region.
In all three wells, the L113 sublayer (Figure 9b) was dominated by siliceous minerals (49.12–91.33%). However, the mineral content of the L113 sublayer differed considerably in wells RS5 and RS10. The content of siliceous minerals in the upper section was generally above 80%, but it dropped below 55% in the lower section, indicating that the depositional environment changed significantly. In well SS1H2-7, the mineral content of sublayer L113 was relatively stable, with the contents of siliceous, clay, and carbonate minerals being similar to the upper section of the sublayer L113 in the RS5 and RS10 wells.
The L112 (Figure 9c) and L111 (Figure 9d) sublayers of the three wells were both dominated by siliceous minerals (51.86–87.11%), followed by the content of carbon minerals (10.40–23.28%), with small proportions of clay minerals. The relative content of siliceous minerals and clay minerals in the L112 and L111 sublayers showed a similar trend to that of the L114 layer, that is, as the depth increased, the content of siliceous minerals increased and that of clay minerals decreased.
The upper and lower sections of the WF (Figure 9e) in the three wells were notably different. The WF showed both, a high siliceous mineral member and a low siliceous mineral member. In the high siliceous mineral member, siliceous minerals accounted for more than 70%, while clay minerals occurred in low quantities. In the low siliceous mineral member, siliceous minerals accounted for less than 40%, ranging from 33.78% to 39.18%. Notably, sometimes, the predominant minerals were clay or carbonate minerals. This indicates that the sedimentary environment of the WF varied considerably.
Figure 10f shows a northeast-to-southwest line passing through the study area that connects the RS8, RS6, and RS2 wells, with the depth gradually increasing in that direction. However, the mineral content of the same horizons in the three wells did not change regularly with depth in the northeast-to-southwest direction.
The upper and lower sections of the L114 (Figure 10a) sublayer of well RS8 were dominated by clay minerals, while the middle section was dominated by siliceous minerals. The carbonate minerals content in the middle section was obviously higher. The dominant clay minerals occurred in the upper and middle sections of the L114 sublayer in well RS6, while siliceous minerals occupied the most in the lower section. Similar to well RS8, the middle section of well RS6 also had higher carbonate minerals. In well RS2, clay minerals only dominated in the upper section, while siliceous minerals dominated in the middle and lower sections. The higher carbonate mineral horizon appeared in the lower section. The averages for the siliceous minerals were (in order from northeast to southwest, here and below) 40.05%, 45.78%, and 54.56%, indicating an increase in their contents as the depth increased. The averages for the clay minerals content were 43.21%, 40.81%, and 27.64%, indicating a decrease in the content as the depth increased.
The mineral contents of the L113 (Figure 10b) sublayer in the three wells were consistent; all of them were dominated by siliceous minerals, with the mineral content being higher than 70%. The subordinate minerals in all three wells were clay minerals, with average values of 19.21%, 12.72%, and 9.59%, indicating a decrease in the clay content as the depth increased.
The L112 (Figure 10c) sublayer was also dominated by siliceous minerals in all three wells. The relative mineral contents in the upper and lower sections of wells RS8 and RS6 were consistent. The upper sections had siliceous minerals content as high as 80%, which was more than that in the lower sections. The carbonate mineral contents in the lower sections were 17.79% and 19.81%, and the clay mineral contents were 22.80% and 10.57%. By comparison, the sample from sublayer L112 of well RS2 had a siliceous mineral content of 45.07%, carbonate mineral content of 22.89%, and clay mineral content of 32.04%, similar to the mineral content observed in the lower sections of the RS8 and RS6 wells.
The L111 (Figure 10d) sublayer of the three wells was also dominated by siliceous minerals, with the average content being 55%. Except for the lower section of RS2, the subordinate minerals in the other sections were all carbonate minerals, with the average content being 20%, indicating the formation of a relatively shallow sedimentary water body in this layer.
The WF (Figure 10e) in well RS8 mainly consisted of siliceous minerals (over 50%), and the subordinate minerals were carbonate minerals, which was more than 20% in the lower section. The WF in both wells RS6 and RS2 showed a stratum dominated by siliceous minerals (over 70%), with clay minerals as the subordinate minerals, and another stratum dominated by carbonate minerals (over 50%), with siliceous minerals as the subordinate minerals. The latter is likely to be the Guanyinqiao member, with a relatively shallow sedimentary water body.

5.2. Relationship between Mineral Content and Other Geological Parameters

The relationship between mineral content and other geological parameters serves as an important reference for analyzing mineral sources, allowing us to make inferences about the sedimentary environment and evaluate the properties of different strata. In this work, the correlation between mineral content and logging data (Table 1) of well RS8, RS5, and SS1H2-7 were inspected. To examine the degree of correlation between the two variables, non-parametric Spearman correlation coefficients were calculated. Table 3 shows the Spearman’s Rank Correlation Coefficient rho rs and the statistical significance level p-value of the different two variables.
For TOC and quartz content of RS8, RS5, and SS1H2-7, the rs is 0.51, indicating that TOC and quartz content are moderately positively correlated. The p-value < 0.05 suggest that the correlation between TOC and quartz is statistically significant. Figure 11 shows the scatter plot of TOC and quartz content of RS8, RS5, and SS1H2-7. Since TOC mainly comes from organisms, it can be inferred that those quartz positively related to TOC has a biological origin.
For BRIT and the sum content of siliceous minerals and carbonaceous minerals, different correlation results were found in different well groups. The rs is 0.24 and the p-value is 0.183 in the well group of RS8, RS5, and SS1H2-7. This indicates that there is a weak correlation between BRIT and the sum content of siliceous minerals and carbonaceous minerals in these three wells, and the correlation is not statistically significant. However, a certain degree of correlation was indeed observed in the scatter plot of BRIT and the sum content of siliceous minerals and carbonaceous minerals (Figure 12). Therefore, to statistically verify this correlation, the variables correlation coefficients in different well groups were further calculated. In Table 3, the rs is 0.43 and the p-value is 0.049 in the well group of RS8 and RS5, so the BRIT and the sum content of siliceous minerals and carbonaceous minerals have a moderate positive correlation, and this correlation could be considered statistically significant. The rs is 0.58 and the p-value is 0.050 in the well SS1H2-7, which also indicates a moderate positive correlation with statistically significance. However, in well RS8 and well RS5, their respective p-values are larger than 0.05, which does not support a statistically significant correlation. In a word, the BRIT and the sum content of siliceous minerals and carbonaceous minerals have moderate positive correlation respectively in well SS1H2-7 and in the well group of RS8 and RS5. When the data of these three wells are put together, there is no obvious correlation between the two variables. There may be at least two reasons for this: firstly, the data span of our analysis is not wide enough; secondly, the fitting formula of correlation in each well is quite different. When put together, these different correlations are neutralized. The specific reasons will be further investigated in our future work. Nonetheless, the greater the sum content of siliceous minerals and carbonaceous minerals, the easier it is for complex fracture networks to form during fracturing, and the better the compressibility of shale.

5.3. Evaluation of Mineral Composition of Each Sublayer

Gamero-Diaz [40] roughly divided shale into four types based on its mineralogical characteristics: siliceous shale, argillaceous shale, carbonate shale, and mixed shale. Based on this, we divided the sublayers into four types of reservoirs from an engineering perspective.
Figure 13 shows a ternary phase diagram of siliceous, carbonate, and clay minerals. The vast majority of the L113, L112, and L111 sublayer samples, the majority of WF samples, and some L114 sublayer samples are portrayed in the siliceous shale area of the diagram. This area indicates >50% siliceous minerals, <50% carbonate minerals, and <50% clay minerals, attributing the characteristics of high brittleness and low plasticity. We classified this type of reservoir as Type I. It is conducive to natural fracturing and subsequent artificial fracturing and represents an optimum engineering opportunity for shale gas development.
The mineral composition of WF samples is relatively dispersed in the diagram. Other than the siliceous shale area, some WF samples are in the carbonate shale area, with <50% siliceous minerals, >50% carbonate minerals, and <50% clay minerals, which are the main characteristics of calcareous minerals. This is the Type II reservoir, which tends to be the limestone strata of the Guanyinqiao member. This member portrayed lower compressibility than the overlying L111–L113 sublayers.
The vast majority of the L114 sublayer samples lie in the mixed shale area in the diagram. The mineral content of the three types of minerals is relatively uniform in this area, with moderate brittleness. This is the Type III reservoir, which has moderate compressibility and may have development potential if the shale-gas reserves are substantial.
Some of the L114 sublayer and WF samples are distributed in the argillaceous shale area, characterized by <50% siliceous minerals, <50% carbonate minerals, and >50% clay minerals; these samples portrayed low brittleness and high plasticity. This is the Type IV reservoir. It has low compressibility, which may hinder the development of hydraulic fracturing. Notably, it is important to be aware of the negative effect of clay minerals on fracturing.

6. Conclusions

(1)
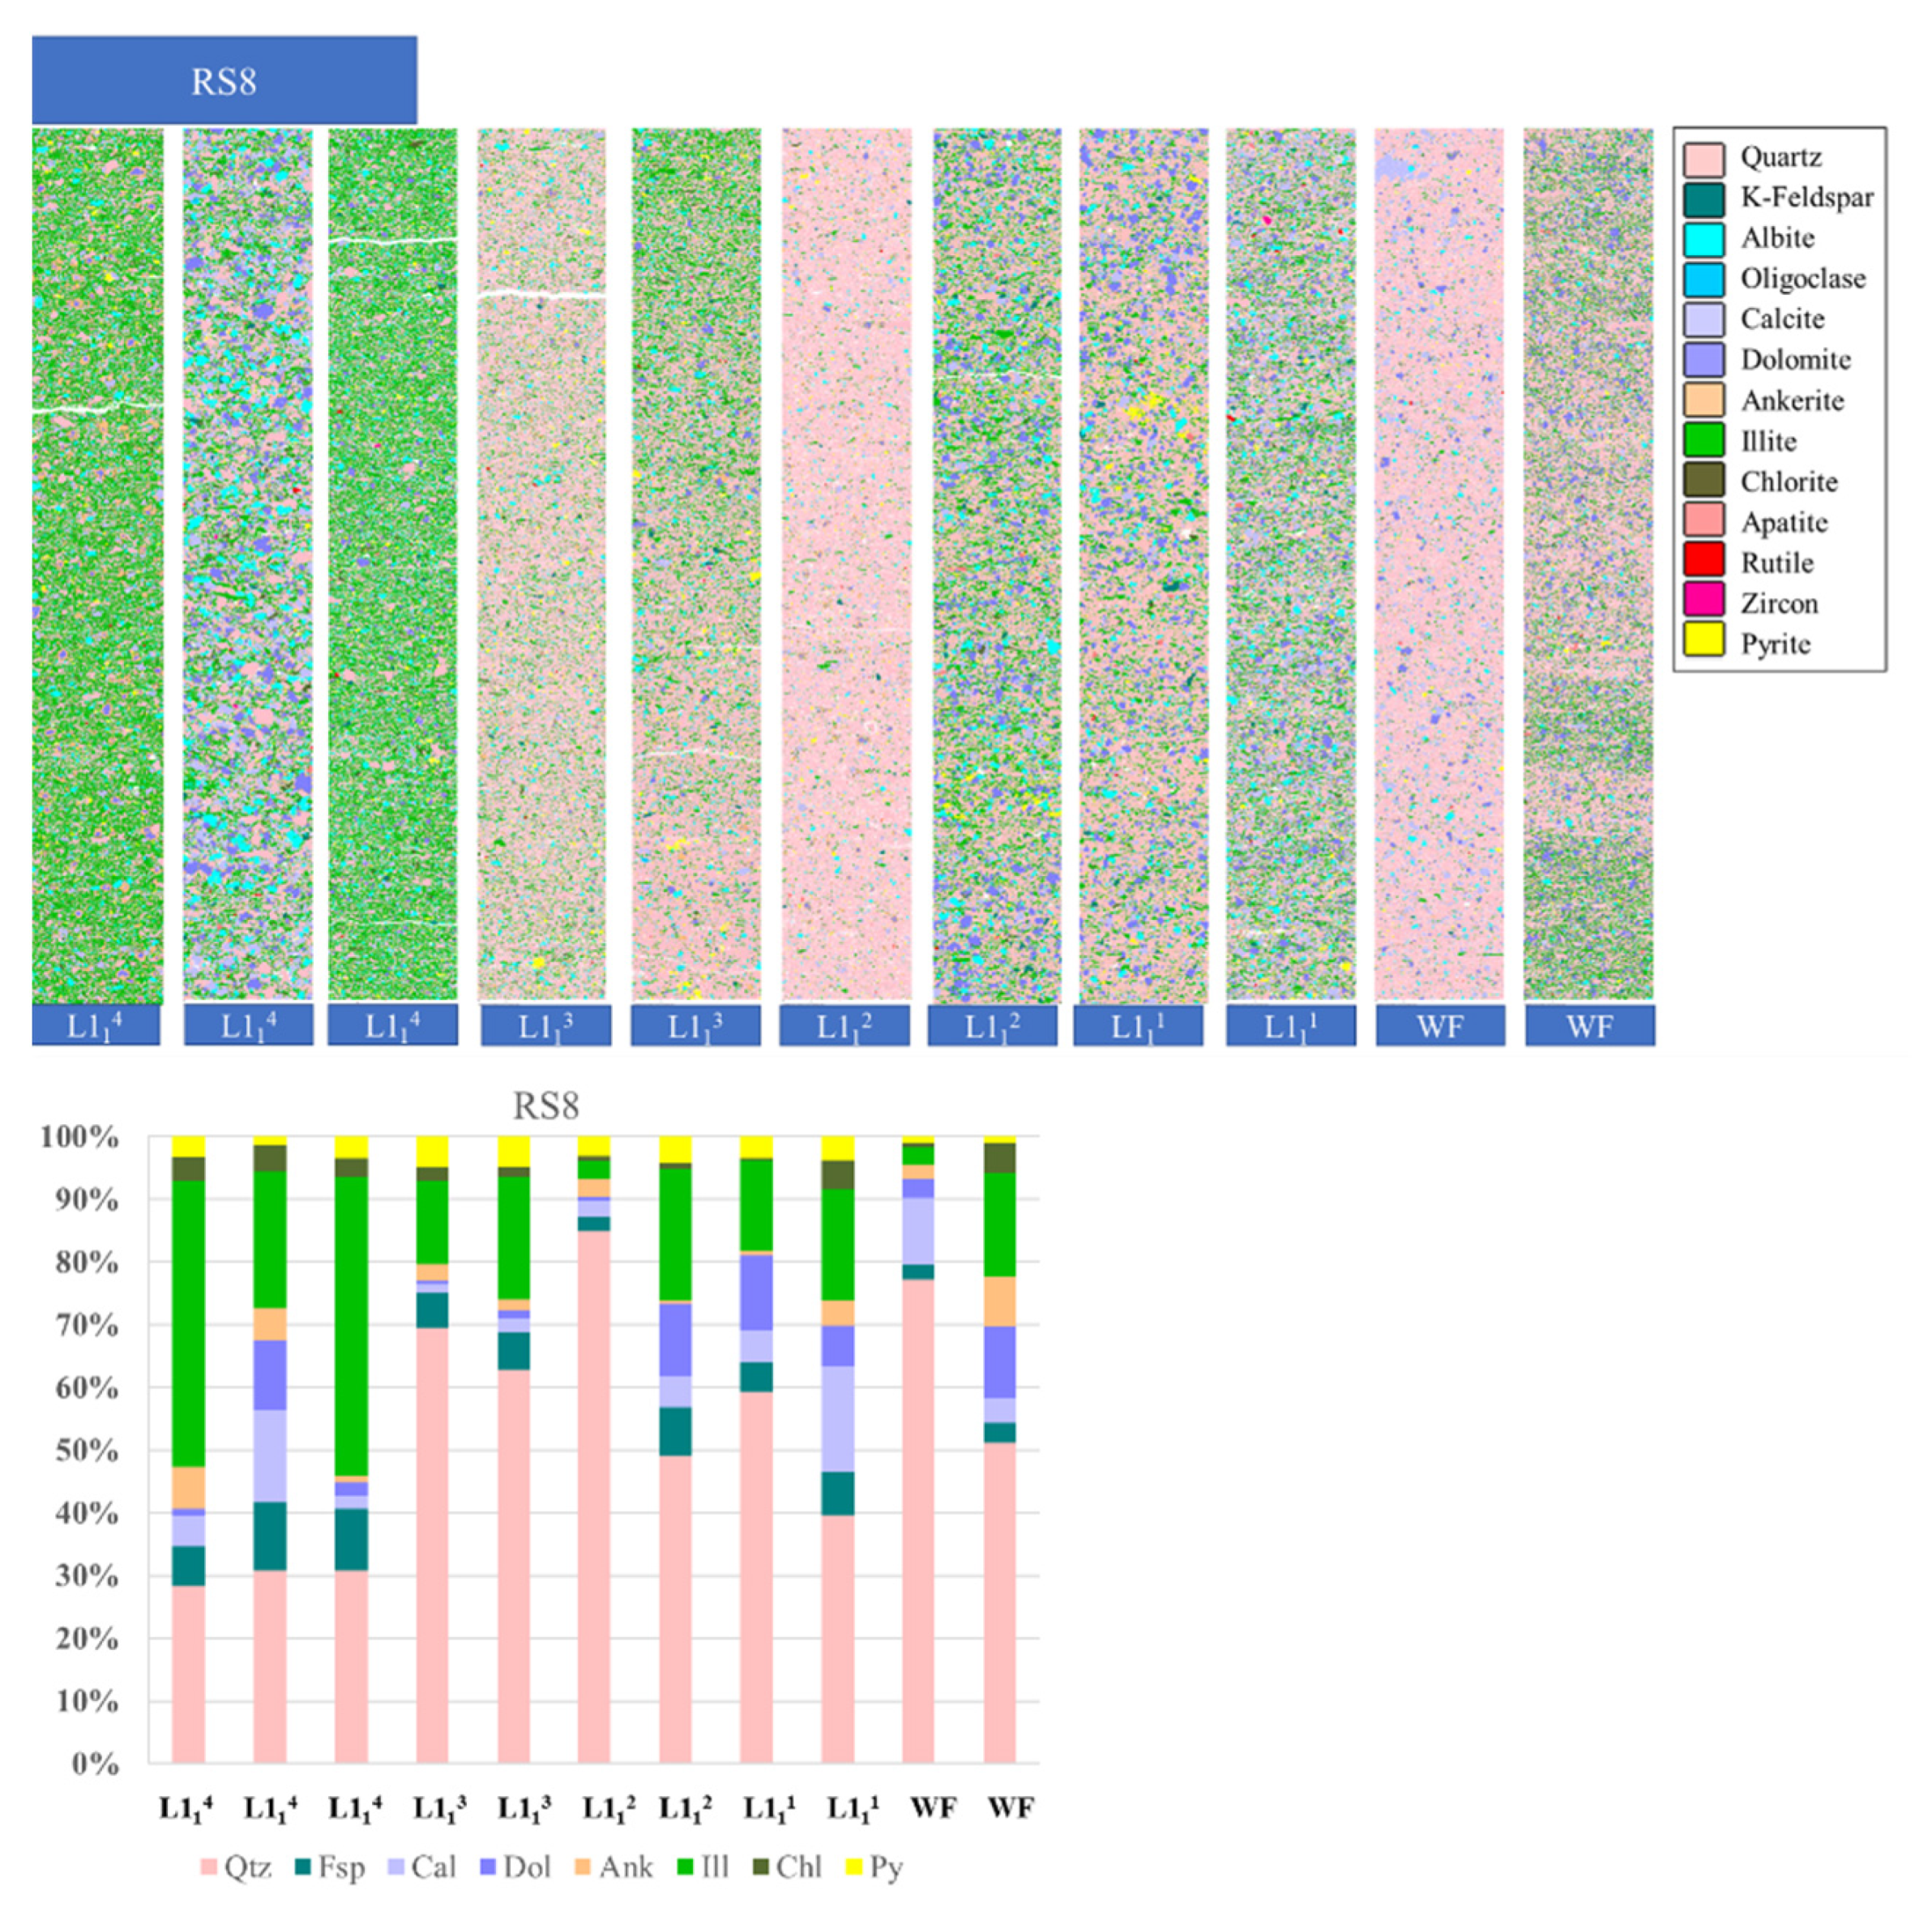
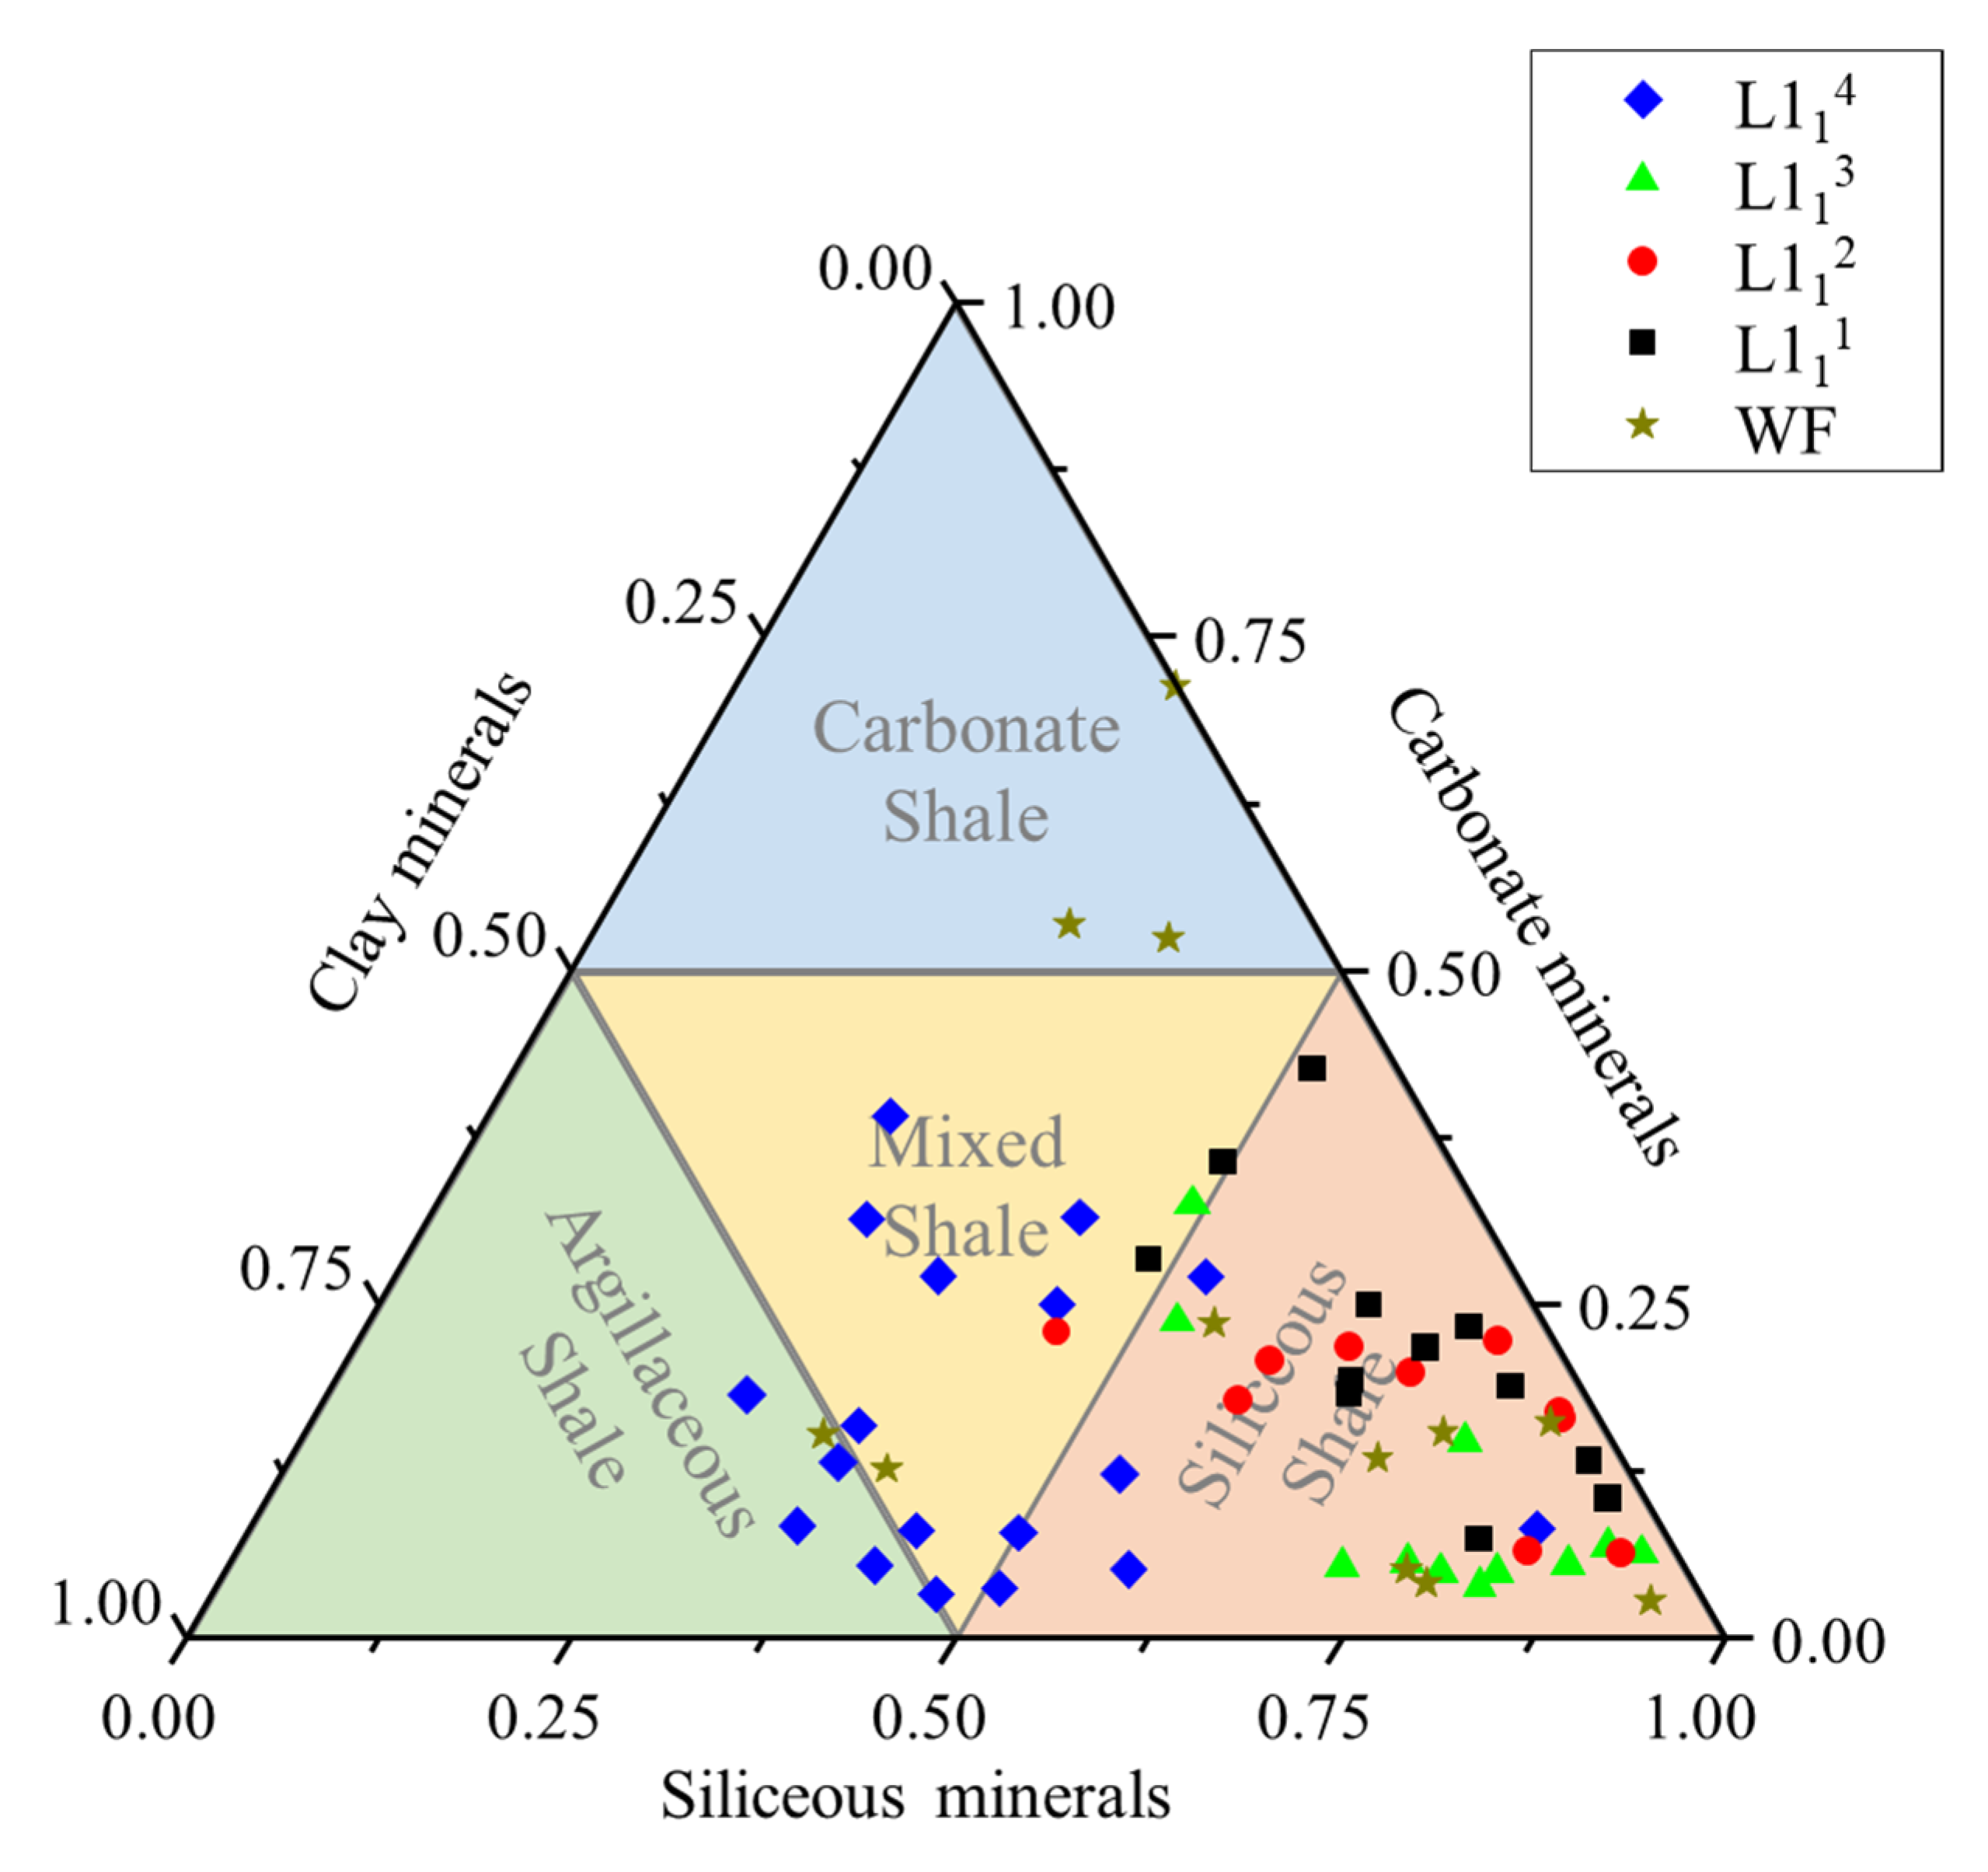
The content of quartz, which was the dominant mineral type in the L11-WF zone of the Luzhou shale play, ranged from 16.9% to 87.21% (average 51.33%). The subordinate mineral was illite, with content of 1.49–51.5% (average of 17.76%). The averages for calcite, dolomite, and pyrite were 7.88%, 5.60%, and 3.24%, respectively.
(2)
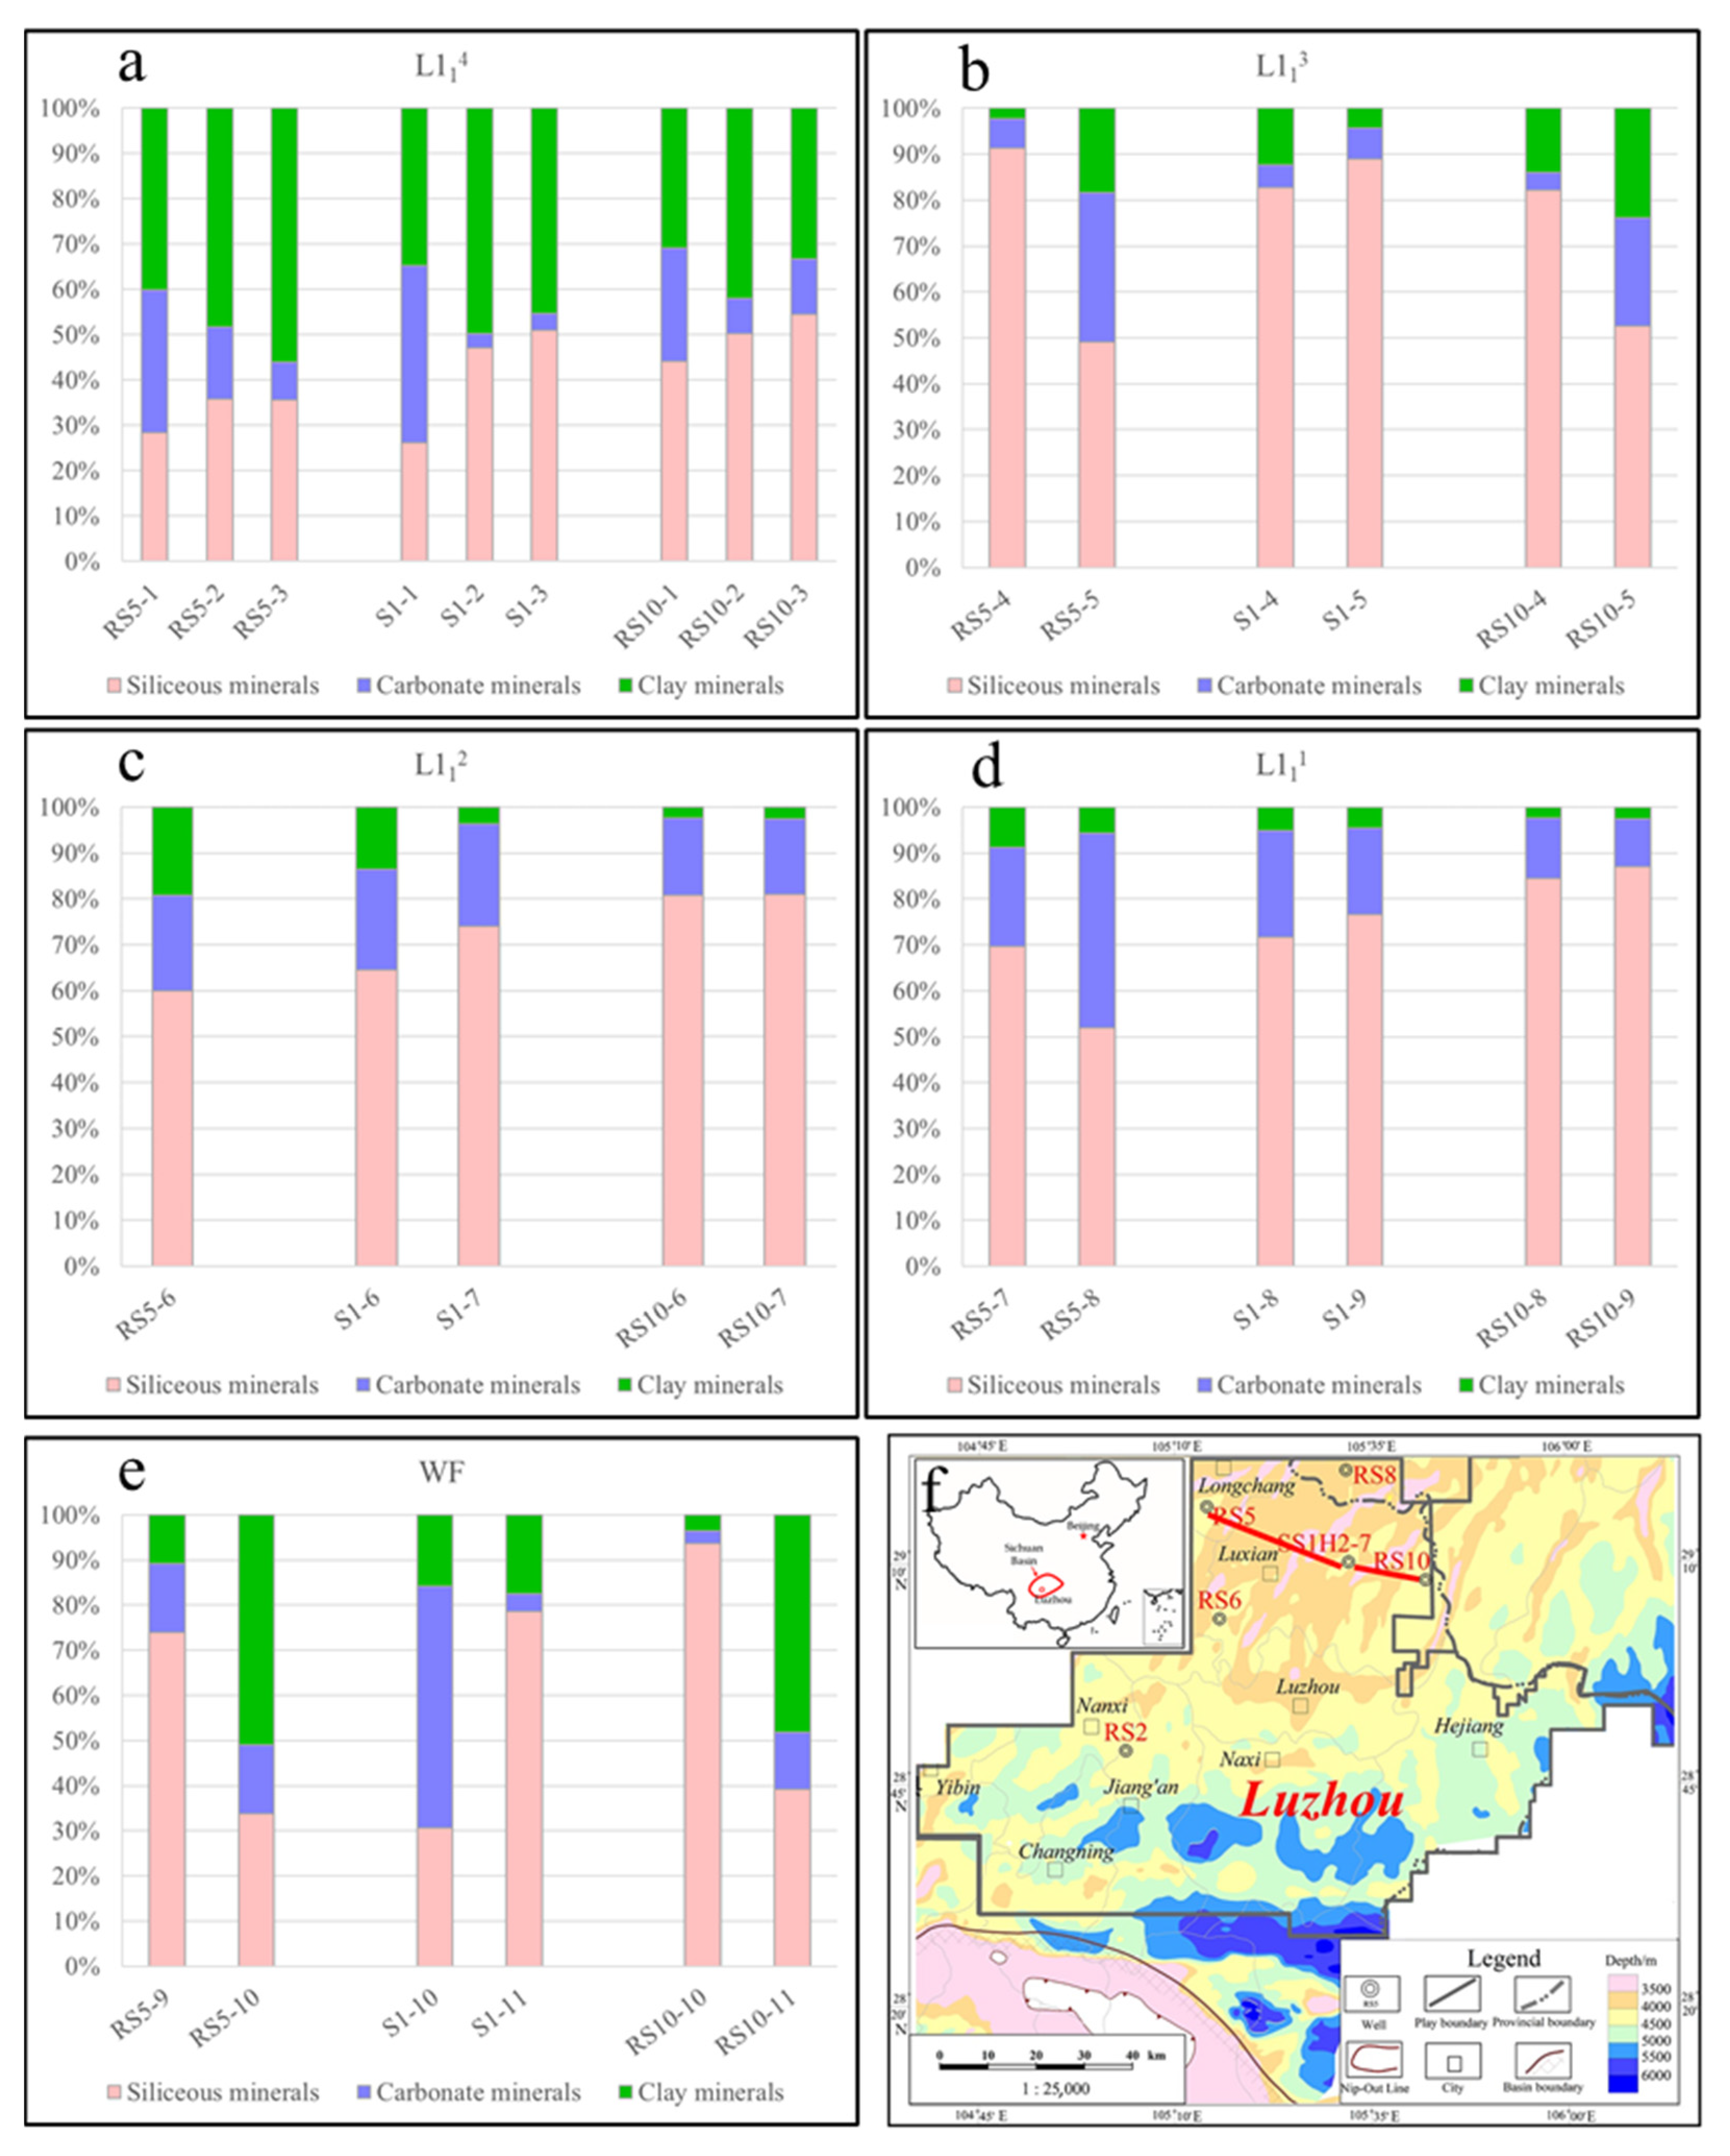
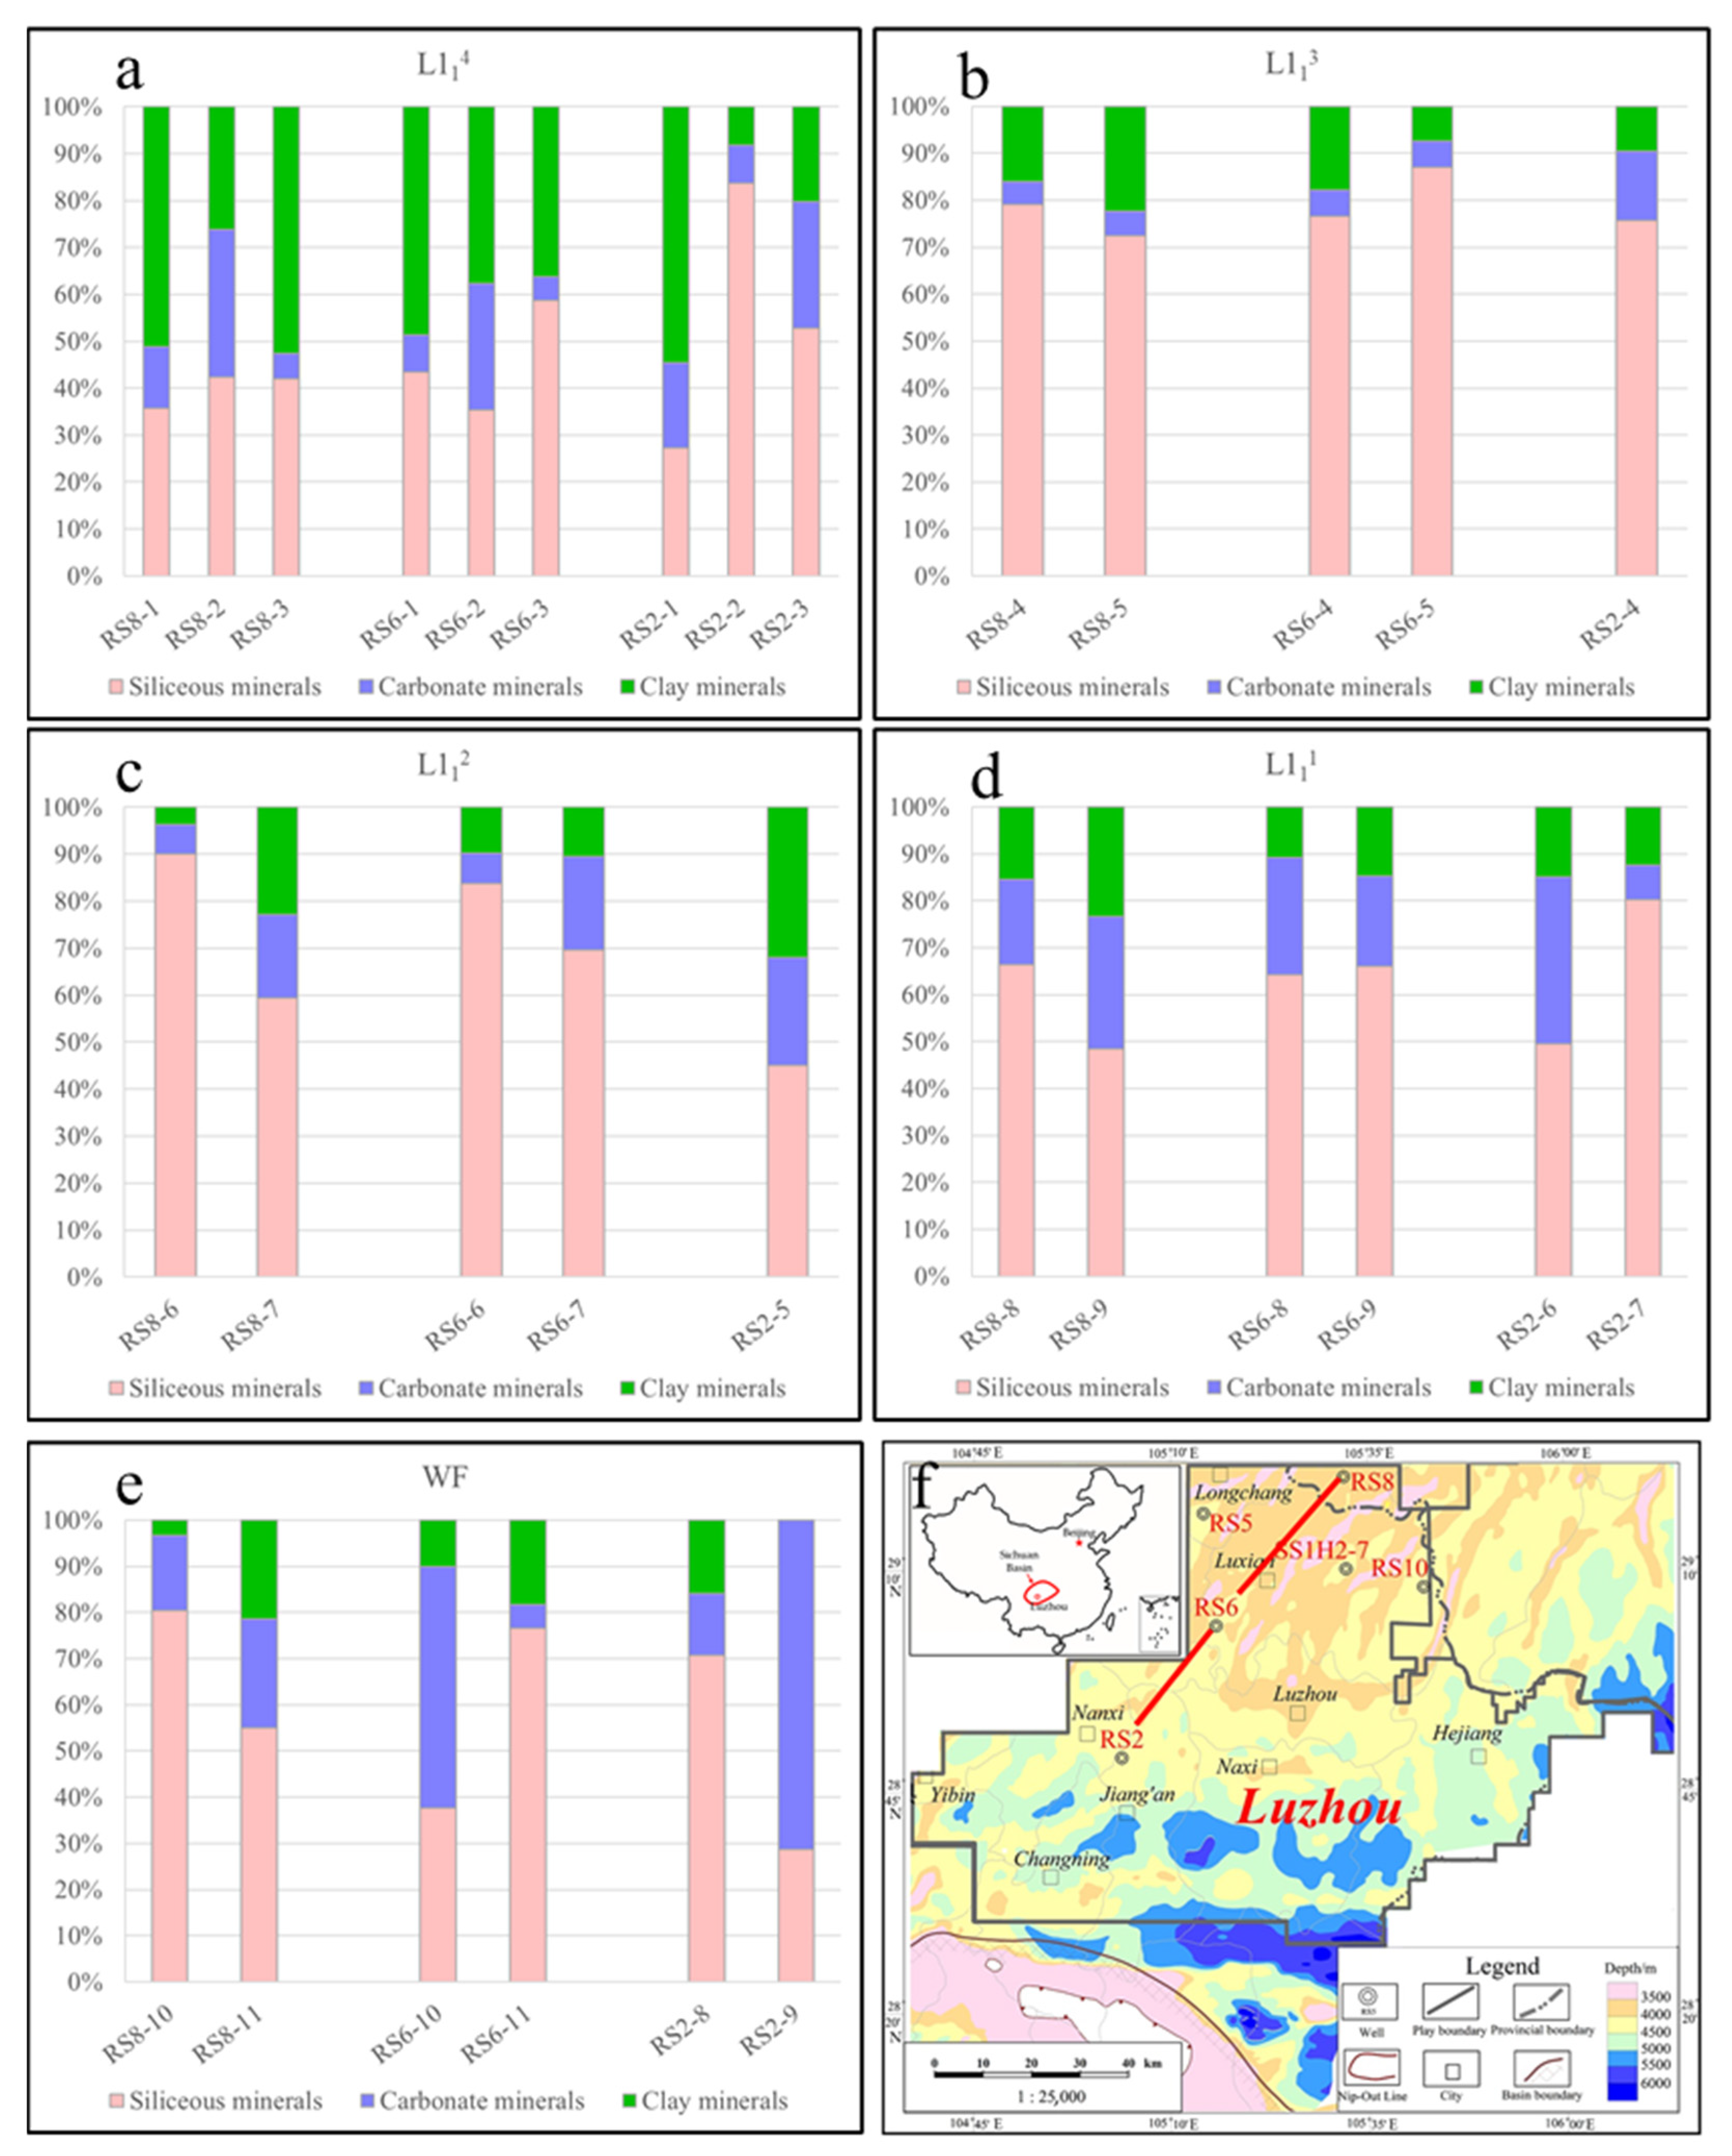
In the northern part of the study area, as depth increased in the northwest-to-southeast direction; there was a relative increase in the siliceous minerals and relative decrease in the clay minerals within the same sublayers. However, in the northeast-to-southwest direction, there was no obvious link between the mineral content within the same sublayers and the changing depth.
(3)
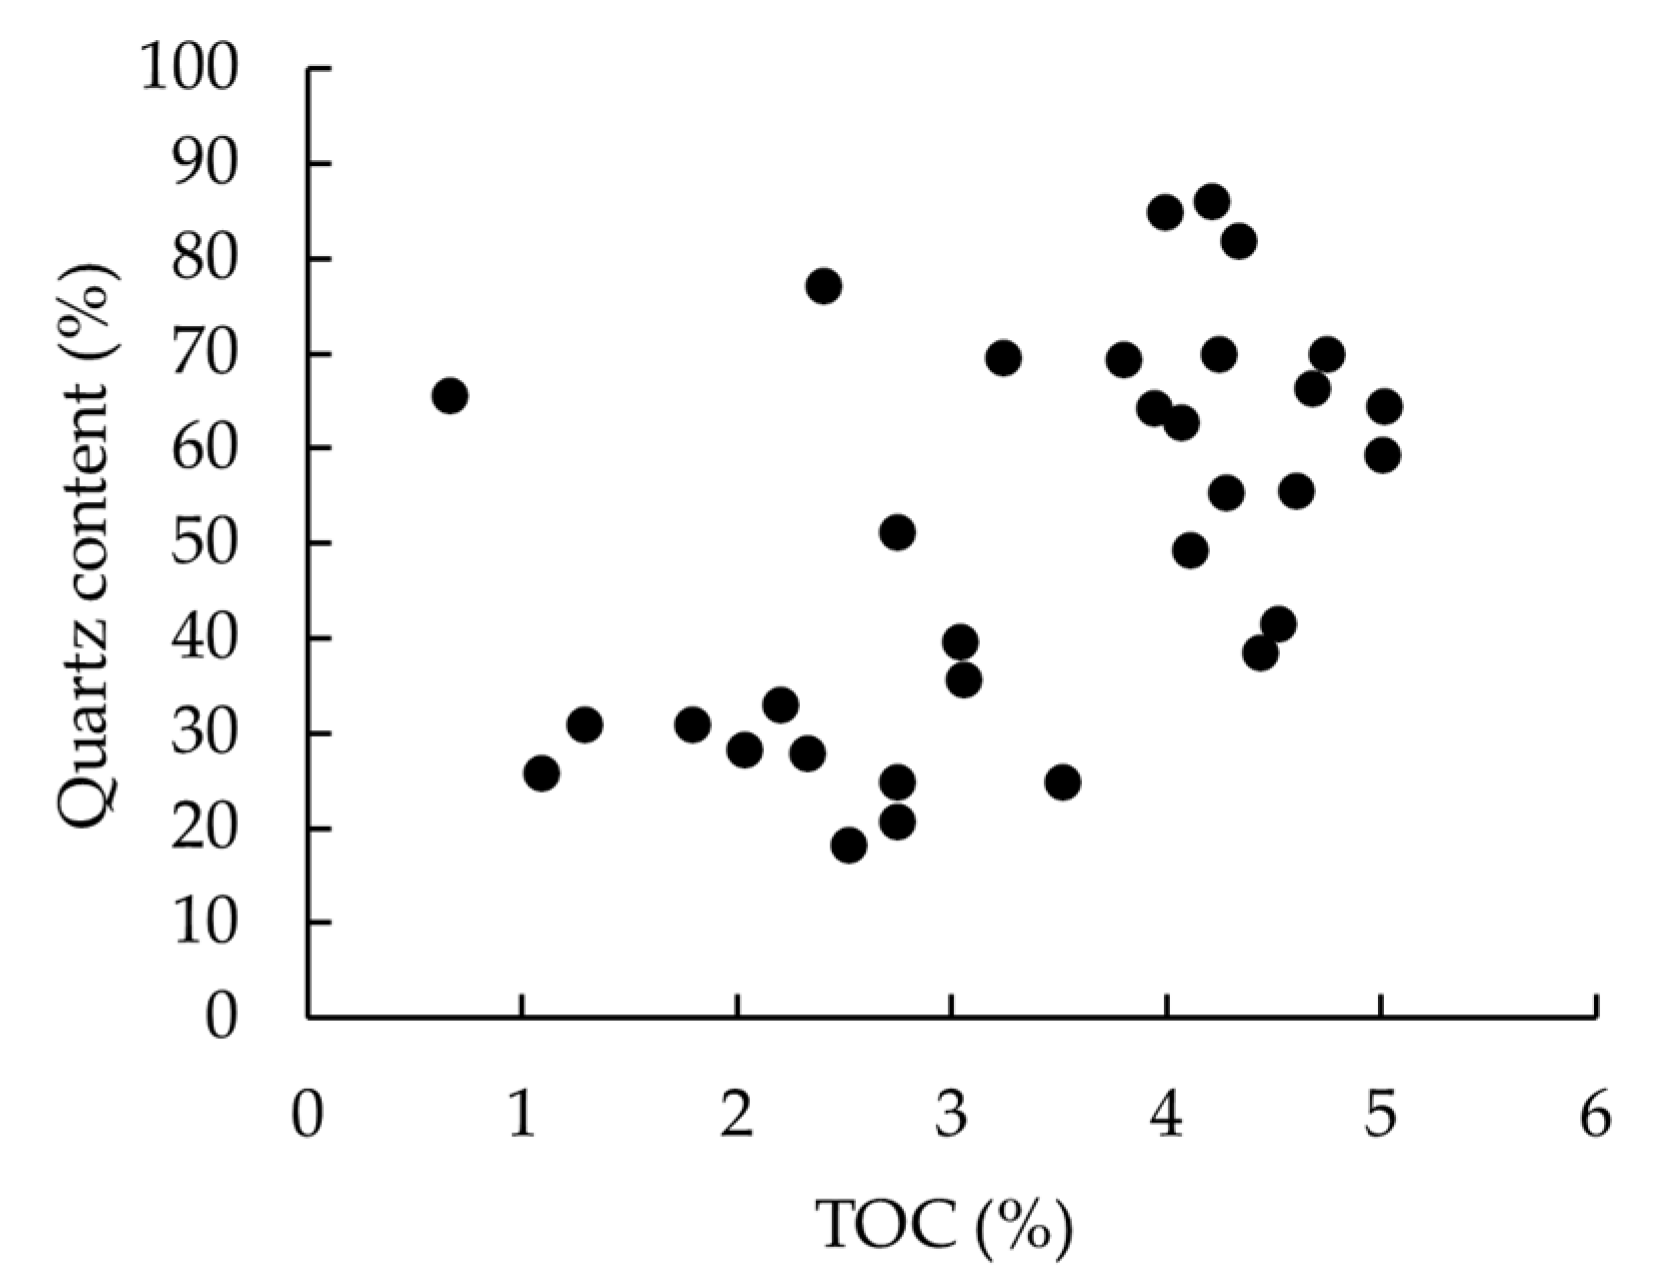
Quartz content and TOC showed a moderately positive correlation, which indicated that quartz found in this region was of biological origin; the sum content of siliceous minerals and carbonaceous minerals was positively correlated to BRIT in a moderate degree, respectively, in well SS1H2-7 and in the well group of RS8 and RS5, which indicated that, in general, siliceous minerals and carbonaceous minerals had a relatively active effect on reservoir compressibility.
(4)
Based on the mineralogical characteristics of the sublayers, reservoir types can be identified as the following four: Type I reservoirs had high brittleness and low plasticity, which are conducive to natural and artificial fracturing, and included the vast majority of L113, L112, and L111 samples, most of the WF samples, and a small number of the L114 samples. Type II is reservoirs were dominated by carbonate minerals, most of which were limestone strata in the Guanyinqiao member; the Type II reservoirs had less compressibility than the Type I reservoirs. Type III reservoirs had moderate brittleness and moderate compressibility. The L114 sublayer samples were mostly of this type. Type IV, which had low brittleness and high plasticity, also included a small number of WF samples. Reservoirs of this type portrayed low compressibility, known to hinder the development of hydraulic fracturing.
(5)
In the future, the origin of minerals, and the influence of mineral composition on rock mechanical parameters need to be further discussed.

Author Contributions

Conceptualization, H.Y., X.S. and J.W.; methodology, H.Y. and J.W.; software, W.W.; validation, C.L., W.W. and Y.L.; formal analysis, Y.H.; investigation, Y.L.; resources, H.Y.; data curation, K.Z.; writing—original draft preparation, H.Y.; writing—review and editing, J.W.; visualization, W.W.; supervision, J.W.; project administration, J.W.; funding acquisition, X.S. All authors have read and agreed to the published version of the manuscript.

Funding

This research was funded by Major Engineering Technology Field Test Project of China National Petroleum Corporation (Grant No. 2019F-31-01).

Data Availability Statement

The data presented in this study are partially available on request from the corresponding author.

Conflicts of Interest

The authors declare no conflict of interest.

References

  1. Zou, C.; Zhao, Q.; Cong, L.; Wang, H.; Shi, Z.; Wu, J.; Pan, S. Development progress, potential and prospect of shale gas in China. Nat. Gas Ind. 2021, 41, 1–14. [Google Scholar] [CrossRef]
  2. Jiang, T.; Bian, X.; Wang, H.; Li, S.; Jia, C.; Liu, H.; Sun, H. Volume fracturing of deep shale gas horizontal wells. Nat. Gas Ind. B 2017, 4, 127–133. [Google Scholar] [CrossRef]
  3. Liang, X.; Wang, L.; Zhang, J.; Xian, C.; Wang, G.; Zhao, C. 100% in the sweet section: An effective geosteering approach for silurian longmaxi shale play in Sichuan Basin. In Proceedings of the Society of Petroleum Engineers—SPE Asia Pacific Unconventional Resources Conference and Exhibition, Brisbane, QLD, Australia, 9–11 November 2015. [Google Scholar]
  4. Liu, J.; Yao, Y.; Liu, D.; Pan, Z.; Cai, Y. Comparison of three key marine shale reservoirs in the southeastern margin of the sichuan basin, SW china. Minerals 2017, 7, 179. [Google Scholar] [CrossRef] [Green Version]
  5. Li, H.; Tang, H.; Zheng, M. Micropore structural heterogeneity of siliceous shale reservoir of the longmaxi formation in the southern Sichuan basin, China. Minerals 2019, 9, 548. [Google Scholar] [CrossRef] [Green Version]
  6. Wang, X.; Jiang, Z.; Jiang, S.; Chang, J.; Zhu, L.; Li, X.; Li, J. Full-scale pore structure and fractal dimension of the Longmaxi shale from the southern Sichuan basin: Investigations using FE-SEM, gas adsorption and mercury intrusion porosimetry. Minerals 2019, 9, 543. [Google Scholar] [CrossRef] [Green Version]
  7. Xiong, J.; Liu, K.; Shi, C.; Liu, X.; Huang, L. Logging prediction and evaluation of fracture toughness for the shales in the Longmaxi Formation, Southern Sichuan Basin. Petroleum 2020, 7, 254–262. [Google Scholar] [CrossRef]
  8. Xu, Z.; Zheng, M.; Liu, Z.; Deng, J.; Li, X.; Guo, W.; Li, J.; Wang, N.; Zhang, X.; Guo, X. Petrophysical properties of deep Longmaxi Formation shales in the southern Sichuan Basin, SW China. Pet. Explor. Dev. 2020, 47, 1183–1193. [Google Scholar] [CrossRef]
  9. Ye, Y.; Tang, S.; Xi, Z. Brittleness evaluation in shale gas reservoirs and its influence on fracability. Energies 2020, 13, 388. [Google Scholar] [CrossRef] [Green Version]
  10. Dai, J.; Zou, C.; Dong, D.; Ni, Y.; Wu, W.; Gong, D.; Wang, Y.; Huang, S.; Huang, J.; Fang, C.; et al. Geochemical characteristics of marine and terrestrial shale gas in China. Mar. Pet. Geol. 2016, 76, 444–463. [Google Scholar] [CrossRef]
  11. Hu, H.; Hao, F.; Guo, X.; Yi, J.; Shu, Z.; Bao, H.; Zhu, X. Effect of lithofacies on the pore system of over-mature Longmaxi shale in the Jiaoshiba area, Sichuan Basin, China. Mar. Pet. Geol. 2019, 109, 886–898. [Google Scholar] [CrossRef]
  12. Wang, Z.; Chen, L.; Chen, D.; Lai, J.; Deng, G.; Liu, Z.; Wang, C. Characterization and evaluation of shale lithofacies within the lowermost Longmaxi-Wufeng Formation in the Southeast Sichuan Basin. J. Pet. Sci. Eng. 2020, 193, 107353. [Google Scholar] [CrossRef]
  13. Nie, H.; He, Z.; Liu, G.; Du, W.; Wang, R.; Zhang, G. Genetic mechanism of high-quality shale gas reservoirs in the Wufeng–LongmaxiFms in the Sichuan Basin. Nat. Gas Ind. B 2021, 8, 24–34. [Google Scholar] [CrossRef]
  14. Chen, S.; Zhu, Y.; Qin, Y.; Wang, H.; Liu, H.; Fang, J. Reservoir evaluation of the Lower Silurian Longmaxi Formation shale gas in the southern Sichuan Basin of China. Mar. Pet. Geol. 2014, 57, 619–630. [Google Scholar] [CrossRef]
  15. Jiang, Z.; Song, Y.; Tang, X.; Li, Z.; Wang, X.; Wang, G.; Xue, Z.; Li, X.; Zhang, K.; Chang, J.; et al. Controlling factors of marine shale gas differential enrichment in southern China. Pet. Explor. Dev. 2020, 47, 661–673. [Google Scholar] [CrossRef]
  16. Li, X.; Zhang, J.; Wang, Y.; Zhao, P.; Wang, Z.; Xu, H.; Wang, G.; Wang, F. Accumulation conditions of Lower Paleozoic shale gas from the southern Sichuan Basin, China. J. Nat. Gas Geosci. 2016, 1, 101–108. [Google Scholar] [CrossRef] [Green Version]
  17. Zhao, J.; Jin, Z.; Hu, Q.; Liu, K.; Jin, Z.; Hu, Z.; Nie, H.; Du, W.; Yan, C.; Wang, R. Mineral composition and seal condition implicated in pore structure development of organic-rich Longmaxi shales, Sichuan Basin, China. Mar. Pet. Geol. 2018, 98, 507–522. [Google Scholar] [CrossRef]
  18. Wu, J.; Yuan, Y.; Niu, S.; Wei, X.; Yang, J. Multiscale characterization of pore structure and connectivity of Wufeng-Longmaxi shale in Sichuan Basin, China. Mar. Pet. Geol. 2020, 120, 104514. [Google Scholar] [CrossRef]
  19. Wu, J.; Liang, C.; Yang, R.; Xie, J. The significance of organic matter–mineral associations in different lithofacies in the Wufeng and longmaxi shale-gas reservoirs in the Sichuan Basin. Mar. Pet. Geol. 2021, 126, 104866. [Google Scholar] [CrossRef]
  20. Xu, H.; Zhou, W.; Zhang, R.; Liu, S.; Zhou, Q. Characterizations of pore, mineral and petrographic properties of marine shale using multiple techniques and their implications on gas storage capability for Sichuan Longmaxi gas shale field in China. Fuel 2019, 241, 360–371. [Google Scholar] [CrossRef]
  21. Jiang, W.; Cao, G.; Luo, C.; Lin, M.; Ji, L.; Zhou, J. A composition-based model for methane adsorption of overmature shales in Wufeng and Longmaxi Formation, Sichuan Basin. Chem. Eng. J. 2022, 429, 130766. [Google Scholar] [CrossRef]
  22. Wang, G.; Jin, Z.; Liu, G.; Liu, Q.; Liu, Z.; Wang, H.; Liang, X.; Jiang, T.; Wang, R. Geological implications of gamma ray (GR) anomalies in marine shales: A case study of the Ordovician-Silurian Wufeng-Longmaxi succession in the Sichuan Basin and its periphery, Southwest China. J. Asian Earth Sci. 2020, 199, 104359. [Google Scholar] [CrossRef]
  23. Gou, Q.; Xu, S.; Hao, F.; Zhang, B.; Shu, Z.; Yang, F.; Wang, Y.; Li, Q. Quantitative calculated shale gas contents with different lithofacies: A case study of Fuling gas shale, Sichuan Basin, China. J. Nat. Gas Sci. Eng. 2020, 76, 103222. [Google Scholar] [CrossRef]
  24. Kang, Y.; Shang, C.; Zhou, H.; Huang, Y.; Zhao, Q.; Deng, Z.; Wang, H.; Ma, Y.Z. Mineralogical brittleness index as a function of weighting brittle minerals—From laboratory tests to case study. J. Nat. Gas Sci. Eng. 2020, 77, 103278. [Google Scholar] [CrossRef]
  25. Zhang, B.; Shan, B.; Zhao, Y.; Zhang, L. Review of formation and gas characteristics in shale gas reservoirs. Energies 2020, 13, 5427. [Google Scholar] [CrossRef]
  26. Hua, G.; Wu, S.; Jing, Z.; Yu, X.; Xu, K.; Shi, W.; Guan, M. Rock physical and chemical alterations during the in-situ interaction between fracturing fluid and Silurian organic-rich shales in China. J. Nat. Gas Sci. Eng. 2021, 94, 104075. [Google Scholar] [CrossRef]
  27. Levinthal, J.D.; Richards, B.; Snow, M.S.; Watrous, M.G.; McDonald, L.W. Correlating NORM with the mineralogical composition of shale at the microstructural and bulk scale. Appl. Geochem. 2017, 76, 210–217. [Google Scholar] [CrossRef]
  28. Iqbal, M.A.; Rezaee, R.; Smith, G.; Ekundayo, J.M. Shale lithofacies controls on porosity and pore structure: An example from Ordovician Goldwyer Formation, Canning Basin, Western Australia. J. Nat. Gas Sci. Eng. 2021, 89, 103888. [Google Scholar] [CrossRef]
  29. He, J.; Li, X.; Yin, C.; Zhang, Y.; Lin, C. Propagation and characterization of the micro cracks induced by hydraulic fracturing in shale. Energy 2020, 191, 116449. [Google Scholar] [CrossRef]
  30. Zhao, G.; Ding, W.; Sun, Y.; Wang, X.; Tian, L.; Liu, J.; Shi, S.; Jiao, B.; Cui, L. Fracture development characteristics and controlling factors for reservoirs in the Lower Silurian Longmaxi Formation marine shale of the Sangzhi block, Hunan Province, China. J. Pet. Sci. Eng. 2020, 184, 106470. [Google Scholar] [CrossRef]
  31. Du, J.; Whittle, A.J.; Hu, L.; Divoux, T.; Meegoda, J.N. Characterization of meso-scale mechanical properties of Longmaxi shale using grid microindentation experiments. J. Rock Mech. Geotech. Eng. 2021, 13, 555–567. [Google Scholar] [CrossRef]
  32. Li, G.; Li, G.; Wang, Y.; Qi, S.; Yang, J. A rock physics model for estimating elastic properties of upper Ordovician-lower Silurian mudrocks in the Sichuan Basin, China. Eng. Geol. 2020, 266, 105460. [Google Scholar] [CrossRef]
  33. Ma, Y.; Ardakani, O.H.; Zhong, N.; Liu, H.; Huang, H.; Larter, S.; Zhang, C. Possible pore structure deformation effects on the shale gas enrichment: An example from the Lower Cambrian shales of the Eastern Upper Yangtze Platform, South China. Int. J. Coal Geol. 2020, 217, 103349. [Google Scholar] [CrossRef]
  34. Zhang, L.; Xiao, D.; Lu, S.; Jiang, S.; Chen, L.; Guo, T.; Wu, L. Pore development of the Lower Longmaxi shale in the southeastern Sichuan Basin and its adjacent areas: Insights from lithofacies identification and organic matter. Mar. Pet. Geol. 2020, 122, 104662. [Google Scholar] [CrossRef]
  35. Chen, J.; Lan, H.; Macciotta, R.; Martin, C.D.; Wu, Y. Microfracture characterization of shale constrained by mineralogy and bedding. J. Pet. Sci. Eng. 2021, 201, 108456. [Google Scholar] [CrossRef]
  36. Jiarui, Z.; Jianting, X.; Shengming, J.; Shuai, T. Quantitative identification and distribution of quartz genetic types based on QemScan: A case study of Silurian Longmaxi Formation in Weiyuan area, Sichuan Basin. Pet. Res. 2021. [Google Scholar] [CrossRef]
  37. Roshani, M.; Sattari, M.A.; Muhammad Ali, P.J.; Roshani, G.H.; Nazemi, B.; Corniani, E.; Nazemi, E. Application of GMDH neural network technique to improve measuring precision of a simplified photon attenuation based two-phase flowmeter. Flow Meas. Instrum. 2020, 75, 101804. [Google Scholar] [CrossRef]
  38. Yang, H.; Zhao, S.; Liu, Y.; Wu, W.; Xia, Z.; Wu, T.; Luo, C.; Fan, T.; Yu, L. Main controlling factors of enrichment and high-yield of deep shale gas in the Luzhou Block, southern Sichuan Basin. Nat. Gas Ind. 2019, 39, 55–63. [Google Scholar] [CrossRef]
  39. Patzschke, M. Advanced Microanalysis with The QUANTAX System. Available online: https://www.bruker.com/en/news-and-events/webinars/2019/analytical-sem-solutions-for-geology-part-i.html (accessed on 22 November 2021).
  40. Gamero-Diaz, H.; Miller, C.; Lewis, R. sCore: A mineralogy based classification scheme for organic mudstones. In Proceedings of the Society of Petroleum Engineers—SPE Annual Technical Conference and Exhibition; OnePetro: Moscow, Russia, 2013; Volume 3, pp. 2465–2481. [Google Scholar]
Figure 1. Wufeng Formation (WF) basal depth map (a) and sublayer division scheme (b) in Luzhou shale play. AC means acoustic logging, DEN means density logging, APLC means near array porosity (limestone calibrated) logging.
Minerals 12 00020 g001
Figure 2. Schematic diagram of AMICS mineral analysis process (modified from Max Patzschke [39]).
Minerals 12 00020 g002
Figure 3. Mineral distribution map and mineral composition histogram of well RS5.
Minerals 12 00020 g003
Figure 4. Mineral distribution map and mineral composition histogram of well SS1H2-7.
Minerals 12 00020 g004
Figure 5. Mineral distribution map and mineral composition histogram of well RS10.
Minerals 12 00020 g005
Figure 6. Mineral distribution map and mineral composition histogram of well RS8.
Minerals 12 00020 g006
Figure 7. Mineral distribution map and mineral composition histogram of well RS6.
Minerals 12 00020 g007
Figure 8. Mineral distribution map and mineral composition histogram of well RS2.
Minerals 12 00020 g008
Figure 9. Histograms comparing the mineral composition of sublayers L114 (a), L113 (b), L112 (c), L111 (d), and WF (e) of the RS5, SS1H2-7 (abbreviated as S1), and RS10 wells and a schematic diagram of well locations (f).
Minerals 12 00020 g009
Figure 10. Histograms comparing the mineral composition of sublayers L114 (a), L113 (b), L112 (c), L111 (d), and WF (e) of the RS8, RS6, and RS2 wells and a schematic diagram of well locations (f).
Minerals 12 00020 g010
Figure 11. Scatter plot of quartz content and total organic carbon (TOC) of RS8, RS5, and SS1H2-7.
Minerals 12 00020 g011
Figure 12. Scatter plot of the sum content of siliceous minerals and carbonaceous minerals and brittleness index (BRIT) in well SS1H2-7 and in well group of RS8 and RS5.
Minerals 12 00020 g012
Figure 13. Ternary lithofacies diagram of Wufeng-Longmaxi shale samples in Luzhou shale play (Modified from Gamero-Diaz [40]).
Minerals 12 00020 g013
Table 1. BRIT, TOC, U/Th data from well logging of RS5, SS1H2-7, and RS8.
WellSample IDDepthSublayerBRITTOC(%)U/Th
RS5RS5-13982.99L11457.5282.7450.49
RS5-23994.75L11463.9382.331.04
RS5-34015.52L11459.4652.7450.62
RS5-44025.28L11369.0954.2131.22
RS5-54027.35L11374.7944.4411.45
RS5-64029.17L11282.0514.2821.34
RS5-74031.74L11174.3025.0191.90
RS5-84032.2L11168.6974.5252.36
RS5-94033.64WF70.8483.9440.70
RS5-104040.88WF70.4511.0880.10
SS1H2-7S1-14105.64L11432.5132.5250.86
S1-24109.49L11435.8972.2011.17
S1-34113.67L11453.4743.0610.79
S1-44141.59L11351.9453.8021.30
S1-54144.35L11359.0624.3371.27
S1-64146.42L11266.484.6081.34
S1-74149.27L11269.4464.751.72
S1-84151.25L11151.7714.6793.22
S1-94151.64L11156.9614.2422.44
S1-104152.45WF59.7873.5190.69
S1-114154.77WF55.2690.6670.47
RS8RS8-13792.3L11456.0052.0340.44
RS8-23796.23L11463.3951.2910.13
RS8-33800.85L11454.6911.7940.58
RS8-43835.18L11359.7943.2440.84
RS8-53836.96L11370.4514.0731.69
RS8-63839.13L11264.8713.9911.94
RS8-73838.37L11274.6624.1121.37
RS8-83840.1L11170.3145.0112.55
RS8-93841.13L11174.673.0371.71
RS8-103843.27WF83.3942.4030.19
RS8-113847.28WF79.212.7490.21
Table 2. Quantitative results of mineral composition of shale samples by AMICS. -: no number.
WellSample IDDepth
(m)
SublayerQtz
(%)
Fsp
(%)
Cal
(%)
Dol
(%)
Ank
(%)
Ill
(%)
Chl
(%)
Py
(%)
Siliceous Minerals
(%)
Carbonate
Minerals
(%)
Clay
Minerals
(%)
RS5RS5-13982.99L11420.705.0010.599.138.6036.000.309.6728.4631.3540.19
RS5-23994.75L11427.897.025.694.065.7544.472.702.4135.7715.8948.34
RS5-34015.52L11424.809.343.152.462.3751.602.224.0735.588.3256.10
RS5-44025.28L11386.102.993.051.941.142.020.312.4591.336.282.39
RS5-54027.35L11338.504.0011.4512.863.7415.620.3313.4949.1232.4318.44
RS5-64029.17L11255.303.907.9512.460.0018.910.081.4160.0520.7019.26
RS5-74031.74L11164.373.496.5613.611.018.290.192.4869.5821.728.70
RS5-84032.20L11141.478.779.9415.0916.215.080.333.1151.8642.565.58
RS5-94033.64WF64.237.5312.441.371.089.840.572.9473.9315.3510.72
RS5-104040.88WF25.787.917.640.377.1846.874.010.2433.7815.2251.00
SS1H2-7S1-14105.64L11418.267.4814.6010.0913.5827.576.471.9526.2539.0434.72
S1-24109.49L11432.9312.871.940.640.5742.635.742.6947.073.2349.70
S1-34113.67L11435.6012.892.020.620.8738.694.504.8250.943.6845.38
S1-44141.59L11369.378.971.711.061.829.022.755.2982.724.8512.43
S1-54144.35L11381.834.932.592.271.803.091.142.3488.856.824.34
S1-64146.42L11255.496.309.836.914.179.403.584.3264.5721.8513.57
S1-74149.27L11269.912.559.166.645.901.991.672.1974.0822.183.74
S1-84151.25L11166.393.896.3610.436.062.792.221.8671.6223.285.10
S1-94151.64L11169.983.3212.072.913.022.871.544.2976.5818.814.61
S1-104152.45WF24.904.7833.2215.283.3410.594.843.0630.6153.4815.91
S1-114154.77WF65.6312.160.982.030.9613.793.490.9578.544.0117.45
RS10RS10-14232.89L11430.3611.9314.970.008.9221.807.914.1244.1024.9230.98
RS10-24244.89L11437.1111.555.050.022.4834.486.303.0150.177.7942.04
RS10-34260.49L11437.2814.854.870.016.8324.497.304.3654.5012.2533.25
RS10-44272.53L11367.869.471.830.721.0810.822.445.8082.093.8514.07
RS10-54276.4L11340.057.659.009.992.5017.883.759.1752.5223.6623.82
RS10-64277.35L11277.582.376.036.584.141.490.840.9780.7316.912.35
RS10-74278.84L11277.562.639.194.202.891.570.891.0681.0616.462.49
RS10-84280.94L11180.443.208.541.882.631.540.790.9884.4713.182.35
RS10-94281.46L11183.143.236.821.541.951.740.730.8587.1110.402.49
RS10-104282.92WF87.214.560.690.741.302.510.942.0593.702.783.52
RS10-114284.98WF29.0210.027.971.213.3938.0010.030.3739.1812.6248.21
RS2RS2-14245.04L11418.668.1012.863.041.9051.561.872.0127.3218.1654.53
RS2-24273.44L11431.4049.155.012.870.004.853.023.7083.658.188.16
RS2-34285.04L11416.9034.911.044.7020.8517.772.101.7352.7227.0520.23
RS2-44312.09L11362.7510.694.695.244.429.140.182.9075.6314.779.59
RS2-54317.16L11237.225.479.075.257.3730.200.145.2945.0722.8932.04
RS2-64318.92L11144.534.0112.5421.151.1814.470.122.0049.5335.5814.89
RS2-74322.26L11174.104.753.642.670.9811.870.241.7580.257.4212.33
RS2-84325.94WF65.664.066.122.334.7315.350.381.3770.6913.3615.95
RS2-94328.55WF24.533.7243.7926.590.000.010.091.2628.6171.290.10
RS6RS6-13983.90L11431.839.883.922.571.2143.213.463.9143.418.0248.57
RS6-23987.57L11426.957.254.236.7215.3228.487.973.0735.2927.1037.61
RS6-34008.06L11441.9514.691.870.822.2229.055.973.4258.655.0936.26
RS6-44027.42L11363.378.851.192.731.3414.482.445.6076.505.5717.93
RS6-54031.49L11377.665.751.252.751.246.171.024.1687.035.467.51
RS6-64033.08L11274.315.881.952.771.458.311.044.2883.776.469.77
RS6-74037.69L11261.575.047.997.543.438.491.634.3269.6119.8110.57
RS6-84039.42L11156.076.3613.888.451.859.221.232.9564.3224.9110.78
RS6-94039.94L11155.498.149.647.111.8212.401.823.5865.9919.2614.75
RS6-104041.15WF30.696.0433.4114.253.528.541.262.3037.6052.3710.03
RS6-114047.45WF67.408.421.402.351.3214.583.441.1076.665.1218.22
RS8RS8-13792.30L11428.246.344.821.246.6145.683.733.3435.7713.1251.11
RS8-23796.23L11430.8510.8514.6911.095.1721.694.151.5042.3431.4326.24
RS8-33800.85L11430.869.702.002.191.0247.842.893.5042.035.4052.57
RS8-43835.18L11369.495.581.400.552.6413.262.075.0179.034.8316.14
RS8-53836.96L11362.806.122.021.361.7119.601.624.7672.365.3522.29
RS8-63838.37L11284.892.292.530.652.912.750.883.1089.976.283.75
RS8-73839.13L11249.207.665.0211.480.5220.980.854.2959.4117.7922.80
RS8-83840.10L11159.274.804.9212.080.6114.580.283.4666.3718.2415.39
RS8-93841.13L11139.686.8316.906.354.0217.754.683.7948.3428.3523.31
RS8-103843.27WF77.122.4610.702.892.342.650.701.1580.4916.113.39
RS8-113847.28WF51.163.193.9711.368.0116.604.661.0554.9323.5921.49
AVG---51.337.917.885.593.7917.762.493.2462.4917.2620.25
Table 3. Spearman rho rs and p-value of different variables.
Variablesrsp-Value
TOC—quartz content of RS8, RS5 and SS1H2-70.510.002
BRIT—∑Si + Ca * of RS8, RS5 and SS1H2-70.240.183
BRIT—∑Si + Ca of RS8, and RS50.430.049
BRIT—∑Si + Ca of SS1H2-70.580.050
BRIT—∑Si + Ca of RS80.500.117
BRIT—∑Si + Ca of RS50.330.346
* the sum content of siliceous minerals and carbonaceous minerals.
Publisher’s Note: MDPI stays neutral with regard to jurisdictional claims in published maps and institutional affiliations.

