Article

Clay–Magnetite Co-Aggregates for Efficient Magnetic Removal of Organic and Inorganic Pollutants

INQUISUR, Departamento de Química, Universidad Nacional del Sur (UNS)-CONICET, 8000 Bahía Blanca, Argentina
*
Author to whom correspondence should be addressed.
Minerals 2021, 11(9), 927; https://doi.org/10.3390/min11090927
Submission received: 23 July 2021 / Revised: 15 August 2021 / Accepted: 25 August 2021 / Published: 27 August 2021

Abstract

:
This work reports the behavior of montmorillonite–magnetite mixtures of varying composition in aqueous dispersions and evaluates their adsorbing properties using a cationic organic pollutant, methylene blue (MB+), and an anionic inorganic pollutant, arsenate (As(V)), as the adsorbing species. The effects of the presence of montmorillonite on the As(V) adsorption by magnetite and the effects of magnetite on the MB+ adsorption by the clay were specially addressed. The simple mixture of a montmorillonite dispersion with a magnetite dispersion led to the spontaneous formation of montmorillonite–magnetite co-aggregates. These co-aggregates showed a unimodal electrophoretic mobility distribution, with no evidence of the presence of separate populations of montmorillonite or magnetite. The application of a magnetic field confirmed the formation of co-aggregates and showed that their separation rate increased as the magnetite content increased. Adsorption studies as a function of the aggregate composition demonstrated that MB+ uptake was mainly controlled by the content of montmorillonite, while As(V) adsorption was mainly controlled by the content of Fe3O4. This permits an easy tuning of the adsorbing properties of cations and anions by controlling the composition of the system.

1. Introduction

Extensive research has been carried out in the field of environmental remediation in the last decades, aiming to develop efficient, economical, and versatile water remediation technologies. In this context, magnetic separation has been applied recently in many areas for preconcentration and quantification in analytical chemistry [1,2], to capture and separate pollutants from aqueous environments [3,4], and to adsorb and degrade undesired substances [5]. These technologies are inexpensive, reliable, fast, and durable to treat wastewater and, if well adapted, would allow to remove specific contaminants from water. Therefore, magnetic modification of inexpensive adsorbents, such as clays, can lead to the formation of magnetic particles that can be easily and rapidly removed from solutions by applying an external magnetic field [5,6], capturing organic and inorganic pollutants.
Clays, such as montmorillonite, have been used since the beginning of civilization and have maintained their position among the most important industrial raw materials since then. They are well known as adsorbents not only of heavy metals, but also of drugs, pesticides, organic matter, etc. [7,8,9,10,11] On the other hand, magnetic nanoparticles, such as Fe3O4, have generated considerable repercussion in adsorption technologies and, consequently, in the remediation field [12,13], due to their stability, large surface area, high number of surface active sites, and, unlike montmorillonite which is paramagnetic, the particular advantage of being able to be separated by applying an external magnetic field.
Montmorillonite and magnetite surfaces behave differently in aqueous media. In the case of montmorillonite, most of the surface contains siloxane groups, which are not involved in protonation–deprotonation reactions. Therefore, the charge of montmorillonite particles is dominated by negative structural charges, arising from isomorphic substitutions, making montmorillonite a good adsorbent of cationic species through a cation exchange mechanism. In the case of magnetite, surface hydroxyl groups coordinated to Fe(III) and Fe(II) ions at the surface have the capacity to protonate or deprotonate depending on the pH, resulting in positive charges at low pH and negative charges at high pH. In addition, these hydroxyl groups can be exchanged by anionic ligands such as arsenate; thus, magnetite can adsorb anionic moieties via a ligand exchange mechanism.
The differences in the surface properties of both solids indicate that the preparation of aggregates consisting of a mixture of montmorillonite and magnetite particles will lead to a system with the capacity to adsorb cationic and anionic pollutants, whether organic or inorganic. Furthermore, the presence of magnetite in each aggregate will impart magnetic properties to them, enabling the separation of the aggregates with an external magnetic field, making them extremely useful in adsorption and remediation processes.
Currently, there are works in the literature where the properties of the montmorillonite–magnetite system have been explored. Galindo-Gonzales et al. [14] synthesized magnetite-covered clay particles in aqueous medium, but they did not carry out adsorption studies. The work focused on the sedimentation behavior of monodisperse magnetic particles, for application in the formulation of magnetorheological fluids. Mamedov et al. [15] synthesized thin films of magnetite–montmorillonite and polyelectrolytes, as well as measured their optical and magnetic properties, but they did not carry out adsorption studies. Yuan et al. [16] and Larraza et al. [17] were seemingly the first to specifically show adsorption studies of an anion (chromate) in montmorillonite–magnetite composite systems, demonstrating their good adsorbent properties. Some works in which clay–magnetite nanoparticle systems [18] were used as enzyme support have also been published [19], while others reported their good cation adsorption properties using Ni2+, Cu2+, Cd2+, and Zn2+ [20].
Most of the studies dealing with adsorption using clay–magnetite systems focused on studying the adsorption of a particular species, whether anionic or cationic. There are no reports in the literature exploring the ability of these systems to adsorb both anions and cations. Such a kind of adsorbent would be technologically sound, since the same solid will be capable of removing a great variety of pollutants.
The aim of this work was to evaluate the adsorptive properties of montmorillonite–magnetite co-aggregates, prepared in different proportions of clay and oxide. A well-known cationic die, methylene blue (MB+), and well-known anionic species such as As(V) species in aqueous media were used to test the properties of the adsorbents. The electrokinetic and magnetic properties of the co-aggregates are also reported. The effects of the presence of one solid on the adsorptive properties of the other solid in the co-aggregates were evaluated.

2. Materials and Methods

2.1. Materials

FeCl2·4H2O, FeCl3·6H2O, K2HAsO4·7H2O, and methylene blue (in a chloride salt form) were obtained from Merck (Germany). KCl, KOH, and HCl were purchased from Anhedra (Argentina). All chemicals were of analytical grade and were used as received. Double-distilled water was used in all cases.
The montmorillonite (Mt) studied in this work came from the Northern Patagonia, in Argentina. Lombardi et al. [21] described its chemical composition and physicochemical properties (identified as sample 4 in the article). The material, mostly composed of montmorillonite (98% purity), with low amounts of gypsum and quartz, presented a cation exchange capacity (CEC) of 0.96 meq·g−1 (measured using the standard ammonium acetate method) and a specific surface area of 738 m2·g−1 (determined by water adsorption) [21]. Particles with nominal diameter <2 μm were obtained by sedimentation, and a homoionic Na–montmorillonite was prepared by dispersing suitable amounts of the solid several times in a 1 M NaCl solution. Afterward, the sample was washed with 0.01 M NaCl (successive centrifugal treatments) until the conductivity of the supernatant was equal to that of the washing solution. A final stock suspension of 12.8 g·L−1 was obtained after these treatments.
The magnetic particles (Fe3O4) were synthesized via chemical coprecipitation, as indicated elsewhere [22]. A stock suspension was also prepared after synthesis and washing, with a concentration of 7.52 g·L−1. The physicochemical and adsorptive properties of the studied Fe3O4 particles were reported in a previous publication [22]. They showed superparamagnetic properties, spherical shape, and an average size of 12 nm.
From the montmorillonite and magnetite stock suspensions, a series of montmorillonite–magnetite mixtures (Mt–Fe3O4) were prepared. The following mass fractions (F) were obtained: 0.20, 0.27, 0.44, 0.60, and 0.85, defining this relationship as
F   =   m Fe 3 O 4 m Mt + m Fe 3 O 4 ,
where m Fe 3 O 4 and m Mt are the masses in grams of magnetite and montmorillonite, respectively. The different Mt–Fe3O4 mixtures, with a concentration of 5.0 g·L−1, were kept in suspension at room temperature. These mixtures are called Mt–Fe3O4 (F), using the corresponding value of F within parentheses.

2.2. XRD, FT-IR, and Zeta Potential

The pure solids and the mixtures were examined by XRD using a Rigaku D-Max III−C instrument equipped with a Cu-Kα1 (λ = 1.54059 Å) source and a graphite monochromator operated at 35 kV and 15 mA over the 2θ range 3–80° at a scan rate of 0.02° (2θ) s−1.
FT-IR spectra of all samples were recorded with a Nicolet FT-IR Nexus 470 spectrophotometer in the range 400–4000 cm−1 using the KBr pellet technique.
The electrophoretic mobilities at 25 °C of Mt, Fe3O4, and Mt–Fe3O4 mixtures were measured using a Malvern Zetasizer Nano ZS 90 equipment. The zeta potential (ζ) was automatically calculated with the classic Smoluchowski equation. Studies were performed as a function of pH using 0.01 M KCl as supporting electrolyte. For each sample, 50 mL of a 0.1 g·L−1 suspension in 0.01 M KCl were placed in a reaction cell, under continuous stirring. The pH was lowered to a value around 3.5 with HCl, and N2 was bubbled for 30 min. Once the suspension was stabilized, ζ was measured. The pH was then increased with small additions of KOH, and ζ was again measured. This procedure was repeated until the pH was around 9.5.
For selected cases, the zeta potential distribution was measured. This is important for mixtures because the obtained distribution can give valuable information regarding the presence of one, two, or even more populations of particles or aggregates with different electrokinetic properties. During a default ζ measurement, the equipment determined two outcomes in separate. On the one hand, the mean value of ζ was obtained from a fast field reversal measurement. On the other hand, the ζ distribution was obtained from the combination of slow and fast field reversal application. In this way, the zeta potential distribution is an interpretation of potential contributions from differently charged particles that could have contributed to the result.

2.3. Adsorption Studies

Adsorption studies were performed with Mt, Fe3O4, and Mt–Fe3O4 mixtures. MB+ and As(V) adsorption isotherms were carried out at pH 7 in 0.01 M KCl using 15 mL polyethylene centrifuge tubes. For the case of MB+ adsorption on Mt, 0.100 mL of the montmorillonite stock suspension ( m Mt = 1.28 × 10⁻³ g) was mixed with the desired volume of 0.001 M MB+, and then 0.01 M KCl was added to reach a final volume of 10 mL. For the case of As(V) adsorption on Mt, an analogous procedure was followed, but using the desired volumes of a 0.001 M As(V) solution. The final volume was also set to 10 mL with 0.01 M KCl. The same procedure was applied for the cases of MB+ and As(V) adsorption on Fe3O4. In these cases, 1.00 mL of the Fe3O4 stock suspension ( m F e 3 O 4   =   7.52 × 10⁻³ g) was used, and varying volumes of either 0.001 M MB+ (from 0.100 a 2.00 mL) or 0.001 M As(V) (from 0.100 to 2.00 mL) were added.
In order to investigate the effect of the composition of Mt–Fe3O4 mixtures (different F values) on MB+ and As(V) adsorption, two sets of tubes were prepared. In the first case, centrifuge tubes containing a constant amount of Mt ( m Mt   =   1.28 × 10⁻³ g) and increasing amounts of Fe3O4 stock suspension, yielding the F values of 0 (pure Mt), 0.20, 0.27, 0.44, 0.60, 0.85, and 1 (pure Fe3O4), were sonicated for 5 min. Later, a fixed amount of MB+ (2.00 mL of 0.001 M solution) was added to each tube. In the second case, centrifuge tubes containing a constant amount of Fe3O4 ( m F e 3 O 4   =   7.52 × 10⁻³ g) and increasing amounts of Mt stock suspension were also sonicated for 5 min, and a fixed amount of As(V) (1.60 mL of 0.001 M solution) was added. In both sets of tubes, the final volume was set to 10.00 mL with 0.01 M KCl.
Lastly, three mixtures were selected to perform adsorption isotherms: Mt–Fe3O4(0.20), Mt–Fe3O4(0.60), and Mt–Fe3O4(0.85), where the values within parentheses denote the value of F in each mixture. The pH was 7, the final volume was 10 mL, and the ionic strength was controlled by 0.01 M KCl. The operational conditions concerning these isotherms are detailed in the Supplementary Materials (Tables S1–S6).
In all the adsorption experiments previously described, the tubes were shaken for 24 h and centrifuged, and the concentration of MB+ or As(V) remaining in the supernatant was quantified. The adsorbed amount was calculated from the difference between the initial concentration and the concentration that remained in the supernatant. MB+ was spectrophotometrically measured by recording the UV/vis spectra in the 200−800 wavelength range reading the absorbance at 664 nm [23]. Arsenate was quantified by the spectrophotometric molybdenum blue method validated by Lenoble et al. [24] for arsenic species in aqueous media.

3. Results and Discussion

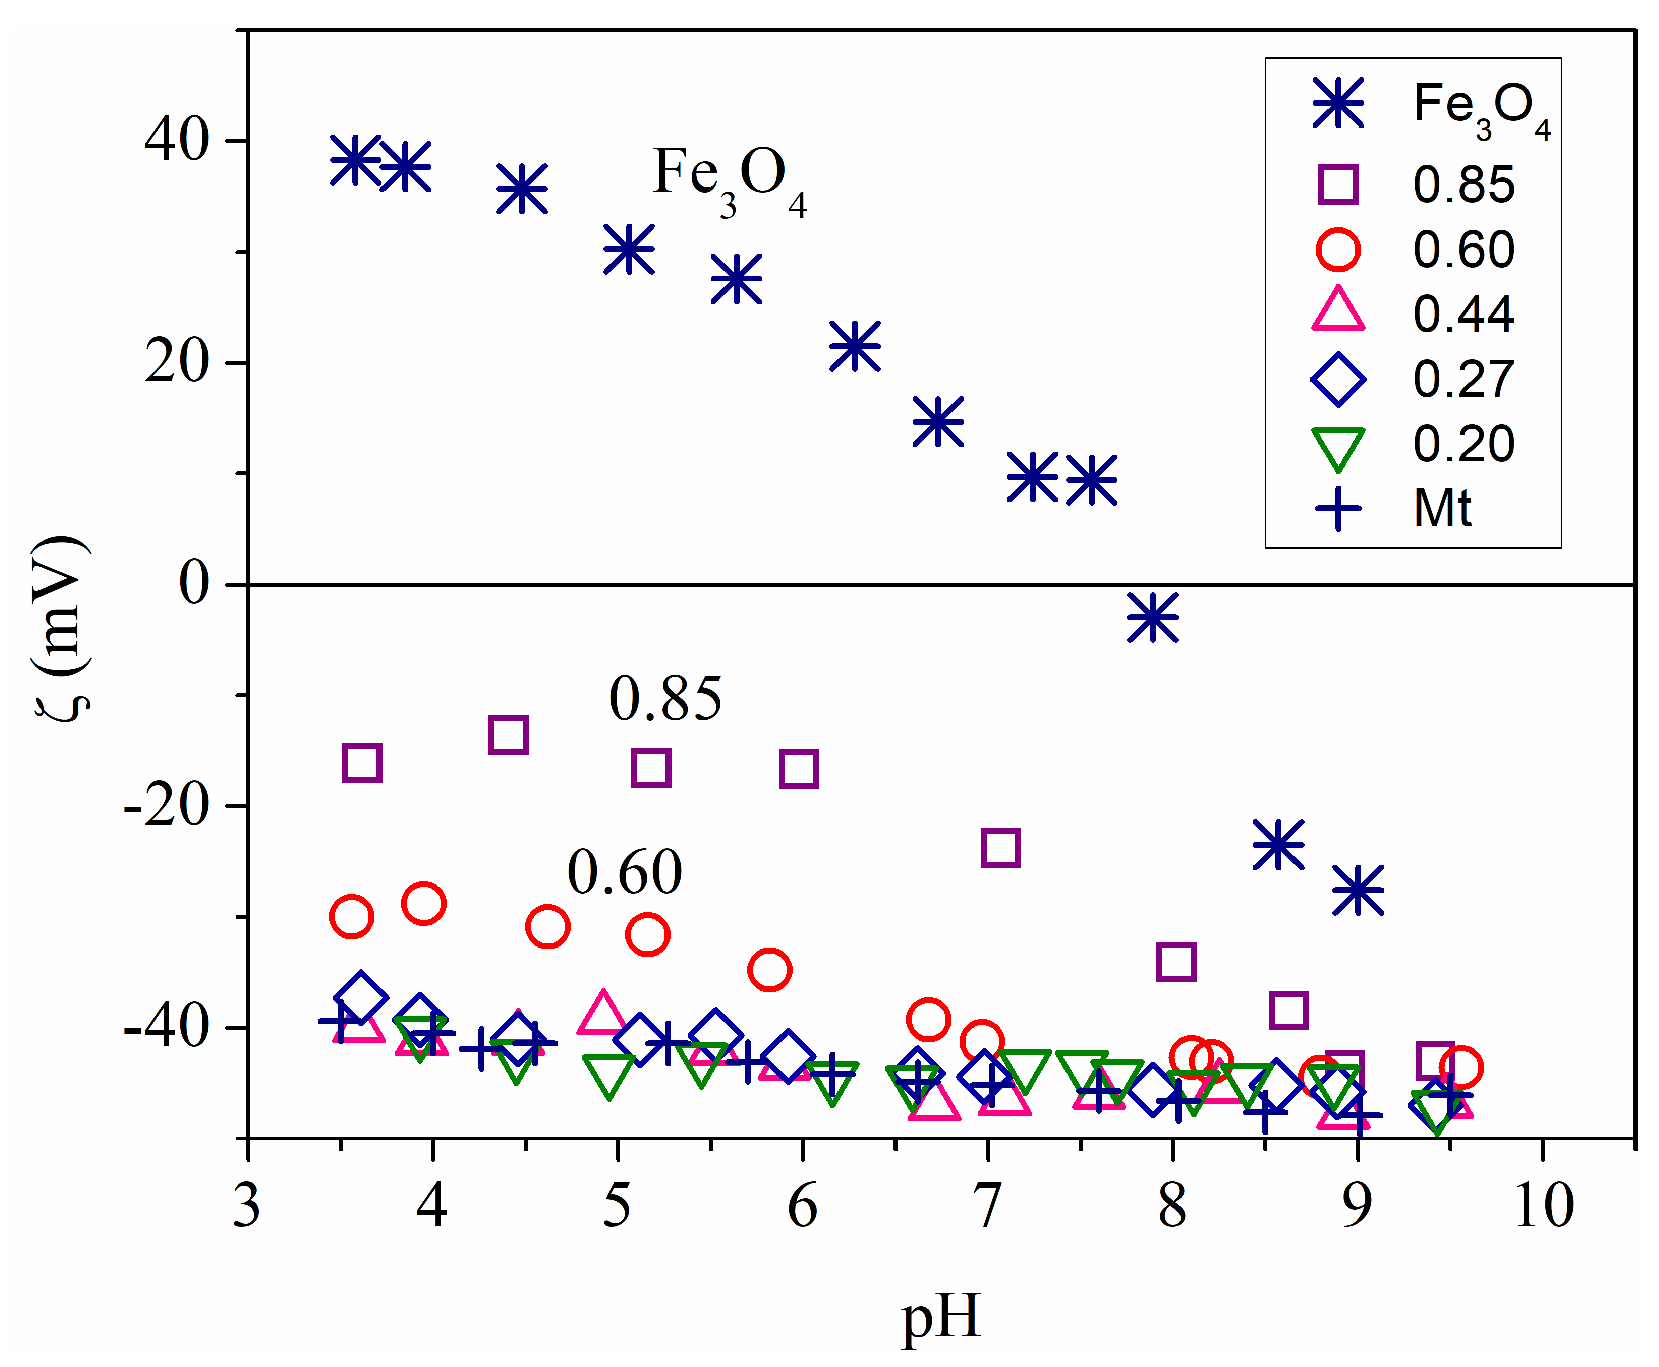
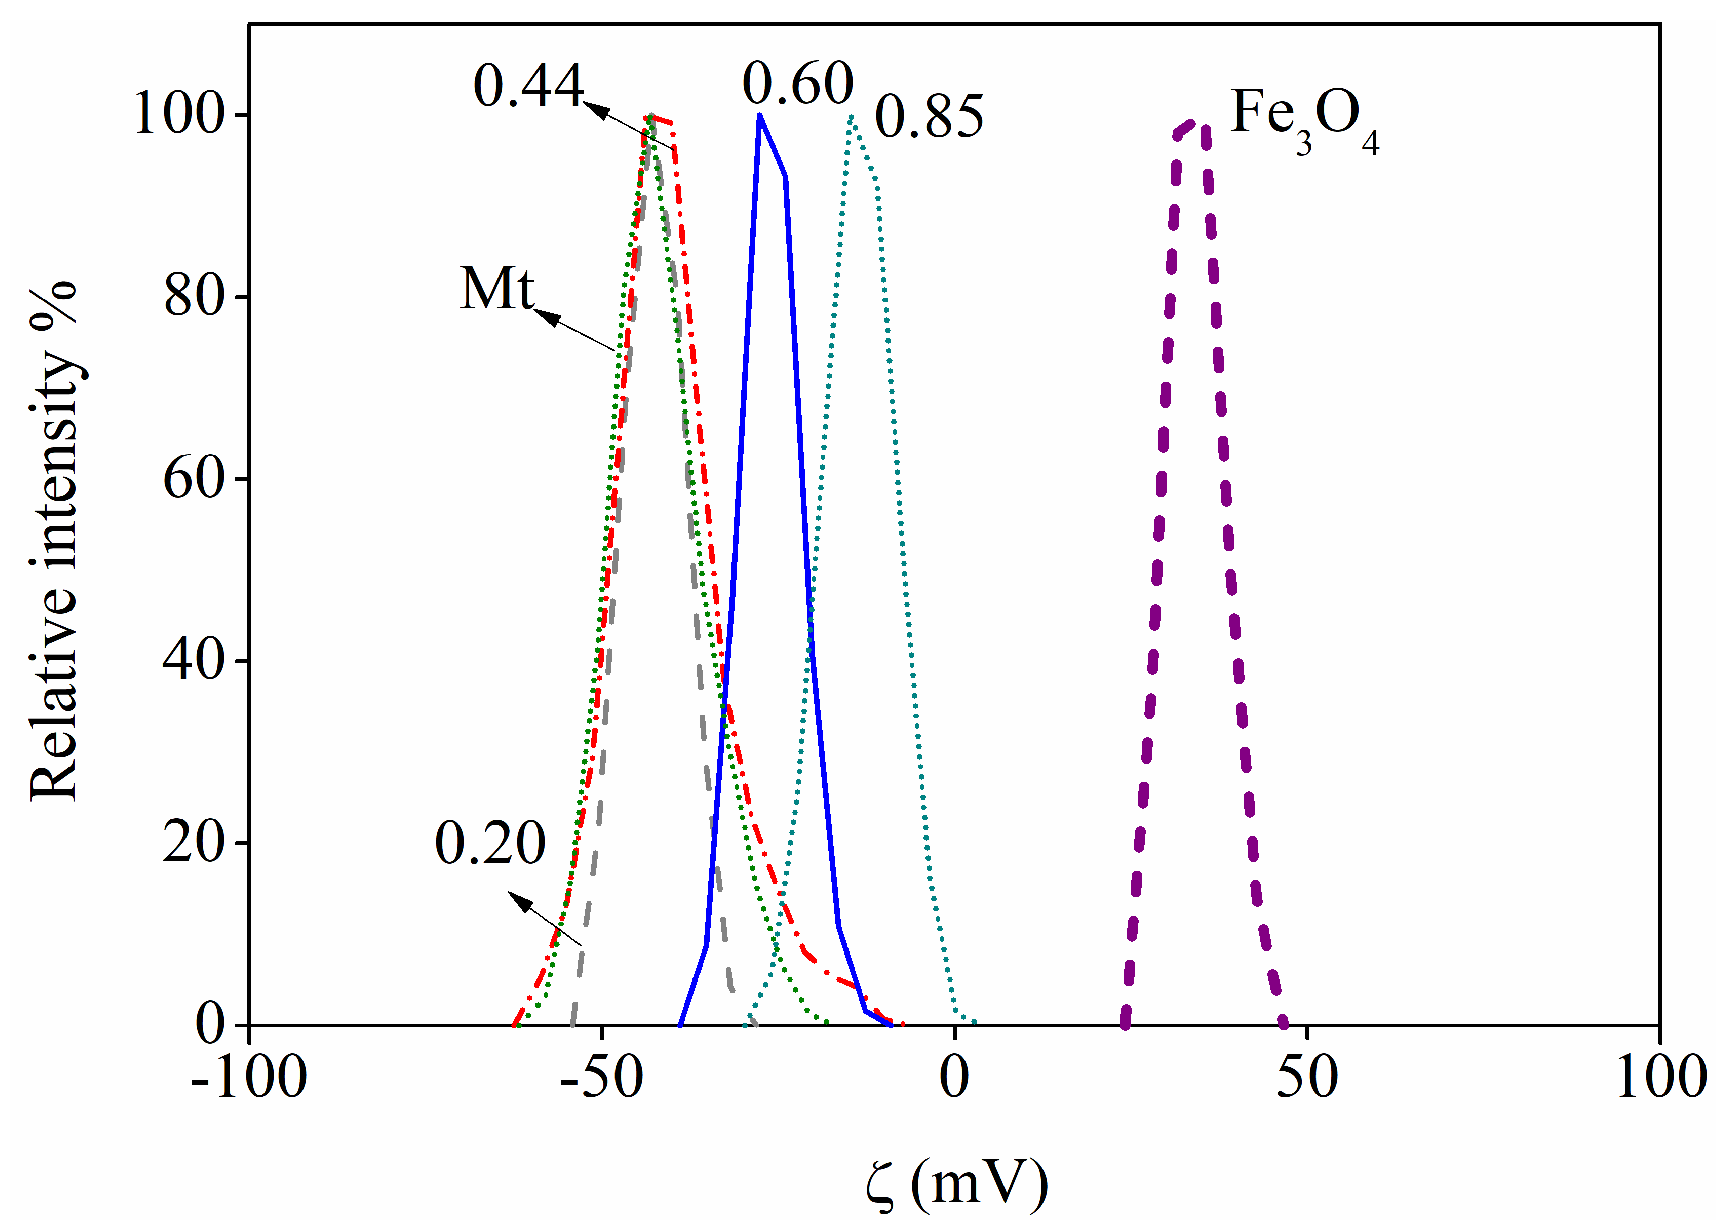
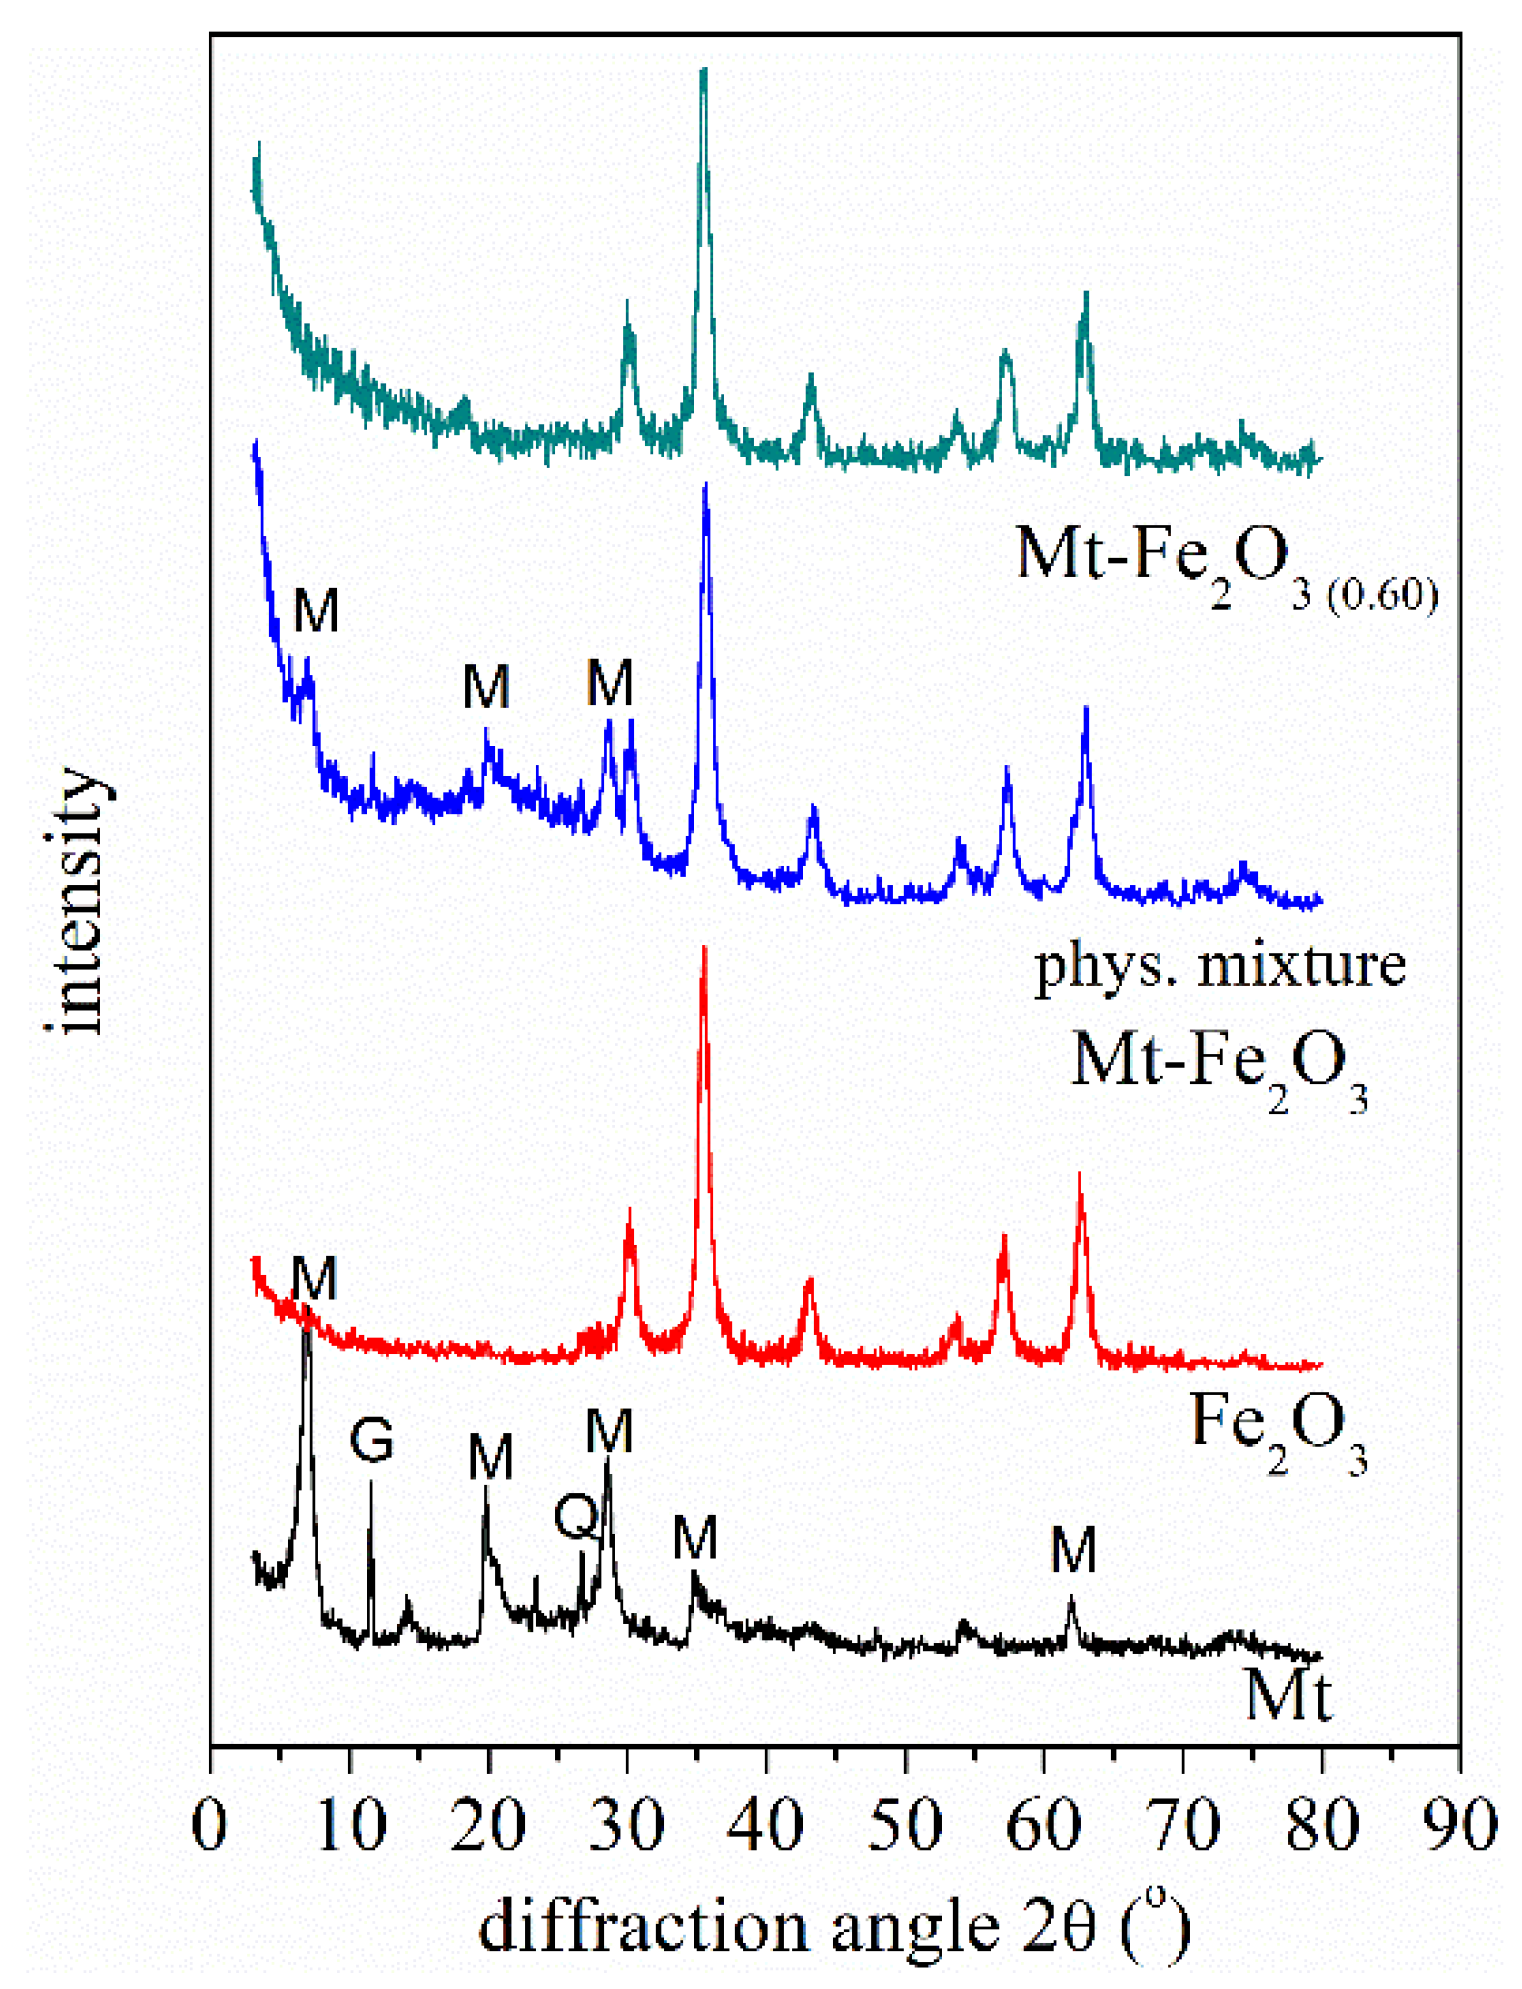
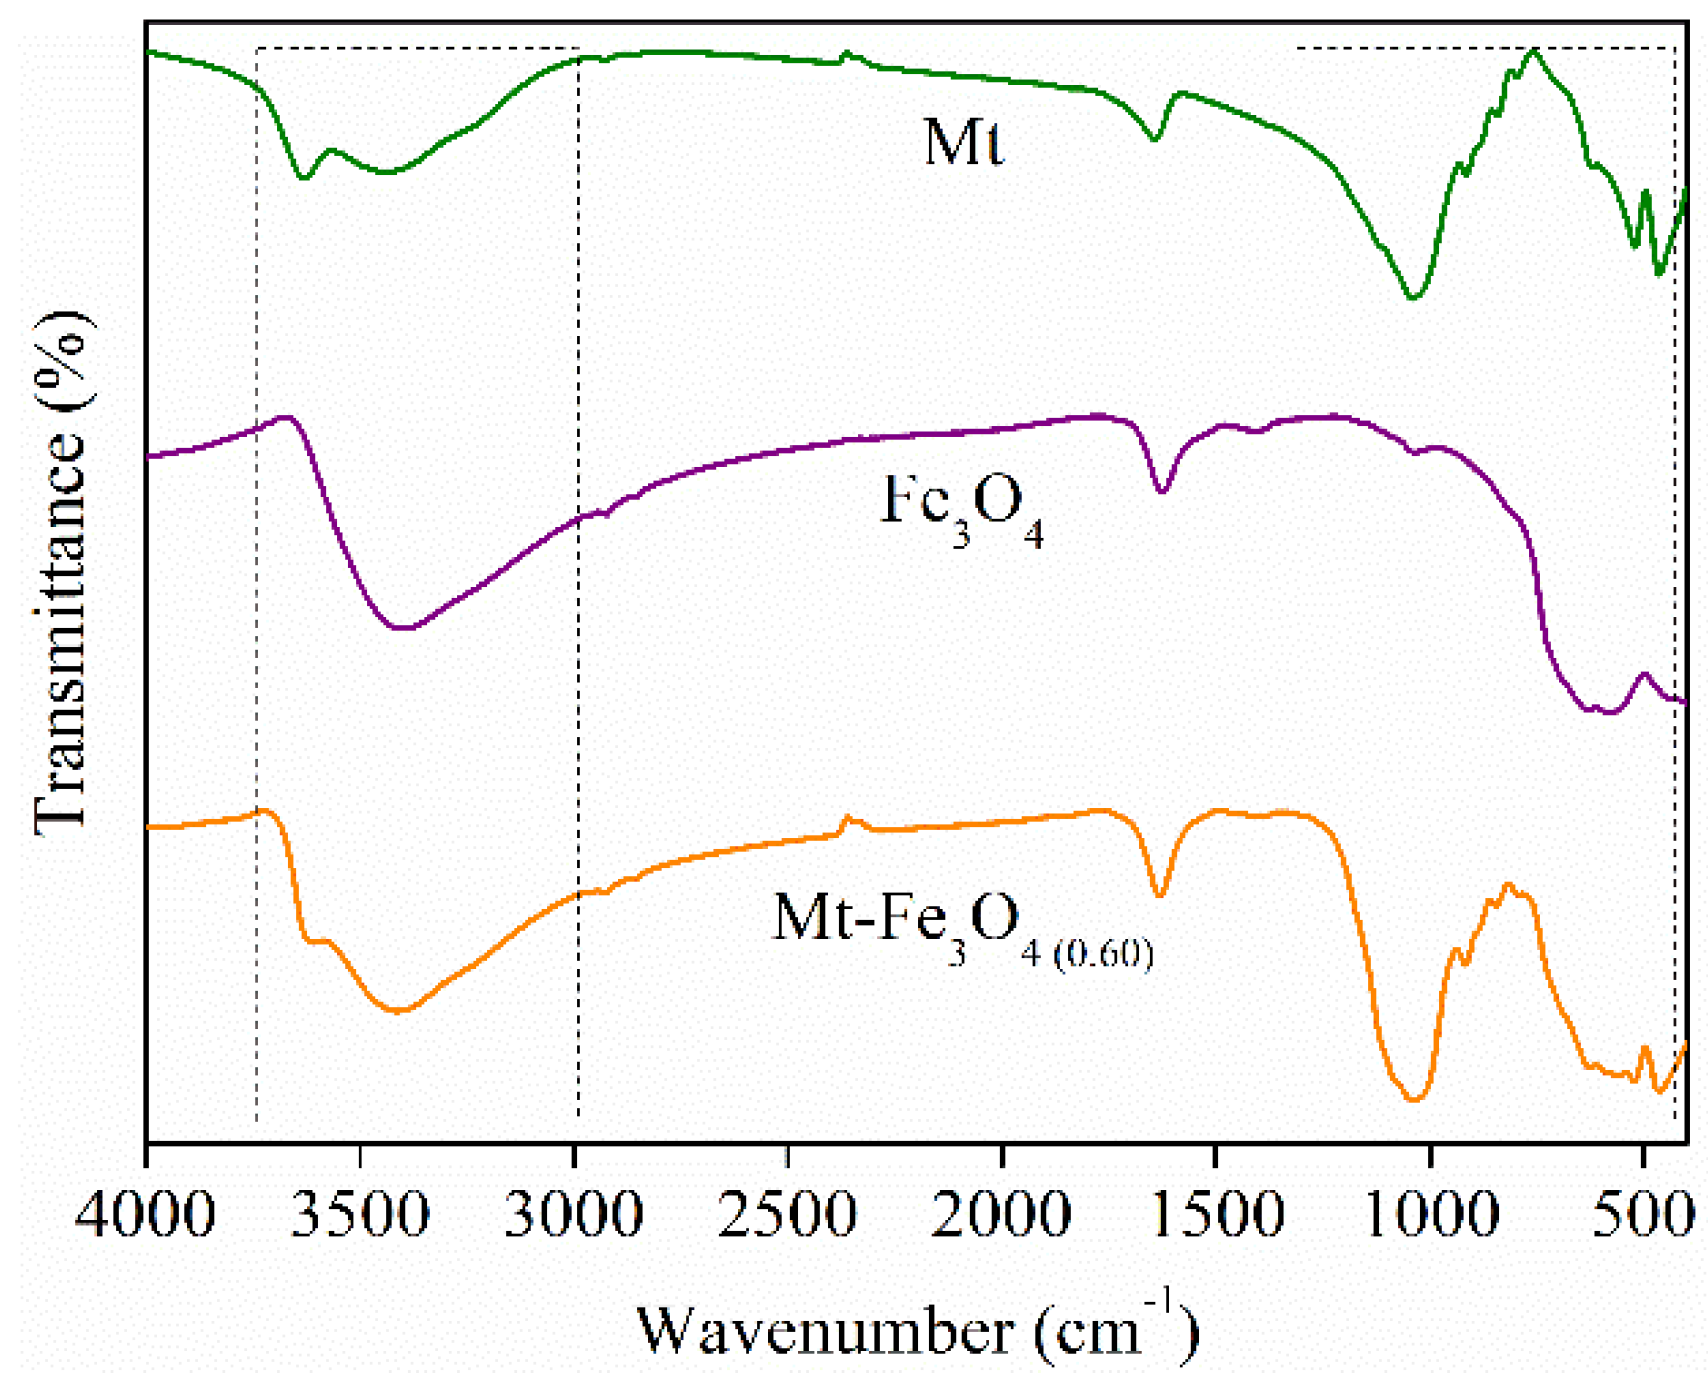
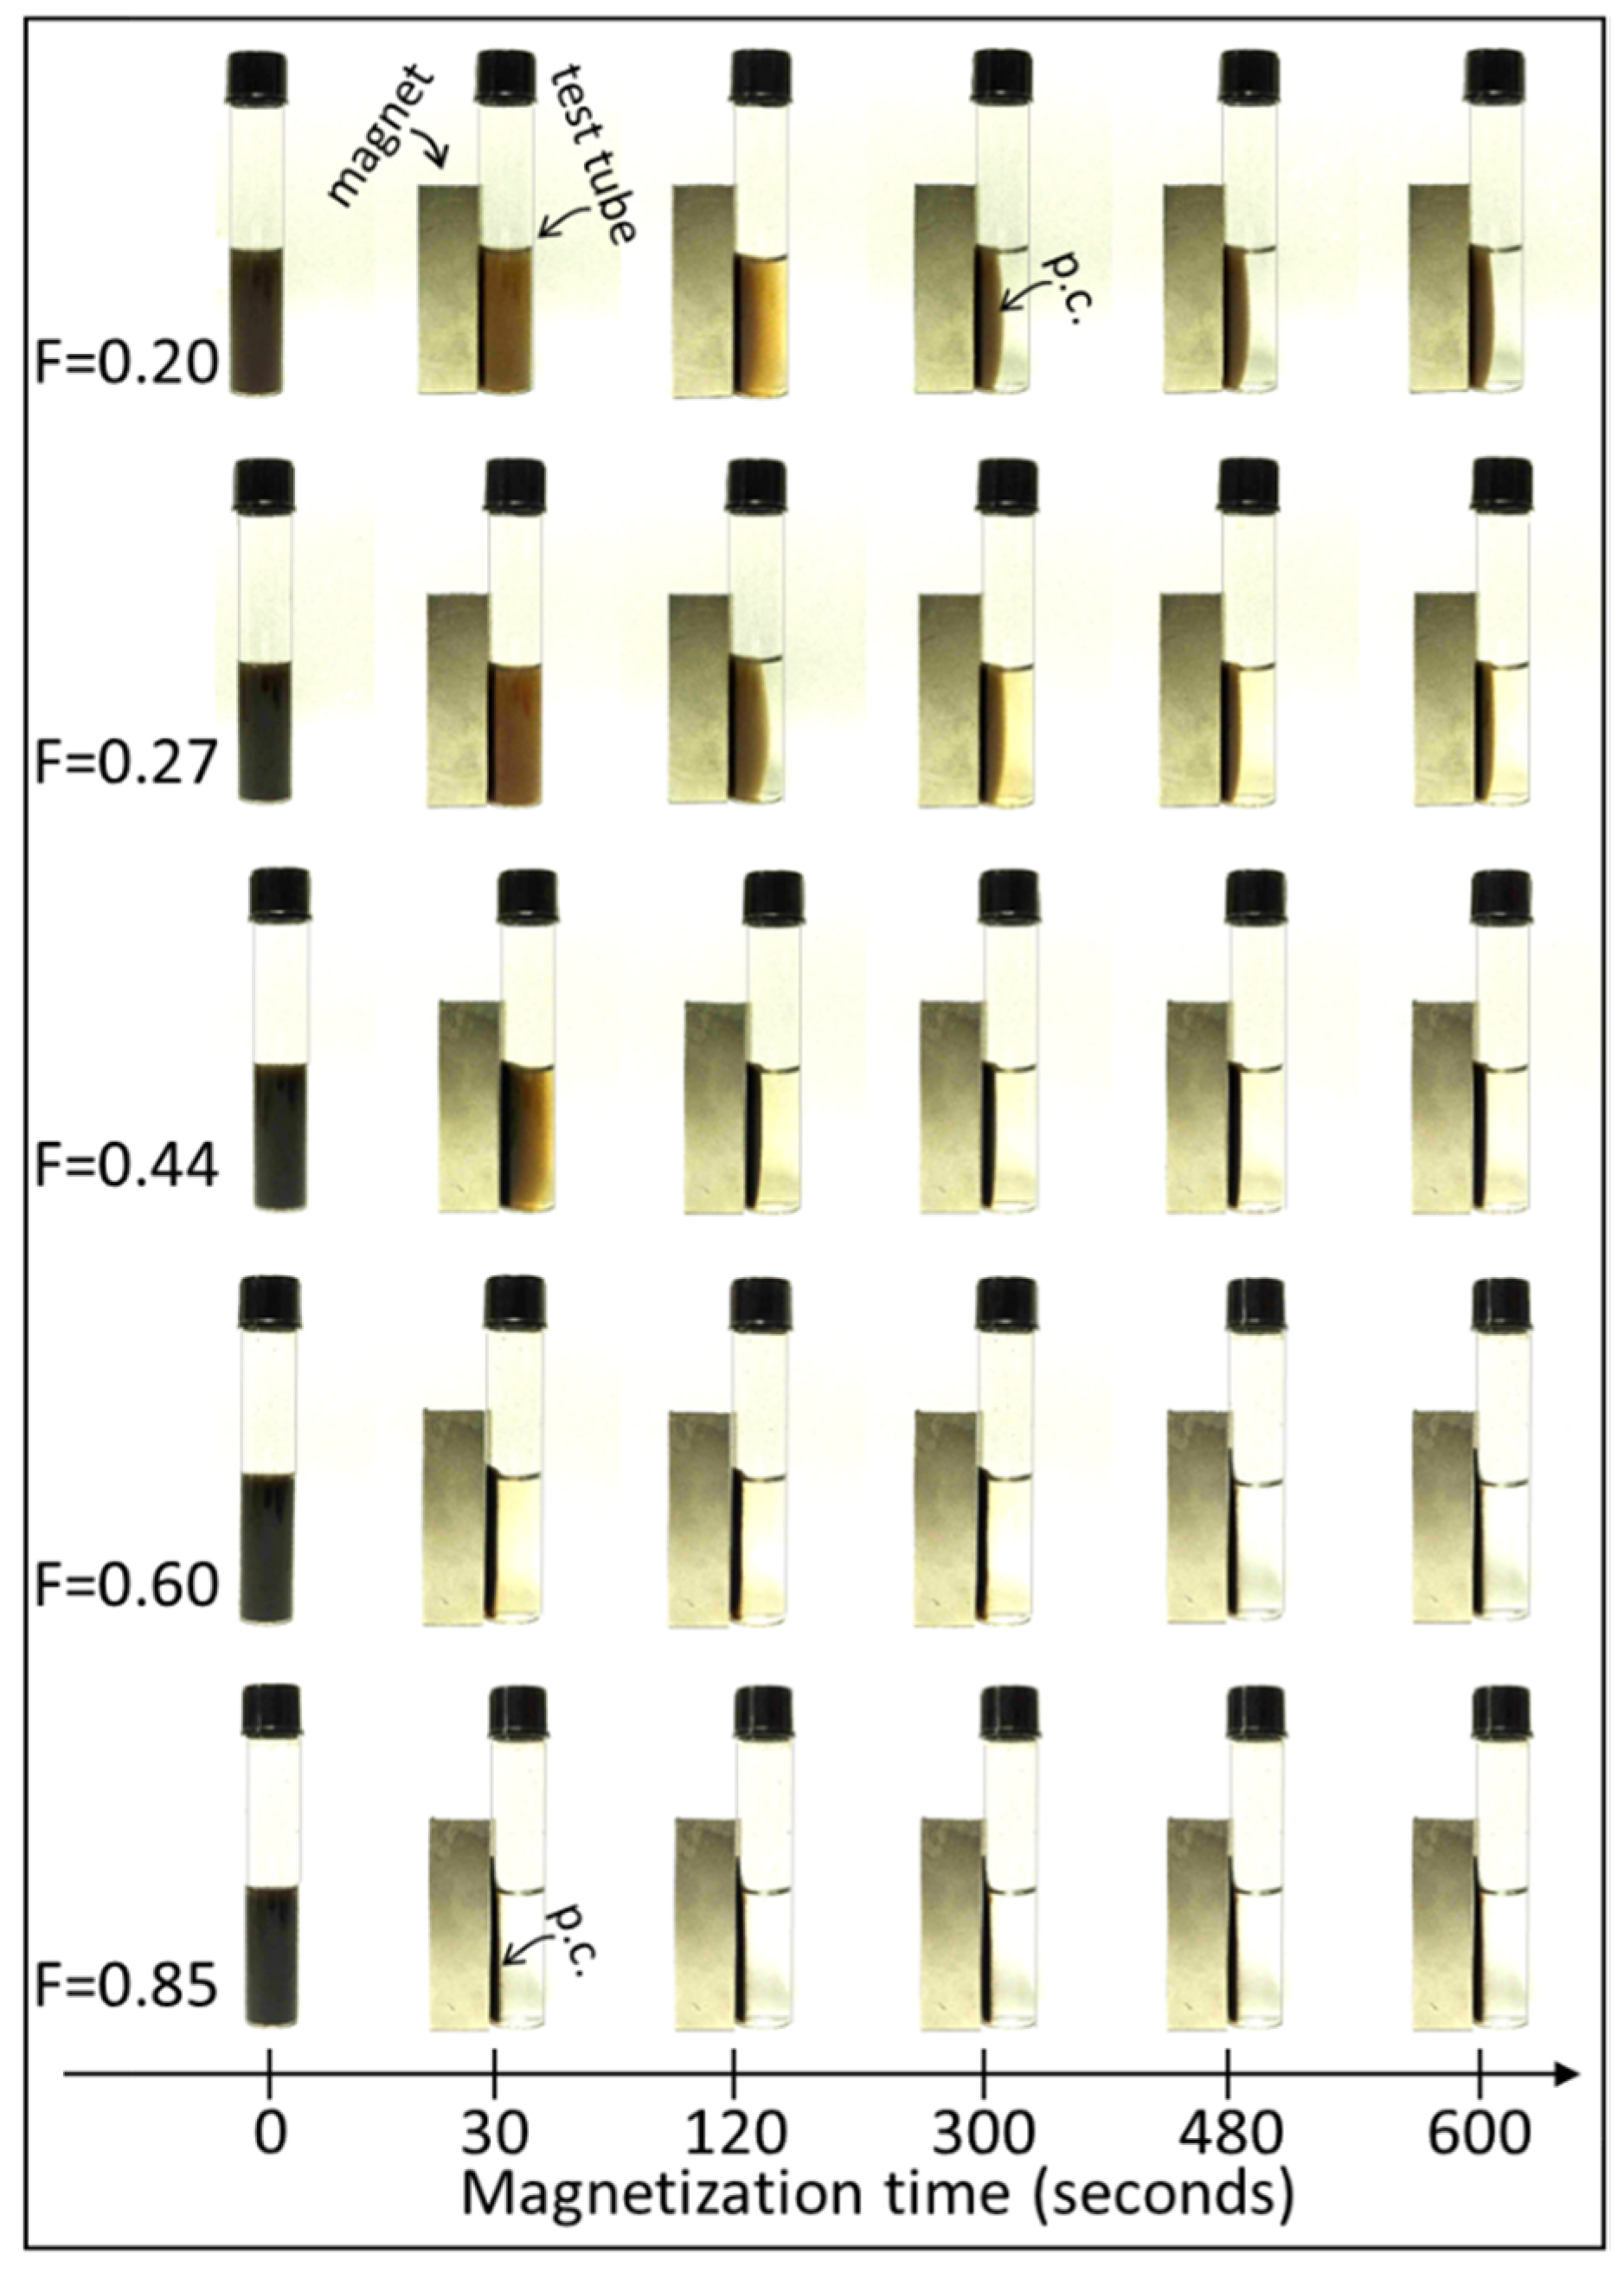
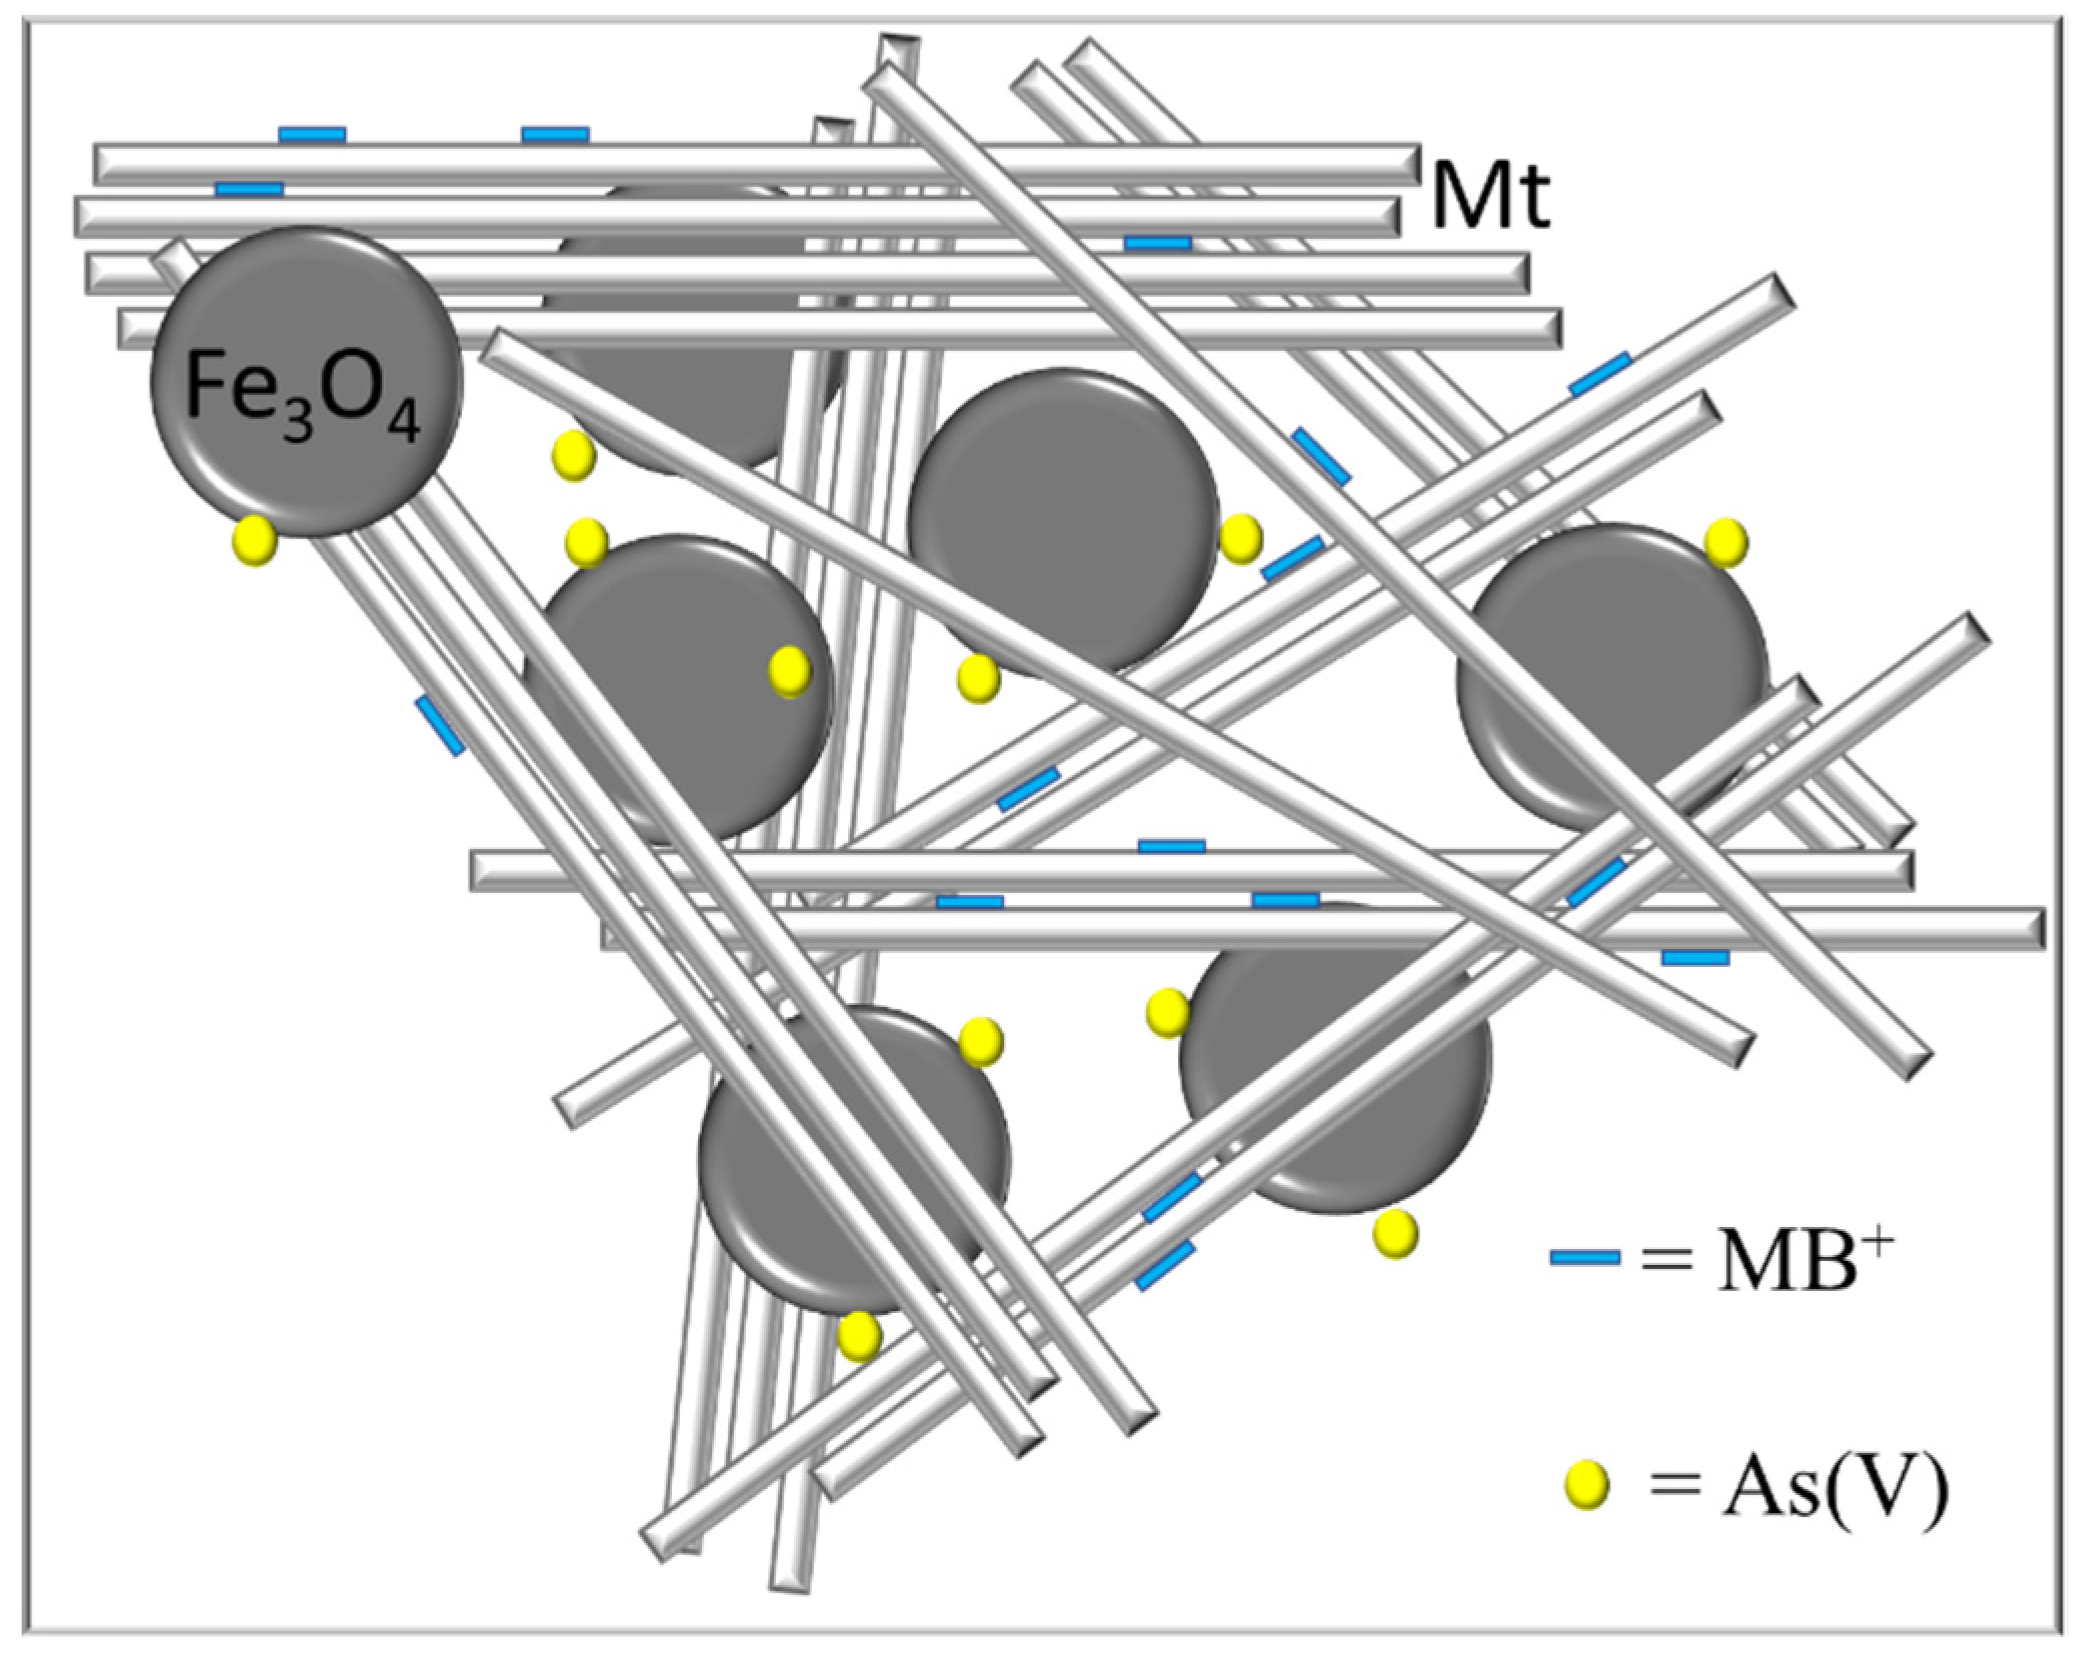
3.1. XRD, FT-IR, Zeta Potential, and Magnetic Remotion

Figure 1 shows the X-ray diffractograms of Fe3O4, Mt (raw material, before sedimentation to obtain the <2 µm fraction), a physical mixture of raw Mt and Fe3O4 powders (F = 0.60), and Mt–Fe3O4(0.60). The pattern of Fe3O4 matched that of magnetite samples from the literature (ICDD: 00-019-0629), exhibiting the characteristics peaks at 30.2° (220), 35.2° (311), 43.2° (400), 53.7° (422), 57.1° (511), and 62.7° (440). The pattern of Mt showed three characteristic reflections at 7.12° (001), 19.80° (02-11), 28.78° (004). Montmorillonite is a layered aluminosilicate mineral, where each layer is formed by two tetrahedral sheets sandwiching an octahedral sheet. The layers pile up forming stacks, where each layer is separated from the other by the interlayer or interlaminar spacing, which contains water and intercalated cations [23]. The basal spacing, d001 = 12.70 Å, corresponds to the sum of the interlaminar spacing (variable thickness, depending on the size of the intercalated species and hydration) and the thickness of the Mt layer (constant, 9.6 Å), indicating that the interlaminar space was 3.1 Å, typical of a sodium montmorillonite with a monolayer of water in the interlaminar region [25,26]. There were also some reflections due to the presence of quartz and gypsum in this raw sample. The physical mixture of raw Mt and Fe3O4 powders showed all the reflections of raw Mt and magnetite. However, in the pattern of Mt–Fe3O4(0.60), only the characteristic reflections of Fe3O4 could be observed. The absence of quartz and gypsum reflections was expected because Mt–Fe3O4(0.60) was prepared with Mt after sedimentation and homoionization, but the absence of the (001) and (004) reflections of Mt, suggests changes in the stacking or piling of Mt layers with, perhaps, some delamination due to the presence of magnetite.
The FT-IR spectra of Mt, Fe3O4, and Mt–Fe3O4 (0,60) are shown in Figure 2. The clay spectrum exhibited its characteristic absorption bands. The band at 3627 cm−1 corresponds to the stretching vibration of the OH groups linked to the cations of the octahedral layer. This band is typical of smectites where most of the octahedral sites are occupied by Al3+ atoms [27]. The broad band at 3444 cm−1 corresponds to OH groups that participate in hydrogen bonding. The band at 1646 cm−1 belongs to the deformation of the OH groups of the hydration water of montmorillonite. The band at 1041 cm−1 results from the stretching of Si–O bond of Si4+ present in the tetrahedral sheets, together with a small “shoulder” that appears around 1100 cm−1 due to the vibration of Al3+ that is replacing Si4+ in the tetrahedral sheet. The band at 914 cm−1 is related to the deformation vibration of the OH groups with Al present in octahedral position [28]. Two bands at 883 cm−1 and 843 cm−1 were attributed to the deformation of the OH group with partial substitution of octahedral Al3+ by Fe2+ and Mg2+, respectively. The low intensity of the bands indicates low content of octahedral Fe2+ and Mg2+ [29]. Lastly, two sharp bands of equivalent intensity appeared at 520 cm−1 and 464 cm−1, corresponding to deformation vibrations of the Si–O–Al bond (where Al3+ is the octahedral cation) and Si–O–Si bond, respectively [30]. The FT-IR spectrum of magnetite particles showed a broad band at 3400 cm−1, typical for symmetric and asymmetric vibrations of OH groups. The band at 1644 cm−1 was attributed to the O–H bending vibration of water, and the bands at 581 cm−1 and 440 cm−1 were attributed to the Fe–O stretching vibrations in tetrahedral and octahedral positions, respectively [31]. The Mt–Fe3O4 (0,60) spectrum was a superposition of montmorillonite bands with those of magnetite. No clear evidence of new bands indicating the existence of a new chemical bond or a new phase appeared. The IR spectra of the other mixtures, which are not shown here for simplicity, showed the same characteristics.
Figure 3 shows the electrokinetic behavior of Mt, Fe3O4, and the Mt–Fe3O4 mixtures at different pH. In the case of Mt, ζ was dominated by the negative structural charge of the clay mineral, being negative throughout the entire pH range studied, with nearly constant values around −40 mV. This behavior is well known and has been reported several times in the literature [32,33,34]. Fe3O4 particles exhibited a different behavior, showing an isoelectric point (IEP) of 7.8, with positive ζ at pH < IEP and negative ζ at pH > IEP, as a result of protonation–deprotonation reactions of the surface groups [35,36]. All Mt–Fe3O4 mixtures presented negative ζ in the entire pH range studied. Those mixtures with low magnetite contents (Mt–Fe3O4(0.20), Mt–Fe3O4(0.27), and Mt–Fe3O4(0.44)) had a nearly constant ζ, almost independent of pH, as with Mt. Mixtures with high magnetite content showed a detectable pH dependence of ζ, with this dependence being less marked for Mt–Fe3O4(0.60) (ζ changed from −30 mV at pH 3.5 to −40 mV at pH 9.5) than for Mt–Fe3O4(0.85) (ζ changed from −16 mV at pH 3.5 to −40 mV at pH 9.5). In summary, the behavior of the mixtures was in between the behavior of Mt and Fe3O4, with a marked influence of Mt, since no mixture acquired positive mobilities at any pH.
The Zetasizer equipment allowed us, in addition to measuring the mean value of ζ, to obtain information of the distribution of ζ in each measurement. Since most of the samples studied in this work are mixtures of two solids, and the electrokinetic behavior of these two solids is very different, measuring the distribution of ζ at any given pH permits deducing whether the particles of the two solids remained as two independent populations in the suspension or they became grouped, generating co-aggregates with intermediate properties. Figure 4 shows the ζ distributions of the different mixtures. For clarity, only distributions corresponding to measurements performed at pH 4.5 ± 0.1 are shown. The remaining measurements for the different mixtures, in the entire pH range studied, rendered similar distributions to those of Figure 4, and some examples are shown in the Supplementary Materials. All mixtures had unimodal distributions, just like Mt and Fe3O4. The mean ζ values and the standard deviations (ζ ± sd) were as follows: Mt, −41.4 ± 4.6 mV; Mt–Fe3O4(0.20), −42.5 ± 4.2 mV; Mt–Fe3O4(0.44), −38.2 ± 4.5 mV; Mt–Fe3O4(0.60), −25.9 ± 4.2 mV; Mt–Fe3O4(0.85), −13.6 ± 4.8 mV; Fe3O4, 35.7 ± 4.3 mV. Mean ζ values followed the regular trend observed in Figure 3, with Mt and mixtures with low F showing high negative ζ, mixtures with high F showing lower negative ζ, and Fe3O4 having a positive ζ. All samples, whether pure samples or mixtures, presented unimodal distributions with very similar standard deviations, proving that the moving entities during electrophoretic mobility measurements were single populations of “particles” (more precisely, co-aggregates of particles), with rather homogeneous electrokinetic properties. No evidence for the presence of two different populations of moving entities was obtained. These co-aggregates spontaneously formed when Mt and magnetite suspensions were mixed, likely driven by the electrostatic attraction between the oppositely charged surfaces or the solids.
Figure 5 shows a series of photographs taken at different times in order to observe the effect caused by an Nd magnet near each Mt–Fe3O4 mixture. This figure provides a semiquantitative idea of their behavior under the influence of an external magnetic field. At time zero, a dark and turbid dispersion was observed. After different magnetization times, the particles cloud (p.c.) became retracted and particles became concentrated on the left side of the tube, in close contact with the magnet. The separation rate depended on the magnetite content, with samples having high F being separated at shorter times. Although there were variations in the separation rates, the solid phases of all mixtures could be readily attracted by the magnet, resulting in clear solutions when the process ended. Again, no evidence for the presence of two different populations of particles or aggregates was found. Knowing that Mt particles in a suspension are not attracted by a magnetic field, the presence of one population of Mt particles and another population of Fe3O4 particles would have resulted in particle separation under the application of the magnetic field, with Mt remaining in suspension and Fe3O4 being attracted by the magnet. These results, in agreement with ζ measurements, suggest that mixtures were formed by rather homogeneous co-aggregates of particles. In each mixture, the co-aggregates had similar magnetic properties, moving all together under the influence of the magnetic field.

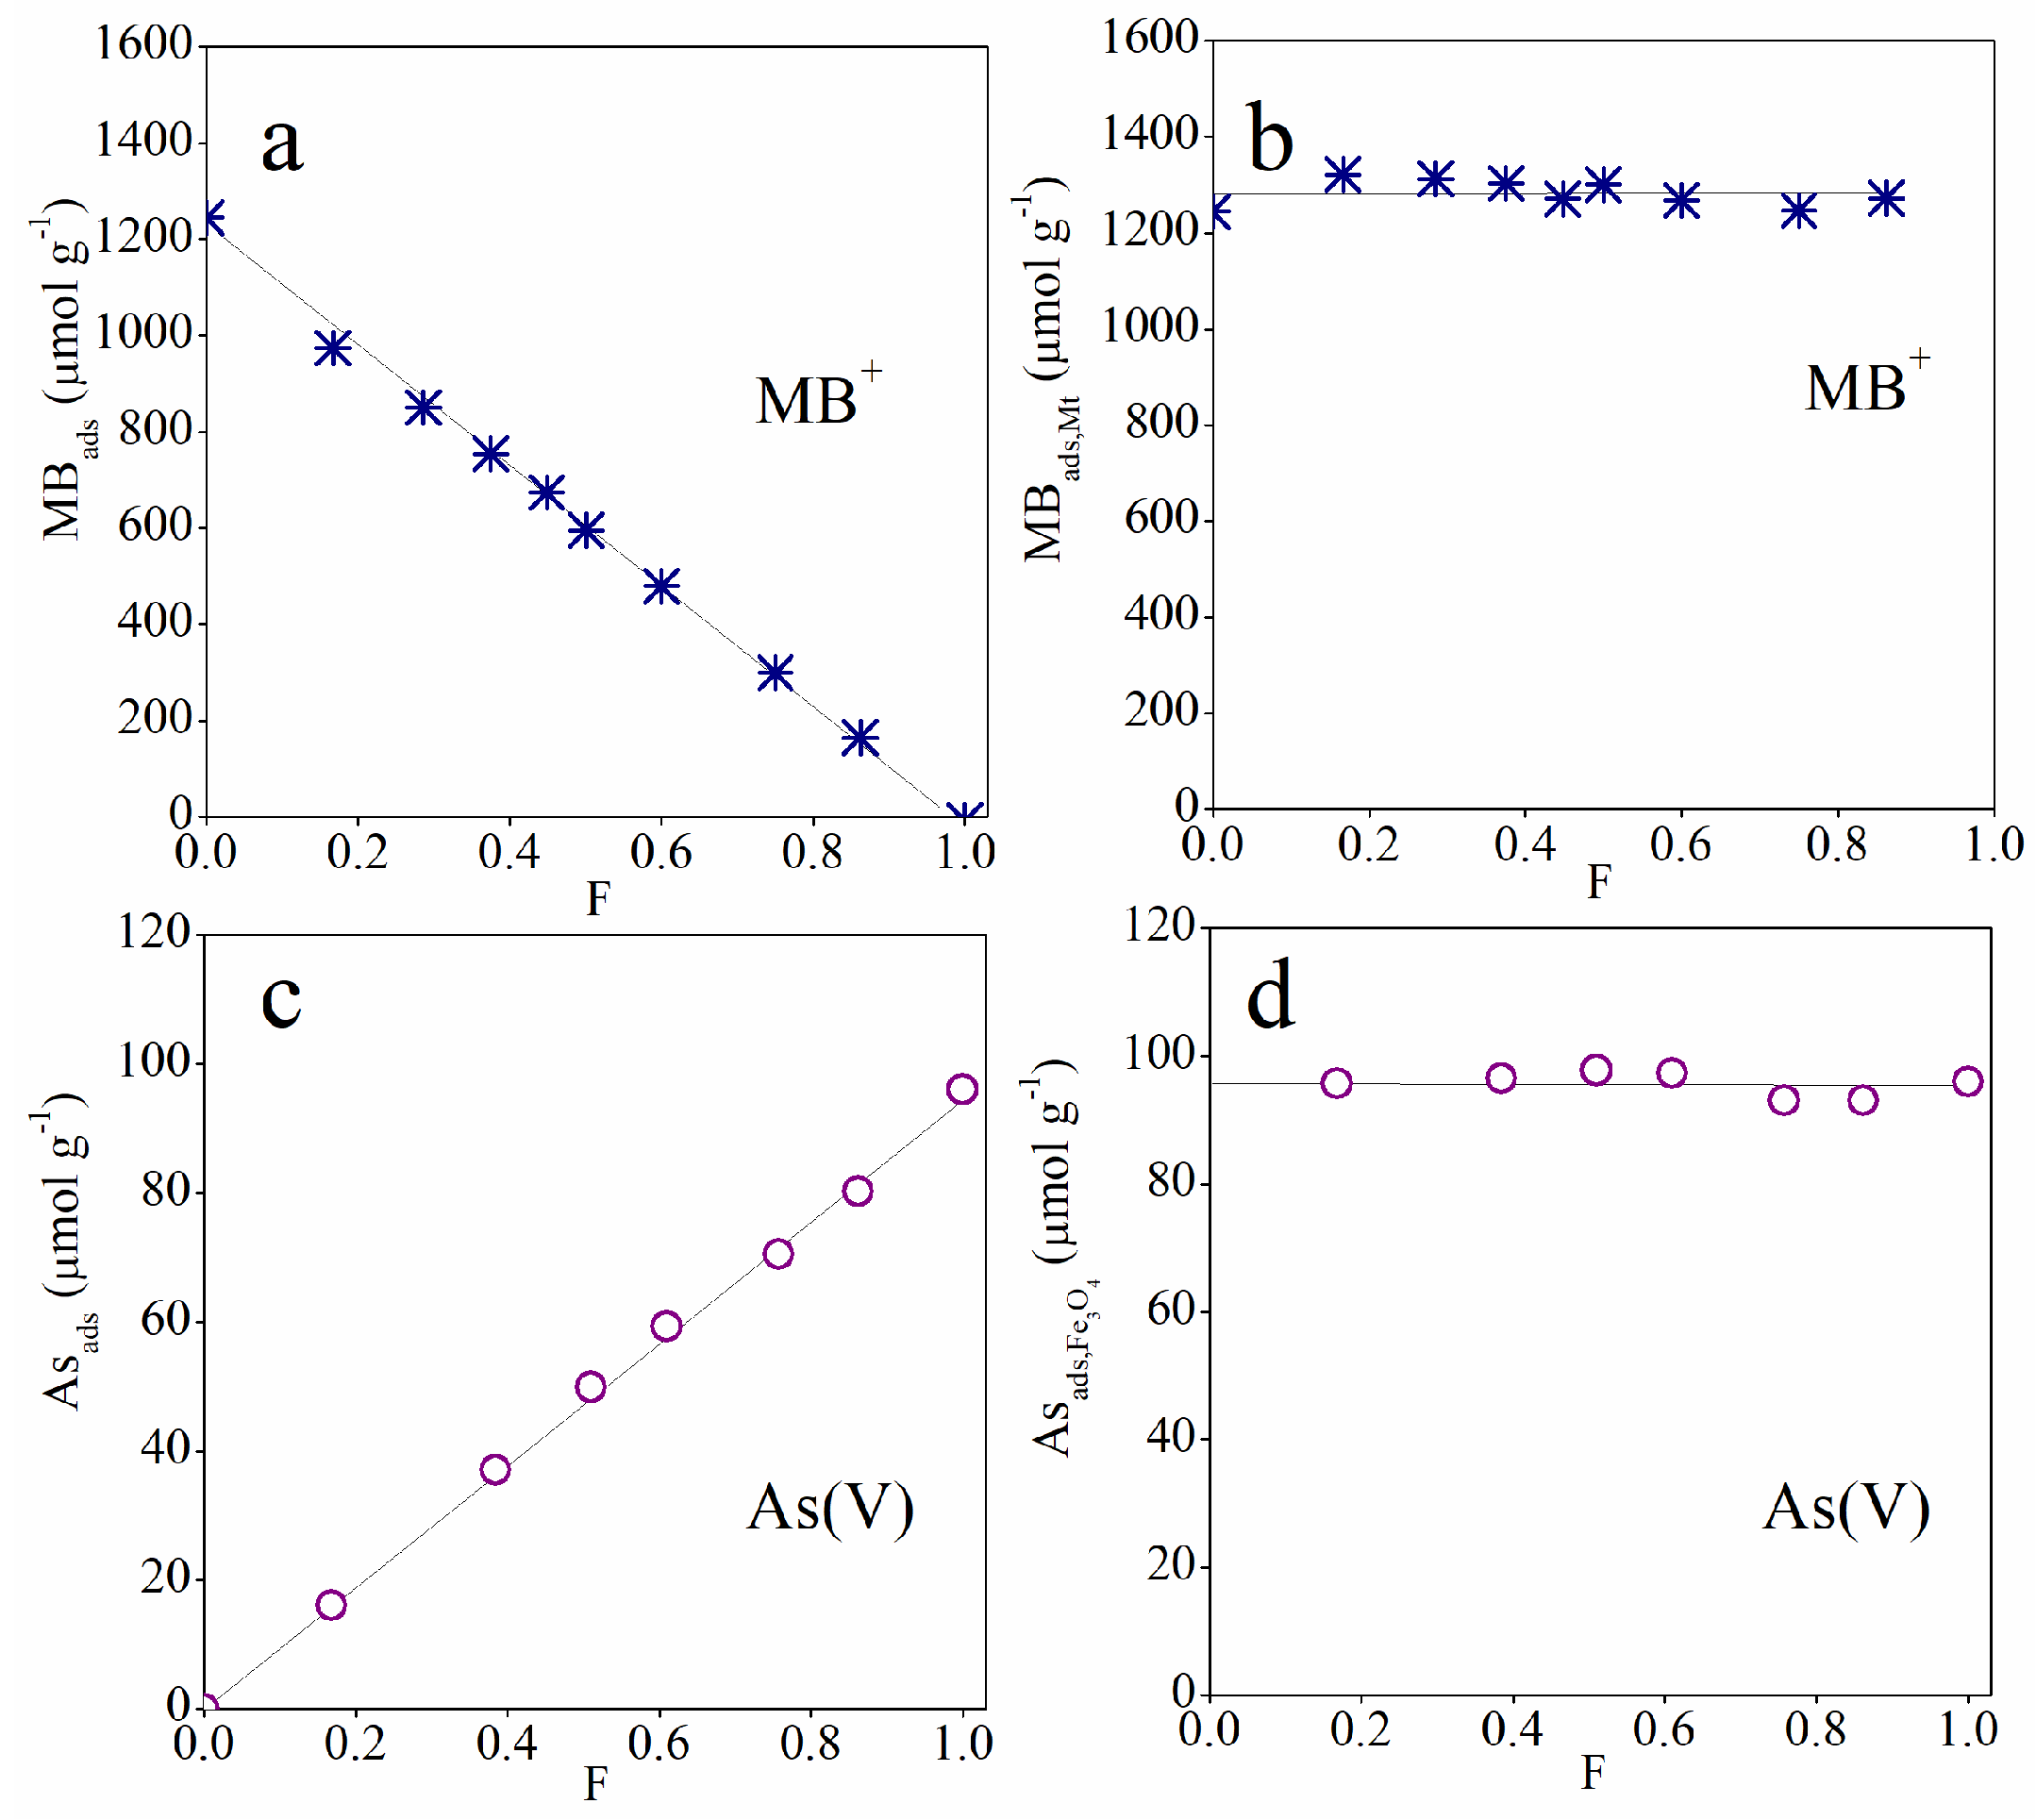
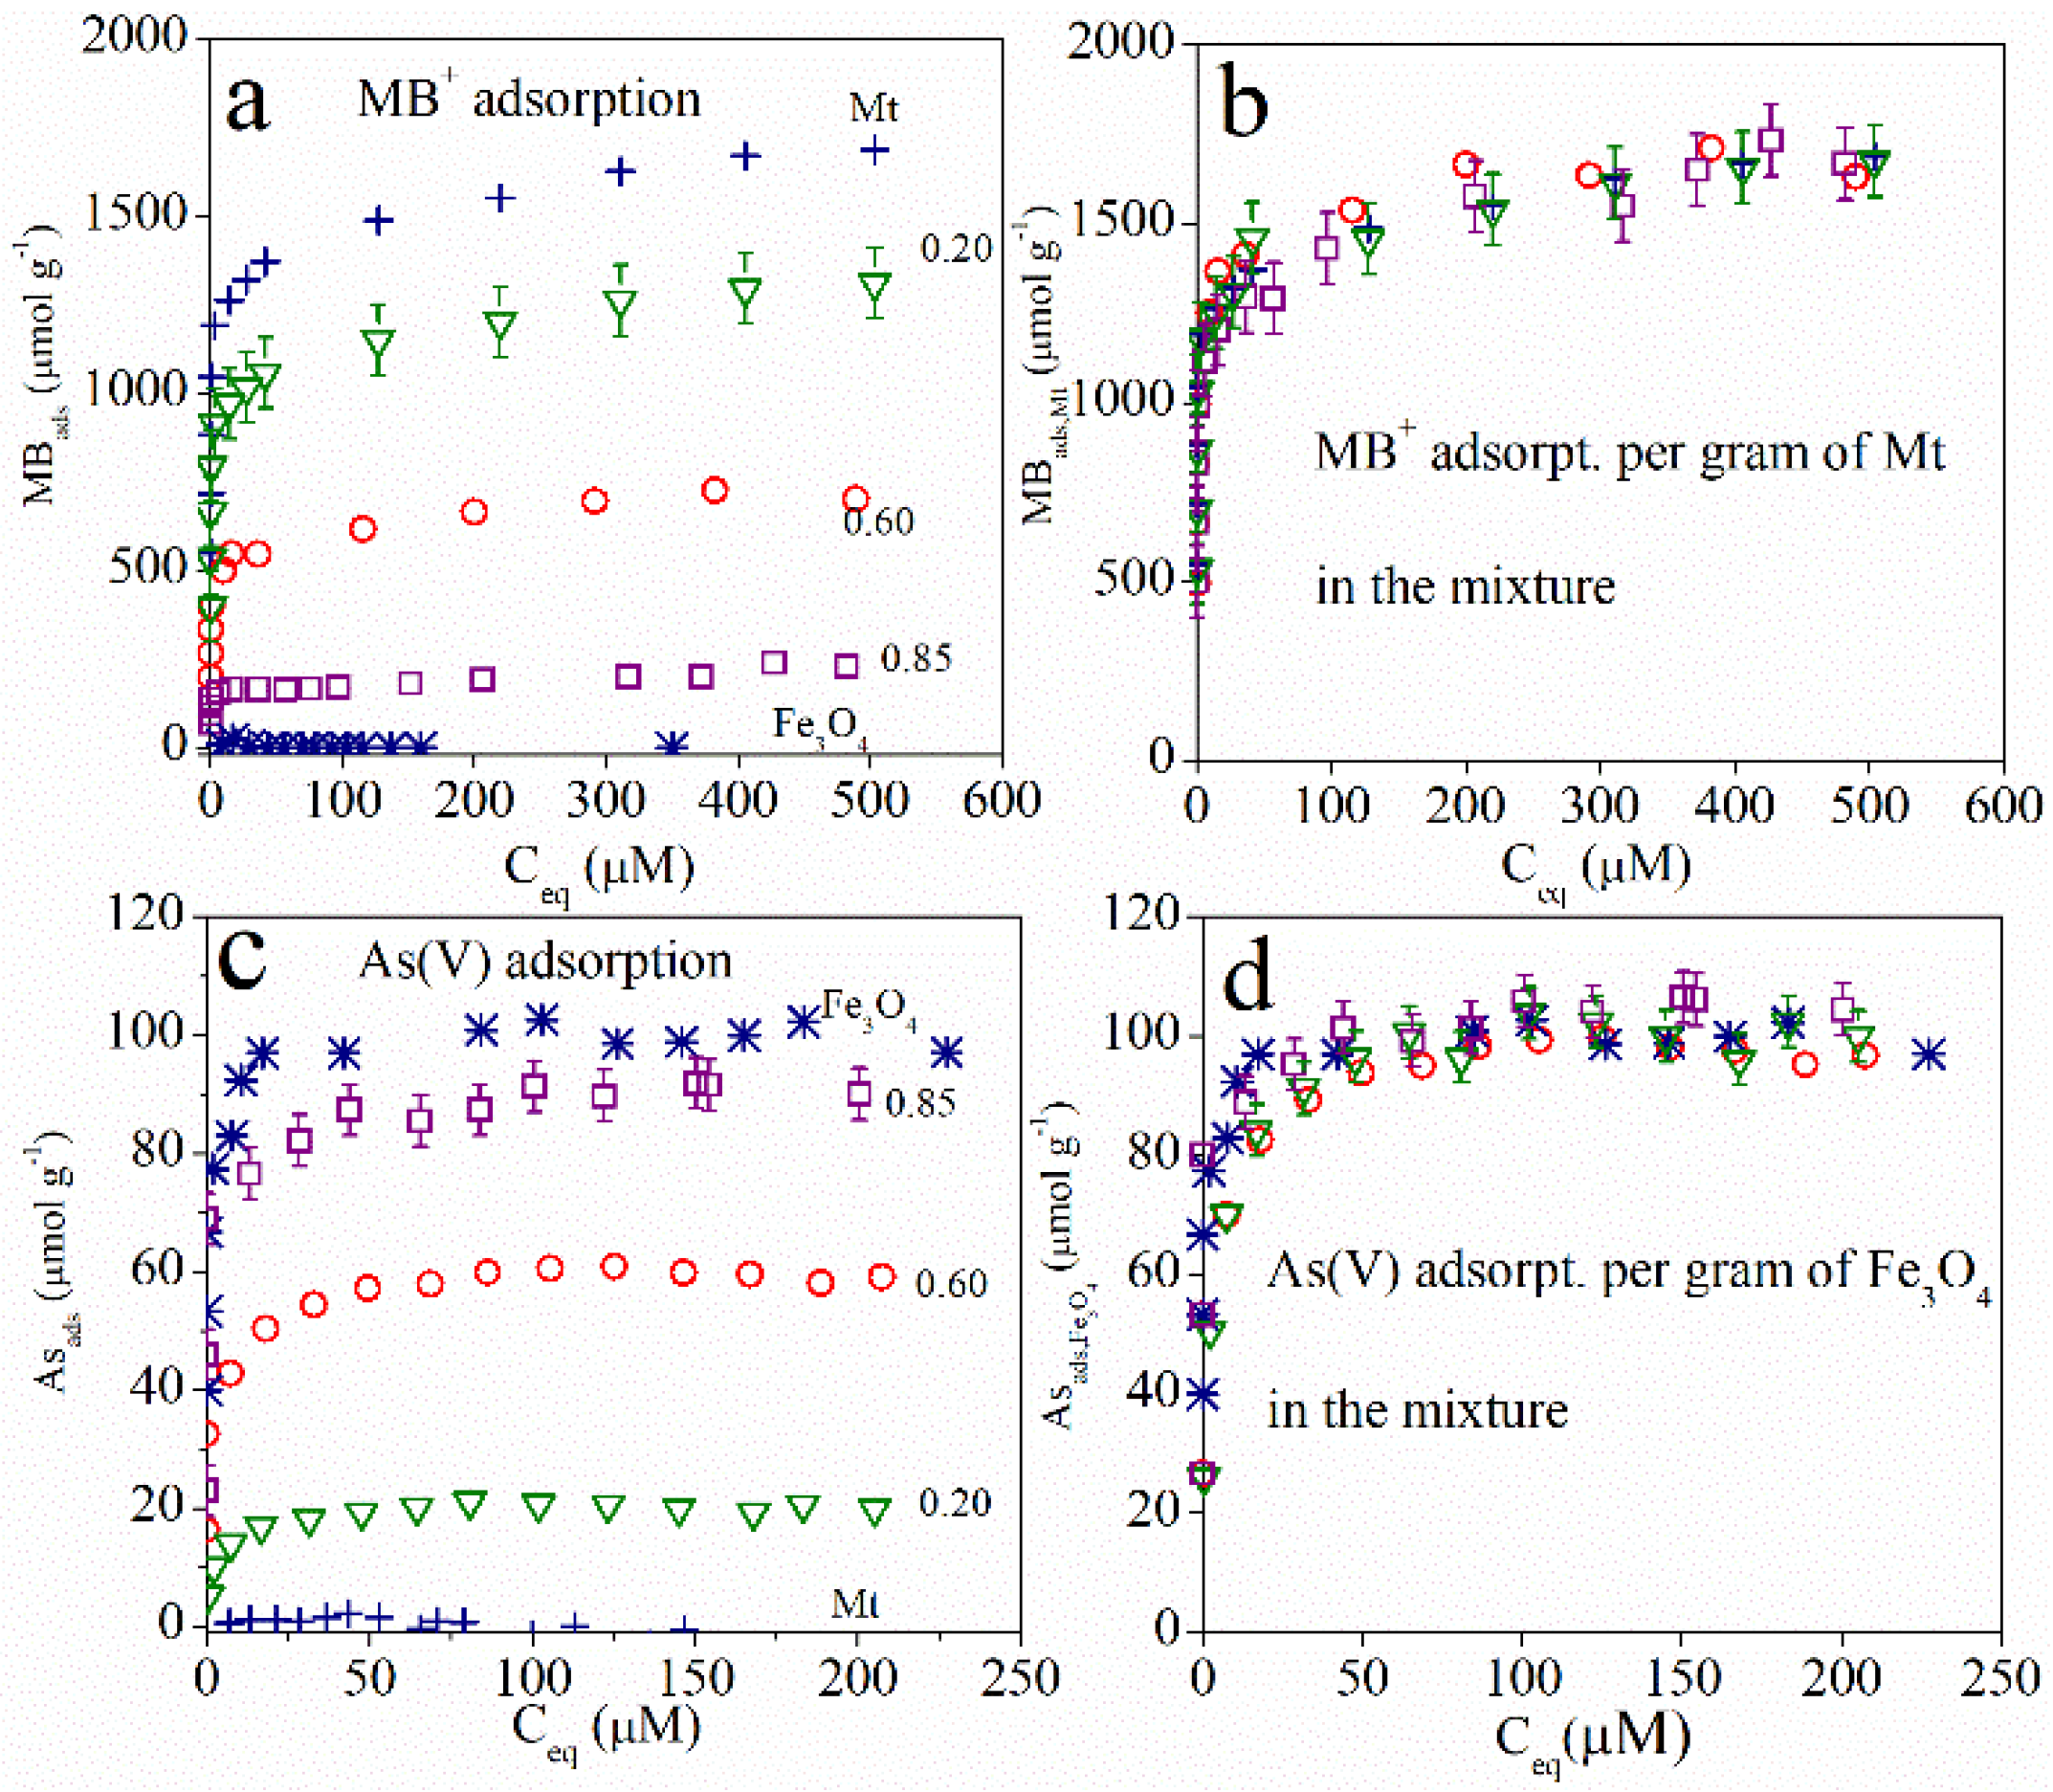
3.2. Adsorption Studies

Figure 6 shows MB+ and As(V) adsorption on Mt–Fe3O4 mixtures, for a constant initial concentration of both adsorbates (adsorption percentages are shown as Supplementary Materials). The adsorption of MB+ per gram of Mt–Fe3O4 decreased linearly with F, becoming zero at F = 1 (Figure 6a). However, upon expressing these same results as adsorption of MB+ per gram of Mt in each mixture, a constant adsorption was obtained (Figure 6b). It is evident that MB+ adsorbed only on montmorillonite, and that the presence of magnetite did not affect the adsorbing properties of the clay. An analogous behavior was observed with As(V). The adsorption of As(V) per gram of Mt-Fe3O4 increased linearly with F, being zero at F = 0 (Figure 6c). However, plotting the same results as adsorption of As(V) per gram of magnetite led to a constant adsorption (Figure 6d). It follows, then, that As (V) was only adsorbed on magnetite, and that the presence of Mt did not affect the adsorbing properties of the oxide.
The results obtained for one initial concentration of MB+ and As(V) were extended to the full range of concentrations investigated, by means of adsorption isotherms (adsorption percentages are shown in the Supplementary Materials). Figure 7a shows MB+ adsorption isotherms on Mt, Fe3O4, and Mt–Fe3O4 mixtures with F values 0.2, 0.6, and 0.85. Mt was the best MB+ adsorbent at all concentrations. Mt–Fe3O4 mixtures, on the other hand, adsorbed MB+, but their adsorption capacity decreased as the proportion of Mt in the mixture decreased. Lastly, Fe3O4 did not adsorb the dye. Therefore, the general results of Figure 7a shows that the MB+ adsorption per gram of mixture strongly depended on the Mt content. Moreover, expressing these same results as adsorption of MB+ per gram of Mt in each mixture (Figure 7b) resulted in a single isotherm, which coincided with the isotherm of pure Mt, within experimental error. It is then evident that MB+ adsorption was mainly controlled by montmorillonite at all MB+ concentrations, and that the presence of magnetite did not appreciably affect the adsorption capacity of Mt.
Analogously, for the case of As(V), Figure 7c shows the adsorption isotherms on Mt, Fe3O4, and Mt–Fe3O4 mixtures. The opposite behavior to that shown by Figure 7a was observed. Mt did not appreciably adsorb As(V), but Fe3O4 was the best adsorbent of the oxoanion. Mt–Fe3O4 mixtures were in line with these results, increasing As(V) adsorption as the proportion of Fe3O4 in the mixture increased. Figure 7d replots the data, expressing the same results of Figure 7c as adsorption of As(V) per gram of Fe3O4 in each mixture. All isotherms nearly merged into a single isotherm, which coincided with the isotherm of pure Fe3O4. It is clear then that As(V) adsorption was mainly controlled by magnetite at all oxoanion concentrations, and that the presence of Mt did not significantly affect the adsorption capacity of magnetite.
The behaviors of pure Mt and Fe3O4 observed in Figure 7a,c are known and expected. Montmorillonite is a very good adsorbent of MB+ [23], and it was reported to be a bad adsorbent of As(V) [37,38]. On the other hand, the adsorption of As(V) by magnetite was similar to that informed previously [22,39]. Structural negative charges on Mt drive the adsorption of MB+ but hinder the adsorption of aqueous As(V) species, which are negatively charged. Functional groups at the magnetite surface allow surface complexation of As(V) species, but positive surface charges hinder the uptake of MB+. In addition, the behavior of the mixtures and the fact that all isotherms merged into single isotherms are a strong indication that the solid components of Mt–Fe3O4 mixtures acted independently as adsorbents in the whole range of MB+ and As(V) concentrations investigated. In other words, MB+ adsorption on Mt–Fe3O4 mixtures was fully controlled by the content of Mt, while the adsorption of As(V) was entirely controlled by the content of Fe3O4. The presence of Fe3O4 did not affect the adsorption of the dye by Mt in the mixtures, whereas the presence of Mt did not affect the adsorption of the oxoanion by Fe3O4.
The independent behavior of montmorillonite and magnetite in the mixtures is a desired property that facilitates the use of the solids as adsorbents. Indeed, the MB+ and As(V) adsorption capacity could be easily tuned by controlling the proportion of Mt and Fe3O4 in the mixture. This independent behavior, nevertheless, does not imply that magnetite particles and montmorillonite particles remain as two independent populations in the suspension. Electrophoretic mobilities and experiments with the magnet demonstrated that Mt and magnetite form co-aggregates; a schematic picture of one of these co-aggregates is shown in Figure 8. The scheme is based on the following findings and known information: (a) each Mt–Fe3O4 co-aggregate consists of a mixture of Mt and Fe3O4 particles, with the former adsorbing MB+ and the later adsorbing As(V). This spontaneous co-aggregation is likely driven by the opposite charges of montmorillonite and magnetite, allowing direct contact between the two types of surfaces. Other evidence for the Mt–magnetite interaction is given by the XRD data, which suggest that the piling of Mt layers was modified by the presence of magnetite; (b) magnetite particles were spherical, with a diameter of around 12 nm, around ten times larger than the thickness of Mt layers (the side view of the layers is drawn in the figure); (c) since delamination of Mt took place, only piling of a few (2–4) layers was allowed in the drawing; (d) As(V) adsorbed on the surface of magnetite and MB+ on the surface and interlayer of Mt. Each aggregate, in addition, possesses electrokinetic and magnetic properties that are like those of the other aggregates and, thus, all move together under the application of an electric or a magnetic field. This is another desired and sound property of the mixtures. They can be easily recovered after acting as adsorbent by applying an electric or a magnetic field, capturing the pollutants and leaving a clear and uncontaminated solution.

4. Conclusions

The simple mix of stock suspensions of montmorillonite and magnetite led to the spontaneous formation of co-aggregates consisting of a mixture of montmorillonite and magnetite particles. The co-aggregates formed at all investigated proportions of the solids and acquired magnetic properties in all cases. The aggregates behaved as stable entities with unimodal ζ distribution and could be easily removed by the application of an external magnetic field, leaving a clear supernatant. In each co-aggregate, the clay and the oxide acted independently of the other component, regarding adsorption of MB+ and As(V), making it easy to tune the adsorptive properties of the system by controlling the composition of the co-aggregates.

Supplementary Materials

The following are available online at https://www.mdpi.com/article/10.3390/min11090927/s1, Tables S1–S6. Detail of Mt-Fe3O4 mixtures preparation for adsorption studies using Mt stock suspension (12.8g/L), Fe3O4 stock suspension (7.5 g/L), MB+ stock solution (0.001 M) and As(V) stock solution (0.001 M). Figure S1. Examples of unimodal distributions of zeta potentials at different pH for the Mt-Fe3O4(0.20) mixture. Figure S2. Examples of unimodal distributions of zeta potentials at different pH for the Mt-Fe3O4(0.60) mixture. Figure S3. Examples of unimodal distributions of zeta potentials at different pH for the Mt-Fe3O4(0.85) mixture. Figure S4. MB+ and As(V) adsorption and adsorption percentages on Mt-Fe3O4 mixtures as a function of composition. Initial concentration of: MB+, 2 × 10⁻⁴ M; As(V), 1.6 × 10⁻⁴ M. Same data as Figure 6 in main text. Figure S5. Adsorption percentages of MB+ on Mt-Fe3O4 mixtures for the case of adsorption isotherms shown in Figure 7 (main text). Figure S6. Adsorption percentages of As(V) on Mt-Fe3O4 mixtures for the case of adsorption isotherms shown in Figure 7 (main text). The behavior is typical for adsorption isotherms performed at different initial concentration of the adsorptive and constant solid dosage (“concentration” of solid). The higher the initial concentration, the lower the adsorption percentage, because the surface is becoming progressively saturated.

Author Contributions

Conceptualization, E.P. and M.A.; methodology, E.P. and M.A.; validation, E.P.; formal analysis, E.P. and M.A; investigation, E.P.; resources, M.A.; writing—original draft preparation, E.P.; writing—review and editing, M.A.; visualization, E.P. and M.A; supervision, M.A.; project administration, M.A.; funding acquisition, M.A. Both authors have read and agreed to the published version of the manuscript.

Funding

This research was founded by SGCyT-UNS, grant number PGI 24/Q083, ANPCYT-MINCYT, grant number PICT 2018/03592 and CONICET, grant numbers 11220150100769CO, 23820190100022CO and 20720150100031CO.

Acknowledgments

The authors would like to thank SGCyT-UNS (PGI), ANPCYT-MINCYT (PICT), and CONICET (PIP-PIO). This work is also part of the Joint Project CONICET (Argentina)—NSFC (China).

Conflicts of Interest

The authors declare no conflict of interest.

References

  1. Filik, H.; Avan, A.A. Magnetic Nanostructures for Preconcentration, Speciation and Determination of Chromium Ions: A Review. Talanta 2019, 203, 168–177. [Google Scholar] [CrossRef]
  2. Karimi, M.A.; Mohadesi, A.; Hatefi-Mehrjardi, A.; Mohammadi, S.Z.; Yarahmadi, J.; Khayrkhah, A. Separation/Preconcentration and Speciation Analysis of Trace Amounts of Arsenate and Arsenite in Water Samples Using Modified Magnetite Nanoparticles. J. Chem. 2014, 2014. [Google Scholar] [CrossRef]
  3. Cao, Y.; Sheng, T.; Yang, Z.; Huang, D.; Sheng, L. Synthesis of Molecular-Imprinting Polymer Coated Magnetic Nanocomposites for Selective Capture and Fast Removal of Environmental Tricyclic Analogs. Chem. Eng. J. 2021, 426, 128678. [Google Scholar] [CrossRef]
  4. Peighambardoust, S.J.; Foroutan, R.; Peighambardoust, S.H.; Khatooni, H.; Ramavandi, B. Decoration of Citrus Limon Wood Carbon with Fe3O4 to Enhanced Cd2+ Removal: A Reclaimable and Magnetic Nanocomposite. Chemosphere 2021, 282, 131088. [Google Scholar] [CrossRef]
  5. Saiz, S.; Nanozarah, P.; Kaedah, M.; Kimia, K. Size-Controlled Synthesis and Characterization of Fe3O4 Nanoparticles by Chemical Coprecipitation Method. Sains Malays. 2008, 37, 389–394. [Google Scholar]
  6. Jang, J.; Lee, D.S. Magnetite Nanoparticles Supported on Organically Modified Montmorillonite for Adsorptive Removal of Iodide from Aqueous Solution: Optimization Using Response Surface Methodology. Sci. Total Environ. 2018, 615, 549–557. [Google Scholar] [CrossRef]
  7. Shattar, S.F.A.; Zakaria, N.A.; Foo, K.Y. Utilization of Montmorillonite as a Refining Solution for the Treatment of Ametryn, a Second Generation of Pesticide. J. Environ. Chem. Eng. 2017, 5, 3235–3242. [Google Scholar] [CrossRef]
  8. Wang, G.; Hua, Y.; Su, X.; Komarneni, S.; Ma, S.; Wang, Y. Cr(VI) Adsorption by Montmorillonite Nanocomposites. Appl. Clay Sci. 2016, 124, 111–118. [Google Scholar] [CrossRef]
  9. Geroeeyan, A.; Niazi, A.; Konoz, E. Removal of Basic Orange 2 Dye and Ni2+from Aqueous Solutions Using Alkaline-Modified Nanoclay. Water Sci. Technol. 2021, 83, 2271–2286. [Google Scholar] [CrossRef]
  10. Jeganathan, M.; Dhakshinamoorthy, A.; Pitchumani, K. One-Pot Synthesis of 2-Substituted Quinoxalines Using K10-Montmorillonite as Heterogeneous Catalyst. Tetrahedron Lett. 2014, 55, 1616–1620. [Google Scholar] [CrossRef]
  11. Suresh, D.; Dhakshinamoorthy, A.; Pitchumani, K. A Green Route for the Synthesis of 2-Substituted Benzoxazole Derivatives Catalyzed by Al3+-Exchanged K10 Clay. Tetrahedron Lett. 2013, 54, 6415–6419. [Google Scholar] [CrossRef]
  12. Bharath, G.; Alhseinat, E.; Ponpandian, N.; Khan, M.A.; Siddiqui, M.R.; Ahmed, F.; Alsharaeh, E.H. Development of Adsorption and Electrosorption Techniques for Removal of Organic and Inorganic Pollutants from Wastewater Using Novel Magnetite/Porous Graphene-Based Nanocomposites. Sep. Purif. Technol. 2017, 188, 206–218. [Google Scholar] [CrossRef]
  13. Su, C. Environmental Implications and Applications of Engineered Nanoscale Magnetite and Its Hybrid Nanocomposites: A Review of Recent Literature. J. Hazard. Mater. 2017, 322, 48–84. [Google Scholar] [CrossRef]
  14. Galindo-González, C.; de Vicente, J.; Ramos-Tejada, M.M.; López-López, M.T.; González-Caballero, F.; Durán, J.D.G. Preparation and Sedimentation Behavior in Magnetic Fields of Magnetite-Covered Clay Particles. Langmuir 2005, 21, 4410–4419. [Google Scholar] [CrossRef]
  15. Mamedov, A.; Ostrander, J.; Aliev, F.; Kotov, N.A. Stratified Assemblies of Magnetite Nanoparticles and Montmorillonite Prepared by the Layer-by-Layer Assembly. Langmuir 2000, 16, 3941–3949. [Google Scholar] [CrossRef]
  16. Yuan, P.; Fan, M.; Yang, D.; He, H.; Liu, D.; Yuan, A.; Zhu, J.; Chen, T. Montmorillonite-Supported Magnetite Nanoparticles for the Removal of Hexavalent Chromium [Cr(VI)] from Aqueous Solutions. J. Hazard. Mater. 2009, 166, 821–829. [Google Scholar] [CrossRef]
  17. Larraza, I.; López-Gónzalez, M.; Corrales, T.; Marcelo, G. Hybrid Materials: Magnetite-Polyethylenimine-Montmorillonite, as Magnetic Adsorbents for Cr(VI) Water Treatment. J. Colloid Interface Sci. 2012, 385, 24–33. [Google Scholar] [CrossRef]
  18. Zhao, G.; Wang, J.; Li, Y.; Chen, X.; Liu, Y. Enzymes Immobilized on Superparamagnetic Fe3O4@Clays Nanocomposites: Preparation, Characterization, and a New Strategy for the Regeneration of Supports. J. Phys. Chem. C 2011, 115, 6350–6359. [Google Scholar] [CrossRef]
  19. Cabrera, M.; Maciel, J.C.; Quispe-Marcatoma, J.; Pandey, B.; Neri, D.F.M.; Soria, F.; Baggio-Saitovitch, E.; de Carvalho, L.B. Magnetic Composites from Minerals: Study of the Iron Phases in Clay and Diatomite Using Mössbauer Spectroscopy, Magnetic Measurements and XRD. Hyperfine Interact. 2014, 224, 197–204. [Google Scholar] [CrossRef]
  20. Oliveira, L.C.A.; Rios, R.V.R.A.; Fabris, J.D.; Sapag, K.; Garg, V.K.; Lago, R.M. Clay-Iron Oxide Magnetic Composites for the Adsorption of Contaminants in Water. Appl. Clay Sci. 2003, 22, 169–177. [Google Scholar] [CrossRef]
  21. Lombardi, B.; Baschini, M.; Torres Sánchez, R.M. Bentonite Deposits of Northern Patagonia. Appl. Clay Sci. 2003, 22, 309–312. [Google Scholar] [CrossRef]
  22. Pecini, E.M.; Springer, V.; Brigante, M.; Avena, M. Arsenate Interaction with the Surface of Nanomagnetic Particles. High Adsorption or Full Release. J. Environ. Chem. Eng. 2017, 5, 4917–4922. [Google Scholar] [CrossRef]
  23. Pecini, E.M.; Avena, M.J. Measuring the Isoelectric Point of the Edges of Clay Mineral Particles: The Case of Montmorillonite. Langmuir 2013, 29, 14926–14934. [Google Scholar] [CrossRef] [PubMed]
  24. Lenoble, V.; Deluchat, V.; Serpaud, B.; Bollinger, J.C. Arsenite Oxidation and Arsenate Determination by the Molybdene Blue Method. Talanta 2003, 61, 267–276. [Google Scholar] [CrossRef]
  25. Oueslati, W.; Ben Rhaiem, H.; Lanson, B.; Ben Haj Amara, A. Selectivity of Na-Montmorillonite in Relation with the Concentration of Bivalent Cation (Cu2+, Ca2+, Ni2+) by Quantitative Analysis of XRD Patterns. Appl. Clay Sci. 2009, 43, 224–227. [Google Scholar] [CrossRef]
  26. Chen, G.; Han, B.; Yan, H. Interaction of Cationic Surfactants with Iron and SodiumMontmorillonite Suspensions. J. Colloid Interface Sci. 1998, 201, 158–163. [Google Scholar] [CrossRef]
  27. Farmer, V.C. The Infrared Spectra of Minerals; Mineralogical Society: Chantilly, VA, USA, 1974; p. 539. [Google Scholar]
  28. Costanzo, P.M. Baseline Studies of the Clay Minerals Society Source Clays: Introduction. Clays Clay Miner. 2001, 49, 372–373. [Google Scholar] [CrossRef]
  29. Fan, M.; Yuan, P.; Zhu, J.; Chen, T.; Yuan, A.; He, H.; Chen, K.; Liu, D. Core-Shell Structured Iron Nanoparticles Well Dispersed on Montmorillonite. J. Magn. Magn. Mater. 2009, 321, 3515–3519. [Google Scholar] [CrossRef]
  30. Green-Pedersen, H.; Pind, N. Preparation, Characterization, and Sorption Properties for Ni(II) of Iron Oxyhydroxide-Montmorillonite. Colloids Surf. A Physicochem. Eng. Asp. 2000, 168, 133–145. [Google Scholar] [CrossRef]
  31. D’Cruz, B.; Madkour, M.; Amin, M.O.; Al-Hetlani, E. Efficient and Recoverable Magnetic AC-Fe3O4 Nanocomposite for Rapid Removal of Promazine from Wastewater. Mater. Chem. Phys. 2020, 240, 122109. [Google Scholar] [CrossRef]
  32. Sondi, I.; Biscan, J.; Pravdic, V. Electrokinetics of Pure Clay Minerals Revisited. J. Colloid Interface Sci. 1996, 178, 514–522. [Google Scholar] [CrossRef]
  33. Guz, L.; Curutchet, G.; Torres Sánchez, R.M.; Candal, R. Adsorption of Crystal Violet on Montmorillonite (or Iron Modified Montmorillonite) Followed by Degradation through Fenton or Photo-Fenton Type Reactions. J. Environ. Chem. Eng. 2014, 2, 2344–2351. [Google Scholar] [CrossRef]
  34. Miller, S.; Low, P. Characterization of the Electrical Double Layer of Montmorillonite. Langmuir 1990, 11, 572–578. [Google Scholar] [CrossRef]
  35. Illés, E.; Tombácz, E. The Effect of Humic Acid Adsorption on pH-Dependent Surface Charging and Aggregation of Magnetite Nanoparticles. J. Colloid Interface Sci. 2006, 295, 115–123. [Google Scholar] [CrossRef] [PubMed]
  36. Favela-Camacho, S.E.; Samaniego-Benítez, E.J.; Godínez-García, A.; Avilés-Arellano, L.M.; Pérez-Robles, J.F. How to Decrease the Agglomeration of Magnetite Nanoparticles and Increase Their Stability Using Surface Properties. Colloids Surf. A Physicochem. Eng. Asp. 2019, 574, 29–35. [Google Scholar] [CrossRef]
  37. Luengo, C.; Puccia, V.; Avena, M. Arsenate Adsorption and Desorption Kinetics on a Fe(III)-Modified Montmorillonite. J. Hazard. Mater. 2011, 186, 1713–1719. [Google Scholar] [CrossRef]
  38. Ren, X.; Zhang, Z.; Luo, H.; Hu, B.; Dang, Z.; Yang, C.; Li, L. Adsorption of Arsenic on Modified Montmorillonite. Appl. Clay Sci. 2014, 97, 17–23. [Google Scholar] [CrossRef]
  39. Akin, I.; Arslan, G.; Tor, A.; Ersoz, M.; Cengeloglu, Y. Arsenic(V) Removal from Underground Water by Magnetic Nanoparticles Synthesized from Waste Red Mud. J. Hazard. Mater. 2012, 235, 62–68. [Google Scholar] [CrossRef]
Figure 1. X-ray diffraction data of raw Mt, Fe3O4, a physical mixture of raw Mt and Fe3O4 powders (F = 0.60), and Mt–Fe3O4(0.60). The reflections of montmorillonite (M), gypsum (G), and quartz (Q) are indicated in the Mt diffractogram. The reflections of montmorillonite are also indicated in the diffractogram of the physical mixture.
Minerals 11 00927 g001
Figure 2. IR spectra of selected samples.
Minerals 11 00927 g002
Figure 3. Zeta potential vs. pH data of the different studied solids. F values are given in the graph.
Minerals 11 00927 g003
Figure 4. Zeta potential distributions of Mt, Fe3O4, and selected Mt–Fe3O4 mixtures at pH 4.5. F values are given in the graph.
Minerals 11 00927 g004
Figure 5. Photographs of capped test tubes with dispersions of Mt–Fe3O4 mixtures of different composition under the effect of a magnetic field. Each row represents one dispersion (with the corresponding F value indicated on the left side of the row) after different magnetization times. The zero time corresponds to dispersions before magnetization. Other time values correspond to the time elapsed after placing the magnet in contact with the tubes. It is seen that the particle cloud (p.c.) becomes contracted and attracted by the magnet as time increases.
Minerals 11 00927 g005
Figure 6. MB+(a,b) and As(V) (c,d) adsorption on Mt–Fe3O4 mixtures as a function of composition. Initial concentration of MB+ = 2 × 10⁻⁴ M and As(V) = 1.6 × 10⁻⁴ M. Adsorption results are expressed on a per gram of Mt–Fe3O4 basis (left panels) or a per gram of Mt or Fe3O4 basis (right panels).
Minerals 11 00927 g006
Figure 7. MB+(a,b) and As(V) (c,d) adsorption isotherms on Mt, Fe3O4, and Mt–Fe3O4 mixtures (F values indicated in the graphs). Adsorption results are expressed per gram of Mt–Fe3O4 (a,c), per gram of Mt (b), or per gram of Fe3O4 (d). Symbols in b and d are the same as in a and c, respectively. Error bars (±2 sd) are placed only in selected curves for clarity.
Minerals 11 00927 g007
Figure 8. Representative scheme of Mt–Fe3O4 co-aggregates, with adsorbed MB+ and As(V). Mt layers are seen from a side view.
Minerals 11 00927 g008
Publisher’s Note: MDPI stays neutral with regard to jurisdictional claims in published maps and institutional affiliations.

