Article

Experimental Study on the Effect of Freeze—Thaw Cycles on the Mineral Particle Fragmentation and Aggregation with Different Soil Types

1
Institute of Cold Regions Science and Engineering, School of Transportation, Northeast Forestry University, Harbin 150040, China
2
Institute of Cold Regions Science and Engineering, School of Civil Engineering, Northeast Forestry University, Harbin 150040, China
3
Melnikov Permafrost Institute, Siberian Branch, Russian Academy of Science, 677010 Yakutsk, Russia
4
State Key Laboratory of Frozen Soil Engineering, Northwest Institute of Eco-Environment and Resources, Chinese Academy of Sciences, Lanzhou 730000, China
5
University of Chinese Academy of Sciences, Beijing 100049, China
*
Author to whom correspondence should be addressed.
Minerals 2021, 11(9), 913; https://doi.org/10.3390/min11090913
Submission received: 24 July 2021 / Revised: 19 August 2021 / Accepted: 19 August 2021 / Published: 24 August 2021

Abstract

:
The freeze–thaw cycle can change the size and shape of soil particles, that is, cause fragmentation and aggregation of soil mineral particles, thereby affecting the soil structure, which, in turn, affects the soil properties. In addition, the process of soil mineral fragmentation and aggregation, as an event closely related to the cold climate, plays an irreplaceable role in reconstructing the climatic conditions of a certain area and a certain period of time and has important referential significance for the restoration of historical permafrost boundaries and the study of climate change. Therefore, in order to better study the effect of freeze–thaw cycles on the fragmentation and aggregation of soil mineral particles, four soil specimens were selected for this study; the freeze–thaw cycle tests were carried out 0, 3, 6, 9, 50, and 100 times, respectively, and the test results were analyzed. The results of these experiments indicate that (1) after freeze–thaw cycles, the changes in grain-size distribution are different in various soil types, and the changes are mainly concentrated in 0.001–0.1 mm; (2) the coarse particle size particles (sand, silt) can be fragmented into relatively fine-grained particles (silt, clay). The fine-grained particles (clay) cannot undergo fragmentation, and the decrease in clay is due to its aggregation; (3) with the increase in freeze–thaw cycles, the fraction change trend of four specimens is parallel to the x-axis, which means the fragmentation and aggregation of soil mineral particles are in a state of equilibrium or balance; (4) the increase in the Kvar value indicates the change in grain-size distribution, which means aggregation and fragmentation of soil mineral particles. After the 100th cycle, the Kvar value of four specimens is <0.1, which belongs to a low-intensity area; (5) the freeze–thaw cycle will change the type of soil, and after 100 freeze–thaw cycles, the soil type of specimen (H) changes from silty clay loam to silty clay; (6) during the freeze–thaw process, different types of soil have different situations of aggregation and fragmentation.

1. Introduction

As the atmospheric temperature changes periodically with the seasons, the soil in the seasonal and permafrost regions will inevitably undergo a periodic freeze–thaw process; the ground surface experiences more than 100 freeze–thaw cycles within a year [1]. Different freeze–thaw conditions will cause the soil to form different types of texture and structure [2,3,4]. In addition, the process of freeze–thaw cycle is accompanied by temperature changes, and this change causes energy input and output [5]. During this process, water and salt transfer cause changes in soil structure, with the initial stable state of soil particles being changed through aggregation and fragmentation, causing changes in grain-size distribution. These changes may result in further variations in soil, including its composition, structure, and characteristics, all of which can lead to ecological (water-retention and nutrient-preservation capabilities, resulting in water loss, grassland degradation, desertification, etc.) and engineering (soil strength, bearing capacity of foundations, capillary water pressure in soil, and soil’s plasticity and collapsibility) problems [6]. In geology, this process is the main cause of physical weathering, and the freezing process is also called a freezing weathering process [7]. In the process of freezing weathering, the deformation and stress generated between soil mineral particles are also different; this stress is positively correlated with the magnitude of temperature change and can even reach a level of KMPa [8]. Studies have found that the magnitude of freezing weathering is directly proportional to the number of freeze–thaw cycles and moisture content.
There are two main stages in the freezing weathering process of soil mineral particles [9]. In the first stage, driven by the temperature tension and the water phase change in the soil, cracks will occur on the surface of coarse mineral particles. When the soil–water enters the microscopic cracks at the surface of the minerals and freezes, the 9% volume increase of freezing water [10] causes the particles’ microcracks to widen into large crack systems. In the second stage, under repeated freeze–thaw cycles, the cracks in the soil mineral particles further develop until they penetrate the particles, which eventually cause fragmentation of minerals [11].
In the process of freezing, the soil mineral particles are not only fragments but also aggregates, because the fragmentation of coarse grains and the aggregation of fine grains are synchronized [12]. The aggregation occurs due to the effect of the double electron layer [13]. The aggregation process of fine-grained soil (clay minerals such as montmorillonite, illiterate, and kaolinite) is as follows: the surfaces of soil clay mineral particles carry negative electric charges, attracting the positive end of water molecules, which causes some additional forces between soil mineral particles. The freeze–thaw cycles can enhance the formation of intermolecular associations between the surfaces of mineral particles, thereby having greater mineral–mineral binding capacity. Soil minerals are mutually bound to positively charged polyvalent metal cations. When the liquid phase changes to the solid phase, the volume of water increases by about 9%. In confined volume, the expansion pressure can be close to 1.4 × 10⁴ kPa during ice formation. Under great pressure, the fine-grained soil aggregates, and may recrystallize into new mineral crystals. The process of soil mineral aggregation can be divided into two situations: the first is the aggregate formed by clay minerals and clay minerals, and the other is the aggregate wrapped by clay mineral particles with sand mineral particles as the core [14].
After fragmentation and aggregation, the structure of the soil, the arrangement, and the connection of soil mineral particles will change [15,16,17,18,19,20]. In addition, the process of soil mineral fragmentation and aggregation under the action of freeze–thaw is essentially a cryogenic weathering process (physical weathering). This change is the information carrier of the cryogenic environment evolution process, and it also records the evolution and development process of the cryogenic environment since the Quaternary [21,22].
Furthermore, the process of soil mineral fragmentation and aggregation, as an event closely related to the cold climate, plays an irreplaceable role in reconstructing the climatic conditions of a certain area and a certain period of time and has important reference significance for the restoration of historical permafrost boundaries and the study of climate change [23,24]. Therefore, in order to better study the evolution process of the cryogenic environment evolution process in the future, four soil specimens were selected to undergo 0, 3, 6, 9, 50, and 100 freeze–thaw cycles to analyze their fragmentation and aggregation laws. In what follows, the soil mineral grain-size distribution changes are analyzed, and the change process of soil types is discussed.

2. Materials and Methods

2.1. Test Soil Specimens
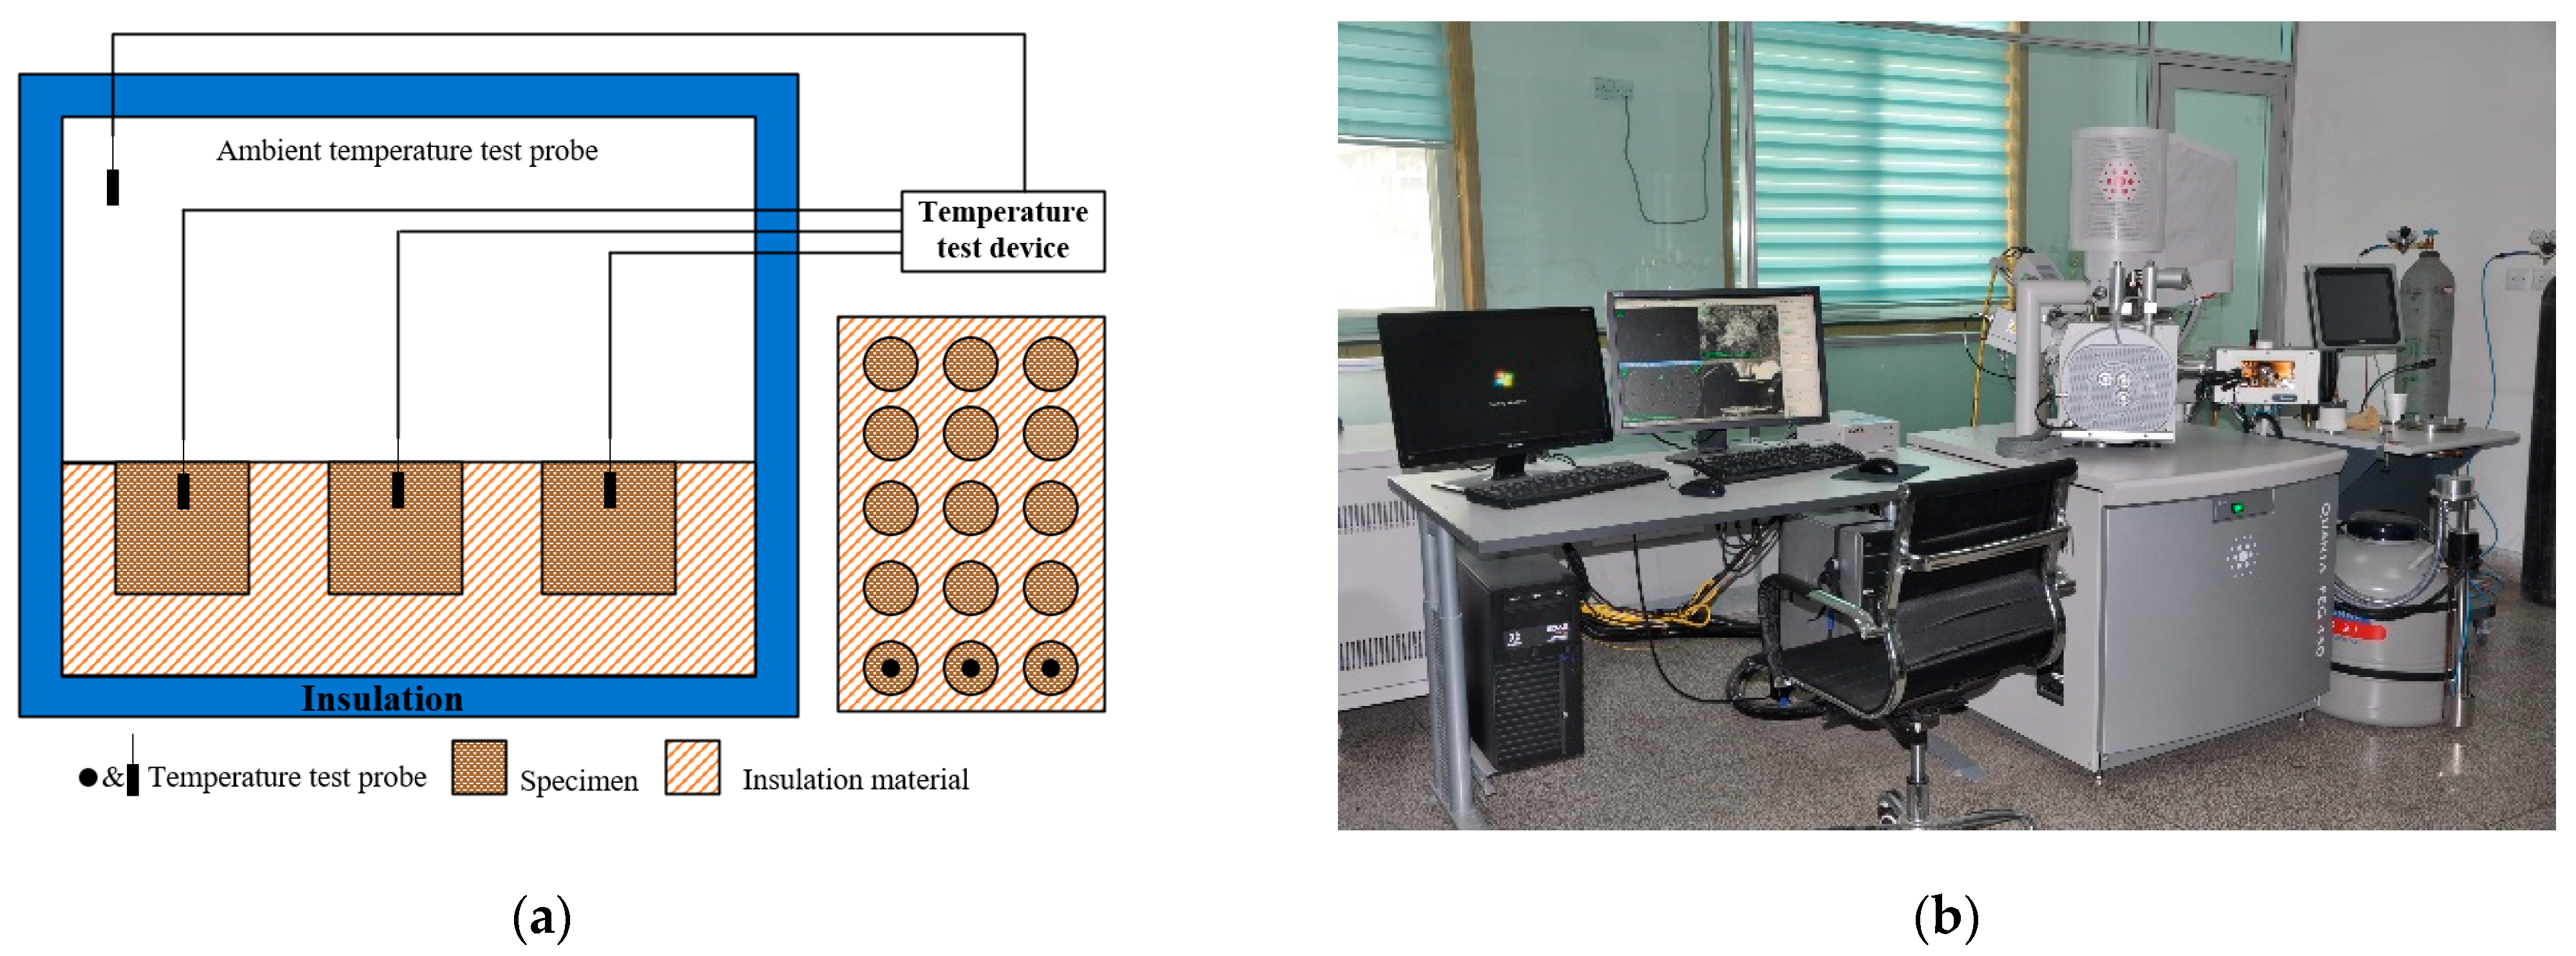
We selected representative samples from the Qinghai Tibet Plateau. The soil types in the area include Adamic earth (T), Qinghai-Tibet silty red clay (H), Lanzhou Loess (G), Haidong Loess (L). The physical properties and particle size distribution of the four soil specimens are shown in Table 1. The test process shall be carried out according to the “Standard for Geotechnical Testing Method”.

2.2. Test Equipment

The freeze–thaw cycle test of the soil specimens was carried out in the freeze–thaw cycle test chamber (Figure 1a). The soil sample was saturated by the vacuum-pumping saturation method, and the specimens were in a closed system without water supplement; the temperature of the freeze–thaw test was set to form +20 °C to −20 °C for analyzing the three-dimensional freezing and thawing behavior. The freezing and thawing states of the soil specimens were determined by the temperature probe installed inside the specimens. The freeze–thaw temperature control was determined by the temperature in the soil specimens.
In order to study the fragmentation and aggregation of mineral particles after the freeze–thaw process and better analyze the fragmentation and aggregation of mineral particles in different soil samples, the images of freeze–thaw samples were obtained by the Quanta FEG-450 FEI (State Key Laboratory of Frozen Soil Engineering, Chinese Academy of Sciences, Lanzhou, China) scanning electron microscope (Figure 1b). Main performance indicators of the instrument include the following features: (1) resolution: high vacuum 1.2 nm at 30 kV (SE), low vacuum 1.4 nm at 30 kV (SE), ambient vacuum 1.4 nm at 30 kV (SE); (2) magnification: 6–1,000,000×; (3) image processor: the maximum pixel is 4096 × 3536.

2.3. Test Program

The four soil specimens were air-dried naturally, crushed, and sieved (2 mm), and the soil specimens were used for freeze–thaw cycles tests. Due to the complexity of freeze–thaw test, there is thus far no unified test standard to follow. According to the research experience of domestic and foreign scholars [25,26,27], we conducted preliminary experiments on specimens to determine the maximum freeze–thaw time. The time required for the soil specimens to be completely frozen and thawed is 4 h. Thus, the freeze–thaw cycle period is 8 h. This experiment was planned to take specimens and tests after 0, 3, 6, 9, 50, and 100 freeze–thaw cycles. Each specimen had 6 groups according to the number of cycles, and each group had at least 2 parallel test specimens, and a total of at least 72 specimens were required. The soil standard prototype was used to make specimens in the standard ring knife to minimize the influence on the physical parameters of the specimens, so as to assure the unity of the specimens and the credibility and contrast of the test results. The prepared specimens were vacuum-saturated and sealed up and down with cling film to maintain the closed state of the system conditions.
After the specimens were ready, the freeze–thaw cycle test chamber (Figure 1a) was used to perform freeze–thaw cycles on the specimens. After reaching the number of freeze–thaw cycles, the specimens were taken out for testing, and the remaining specimens continued to freeze–thaw cycle tests until all the planned freeze–thaw cycles were completed. After the freeze–thaw cycle, according to the “Standard for Geotechnical Testing Method,” we used a wet gravitational separation method to test the grain-size distribution of the soil specimens before and after the freeze–thaw cycle, and the mass percentage of the soil specimens was measured. After reaching the planned number of freeze–thaw cycles, the specimens were subjected to (1) fixation and dehydration, (2) drying, (3) plating, and (4) scanning electron microscope.

3. Results and Analysis

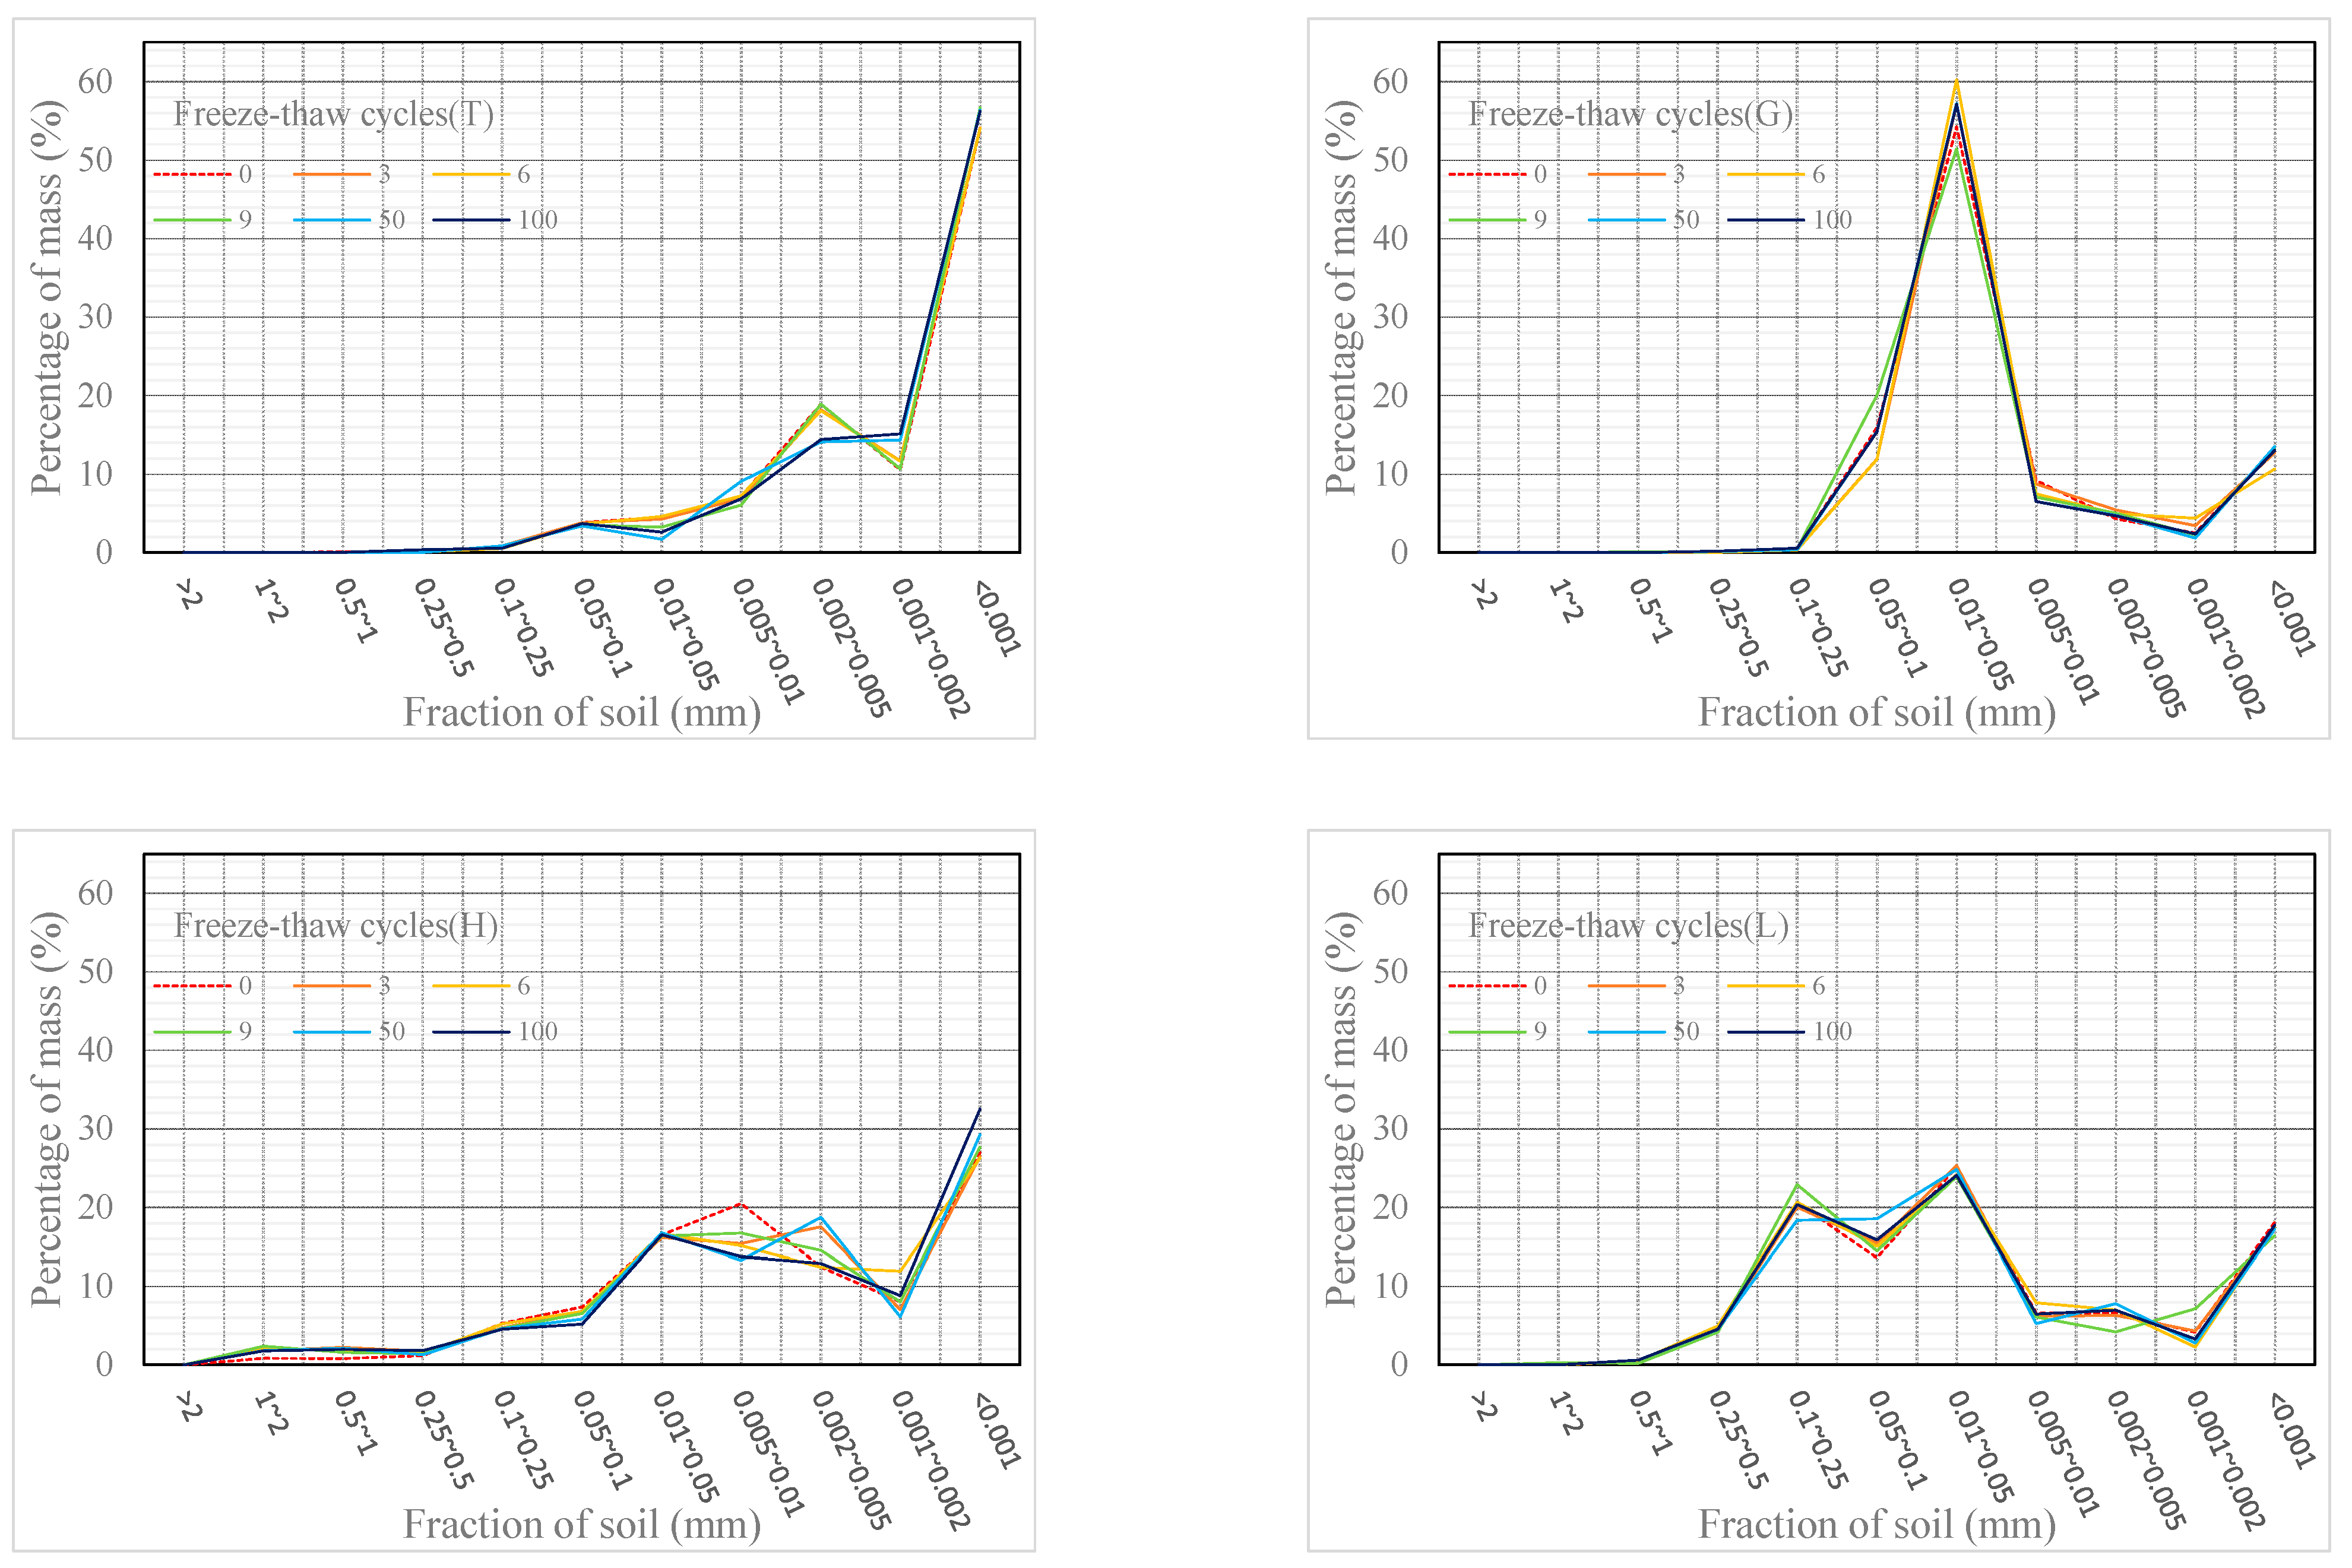
3.1. The Changes of Grain-Size Distribution of Soil Semi-Logarithmic Curve with Different Numbers of Freeze–Thaw Cycles

The freeze–thaw cycle can cause the fragmentation and aggregation of soil mineral particles, that is, change the size and shape of soil particles. Therefore, in order to investigate the effect of freeze–thaw on the grain-size distribution of minerals, the changes of four samples under freeze–thaw were monitored. The result is shown in Figure 2.
From the results, we can deduce that for four specimens, the grain-size distribution has changed, but the degrees of change are different. With the increase in freeze–thaw cycles, the content of fine particles increases. The fraction of 0.001–0.1 mm changes considerably, while 0.1–2 mm changes are not obvious, except for specimen (H). There are fewer changes in the grain-size distribution of specimen (G) and specimen (L), while specimen (H) changes greatly, and the variation range is also wide. To summarize, the change in size fraction is different in diverse soil types after the freeze–thaw process. The main change in grain-size distribution is fine-grained soil, and the granulometric change is mainly concentrated in 0.001–0.1 mm.

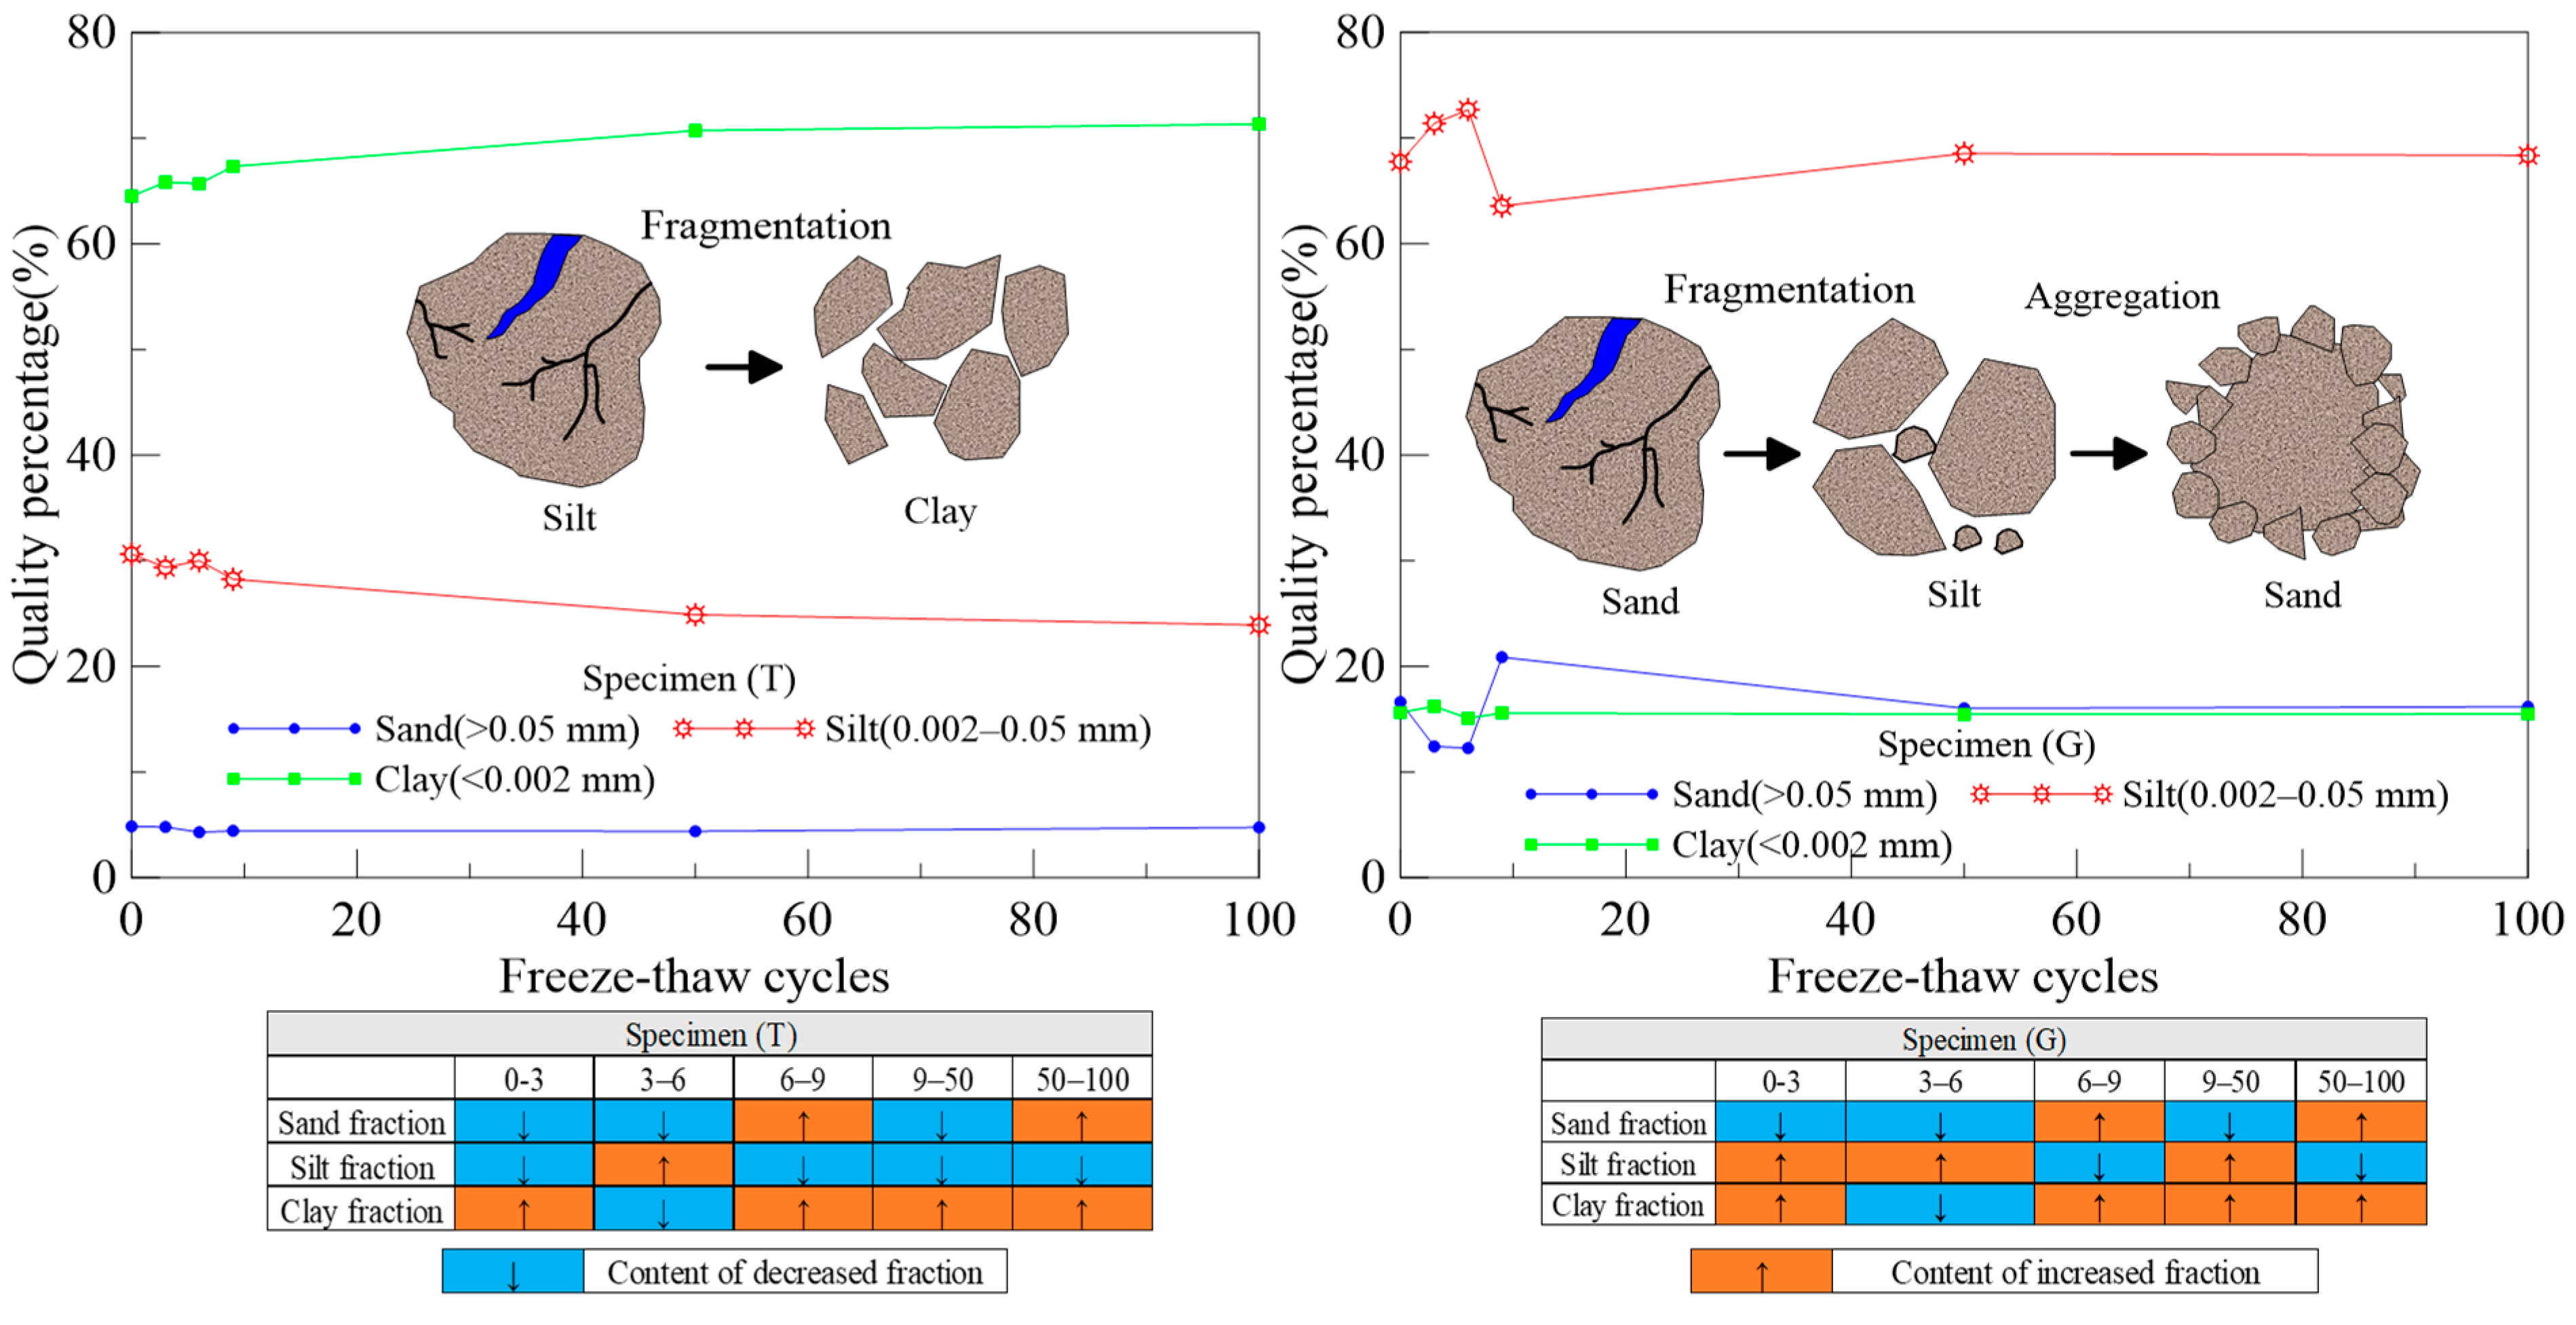
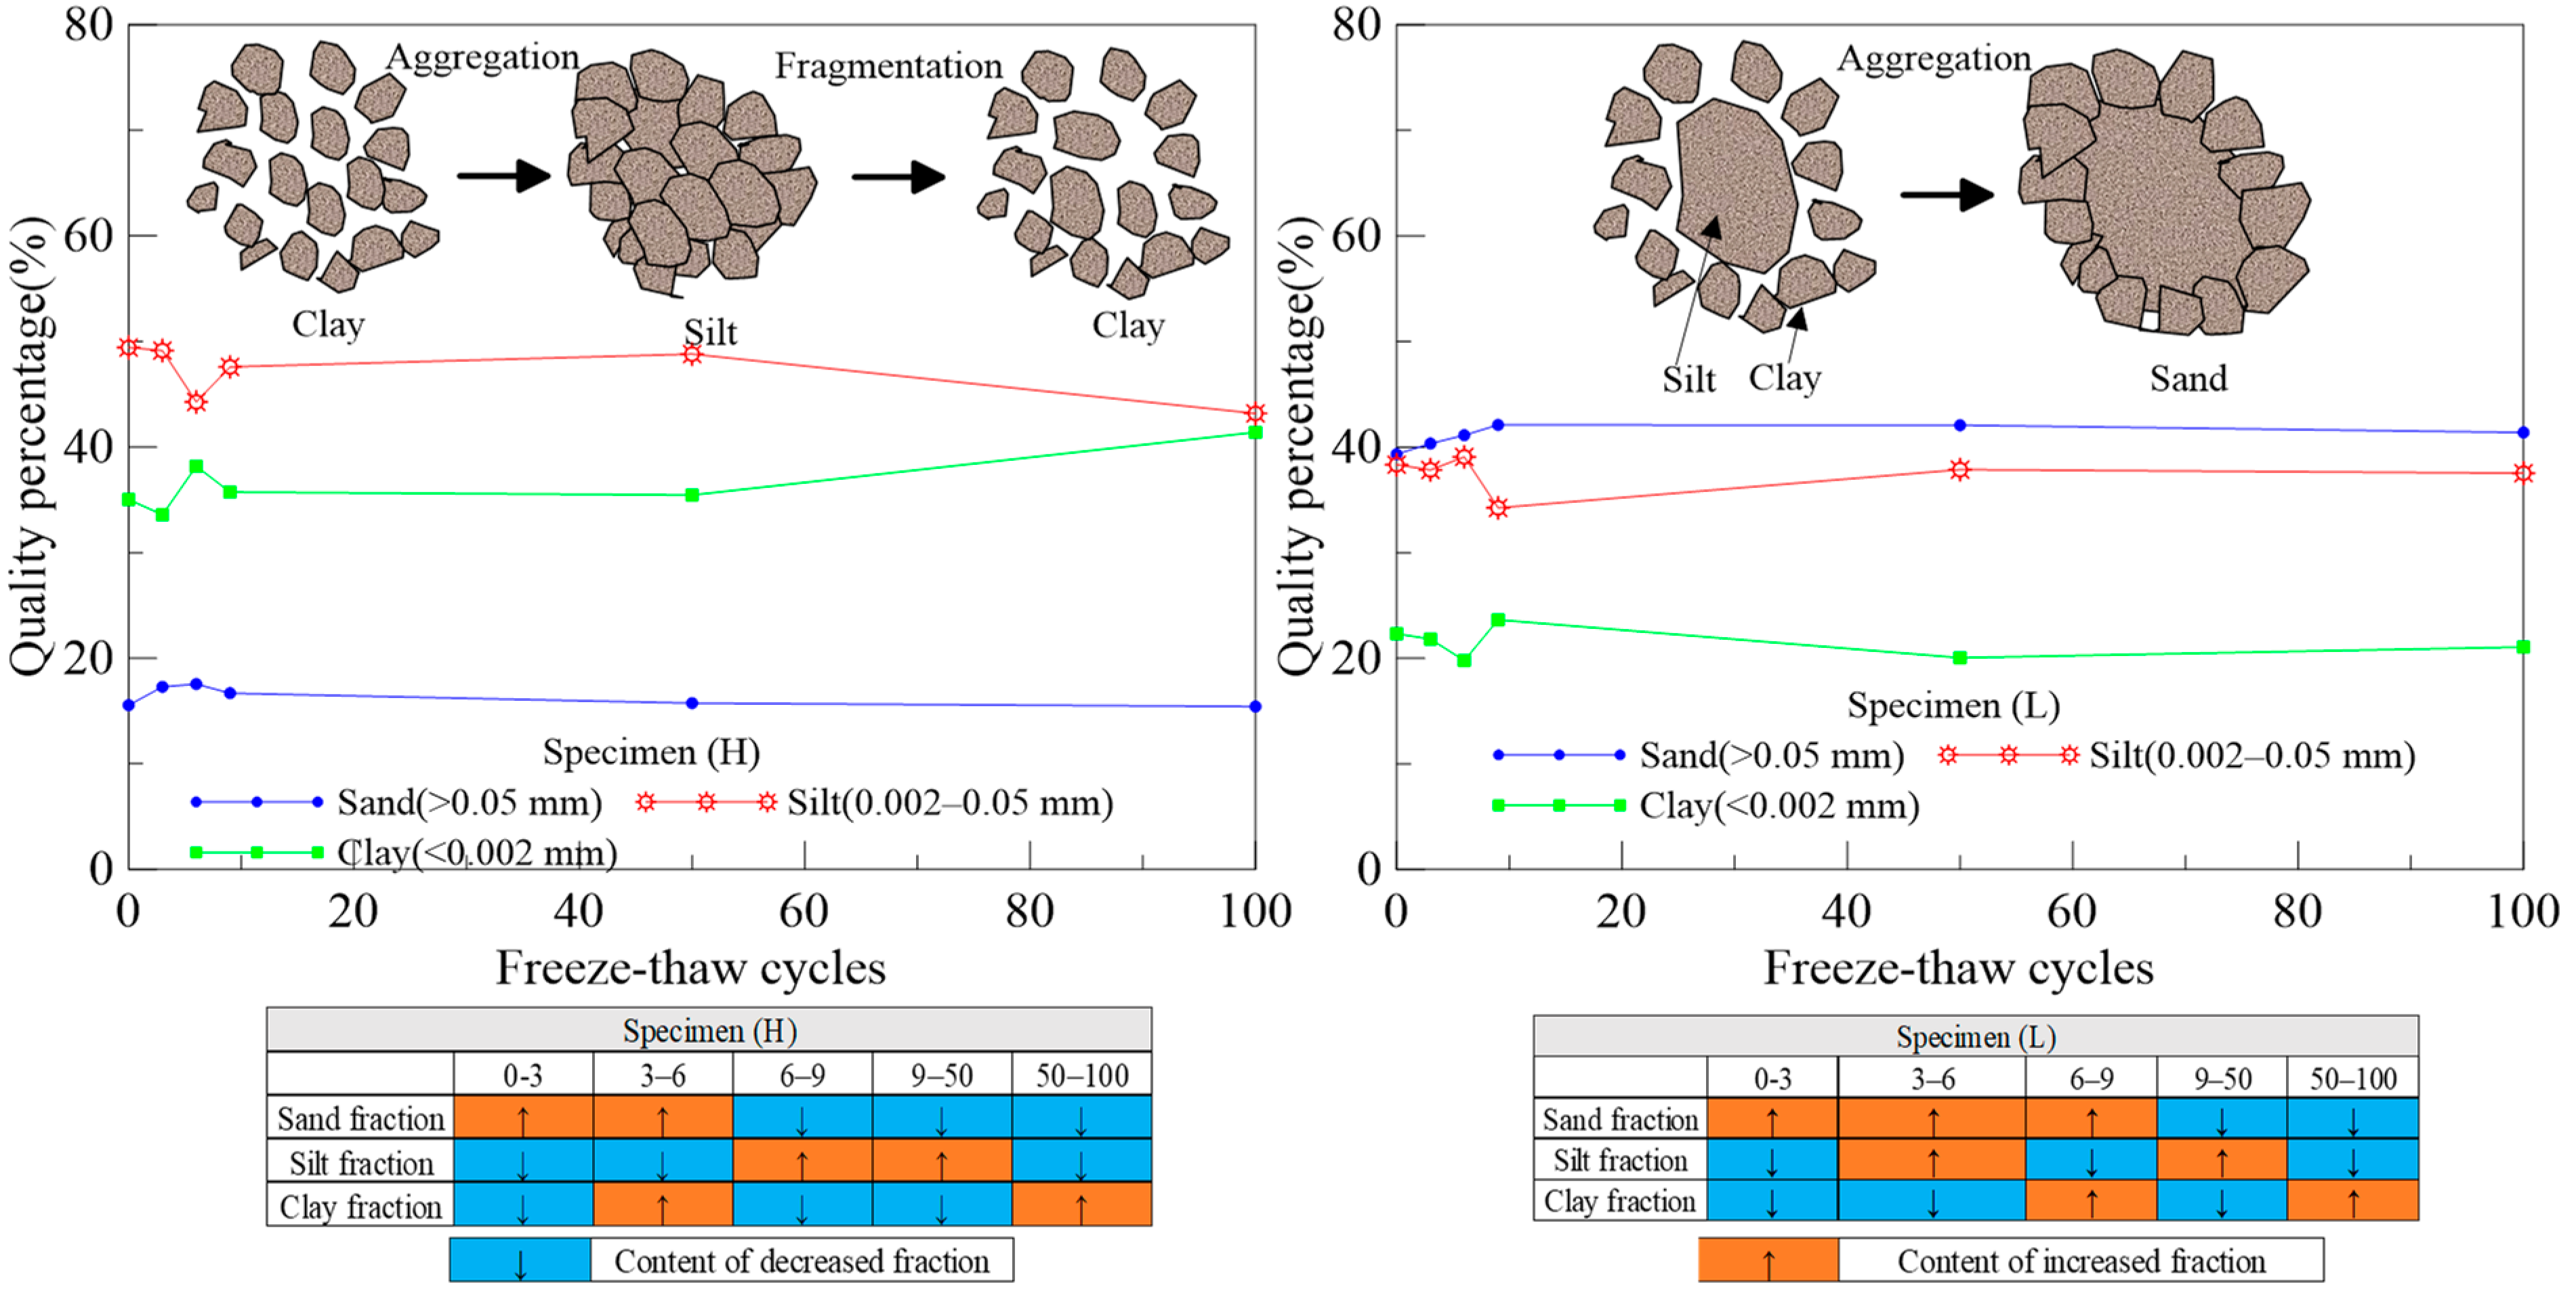
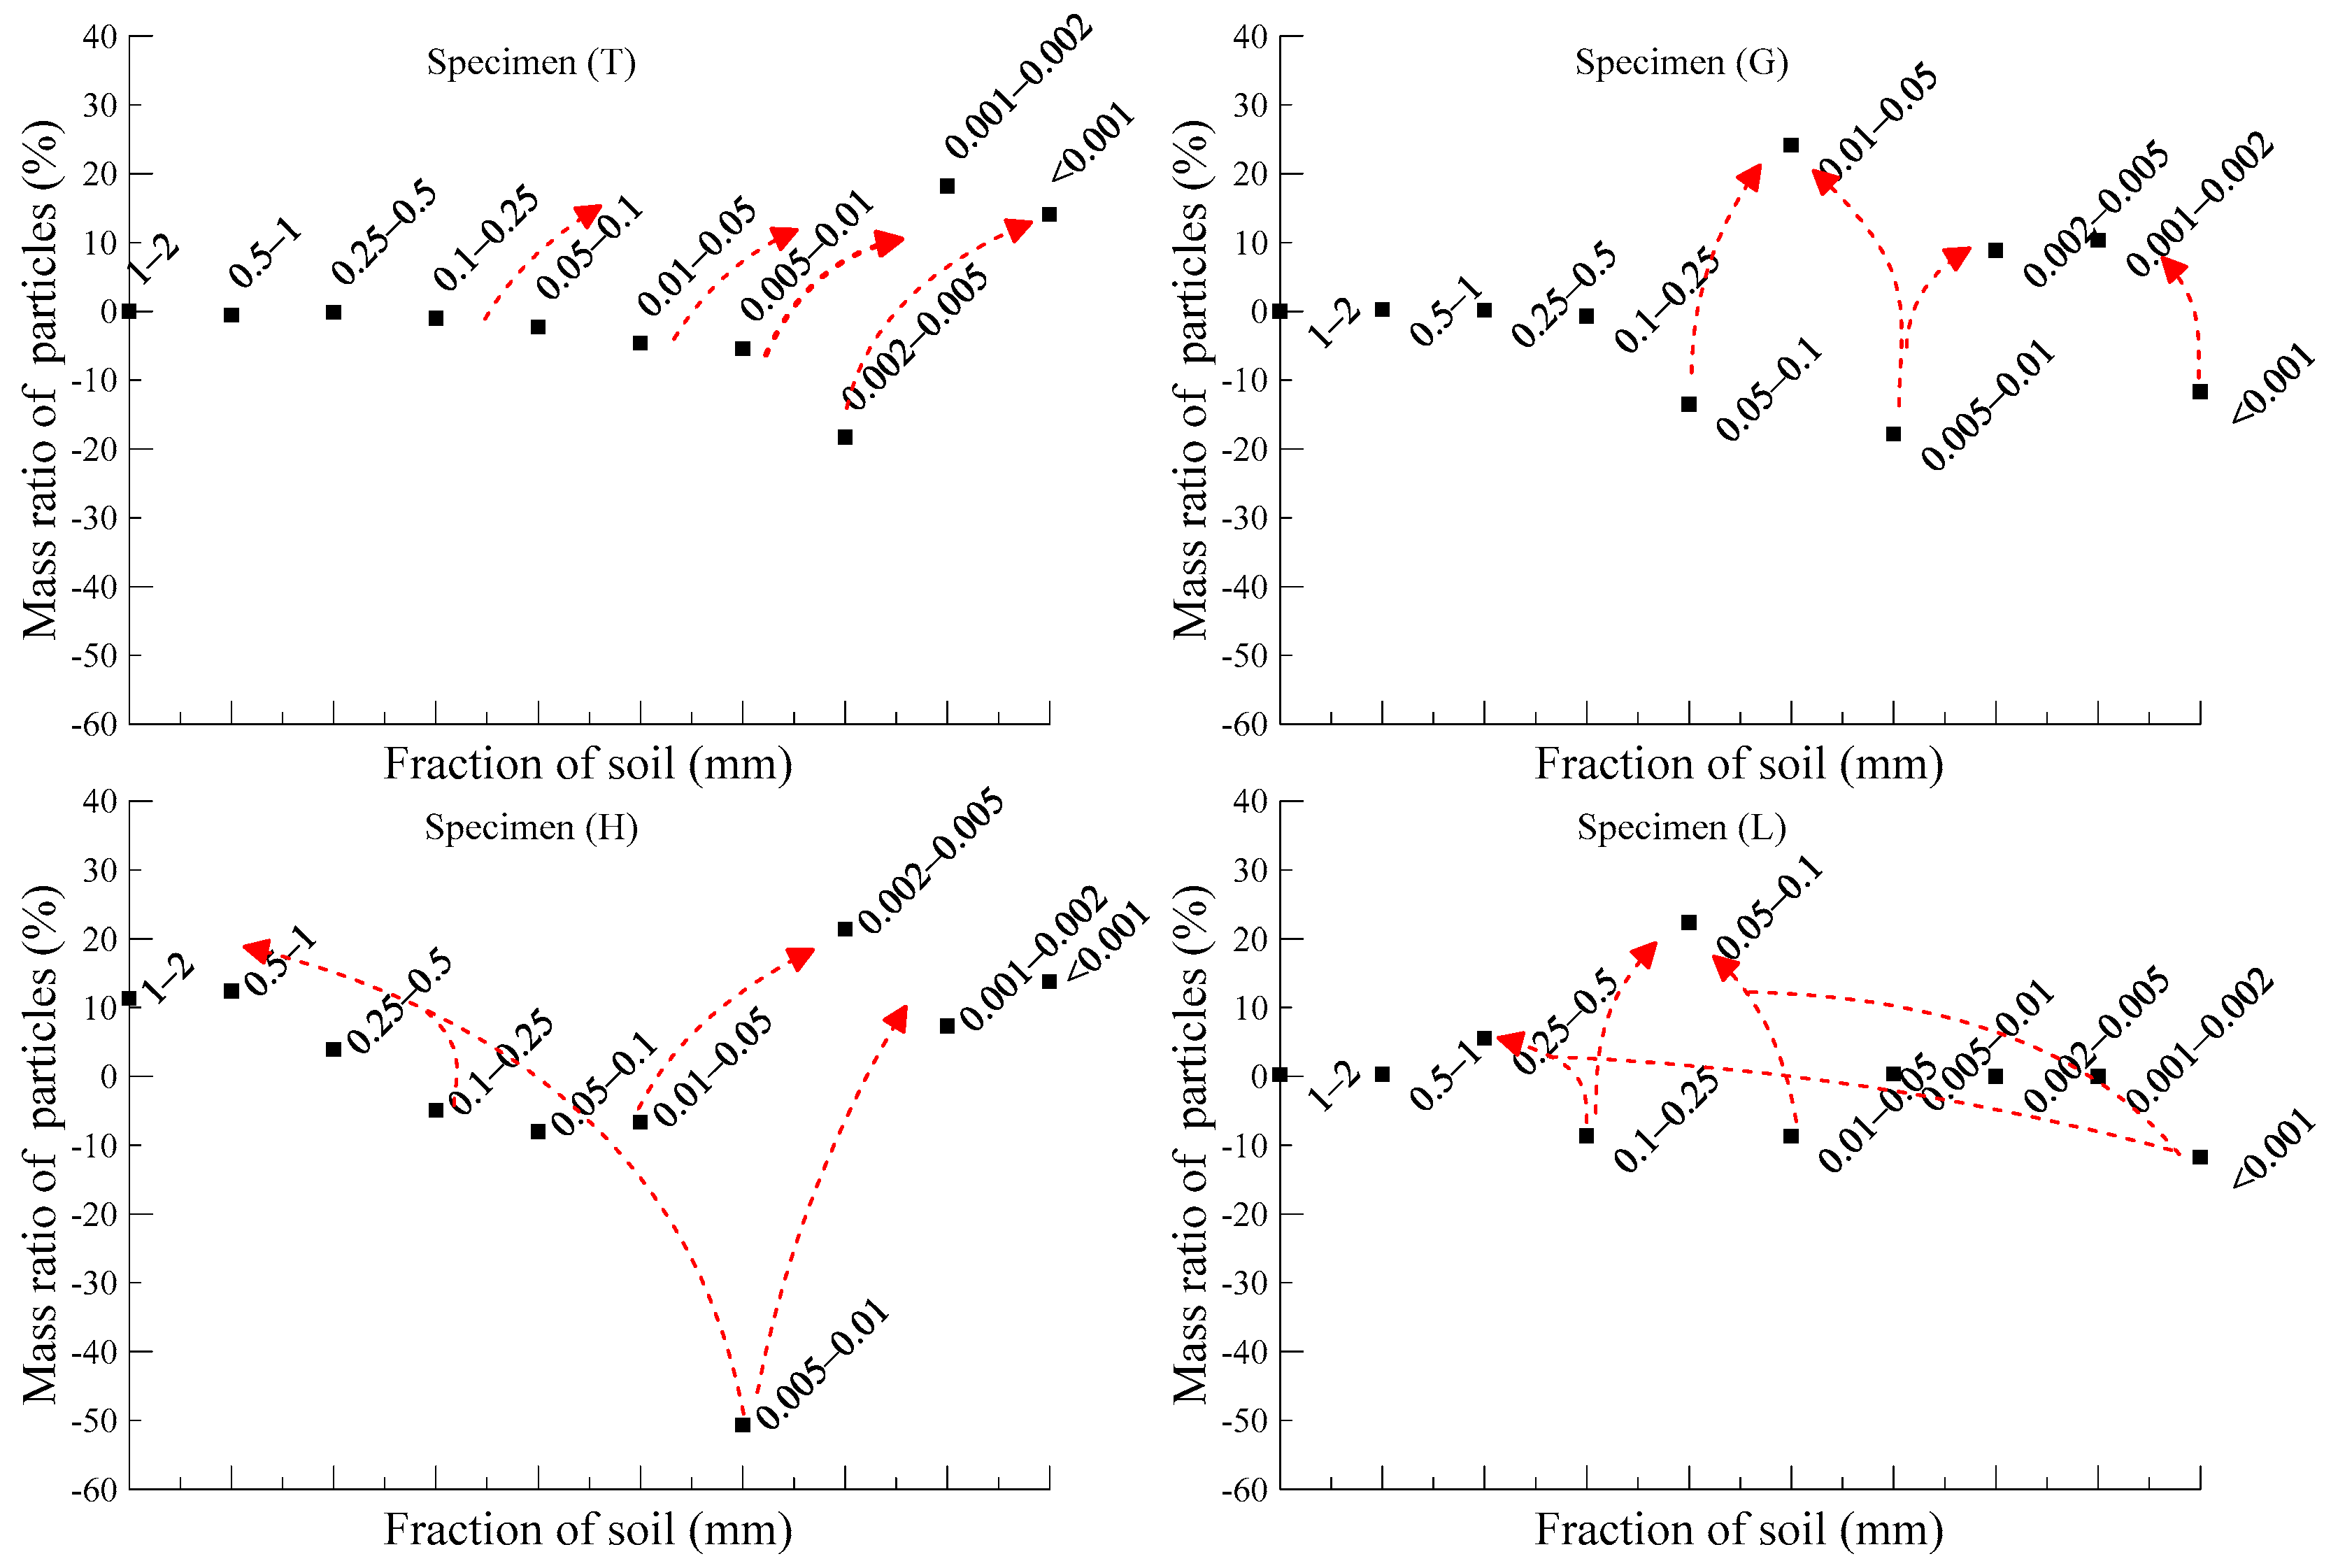
3.2. The Changing of the Soil Fraction during the Freeze–Thaw Process

The change in grain-size distribution changes the mass fraction of sand, silt, and clay in the soil. According to the percentage change in sand, silt, and clay in the freeze–thaw process(see Figure 3).
As can be observed from the figure, with the increase in freeze–thaw cycles, the change in the sand of specimen (T) is small, while the change in clay and silt is considerable. Furthermore, the change in silt is inversely related to the change in clay; when the silt percentage increases, the clay decreases, and vice versa. The changes in clay and silt are in a conjugated relationship. Overall, specimen (T) mainly occurs in the process of fragmentation from silt to clay, which leads to the decrease in silt percentage and the increase in clay percentage.
Different from specimen (T), the sand increase in specimen (G) corresponds to the silt decrease. After freeze–thaw, specimen (G) mainly occurs during the process of sand fragmenting into silt and silt aggregating into sand. The process of fragmentation and aggregation will lead to an increase or decrease in clay particles. After the 50th cycle, the percentage of sand, silt, and clay are stable and basically unchanged.
After the freeze–thaw cycles, the mineral particles of specimen (H) are also fragmented and aggregated. After the third freeze–thaw cycle, with the increase in freeze–thaw cycles, the silt and clay show a strong correlation. When the silt content increased, the clay content decreased, and vice versa. In addition, different from other specimens, after the 50th freeze–thaw cycle, the silt and clay of specimen (H) also changed significantly.
In 0–3 freeze–thaw cycles, the silt and clay of specimen (L) aggregate to form sand. After the third freeze–thaw cycle, the silt and clay of specimen (L) show a strong correlation.
According to the analysis results of the above four specimens, in the freeze–thaw process, except for specimen (G), the other three specimens are mainly transformed between silt and clay, and the final result indicates that silt decreases and clay increases. However, specimen (G) mainly occurs during the process of sand fragmenting into silt and silt aggregating into sand, and the final result shows that the content of each component changed little.
Further analysis found that the coarse particles (sand, silt) can be fragmented into relatively fine-grained particles (silt, clay), resulting in a decrease in coarse particle size. The fine particles (clay) can aggregate by themselves (clay) or with relatively coarse particles (silt). The clay cannot fragment, and the decrease in clay is due to its aggregation. This is because, on the one hand, in the clay particles, a large number of water molecules exist in the state of bound water, and the unfrozen water content is much larger than that in the coarse particles; therefore, the fragmentation cannot occur; on the other hand, the particle size of clay is small, and the stress generated by freeze–thaw action on more particles reduces the stress on a single particle.
In order to verify the viewpoint of the soil mineral fragmentation and aggregation, a particle image processor was used to observe soil particles after freeze–thaw. As displayed in Figure 4, the soil particles of specimen (G) have changed, which confirms our hypothesis and corroborates the process regarding specimen (G) in Figure 3, i.e., initially experiencing fragmentation, then aggregation, and eventually fragmentation. Due to the limitation of the magnification of the particle image processor, except for specimen (G), the fragmentation and aggregation between the silt particles and the clay particles in the remaining three specimens cannot be observed. Therefore, as shown in Figure 5, we used the scanning electron microscope method to scan the four specimens after freeze–thaw cycles and observe the fragmentation and aggregation of the four samples through the electron microscope image of the soil particles.
It can be noticed from Figure 5 that specimen (T) experiences fragmentation from silt particles to clay particles. In specimen (G), the sand particles are fragmented into silt particles and clay particles, and the silt particles are used as the core, and clay particles are used as the inclusion to aggregate into sand particles. In specimen (H), the clay particles and clay particles aggregate into form silt particles. In specimen (L), the silt particles are used as the core, and clay particles are used as the inclusion to aggregate into sand particles.
To further determine dynamic changes of the soil fraction, we used the parameter of mass change for each fraction, which can be expressed as follows:
Δ M = A i B i n
where A is the content of fraction before the freeze–thaw test; B is the content of fraction after the freeze–thaw test; i is the different fraction; n is the number of freeze–thaw cycles.
Figure 6 shows the results with respect to the process of the increase and decrease in fractions under the freeze–thaw effect. The overall view from Figure 6 that the specimen (T) had positive changes in the range of fractions at 0.001–0.002 mm, and negative changes at 0.002–0.005 mm and 0.01–0.05 mm, but other changes were not obvious; specimen (G) had positive changes in the range of fractions at 0.01–0.05 mm and 0.002–0.005 mm, and negative changes at 0.005–0.01 mm; in addition, specimen (H) had positive changes in the range of fractions at 1–2 mm and 0.001–0.002 mm, and negative changes at 0.005–0.01 mm and 0.05–0.1 mm. However, there are positive and negative changes in the range of fractions at 0.001–0.002 mm and 0.01–0.05 mm. As mentioned above, the specimen (L) also had positive changes in the range of fractions at 0.05–0.1 mm and 1–2 mm, and negative changes at 0.01–0.05 mm and 0.001–0.002 mm.
In addition, from the final results, at the 100th freeze–thaw cycles, specimen (T) increased in the range of fractions at 0.001–0.002 mm and decreased to 0.002–0.005 mm and 0.01–0.05 mm. This provides evidence for the silt fragmenting into clay in specimen (T) in Figure 3; specimen (G) increased in the range of fractions at 1–2 mm and decreased at 0.005–0.01 mm. This corresponds to the mutual transformation of silt and sand in specimen (G) in Figure 3; specimen (H) decreased in the range of fractions at 0.005–0.01 mm and 0.05–0.1 mm; specimen (L) increased in the range of fractions at 0.05–0.1 mm and decreased at 0.001–0.002 mm and 0.01–0.05 mm.
Further analysis shows that with the increase in freeze–thaw cycles, the changing trend of the sample tends toward zero. After 50 freeze–thaw cycles, the fraction of soil mineral particles size changes little. In other words, with the increase in freeze–thaw cycles, the fraction of soil in a certain particle size range will not change. This is due to the fact that the fragmentation of coarse grains and the aggregation of fine grains were synchronized during the freeze–thaw process. We can infer that the grain-size distribution tends to be steady, which means that the fragmentation and aggregation of soil mineral particles are in a state of equilibrium or balance.

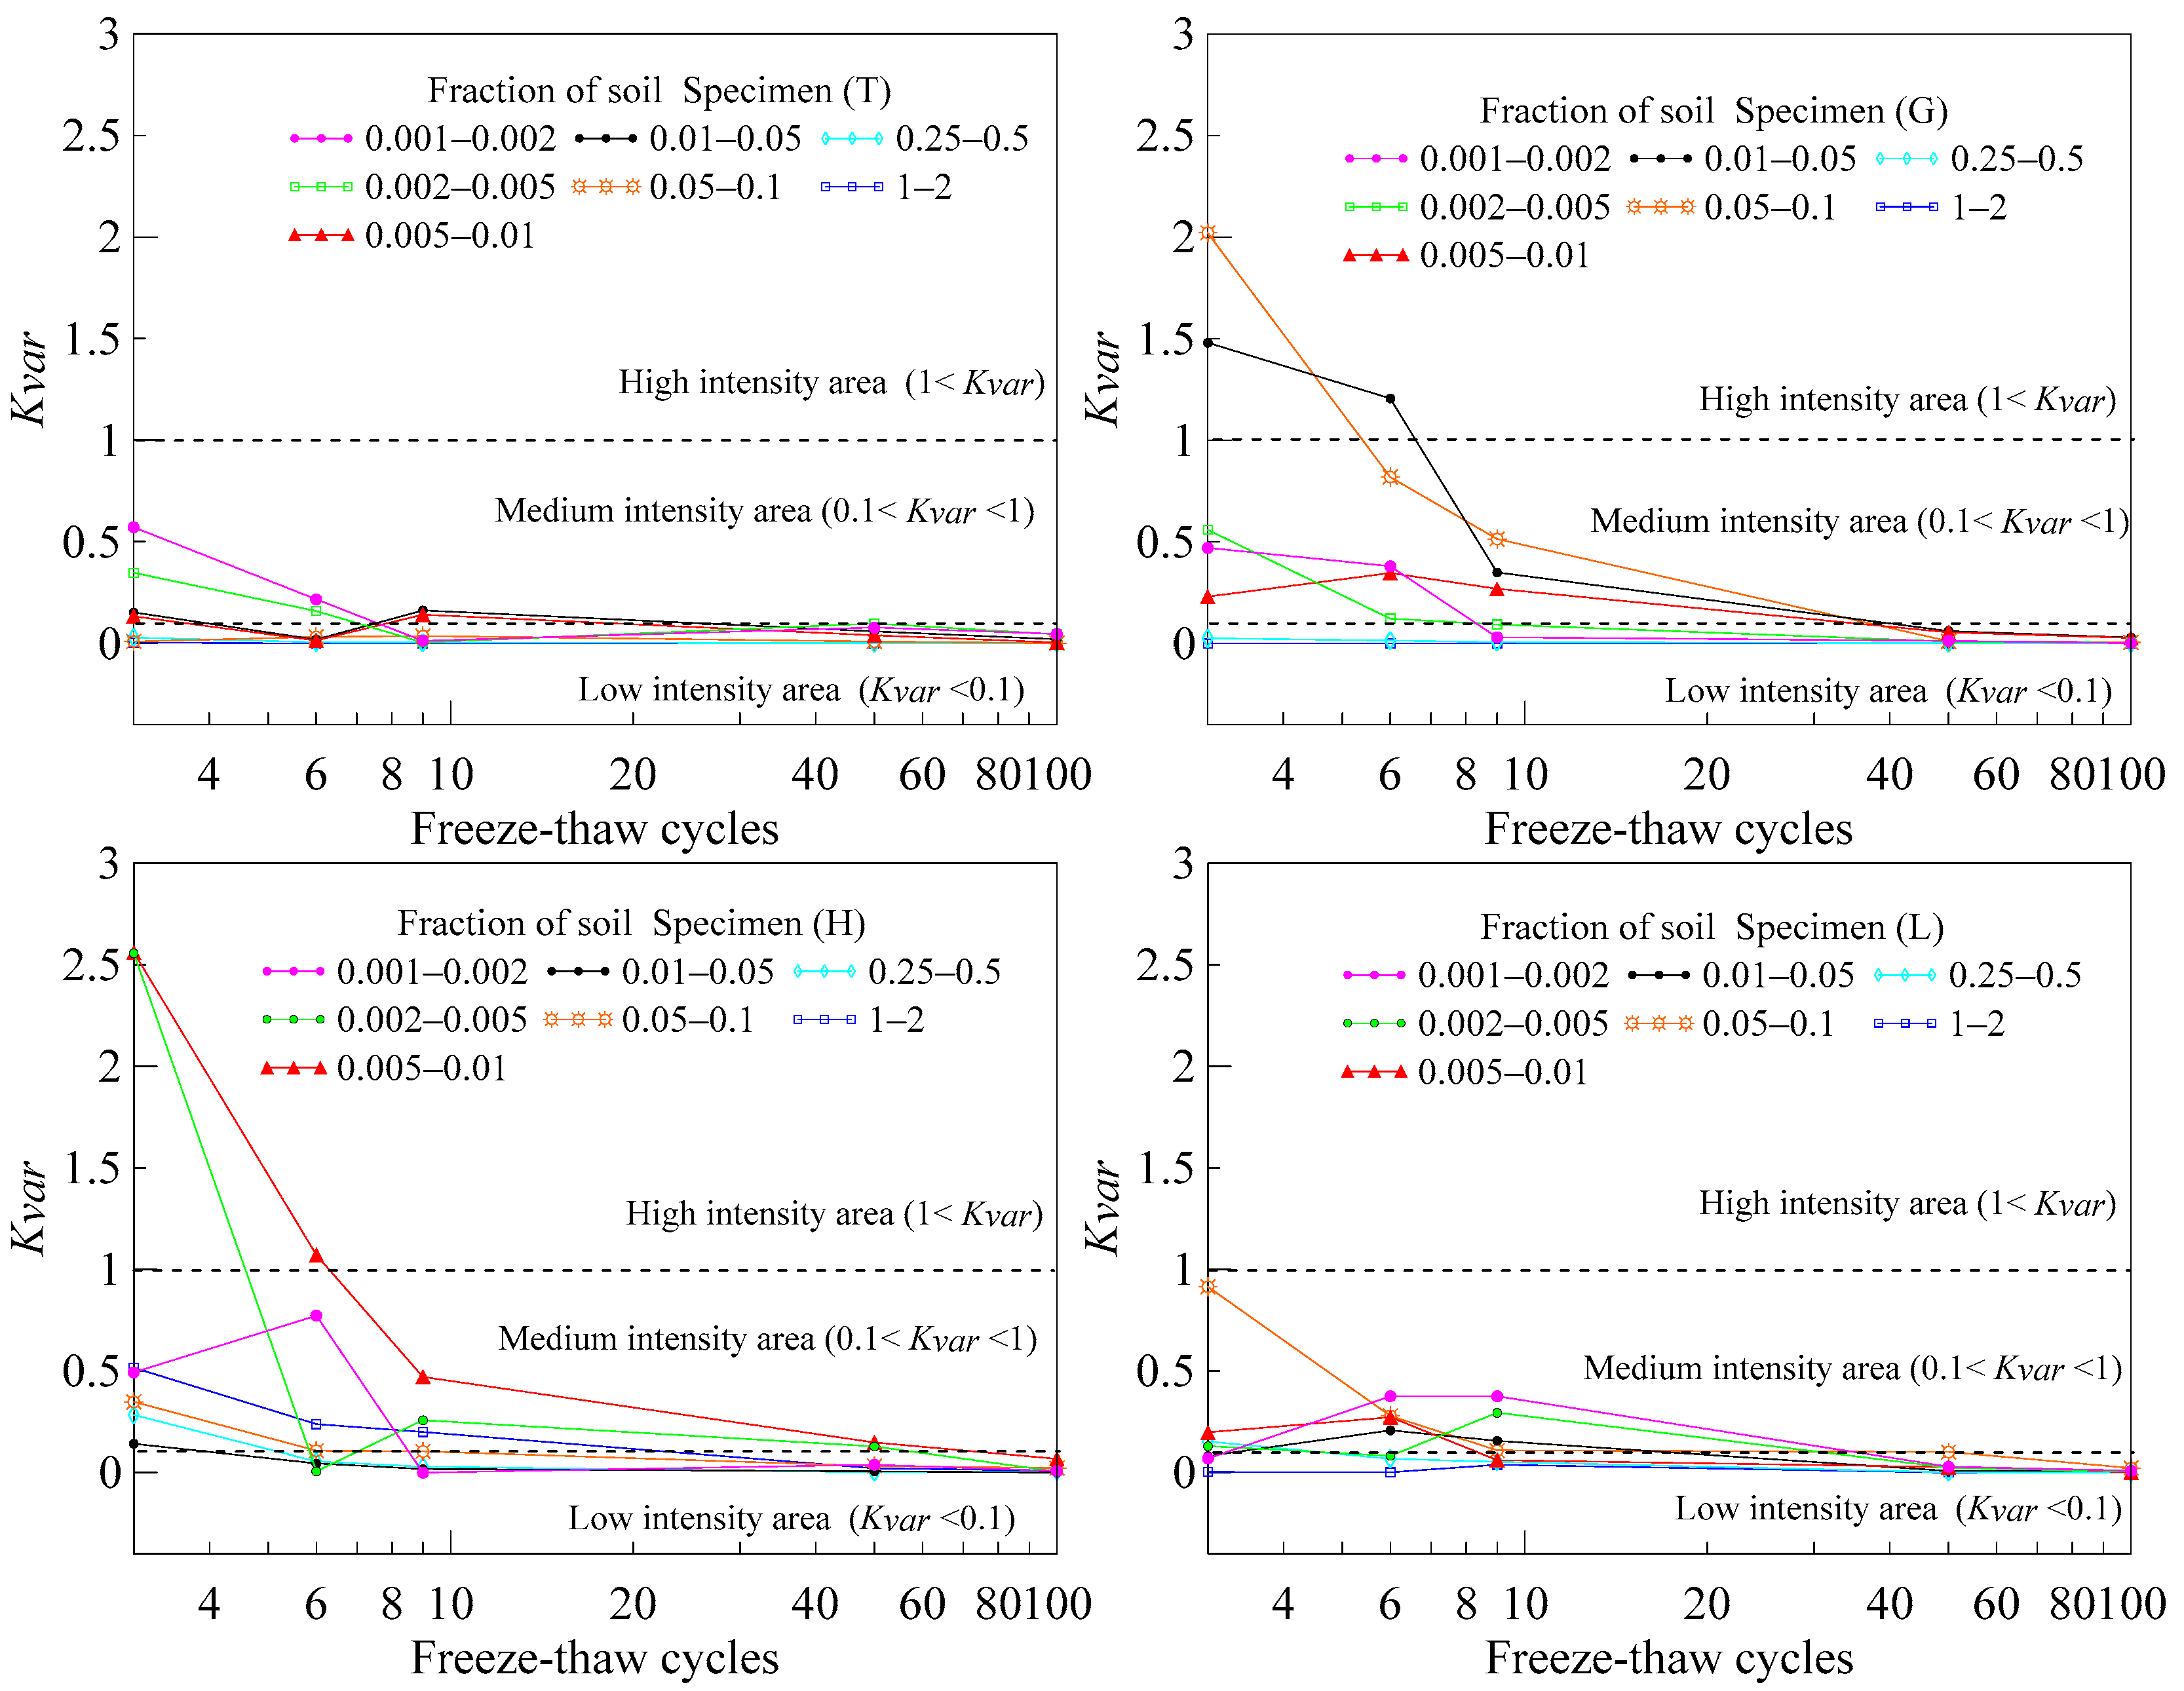
3.3. Analysis of the Intensity of Granulometric Changes during the Freeze–Thaw Process

The experimental results show that as the number of freeze–thaw cycles increases, the grain-size distribution tends to be evenly distributed. In order to demonstrate the intensity of granulometric changes, we used the coefficient of the intensity variation of grain fineness (Kvar) (Yershov, 1995), expressed as follows:
K v a r = 1 N A i B i
where N is the number of freeze–thaw cycles; A is the content of fraction before the freeze–thaw test; B is the content of fraction after the freeze–thaw test; i is the different fraction; Kvar < 0.1 belongs to the low-intensity area; 0.1 < Kvar < 1 belongs to the medium-intensity area; 1 < Kvar belongs to the high-intensity area. The Kvar change was obtained after each freeze–thaw cycle, as shown in Figure 7.
From the beginning of the freeze–thaw process to the 100th cycle, the Kvar value of the specimen (T) is always <1. With the increase in freeze–thaw cycles, the 0.001–0.002 mm and 0.002–0.005 mm range from medium-intensity area to low-intensity area. Different from 0.001–0.002 mm and 0.002–0.005 mm, the Kvar value of 0.005–0.01 mm and 0.01–0.05 mm is >0.1 after the ninth freeze–thaw cycle, that is, from low-intensity area to medium-intensity area.
It can be seen from the figure that with the increase in freeze–thaw cycles, the Kvar value of the specimen (G) decreases gradually. Among them, 0.01–0.05 mm and 0.05–0.1 mm range from high-intensity area to low-intensity area, spanning three intensity areas. Moreover, the Kvar of 0.05–0.1 mm has the largest value. The Kvar value of 0.25–0.5 mm and 1–2 mm of specimen (G) is always less than 0.1 and belongs to the low-intensity area.
Unlike with specimen (G), the Kvar of specimen (H) of 0.002–0.005 mm and 0.005–0.01 mm range from high-intensity area to low-intensity area. Among them, 0.002–0.005 mm belonged to the low-intensity area at the sixth freeze–thaw cycle, and 0.002–0.005 mm belonged to the medium-intensity area at the ninth freeze–thaw cycle. From the low-intensity area to the medium-intensity area, the increase in Kvar value indicates that the grain-size distribution has changed, which means that soil mineral particles aggregate and undergo fragmentation. In addition, the 0.005–0.01 mm and 0.002–0.005 mm ranges have the largest Kvar, at 2.56 and 2.55, respectively. Different from the other three specimens, the 1–2 mm range of specimen (H) changes from medium-intensity area to low-intensity area with the increase in freeze–thaw cycles.
At the third cycle, the Kvar values of 0.001–0.002 mm and 0.01–0.05 mm ranges of specimen (L) are 0.069 and 0.082, respectively. It belongs to the low-intensity area. However, in the sixth cycle, the Kvar values are 0.376 and 0.208, respectively, belonging to the medium-intensity area. Additionally, at the 50th cycle, it entered the low-intensity area. The following process may occur: from the third cycle to the sixth cycle, under the freeze–thaw action, the soil mineral particles of 0.001–0.002 mm and 0.01–0.05 mm agglomerate, resulting in an increase in the coefficient of the intensity variation of 0.001–0.002 and 0.01–0.05.
In general, the Kvar value decreases with the increase in freeze–thaw cycles. However, in the process of decreasing, the Kvar value tends to increase. The increase in Kvar indicates the change in grain-size distribution, which means aggregation and fragmentation of soil mineral particles. Moreover, after the 100th cycle, the Kvar value of four specimens is <0.1, which belongs to the low-intensity area. In the whole freeze–thaw test process of four specimens, the coefficient of the intensity variation of 1–2 mm range is small, which belongs to the low-intensity area, except for specimen (H). From the above analysis, it can be inferred that with the increase in freeze–thaw cycles, different soil specimens lead to different changes in the Kvar value of soil components.

4. Discussion

4.1. The Effect of Freeze–Thaw Cycles on Soil Types

It can be seen from Figure 2 and Figure 3 that the freeze–thaw process will change the grain-size distribution and the percentage of sand, silt, and clay. The percentage change will result in a change in soil type. Therefore, the influence of the number of freeze–thaw cycles on soil types was studied. In terms of soil composition, the soil is divided into sand, silt, and clay. Additionally, according to the percentage of sand, silt, and clay in the soil, a ternary diagram was established, as shown in Figure 8.
As shown in Figure 8, it can be observed that specimen (T), specimen (G), specimen (H), and specimen (L) before the freeze–thaw test belong to clay, silt loam, silty clay loam, and loam, respectively. With the increase in freeze–thaw cycles, the various soil specimens show different changes. The direction marked by the red dashed line in the figure is the track direction of the change in soil composition with the increase in freeze–thaw cycles.
The trace line of specimen (T) moves nearly parallel to the decreasing direction of the silt axis. From the beginning of the test to the 100th freeze–thaw cycle, the sand percentage of specimen (T) varies 4–5%. The sand variation range is small, which is 1%. However, the clay and silt percentage change in the range of 64–72% and 2331%, changing by 8% and 8%, respectively. This indicates that specimen (T) mainly undergoes transformation between silt and clay. As shown in the figure, the clay percentage of specimen (T) increases, and the silt percentage decreases, which means that the silt fragments into clay.
The trajectory of the specimen (G) forms a loop. The sand, silt, and clay percentage change in the range of 12–21%, 66–73%, and 14–17%. With the increase in the number of cycles, the sand first decreases and then increases, and finally returns to the vicinity of the origin. In the whole process, the sand fragmentation causes the percentage of sand to reduce, and the percentage of sand to increase owing to the aggregation of silt and clay.
Unlike other specimens, the sand, silt, and clay percentage of specimen (H) change greatly. After 50 freeze–thaw cycles, specimen (H) still belongs to silty clay loam. However, at the 100th cycle, the soil type of specimen (H) changes from silty clay loam to silty clay. The type of soil has changed. This indicates that the type of soil can be changed after multiple freeze–thaw cycles. Moreover, the trajectory of specimen (H) points from the lower left to the upper right. We have reason to believe that after a certain number of freeze–thaw cycles, specimen (H) may change from silty clay loam to clay.
Similar to the law of specimen (G), the trajectory of the specimen(L) also forms a loop. After 50 freeze–thaw cycles and 100 freeze–thaw cycles, the trajectory of specimen (L) gathers toward the center. This indicates that the change in sand, silt, and clay percentage is increasingly smaller, and will be steady when it reaches a certain number of freeze–thaw cycles.

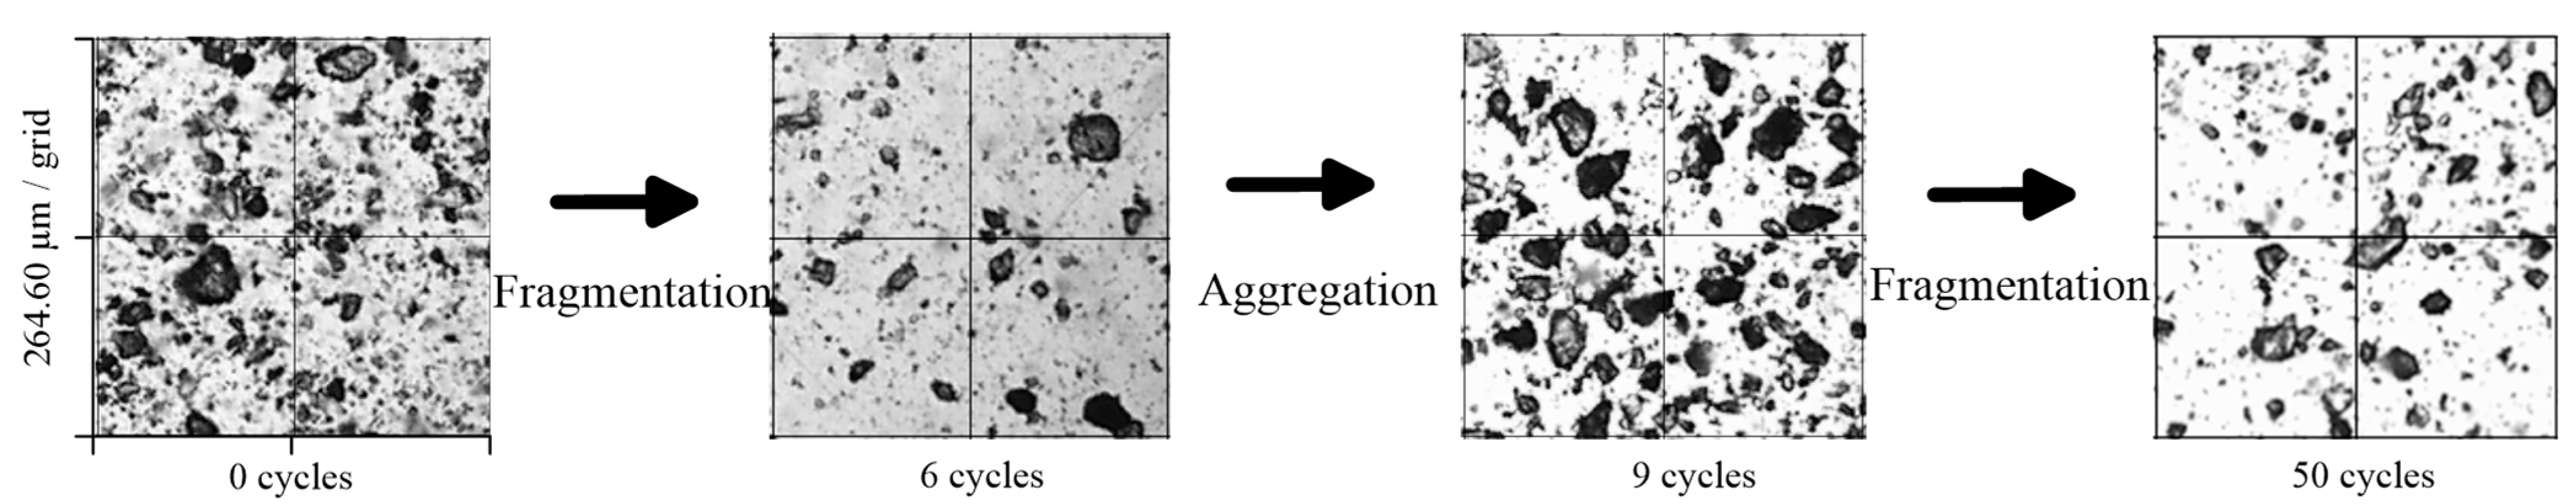
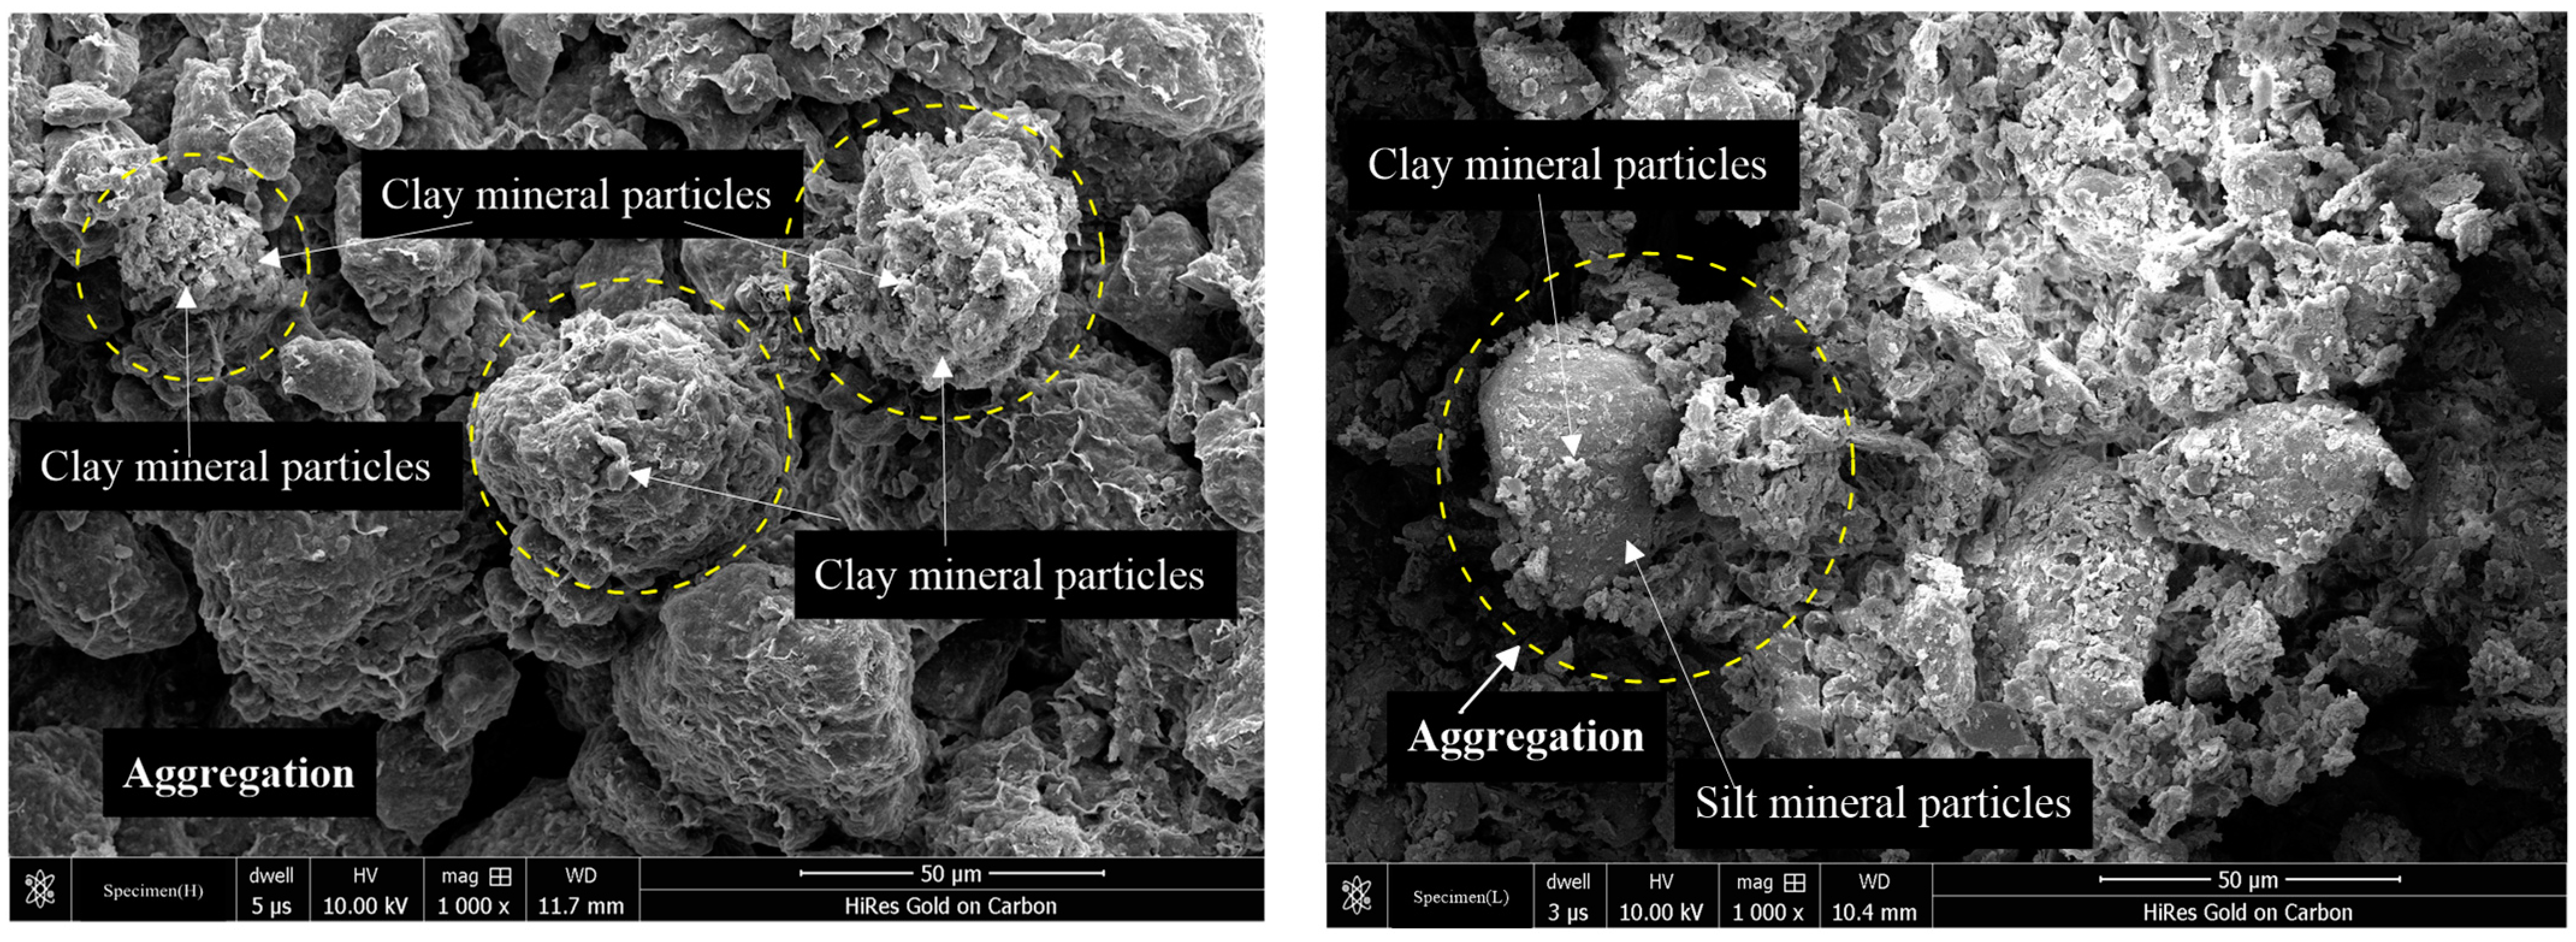
4.2. Analysis of Aggregation and Fragmentation of Soil Mineral Particles

Figure 9 shows the change in mass ratio of different grain-size distributions of soil specimens. In the grain-size distribution of specimen (T), the mass ratio of the particle in the range of 0.002–0.25 mm decreases, and that of 0.002–0.005 mm decreases the most. The mass ratio of the particles of <0.002 mm increases. This may be because 0.002–0.25 mm changes into 0.001–0.002 mm or <0.001 mm after repeated freeze–thaw cycles. The soil specimen (T) mainly occurs in the fragmentation process, during which it is fragmented from coarse particles to fine particles.
In specimen (G), the mass ratio of particles of 0.05–0.1 mm, 0.005–0.01 mm, <0.001 mm decrease, while those of 0.01–0.05 mm, 0.002–0.005 mm, and 0.001–0.002 mm increase. On the one hand, the 0.01–0.05 mm particles took the form of 0.005–0.01 mm particles as a core encapsulated by <0.001 mm particles. On the other hand, the fragmentation of 0.05–0.1 mm will also lead to an increase of 0.01–0.05 mm. At the same time, a fraction of 0.05–0.1 mm and 0.005–0.01 mm fragment into 0.002–0.005 mm or 0.001–0.002 mm, which leads to the increase of 0.002–0.005 mm and 0.001–0.002 mm.
As regards the change in the mass ratio of specimen (H), 0.25–2 mm and <0.005 mm increase, 0.005–0.25 mm decreases, and 0.005–0.01 mm decreases the most. With 0.1–0.25 mm, 0.05–0.1 mm, and 0.005–0.01 mm as the core, and 0.005–0.01 as the agglomerate, the particles aggregate to form 1–2 mm, 0.5–1 mm, and 0.25–0.5 mm. This is the reason for the increase of 0.25–2 mm. However, the mass ratio of <0.005 mm increases, which is caused by the fragmentation of 0.005–0.01 mm particles into 0.002–0.005 mm, 0.001–0.002 mm, or <0.001 mm particles.
In specimen (L), particles of fractions 0.25–0.5 mm, 0.05–0.1 mm increases, while 0.1–0.25 mm, 0.01–0.05 mm, <0.001 mm decrease. The 0.1–0.25 mm and 0.05–0.1 mm particles took the form of 0.1–0.25 mm particles and 0.01–0.05 mm particles as a core encapsulated by <0.001 mm particles. At the same time, a fraction of 0.1–0.25 mm particles fragment into 0.05–0.1 mm. This indicates that the fragmentation of coarse grains and the aggregation of fine grains were synchronized during the freeze–thaw process.
It can be deduced from the aggregation and fragmentation of the above four soil specimens that during the freeze–thaw cycles, the different soil types have different situations of aggregation and fragmentation. Specimen (T) mainly undergoes fragmentation, specimen (L) mainly undergoes aggregation, and specimen (G) and specimen (H) undergo both aggregation and fragmentation.

5. Conclusions

The four samples were tested for 0, 3, 6, 9, 50, and 100 freeze–thaw cycles, respectively, and the test results were analyzed. After the freeze–thaw cycles, we found that the different soil types have different situations of the mineral particle aggregation and fragmentation—specimen (T) mainly undergoes fragmentation, specimen (L) mainly undergoes aggregation, and specimen (G) and specimen (H) undergo both aggregation and fragmentation. In addition, after the 100th freeze–thaw cycle, the soil type of specimen (H) changes from silty clay loam to silty clay.
Further study of the mineral particles of four specimens found that the coarse particles (sand, silt) can be fragmented into relatively fine-grained particles (silt, clay). The clay cannot fragment, and the fine particles (clay) can aggregate by themselves (clay) or with relatively coarse particles (silt).
Furthermore, the granulometric of four specimens change is mainly concentrated in 0.001–0.1 mm. The increase in the Kvar indicates the change in grain-size distribution, which means aggregation and fragmentation of soil mineral particles. After the 100th cycle, the Kvar value of four specimens is <0.1, which belongs to the low-intensity area. Moreover, with the increase in freeze–thaw cycles, the grain-size distribution tends to become stable, which means the fragmentation and aggregation of soil mineral particles are in equilibrium or in a state of balance.

Author Contributions

Conceptualization, Z.Z. and J.Z.; methodology, Z.Z. and A.M.; software, D.J.; validation, Z.Z., J.Z. and L.Y.; formal analysis, Z.Z., J.Z. and L.Y.; investigation, Z.Z., M.Z. and L.Y.; resources, Z.Z.; data curation, D.J.; writing—original draft preparation, J.Z.; writing—review and editing, J.Z., Z.Z., A.M., M.Z., L.Y. and D.J.; visualization, Z.Z. and M.Z.; supervision, Z.Z.; project administration, Z.Z., A.M. and M.Z.; funding acquisition, Z.Z., A.M. and M.Z. All authors have read and agreed to the published version of the manuscript.

Funding

This research work was jointly supported by the National Natural Science Foundation of China (NSFC) (Grant No. 41771078, 42011530083, 42011530087), Russian Foundation for Basic Research: RFBR-NSFC project (Grant No. 20-55-53006), and the CAS “Light of West China” Program for the Belt and Road Research Teams (Granted to Mingyi Zhang).

Data Availability Statement

Not applicable.

Acknowledgments

This paper is very grateful to Z.Z., M.Z. and A.M. for their guidance. Thank you D.J. for testing and analyzing the samples. Thank you L.Y. for the investigation and sampling of the field samples. The authors are very appreciative of their efforts. Special thanks are also given to the two unidentified reviewers who have spent their precious time and efforts to in improving the quality of this paper.

Conflicts of Interest

The authors declare no conflict of interest.

References

  1. Yershov, E.D. Cryolithogenesis; Izdatel’stvo Nedra: Moscow, Russia, 1982; p. 211. [Google Scholar]
  2. Bajracharya, R.M.; Lal, R.; Hall, G.F. Temporal variation in properties of an uncropped, ploughed Miamian soil in relation to seasonal erodibility. Hydrol Process. 1998, 12, 1021–1030. [Google Scholar] [CrossRef]
  3. Oztas, T.; Fayetorbay, F. Effect of freezing and thawing processes on soil aggregate stability. Catena 2003, 52, 1–8. [Google Scholar] [CrossRef]
  4. Ferrick, M.G.; Gatto, L.W. Quantifying the effect of a freeze-thaw cycle on soil erosion: Laboratory experiments. Earth Surf. Proc. Land. 2005, 30, 1305–1326. [Google Scholar] [CrossRef]
  5. Shu-Xun, L.I.; Nan, Z.T.; Zhao, L. Impact of Freezing and Thawing on Energy Exchange Between the System and Environment. J. Glaciolgy Geocryol. 2002, 24, 109–115. [Google Scholar]
  6. Zhang, Z.; Ma, W.; Feng, W.J.; Xiao, D.H.; Hou, X. Reconstruction of soil particle composition during freeze-thaw cycling:A review. Pedosphere 2016, 26, 167–179. [Google Scholar] [CrossRef]
  7. Zhang, Z.; Ma, W.; Qi, J.L. Structure evolution and mechanism of engineering properties change of soils under effect of freeze-thaw cycle. J. Jilin Univ. 2013, 43, 1904–1914. [Google Scholar]
  8. Chernyakhovsky, A. Some Problems of Physical and Physico-Chemical Weathering of Rocks; Perel’man, A.I., Ed.; The Weathering Crust. Press of “Nauka”: Moscow, Russian, 1968; pp. 18–29. (In Russian) [Google Scholar]
  9. Poltev, N.F. Effect of initial composition of melt rocks at its structure in the frozen state. In Permafrost Research; Kudryavtsev, V.A., Ed.; Moscow University Press: Moscow, Russia, 1967; Volume VII, pp. 89–97. (In Russian) [Google Scholar]
  10. Li, S.; Zhang, M.; Tian, Y.; Pei, W.; Zhong, H. Experimental and numerical investigations on frost damage mechanism of a canal in cold regions. Cold Reg. Sci. Technol. 2015, 116, 1–11. [Google Scholar] [CrossRef]
  11. Ha, C.P.; Cheng, P.F. Micropore variation and particlefractal representation of lime-stabilised subgrade soil underfreeze-thaw cycles. Road Mater. Pave. Des. 2015, 16, 19–30. [Google Scholar]
  12. Zhang, Z.; Pendin, V.V.; Feng, W.J.; Zhang, Z.Q. The influence of freeze-thaw cycles on the granulometric composition of Moscow morainic clay. Sci. Cold Arid. Reg. 2015, 7, 199–205. [Google Scholar]
  13. Mazurov, G.P. The formation of the composition and properties of soils in the subarctic zone under the influence of cryogenic processes. In Problems of Engineering Geology. Reports of Soviet Scientists to the International Congress of the International Association of Engineering Geologists; International Association of Engineering Geologists: Moscow, Russia, 1970; pp. 118–125. [Google Scholar]
  14. Morozov, S.S.; Vassiliev, V.I.; Datsko, Y.S. Changes in the composition and properties of loose rocks under the influence of long-term cross freezing and thawing. In Problem of Engineering Geology and Soil Science; Sergeev, E.M., Ed.; Moscow State University Press: Moscow, Russia, 1973; pp. 89–95. (In Russian) [Google Scholar]
  15. Chamberlain, E.J.; Gow, A.J. Effect of freezing and thawing on the permeability and structure of soils. Eng. Geol. 1979, 13, 73–92. [Google Scholar] [CrossRef]
  16. Chamberlain, E.J. Frost Susceptibility of Soil; Crrel Monograph; United States Army Corp of Engineers, Cold Regions Research and Engineering Laboratory: Hanover, NH, USA, 1981; p. 81. [Google Scholar]
  17. Pawluk, S. Freeze-thaw effects on granular structure reorganization for soil materials of varying texture and moisture content. Can. J. Soil Sci. 1988, 68, 485–494. [Google Scholar] [CrossRef]
  18. Layton, J.B.; Skidmore, E.L.; Thompson, C.A. Winter-associated changes in dry-soil aggregation is influenced by management. Soil Sci. Soc. Am. J. 1993, 57, 1568–1572. [Google Scholar] [CrossRef]
  19. Bullock, M.S.; Larney, F.J.; Izaurralde, R.C.; Feng, Y. Overwinter changes in wind erodibility of clay loam soils in southern alberta. Soil Sci. Soc. Am. J. 2001, 65, 423–430. [Google Scholar] [CrossRef]
  20. Qi, J.L.; Ma, W. Influence of freezing-thawing on strength of overconsolidated soils. Chin. J. Geotech. Eng. 2006, 28, 2082–2086. [Google Scholar]
  21. Konischev, V.N. Nature of the cyclic structure of ice complex, East Siberia. Earth Cryosphere 2013, 11, 3–6. [Google Scholar]
  22. Konischev, V.N. Loess soil: New opportunities of its genesis study. Eng. Geol. 2015, 5, 22–36. [Google Scholar]
  23. Konishchev, V.N.; Rogov, V.V. Investigations of cryogenic weathering in Europe and Northern Asia. Permafr. Periglac. Process. 1993, 4, 49–64. [Google Scholar] [CrossRef]
  24. Jin, H.; Vandenberghe, J.; Luo, D.; Harris, S.A.; He, R.; Chen, X.; Jin, X.; Wang, Q.; Zhang, Z.; Spektor, V.; et al. Quaternary permafrost in China: The framework history and some discussions. Quaternary 2020, 3, 32. [Google Scholar] [CrossRef]
  25. Lehrsch, G. A Freeze-Thaw Cycles Increase Near-Surface Aggregate Stability. Soil Sci. 1998, 163, 63–70. [Google Scholar] [CrossRef] [Green Version]
  26. Benoit, G.R. Effect of Freeze-Thaw Cycles on Aggregate Stability and Hydraulic Conductivity of Three Soil Aggregate Sizes. Soil Sci. Soc. Am. J. 1973, 37, 3. [Google Scholar] [CrossRef]
  27. Konrad, J.M. Physical processes during freeze-thaw cycles in clayey silts. Cold Reg. Sci. Technol. 1989, 16, 291–303. [Google Scholar] [CrossRef]
Figure 1. Test device: (a) freeze–thaw test device; (b) electron scanning microscope.
Minerals 11 00913 g001
Figure 2. The grain-size distribution semi-logarithmic curve of soils with different numbers of freeze–thaw cycles.
Minerals 11 00913 g002
Figure 3. Changes in the sand, silt, and clay fraction with the increasing number of freeze–thaw cycles.
Minerals 11 00913 g003aMinerals 11 00913 g003b
Figure 4. Fragmentation and aggregation process of specimen (G).
Minerals 11 00913 g004
Figure 5. Scanning images of four specimens by electron microscope.
Minerals 11 00913 g005aMinerals 11 00913 g005b
Figure 6. Dynamic changes in mass change (ΔM) with the increasing number of freeze–thaw cycles.
Minerals 11 00913 g006
Figure 7. Changes of coefficient of intensity variation of grain fineness (Kvar) with the increasing number of freeze–thaw cycles.
Minerals 11 00913 g007
Figure 8. Changes in the percentage of sand, silt, and clay with the number of freeze–thaw cycles.
Minerals 11 00913 g008
Figure 9. The change in mass ratio of different grain-size distributions of soil specimens.
Minerals 11 00913 g009
Table 1. Physical properties of soils.
Test MethodContent of Different Grain Size (%)Specimen (T)Specimen (G)Specimen (H)Specimen (L)
Cutting ring methodDensity (g/cm3)1.862.042.051.92
Oven-drying methodWater content (%)33.6424.2620.9325.19
Casagrande methodLiquid limit WL (%)35.6828.0224.4625.93
Thread-rolling methodPlastic limit WP (%)24.0023.2115.7917.42
WL-WPPlastic index IP (%)16.684.818.678.51
Publisher’s Note: MDPI stays neutral with regard to jurisdictional claims in published maps and institutional affiliations.

