Article

The Long-Term Effect of Industrial Waste Landfill on Surface Water. An Example from Central Poland

Institute of General and Ecological Chemistry, Lodz University of Technology, 166 Żeromskiego Str., 90-924 Łódź, Poland
*
Authors to whom correspondence should be addressed.
Minerals 2021, 11(8), 861; https://doi.org/10.3390/min11080861
Submission received: 12 May 2021 / Revised: 2 August 2021 / Accepted: 6 August 2021 / Published: 10 August 2021
(This article belongs to the Special Issue Trace Metal Distribution and Cycling in Aquatic Environments)

Abstract

:
Water resources are influenced by many anthropogenic pollutants, which may migrate into the environment. The Bzura River is one of the rivers strongly impacted by human activity e.g., waste landfills and former industrial plants. The objective of this study was to assess the spatial-temporal variability of trace metals in river water and sediments and to recognize the main sources of pollution. An investigation was carried out on the 120 km section, during two hydrological years. Concentrations of Ni, Pb, Cd, Cu, Zn, Fe, and Mn were determined by atomic absorption spectrometry (AAS). The basic statistics were supported by principal component analysis (PCA) and cluster analysis (CA). Generally, only part of the results exceeded the WHO, USEPA, and Polish threshold values. However, one hotspot burdened by nickel was found. The spatial trend of Ni indicates long-distance migration. The PCA and CA confirmed that the Ni mainly comes from the old industrial waste landfill. Variability of the remaining metals was affected by more mixed sources. None of the metals showed any consistent temporal pattern. The PCA revealed that the anthropogenic factor explained over 50% of the variability in both years; therefore, intensive monitoring of the water river quality is still required.

1. Introduction

Nowadays, deficiency of drinking water is a global problem. Freshwater accounts for 3% while available water constitutes only 0.5–1% of terrestrial water resources [1,2]. Moreover, the increase in water demand follows the population explosion, which in turn prompted unsustainable exploitation of natural resources, forced intensive development of agriculture and industry. Water scarcity is a common problem in many countries and affects all continents. Poland is highly affected by freshwater deficiency [1,2]. Therefore, a particularly important problem faced by local authorities is to reduce surface water pollution and improve its quality.
Metal pollution has become a global problem due to its omnipresence, long-time persistence in the environment, and high toxicity. Moreover, metals of anthropogenic origin are very often easily mobile and prone to migration between different compartments of the environment. A significant load of heavy metal pollution is related to human activity. The sources of toxic metals are mostly related to mining, metallurgy, electronic industry, chemical industry, batteries, disposal of waste, sewage sludge and wastewater, agriculture, transport, fuel combustion [3,4,5]. The main pathways for the transport of contaminants are rivers. Metal content in rivers, subject to strong anthropogenic influences, should be monitored frequently because of significant fluctuations in pollution concentrations. This is because a number of factors affect the metal distribution in surface waters, such as pH, temperature, redox potential, the chemical composition of water, salinity, solubility, the chemical form of the metals, adsorption on suspensions, complexation, sedimentation, size of sediment particles, resuspension, bioavailability [6,7,8]. Thus, water pollution poses a direct threat to aquatic organisms, and indirectly it is also dangerous to human and animal health. According to Dibofori-Orji et al. [9], the quality of surface water depends primarily on land use. A serious threat to the inhabitants is the discharge of untreated or insufficiently treated municipal and industrial sewage to rivers, as well as urban stormwater runoff [3,10,11,12,13]. According to Zhou et al. [14], the structure of surface water contamination has changed significantly over the last 50 years. In the 1970s and 1980s, the quality standards (WHO, USEPA) were exceeded mainly by Fe, Mn, and Pb, and water pollution of the 168 studied rivers usually concerned single metals. In the following decades, the pollution of surface waters has increased, and mixed metal pollution has occurred. In the 1970s, trace metals were related to rock weathering, mining, and manufacturing, while in the 21st century the share of pollutants from waste discharge increased significantly worldwide [14]. Solid waste landfills (industrial, municipal) are often located in proximity to residential areas. Even in the case of stabilization of the waste by solidification, hazardous components may be washed out in the amount depending on the form and method of immobilization. Therefore, toxic metals are considered one of the most important waste producers [13,15,16,17].
The subject of the paper is the spatial distribution and temporal variability of the trace metal concentrations in the Bzura River flowing through central Poland. The Bzura has been heavily influenced by mixed anthropogenic factors and is one of the rivers significantly transformed by human activity. In the 1960s, the Bzura was one of the most polluted Polish rivers. The main sources of water pollution were the machinery, metal and textile industries, dye production, municipal wastewater, and waste dumps. Most of the pollutants introduced into the river came from the town of Zgierz (56,190 inhabitants in 2019). Over a hundred years ago, a chemical plant (later “Boruta” Dye Industry Plant) was established in the southwestern part of Zgierz. After World War II, the “Boruta” plant was significantly expanded and it produced dyes for the textile industry. Industrial wastewater was directed to the Bzura River. In 1998, Zgierz Wastewater Treatment Plant, which collects municipal and industrial sewage, was launched. The political transformation that took place in Poland at the turn of the 1980s and 1990s accelerated the collapse of the “Boruta” plant, which closed in 1999. On its site, the Boruta Zgierz Industrial Park was created, which is the seat of numerous enterprises with a different production profile. There are three industrial waste dumps on the premises of the former “Boruta” Dye Industry Plant in Zgierz. The composition and amount of landfilled waste are not known exactly. After the “Boruta” plant closure, the landfill continued to receive waste, including municipal and hazardous. The landfill management is not in line with the regulations. A number of ignitions have been recorded in landfills. As a result of the inspections [18], leakage of leachate into the ground was found leading to the deterioration of the environment.
Detailed studies concerning the water quality of the Bzura River, were carried out over 10 years ago. Based on current and historical data, Kopeć et al. [19] and Kobojek [20] concluded that the changes in the landscape, moisture conditions, and vegetation in the middle part of the Bzura River valley result from regulatory works, melioration, deforestation, and climate change. In turn, in 1998–2002, analyzes of Cd, Cu, Zn, and Pb contents were performed in the waters of the upper reaches of the Bzura River, in the area of Zgierz (a satellite town of the Łódź agglomeration) [21]. High contamination of the Bzura was caused by both municipal wastewater discharge and the activity of industrial plants, of which the production of dyes had the greatest share. Sewage and industrial waste of Chemical Plant “Boruta” in the town of Zgierz caused significant soil and water pollution in the upper section of the river. Studies of water quality were carried out before and after the municipal sewage treatment plant started operating. After the construction of the sewage treatment plant located near the chemical plant, the water quality initially improved, but after 3 years it deteriorated again. It was attributed to illegal sewage discharges. Additionally, the industrial waste landfill located in the area of the dye production plant began to have an increasing impact on river pollution.
Due to the important economic and recreational role played by the Bzura and taking into account the previous reports on the state of the environment in the Bzura River valley, in 2016–2019 we carried out comprehensive studies of the pollution of this area. The research was encouraged and supported by the Voivodeship Fund for Environmental Protection and Water Management in Łódź. The presented study aimed to assess water quality influenced by human activities concerning the content of trace toxic metals in the water of the Bzura River. The location of major spots of pollution in the upper section of the river makes this area a very interesting place for studying the pollutants migration in the surface water environment. The objectives of this paper are: (i) to determine the content of Cd, Cu, Fe, Mn, Ni, Pb, and Zn in the water and sediment samples in the upper and middle sections of the Bzura River from its headwaters to the boundaries of the District of Łódź; (ii) to assess fluctuations in the trace metal concentrations over 2 years along the river section under study; (iii) to identify the main sources of water pollution. It was found that nickel migrates primarily from the old industrial waste landfill located in the upper section of the river and, to a lesser extent, municipal sewage treatment plants.

2. Materials and Methods
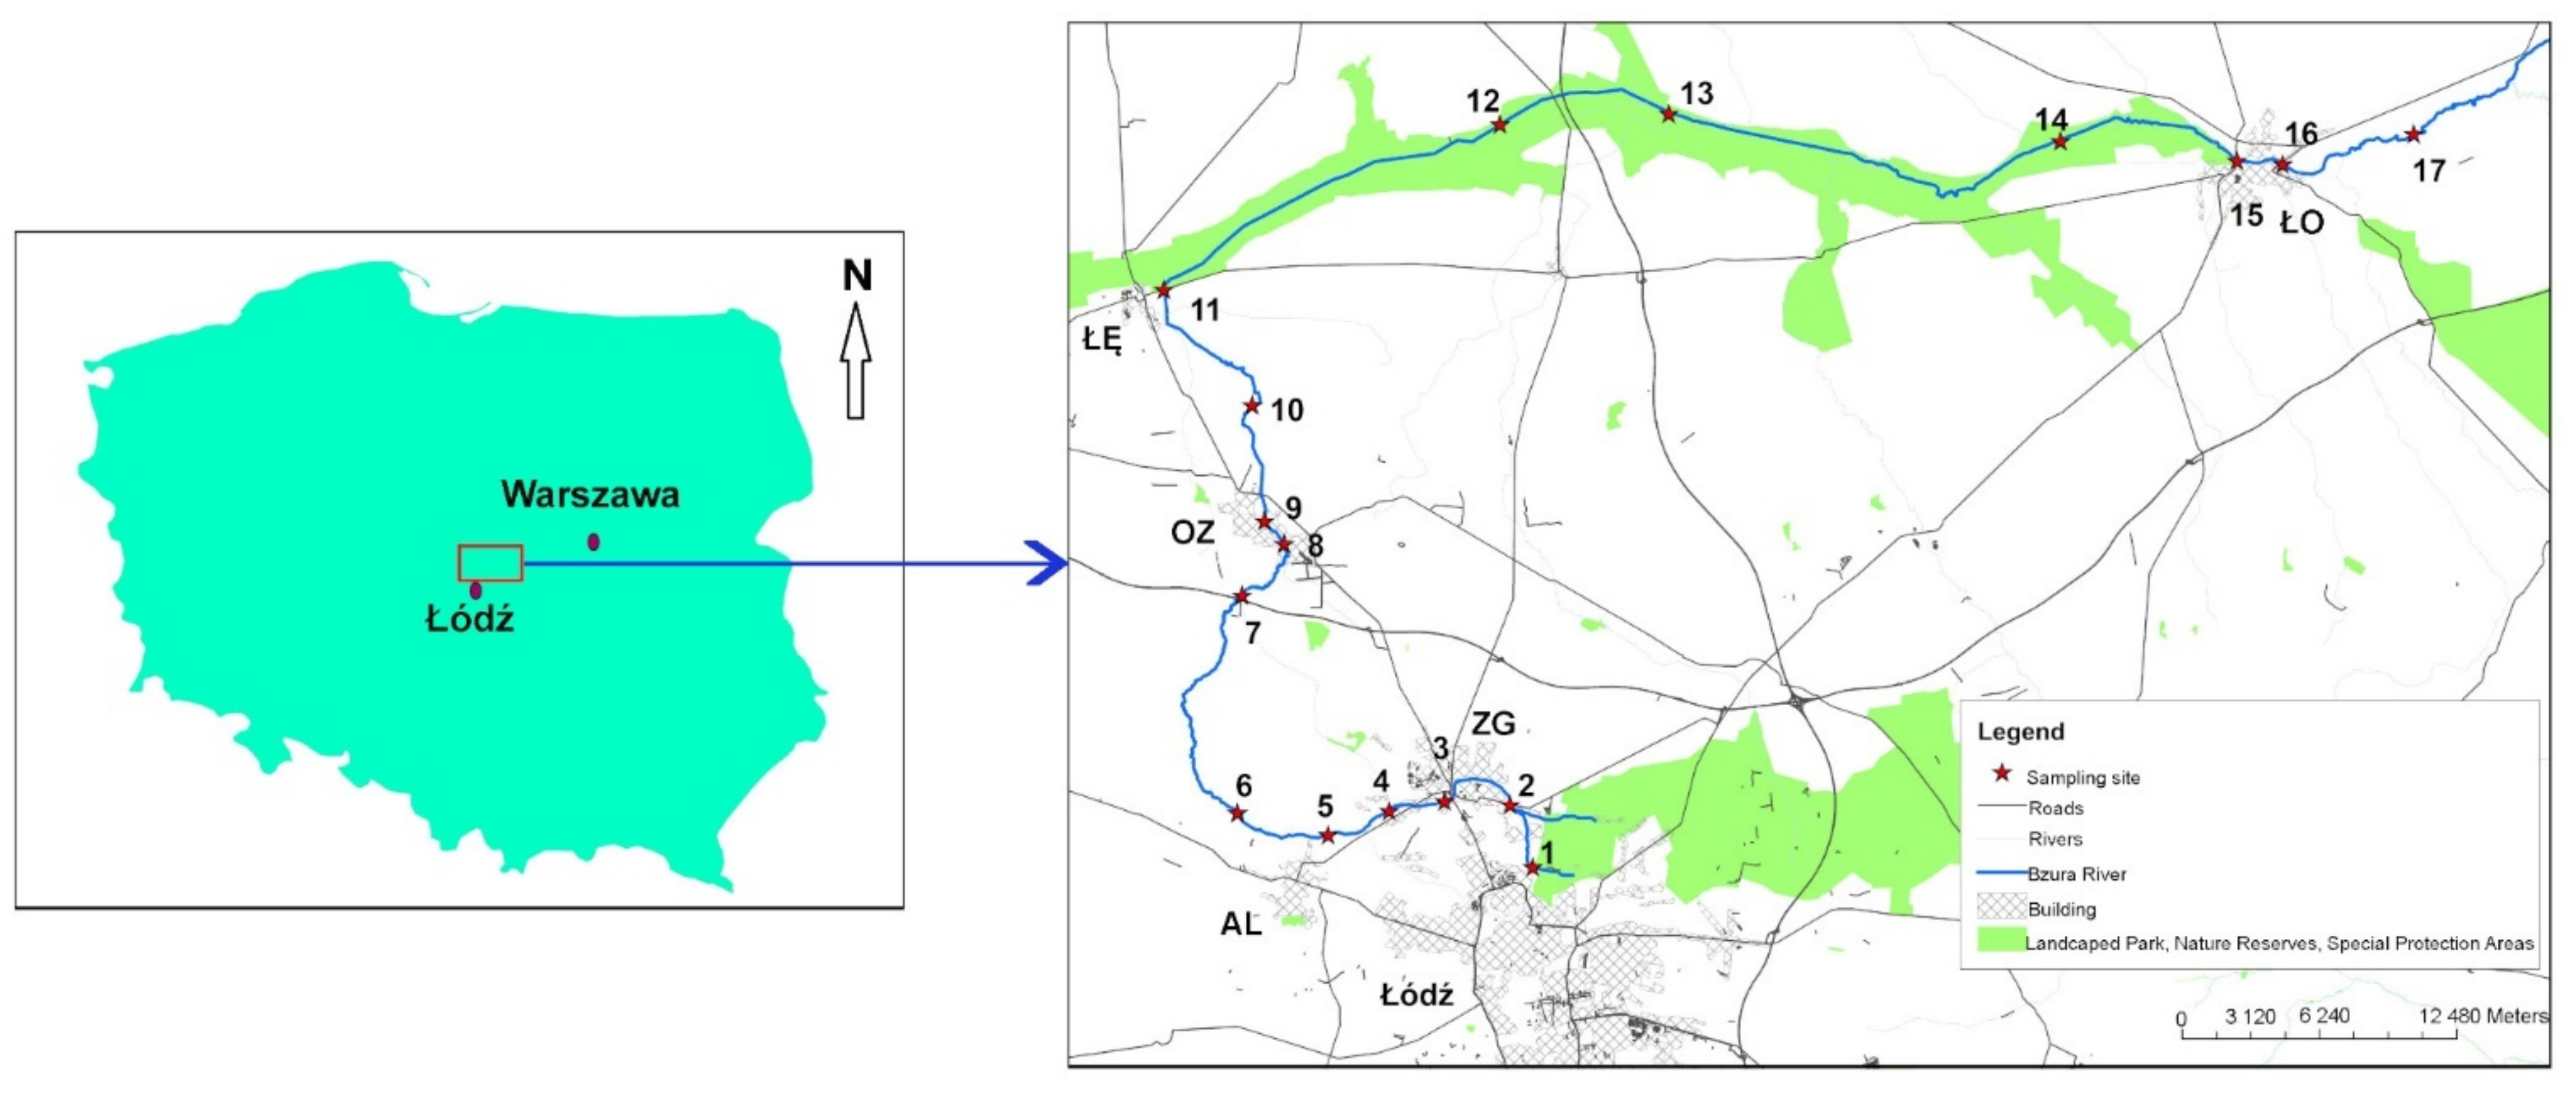
2.1. Study Area

The Bzura River (the length 166 km, catchment area 7788 km2) is a left tributary of the Vistula River. It flows in the area of central Poland, within the boundaries of the District of Łódź (Lodzkie Voivodeship), and in the lower, approximately 40 km-long section, through the District of Mazovian (Mazovian Voivodeship). The river sources are located on the north-eastern outskirts of Łódź (the third biggest city in Poland in terms of population—693,797 habitants in 2017 [22]), in a large urban forest complex, within the Łódzkie Hills Landscape Park. At a distance of 4 km from the springs, the river flows into the town of Zgierz. Initially, the river flows westwards and then northwards (Figure 1). Below town of Łęczyca, the Bzura River flows eastwards across the flat-floored, broad, periglacial valley Pradolina Warszawsko-Berlińska. The section of the valley between Łęczyca and Łowicz is a Special Protection Area Natura 2000 (site PLB100001).

2.2. Water and Sediment Sampling, Preparation, and Analysis

Metal contents in the Bzura River section within the Łódź Province were determined. Water samples were collected once a month in the period November 2017–October 2018 (first hydrological season) and November 2018–October 2019 (second hydrological season). In the first hydrological year, samples were taken from 13 sites located in the upper and middle sections of the river, which are potentially the most loaded with anthropogenic pollution from mixed urban, industrial and agricultural sources (Table 1). In the following year, additional samples from another four sites below location 13 were collected (in the second year there were 17 sampling sites in total). Agricultural areas predominate in this section. Additionally, at sites 1 (control sample), 4 and 11 bottom sediments were collected.
For metal determination at each of the sites, 100 mL of water was collected in a plastic bottle filled to the top, filtered (0.45 µm pore size), and immediately acidified with 1 mL of 65% nitric acid to pH 1–2. The samples were transported in an ice-cooled container at a temperature below 8 °C and stored in a refrigerator (maximum holding time one week). Before water collection, PE bottles with caps were cleaned with deionized (DI) water. Bottles were then filled with 10% HNO3, capped, and left for 24 h. After the nitric acid was discarded, bottles and caps were rinsed again with DI water and dried. Before river water sampling, the PE bottles were rinsed with river water. Water for dissolved organic carbon (DOC) determination was sampled separately in a glass bottle to the top and acidified on-site with 1 mL of 98% sulfuric acid to pH 1–2. Glass bottles were rinsed as described above. The samples were transported in an ice-cooled container at a temperature below 8 °C, filtered (0.45 µm pore size), and stored in a refrigerator until analysis (maximum holding time 24 h).
pH, temperature, and total dissolved solids (TDS) were measured directly in the river during water sampling, using portable, digital pH- and EC-meters (Series 410, Elmetron, Zabrze, Poland). pH-meter was equipped with the EPS-1 combination glass body pH electrode with a temperature sensor. Prior to analysis, the pH-meter was calibrated using pH calibration standards (certified buffer solutions pH 4.00, 7.00, and 9.00 at 20 °C, Certipur, Merck Supelco). EC-meter was equipped with a temperature sensor, the ECF 1 conductivity cell (K = 0.417), and the TDS measurement option. EC-meter was calibrated using EC calibration standard (potassium chloride solution, electrolytic conductivity 0.015 mS/cm, Certipur, Merck Supelco). The dissolved organic carbon (DOC) content was determined using TOC/TN Analyser (Hach Lange IL 550, Hach, Loveland, CO, USA). The principle of the method is thermocatalytic high-temperature (up to 950 °C) oxidation of organic compounds and nondispersive infrared (NDIR) detection of CO2. For calibration of the TOC analyzer, standard solution potassium hydrogen phthalate at a concentration of 1000 mg/L (Certipur, Merck Supelco) was used.
From each of the site numbers 1, 4, and 11, five sub-samples of bottom sediments (of a total mass of about 500 g) were taken from a depth of 0–30 cm. For each location, sub-samples were combined into a single composite sample. Sediments were transported in plastic bottles, then dried in the air at room temperature, mixed, and sieved through a 2-mm stainless steel sieve. Samples were stored in Ziploc bags. Total metal contents were determined after microwave wet digestion with aqua regia and concentrated hydrofluoric acid according to the method described in [4]. After the first step of digestion, samples were cooled, 18 mL of 4 % H3BO3 were added and the decomposition of sediments was continued for another 15 min (second step). Samples were then placed into a 50 mL volumetric flask, filled with deionized water, and filtered through a filter of medium porosity into PE bottles.
Metal contents in water and sediments were determined by the Atomic Absorption Spectrometry (AAS). Calibration curves were prepared from standard metal solutions at a concentration of 1000 mg/L in 0.5 mol/L HNO3 (Certipur, Merck Supelco). The following wavelengths were used: 228.8 nm for Cd, 324.7 nm for Cu, 248.3 nm for Fe, 279.5 nm for Mn, 232.0 for Ni, 217.0 nm for Pb, and 213.9 nm for Zn. To analyze Cu, Fe, Mn, and Zn concentrations, the FAAS technique with air/acetylene flame was used (ContrAA 300, Analytik, Jena, Germany). The amounts of Cd, Ni, and Pb were determined by the GFAAS technique (SensAA, GBC, Melbourne, Australia) in an argon atmosphere. The limit of detection was 0.005 mg/L, 0.0015 mg/L, 0.001 mg/L, 0.005 mg/L, 0.5 µg/L, 0.25 µg/L and 0.015 µg/L for Fe, Mn, Cu, Zn, Ni, Pb and Cd, respectively. The results of metal determination in sediment and water samples are presented in Table 2 and Tables S1–S4.
Environmental matrix reference material (RM) TMDA-64.3 (Environment and Climate Change Canada, Burlington, Canada) was analyzed to provide quality assurance. RM is a trace element fortified sample and it is made with diluted Lake Ontario water. Analytical and statistical data of RM analysis are presented in Table A1 (Appendix A). Additionally, a statistical evaluation of the results of the metal analysis in water samples (four parallel aliquots) collected at site 4 was performed. We determined standard deviations, coefficients of variation, and confidence intervals at probability p = 95%. The results are presented in Table S5.
To reduce sample contamination, all reagents were of Suprapur (65% HNO3, 30% HCl, 40% HF) or analytical quality. Deionized water with electrical conductivity of 0.05 µS/cm was used (water deionized system Polwater, Cracow, Poland).

2.3. Statistical Methods

Basic statistical parameters, such as median, mean, minimum, and maximum values, were calculated for each sampling site in 2019 (Table S1) and in 2018 (Table S2) as well as each month in 2019 (Table S3) and 2018 (Table S4). Some of the results were below the limit of detection (<LOD). Therefore, calculations were carried out based on the values exceeding these limits (n). Spatial and temporal variability was also assessed by coefficients of variation (CVs), which were interpreted according to Karim et al. [24].
Moreover, the datasets (using mean values of variables) were subjected to multivariate analysis. Principal component analysis (PCA) and cluster analysis (CA) was performed with Statistica 10 (StatSoft Inc., Tulsa, OK, USA). Column autoscaling of the datasets before PCA and CA was conducted. The PCs were selected according to the Kaiser’s criterion and the cumulative percentage of explained variance. Ward’s method and the squared Euclidean distance were applied to develop the CA. Additionally, the PCA and the CA were supported by Pearson’s correlation coefficients.

3. Results and Discussion

3.1. Physicochemical Properties of the Bzura River Water

Physicochemical properties have an impact on the concentration of metals in water [25]. Therefore, four parameters were measured for the general characterization of water samples. Annual mean values of temperature, pH, TDS, and DOC for individual sampling points are presented in Figure S1 (Supplementary Materials).
In both years, the highest mean temperature was observed at site 4. Elevated temperatures usually indicate places where liquid wastes are discharged [26]. The temperature at the remaining points ranged from 10.7 °C to 12.6 °C in 2018 and from 9.1 °C to 12.1 °C in 2019.
Water pH was neutral or slightly alkaline. Similar ranges are found in other Polish rivers such as the Odra and the Narew [27,28]. Generally, high variability of pH was not observed, but site 4 can be distinguished by its lowest values in comparison to the remaining points. The inter-annual changes in pH at all sites result mainly from the differences in the amount of precipitation and the size of snow cover during the analyzed period [29,30,31]. In 2018, it was dry and extremely dry in Central Poland. The amount of precipitation was 80% of the long-term normal, and snow cover was sporadic. In 2019, the amount of precipitation increased (93% of the long-term average), and the snow cover also lasted longer. According to Moniewski [29], the long-term changes in the pH of water in rivers near Łódź do not exceed one pH unit. The differences in pH values determined by us amounted to 0.3–0.6 units (Figure S1) and are typical of this region.
The mean of TDS ranged between 187 mg/L and 557 mg/L. In both years, TDS levels were comparable, however slightly higher in 2018. Using this parameter, the Bzura River can be divided into three sections: (1) sites 1–3, where TDS concentrations were lowest and did not exceed 300 mg/L, (2) sites 4–13, where TDS significantly increased; (3) sites 14–17, where concentrations decreased and again were close to 300 mg/L. Lower TDS values downstream may indicate dilution and lack of significant sources of TDS within this stretch of the river [32]. The highest TDS concentration is observed at site 4 (over 500 mg/L), which may suggest the strong anthropogenic loading [33].
The spatial variability of the dissolved organic carbon is similar to the TDS. In both years, the highest and the lowest DOC concentrations were at sites 4 and 1, respectively. Generally, the results obtained for the Bzura River did not differ significantly from the DOC concentrations which were determined for the Vistula River between 2000 and 2014 [34].

3.2. Spatial-Temporal Variability of Metal Concentrations in River Water

Basic statistics of metal concentrations in 2018 and 2019 are presented in Tables S1–S4. According to the median values, the metal contents generally increase in the following order: Cd < Pb < Ni < Cu ≅ Zn < Mn < Fe. However, for the pairs of metals Pb/Ni and Cu/Zn, several exceptions to the above sequence were observed. Similar trends were recognized for the Ganga River [35] and the Polish rivers, namely Middle and Upper Odra River [36], the Olobok (except for Cu), and along the entire course of the Odra River (except for Ni) [37,38]. The latter is strongly influenced by various industrial activities (i.e., mining, power industry, pigments production), while the Olobok River collects agriculture as well as urban wastewater. A different trend with the predominance of Fe, Zn, and Pb was observed for the Pilawa River, which is a sink for the wastewater from the textile industry [37].

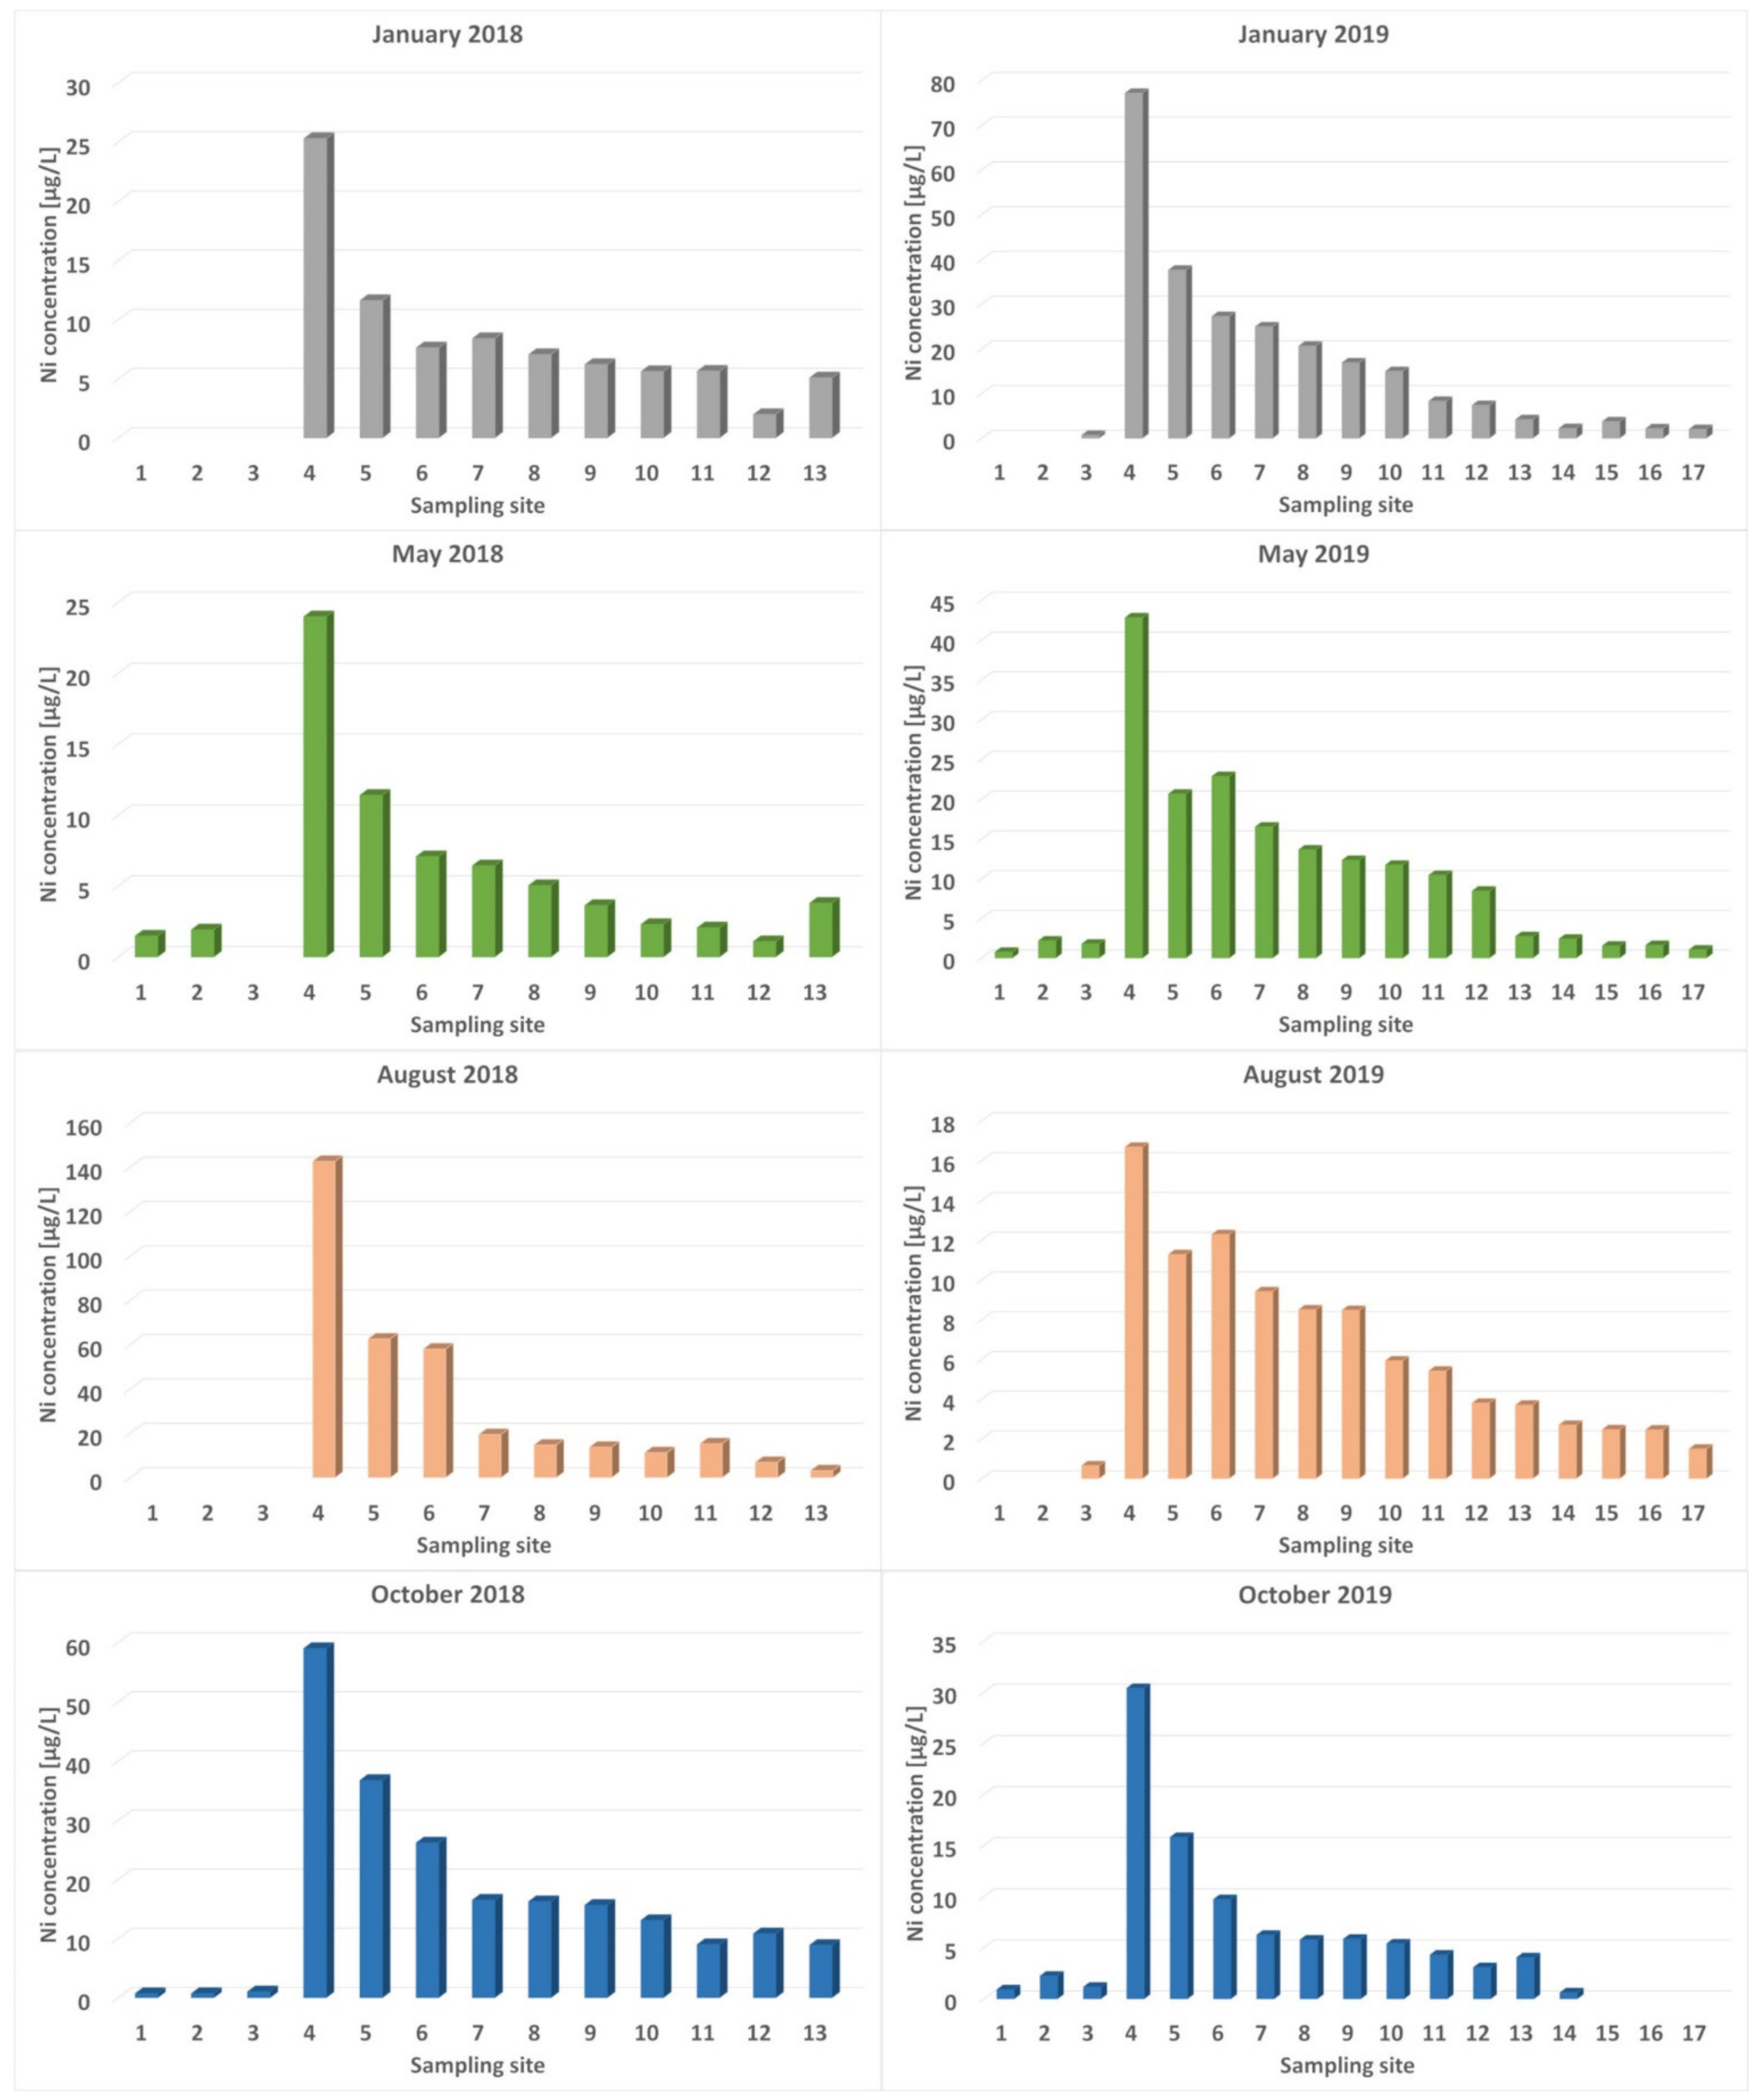
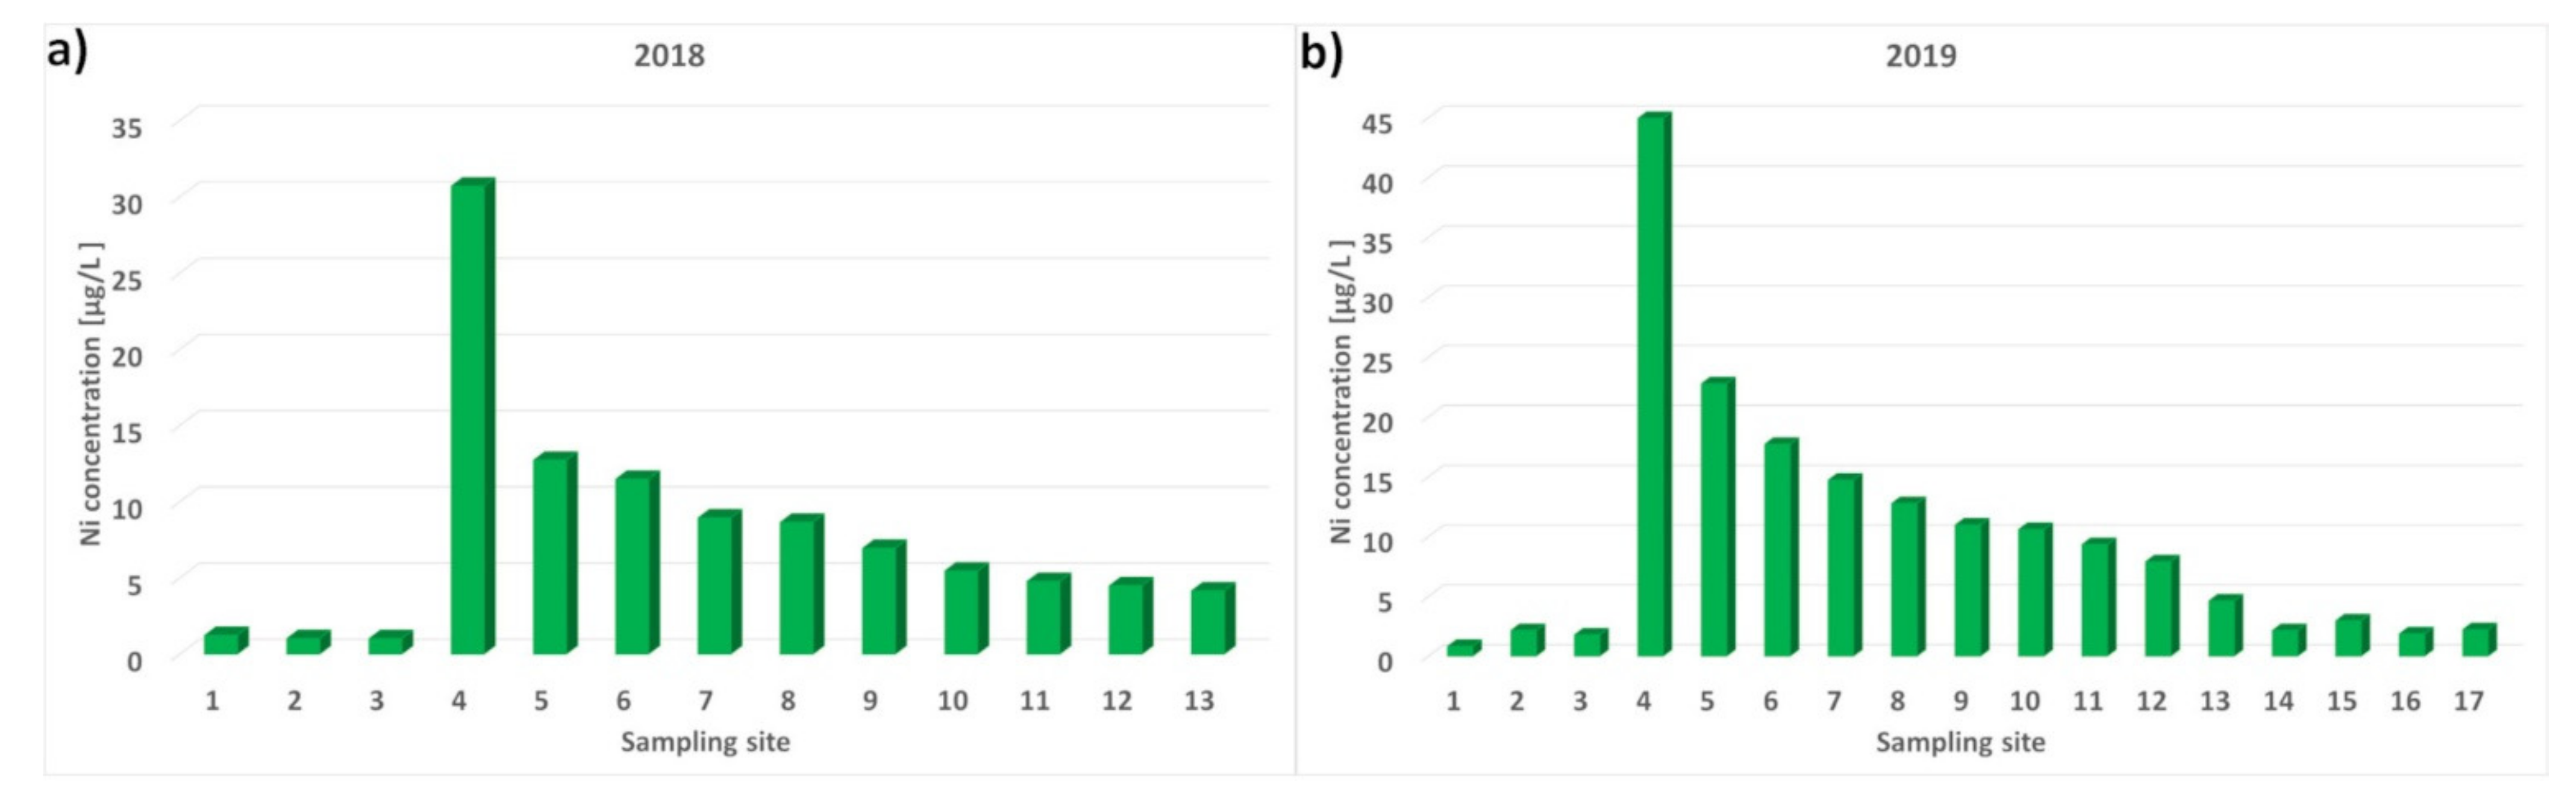
3.2.1. Spatial Variability of Nickel Concentrations

Nickel concentrations ranged from <LOD to 283 µg/L in 2018 and 324 µg/L in 2019. Concentrations determined for other Polish rivers were significantly lower [27,36,37,39]. Comparable results were reported for the Olobok and Shima Rivers, which are mainly polluted by urban and industrial sewage [37,40]. Average Ni concentrations in European river waters were similar to our observations [14]. Higher concentrations were reported for Sakarya and Gagan Rivers, which often receive wastewater from many industrial plants [41,42].
The spatial variability of Ni concentrations in the Bzura River was similar in both years (Figure 2). The lowest contents were detected at sites 1–3 as well as at 14 and 17, where the maximum and median values did not exceed 8.5 µg/L and 2.2 µg/L, respectively. Site 4 (downstream of Zgierz) was characterized by the highest Ni contents, which increased nearly 30 times compared to points 1–3. Below point 4, a gradual decline of the metal content along the river flow was observed. Finally, Ni concentrations decreased to 4.2 µg/L (2018) and 4.6 µg/L (2019) at site 13. At sites 14–17, Ni concentrations stabilized and the median values ranged from 1.9 µg/L to 3.0 µg/L. Sites 15 and 16 (upstream and downstream town of Łowicz, respectively) are characterized by a wider range of Ni contents. The maximum values increased to about 9 µg/L (and even reached 30 µg/L once in April 2019). These sites are located within the city area, near the roads with heavy traffic. This may have contributed to the increase in Ni levels because Ni is found in exhaust gases, brakes, or welded metal plating [43]. Nickel contents determined in 2018 as part of State Environmental Monitoring [44] at three points on the river section below sites 10, 15, and 17 were on average 7.6, 2.1, and 2.1 µg/L (max. 15.0, 2.9 and 4.8 µg/L, respectively).
Other anthropogenically impacted rivers showed different spatial tendencies [25,45]. Both the Bogacayi and Langat Rivers were characterized by increased Ni concentrations on the entire length of the river. The Langat River received the main pollutants load from the upstream and also from the industrial activities downstream. The Bogacayi River flows almost along its entire length through the areas with many manufacturing plants, especially downstream. Hence, in these rivers, a cumulation of Ni was recorded in downstream regions. The most important Ni source exists upstream of the Bzura River. Therefore, observation of the long-distance migration of this element is argued. A slightly similar trend was observed for the Shima River, which is mainly influenced by the discharge of industrial sewage upstream [40]. This study was conducted for three months. In February, the highest Ni concentrations were found upstream with a declining trend towards downstream. This trend was explained by the deposition and dilution of pollutants. However, the decreasing pattern was not gradual, and downstream, an increase in Ni concentration was detected. Additionally, the short research period did not allow the evaluation of the occurrence of this trend during the year.
Industry, metal mining, municipal and industrial waste, or vehicle emissions are the main anthropogenic sources of nickel. The industrial applications of nickel are e.g., electroplating, production of steel as well as chemical and metallurgical industry [46,47,48,49,50,51]. Waste landfills, especially when dealing with old dumps that do not have a system to collect effluents and prevent them from migration, pose a serious environmental problem [13,52]. Waste from the “Boruta” dye production plant, municipal and industrial waste, electronic and electrical equipment, construction debris, and others was deposited in dumps above site 4. Part of the industrial waste is stored in rusty containers which are an additional source of nickel and other heavy metals. The impact of the industrial waste landfill located near site 4 was audited by the Supreme Audit Office. The river water was not tested, however, deterioration of the groundwater quality near the landfill has been observed since 2013, due to leachate leakage into the environment. In April 2019, many indicators were significantly exceeded in the leachate from piezometers and the drainage ditch in the landfill [18]. Our studies proved that this waste landfill affects not only the groundwater but also the Bzura River water quality. An additional source of nickel may come from the wastewater treatment plant, which processes sewage both municipal and industrial from factories located in Boruta Zgierz Industrial Park [53].
The spatial Ni variability was very similar every month, regardless of the season or the level that was reached. Figure 3 shows the comparison of variation in selected months for (a) winter, (b) spring, (c) summer, (d) autumn. It confirms the year-round prevalence of the point-source of Ni at site 4.
The mobility of Ni in the environment depends on several factors, including pH and organic matter [47,50]. In an acidic environment with a high content of organic substances, the mobility of Ni increases and may pose a threat to groundwater [50]. Landfill conditions above site 4 favor nickel migration. Waste deposited in dumps contains a significant amount of organic substances [18]. Landfills do not have a leachate collection system. Therefore, nickel and other metals are leached by acidic stormwater into the soil and then into the river.
At site 4, the lowest pH values were observed, especially in 2019 (minimum was 6.35). It probably induced higher solubility of Ni because, in natural water, Ni is present predominantly as Ni(H2O)62+ and the change of water pH from 8 to 6.5 may cause an increase in cationic forms even of 25% [51,54]. Additionally, in the water samples collected at site 4, the highest contents of dissolved organic carbon were detected. Significant correlation coefficients (p < 0.05) between DOC and Ni concentrations in water at all sites were found for both years, namely, 0.74 (2018) and 0.90 (2019). It confirms that Ni is strongly associated with organic matter. Therefore, a decrease in pH values and/or an increase in organic matter contents at site 4 promote nickel migration. A gradual decrease in Ni concentration downstream probably results from the dilution of pollutants along the flow of the river. Long-distance Ni migration (nearly 70 km) suggests that nickel does not easily accumulate on the bottom sediments. It is also confirmed by the analysis of the sediment samples collected at sites 1, 4, 11 (Table 2). The partition coefficient (log Kd) indicates that Ni is the only metal prevailing in the liquid phase both at sites 4 and 11 (Table A2).
The geochemical background of nickel in bottom sediments in Poland is 6 mg/kg [55]. The Ni content in the Bzura River bottom sediments is determined as part of State Environmental Monitoring at two points. The first monitoring site is located between points no. 13 and 14 investigated in this study. In 2017, nickel content in this site was 7.4 mg/kg. At the second state monitoring point (located outside the area studied by us, at the mouth of the Bzura River to the Vistula River), the Ni content in the sediments increased to 10.6 mg/kg.
Bottom sediments in the upper part of the Bzura River have been rarely investigated. Analyses of their composition at the site directly below the waste landfills of the “Boruta” Dye Industry Plant in Zgierz were performed in the 1990s before the municipal wastewater treatment plant was launched. At that time, high nickel contents in sediments were found (max. 345 mg/kg) [56]. However, the Ni content in the river water did not exceed 0.02 mg/L. To our knowledge, the composition of the bottom sediments at this site has not been controlled since then. After the treatment plant was started up, the parameters of the water improved temporarily, but soon the pollution increased again. The likely sources were three hazardous and industrial waste dumps (currently closed). This is confirmed by the results of inspections carried out in recent years at landfills [18,57]. As mentioned above, the analysis of samples taken from piezometers showed high contents of some parameters e.g., iron and nickel concentrations (in 2019 it was determined 0.20–0.22.mg/L of Ni and 13–24 mg/L of Fe). The audit also proved that, for example, the landfill adjacent to the river bank (closed since 1995) is not protected against leachate migration into the environment.

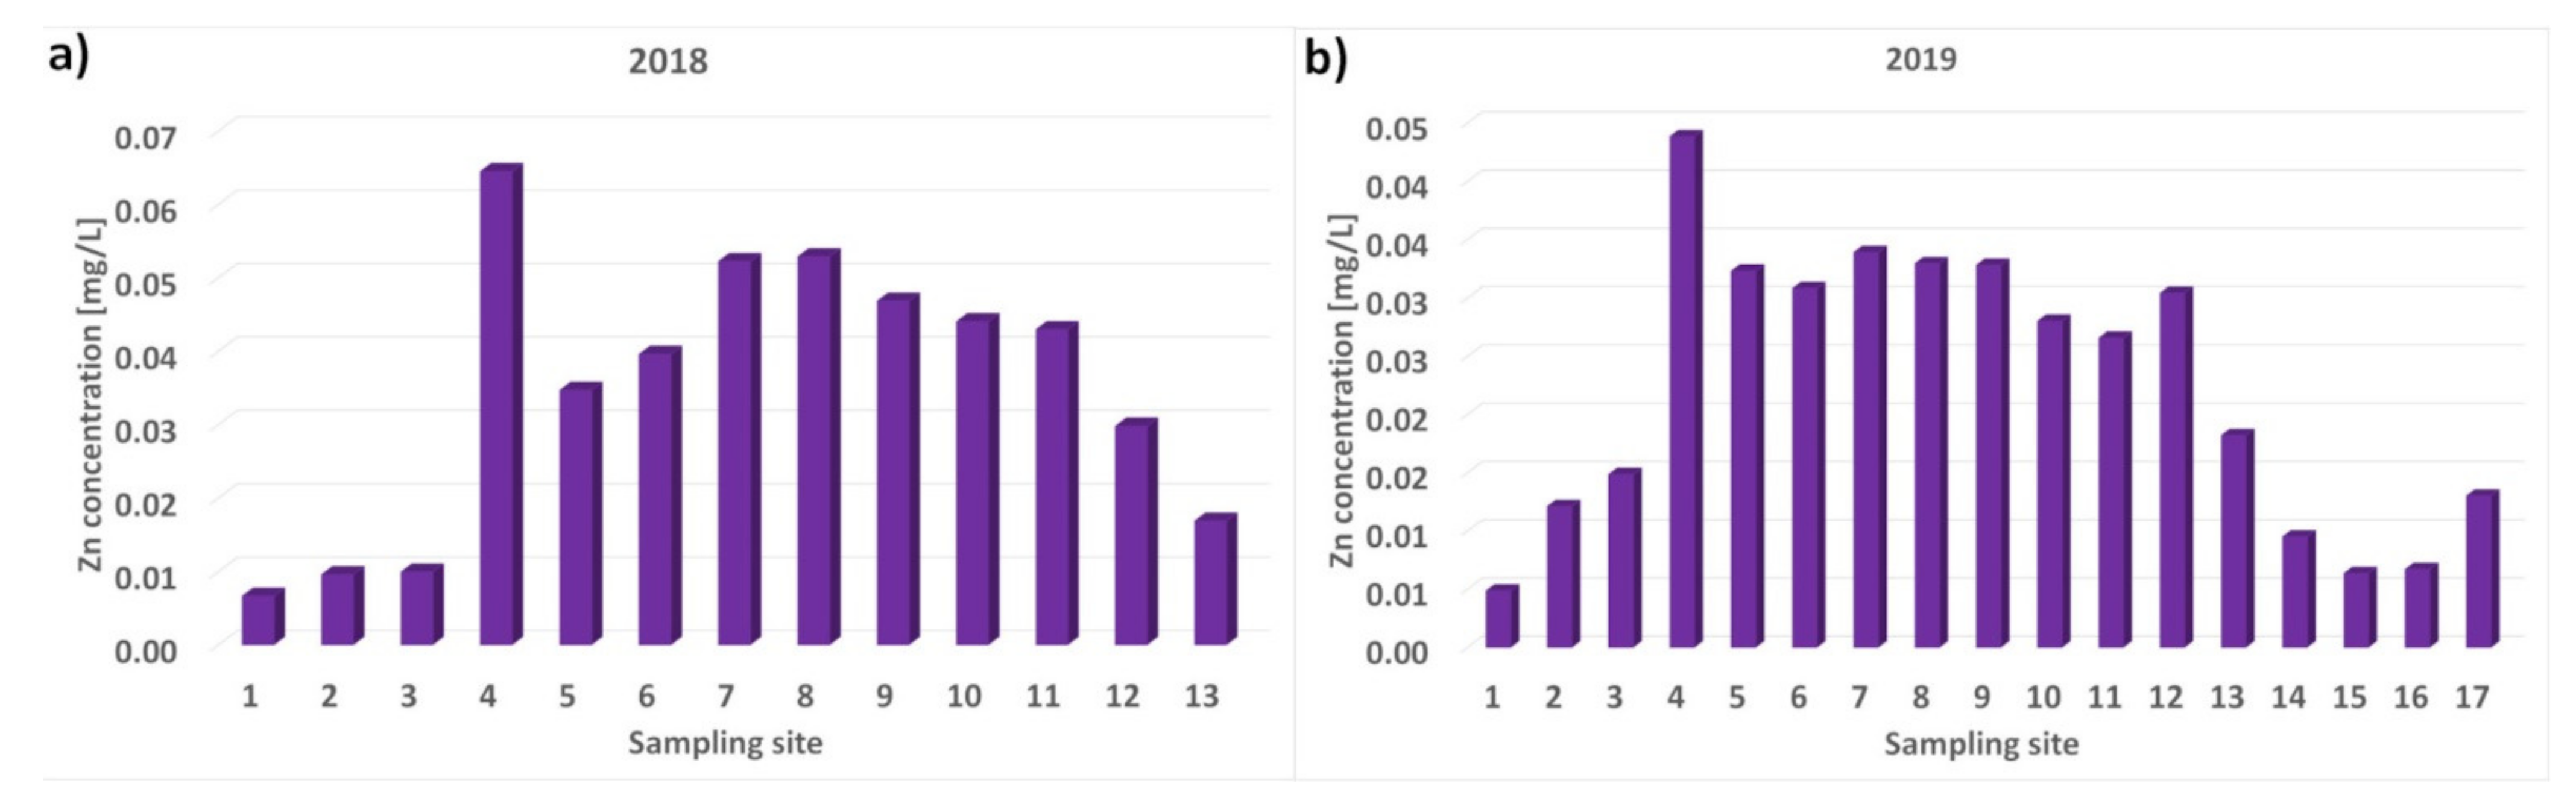
3.2.2. Spatial Variability of Cd, Pb, Cu, Zn, Mn, and Fe Concentrations

Cadmium concentrations were found from <LOD to 1.20 µg/L in 2018 and 0.47 µg/L in 2019 (Tables S1 and S2). The highest contents were observed at sites 7–11, in 2018. In the following year, these points were also characterized by slightly higher Cd concentrations. In both years, the lowest concentrations were noticed at sites 1, 2, and 3. In the environment, Cd usually comes from the Ni-Cd type of batteries, plastic and steel industries as well as fossil fuels, municipal waste burning, transport, and agriculture [5,14,33,43,58,59]. Cadmium occurs in the phosphorus fertilizers and may be released from the soil into the river water as a result of the application of NPK fertilizers, which promotes Cd mobility. This metal is also detected in the urban runoff as a consequence of tires and brakes outwearing or operating car washing facilities. Agriculture and transport are probably the main factors responsible for the presence of cadmium in the Bzura waters. However, high values of the coefficient of variations (CVs) indicate the presence of other point sources of cadmium contamination as well (Tables S1–S4).
Lead was determined from <LOD to 28.6 µg/L in 2018 and 25.0 µg/L in 2019. However, in 2019, at sites 7 and 17, the amounts of lead were 85.3 µg/L and 63.7 µg/L, respectively (Tables S1 and S2). Considering spatial variability in 2018, we can distinguish the river section from sites 6 to 11 with the highest Pb values. In 2019, only sites 7 and 10 were characterized by elevated Pb concentrations. The remaining points did not show clear diversity. Chemical fertilizers, pesticides, domestic plumbing, and vehicular traffic are the most probable Pb sources among the specified ones in the literature. The phasing out of lead tetraethyl added to fuel reduced the lead content in road runoff; however, Pb is still used in lead-acid batteries, wheel balance weights, brakes, or car body paint [33,43,59].
Copper concentrations ranged from <LOD to 0.073 mg/L in 2019 and 0.067 mg/L in 2018, with the exception of site 13 (0.129 mg/L in September 2018) (Tables S1 and S2). In 2019, the highest Cu concentrations were determined at points 6 to 9. Below site 9, a decrease in the metal content was noticed. A slight increase in Cu concentrations was observed only at sites 15 and 16 in Łowicz town. In 2018, Cu levels were comparable at all sites and they do not create any consistent spatial trend. Copper is used in many industrial branches, such as electroplating or the production of pigments, batteries, and fertilizers [33,60]. The spatial variability of Cu in the Bzura does not clearly indicate the potential sources. However, following the type of land use, road runoff, industrial and municipal sewage, and agriculture are the most possible sources of Cu. Municipal sewage often contains copper as a result of copper pipes corrosion. Copper is associated with transport as it is used in the production of tires and brakes and as an impurity of road salts [43,59].
Zinc concentrations were determined from <LOD to 0.099 mg/L in 2019 and 0.147 mg/L (with the exception of sites 7 and 8 with 0.237 mg/L and 0.206 mg/L, respectively) in 2018 (Tables S1 and S2). The spatial variability of zinc in the Bzura was similar in both years (Figure 4). The lowest contents were observed at sites 1–3 and 13–17, where median values did not exceed 0.02 mg/L. Site 4 was characterized by the highest concentrations, namely 0.065 mg/L in 2018 and 0.044 mg/L in 2019. At site 4, zinc probably comes mainly from the waste dump runoff [21] and leaching of the bottom sediments, which is indicated by the highest Zn content detected in bottom sediment (765 mg/kg). Levels of natural zinc in the bottom sediments are defined up to 73 mg/kg. Therefore, its content at site 4 exhibits anthropogenic enrichment (Table 2). Below point 4, Zn contents decreased because of dilution, but at the same time, other point sources of pollution caused local increases in the concentration of metal again. Additional sources could be road runoff, urban stormwater, municipal wastewater, and agriculture. Zinc is used as corrosion protection in many constructions, such as roof covers, lamp poles, galvanized building pipes, and car bodies. Zinc, like copper, is also one of the road salt impurities. It may also come from arable and animal farming. Zinc is contained both in crop protection treatment and inorganic fertilizers as well as manure and slurry. This is caused by nutritional supplements applied to promote the growth of animals, especially pigs [39,43,59,61,62].
Manganese concentrations ranged from <LOD to 0.32 mg/L in 2018 and 0.22 mg/L in 2019. In the case of iron, concentrations were found from <LOD to 1.30 mg/L in 2018 and 0.53 mg/L in 2019 (Tables S1 and S2). Both in 2018 and 2019, the lowest Fe and Mn concentrations were at site 1. Median values of Fe did not differ substantially at the remaining points. The highest Mn concentrations were found at site 3 in both years. Similar to Fe, the remaining points were characterized by comparable levels. Manganese and iron are usually regarded as metals of natural origin as they are among the most abundant elements in the Earth’s crust [59,63,64]. Their presence in river water is mainly caused by the dissolution of Fe and Mn oxides as well as catchment erosion [54,61]. However, they may also come from anthropogenic sources, such as the production of steel and iron alloys [59,65]. Mn is also used in the production of fertilizers as well as disinfectants and bleaching agents (potassium permanganate) and therefore it is detected in agricultural and urban wastewater [37,59].

3.2.3. Temporal Variability of Ni, Cd, Pb, Cu, Zn, Mn, and Fe Concentrations

Metal concentrations in the Bzura River water varied from month to month (Tables S3 and S4). The highest levels of Ni and Pb were in December 2018 and April 2019. Elevated concentrations were observed after the long-lasting rainfall; however, this cannot be considered a trend. Relatively high Pb concentrations were also detected in February and July 2019 and from June to August 2018. The highest median and maximum values of Cd were observed from December to February and in August 2019 and in January and February 2018. Additionally, high Cd levels were also found in March, June, and July 2018. As far as zinc is concerned, the highest concentrations were recorded in January, February, and April 2019 as well as from November to March 2018. Cu is the only metal that was not detected for several months. In January, February, and October 2018 as well as in December, January, March, and April 2019, concentrations at all sites were found below LOD. The highest median values were determined in August 2019, June, and July 2018. Monthly medians of Fe and Mn concentrations were comparable during the year. However, April and May were characterized by slightly higher values of Fe in both years. In the case of Mn, the level of 0.1 mg/L was reached from December to June 2018 and from January to May 2019.
Generally, concentrations of Cd and Zn were slightly higher in the months with the highest downfalls, Pb and Ni concentrations increased after the long-lasting rainfall, while Cu contents were detected in the summer. However, temporal variability did not create any consistent seasonal trend. No clear hydrological or meteorological impact on the concentrations of trace metals in the surface water within urban, industrial, and agriculture areas was observed in other Polish reservoirs [38,39,66]

3.2.4. Coefficients of Variation

Based on the coefficient values of variation (CVs) (Tables S1–S4), the degree of metal concentration variability between the sampling sites (spatial variability) and also between months (temporal variability) was determined. In both years, the Ni, Pb, and Cd contents were characterized by the highest variability (exceptionally high or high) between the sites [24]. Temporal variability for Ni was high or exceptionally high, whereas for Pb and Cd it was mainly high or moderate. Exceptionally high CVs values (>100%) indicate important spatial and/or temporal variation for metals [45,65,67]. In the case of Zn, Fe, and Mn, moderate or high variability was observed both between sites and months. However, in both years, moderate CVs predominate for Fe in the case of spatial and temporal variability. The wide range of spatial and temporal CVs suggests anthropogenic sources of these metals [65]. The CVs higher than 50% may indicate different sources of metals or dilution in the river water [65]. Most of such values were noticed for Ni, Pb, Cd, and Zn, while the least for Fe and Mn.

3.3. Water Quality

The quality of the Bzura River was assessed based on threshold levels following the WHO, USEPA, and Polish Regulations concerning drinking water and surface water classification (Table 3).
Limits of metal concentrations for drinking water were established by the WHO, USEPA, and Polish Regulation of Health Minister [59,68,69]. In the case of Cd, Cu, and Zn, all determined concentrations were lower than the threshold values. Most values above the guideline limits were found for Mn. In both years, it was about 70% and 40% of water samples according to the USEPA and the WHO, respectively. Permitted levels were exceeded at every site, but mostly at sites 3 and 4. Fe concentrations exceeded the guideline limit is 60% and 33% of samples collected in 2018 and 2019, respectively. Only site 1 was characterized by lower levels than thresholds in all months. Concentrations of Pb and Ni were above the standard in less than 10% and 20% of the samples, respectively. In 2018, Pb concentrations were above limits at sites from 6 to 11 and 13. In 2019, the limit values were sporadically exceeded at sites 2, 3, 6, 7, 10, and 17. According to the Polish Regulation [69], Ni concentrations were higher than the permitted limits at sites from 4 to 12 and at 15 and 16 in 2019, while in 2018 only at sites 4–10. Ni contents determined for sites from 4 to 7 also exceeded the WHO standards. The lowest Ni concentrations, below the threshold limits, were found in September 2019 and February 2018, while the highest—in April 2019 and December 2018. Site 4 was characterized by the Ni levels higher than permitted almost every month, only except in April 2019 and February 2018.
According to Polish legislation, surface waters can be classified in terms of their chemical and ecological quality [71] or their suitability for consumption [70]. The Polish regulation on the requirements for surface water intended for food purposes specifies the parameters that surface water should meet before treatment [70]. Water could be divided into three categories (Cat. A1, Cat. A2, Cat. A3) depending on water treatment processes (Table 3 and Table 4).
To assess the chemical status of the Bzura River water, the results of our investigation were compared to the threshold values specified in the Regulation of the Minister of Marine Economy and Inland Navigation on surface water quality [71]. According to the Cd and Zn concentrations, a good chemical status was achieved at all sites. However, the guideline limits were exceeded for Ni, Pb, and Cu. In terms of the Ni levels, the chemical status was classified as failing to achieve ‘good’ at sites from 4 to 10 in December 2018 and April 2019. Additionally, a good chemical status was not reached ten, four times, and twice at sites 4, 5, and 6, respectively. The Pb concentrations indicated less than a good status at site 7 (in four months) as well as at sites 2, 3, 6, 8–10 (in two months) and only once at sites 11, 13, 17. In 2019, the Cu concentrations were higher than threshold limits only in August at sites 1–3 and 5–7. In 2018, the status was determined as failing to be considered good at sites 2–7, 9–11, and 13, once or twice. Taking into account all metal concentrations, a good chemical status was most often achieved at sites 12, 14, 15, and 16 (every month) and sites 1 and 17 (except one month).

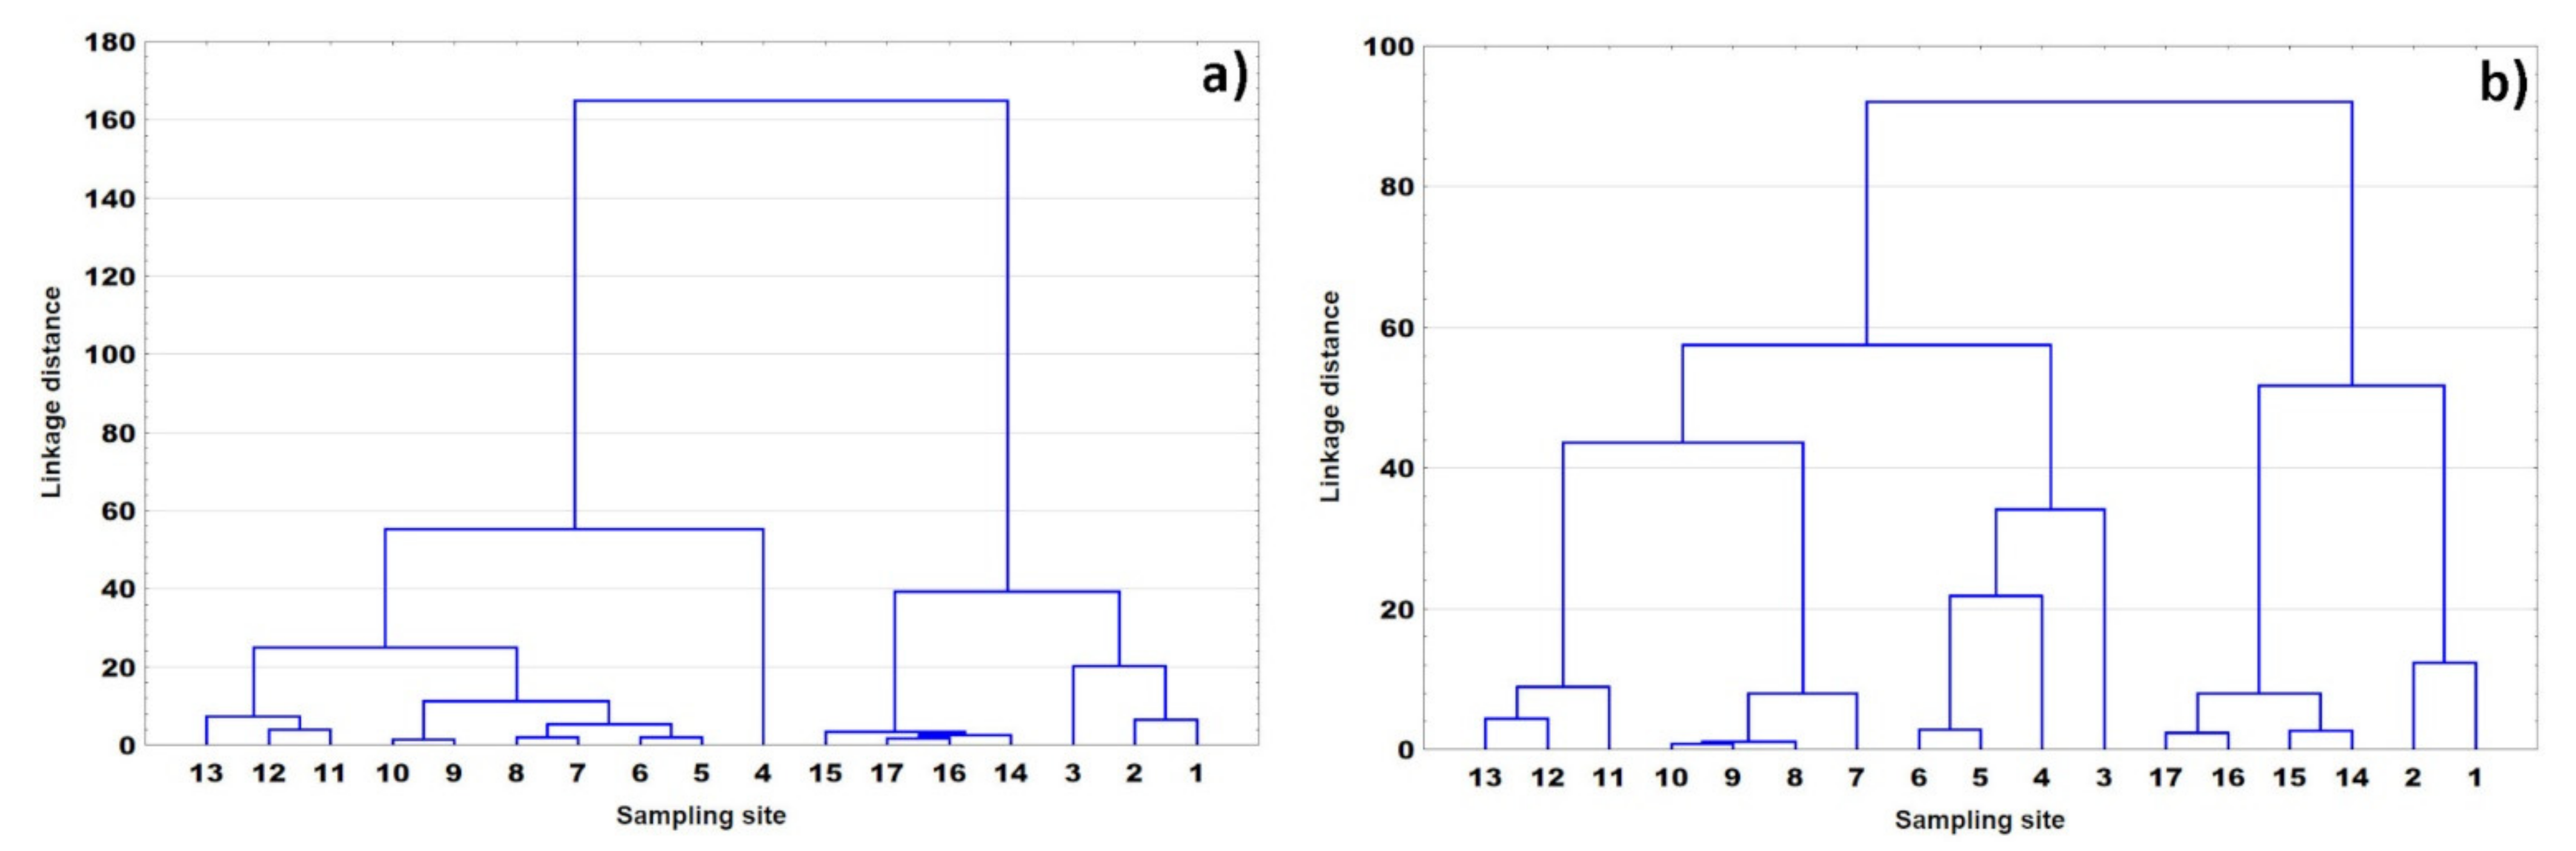
3.4. Multivariate Statistics

PCA and CA were used to determine the relations between variables and classify sampling points. Calculations were performed for selected months as well as for both years. February and July (in 2019) were the only months with a majority of the results above LOD for all metals. Therefore, statistical data were compared between these months. During both years, most of the values above LOD were measured for Ni, Mn, and Fe (86%, 97%, and 98% of the total number of results, respectively) (Tables S3 and S4). Hence, PCA and CA were carried out for these elements and physicochemical properties.

3.4.1. Comparison between February and July

PCA revealed that data variability for winter and summer months was controlled by different numbers of main components (Table 5). In February, three principal components (PCs) with 54.9%, 21.4%, and 10.3% contributions of the total variance and eigenvalues higher than one were extracted. In July, four PCs, which explained 36.5%, 21.0%, 18.4%, and 13.0% and had eigenvalues higher than or equal to one, were identified. Hence, PC1 has a significantly lower share in variability explanation in summer than in winter.
In February, PC1 was strongly or moderately influenced by all variables (except temperature) with correlation coefficients ≥0.7 and 0.5–0.7, respectively [65,66]. PC1 represents a mixed anthropogenic-lithogenic source of metals. Site 4 shows the highest negative PC1 score (indicating the highest concentration of metal) (Figure S2). This point is characterized by the lowest pH and the highest TDS values, which may increase the desorption of metals from sediments [72]. At sites below sample 4, the impact of PC1 fluctuates in the range from −3 to −1, and from point 12 there is an increase in positive values, comparable to those in sites 1 and 2. PC2 has strongly positive correlation coefficients for water temperature, moderately positive for TDS and DOC as well as moderately negative for Cu and Pb. This principal component contrasts physicochemical properties with metal concentrations. The presence of TDS, DOC, Cu, and Pb both in PC1 and PC2 indicates that PC2 is related to other processes than PC1 and it may be associated with metal accumulation. The processes of metal adsorption and desorption on the sediment significantly affect its concentration in water. Several authors reported that metals leaching from sediment may depend on seasonal parameters like organic matter and temperature [54,73]. Results of the mentioned studies which investigated temperature effects on Pb [74] and Cu [75] adsorption on sediments and suspended solids proved that accumulation of these metals increases with rising temperature. Site 4 and points 14–17 in the lower course of the river have the highest PC2 scores, which may result from the elevated temperature at these points. This favors the process of metal adsorption on sediments, which reduces the concentration of these metals in the water. PC3 was positively correlated with pH and Mn, (strongly or moderately, respectively). The presence of Mn in two components indicates different sources of this element.
The trend of PC1 in both months is generally similar. In July, PC1 was strongly negatively correlated with DOC, Ni, Zn and moderately negatively with temperature, TDS, Cu, and Cd. Samples 3–10 and 12 are characterized by negative PC1 scores. The significant share of metals from human activities, often found in urban runoffs, allows assigning this component to anthropogenic sources. Additionally, in stormwater runoff, organic matter has a high affinity for metals such as Ni, Cu, Cd [43]. The high correlation coefficient of Ni, which in our case comes mainly from landfill, indicates the anthropogenic nature of PC1. The significant influence of temperature also proves the anthropogenic nature of PC1, because often at the place of discharge of wastewater (containing metals) an increased temperature of surface waters is noted [26]. PC2 is strongly correlated with TDS (negatively) and Cu (positively). Additionally, moderately negative (temperature) and positive (Cd) correlations were observed. PC2 is related to the influence of temperature on the sorption processes of Cu and Cd in sediments [75]. PC3 was dominated by strongly negatively correlated Fe and Mn as well as moderately negatively pH. Fe and Mn mainly come from natural processes [65], but the highest PC3 score is presented by point 3. Therefore, PC3 may be attributed to mixed anthropogenic-lithogenic sources. PC4 was characterized by strongly (Pb) and moderately (pH) positive correlation coefficients. The stretch of the river where the PC4 share was found to be significant is located in agricultural and built-up areas along with local roads and a motorway. This may indicate the presence of a new mixed Pb source in the summer as a result of re-suspension processes from bottom sediments and human activity (e.g., fertilization, waste, batteries) [39,76,77].
Following the CA (Figure 5) in February and July, two clusters of samples were extracted: I—sites 1–2 and 14–17; II—sites 4–13. The only difference is the change in the position of sample 3 in July compared to February due to the increase in the pollutant load at this site in the summer. In addition, the distance between clusters I and II in February is much greater than in July, which may indicate the diversity of sources and pollution loads discharged into the Bzura River in the winter and summer seasons. Thus, in February, there is a more distinct division into river sections with a relatively small (cluster I) and significant influence (cluster II) of anthropogenic factors. In July, the loads of Fe, Mn, Ni, Zn, and Cd in the river section between points 4–13 decreased. This resulted in a certain change in the location of points in cluster II.

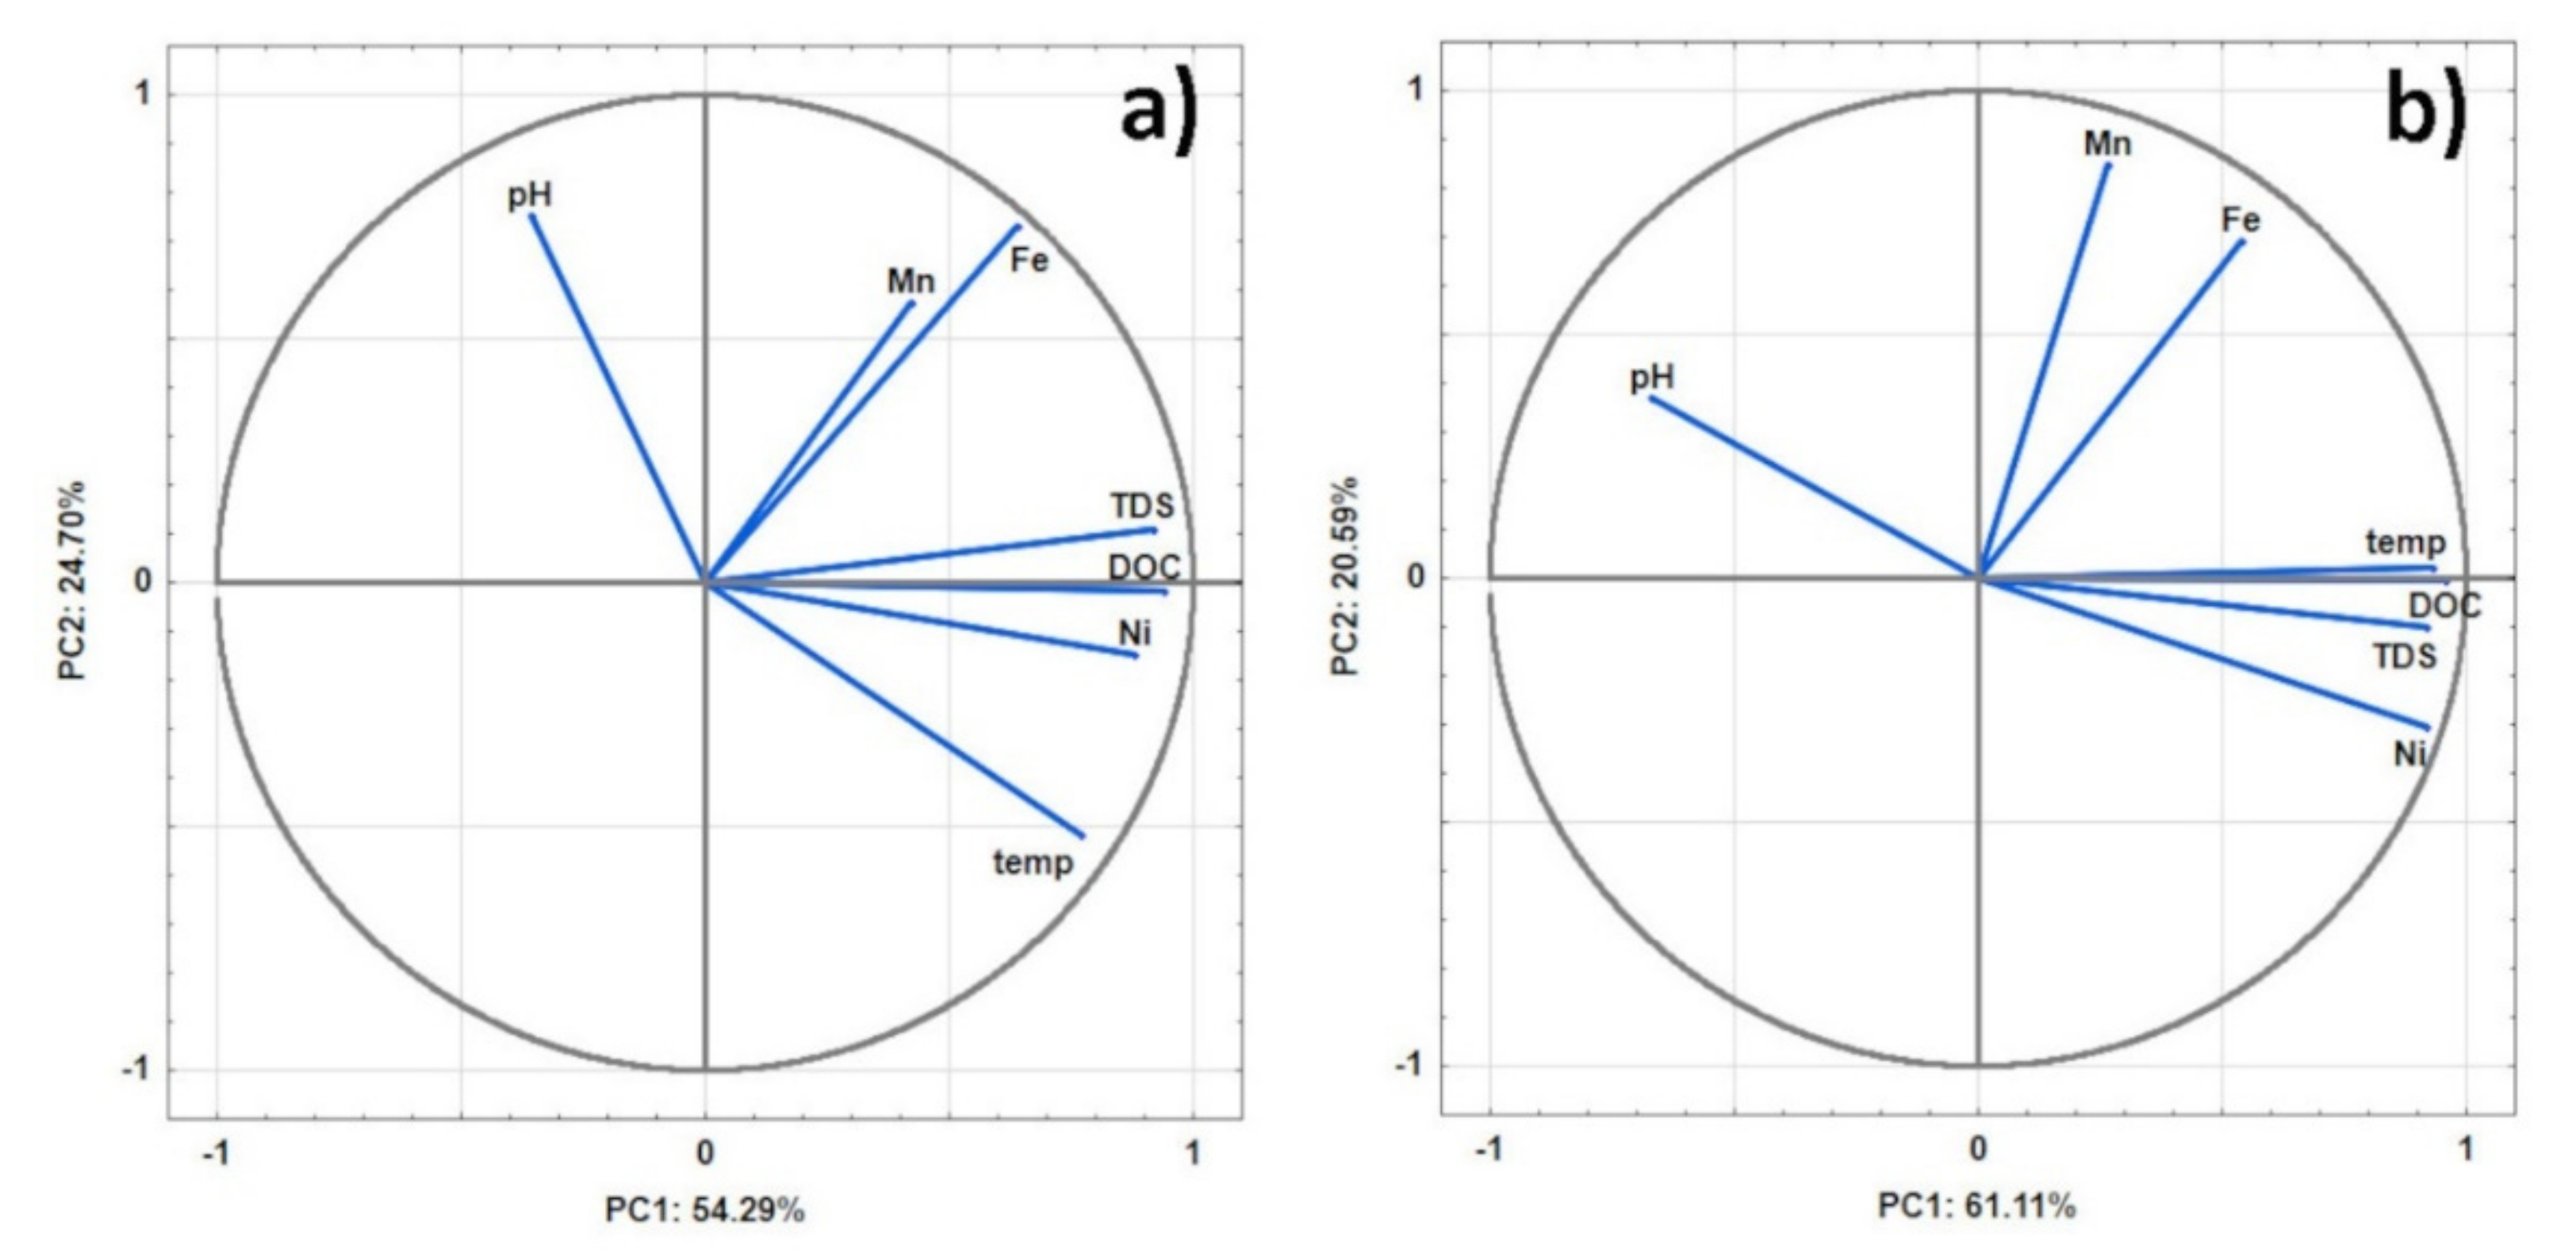
3.4.2. Comparison between Years

Following the PCA calculated for Ni, Mn, Fe, and physicochemical properties, three main components (PCs) were extracted both in 2018 and 2019. Together they explain almost 92% of the data variability. However, some differences occur for individual components. PC1, PC2 and PC3 explain 54.3%, 24.7%, 12.9% and 61.1%, 20.6%, 10.2% for 2018 and 2019, respectively. Eigenvalues were 3.8, 1.7 and 0.9 (in 2018) and 4.3, 1.4 and 0.7 (in 2019) for PC1, PC2 and PC3, respectively. Although eigenvalues of PC3 are below 1 for both years, they have been included in the following considerations, because each of them explains more than 5% of variance [78].
In both years, temperature, TDS, DOC, Ni showed strongly and Fe moderately positive correlations with PC1 (Figure 6). PC1 was also negatively correlated with pH, but weakly (−0.36) in 2018 and moderately (−0.67) in 2019. In addition, a moderately positive (0.42) PC1 correlation coefficient for Mn was observed in 2018. Correlation coefficients indicate that PC1 represents the overall pollution of river water mainly from anthropogenic sources of pollutants. Metals of anthropogenic origin are usually more mobile and their release increases towards low pH values [79]. PC2 was characterized by positively strong or moderate correlation coefficients of Fe and Mn as well as a positive (strong in 2018 and weak in 2019) correlation with pH. In 2018, PC2 had also a moderately negative correlation coefficient for temperature. Additionally, the relatively low variability between sampling sites and months can indicate a negligible anthropogenic impact [80]. For these reasons, PC2 probably represents the lithogenic source. The origin of Fe and Mn was also defined as natural in other contributions concerning metal sources in the aquatic environment [63,65]. PC3 includes only pH (positive correlation) and Mn (negative) (Figure S3). Moderate and weak correlations for these variables may suggest the additional point source of Mn. The highest PC3 score is observed at site 3 (the town of Zgierz). The location of this point suggests that the source of Mn can be e.g., combustion fuel additives used in local heating systems or illegal dumping of waste.
Trends in the spatial variability of PC scores were very similar in both years (Figure S4). Sites 1 and 2 located within the Bzura source area have the lowest negative PC1 scores. It confirms the low impact of pollution at these sites. The highest positive PC1 score (anthropogenic pollutants) is observed for site 4. It is caused by the influence of landfills, sewage treatment plants, and urban activity. Below point 4, the impact of PC1 significantly decreases, and in the further course of the river, it usually ranges from −1 to 1, which proves an average influence of given factors [37]. It also proves that at site 4 there is a source of pollution that determines river water chemistry. PC2 has the lowest negative scores at sites 1 and 4. The low impact of the natural factors at site 4 results from the high share of anthropogenic pollutants. Site 1 (river source section) is not polluted, but Fe and Mn concentrations are not particularly high due to the low surface runoff and the low metal content in the soil. Below point 4, the influence of PC2 increases and most often fluctuates between −1 and 1. As it has already been stated, in both years the lowest negative PC3 scores were recorded at site 3. For each month, the highest or one of the highest concentrations of manganese were found at this point.
Cluster analysis (Figure 7) shows that site 4 is a hot-spot and the other points are grouped in one cluster. It can be seen that site 1 differs from the others. In addition, several subclusters can be distinguished. Subcluster I includes sites with low water pollution, namely sites 2 and 3 in 2018 and sites 14–17 in 2019. These are the points from the initial section, which carry only a small load of pollutants, and the points from the lower section, where the pollutants have already diluted and the activities in this area do not cause any additional contamination. Subcluster II contains sites 5–13 i.e., the section of the river under a strong impact of anthropogenic pollution (except 4, which is a hot-spot). The linkage distances in subcluster II are below 20, so these points are similar. However, it can be seen that the classification of points depends on the type of pollutant, especially in 2019. The pollutants migrating from point 4 have a strong impact on the sites below (5 and 6). Subsequent sites downstream of the river are less influenced by the hotspot. However, points 11–13 are found in intensively used agricultural areas (mainly the cultivation of vegetables) and thus separated from sites 7–10 (mixed pollutants from transport, wastewater treatment plants, agriculture).
The PCA and CA results prove that in both hydrological years, similar factors influence the water chemistry. The predominant factor is the anthropogenic impact, which accounts for over 50% of the variability. In both years, the influence of factors on individual sampling sites is similar. According to the studies, the “constant” sources of pollution (waste landfills, sewage treatment plants, urban runoff, and land use which did not change significantly within two years) are of significance to the spatial and temporal variability. Climatic and meteorological factors in annual terms seem to be less important, which was also noticed by Siepak et al. [66].

4. Conclusions

(1)
Our study is the first comprehensive investigation that provided detailed information about the trace metal variability in the Bzura River water within the Łódź Province for 24 months.
(2)
It has been found that industrial and hazardous waste dumps located above site 4 are significant sources of water pollution by metals. Waste from the dye production plant, municipal and industrial waste, electronic and electrical equipment, construction debris, and others were deposited in landfills. Part of the industrial waste is stored in metal containers. Their corrosion, found as a result of the inspection, is an additional source of heavy metals.
(3)
The most interesting finding is the spatial trend of nickel concentrations. Contrary to the remaining metals, long-distance migration was detected. In the case of this metal, the impact of the landfill is visible within about 70 km. This poses a particular threat to the areas below site 4 in the case of the release of exceptionally high nickel contents from the waste landfill.
(4)
The contamination of the river with the other metals comes from mixed sources, i.e., waste dumping, municipal sewage treatment plants, agricultural areas, transportation.
(5)
Following the multivariate statistics, one hotspot and groups of sites depending on the pollution sources were distinguished.
(6)
Water quality has improved since the 1990s, but anthropogenic factors still dominate water chemistry. Additionally, the exceedance of the threshold concentrations occurs unpredictably. Therefore, intensive monitoring of water quality should be constantly carried out.
(7)
To improve the water quality in the Bzura River, it is necessary to limit the inflow of metals from the urban areas. The solution to this problem requires prevention of the leachate migration from landfills and an increase in wastewater treatment efficiency.

Supplementary Materials

The following are available online at https://www.mdpi.com/article/10.3390/min11080861/s1, Figure S1: The annual mean values of physicochemical properties of river water: (a) temperature, (b) TDS, (c) pH, (d) DOC; Figure S2: Spatial changes of PC scores in (a) February and (b) July in 2019; Figure S3: Correlations between the variables and principal components in the projection of PC1 and PC3 for (a) 2018 and (b) 2019; Figure S4: Spatial changes of PC scores in (a) 2018 and (b) 2019; Table S1: Results of metal concentrations in the Bzura River water according to the sampling sites in 2019; Table S2: Results of metal concentrations in the Bzura River water according to the sampling sites in 2018; Table S3: Results of metal concentrations in the Bzura River water according to the months in 2019; Table S4: Results of metal concentrations in the Bzura River water according to the months in 2018; Table S5: Sample no. 4—results of basic statistics: standard deviations (s) [µg/L], coefficients of variation (CV) [%] and confidence intervals (CI) (n = 4; p = 95%).

Author Contributions

Conceptualization, K.W. and A.T.; methodology, K.W., J.K. and A.T.; software, K.W.; validation, K.W. and J.K.; formal analysis, K.W., J.K. and A.T.; investigation, K.W., J.K. and A.T.; data curation, K.W.; writing—original draft preparation, K.W., A.T. and W.M.W.; writing—review and editing, K.W., A.T. and W.M.W.; visualization, K.W.; supervision, W.M.W.; funding acquisition, W.M.W. All authors have read and agreed to the published version of the manuscript.

Funding

This work received financial support from the Voivodeship Fund for Environmental Protection and Water Management in Lodz, Poland (grant number 804/BN/D/2016) and the Institute of General and Ecological Chemistry of Lodz University of Technology.

Data Availability Statement

All data presented in the article.

Acknowledgments

The authors are grateful to Lodz University of Technology for granting access to the computing infrastructure built into project Nos. POIG.02.03.00-00-028/08 “PLATON-Science Services Platform” and POIG.02.03.00-00-110/13 “Deploying high-availability, critical services in Metropolitan Area Networks (MAN-HA)”. The authors wish to thank Małgorzata Szczesio (Institute of General and Ecological Chemistry, Lodz University of Technology) for preparing the map of the study area and Piotr Anielak (Institute of General and Ecological Chemistry, Lodz University of Technology) for his excellent support in DOC analyses.

Conflicts of Interest

The authors declare no conflict of interest.

Appendix A

Table A1. Results of reference material analysis (n = 6).
Metal Concentrations [µg/L]
Sub-sampleNiCdPbCuZnFeMn
1246251267243312349260
2257245268243308344256
3249247272240303338260
4250249275238313337262
5243249276242315316261
6244248279235308328258
Found value [µg/L]248 ± 5248 ± 2273 ± 5240 ± 3310 ± 5335 ± 12260 ± 2
Certified value [µg/L]251 ± 17258 ± 21280 ± 22261 ± 19320 ± 26229 ± 21293 ± 17
Recovery [%]98.896.197.592.096.911288.7
Table A2. Partition coefficients (log Kd) in bottom sediment and water at particular sites (in July 2018).
MetalSite 1Site 4Site 11
Zn2.464.393.36
Fe4.644.034.03
Mn3.463.033.04
Ni3.721.842.61
Cu2.793.322.75
Cd2.573.872.86
Pb2.993.872.89
Kd = Cs/Cw, where Cs, Cw are metal concentrations in sediment and water, respectively [81].

References

  1. Global Compact Network Poland. Available online: https://ungc.org.pl/info/zasoby-wodne-polsce (accessed on 8 February 2021).
  2. Bureau of Reclamation. Available online: https://www.usbr.gov/mp/arwec/water-facts-ww-water-sup.html (accessed on 8 February 2021).
  3. Bhuyan, M.S.; Bakar, M.A.; Rashed-Un-Nabi, M.; Senapathi, V.; Chung, S.Y.; Islam, M.S. Monitoring and assessment of heavy metal contamination in surface water and sediment of the Old Brahmaputra River, Bangladesh. Appl. Water Sci. 2019, 9, 125. [Google Scholar] [CrossRef] [Green Version]
  4. Wieczorek, K.; Turek, A.; Szczesio, M.; Wolf, W.M. Comprehensive Evaluation of Metal Pollution in Urban Soils of a Post-Industrial City—A Case of Łódź, Poland. Molecules 2020, 25, 4350. [Google Scholar] [CrossRef] [PubMed]
  5. Wuana, R.A.; Okieimen, F.E. Heavy Metals in Contaminated Soils: A Review of Sources, Chemistry, Risks and Best Available Strategies for Remediation. Int. Sch. Res. Not. 2011, 2011, 402647. [Google Scholar] [CrossRef] [Green Version]
  6. Huang, X.; Luo, D.; Zhao, D.; Li, N.; Xiao, T.; Liu, J.; Wei, L.; Liu, Y.; Liu, L.; Liu, G. Distribution, Source and Risk Assessment of Heavy Metal(oid)s in Water, Sediments, and Corbicula Fluminea of Xijiang River, China. Int. J. Environ. Res. Public Health 2019, 16, 1823. [Google Scholar] [CrossRef] [PubMed] [Green Version]
  7. Okupny, D.; Rzepecki, S.; Borówka, R.K.; Forysiak, J.; Twardy, J.; Fortuniak, A.; Tomkowiak, J. Factors influencing temporal changes in chemical composition of biogenic deposits in the middle Tążyna Fiver Valley (Kuyavian Lakeland, central Poland). Geologos 2016, 22, 121–136. [Google Scholar] [CrossRef] [Green Version]
  8. Skorbiłowicz, E.; Skorbiłowicz, M.; Misztal, W. Distribution of Nickel, Copper and Cobalt in the Grain Fractions of Bottom Sediments of the Sokołda River and its Tributaries (Poland). J. Ecol. Eng. 2020, 21, 89–97. [Google Scholar] [CrossRef]
  9. Dibofori-Orji, A.N.; Ihunwo, O.C.; Udo, K.S.; Shahabinia, A.R.; Onyema, M.O.; Mmom, P.C. Spatial and temporal distribution and contamination assessment of heavy metal in Woji Creek. Environ. Res. Commun. 2019, 1, 111003. [Google Scholar] [CrossRef]
  10. Guan, J.; Wang, J.; Pan, H.; Yang, C.; Qu, J.; Lu, N.; Yuan, X. Heavy metals in Yinma River sediment in a major Phaeozems zone, Northeast China: Distribution, chemical fraction, contamination assessment and source apportionment. Sci. Rep. 2018, 8, 12231. [Google Scholar] [CrossRef] [PubMed] [Green Version]
  11. Hussain, J.; Hussain, I.; Arif, M.; Gupta, N. Studies on heavy metal contamination in Godavari river basin. Appl. Water Sci. 2017, 7, 4539–4548. [Google Scholar] [CrossRef]
  12. Mohiuddin, K.M.; Ogawa, Y.; Zakir, H.M.; Otomo, K.; Shikazono, N. Heavy metals contamination in water and sediments of an urban river in a developing country. Int. J. Environ. Sci. Tech. 2011, 8, 723–736. [Google Scholar] [CrossRef] [Green Version]
  13. Naveen, B.P.; Mahapatra, D.M.; Sitharam, T.G.; Sivapullaiah, P.V.; Ramachandra, T.V. Physico-chemical and biological characterization of urban municipal landfill leachate. Environ. Pollut. 2017, 220, 1–12. [Google Scholar] [CrossRef] [PubMed]
  14. Zhou, Q.; Yang, N.; Li, Y.; Ren, B.; Ding, X.; Bian, H.; Yao, X. Total concentration and sources of heavy metal pollution in global river and lake water bodies from 1972 to 2017. Glob. Ecol. Conserv. 2020, 22, e00925. [Google Scholar] [CrossRef]
  15. Haque, M.A. Effects of specimen size and mix ratio on the nickel migration behavior of landfill waste mixed mortar. J. Environ. Manag. 2017, 190, 290–301. [Google Scholar] [CrossRef] [PubMed]
  16. Mekonnen, B.; Haddis, A.; Zeine, W. Assessment of the Effect of solid Waste Dump Site on Surrounding Soil and River Water Quality in Tepi Town, Southwest Ethiopia. J. Environ. Public Health 2020, 5157046. [Google Scholar] [CrossRef] [PubMed]
  17. Pastor, J.; Hernández, A.J. Heavy metals, salts and organic residues in old solid urban waste landfills and surface waters in their discharge areas: Determinations for restoring their impact. J. Environ. Manag. 2012, 95, 542–549. [Google Scholar] [CrossRef] [PubMed]
  18. Prevention of Threats from Both Landfills from the Area of the Lodzkie Voivodeship. Supreme Audit Office 2020. No 170/2020/P19/112/LLO. Available online: https://www.nik.gov.pl/kontrole/P/19/112/LLO/ (accessed on 5 April 2021).
  19. Kopeć, D.; Ratajczyk, N.; Wolańska-Kamińska, A.; Walisch, M.; Kruk, A. Floodplain forest vegetation response to hydroengineering and climatic pressure—A five decade comparative analysis in the Bzura River valley (Central Poland). Forest Ecol. Manag. 2014, 314, 120–130. [Google Scholar] [CrossRef]
  20. Kobojek, E. Environmental effects of land reclamation and regulation of rivers in the Bzura valley near Łowicz. Acta Univ. Lodz. Folia Geogr. 2004, 6, 31–46. [Google Scholar]
  21. Trawczyńska, A.; Tołoczko, W.; Niewiadomski, A. The content of trace elements in water of the upper course of the Bzura river. Ochr. Śr. Zasobów Nat. 2009, 40, 491–496. (In Polish) [Google Scholar]
  22. Statistical Office in Łódź. Data on Łódź. Population. Population Based On Balances by Former Office Agencies of the City of Łódź Office (2010, 2015, 2016, 2017). Available online: https://lodz.stat.gov.pl/en/information-about-voivodship/capital-of-voivodship-614/population-data-on-lodz-2018/ (accessed on 27 June 2020).
  23. Head Office of Geodesy and Cartography. Available online: www.gugik.gov.pl (accessed on 20 April 2021).
  24. Karim, Z.; Qureshi, B.A.; Mumtaz, M.; Qureshi, S. Heavy metal content in urban soils as an indicator of anthropogenic and natural influences on landscape of Karachi—A multivariate spatio-temporal analysis. Ecol. Indic. 2014, 42, 20–31. [Google Scholar] [CrossRef]
  25. Cengiz, M.F.; Kilic, S.; Yalcin, F.; Kilic, M.; Yalcin, M.G. Evaluation of heavy metal risk potential Bogacayi River water (Antalya, Turkey). Environ. Monit. Assess. 2017, 189, 248. [Google Scholar] [CrossRef]
  26. Kretschmer, F.; Simperler, L.; Ertl, T. Analysing wastewater temperature development in a sewer system as a basis for the evaluation of wastewater heat recovery potentials. Energy Build. 2016, 128, 639–648. [Google Scholar] [CrossRef]
  27. Rzymski, P.; Klimaszyk, P.; Niedzielski, P.; Marszelewski, W.; Borowiak, D.; Nowiński, K.; Baikenzheyeva, A.; Kurmanbayev, R.; Aladin, N. Pollution with trace elements and rare-earth metals in the lower course of Syr Darya River and Small Aral Sea, Kazakhstan. Chemosphere 2019, 234, 81–88. [Google Scholar] [CrossRef]
  28. Ciazela, J.; Siepak, M.; Wojtowicz, P. Tracking heavy metal contamination in a complex river-oxbow lake system: Middle Odra Valley, Germany/Poland. Sci. Total Environ. 2018, 616–617, 996–1006. [Google Scholar] [CrossRef]
  29. Skorbiłowicz, M. The sources of nutrients in waters of rivers in the wetland areas of Narew National Park in north-eastern Poland. J. Ecol. Eng. 2013, 14, 1–7. [Google Scholar] [CrossRef]
  30. Moniewski, P. Seasonal changes of the selected physicochemical characteristics of the suburban small river waters on the Dzierżązna river example. Monogr. Kom. Gospod. Wodnej PAN 2014, 20, 407–416. [Google Scholar]
  31. Saarinen, T.S.; Kløve, B. Past and future seasonal variation in pH and metal concentrations in runoff from river basins on acid sulphate soils in Western Finland. J. Environ. Scieces Health Part A 2012, 47, 1614–1625. [Google Scholar] [CrossRef] [PubMed]
  32. Martinez-Tavera, E.; Rodriguez-Espinosa, P.F.; Shruti, V.C.; Sujitha, S.B.; Morales-Garcia, S.S.; Muñoz-Sevilla, N.P. Monitoring the seasonal dynamics of physicochemical parameters from Atoyac River basin (Puebla), Central Mexico: Multivariate approach. Environ. Earth Sci. 2017, 76, 95. [Google Scholar] [CrossRef] [Green Version]
  33. Suthar, S.; Sharma, J.; Chabukdhara, M.; Nema, A.K. Water quality assessment of river Hindon at Ghaziabad, India: Impact of industrial and urban wastewater. Environ. Monit. Assess. 2010, 165, 103–112. [Google Scholar] [CrossRef]
  34. Emenike, C.P.; Neris, J.B.; Tenebe, I.T.; Nnaji, C.C.; Jarvis, P. Estimation of some trace metal pollutants in River Atuwara southwestern Nigeria and spatio-temporal human health risks assessment. Chemosphere 2020, 239, 124770. [Google Scholar] [CrossRef] [PubMed]
  35. Górniak, A. Spatial and temporal patterns of total organic carbon along the Vistula River course (Central Europe). Appl. Geochem. 2017, 87, 93–101. [Google Scholar] [CrossRef]
  36. Siddiqui, E.; Pandey, J. Assessment of heavy metal pollution in water and surface sediment and evaluation of ecological risks associated with sediment contamination in the Ganga River: A basin-scale study. Environ. Sci. Pollut. Res. 2019, 26, 10926–10940. [Google Scholar] [CrossRef]
  37. Adamiec, E.; Helios-Rybicka, E. Distribution of Pollutants in the Odra River System. Part IV. Heavy Metal Distribution in Water of the Upper and Middle Odra River, 1998–2000. Pol. J. Environ. Stud. 2002, 11, 669–673. [Google Scholar]
  38. Samecka-Cymerman, A.; Kempers, A.J. Heavy Metals in Aquatic Macrophytes from Two Small Rivers Polluted by Urban, Agricultural and Textile Industry Sewages SW Poland. Arch. Environ. Contam. Toxicol. 2007, 53, 198–206. [Google Scholar] [CrossRef] [PubMed]
  39. Helios-Rybicka, E.; Adamiec, E.; Aleksander-Kwaterczak, U. Distribution of trace metals in the Odra River system: Water–suspended matter–sediments. Limnologica 2005, 35, 185–198. [Google Scholar] [CrossRef] [Green Version]
  40. Frankowski, M.; Sojka, M.; Zioła-Frankowska, A.; Siepak, M.; Murat-Błażejewska, S. Distribution of heavy metals in the Mała Wełna River system (western Poland). Oceanol. Hydrobiol. Stud. 2009, 38, 51–61. [Google Scholar] [CrossRef]
  41. Gao, L.; Chen, J.; Tang, C.; Ke, Z.; Wang, J.; Shimizu, Y.; Zhu, A. Distribution, migration and potential risk of heavy metals in the Shima River catchment area, South China. Environ. Sci. Process Impacts 2015, 17, 1769–1782. [Google Scholar] [CrossRef] [PubMed]
  42. Dundar, M.; Altundag, H. Investigation of heavy metal contaminations in the lower Sakarya river water and sediments. Environ. Monit. Assess. 2007, 128, 177–181. [Google Scholar] [CrossRef] [PubMed]
  43. Sinha, D.K.; Kumar, N. Monitoring of Trace Metals in Gagan River Water at Moradabad. Indian J. Environ. Prot. 2006, 26, 516–520. [Google Scholar]
  44. Müller, A.; Österlund, H.; Marsalek, J.; Viklander, M. The pollution conveyed by urban runoff: A review of sources. Sci. Total Eniron. 2020, 709, 136125. [Google Scholar] [CrossRef]
  45. State of the Environment. Available online: https://www.gios.gov.pl/pl/stan-srodowiska/monitoring-wod (accessed on 6 June 2021).
  46. Lim, W.Y.; Aris, A.Z.; Zakaria, M.P. Spatial Variability of Metals in Surface Water and Sediment in the Langat River and Geochemical Factors That Influence Their Water-Sediment Interactions. Sci. World J. 2012, 652150. [Google Scholar] [CrossRef] [Green Version]
  47. Calbo, J.; Sorlí, S.; Llusar, M.; Tena, M.A.; Monrós, G. Minimisation of toxicity in nickel ferrite black pigment. Br. Ceram. Transit. 2004, 103, 3–9. [Google Scholar] [CrossRef]
  48. Cempel, M.; Nikel, G. Nickel: A Review of Its Sources and Environmental Toxicology. Polish J. Environ. Stud. 2006, 15, 375–382. [Google Scholar]
  49. Chaudhry, A.U.; Mittal, V.; Mishra, B. Nano nickel ferrite (NiFe2O4) as anti-corrosion pigment for API 5L X-80 steel: An electrochemical study in acidic and saline media. Dye. Pigment. 2015, 118, 18–26. [Google Scholar] [CrossRef]
  50. Foster, S.L.; Estoque, K.; Voecks, M.; Rentz, N.; Greenlee, L.F. Removal of Synthetic Azo Dye Using Bimetallic Nickel-Iron Nanopartices. J. Nanomater. 2019, 9807605. [Google Scholar] [CrossRef]
  51. Harasim, P.; Filipek, T. Nickel in the environment. J. Elem. 2015, 20, 525–534. [Google Scholar] [CrossRef] [Green Version]
  52. Rathor, G.; Chopra, N.; Adhikari, T. Nickel as a Pollutant and its Management. Int. Res. J. Environment Sci. 2014, 3, 94–98. [Google Scholar]
  53. Naveen, B.P.; Sumalatha, J.; Malik, R.K. A study on contamination of ground and surface water bodies by leachate leakage from a landfill in Bangalore, India. Geo-Engineering 2018, 9, 27. [Google Scholar] [CrossRef]
  54. Zgierz City Council. Resolution No. XXX/359/2020 of the Zgierz City Council of 29 December 2020 on Demarcation of the Zgierz Agglomeration. Off. J. Lodzkie Voiv. 2021, 376. Available online: https://www.infor.pl/akt-prawny/U72.2021.027.0000376,metryka,uchwala-nr-xxx3592020-rady-miasta-zgierza-w-sprawie-wyznaczenia-aglomeracji-zgierz.html (accessed on 5 April 2021).
  55. Lourino-Cabana, B.; Billon, G.; Lesven, L.; Sabbe, K.; Gillan, D.C.; Gao, Y.; Leermakers, M.; Baeyens, W. Monthly variation of trace metals in North Sea sediments. From experimental data to modeling calculations. Mar. Pollut. Bull. 2014, 87, 237–246. [Google Scholar] [CrossRef]
  56. Research results and comprehensive assessment of the state of bottom sediments of rivers and lakes in 2016–2017. In Chief Inspectorate of Environmental Protection; Biblioteka Monitoringu Środowiska: Warsaw, Poland, 2017. Available online: https://www.gios.gov.pl/images/dokumenty/pms/monitoring_wod/Wyniki_badan_20180111.pdf (accessed on 6 June 2021).
  57. Lis, J.; Pasieczna, A. Geochemical Atlas of Łódź Agglomeration 1:100 000. Part I. Soils, Water Sediments, Surface Waters, 1st ed.; Państwowy Instytut Geologiczny: Warsaw, Poland, 1998. [Google Scholar]
  58. Kuśmierz, A.; Krawczyńska, B.; Krawczyński, J. Assessment of the Impact of Landfills Located on the Areas of the Former “Boruta” Plant in Zgierz on the Life and Health of the Inhabitants of Zgierz and the Surrounding area, and on the Environment; Institute of Environmental Protection—National Research Institute: Warsaw, Poland, 2019; p. 20. [Google Scholar]
  59. Han, X.Q.; Xiao, X.Y.; Guo, Z.H.; Xie, Y.H.; Liang, Y.Q. Release of cadmium in contaminated paddy soil amended with NPK fertilizer and lime under water management. Ecotoxicol. Environ. Saf. 2018, 159, 38–45. [Google Scholar] [CrossRef]
  60. Guidelines for Drinking-Water Quality: Fourth Edition Incorporating the First Addendum; World Health Organization: Geneva, Switzerland, 2017.
  61. Rehman, M.; Liu, L.; Wang, Q.; Saleem, M.H.; Bashir, S.; Ullah, S.; Peng, D. Copper environmental toxicology, recent advances, and future outlook: A review. Envrion. Sci. Pollut. Res. 2019, 26, 18003–18016. [Google Scholar] [CrossRef]
  62. Alves, R.I.S.; Sampaio, C.F.; Nadal, M.; Schuhmacher, M.; Domingo, J.L.; Segura-Muñoz, S.I. Metal concentrations in surfacewater and sediments from Pardo River, Brazil: Human health risks. Environ. Res. 2014, 133, 149–155. [Google Scholar] [CrossRef] [PubMed]
  63. Desaulty, A.M.; Petelet-Giraud, E. Zinc isotope composition as a tool for tracing sources and fate of metal contaminants in rivers. Sci. Total Environ. 2020, 728, 138599. [Google Scholar] [CrossRef] [PubMed]
  64. Saha, N.; Rahman, M.S.; Ahmed, M.B.; Zhou, J.L.; Ngo, H.H.; Guo, W. Industrial metal pollution in water and probabilistic assessment of human health risk. J. Environ. Manag. 2017, 185, 70–78. [Google Scholar] [CrossRef]
  65. Hou, D.; O’Connor, D.; Nathanail, P.; Tian, L.; Ma, Y. Integrated GIS and multivariate statistical analysis for regional scale assessment of heavy metal soil contamination: A critical review. Environ. Pollut. 2017, 231, 1188–1200. [Google Scholar] [CrossRef]
  66. Barhoumi, B.; Beldean-Galea, M.S.; Al-Rawabdeh, A.M.; Roba, C.; Martonos, I.M.; Bălc, R.; Kahlaoui, M.; Touil, S.; Tedetti, M.; Driss, M.R.; et al. Occurrence, distribution and ecological risk of trace metals and organic pollutants in surface sediments from a Southeastern European river (Someşu Mic River, Romania). Sci. Total Environ. 2019, 660, 660–676. [Google Scholar] [CrossRef]
  67. Siepak, M.; Sojka, M. Application of multivariate statistical approach to identify trace elements sources in surface waters: A case study of Kowalskie and Stare Miasto reservoirs, Poland. Environ. Monit. Assess. 2017, 189, 364. [Google Scholar] [CrossRef] [PubMed] [Green Version]
  68. Hong, Z.; Zhao, Q.; Chang, J.; Peng, L.; Wang, S.; Hong, Y.; Liu, G.; Ding, S. Evaluation of Water Quality and Heavy Metals in Wetlands along the Yellow River in Henan Province. Sustainability 2020, 12, 1300. [Google Scholar] [CrossRef] [Green Version]
  69. National Primary Drinking Water Regulations. United States Environmental Protection Agency. 2009. Available online: https://www.epa.gov/ground-water-and-drinking-water/national-primary-drinking-water-regulations (accessed on 21 April 2021).
  70. Minister of Health. Regulation of the Minister of Health of 7 December 2017 on the quality of water intended for human consumption. In Journal of Laws of 2017, Item 2294; Wydawnictwo Sejmowe: Warsaw, Poland, 2017. (In Polish) [Google Scholar]
  71. Minister of Marine Economy and Inland Navigation. Regulation of the Minister of Marine Economy and Inland Navigation of 29 August 2019 on the requirements to be met by surface waters used to supply the population with water intended for human consumption. In Journal of Laws of 2019, Item 1747; Wydawnictwo Sejmowe: Warsaw, Poland, 2019. (In Polish) [Google Scholar]
  72. Minister of Marine Economy and Inland Navigation. Regulation of the Minister of Marine Economy and Inland Navigation of 11 October 2019 on the classification of ecological status, ecological potential, chemical status and the method of classifying the status of surface water bodies as well as environmental quality standards for priority substances. In Journal of Laws of 2019, Item 2149; Wydawnictwo Sejmowe: Warsaw, Poland, 2019. (In Polish) [Google Scholar]
  73. Kouassi, N.L.B.; Yao, K.F.; Sangare, N.; Trokourey, A.; Metongo, B.S. The mobility of the trace metals copper, zinc, lead, cobalt, and nickel in tropical estuarine sediments, Ebrie Lagoon, Côte d’Ivoire. J. Soils Sediments 2019, 19, 929–944. [Google Scholar] [CrossRef] [Green Version]
  74. Fisher-Power, L.M.; Cheng, T.; Rastghalam, Z.S. Cu and Zn adsorption to a heterogeneous natural sediment: Influence of leached cations and natural organic matter. Chemosphere 2016, 144, 1973–1979. [Google Scholar] [CrossRef] [PubMed]
  75. Zhang, M.; Jin, L.; Xu, L.; Ding, T. Effect of temperature, salinity, and pH on the adsorption of lead by sediment of a tidal river in east China. In Proceedings of the International Conference on Biomedical Engineering and Biotechnology, Macau, China, 28–30 May 2012; Institute of Electrical and Electronics Engineers: Macau, China, 2012; pp. 1389–1391. [Google Scholar] [CrossRef]
  76. Warren, L.A.; Zimmerman, A.P. The influence of temperature and NaCl on cadmium, copper and zinc partitioning among suspended particulate and dissolved phases in an urban river. Wat. Res. 1994, 28, 1921–1931. [Google Scholar] [CrossRef]
  77. Milivojević, J.; Krstić, D.; Šmit, B.; Djekić, V. Assessment of Heavy Metal Contamination and Calculation of its Pollution Index for Uglješnica River, Serbia. Bull. Environ. Contam. Toxicol. 2016, 97, 737–742. [Google Scholar] [CrossRef] [PubMed]
  78. Zakhem, B.A. Heavy metal pollution index for groundwater quality assessment in Damascus Oasis, Syria. Environ. Earth Sci. 2014, 73, 6591–6600. [Google Scholar] [CrossRef]
  79. Brereton, R.G. Chemometrics: Data Driven Extraction for Science, 2nd ed.; Wiley: Hoboken, NJ, USA, 2018; pp. 176–178. [Google Scholar]
  80. Oka, G.A.; Thomas, L.; Lavkulich, L.M. Soil assessment for urban agriculture: A Vancouver case study. J. Soil Sci. Plant Nut. 2014, 14, 657–669. [Google Scholar] [CrossRef] [Green Version]
  81. Varol, M.; Şen, B. Assessment of nutrient and heavy metal contamination in surface water and sediments of the upper Tigris River, Turkey. Catena 2012, 92, 1–10. [Google Scholar] [CrossRef]
Figure 1. Location of the sampling sites and main towns within the study area (ZG—Zgierz; AL—Aleksandrów Łódzki; OZ—Ozorków; ŁĘ—Łęczyca; ŁO—Łowicz). The location of sampling sites was determined by handheld GPS (MobileMapper 50, Spectra Geospatial, Westminster, CO, USA). The map of the area was generated using ArcMap 9.2 (Esri, Redlands, CA, USA) software, basic geographic data was acquired from the Head Office of Land Surveying and Cartography [23].
Minerals 11 00861 g001
Figure 2. Median values of Ni concentrations in 2018 (a) and 2019 (b) for individual sampling sites, respectively.
Minerals 11 00861 g002
Figure 3. Variability of Ni concentrations in selected months.
Minerals 11 00861 g003
Figure 4. Median values of Zn concentrations in 2018 (a) and 2019 (b) for individual sampling sites, respectively.
Minerals 11 00861 g004
Figure 5. Dendrograms showing clustering of sampling sites in (a) February and (b) July (in 2019).
Minerals 11 00861 g005
Figure 6. Correlations between the variables and principal components in the projection of PC1 and PC2 for (a) 2018 and (b) 2019.
Minerals 11 00861 g006
Figure 7. Dendrograms showing clustering of sampling sites in (a) 2018 and (b) 2019.
Minerals 11 00861 g007
Table 1. Description of sampling sites.
Sampling SiteLatitudeLongitudeChainage [km + m]Characteristics
151°49′29″ N19°27′36″ E169 + 800Source area of the river; protection area
251°51′01″ N19°26′43″ E166 + 200Residential area; near the national road
351°51′06″ N19°24′07″ E162 + 100Urban area
451°50′53″ N19°21′55″ E159 + 400Below the wastewater treatment plant, waste landfill, and industrial park; suburban area
551°50′18″ N19°19′31″ E156 + 200Agriculture land
651°50′51″ N19°15′53″ E151 + 400Below the wastewater treatment plant; meadows and agricultural land
751°56′12″ N19°15′57″ E137 + 100Near the motorway; meadows and agricultural land
851°56′36″ N19°17′22″ E134 + 750Near the local, busy road; meadows, and agricultural land
951°58′02″ N19°17′01″ E131 + 300Urban area
1052°00′13″ N19°16′30″ E126 + 900Below the wastewater treatment plant; agricultural land
1152°03′44″ N19°13′03″ E116 + 700Near the provincial road; meadows, and wasteland
1252°07′45″ N19°26′29″ E99 + 150Agriculture land
1352°08′00″ N19°33′14″ E90 + 850Agriculture land
1452°07′13″ N19°48′36″ E70 + 750Agriculture land
1552°06′45″ N19°55′49″ E61 + 100Near the national road; warehouse and service areas
1652°06′39″ N19°56′50″ E59 + 900Urban area
1752°07′45″ N20°03′54″ E50 + 150Agriculture land
Table 2. Mean metal contents and geochemical background [mg/kg] in bottom sediments.
Geochemical Background [55]Site 1Site 4Site 11
Zn<7310.176539.4
Cu<724.411019.5
Cd<0.50.041.00.2
Ni<62.73.84.2
Pb<153.142.46.4
Mn10673.844.1
Fe270435352667
Table 3. Limits of metal concentrations according to the WHO, USEPA, and Polish Regulations.
MetalWHO [59]USEPA [68][69][70][71]
Cd [µg/L]3555 (A1, A2, A3)1.5
Pb [µg/L]10151050 (A1, A2, A3)14
Ni [µg/L]702050 (A1, A2)
200 (A3)
34
Cu [mg/L]21.320.05 (A1, A2)
0.5 (A3)
0.05
Zn [mg/L]53 (A1)
5 (A2, A3)
1
Mn [mg/L]0.10.050.05 (A1)
0.1 (A2, A3)
Fe [mg/L]0.30.3 (A1)
2 (A2, A3)
[69]—Regulation of the Minister of Health of 7 December 2017 on the quality of water intended for human consumption. [70]—Regulation of the Minister of Marine Economy and Inland Navigation of 29 August 2019 on the requirements to be met by surface waters used to supply the population with water intended for human consumption. [71]—Regulation of the Minister of Marine Economy and Inland Navigation of 11 October 2019 on the classification of ecological status, ecological potential, chemical status, and the method of classifying the status of surface water bodies as well as environmental quality standards for priority substances.
Table 4. Percentage of investigated samples in a specific water category (in total in 2018 and 2019).
MetalCat. 1Cat. 2,3>Cat. 3 1
Zn100
Fe54.745.3
Mn28.629.741.7 2
MetalCat. 1,2Cat. 3>Cat. 3 1
Ni94.74.70.6 3
Cu94.77.3
MetalCat. 1,2,3 >Cat. 3 1
Cd100
Pb99.4 0.6 4
1 not appropriate for portable purposes; 2 exceedance of the limit for category 3 (0.1 mg/L) applies to all locations except site 1; the percentage of samples with Mn content above 0.1 mg/L at sites 2–17 is 20–75%; 3 two samples at site 4; 4 one sample each at sites 7 and 17.
Table 5. Eigenvalues and coefficients of correlation between variables and components calculated for datasets obtained for February and July (in 2019).
FebruaryJuly
PC1PC2PC3PC1PC2PC3PC4
Eigenvalue6.02.41.14.02.32.01.4
temp.−0.230.870.11−0.66−0.51−0.350.01
TDS−0.670.620.03−0.63−0.710.190.14
pH0.53−0.090.780.36−0.11−0.520.69
DOC−0.710.56−0.09−0.88−0.23−0.21−0.30
Fe−0.93−0.190.21−0.380.24−0.730.31
Mn−0.67−0.030.60−0.180.33−0.86−0.21
Ni−0.900.29−0.17−0.79−0.440.140.11
Cu−0.66−0.62−0.22−0.570.740.02−0.15
Zn−0.93−0.080.05−0.890.370.14−0.01
Pb−0.77−0.58−0.01−0.340.230.310.81
Cd−0.87−0.210.10−0.510.630.380.13
Publisher’s Note: MDPI stays neutral with regard to jurisdictional claims in published maps and institutional affiliations.

