Article

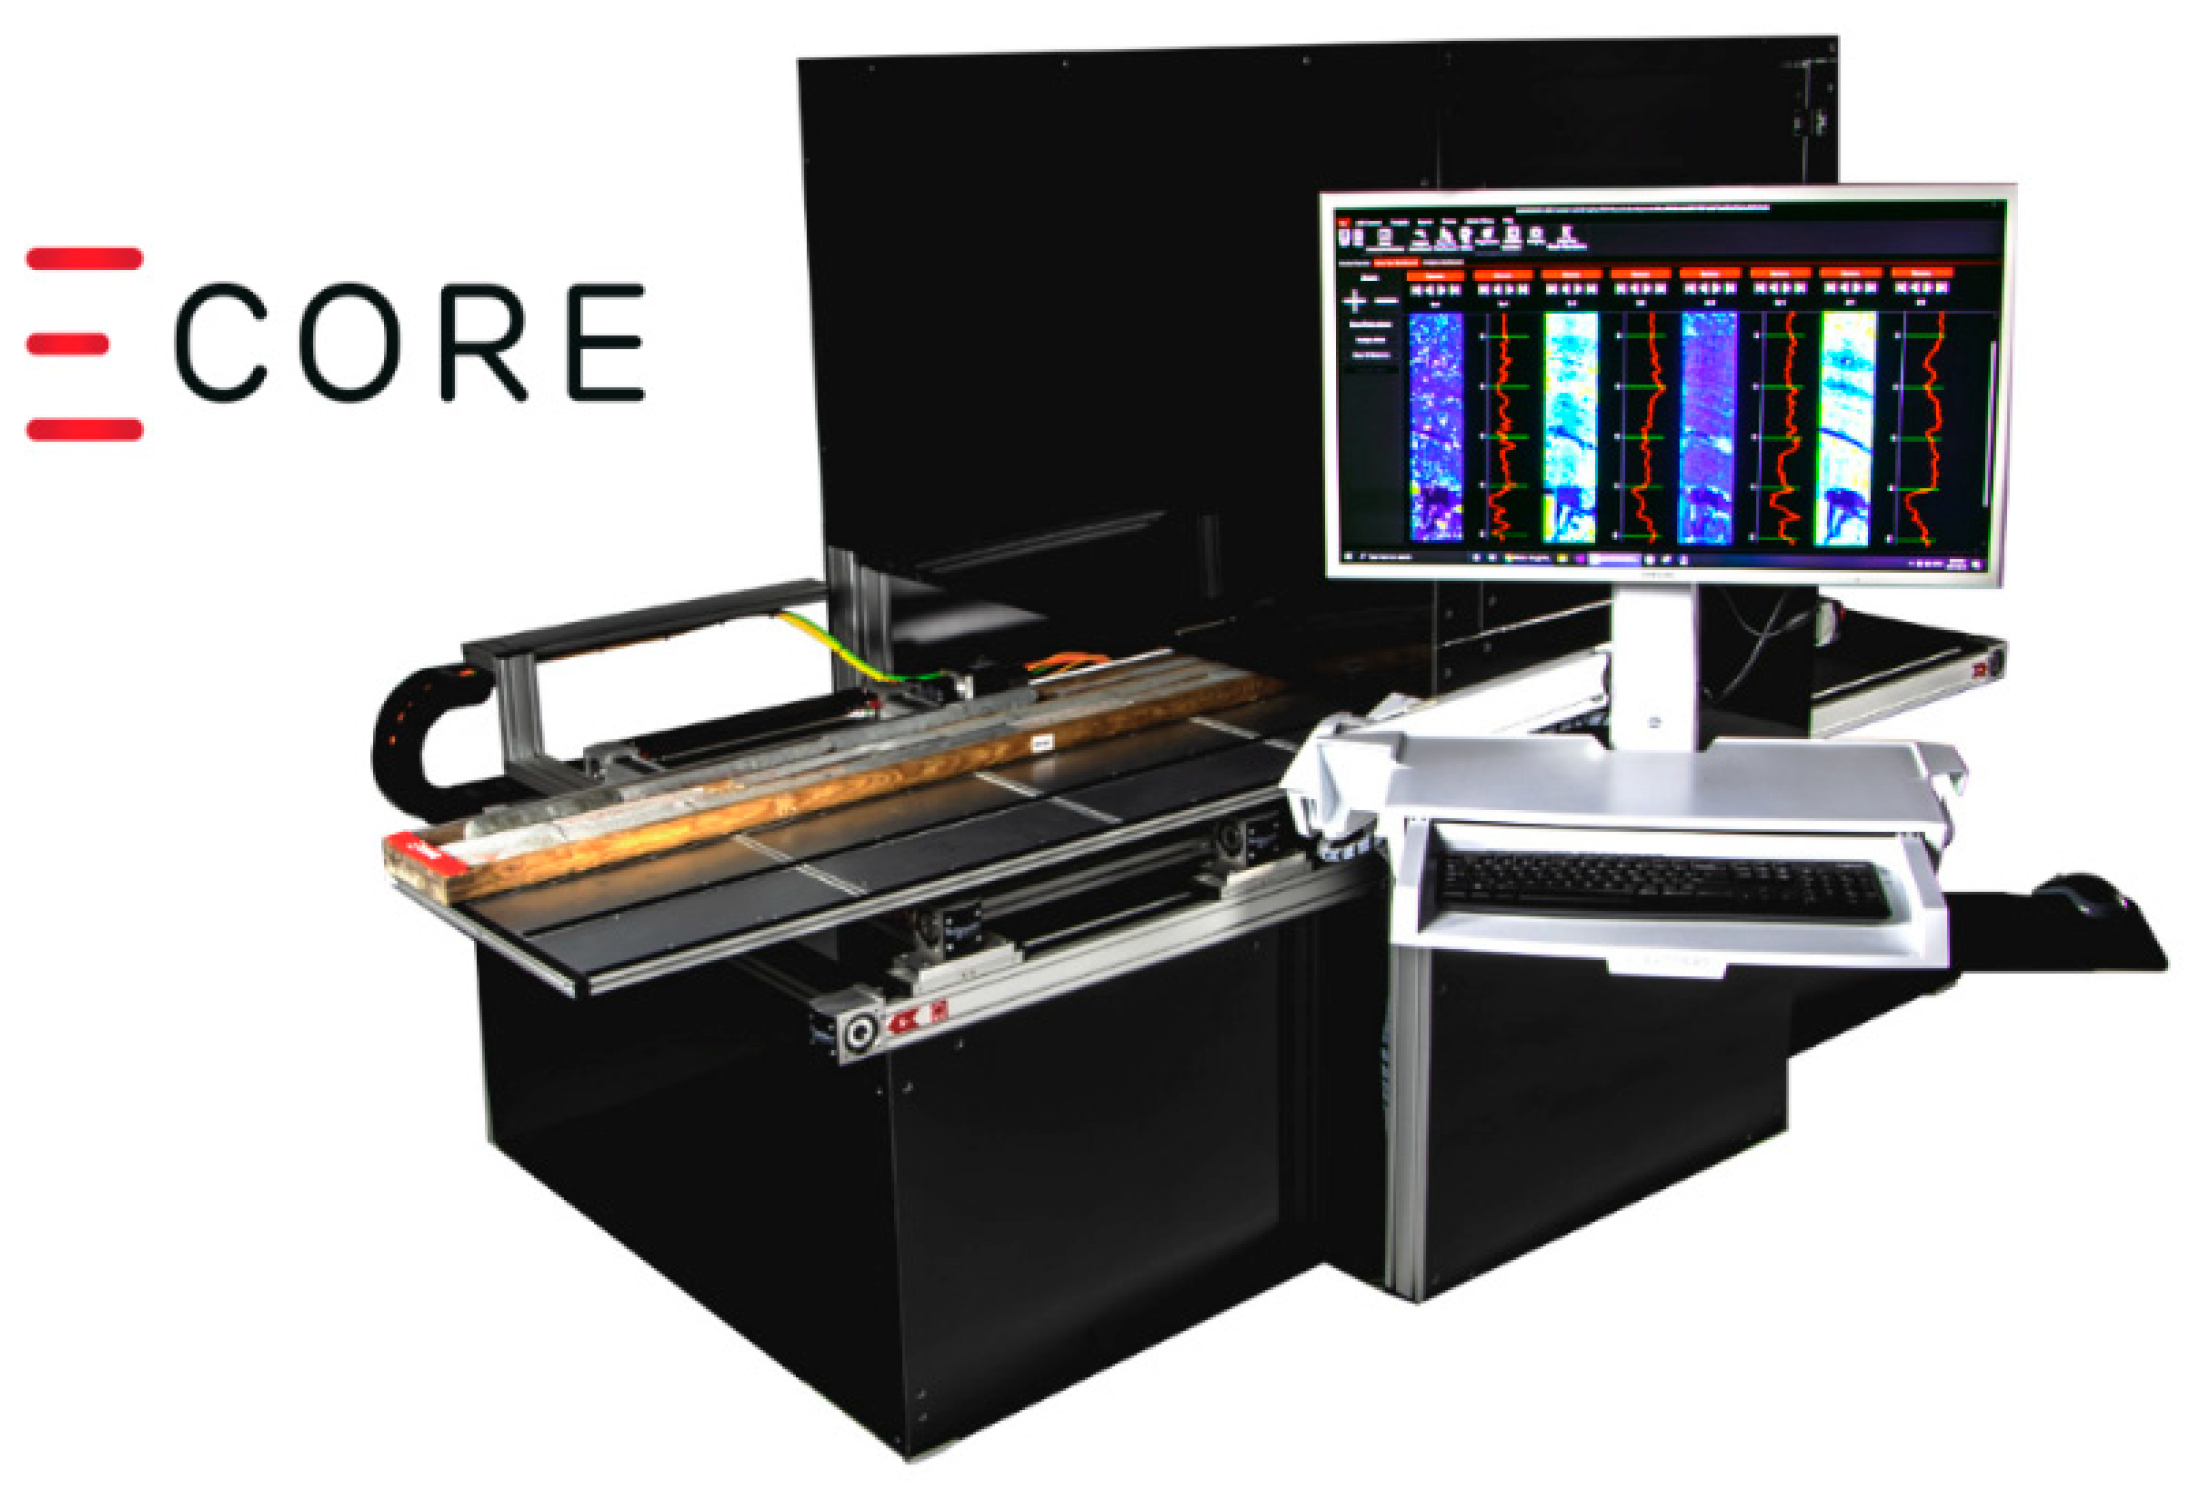
ECORE: A New Fast Automated Quantitative Mineral and Elemental Core Scanner

by
Marie-Chloé Michaud Paradis
1,
François R. Doucet
1,*,
Kheireddine Rifai
1,2,
Lütfü Ç. Özcan
1,
Nawfel Azami
3 and
François Vidal
2
1
ELEMISSION Inc., Montréal, QC H4R 1V6, Canada
2
Institut National de la Recherche Scientifique, Varennes, QC J3X 1S2, Canada
3
Optics Laboratory, INPT, Avenue Allal Al Fassi, Rabat, Morocco
*
Author to whom correspondence should be addressed.
Minerals 2021, 11(8), 859; https://doi.org/10.3390/min11080859
Submission received: 3 June 2021 / Revised: 23 July 2021 / Accepted: 7 August 2021 / Published: 10 August 2021
(This article belongs to the Section Mineral Exploration Methods and Applications)

Abstract

:
Scarce platinum group elements (PGE) are mainly concealed in massive sulfides, and finding economically viable ore bodies largely relies on their fast chemical mapping. Most core scanners provide incomplete mineralogical contents, but none also provide a complete chemical analysis including light elements. This study investigates the performance of a fully automated laser-induced breakdown spectroscopy (LIBS) core scanner, the ECORE, by comparing its reliability to a scanning electron microscope-energy dispersive spectroscopy (SEM-EDS) mineral mapper and its speed to infrared diffuse reflectance hyperspectral imagers (IR-HSI). The LIBS elemental imaging has been put to the test in our previous work, as well as the high-resolution mineralogical mapping. This paper reports the scaling up analytical applicability of LIBS as a high performance and high-speed drill core scanner. The analysis of a full core tray in this study is the first and largest 7.62 megapixels image done by a LIBS core scanner to our knowledge. Both high-resolution and low-resolution data are put together to express both mineralogical and chemical content as a function of depth.

1. Introduction

1.1. The Future of Scarce Elements Mining in Need of a New Type of Sensor

The scarcity and increasing consumption of rare elements in electronics, energy storage systems, and catalytic converters among others have put a strain on mining exploration methods of platinum group elements (PGE). Continental PGE sources are found to be about 10,000 times more concentrated in concealing massive sulfides than in native ores [1]. Many small ore bodies have been discovered as potential providers of PGE, but in many cases are not economically viable for refinement [2]. Therefore, future PGE supplies rely on recycling or on finding new large ore bodies. Because the chemical content of massive sulfides must be done using an elemental analyzer, geological exploration is in great need of a fast core scanner agreeing with the workflow process. The balance between the quality of the results and throughput must be optimized to find new sources of valuable elements.

1.2. Hyperspectral Imaging as a Solution to Better Mining Exploration Analyzers

The mineral liberation, texture, and grain information can be provided by the scanning and mapping of drill core samples. Initially marked and archived by the expert hand of geologists, a technique called hyperspectral imaging (HSI) has improved the exploration throughput. By definition, a hyperspectral imager assigns one detected spectrum to one analysis spot. The generated hypercube (i.e., XYλ) is thus further processed by selecting wavelengths of interest and encoding them into a RGB format (i.e., false color), where analysis spots are represented by pixels. Nowadays, the term HSI is often used to speak only of the infrared diffuse reflectance hyperspectral imaging (IR-HSI) technique due to infrareds sensing’s default remote applications, although many other spectroscopic techniques are HSI instruments (e.g., laser-induced breakdown spectroscopy (LIBS), Raman spectroscopy, laser ablation-induced coupled plasma-mass spectrometry (LA-ICP-MS), etc.) just as well. The IR-HSI technique in the context of mineral mapping is a point-scanning hyperspectral imaging technique [3]. The light source beam width is adjusted to a small diameter, and the diffuse reflectance spectrum is detected for each scanned area in order to provide very detailed maps. This technique is different from others such as line-scanning or area-scanning hyperspectral imaging used for example for remote sensing applications where light interactions of large areas are detected at once by a fixed camera detector [3]. In each case, a spectrum is assigned to a position in space, and a multi-dimensional hypercube is created [3]. This hypercube was used to define hyperspectral imaging even at the very beginning of remote sensing discussions when area, point, and line-scanning types had not yet been defined [4]. All three hyperspectral imaging techniques are described as such by many sources [3,5,6].

1.3. Fast and Robust Hyperspectral Imagers on the Market and Their Limitations

IR-HSI are the most common drill core scanners and provide a lot of texture information rapidly. Most IR-HSI such as CSIRO HySpex and SPECIM SisuROCK may proceed at linear scanning speeds reaching up to about 50 mm/s at low resolutions. Infrared detectors have become more affordable, and infrared range light sources are quite cheap. Unfortunately, no light source covers the whole infrared spectral range. Therefore, combined infrared sources and spectrometers may present a logistical challenge as many sources may be needed for extending the selectivity for minerals and gangue. For example, feldspar minerals absorb infrared photons in the longwave range (LWIR), while epidote minerals absorb in the short-wave infrared range (SWIR) [7]. If a signal from both mineral types is needed for the mineral analysis, then the two light sources must be combined into the instrumentation. Each source’s dwell time must be considered for each analysis and thus has a detrimental impact on the overall speed of the analysis. For example, SWIR dwell times of SPECIM cameras are reported to be about 2.5 ms (400 frame per second (fps)) [8] while LWIR SPECIM HS cameras dwell times are about 8 ms (120 fps) [9]. Additionally, absorbed photons in the infrared range correspond to molecular vibrations, thus alloys and metals reflect most infrareds (e.g., gold, electrum, Pd, Pt, etc.). It is possible to deduce the presence of native ore indirectly using the infrared reflectance signal, limiting the selectivity and accuracy of the results. IR-HSI has been proven efficient for example for the scanning of disseminated gold drill cores even though native ores are not directly detectable using infrareds [10,11]. Furthermore, metal oxides and sulfide minerals are not detected using infrared diffuse reflectance spectroscopy either [7], which is an issue for disseminated valuable elements (e.g., Pd, Pt, Au, Ag, Cu, etc.). Additionally, IR-HSI cannot render the true chemical composition of samples: only their mineral content is assessable from comparison with spectral databases. For example, platinum group elements (PGE)-bearing sulfides liberation analysis cannot be done directly using IR-HSI as concentration gradients vary at different locations. It is essential to put on the market a fast elemental and mineralogical analyzer with throughput comparable to IR-HSI methods.

1.4. A Technique of Interest for Providing the Elemental Content

To provide the chemical composition, scanning X-ray fluorescence (XRF) techniques are a solution often proposed in the literature and have been commercialized in the last decades. The throughput of XRF analyzers is an issue as the X-ray fluorescence technique itself is based on many time-dependent parameters such as exposure times ranging between 1–100 s [12]. The throughput can be improved by considerably lowering the resolution by increasing the beam width of the X-ray source. This technique has been put to the test by the Minalyze core scanner. The Minalyze method consists of irradiating the sample with an X-Ray beam collimated into a rectangular shape of 1 mm × 20 mm. The scanning is done at steps of typically 10 cm to reach the reported speed of 1 cm/s [13]. This technique is thus a line-scanning XRF technique and will be discussed in this paper as a scanning XRF (SXRF) technique because no imaging of any sort (line or point scanning) is generated by the instrument, and only the elemental content is reported. The main drawback of the SXRF analysis is its incapability to generate mineral mapping: the Minalyze system is thus a core logging system. Any XRF system is also unable to detect light elements having a weak Z-number (i.e., smaller than 13); Mg (Z = 12) and Na (Z = 11) can be detected, but dwell times are not practical for the application discussed in this manuscript. Furthermore, interferences are dependent on the exposure time, so detecting an effective range of elements with confidence requires significant and careful fine-tuning of the exposure time, which complicate accurate method development [13].

1.5. Combining Multiple Techniques: A Solution?

A solution to these inevitable drawbacks can be solved by combining multiple sensor systems. For example, Geotek systems are modulated according to the project needs. IR-HSI sensors can be combined with portable XRFs, P-wave velocity’s, magnetic susceptibility, and so on. Another system is the SXRF paired to laser-induced breakdown spectroscopy (LIBS) in Avaatech drill core scanners. In this system, the Spectral Industry LIBS analyzer is used at low acquisition rate (20 measurements per second) to provide chemical assays for light elements [14]. It is of general concern in the literature that the potential of the LIBS technique is genuine as an all-elements analyzer, but manufacturers should improve their systems towards the kHz [15].

1.6. Recent Progresses in LIBS

Many published works have demonstrated the capability of LIBS hyperspectral imaging (LIBS-HSI) processed by machine learning algorithms to generate the mineral mapping. The dwell time typically ranges from 0.01 to 1 s [16,17]. Although all the obtained results were in an acceptable agreement with the accepted methods, the resulting scanning speed (i.e., 1 to 100 Hz) is an issue for all these studies especially when it comes to scanning thousands of drill core meters. The need for a kHz LIBS-HIS drill core scanner is thus reported as crucial.

1.7. A LIBS Analyzer Providing a Supervised Mineral Content

In a previous work, we demonstrated the generation of mineral maps using the CORIOSITY LIBS-HSI analyzer at a spatial resolution of 50 µm and a scanning speed of 1 kHz [18]. In that study, three small disks were cut from PGE-bearing drill cores (Stillwater mine, Nye, MT, USA) and then analyzed first using a scanning electron microscope-energy dispersive spectroscopy (SEM-EDS) TIMA-X analyzer and second using the CORIOSITY. The CORIOSITY mineral map was established from the supervising TIMA-X map [19]. More recently, the mineral library established using the three disks mentioned above was applied to determine the mineral mapping on two PGE-bearing rocks (Lac des Iles mine, Thunder Bay, ON, Canada) [20]. The results were validated using a micro-XRF technique, and similar results were achieved in both cases [20].

1.8. A LIBS Core Scanner Reaching the kHz

The undergoing study is the continuation of our previously published works [19]. The SEM-EDS supervised calibration method described earlier was put to the test to produce a full mineral map of a full core tray from the Stillwater Mine, Billings, MT, USA. This manuscript reports for the first time the reliability of a new fully automated 1 kHz commercial LIBS system for all tray sizes for which the spectral range has been filled and increased to the full 220–990 nm range since our last published work [19]. The new ECORE can scan a drill core tray (i.e., about 4 m) in less than 5 min, generate the mineral and chemical maps at representative resolutions, provide high-resolution optical photographs and provide the rock quality designation as well as physical properties of the full tray. The main novelty introduced in this paper is the high throughput of ECORE that can be tuned for imaging the texture, grain size and mineral liberation analysis, or for core logging applications. Moreover, the optical configuration has been greatly improved to cover the complete emission spectra from 220 nm up to 990 nm to include the emission line of sodium (low concentration) at 589 nm as well as for the detection of sulfur at 921 nm. The absence of this spectral information was prohibiting the discrimination of minor mineral phase of zoisite (Ca2Al3(SiO4)3(OH)) from the major mineral phase of bytownite ((Ca,Na)(Si,Al)4O8). In addition, the incorporation of sulfur signal improves the selectivity for discrimination of massive sulfide from oxide. For example, the LIBS megapixel scan reported in the actual manuscript would have taken 88 days (one fourth of a year) using the system reported by Khun el al. [16], instead of 2 h scanning with ECORE. To the best of our knowledge, ECORE is a new and innovative high-level benchmark for manufacturing LIBS-based drill core scanning instruments.

2. Method

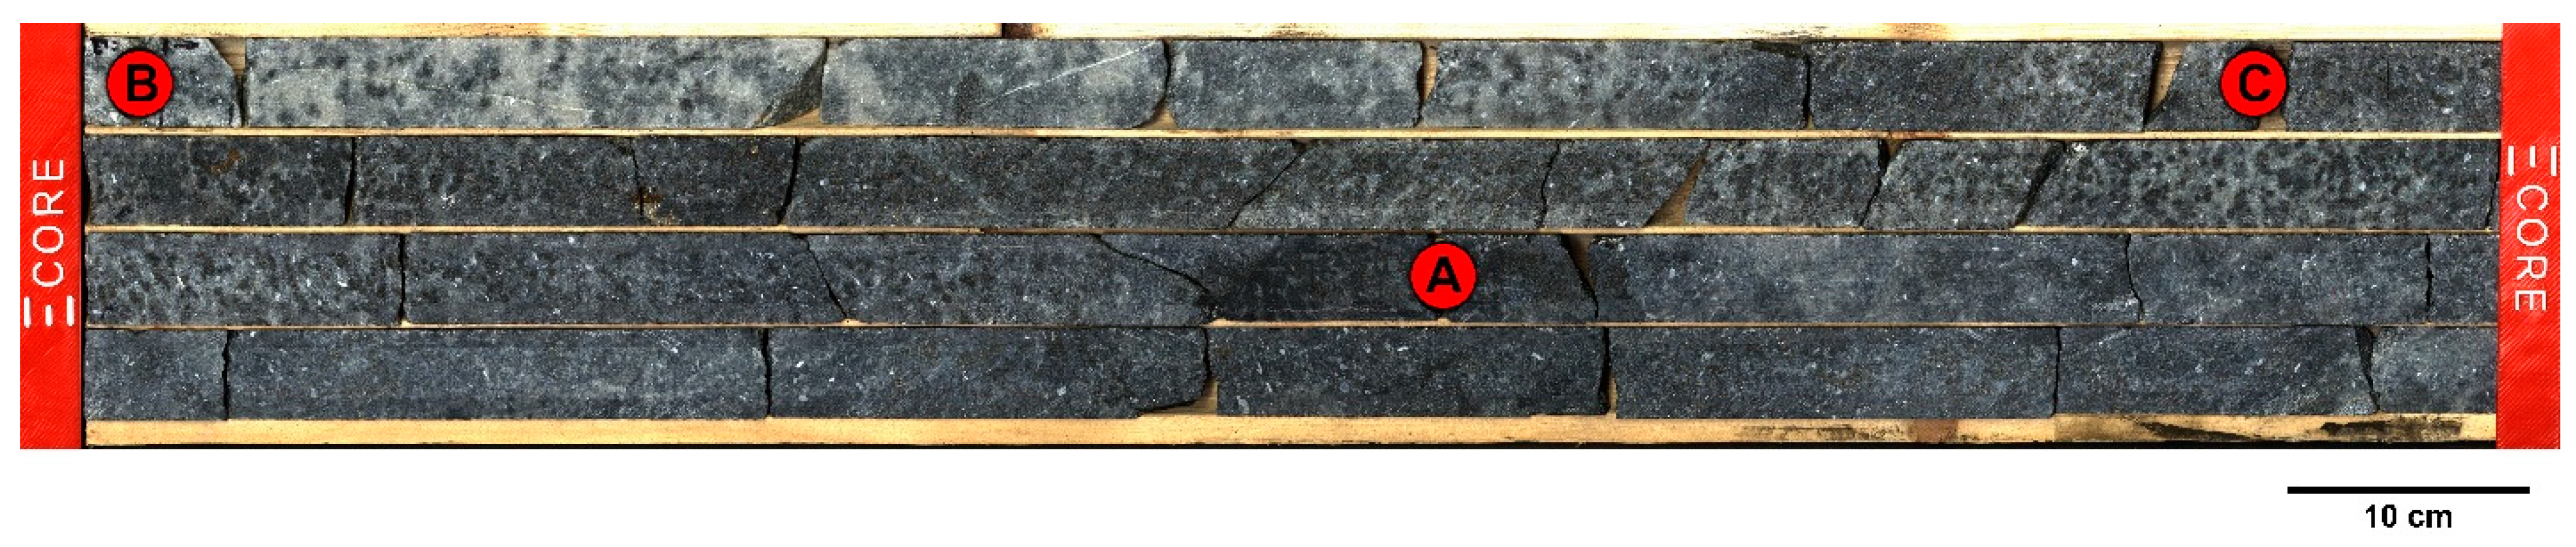
2.1. Drill Core Samples and Sample Preparation

Drill cores from the Stillwater Mine, Billings, MT, USA were placed in a standard North-American tray for BQ-core size (i.e., 40.7 mm diameter core). Three samples were drilled out, cut out, polished and carbon-coated, and analyzed using a SEM-EDS TESCAN Integrated Mineral Analyzer (TIMA-X). The location of the core samples is illustrated in the high-resolution picture of Figure 1. Sample preparation for the TIMA-X and LIBS analyses of the three samples is described in our previous work [19].

2.2. LIBS Technical Overview

In this study, all the LIBS experiments were performed using the LIBS ECORE drill core analyzer manufactured by ELEMISSION Inc. (Montréal, QC, Canada) as shown in Figure 2. The ECORE analyzer is a fully automated commercial drill core scanner instrument that integrates electronics, the laser source, the spectrometer, the 2-axis drill core translation table, and the ablation chamber in a configuration. This system is also equipped with a 3D laser profiling system to ensure the sample is positioned at the focal plane (minimum spot size) within a range less than 30 µm ensuring an optimal positioning of the 6 mm Rayleigh zone (depth-of-field). In addition, a high-resolution optical camera and high-intensity LEDs give the end-user a fast and high-fidelity picture of the full core tray to be added to the LIBS-generated images.
The laser-induced plasma emission is collected by standard achromatic lenses to warrant a minimum chromatic shift over the entire spectrum. The sensitivity on a wide bandwidth is consequently enhanced. The optical signal is then spectrally resolved using an optical spectrometer that covers 220 to 990 nm. The spectrometer is equipped with a CMOS detector which is controlled by proprietary ultrafast electronics. The unique custom electronics allow a camera readout of 1000 full frames per second. The ECORE analyzer can process trays of all sizes up to 1.5 m long and 0.4 m wide. The end-user has to load/unload the drill core tray log starting and ending depth, all the remaining is automated using the ECORE’s control software (ELEMISSION Inc., Montréal, QC, Canada). The ECORE has a unique ultrafast way to process the data and generates results in less than 5 min after the core box scanning is completed. Thereafter, the multi-elemental assays, the quantitative automated mineralogy, the rock density, the rock hardness, the rock quality designation (RQD), the high-resolution RGB image, and more are available for transfer into geological modeling software (e.g., Leapfrog, Datamines, etc.).

2.3. LIBS Procedure

The LIBS analysis was performed over a 2 cm width along the PGE-bearing tray containing BQ cores, which correspond to approximately 55% of the diameter of the core.

2.4. TIMA-X Procedure

The TIMA-X procedure and parameters are provided in a previous study [19].

2.5. Drill Core Samples and Supervised Method

The generated LIBS hyperspectral data are processed in real-time, which leads to automated mineralogical maps based on the LIBS mineral library built from TIMA-X data. At the beginning of a scanning process, the end-user selects the different output data generated by the software as a function of the drill-hole depth (e.g., desired elemental assays (%w/w), list of minerals, etc.). The identification of single mineral phases was made based on the supervised methods described in our previous work [19].

3. Discussion

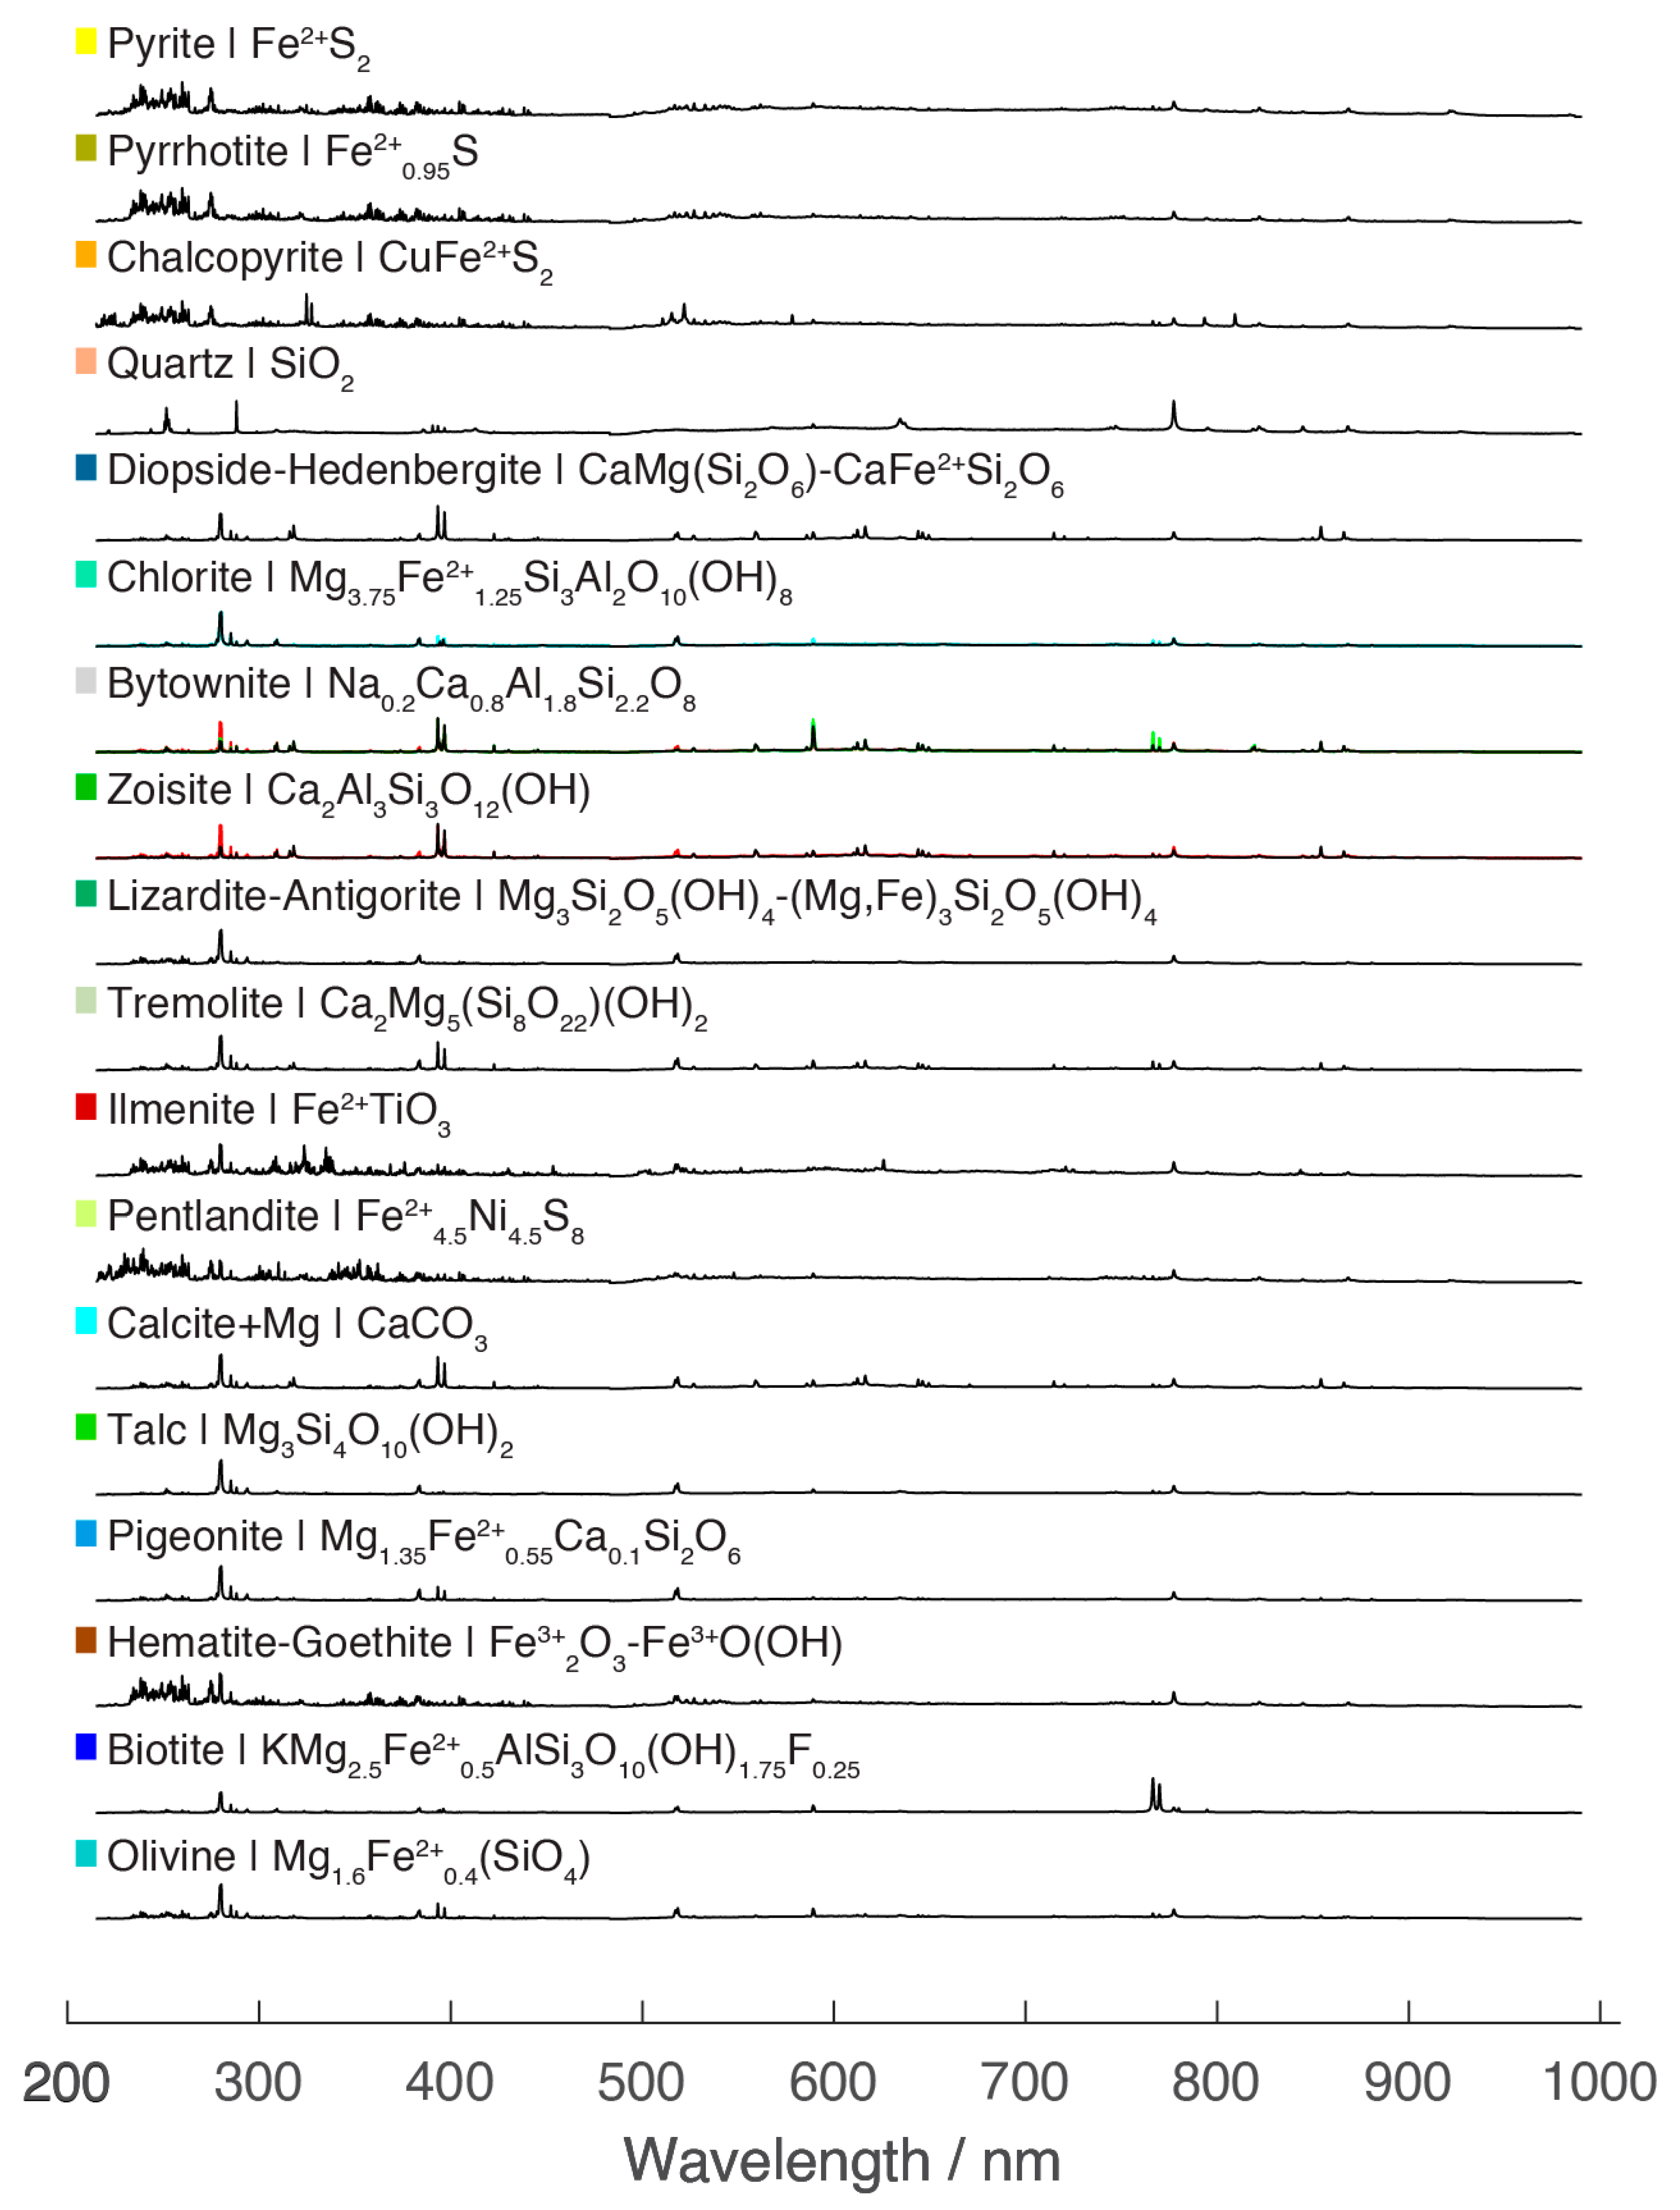
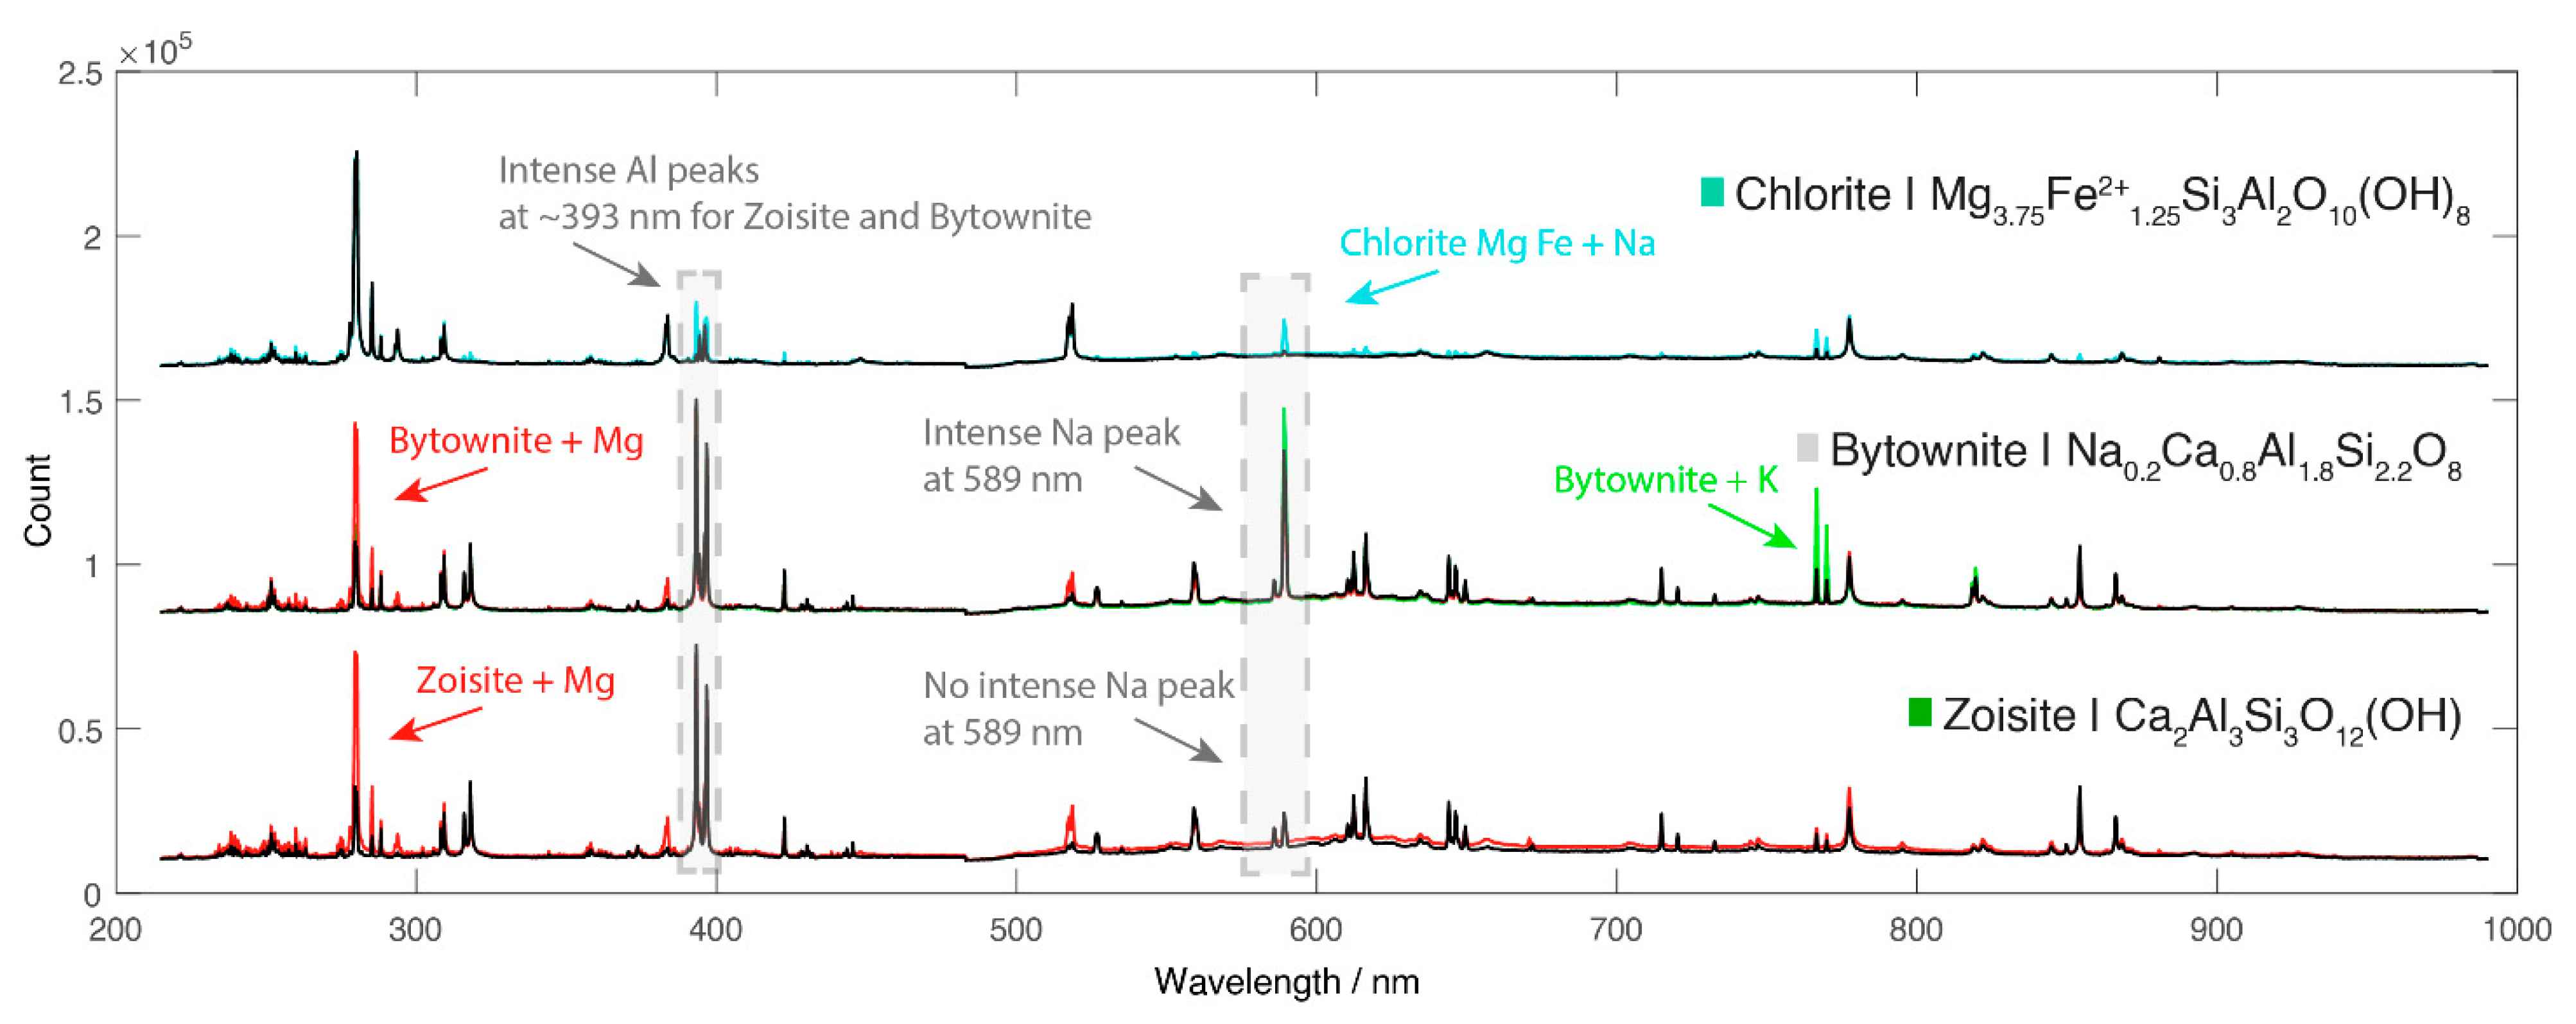
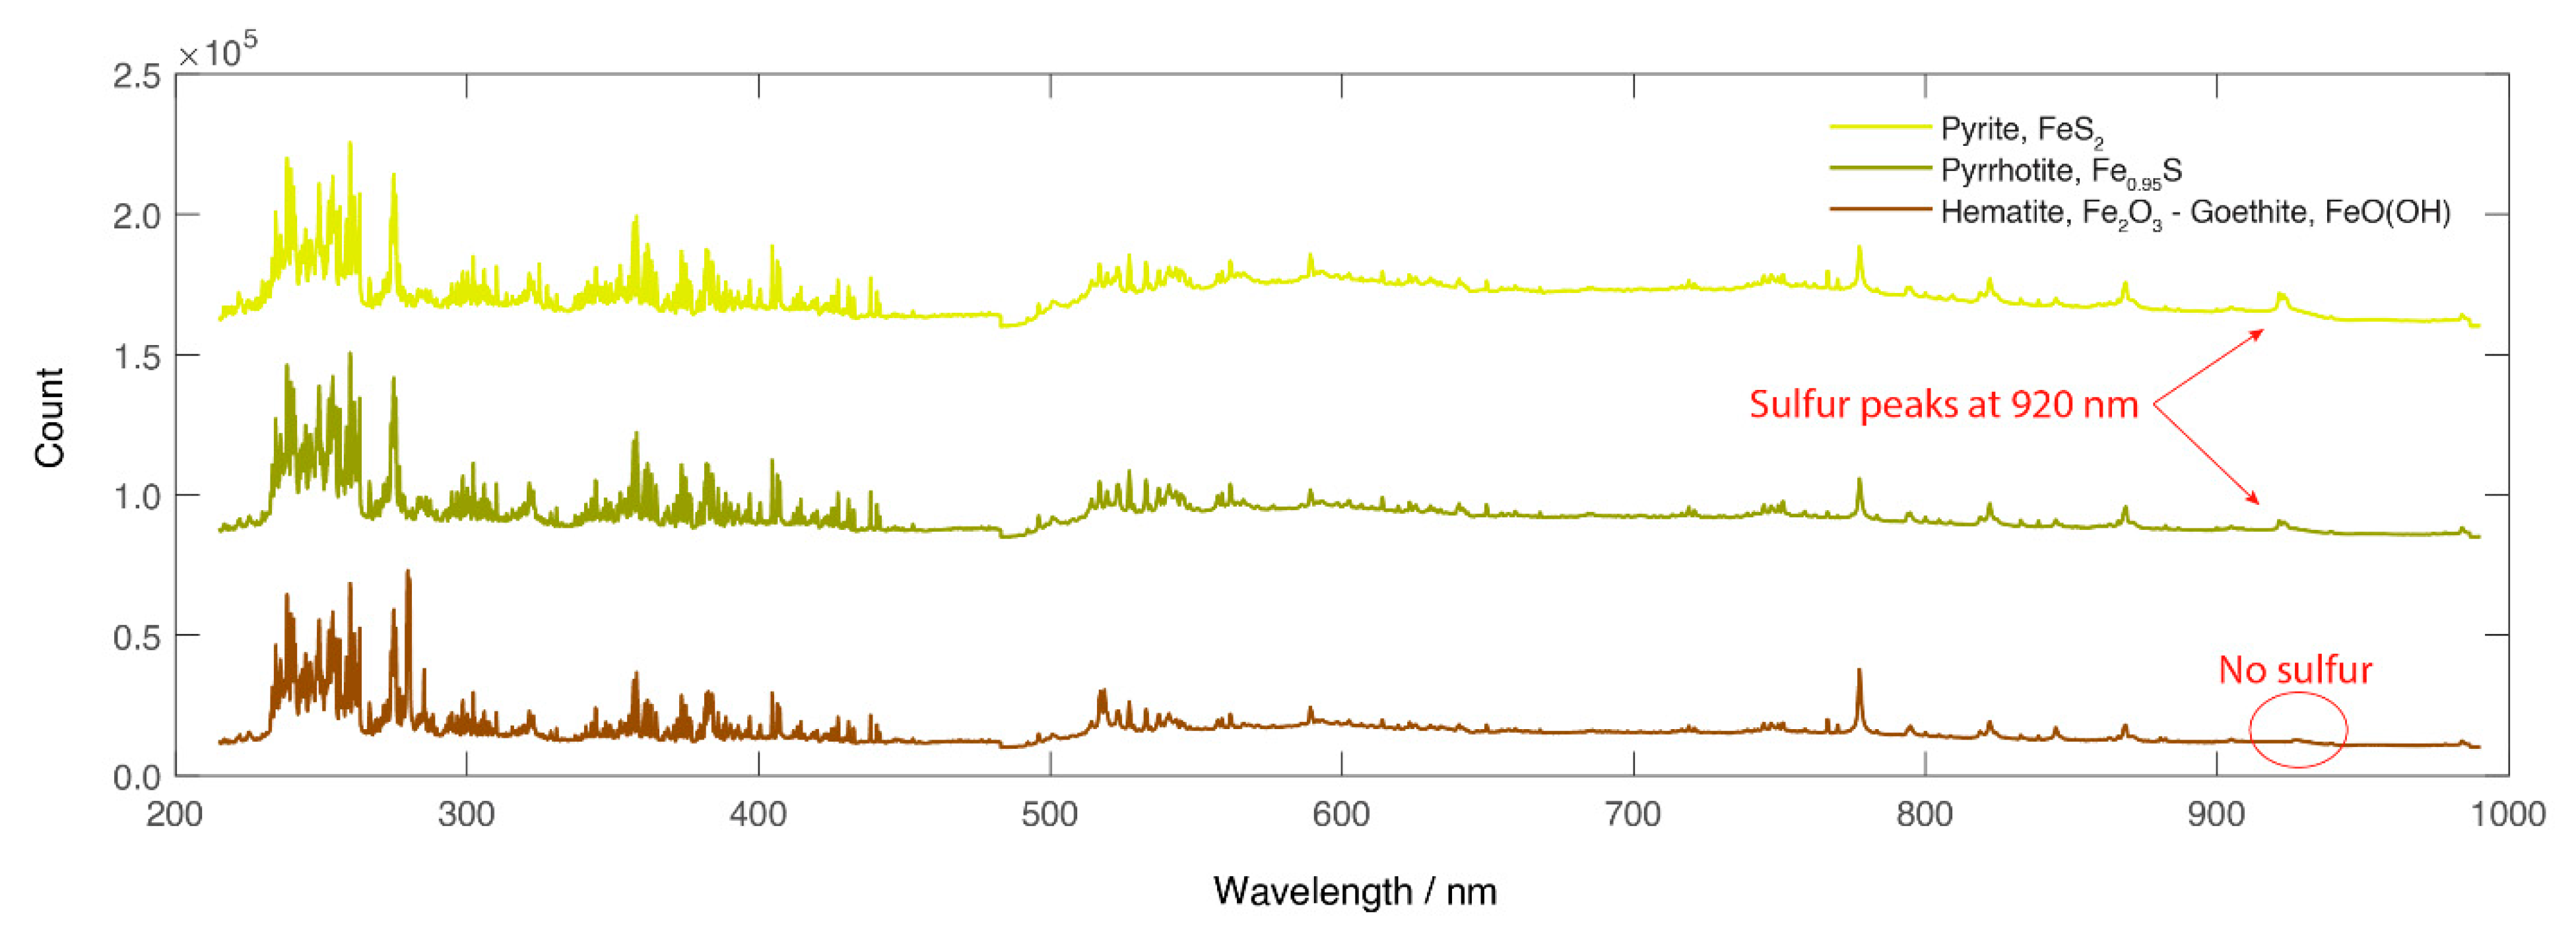
3.1. Mineral Classes and Their Spectra

The assignation process of single-mineral spectra (or classes) is the same as described in our previous work [19]. According to the elemental content and the TIMA-X image, LIBS spectra of three core samples were assigned to mineral classes. Since the assignation is based on a previously published visual comparison of the TIMA-X map and LIBS-generated images, the comparison of TIMA-X and LIBS assigned spectra and both techniques’ detection limitations are not discussed in this manuscript. Furthermore, LIBS spectra are more complex and very different than energy dispersive X-ray spectroscopy spectra, so the comparison would spark a discussion that is not the focus of this study. The mean LIBS spectra for each TIMA-X class are plotted in Figure 3. All TIMA-X classes were assigned to a LIBS spectrum except for the magnesiohornblende mineralogy. Very few magnesiohornblende grains were found using the TIMA-X analyzer, and because the samples contain a lot of mineralogies containing Al, Si, and Ca elements, no “pure” spectrum could be assigned with certainty for this mineralogy. All spectra were compared to the TIMA-X assignation on a first observation basis and then thoroughly validated with the LIBS elemental content based on the chemical composition definition of the mineral. This procedure has been detailed in our previous work [19]. The core samples have been ablated a few times since the TIMA-X analysis. Although the volume of ablated matter using ELEMISSION LIBS technology is very small (i.e., <15 μm depth × 50 μm diameter), the different layers’ images can change a little. It happened for the finely disseminate ilmenite mineralogy, the assignation was thus based only on the Ti content of ilmenite. In our previous work [19], the biotite content had not been assigned as it is contained only in the Core A sample. In Figure 3, the two K peaks at 766 and 770 nm are clearly noticeable, which contributed to its assignation. The Mg ionic emission signal at 279 nm and other elements are very strong using LIBS technology. Therefore, mineralogies having only iron oxides, such as hematite, or iron oxides-hydroxides such as goethite, have complex spectra before 400 nm, while the olivine and pigeonite mineralogies have a seemingly lower iron signal when plotted on a similar scale. All these subtleties have been considered while building this mineral library using ECORE software.
None of the individual single mineral classes are pure (trace impurities can crystalized/been trapped in crystallographic mesh), as can be seen for the calcite class. Its assignation is based on a Ca-rich vein in the Core A sample, but the assigned class also contains Mg. Since this mineralogy is a minor constituent of the core tray, its impurity had a low importance, but for building a bigger database, the spectra of pure calcite would have to be assigned based on a higher content sample.
Since our previous work [19], the gap in the spectral range has been filled to collect a sodium signal at 589 nm, allowing the differentiation between the bytownite and zoisite mineralogies, as can be seen in Figure 4. Na elemental content has thus played an important role in the class assignation for the ECORE instrument. Because these mineralogies are major components, different subclasses have been assigned, such as bytownite + K, bytownite + Mg, and zoisite + Mg. On the higher resolution TIMA-X image, other mineralogies are finely disseminated in these classes, so these mineralogies were assigned to improve the quality of the mineralogical map. These attributions were made based on the fact that all these subclasses have an Al signal at ~393 nm that is very intense. The use of a multiclass classifier could be used in the future to solve these mixed mineral issues, but since core scanning applications require the acquisition and analysis of massive data, the rapidity of the algorithm is key. Therefore, the raw data can always be reprocessed on request to solve specific mixed mineral issues, if required by the end-user.
The core sample A contained a lot of chlorite Mg Fe alterations and made possible the assignation of a chlorite Mg Fe spectrum plus a Ca-rich chlorite Mg Fe spectrum (in cyan in Figure 4). Because the Al signal is a bit higher for the cyan spectrum, some bytownite could be contained at the spot analysis, but on the TIMA-X image, the zone was assigned to chlorite Fe Mg.
Another improvement to instrumentation from our previous work is the wider spectral range up to 990 nm. This improvement made possible the acquisition of the sulfur signal at 921 nm as can be seen in Figure 5. Fe-bearing sulfides such as pyrite and pyrrhotite, for example, were hard to distinguish from Fe oxides-hydroxides such as hematite-goethite in our previous work [19], but it is no longer the case.

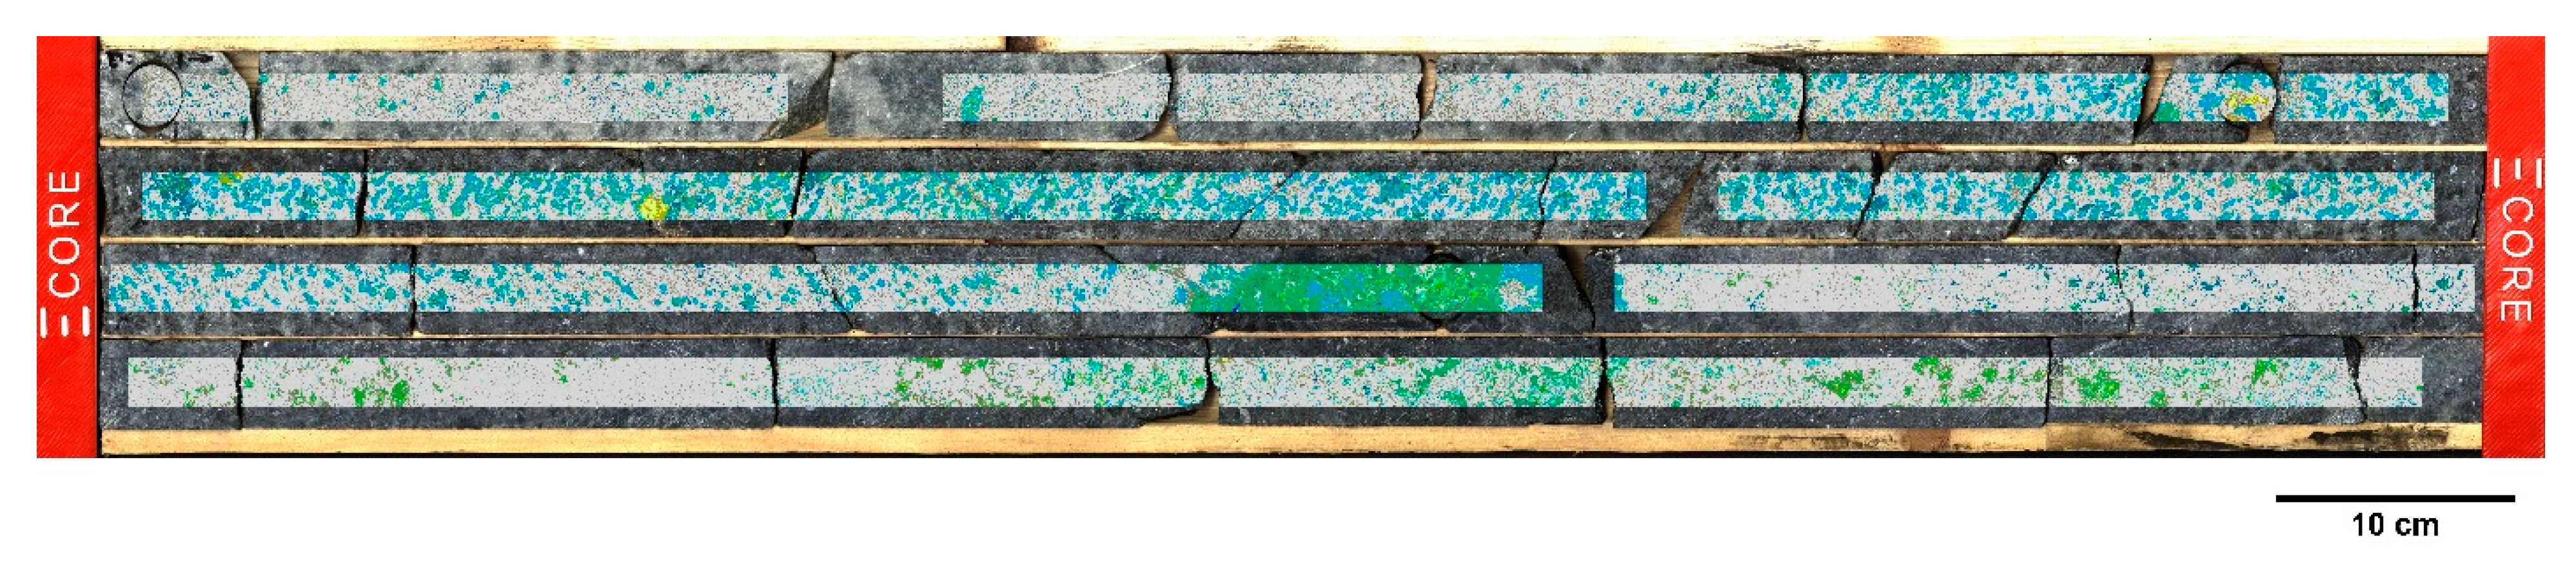
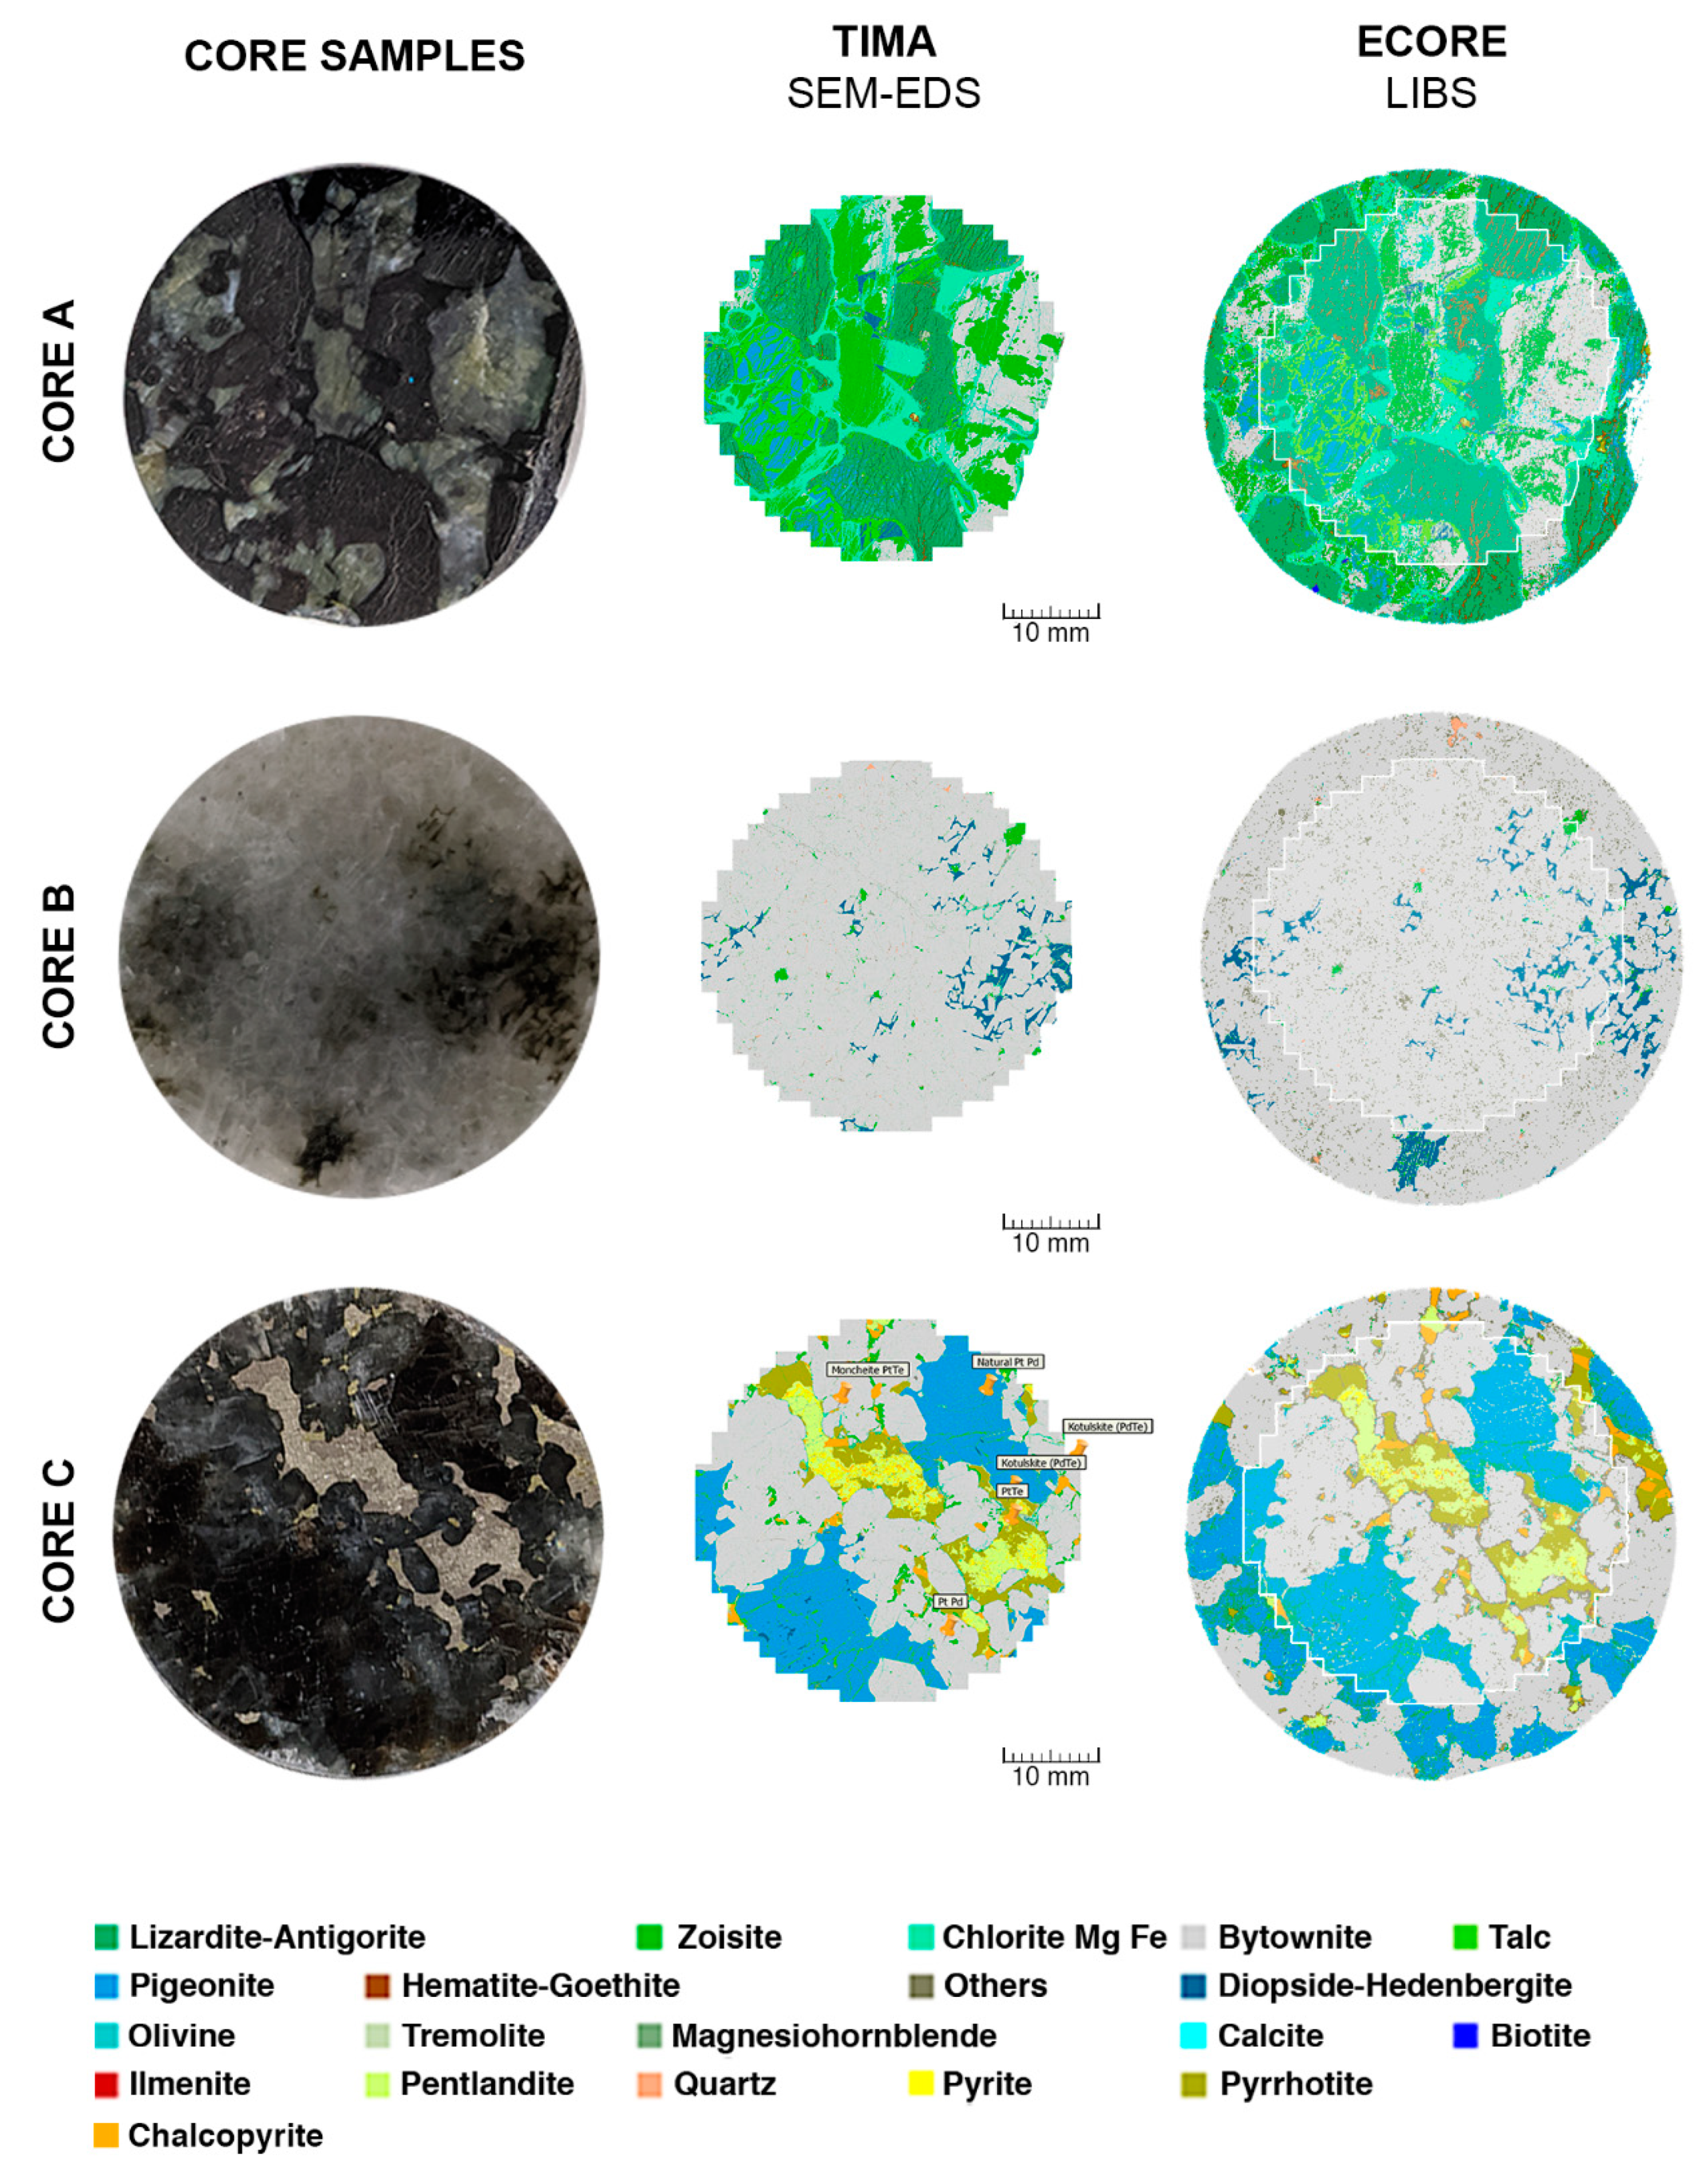
3.2. Newly Generated Maps of the Core Samples

After the class assignation, detailed images of the Core samples A, B, and C at a 50 μm resolution were added to Figure 6. Results for Core C are in concordance with our previous work [19]. All three images are consistent with the TIMA-X images. The mineral contents are provided in Table S1 in Supplementary Materials. In Core A, zoisite regions contain more pixels assigned to bytownite than the TIMA-X image, especially when bordered by chlorite alterations. The spectra of these pixels are bearing a high Na signal. Whether these pixels are bearing mixed mineralogies, or whether the surface has changed after the few ablated layers since our previous work, the algorithm is confused by this strong Na signal. Again, a multiclass classifier might resolve wrong assignations for mixed mineral pixels. Hematite–goethite is finely disseminated in lizardite–antigorite as well, so on the LIBS image, these veins look also bigger than on the TIMA image obviously because of the spatial resolution difference. The Core B zoisite is in great concordance with the TIMA-X image, as well as for diopside-hedenbergite and quartz. In the bytownite on the TIMA-X image, a lot of mineralogies are very finely disseminated. This explains why many pixels on the LIBS image are not assigned. In practice, this is not an issue since these minerals are tagged as gangue. Finally, the core sample C image shows clear differences from the TIMA-X image due to the fact that a few layers have been ablated since the TIMA-X analysis. For instance, a large cluster of pyrrhotite is now visible above a chalcopyrite one a bit above the middle of the core sample. Keeping that in mind, the zoisite parts in this core sample are not as well defined as they are for the other core samples. Looking at spectra again in these regions, pixels that should be attributed to zoisite bear a lot of sodium. Therefore, because zoisite is a minor constituent in this core sample, the assignation was left as is.

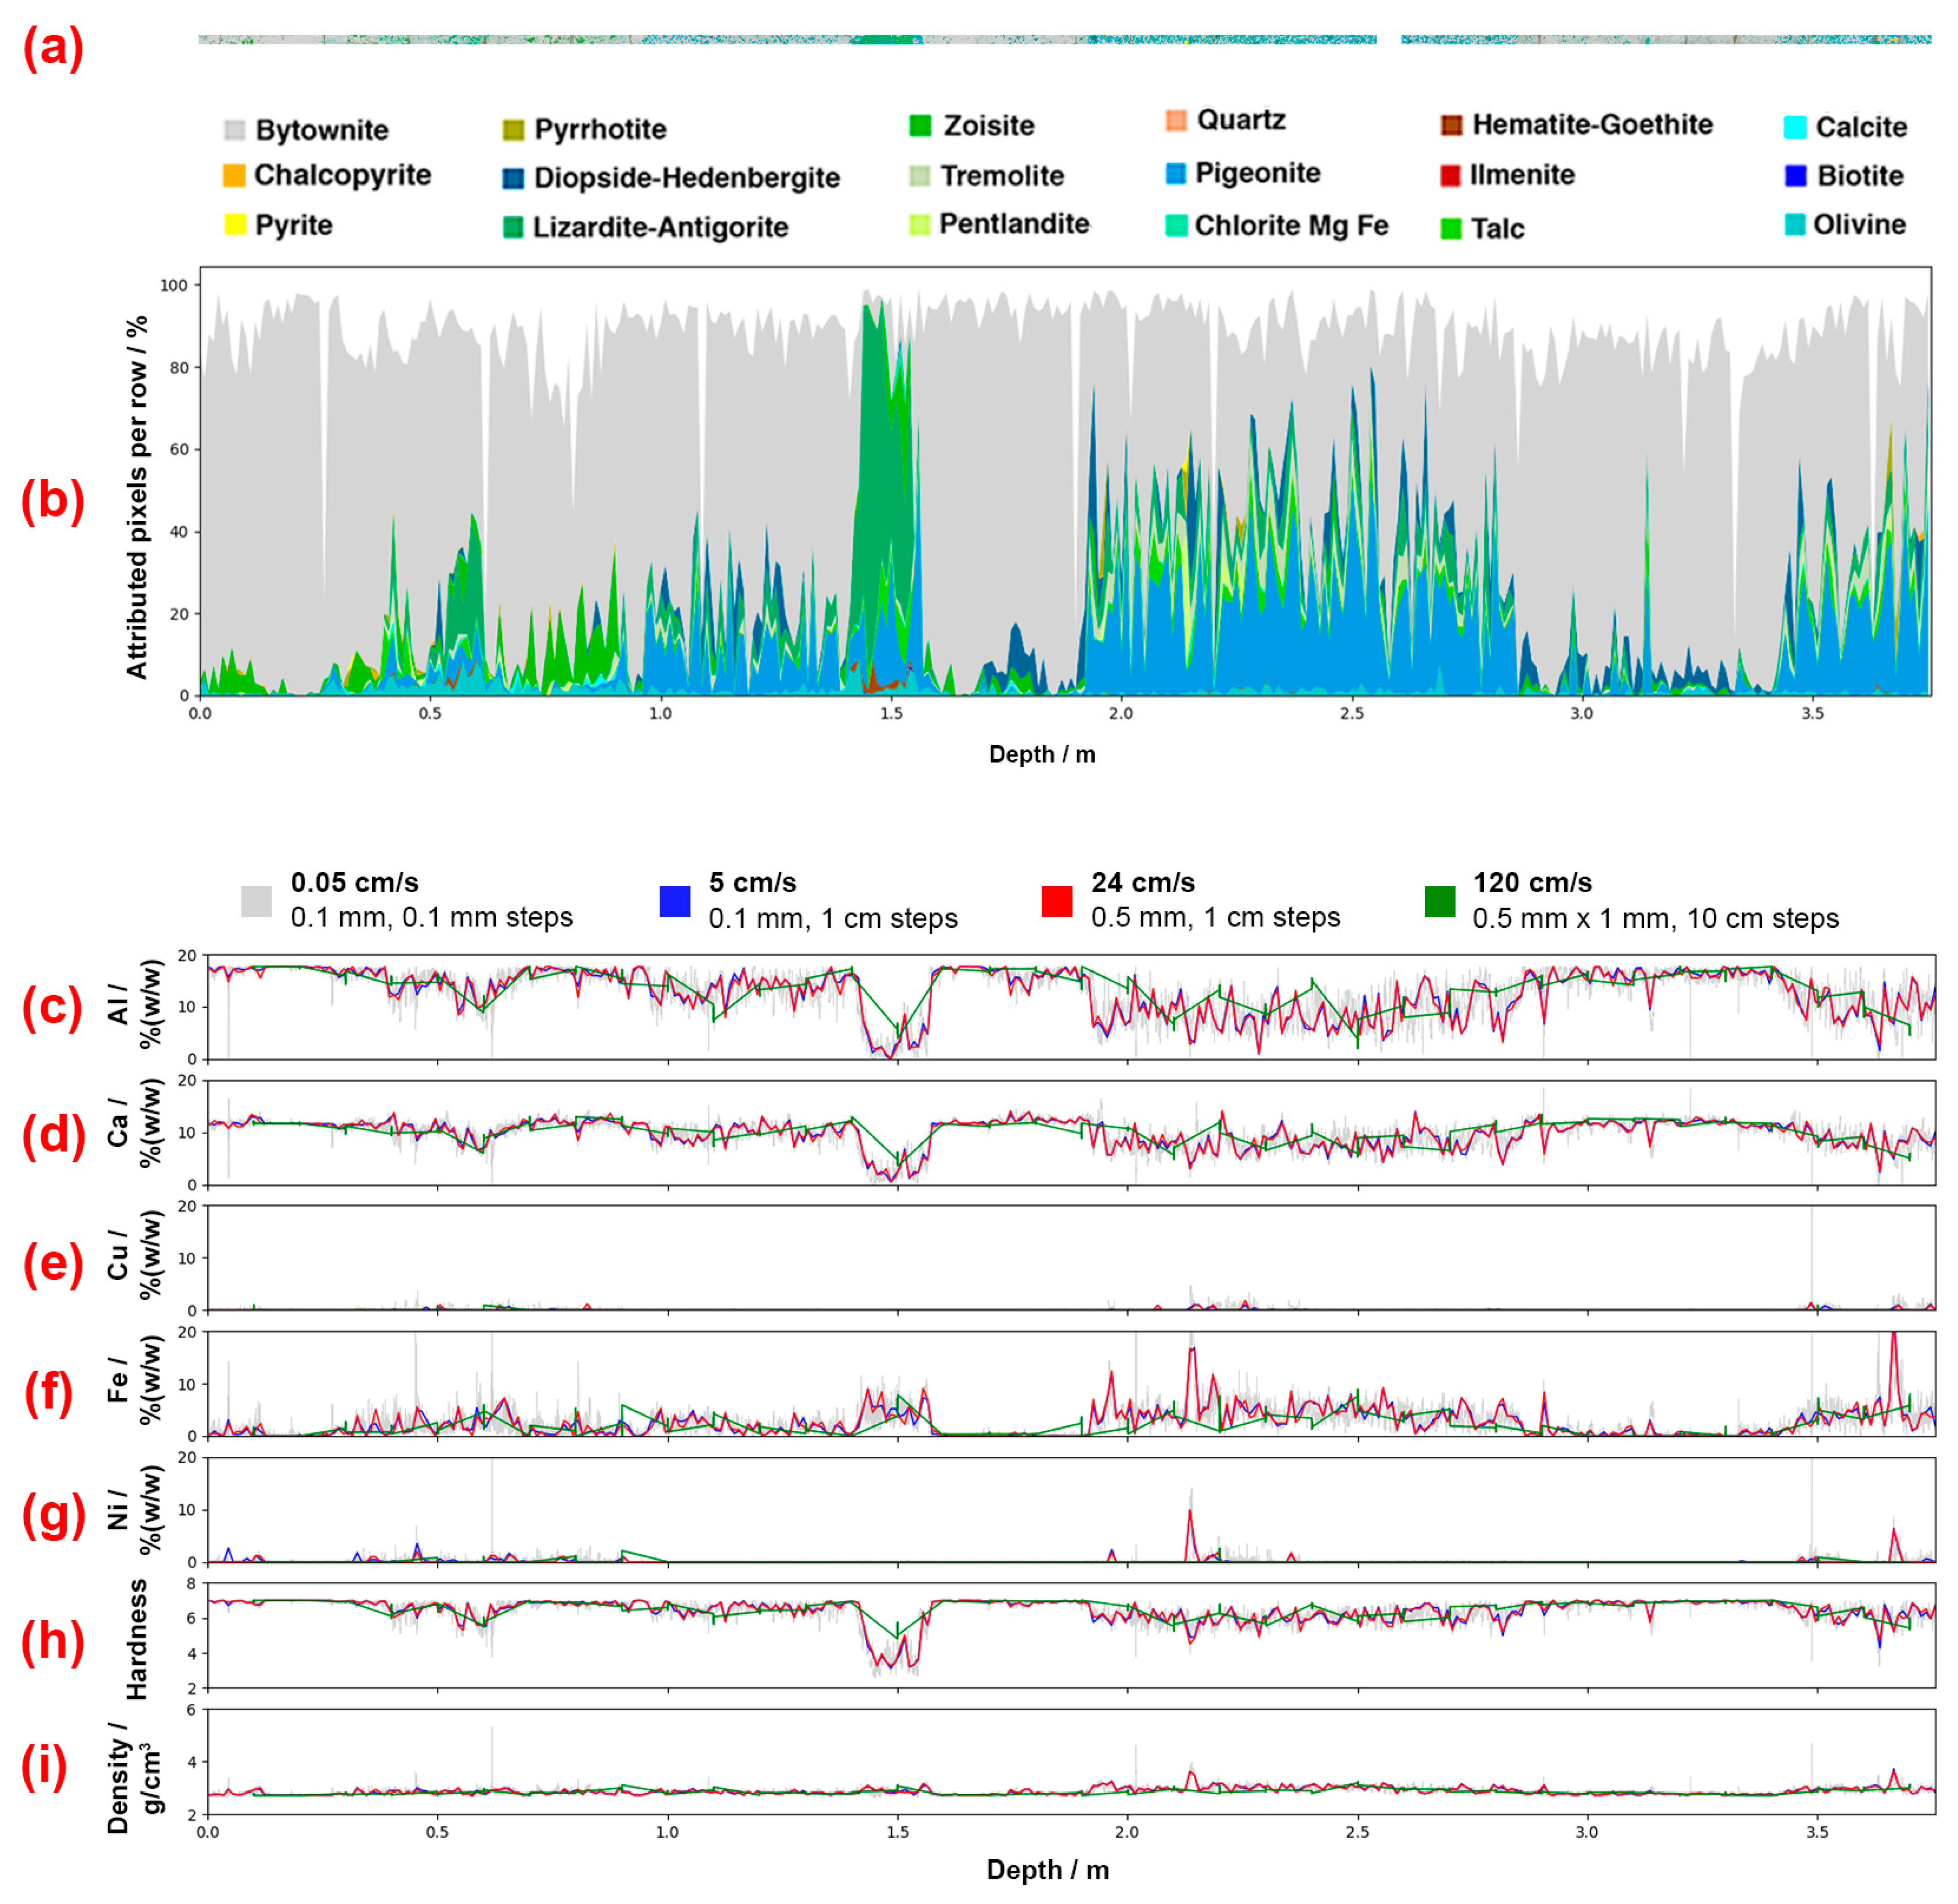
3.3. Automated Mineralogy of the Full Tray

Following the class assignation and validation, a full core tray of four rows of BQ core approximately 1 m for a total of 3.8 m was analyzed by ECORE at a spatial resolution of 50 μm and a step size (effective spatial resolution) of 100 μm. The maps overlapping the high-resolution photography of the core tray are shown in Figure 7. Big cracks were avoided automatically by the instrument, and the whole process is fully automated.
The core samples A, B, and C were put back in their drill holes before the analysis for comparison, and the results are in good agreement with the map at 50 μm steps in Figure 6.

3.4. Elemental Content

The results of the mineralogical mapping in Figure 8a were put in stacked plots in Figure 8b in order to compare the plotted elemental concentrations, hardness, and density in Figure 8c–i. The complete mineral map of the 3.8-m core is presented in Figure 8a, and the mineralogical content expressed at 10 cm steps in Figure 8b is provided as a landmark. In Figure 8b, the content is expressed in %, thus it is to be understood that the algorithm recognizes between 80%–95% classes for each step. Not all analysis spots end up being assigned majorly because of the roughness and the discontinuities of the core samples; in other words, some laser spots were out of the depth-of-field leading to no or a week laser-induced plasma.
In Figure 8c–g, the chemical assays in %(w/w) of Al, Ca, Cu, Fe, and Ni, respectively, are provided as a function of the drill hole depth. Only some elements are plotted for presentation reasons, but any other assay could have been plotted as well. In Figure 8h,i, the hardness on Moh’s scale and density in g/cm3 are plotted as a mean of the mineralogies’ literature values, respectively [21].
For all the waterfall plots presented in Figure 8c–i, the assays, hardness, and density are plotted according to a scanning speed of 0.05 cm/s (grey), 5 cm/s (blue), 24 cm/s (red), and 120 cm/s (green). All line plots are in good agreement with the mineralogical content of the tray at different depths. For example, the aluminum content (Figure 8c) is high through the full tray except when the Al-poor lizardite–antigorite, around 1.5-m content is high (in Figure 8b). Furthermore, the Ni content has maxima at depths where the pentlandite content is high at around 2.15 and 3.6 m, which is expected.
The blue and green lines are very similar and are representative of the mean of the higher resolution grey line. In practice, a 0.1 mm resolution is not needed, and thus, lowering the resolution to 0.5 mm and stepping at 1 cm increments significantly increases the scanning speed while keeping the same information about the drill core. The speeds are calculated from the nominal speed of 1 ms/pixel. Stepping to a 10 cm increment still provides consistent results at a much higher speed of 120 cm/s. Such a sampling method is used for instance for core logging and SXRF methods to compensate for long dwell times.

3.5. Comparison of Analysis Speeds with Other Techniques

As stated before, IR-HSI has been the fastest core logging and core scanning technique, but the technique itself has limitations. One of these limitations is that the technique cannot render the elemental content (i.e., multi-elemental assays) as a validation tool, but more importantly, the IR signal itself is not selective enough to differentiate certain mineralogies because some chemical bonds simply do not absorb infrared photons (e.g., sulfides, oxides, etc.). The SXRF technique in this aspect is largely investigated and even commercialized, but X-ray fluorescence dwell times are >2–3 s, and interferences for each element are largely dependent on these dwell times. The SXRF core scanning speed is therefore undeniably compromised. In the aspect of core logging, however, SXRF instruments manufacturers have made many improvements, reaching for certain techniques 1 cm/s logging speeds. Table 1 shows a comparison of the LIBS parameters to an IR-HSI technique and a fast SXRF technique, both of which were peer reviewed. All manufacturers calculate speeds differently, making comparisons confusing, especially at different resolutions. In Table 2, the reported speed of the IR-HSI [22] and the analysis speed of the LIBS analysis described in this manuscript are translated to resolutions comparable to a peer-reviewed SXRF core logging technique [13]. After covering this area, the SXRF peer-reviewed article describes a 10 cm step and reports a 1 cm/s scanning speed. At the resolutions of the IR-HSI technique, the same experiment would render a scanning speed of about 13 cm/s. Of course, the beam width for IR-HIS cameras can be increased for core logging applications to render a greater speed in such conditions. Therefore, the value estimated in Table 2 serves the purpose of situating the SXRF and LIBS speeds. The reader has to keep in mind that this value is a minimum. To cover the same 1 mm × 20 mm sampling pattern, the LIBS analyzer must sweep 82 pixels at a 0.5 mm resolution. Assuming 10 cm steps, the speed for the LIBS instrument can reach about 120 cm/s, which is faster than the described SXRF analysis. Therefore, based on the analysis of the same area and thus comparing similar experiments, the LIBS-HSI experiment surely deserves to be considered for both core scanning and core logging experiments since it combines automated quantitative mineralogy and multielemental assays in a single measurement.
It is important to note that the scanning resolution used in the present study was set to a high resolution since this manuscript has been written when only 3.8 m of drill core were available at our facilities. The 2.1 h reported in Table 2 for the scanning of the full tray is to bring information comparable to the TIMA-X (SEM-EDS) analysis time for a single disk of 25 mm. In other words, in the time reported to scan one complete 25 mm disk with TIMA-X, ECORE has scanned a complete drill core box of 3.81 m. In practice, when several kilometers of drill core have to be scanned, the low-resolution mode is used, lowering the time for the complete drill core tray scanning under 5 min. The low-resolution mode of the ECORE is equivalent to majority of commercial IR-HSI drill core scanners (i.e., pixel size of 500 µm). One advantage that comes out of the analytical capabilities of ECORE is the flexibility to adjust the scanning resolution depending on the mineral content of the tray. In other words, the ECORE can prospect rapidly at low-resolution and reveal more valuable mineral information at a high resolution if required. ECORE thus combines a high-quality quantitative automated mineralogy at the drill core scale and a high level of automation.

3.6. Analysis Selectivity Comparison to Other Techniques

To compare the versatility of the ECORE instrument, the types of analyses covered by IR-HSI, SEM-EDS, SXRF, and LIBS techniques are presented in Table 3. The limitations of the IR-HSI technique are shown here by the example of sulfides (PGE-bearing minerals) that cannot be diagnosed. PGE-bearing pentlandite and therefore PGE elemental contents cannot be reported using this technique. All diagnoses for the IR-HSI technique are taken directly from literature [7,22], and moderate to good signals are reported according to the selectivity of certain light sources towards different mineral groups. For the other techniques, a good signal is reported if the techniques can report the type of analysis. A SEM-EDS technique such as the one used as a validation tool in this article provides the mineral content at very high resolutions but cannot be used for core scanning or core logging since dwell times are too long. Elemental assays for the SEM-EDS technique are assigned as diagnostic instead of good because the EDS technique has a good sensitivity to only certain light and heavy elements and is not discussed in this manuscript. The fastest SXRF analyzers are core loggers, where the beam width is considerably increased to obtain the elemental content at high dwell times while increasing the surface sampling. The SXRF technique cannot provide the mineral content. Furthermore, SXRF analyzers are not sensitive to light elements such as lithium, and detection limits and superposing signals are largely dependent on the dwell times. At a uniform 1 ms dwell time (the lowest of all), the LIBS analysis is instantaneously sensitive to all elements down to low ppm (w/w), even sulfur, as proven earlier, and to all mineralogies validated by the SEM-EDS method.

4. Conclusions

In conclusion, a full core tray containing 3.8 drill core meters was analyzed using a LIBS core scanner, the ECORE, using a thorough supervision/validation method. From now on, the mineral content, the multielement assay, the density, and the hardness of the rock bed can be reported as a function of the drill hole depth by a LIBS core scanner. The core logging capability of the LIBS analyzer was discussed based on its larger sampled area (representativity) at a 10 cm step size and based on its speed when compared to other techniques described in other published works [13,22].
Because LIBS is an ablation technique, the beam width is not adjustable as with other IR-HSI or SXRF techniques, but its most powerful argument is that its dwell time is the lowest of all. Additionally, at a fixed low dwell time of 1 ms, the LIBS spectrum acknowledges a high instantaneous sensitivity to all elements down to low ppm, which is not the case for SXRF and other XRF techniques. Therefore, the LIBS analysis time largely makes up for same area representativity, since its low dwell time allows larger surface scanning per unit of time. The sampling strategy can be tuned for core logging projects requirements and budgets.
LIBS has been shown to be a reliable mineral mapper in our previous work [19], and its performance has been demonstrated by comparing its selectivity and speed to commercial core scanners. To our knowledge, the generated mineral map reported in this article is the first >7.62 megapixels mineral map created using the fully automated single scanning procedure of a LIBS instrument. This study thus reports breakthroughs for both core scanners manufacturing and LIBS instruments automation.
The LIBS-HSI ECORE instrument introduced in this study is very versatile: it can be used for both high-resolution mineralogical imaging and low-resolution core scanning. Such ambivalence is a game-changer for finding new PGE-bearing ore bodies or better archiving old ones. Future works are planned to report a comparison of the results obtained with ECORE to other core logging technologies as well as providing a standard analytical procedure for the analysis of several thousands of drill core meters.

Supplementary Materials

The following are available online at https://www.mdpi.com/article/10.3390/min11080859/s1, Table S1. Mineral contents of core samples A, B and C obtained using both ECORE and TIMA-X instruments.

Author Contributions

Conceptualization, F.R.D., L.Ç.Ö. and N.A.; data curation, M.-C.M.P., K.R., L.Ç.Ö. and N.A.; formal analysis, M.-C.M.P., F.R.D., K.R. and L.Ç.Ö.; funding acquisition, F.R.D. and L.Ç.Ö.; investigation, M.-C.M.P., F.R.D., K.R., L.Ç.Ö. and N.A.; methodology, F.R.D., K.R., L.Ç.Ö. and N.A.; project administration, F.R.D. and L.Ç.Ö.; resources, F.R.D.; software, K.R.; supervision, F.R.D., L.Ç.Ö. and F.V.; validation, F.R.D. and F.V.; writing—original draft, M.-C.M.P., F.R.D. and K.R.; writing—review and editing, M.-C.M.P., F.R.D., K.R., L.Ç.Ö., N.A. and F.V. All authors have read and agreed to the published version of the manuscript.

Funding

This research was funded by the Group MISA, le Ministère de l’exporation et de l’innovation du gouvernement du Québec, le programme Accord, Mitacs Accelerate program, grant number IT10564, Elemission Inc. and by the National Sciences and Engineering Research Council of Canada.

Data Availability Statement

Not applicable.

Acknowledgments

Authors would like to thank Melissa Narbey, Zofia Swierczek, Alejandro Fayad, and Jing Li for contributing to the TIMA experiments, management, and coordination of communication between the different entities.

Conflicts of Interest

The authors declare no conflict of interest.

References

  1. Burlakovs, J.; Vincevica-Gaile, Z.; Krievans, M.; Jani, Y.; Horttanainen, M.; Pehme, K.-M.; Dace, E.; Setyobudi, R.H.; Pilecka, J.; Denafas, G.; et al. Platinum Group Elements in Geosphere and Anthroposphere: Interplay among the Global Reserves, Urban Ores, Markets and Circular Economy. Minerals 2020, 10, 558. [Google Scholar] [CrossRef]
  2. Zientek, M.L.; Loferski, P.J.; Parks, H.L.; Schulte, R.F.; Seal Ii, R.R. Platinum-Group Elements; 1802N; USGS: Reston, VA, USA, 2017; p. 106. [Google Scholar]
  3. ElMasry, G.; Sun, D.-W. CHAPTER 1—Principles of Hyperspectral Imaging Technology. In Hyperspectral Imaging for Food Quality Analysis and Control; Sun, D.-W., Ed.; Academic Press: San Diego, CA, USA, 2010; pp. 3–43. [Google Scholar]
  4. Goetz, A.F.H.; Vane, G.; Solomon, J.E.; Rock, B.N. Imaging Spectrometry for Earth Remote Sensing. Science 1985, 228, 1147–1153. [Google Scholar] [CrossRef] [PubMed]
  5. Wang, Y.W.; Reder, N.P.; Kang, S.; Glaser, A.K.; Liu, J.T.C. Multiplexed Optical Imaging of Tumor-Directed Nanoparticles: A Review of Imaging Systems and Approaches. Nanotheranostics 2017, 1, 369–388. [Google Scholar] [CrossRef] [PubMed]
  6. Abdo, M.; Badilita, V.; Korvink, J. Spatial scanning hyperspectral imaging combining a rotating slit with a Dove prism. Opt. Express 2019, 27, 20290–20304. [Google Scholar] [CrossRef] [PubMed]
  7. Johnson, C.L.; Browning, D.A.; Pendock, N.E. Hyperspectral Imaging Applications to Geometallurgy: Utilizing Blast Hole Mineralogy to Predict Au-Cu Recovery and Throughput at the Phoenix Mine, Nevada. Econ. Geol. 2019, 114, 1481–1494. [Google Scholar] [CrossRef]
  8. SPECIM. SWIR. Available online: https://www.specim.fi/products/swir/ (accessed on 18 May 2021).
  9. SPECIM. LWIR HS. Available online: https://www.specim.fi/products/lwir-hs/ (accessed on 18 May 2021).
  10. Lypaczewski, P.; Rivard, B.; Gaillard, N.; Perrouty, S.; Piette-Lauzière, N.; Bérubé, C.L.; Linnen, R.L. Using hyperspectral imaging to vector towards mineralization at the Canadian Malartic gold deposit, Québec, Canada. Ore Geol. Rev. 2019, 111, 102945. [Google Scholar] [CrossRef]
  11. Sun, L.; Khan, S.; Shabestari, P. Integrated Hyperspectral and Geochemical Study of Sediment-Hosted Disseminated Gold at the Goldstrike District, Utah. Remote Sens. 2019, 11, 1987. [Google Scholar] [CrossRef] [Green Version]
  12. Huang, J.-J.; Löwemark, L.; Chang, Q.; Lin, T.-Y.; Chen, H.-F.; Song, S.-R.; Wei, K.-Y. Choosing optimal exposure times for XRF core-scanning: Suggestions based on the analysis of geological reference materials. Geochem. Geophys. Geosyst. 2016, 17, 1558–1566. [Google Scholar] [CrossRef] [Green Version]
  13. Sjöqvist, A.S.L.; Arthursson, M.; Lundström, A.; Calderón Estrada, E.; Inerfeldt, A.; Lorenz, H. An innovative optical and chemical drill core scanner. Sci. Drill. 2015, 19, 13–16. [Google Scholar] [CrossRef] [Green Version]
  14. SPECTRAL INDUSTRIES. DRILL CORE SCANNER—LIBS ENGINE. Available online: https://www.spectralindustries.com/products/ (accessed on 31 May 2021).
  15. Fabre, C.; Devismes, D.; Moncayo, S.; Pelascini, F.; Trichard, F.; Lecomte, A.; Bousquet, B.; Cauzid, J.; Motto-Ros, V. Elemental imaging by laser-induced breakdown spectroscopy for the geological characterization of minerals. J. Anal. At. Spectrom. 2018, 33, 1345–1353. [Google Scholar] [CrossRef]
  16. Kuhn, K.; Meima, J.A.; Rammlmair, D.; Ohlendorf, C. Chemical mapping of mine waste drill cores with laser-induced breakdown spectroscopy (LIBS) and energy dispersive X-ray fluorescence (EDXRF) for mineral resource exploration. J. Geochem. Explor. 2016, 161, 72–84. [Google Scholar] [CrossRef]
  17. Khajehzadeh, N.; Kauppinen, T.K. Fast mineral identification using elemental LIBS technique. IFAC-PapersOnLine 2015, 48, 119–124. [Google Scholar] [CrossRef]
  18. Rifai, K.; Doucet, F.; Özcan, L.; Vidal, F. LIBS core imaging at kHz speed: Paving the way for real-time geochemical applications. Spectrochim. Acta Part B At. Spectrosc. 2018, 150, 43–48. [Google Scholar] [CrossRef]
  19. Rifai, K.; Michaud Paradis, M.-C.; Doucet, F.; Swierczek, Z.; Özcan, L.; Fayad, A.; Li, J.; Vidal, F. Emergences of new technology for ultrafast automated mineral phase identification and quantitative analysis using CORIOSITY Laser-Induced Breakdown Spectroscopy (LIBS) system. Minerals 2020, 10, 918. [Google Scholar] [CrossRef]
  20. Mohamed, N.; Rifai, K.; Selmani, S.; Constantin, M.; Doucet, F.R.; Özcan, L.Ç.; Sabsabi, M.; Vidal, F. Chemical and Mineralogical Mapping of Platinum-Group Element Ore Samples Using Laser-Induced Breakdown Spectroscopy and Micro-XRF. Geostand. Geoanal. Res. 2021. [Google Scholar] [CrossRef]
  21. Mineral Database. Available online: http://www.webmineral.com/ (accessed on 3 September 2020).
  22. Acosta, I.C.C.; Khodadadzadeh, M.; Tusa, L.; Ghamisi, P.; Gloaguen, R. A Machine Learning Framework for Drill-Core Mineral Mapping Using Hyperspectral and High-Resolution Mineralogical Data Fusion. IEEE J. Sel. Top. Appl. Earth Obs. Remote Sens. 2019, 12, 4829–4842. [Google Scholar] [CrossRef]
Figure 1. High-resolution image (57 µm/pixel) of drill core tray (Stillwater Mine, USA) wherein the red circles correspond to the areas analyzed using a SEM-EDS analyzer (named Core A, Core B and Core C).
Minerals 11 00859 g001
Figure 2. ECORE LIBS drill core scanner.
Minerals 11 00859 g002
Figure 3. Mineral classes spectra in the 220–990 nm range.
Minerals 11 00859 g003
Figure 4. Full spectra of chlorite and chlorite Mg Fe + Na, bytownite, bytownite + Mg and bytownite + K and zoisite and zoisite + Mg assigned mineralogies.
Minerals 11 00859 g004
Figure 5. Full spectra of pyrite (yellow), pyrrhotite (green), and hematite–goethite (brown) assigned mineralogies.
Minerals 11 00859 g005
Figure 6. TIMA-X and ECORE mineral maps of core samples A, B, and C (the red circles in Figure 1).
Minerals 11 00859 g006
Figure 7. LIBS mineral mapping of a full core tray at a spatial resolution of 50 μm and a step size of 100 μm overlay on the high-resolution image of the core tray. The color code is the same as in Figure 6.
Minerals 11 00859 g007
Figure 8. (a) Mineral map of the entire core in the box, (b) mineral content in % as a function of core length at 10 mm steps, (cg) elemental assay, (h) hardness, and (i) density. Scanning speeds are 0.05 cm/s (grey, 0.1 mm steps), 5 cm/s (green, 10 cm steps), 5 cm/s (blue, 1 cm steps), and 24 cm/s (red, 1 cm steps) along the depth axis.
Minerals 11 00859 g008
Table 1. Comparison of LIBS parameters with IR-HSI (low-speed IR analysis) and with SXRF (high-speed SXRF core logging) parameters taken from peer-reviewed articles.
Core Scanning/Logging Technique
TechniqueIR-HSISXRFLIBS-HSI
Analysis typeHyperspectral imagingElemental contentHyperspectral imaging and elemental content
Instrument in peer-reviewed articleSisuROCK AisaFENIX (VNIR-SWIR)Minalyze CSECORE ELEMISSION
Resolution , step size, analysis time reported by manufacturer65–560 μm,
≥65–560 μm,
up to 50 mm/s
1 mm/2 cm,
0.1 m,
1 cm/s
50 μm,
≥50 μm,
1 pixel/ms
Spatial resolution (beam width)Ø 1.5 mm/pixel1 mm/2 cm [13]Ø 50 μm
Step size1.5 mm/pixel0.1 m500 μm
Real spatial resolution1.5 mm/pixel [22]0.1 m [13]500 μm
Dwell time4 ms (VNIR) [22]
15 ms (SWIR) [22]
10 s [13]1 ms
Reported analysis speed25.06 mm/s [22]1 cm/s [13]1 pixel/ms
Analysis speed at 10 cm steps14 pixels in 1 mm/2 cm
>13 cm/s
1 cm/s82 pixels in 1 mm/2 cm
120 cm/s
The resolution used for the SXRF technique is the beam width provided by Sjöqvist et al. [13].
Table 2. ECORE LIBS analysis principal parameters.
Laser Energy1 mJ/Pulse
Laser source wavelength1064 nm
Acquisition rate1000 Hz
Spatial resolution50 µm
Rayleigh zone (depth of field)6 mm
Working distance (optical window-sample surface)250 mm
Dwell time1 ms
Step size (adjustable)0.1 mm
Core width to be scan (adjustable)20 mm
Drill core length3.81 m
Surface analyzed762 cm2
Number of pixels (LIBS)7.62 megapixels
Total duration2.1 h
Scanning speed in real-time1 pixel/ms
Table 3. Comparison of three types of drill core scanners (IR-HSI, SXRF, and LIBS) and a SEM-EDS high-resolution imager.
Core Scanning Technique
TechniqueIR-HSI
(e.g., SisuROCK, HySpex, etc.)
SEM-EDS
(e.g., TIMA)
SXRF
(e.g., Minalyze CS, ITRAX, etc.)
LIBS-HSI
(e.g., ECORE)
Sample sizesDrill core traysSmall core cross-sectionsDrill core traysAll types
Elemental assayDiagnostic (good or non-diagnostic)
Light elements (H-Mg)NDDiagnosticNDGood
Other elements (Al-Lr)NDDiagnosticGoodGood
Mineral structureMineral groupExampleDiagnostic (poor, moderate, good or non-diagnostic)
Ino-silicatesPyroxeneDiopsideGood (VNIR, LWIR) [7]
Moderate (SWIR) [7]
GoodNDGood
PigeoniteGood (VNIR, LWIR) [7]
Moderate (SWIR) [7]
GoodNDGood
Soro-silicatesEpidoteZoisiteGood (SWIR) [7,22]
Moderate (LWIR) [7,22]
GoodNDGood
Phyllo-silicatesChloriteFe/Mg-ChloriteGood (SWIR) [7,22]
Moderate (LWIR) [7,22]
GoodNDGood
MicaTalcGood (SWIR) [7]
Moderate (LWIR) [7]
GoodNDGood
Tecto-silicatesFeldsparBytowniteGood (LWIR) [22]GoodNDGood
SilicaQuartzGood (LWIR) [7,22]GoodNDGood
Non-silicatesOxidesHematiteGood (VNIR) [7,22]GoodNDGood
SulfidesPyriteModerate (LWIR) [22]
ND [7]
GoodNDGood
ChalcopyriteND [7]GoodNDGood
PentlanditeND [7]GoodNDGood
Publisher’s Note: MDPI stays neutral with regard to jurisdictional claims in published maps and institutional affiliations.

