Article

Crystal Chemistry of Six Grossular Garnet Samples from Different Well-Known Localities

Department of Geoscience, University of Calgary, Calgary, AB T2N 1N4, Canada
Minerals 2021, 11(7), 767; https://doi.org/10.3390/min11070767
Submission received: 22 June 2021 / Revised: 12 July 2021 / Accepted: 13 July 2021 / Published: 15 July 2021

Abstract

:
Two isotropic grossular (ideally Ca3Al2Si3O12) samples from (1) Canada and (2) Tanzania, three optically anisotropic grossular samples (3, 4, 5) from Mexico, and one (6) anisotropic sample from Italy were studied. The crystal structure of the six samples was refined in the cubic space group I a 3 ¯ d , using monochromatic synchrotron high-resolution powder X-ray diffraction (HRPXRD) data and the Rietveld method. The compositions of the samples were obtained from electron microprobe analyses (EPMA). The HRPXRD traces show a single cubic phase for two isotropic samples, whereas the four anisotropic samples contain two different cubic phases that were also resolved using X-ray elemental line scans, backscattered electron (BSE) images, and elemental maps. Structural mismatch from two cubic phases intergrown in the birefringent samples gives rise to strain-induced optical anisotropy. Considering the garnet general formula, [8]X3[6]Y2[4]Z3[4]O12, the results of this study show that with increasing unit-cell parameter, the Y-O distance increases linearly and rather steeply, the average <X-O> distance increases just slightly in response to substitution mainly on the Y site, while the Z-O distance remains nearly constant. The X and Z sites in grossular contain Ca and Si atoms, respectively; both sites show insignificant substitutions by other atoms, which is supported by a constant Z-O distance and only a slight increase in the average <X-O> distance. The main cation exchange is realized in the Y site, where Fe3+ (ionic radius = 0.645 Å) replaces Al3+ (ionic radius = 0.545 Å), so the Y-O distance increases the most.

1. Introduction

In a recent study on grossular, ideally Ca3Al2Si3O12, four different samples were investigated: three anisotropic samples (two from Asbestos, Quebec and one from Tanzania) contain an intergrowth of two different cubic phases, whereas the isotropic sample from Afghanistan contains one cubic phase [1]. In this study, four additional anisotropic grossular samples from Mexico and Italy, and two isotropic grossular samples from Canada and Tanzania were investigated. The results from these ten different samples are used to examine structural trends in grossular–andradite [Ca3(Al,Fe)2Si3O12] solid solutions. The three samples from Mexico were selected because they were described as birefringent [2]. Based on some recent studies, these samples are expected to contain multiple cubic phases [1,3,4,5,6,7,8]. This study was carried out to confirm this expectation. Based on synthetic samples, structural data are available for grossular–andradite solid solutions [9].
Birefringence in garnet was reported over a century ago [10,11,12], but the origin still remains questionable. Many garnet samples are cubic, but some almandine, grossular, spessartine, andradite, uvarovite, and hydrogarnet samples are anisotropic under cross-polarized light, which indicates that they are not optically cubic, e.g., [13,14,15,16,17]. Several reasons were given as the cause of the birefringence, but the main one appears to be cation order in the X and Y sites that cause symmetry reduction [13,18,19,20,21,22,23,24,25,26,27,28]. These studies observed unit-cell parameters that do not deviate significantly from a cubic unit-cell parameter. In an IR study of four birefringent samples, including grossular from Asbestos and Eden Mills, the data from McAloon and Hofmeister [29] are consistent with cubic symmetry and the absence of cation order. They indicated that strain causes anomalous optical anisotropy in garnet (as occurs in diamond and quartz), which are the same conclusions arrived at in this study. The other suggested reasons for the birefringence in garnet were recently discussed by Antao and Klincker [6] and are not repeated here. A recent study on garnet indicated that the symmetry may be trigonal [30].
Diffraction peaks from garnets showing splitting were interpreted as arising from different phases, e.g., [31,32,33,34,35,36,37,38]. Recently, multiphase intergrowths of two or three cubic garnet phases were observed with powder X-ray diffraction; all such garnets show splitting of reflections in diffraction traces [1,3,4,6,7,8,39]. This study reports split reflections from anisotropic grossular samples that contain two different cubic phases.
Garnet nomenclature was discussed by others [40,41]. The general formula for garnet is [8]X3[6]Y2[4]Z3[4]O12, Z = 8, space group I a 3 ¯ d , where the eight-coordinated dodecahedral X site contains Mg, Ca, Mn, or Fe2+ cations, the six-coordinated octahedral Y site contains Al, Cr3+, Fe3+, Ti4+, or Zr4+ cations, and the four-coordinated tetrahedral Z site contains Si or Fe3+ cations, or (O4H4) groups, e.g., [42]. The structure of garnet consists of alternating ZO4 tetrahedra and YO6 octahedra with X atoms filling cavities to form XO8 dodecahedra (Figure 1). The eight O atoms in the XO8 dodecahedron occur at the corners of a distorted cube. Each O atom is tetrahedrally coordinated by two X, one Y, and one Z cation. The O atom is on a general position and the three cation positions are fixed. If substitution with a different size cations occurs on the Y site, for example, then the Y-O distance changes significantly, whereas the Z-O and average <X-O> distances change by minor amounts in response to that substitution [3].
This study examines the crystal structure of four anisotropic and two isotropic grossular samples. The two isotropic samples are single cubic phases. The four birefringent samples contain two cubic phases that cause strain-induced optical anisotropy. X-ray elemental line scans, backscattered electron (BSE) images, and X-ray elemental maps show the distribution of the different cubic phases.

2. Materials and Methods

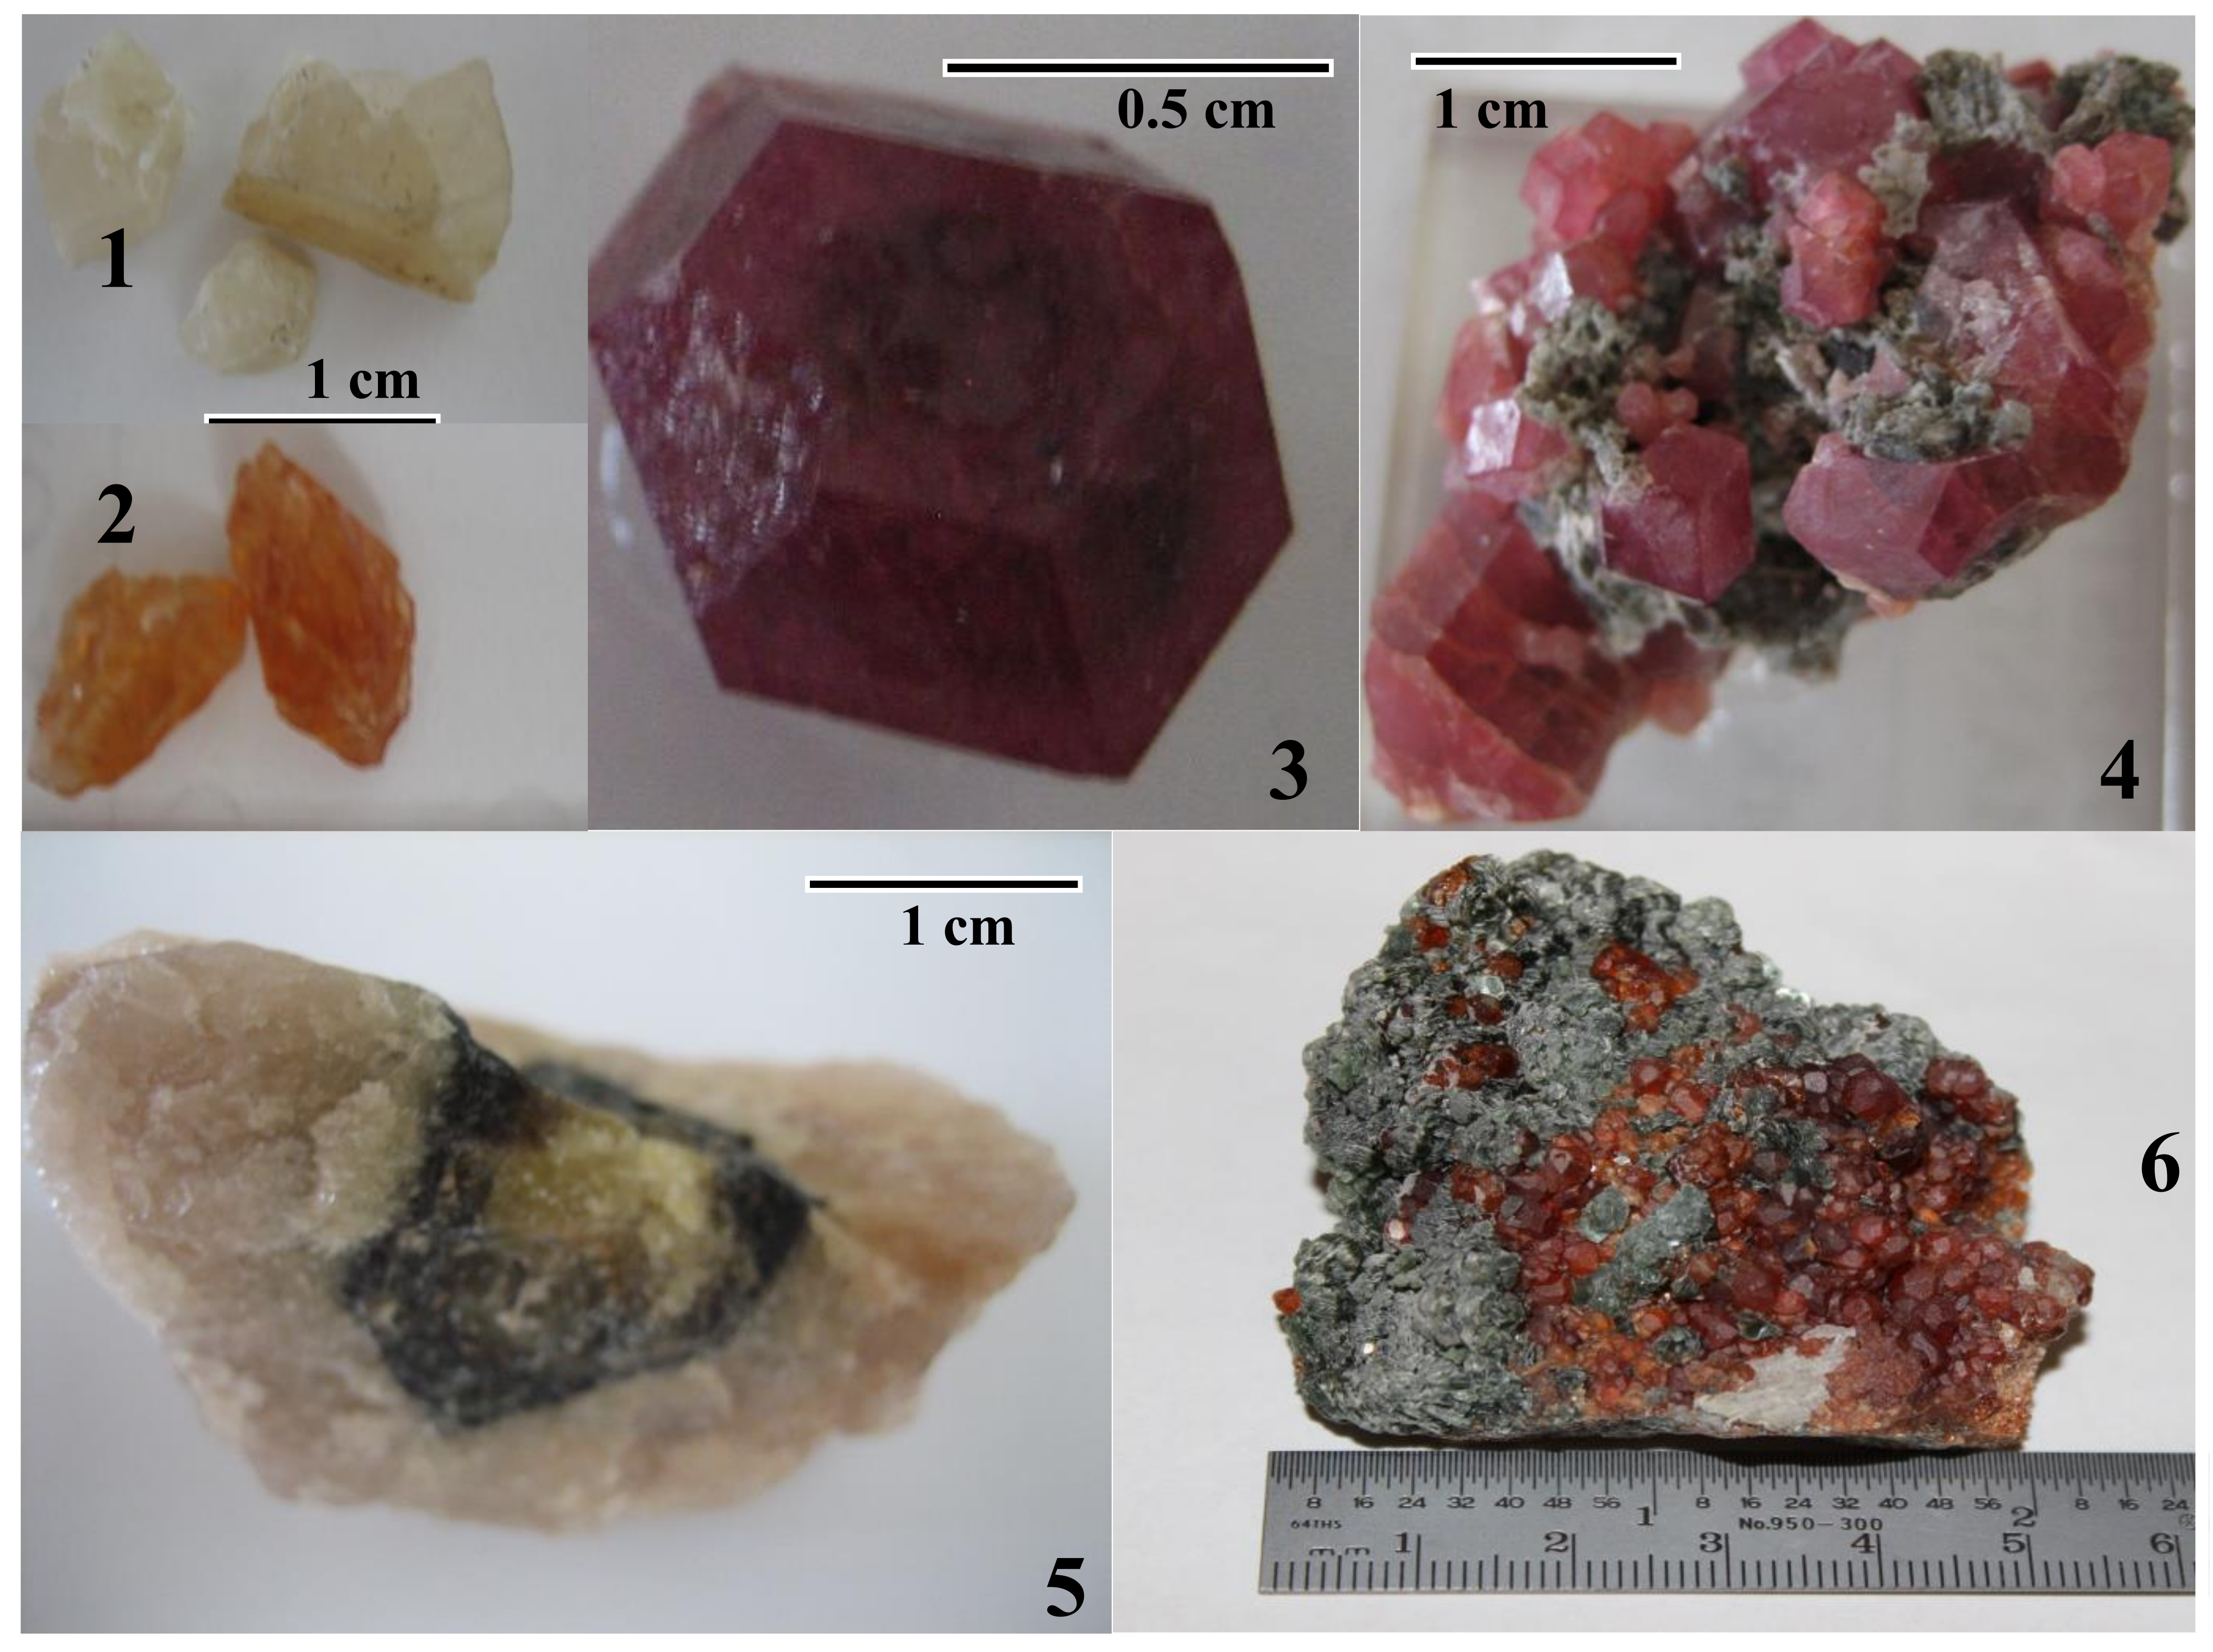
2.1. Sample Description

The six samples used in this study are shown in Figure 2. Sample-1 is from Lytton, BC, Canada (ROM # M30122) and is white in colour. Sample-1 was selected because it was described as “white jade”, which is similar to “green jade” from South Africa [37]. Sample-2 is from Tanzania and is an orange-brown “hessonite” grossular. Sample-3 is from Sierra de Cruces, Coahuila, Mexico and is a raspberry-red grossular that occurs on the eastern slope of the Sierra de Cruces Range, which overlooks Lake Jaco [2,43]. Sample-4 is from Chihuahua, Mexico and is deep-pink in colour. Sample-5 is also from Chihuahua, Mexico and contains a yellow core of grossular and very thick white outer layer of grossular. The core and the outer layer are separated by a dark layer of andradite. Fragments of grossular from the outer layer and the yellow core is used in this study. Sample-6 is from Bellecombe, Aosta Valley, Piedmont, Italy, and consists of red euhedral grossular crystals. The geology of this area was described by Ferrando et al. [44]. They reported the evolution of a polyphase rodingite that occurs within the Bellecombe antigorite–serpentinite and exposed in the Piemonte zone of Aosta Valley, NW Italy. Fine-grained rodingitic rocks are cross-cut by a network of veins that contain different types of grossular–andradite garnets, chlorite, diopside, and vesuvianite. The metamorphic rocks of the late greenschist facies were formed at p = 0.22 GPa and T = 400 °C [44].

2.2. Electron-Probe Microanalysis (EPMA)

Quantitative chemical compositions, line scans, backscattered electron (BSE) images, and X-ray elemental maps were collected with a JEOL JXA-8200 WD-ED electron-probe microanalysis (EPMA). The JEOL operating program on a Solaris platform was used for ZAF (atomic number, Z; absorption, A; fluorescence, F) correction and data reduction. The wavelength-dispersive (WD) analyses were conducted quantitatively using an accelerated voltage of 15 kV, a beam current of 20 nA, and a beam diameter of 5 μm. Relative analytical errors were 1% for major elements and 5% for minor elements. For each sample, an initial energy dispersive spectra was run to know what elements are present. Various standards were used (almandine–pyrope (MgKα), grossular (CaKα), almandine (FeKα, AlKα, SiKα), rutile (TiKα), spessartine (MnKα), and chromite (CrKα)). The EPMA results were obtained from about 9 to 12 spots from different areas of the crystal and were analysed using the spreadsheet from Locock [45]. The results shown in Table 1 are for average compositions (samples-1 and -2) or the compositions of the individual phases in the other samples.

2.3. Synchrotron High-Resolution Powder X-ray Diffraction (HRPXRD)

The samples were studied with HRPXRD that was performed at beamline 11-BM, Advanced Photon Source (APS), Argonne National Laboratory (ANL). A small fragment (about 2 mm in diameter) of the sample was crushed to a fine powder using a corundum mortar and pestle. The crushed sample was loaded into a Kapton capillary (0.8 mm internal diameter) and rotated during the experiment at a rate of 90 rotations per second. The data were collected at 23 °C to a maximum 2θ of about 50 with a step size of 0.001 and a step time of 0.1 s per step. The HRPXRD traces were collected with a multianalyzer detection assembly consisting of twelve independent silicon (111) crystal analyzers and LaCl3 scintillation detectors that reduce the angular range to be scanned and allow for rapid acquisition of data. An external silicon (NIST 640c) and alumina (NIST 676a) standard (mixed in a ratio of ⅓ Si:⅔ Al2O3 by weight) was used to calibrate the instrument and refine the monochromatic wavelength used in the experiment (see Table 2). Additional details of the experimental set-up are given elsewhere [46,47,48]. The experimental techniques used in this study are well established [49,50,51,52,53,54,55,56,57,58,59].

2.4. Rietveld Structural Refinement

The HRPXRD data were analyzed with the Rietveld method [61], as implemented in the GSAS program [62], and using the EXPGUI interface [63]. Scattering curves for neutral atoms were used. The starting atom coordinates, cell parameter, and space group, I a 3 ¯ d , were taken from Antao [1]. The background was modelled using a Chebyschev polynomial (eight terms). In the GSAS program, the reflection-peak profiles were fitted using type-3 profile pseudo-Voigt [64,65]. A full-matrix least-squares refinement was carried out by varying the parameters in the following sequence: a scale factor, unit-cell parameter, atom coordinates, and isotropic displacement parameters. Examination of the HRPXRD traces shows a single cubic phase for samples-1 and -2 and two separate cubic phases with different unit-cell parameters for samples-3, -4, -5, and -6. There are no impurities, or un-indexed peaks. The Y site was constrained to Fe + Al = 1. Toward the end of the refinement, all the parameters were allowed to vary simultaneously and the refinements proceeded to convergence. The unit-cell parameters and Rietveld refinement statistical indicators for the samples are summarized in several tables that follow.

3. Results

3.1. Chemical Analyses

All the samples were analyzed quite well as indicated by the total weight percent oxides, which is close to 100% (Table 1). Based on the general garnet formula X3Y2Z3O12, the sum of the X, Y, and Z cations are close to this ideal formula. The EPMA results for the six grossular samples show that the X site is nearly filled with Ca atoms and with minor amounts of Mn atoms to make a total of 3.0 X cations. (Table 1). The raspberry-red colour in grossular was attributed to Mn atoms [2]. Samples-3 and -4 contain small amounts of the Mn atoms and both are red to pink in colour (Figure 2). The Z site is filled with only Si atoms. The X and Z site contents do not influence the structural variations that are controlled mainly by the Al3+ and Fe3+ cations in the Y site in the grossular (Ca3Al2Si3O12)–andradite (Ca3Fe2Si3O12) solid solutions. Sample-6 contains the most Fe3+ cations, whereas sample-1 contains the least amount. The structure refinements, as shown below, indicate that the sofs for the Y sites are different for the two different cubic phases in the birefringent grossular samples. This study advances some recent work on several garnet-group minerals [66,67,68,69,70,71].
In general, separate phases in a multiphase assemblage of birefringent garnets are difficult to detect with EPMA results, especially if the crystals are randomly oriented in thin sections, or if the intergrowths occur on a fine scale. The electron beam may cover both phases and an average composition for both phases may be obtained by EPMA. Lamellar zoning in grossular and andradite occur along (110) planes and only if such planes are imaged or analyzed along a direction normal to (110) (i.e., edge on to the lamellae) may compositional differences between zones be observed. Lamellar zoning along (110) are Al- or Fe3+-rich in an inverse relation, e.g., [18,34,72,73,74]. Moreover, to simulate cation order in garnet, many single-crystal studies were carried out in space groups that are lower than cubic symmetry (see Section 1). However, this study and other recent studies show that such lamellar zones represent two or three different cubic phases [1,3,4,5,6,7,8]. The separate cubic phases are quite evident from HRPXRD traces as well as in optical micrographs, and backscattered electron (BSE) images obtained with the electron probe. The HRXPRD technique was also used to observe two-phase intergrowths in other minerals [75,76,77,78,79].

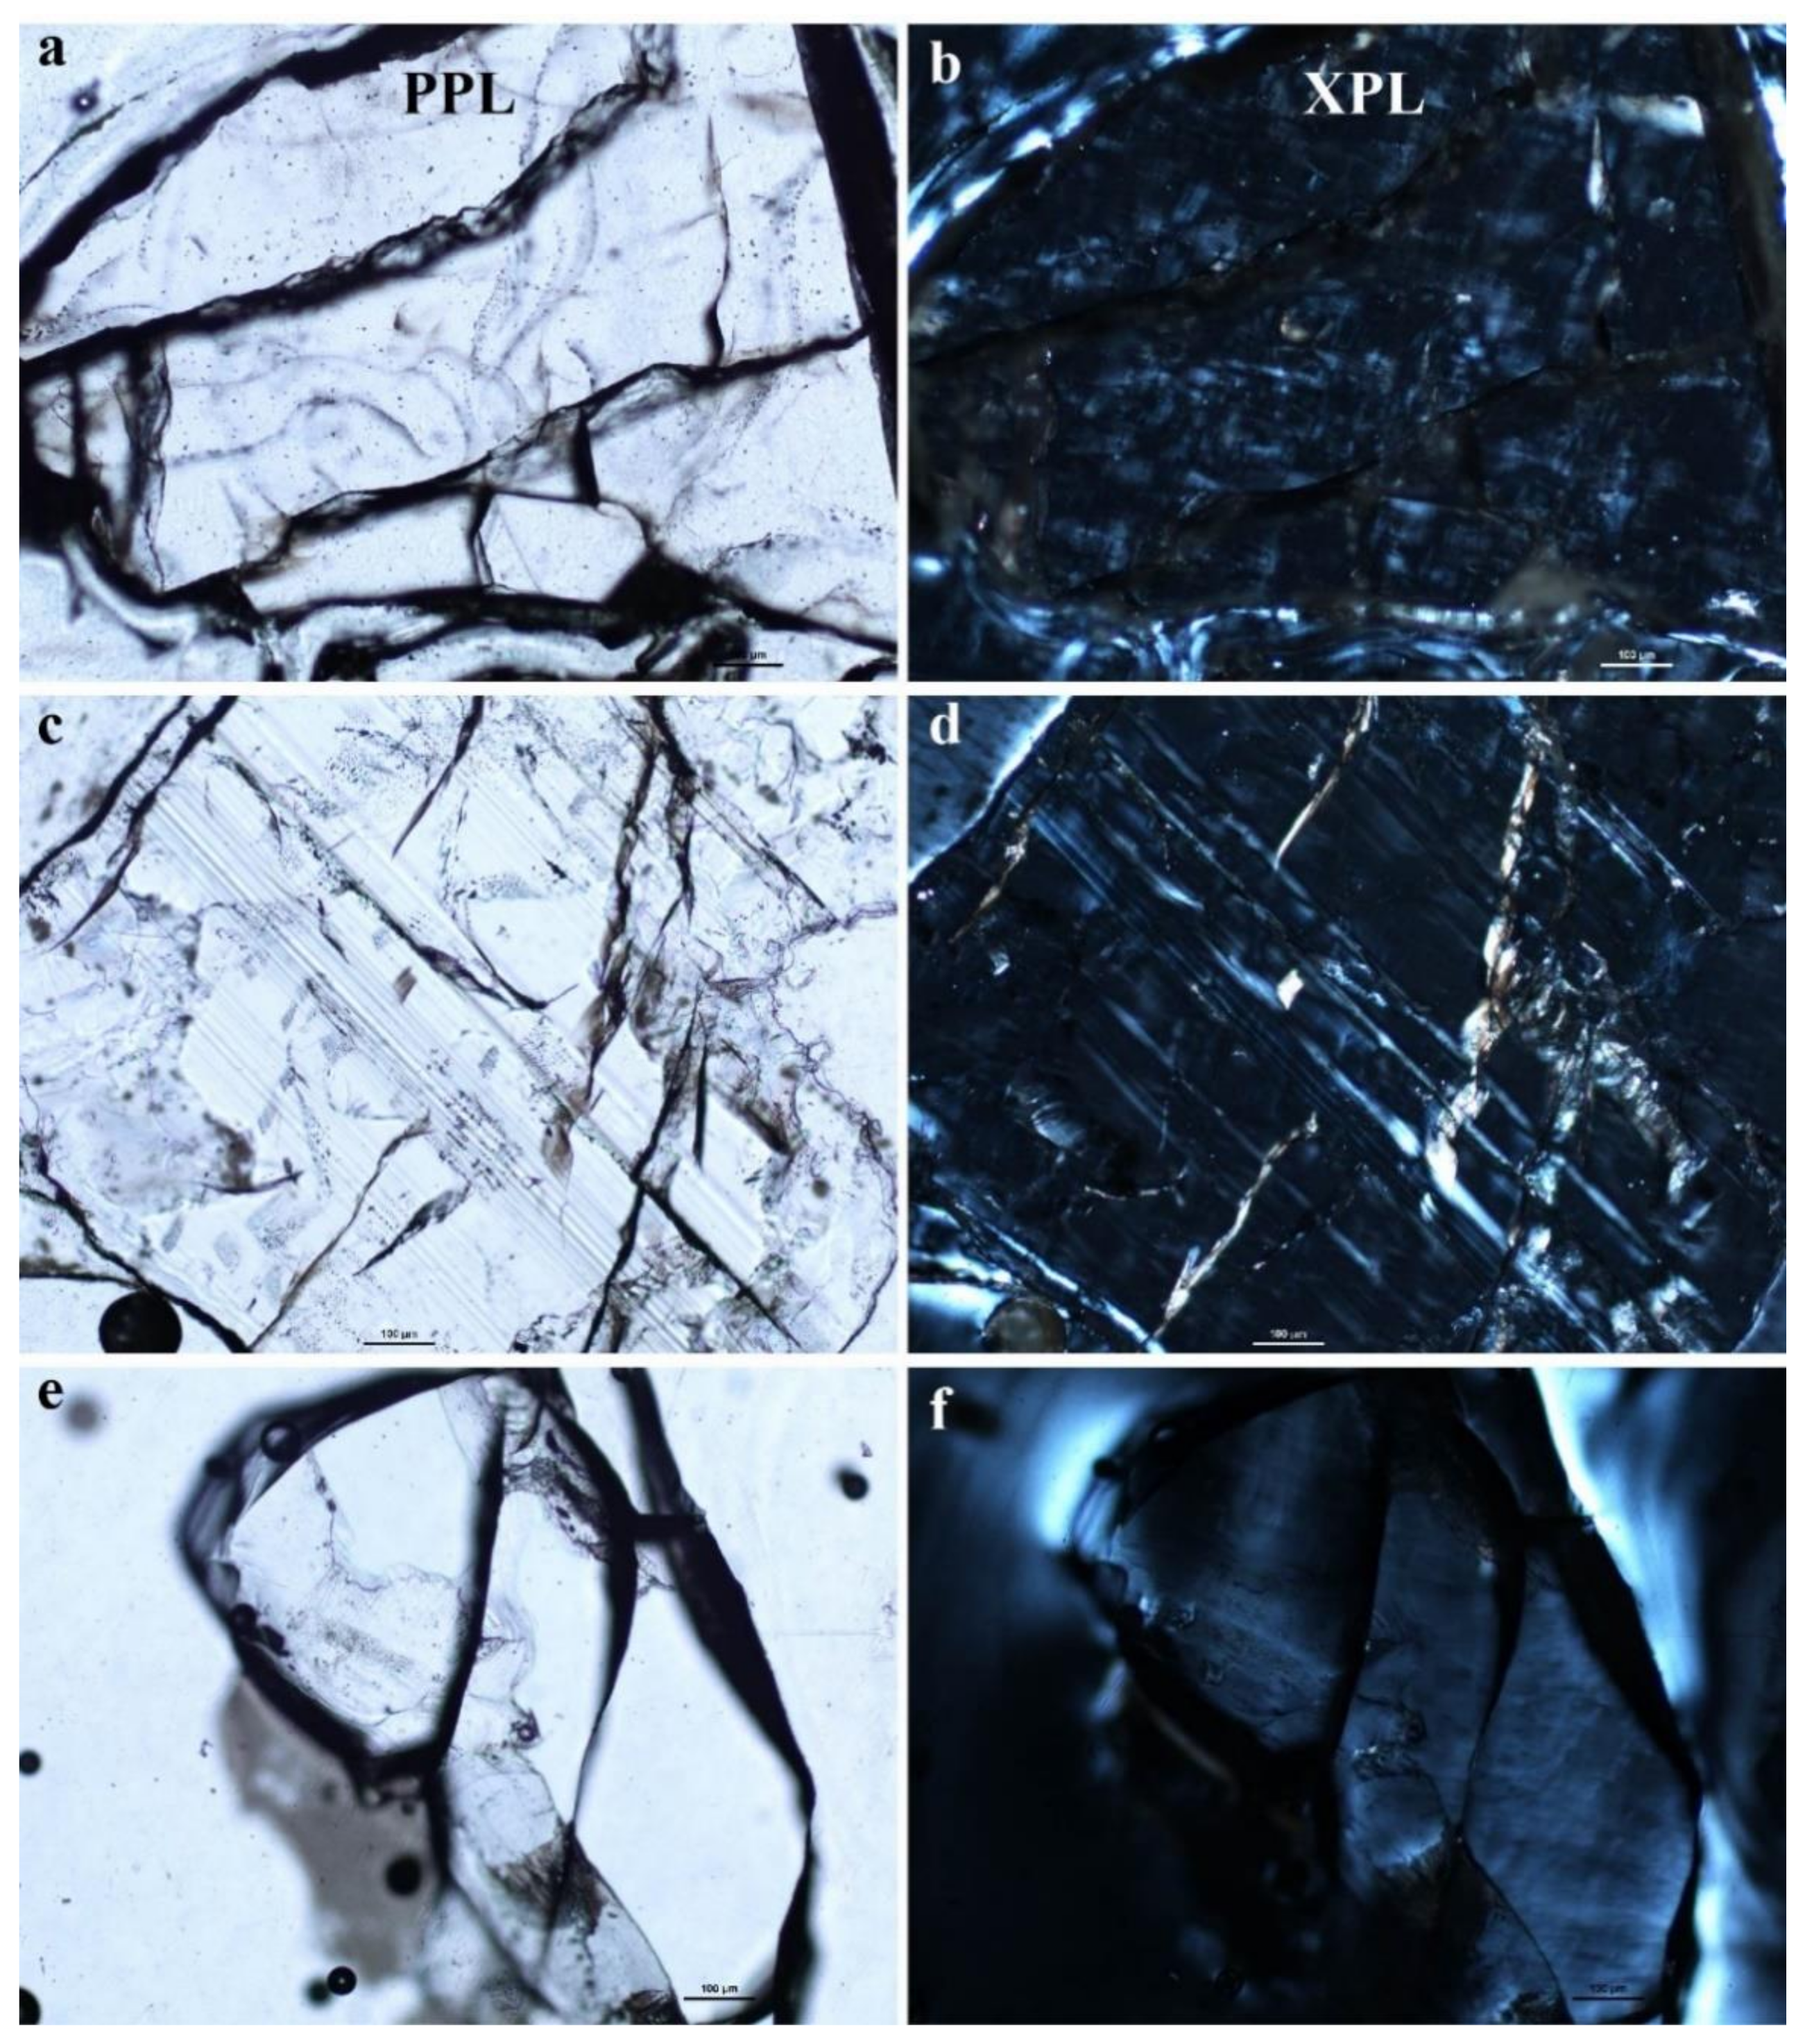
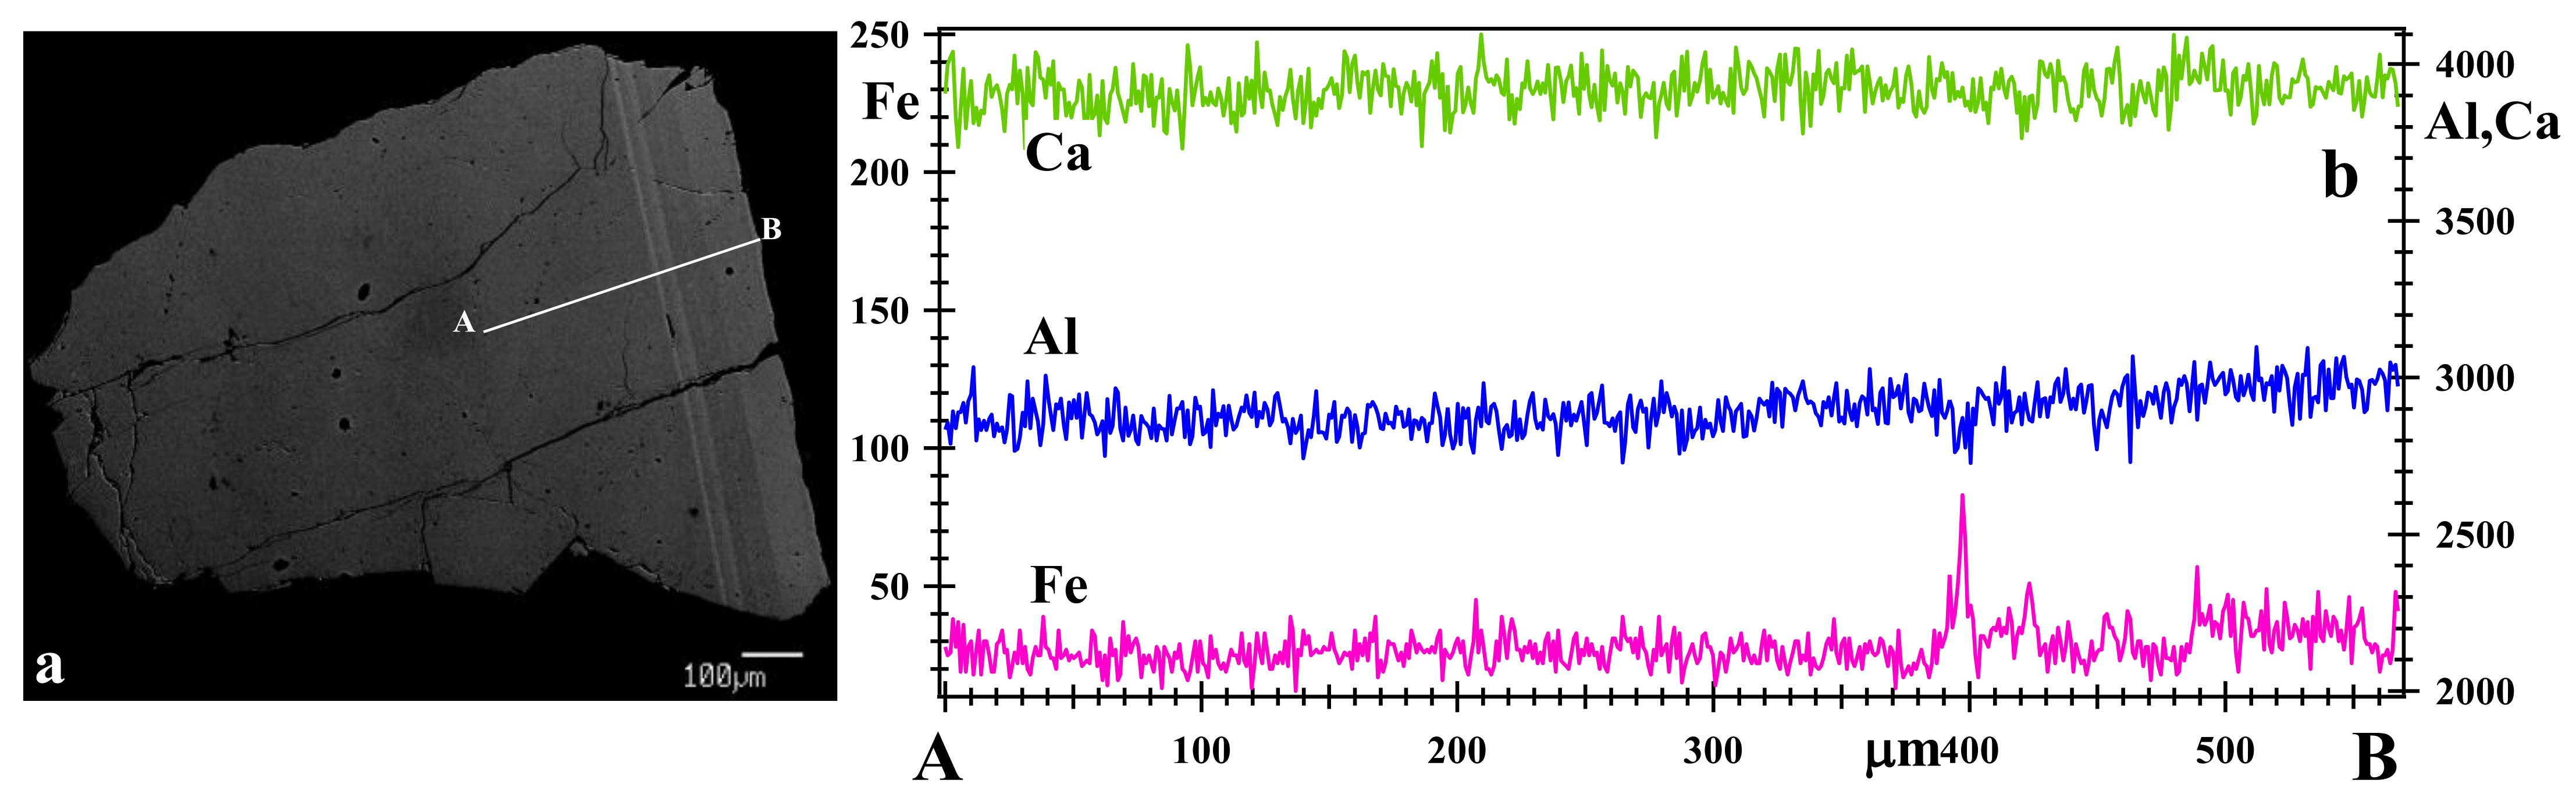
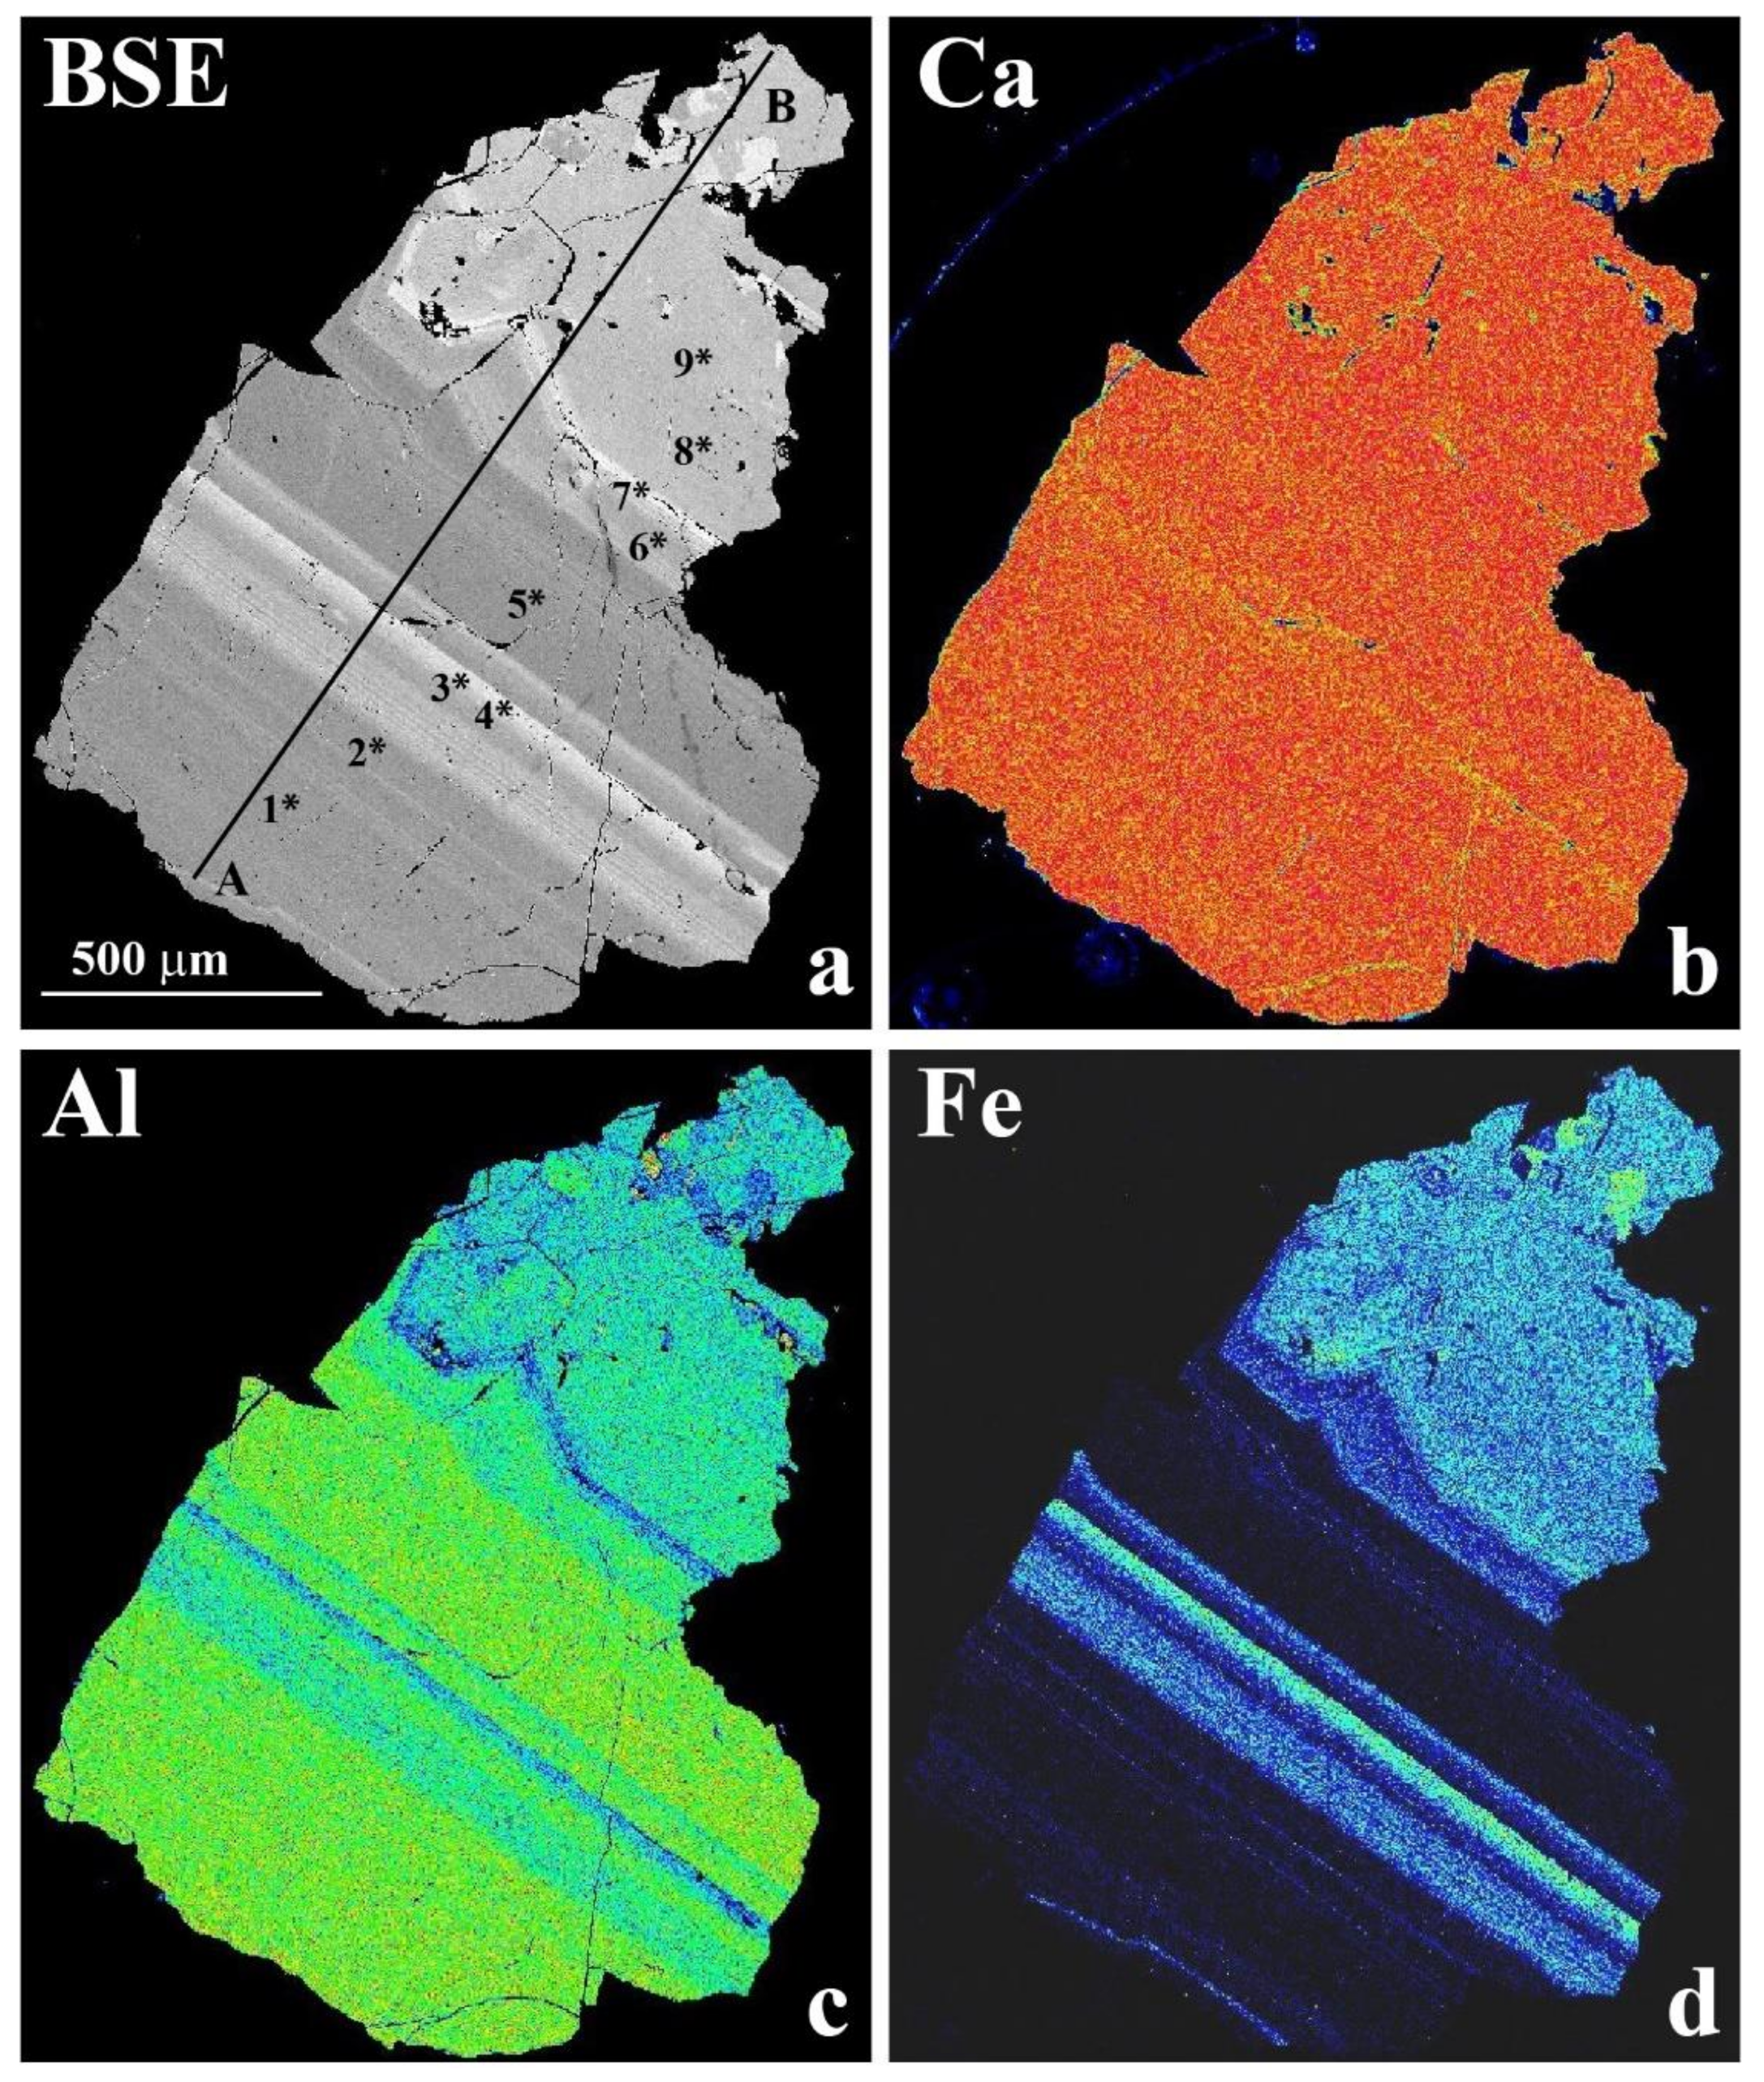
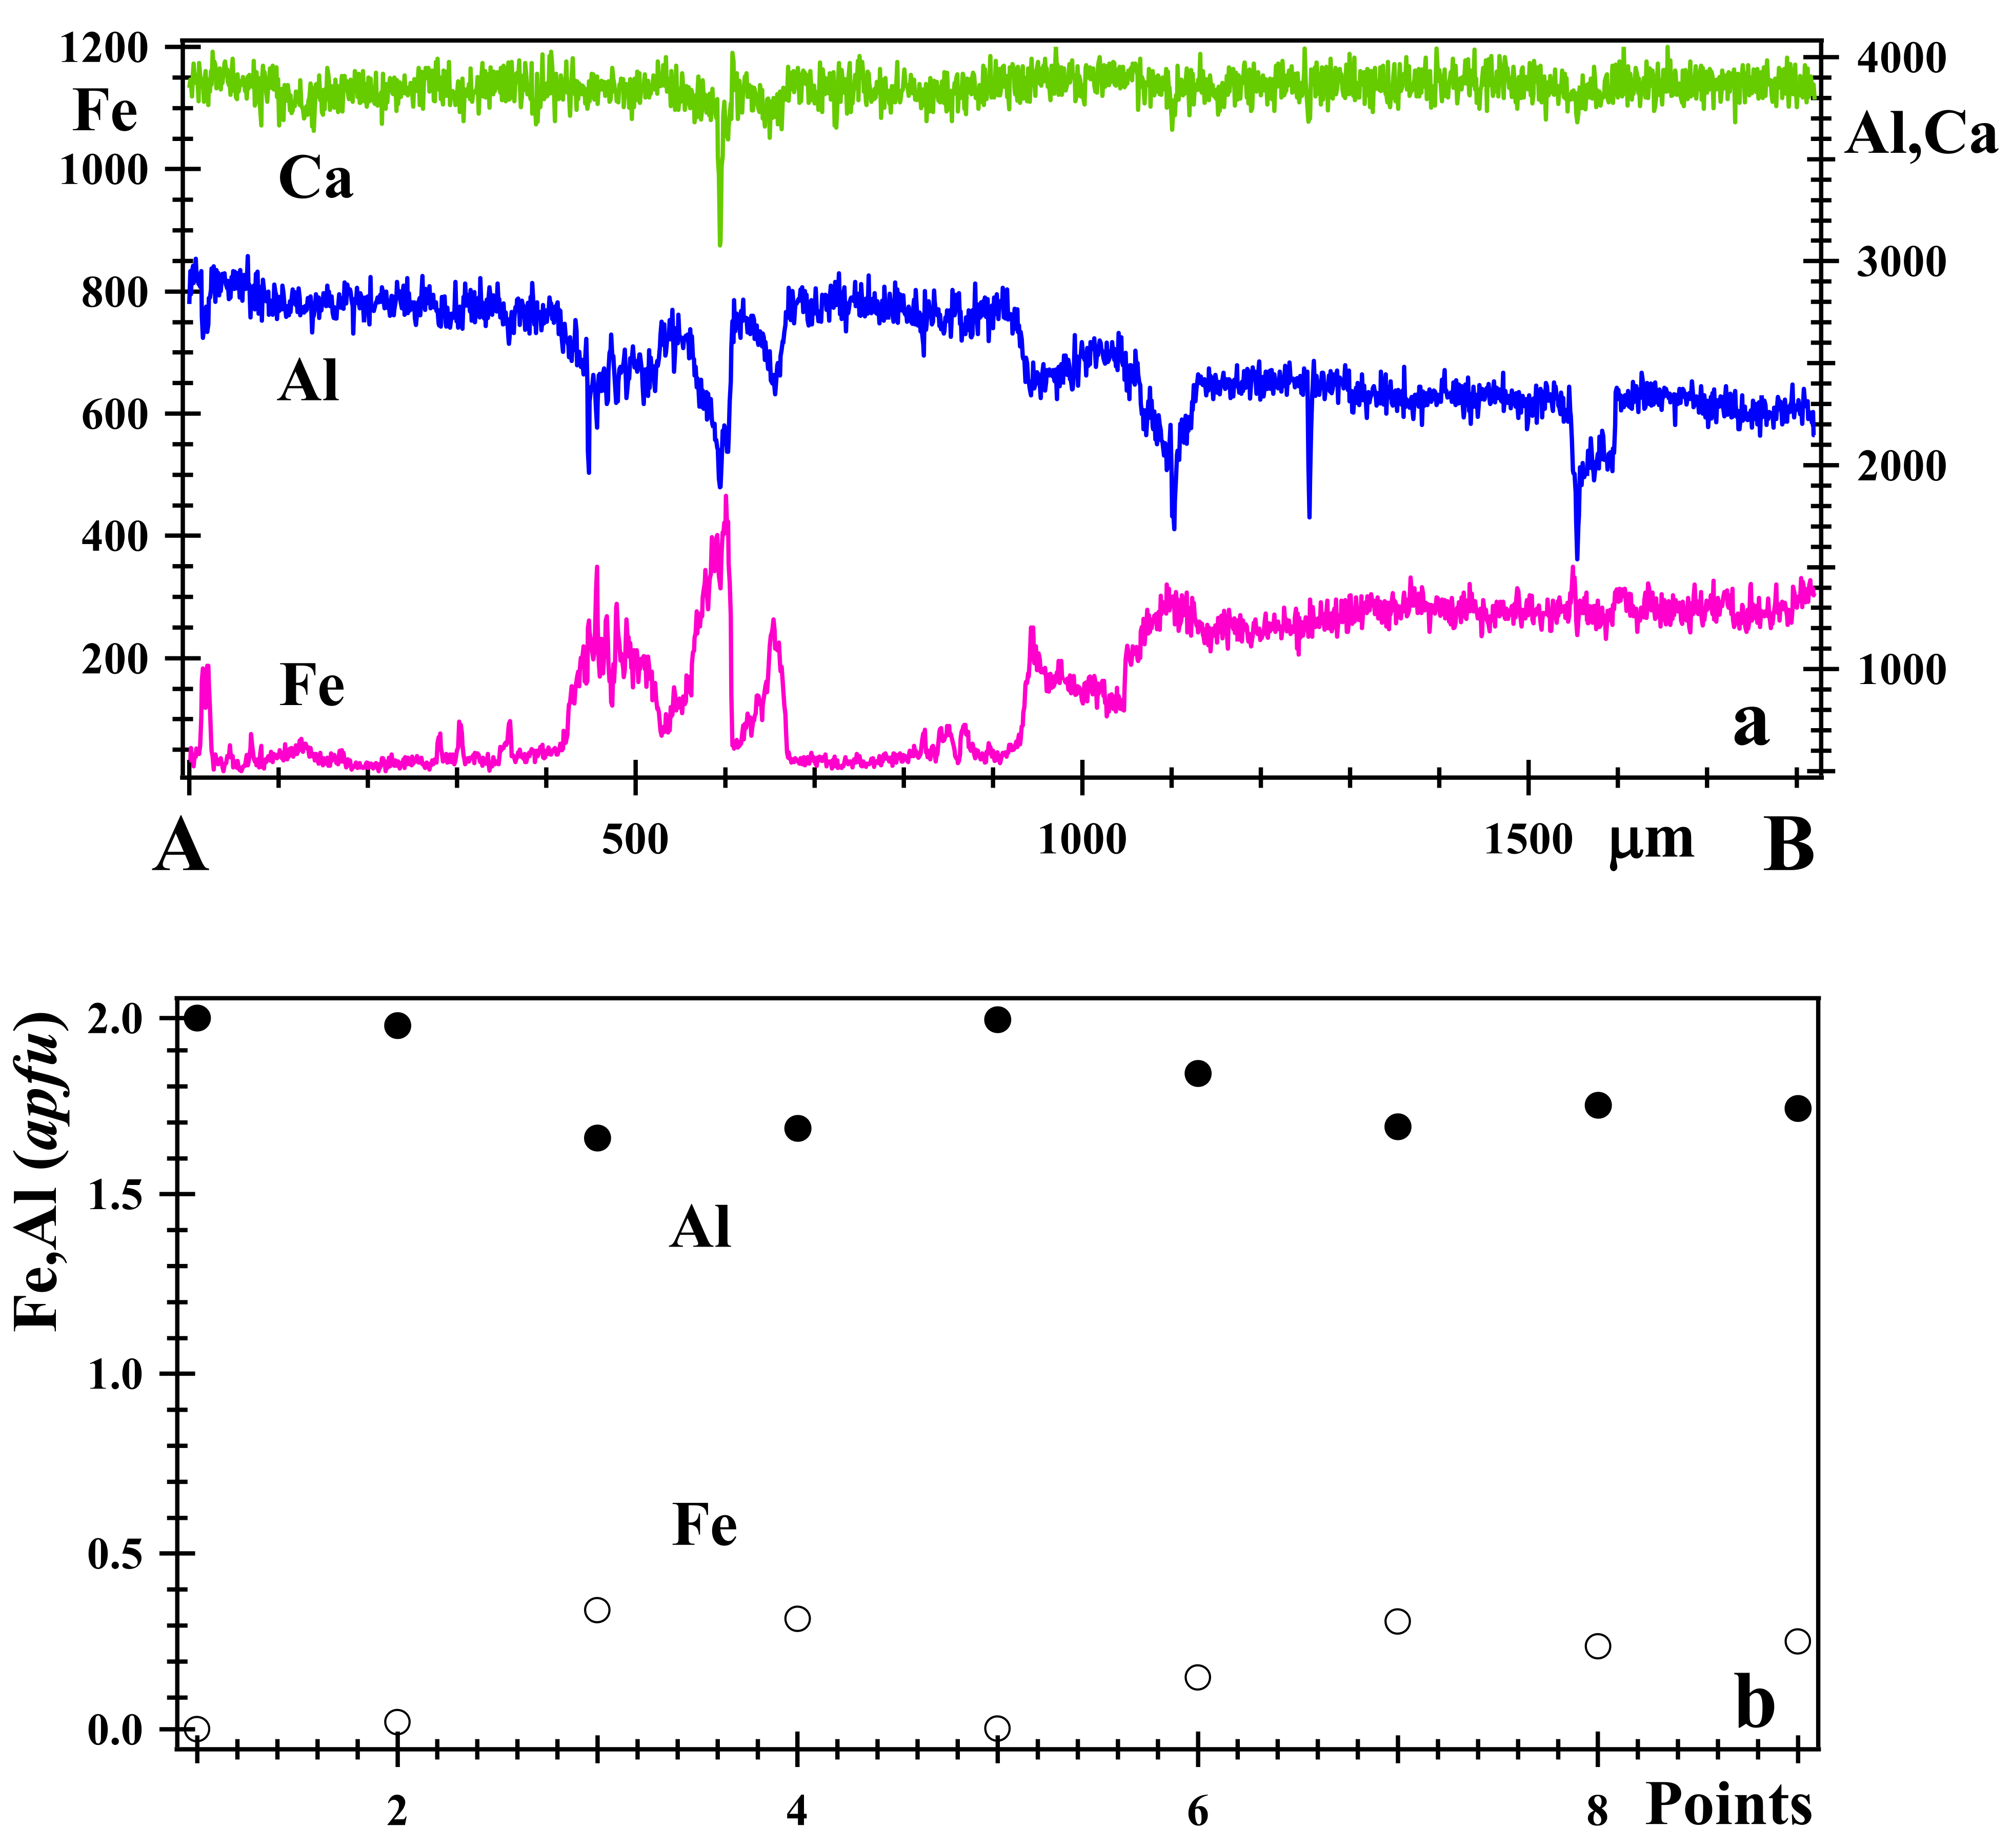
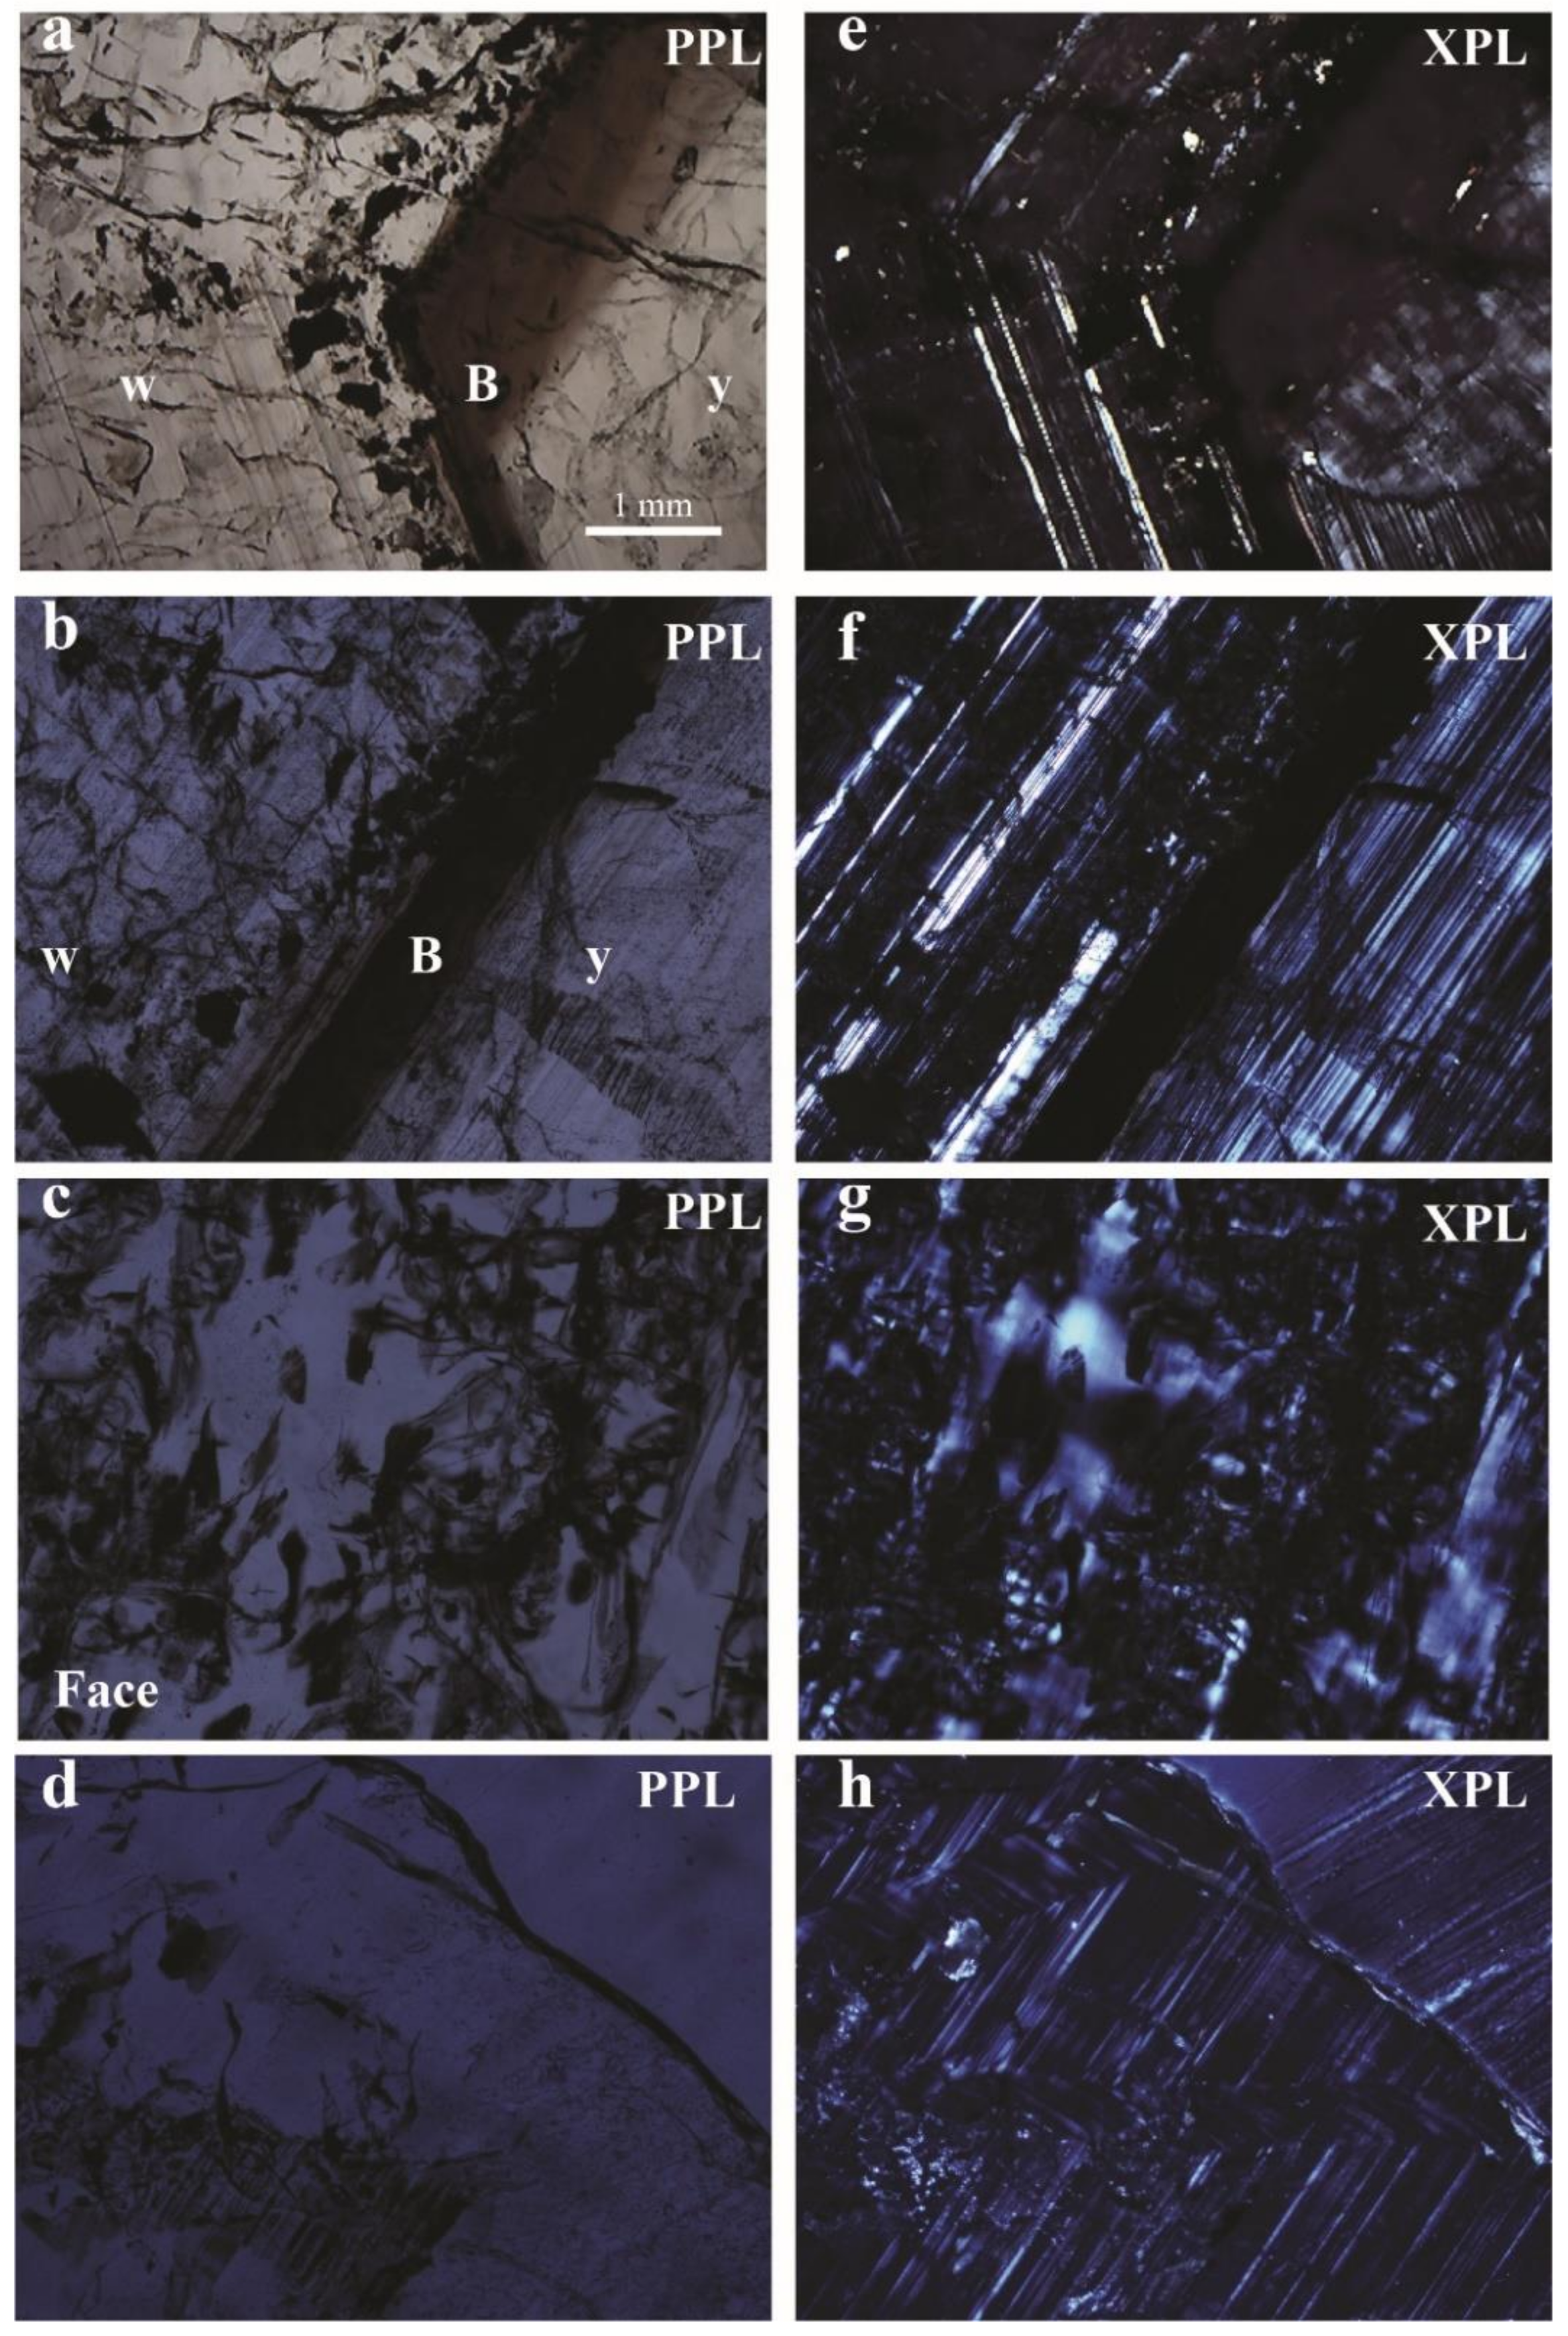
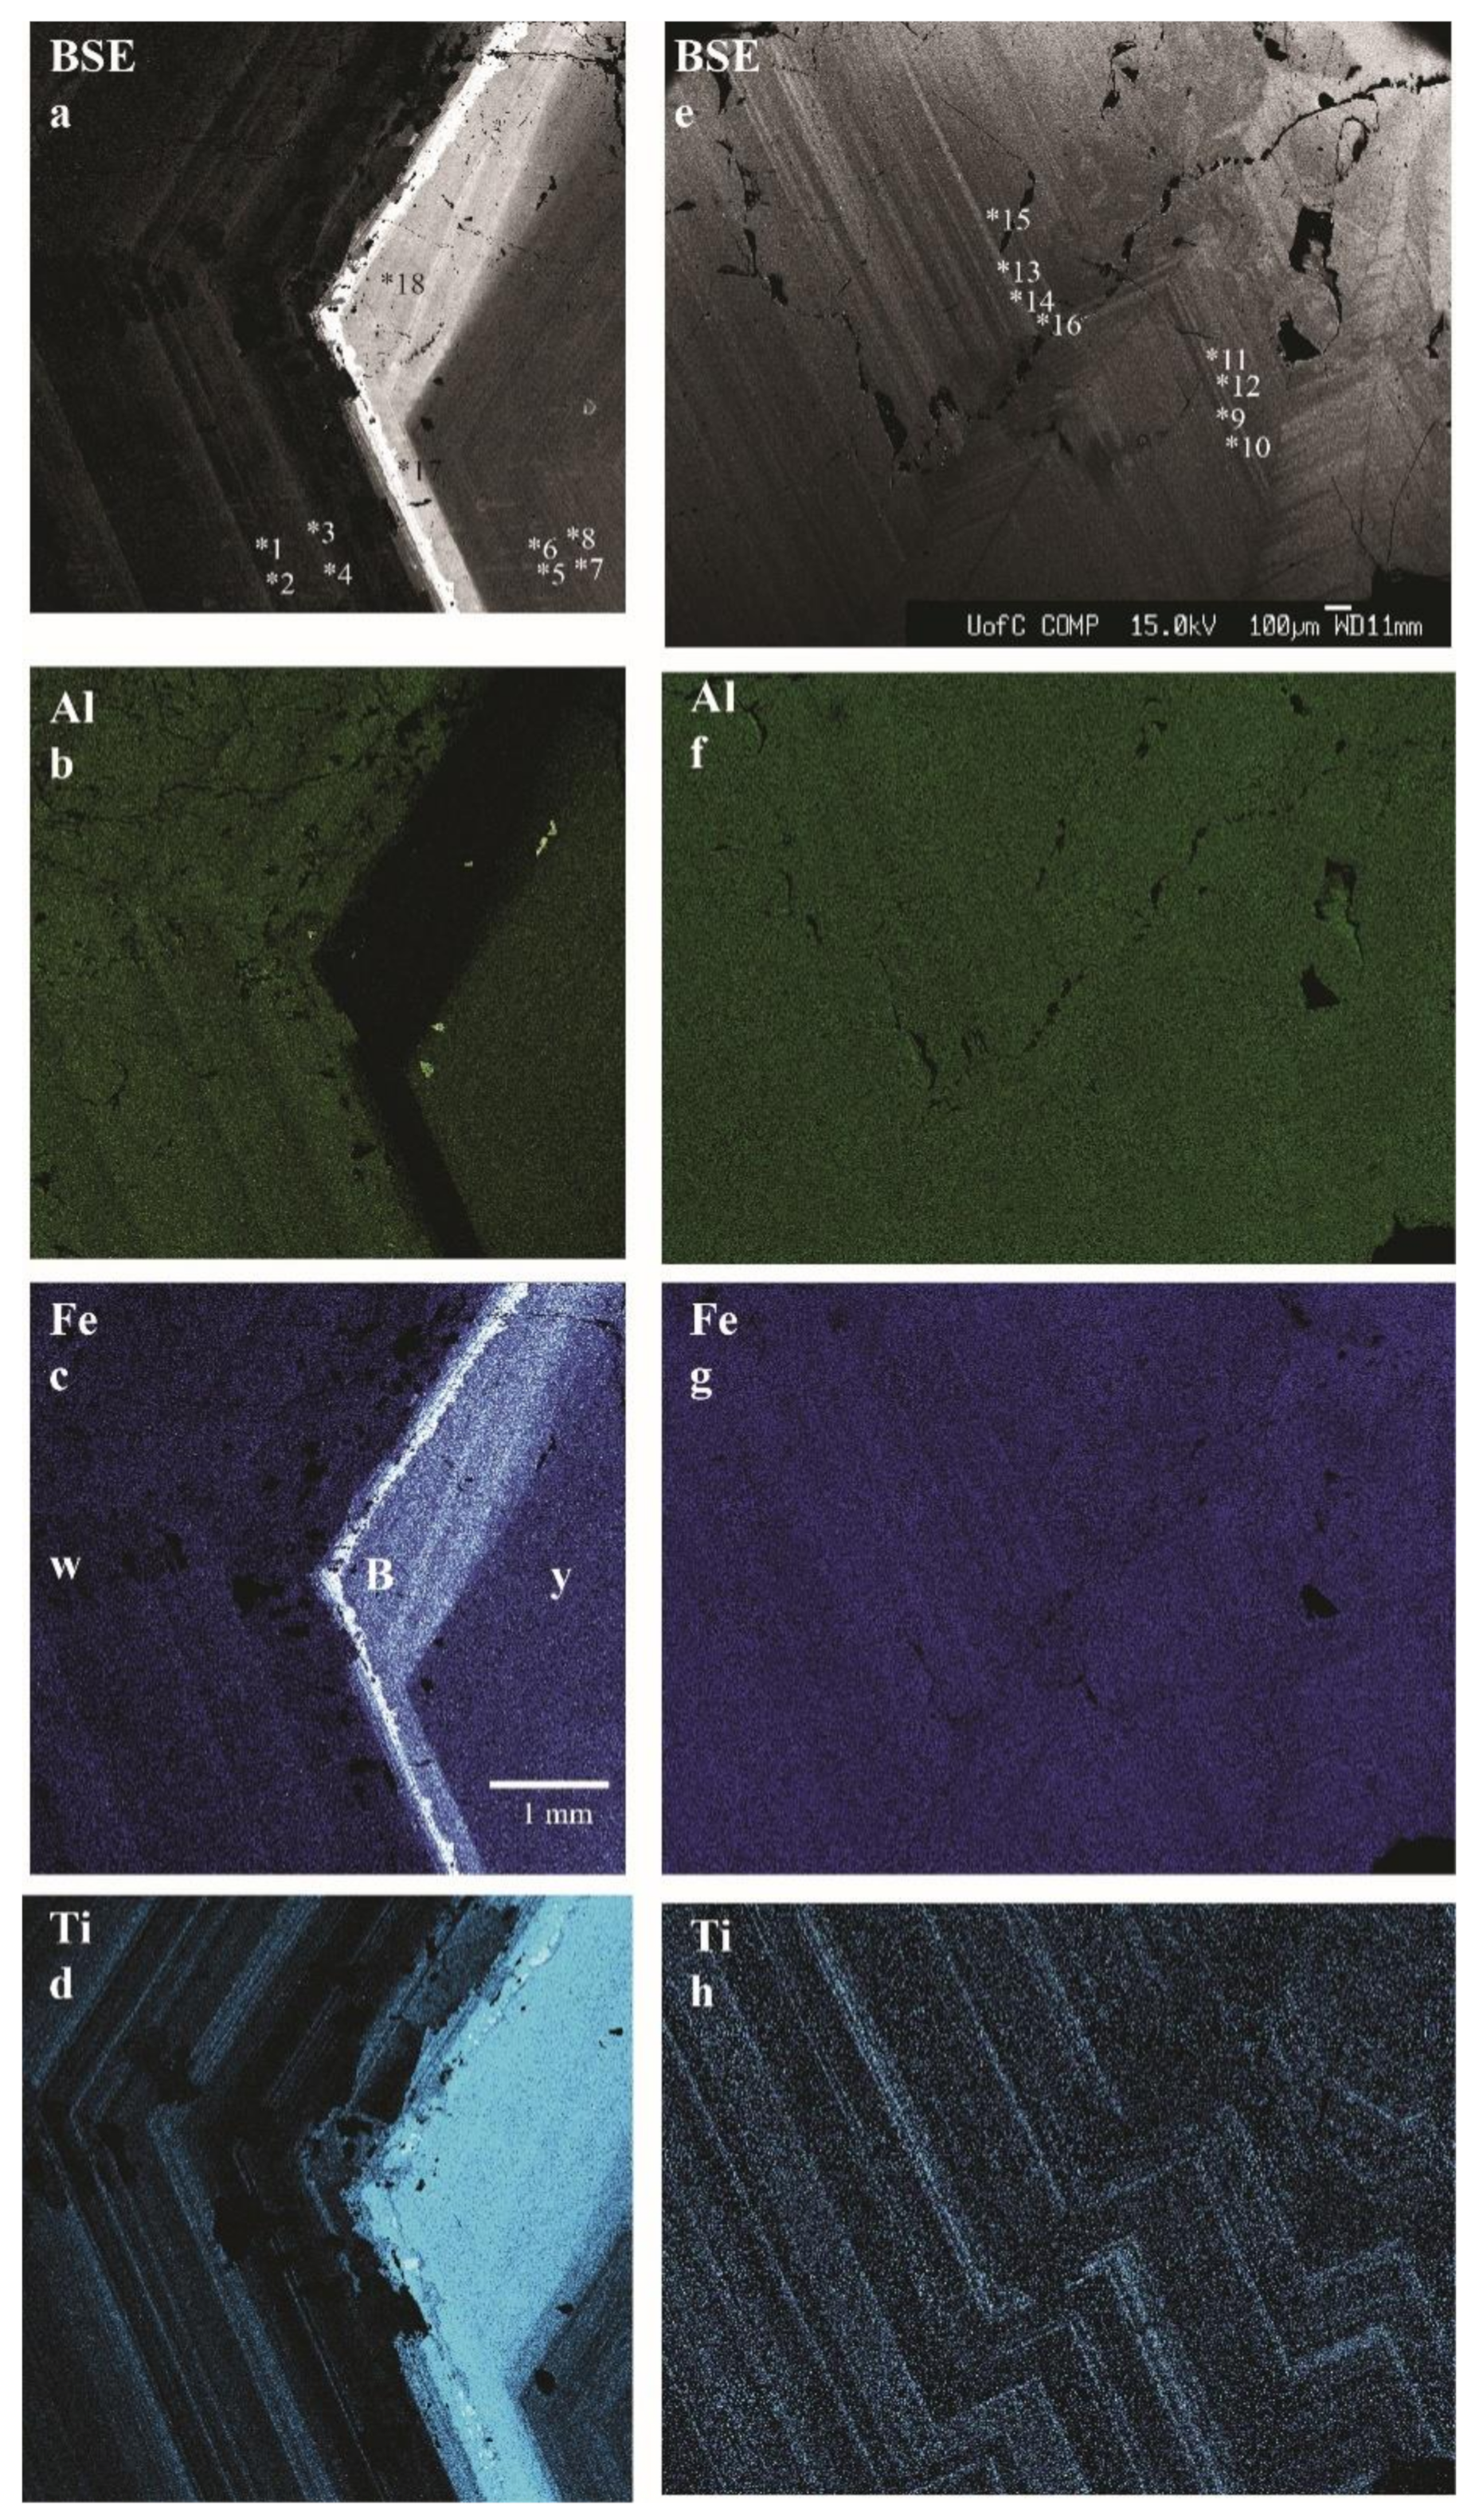
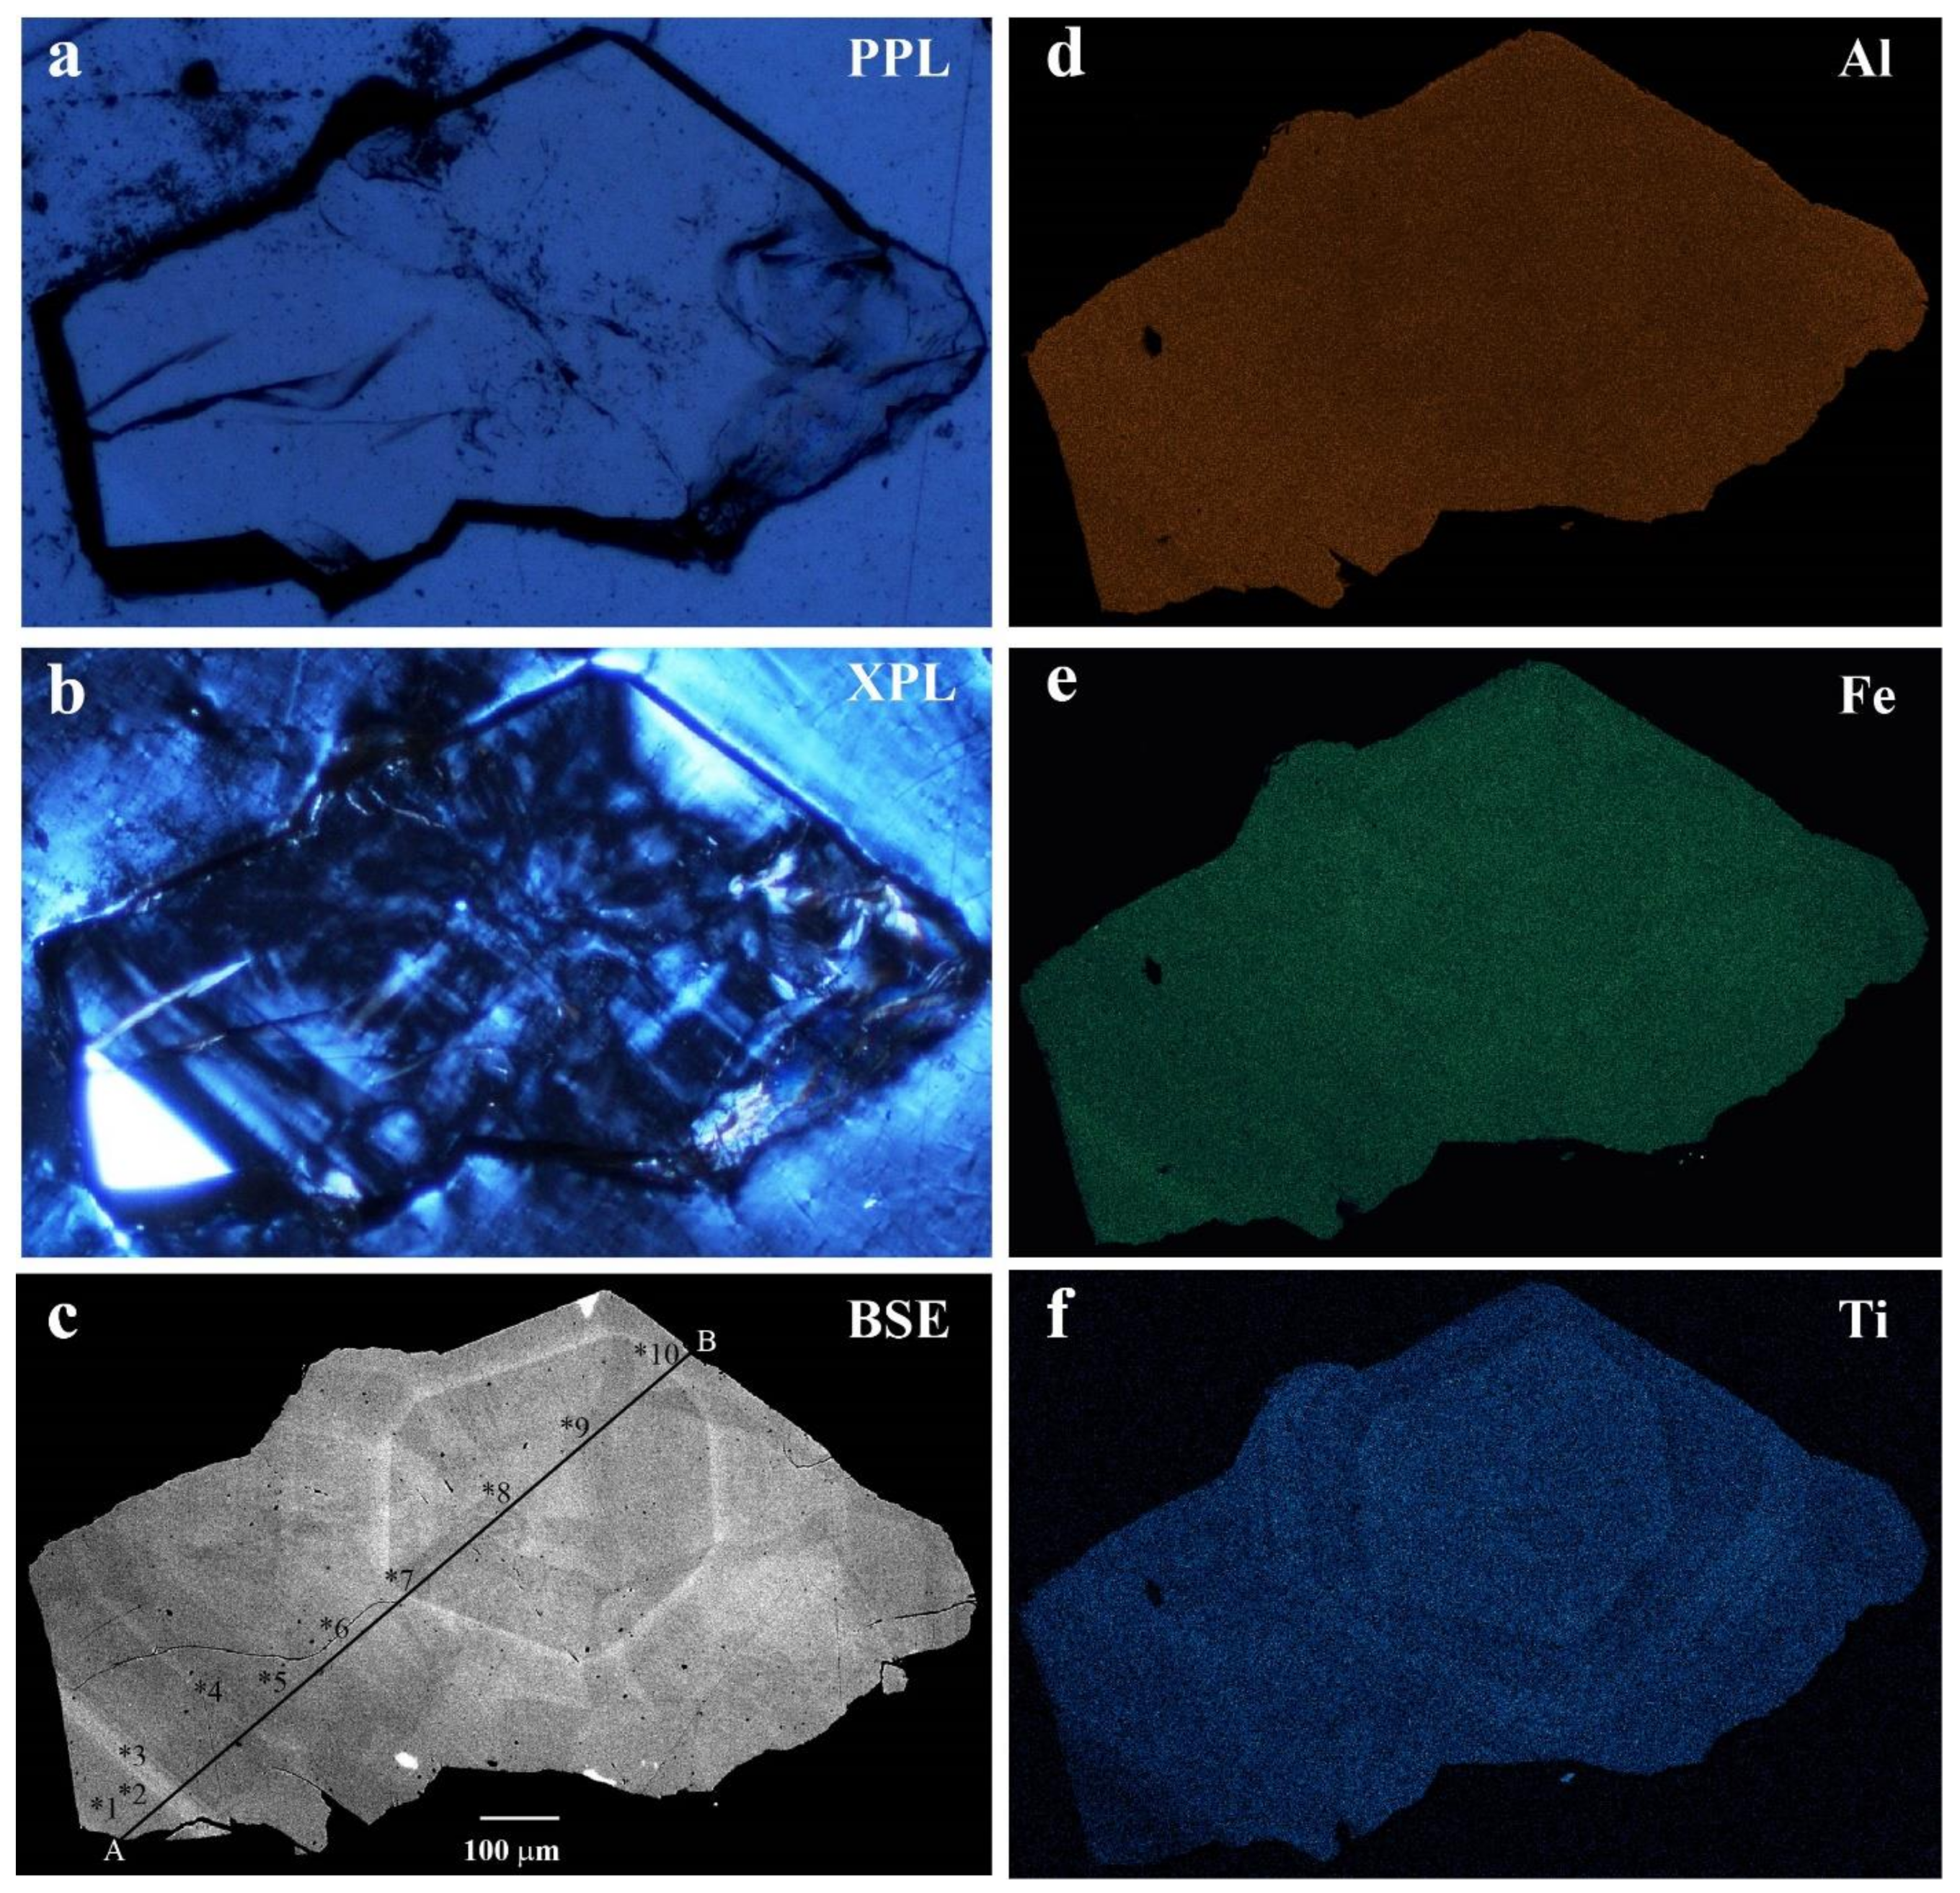
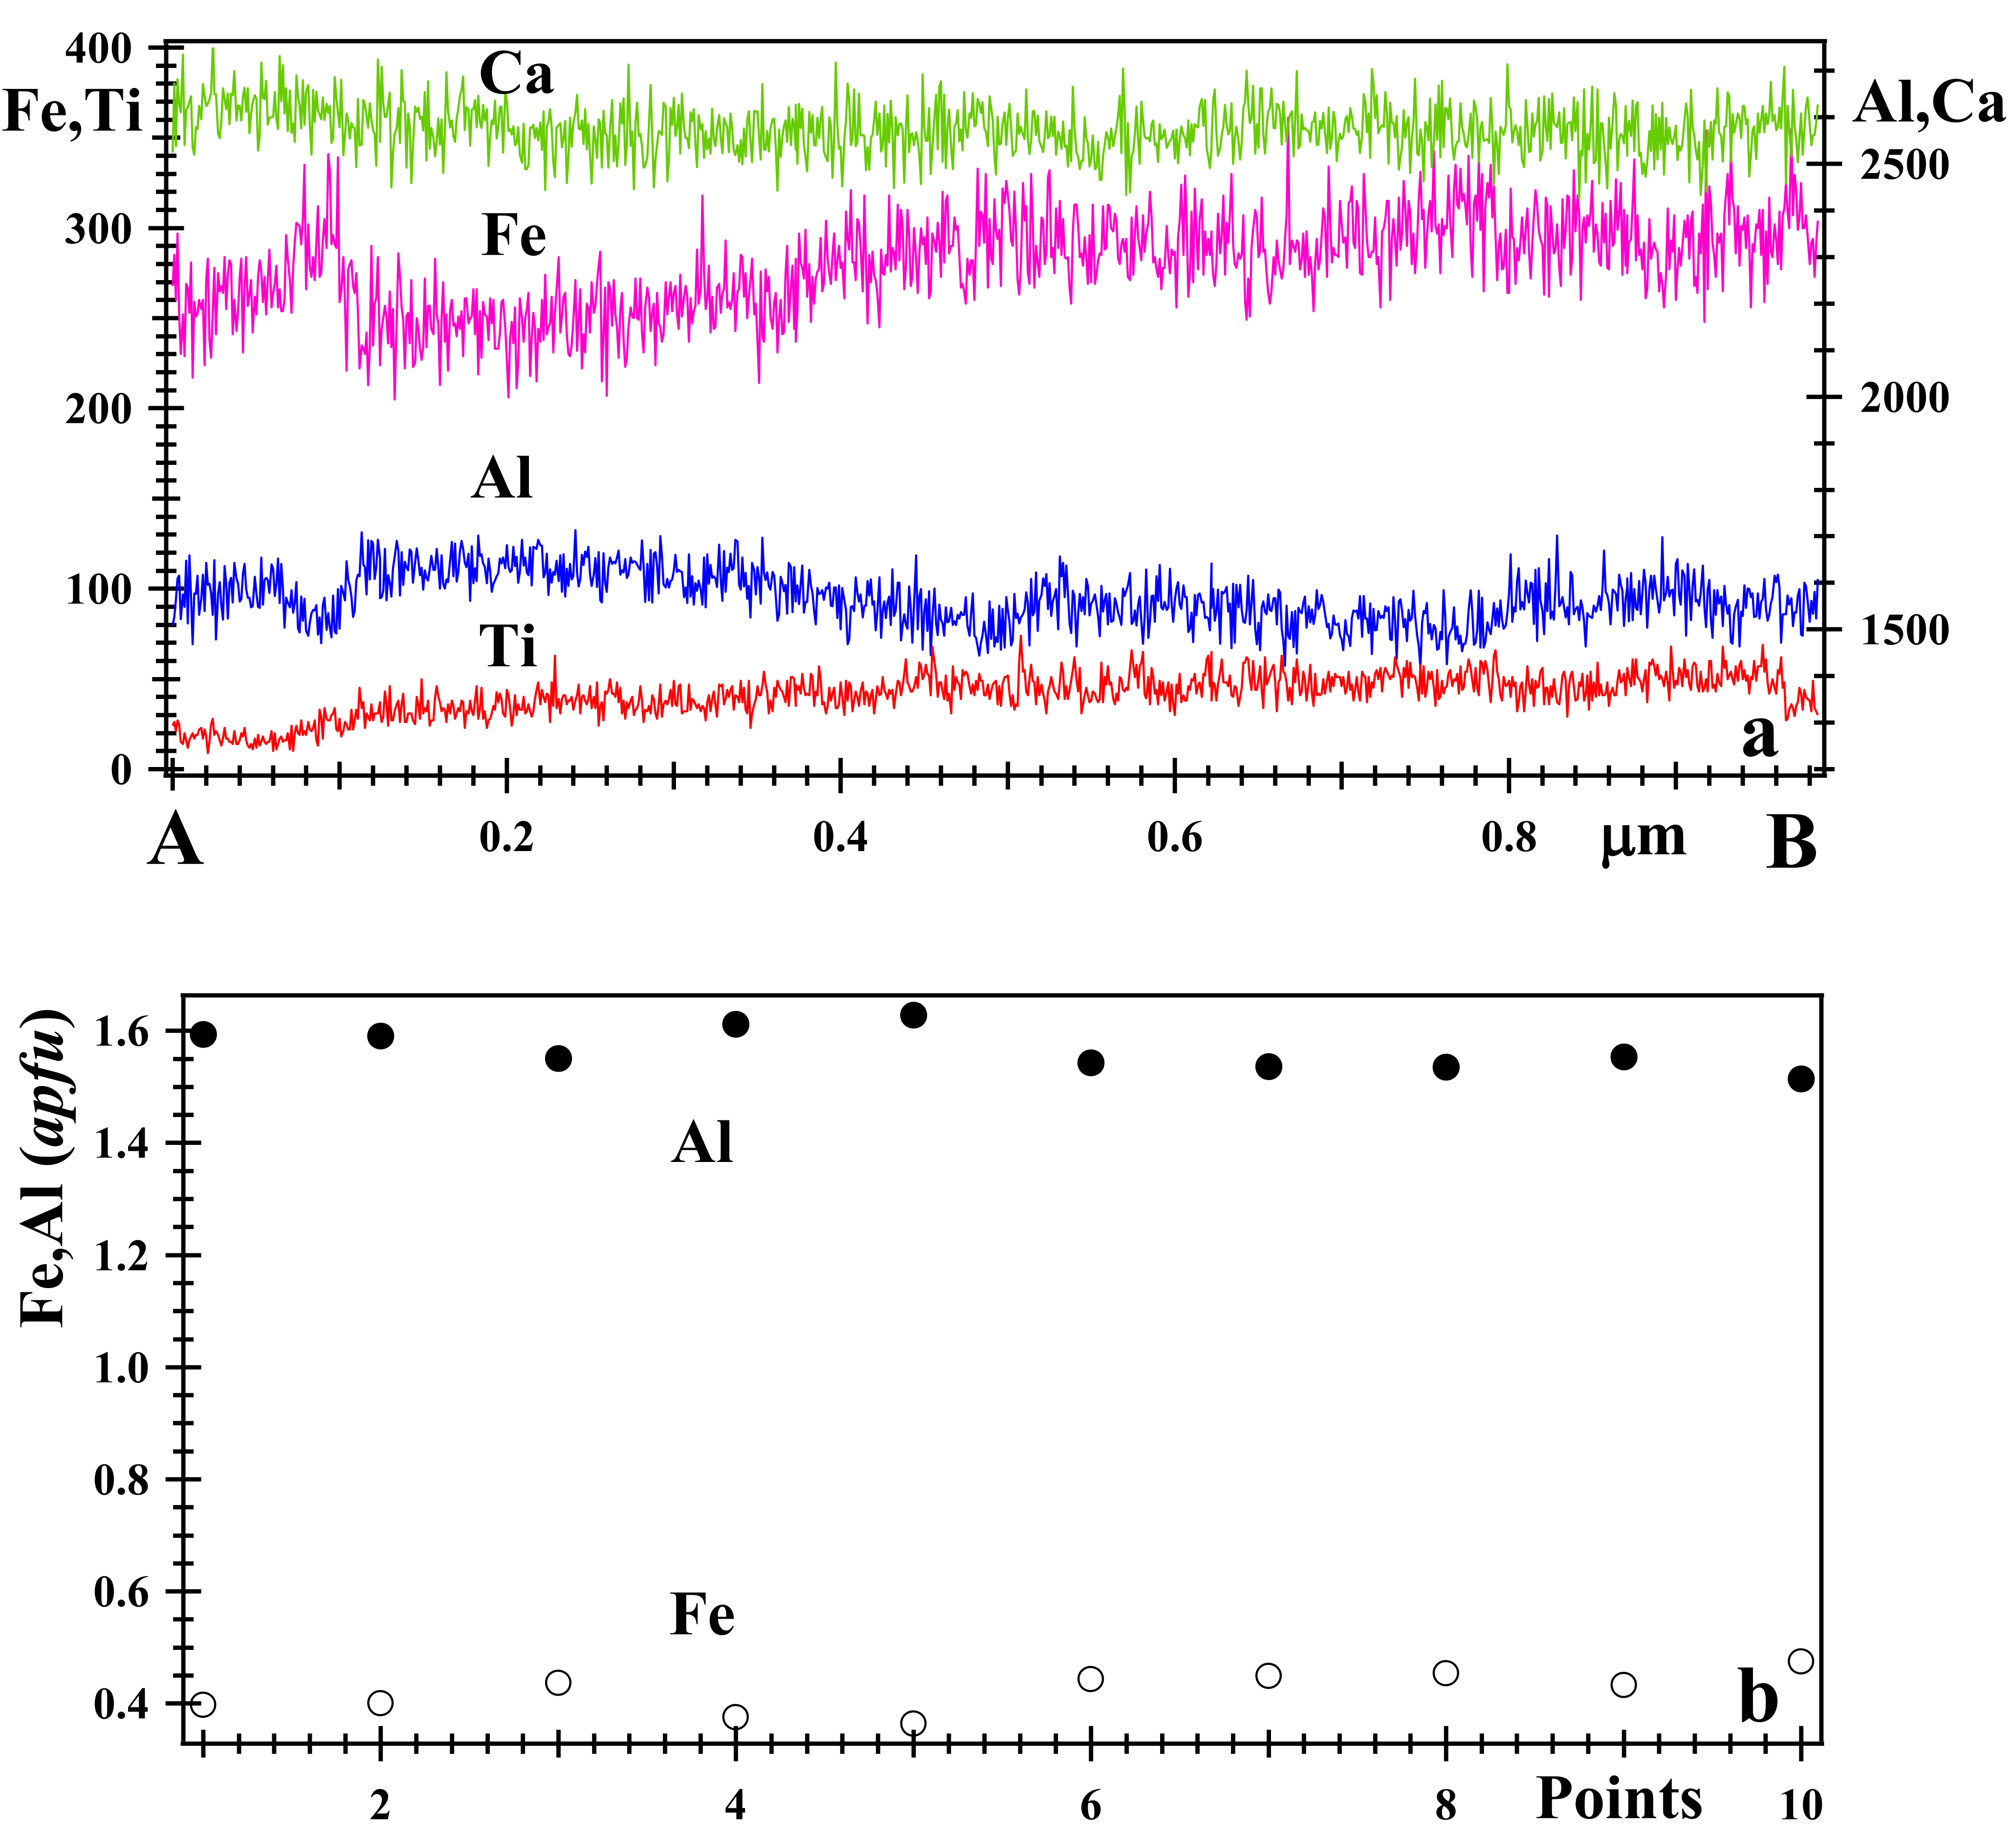
3.2. Optical Light Microscopy, Backscattered Electron (BSE) Images and X-ray Elemental Maps

Samples-1 and -2 are single cubic phases that are optically isotropic and chemically homogeneous. Samples-1 and -2 show no contrast variations in optical micrographs or BSE images. However, the other samples are birefringent and some contain lamellar features or zoning (Figure 3 and Figure 4).
The two-phase birefringent grossular samples in this study have compositional variations (Table 1), and different Y(sofs; Table 3) as indicated by line scans, BSE images, and elemental maps. The BSE image for the sample-3 shows sharp linear features and the line scan shows an inverse relation between Fe and Al atoms (Figure 5). Average compositions were reported for grossular samples from Coahuila, Mexico [2]. They observed optical anisotropy in the form of birefringence and little compositional heterogeneity or zonation, and reported an average composition of {Ca2.94Mg0.08Mn2+0.10}3.12[Al1.90Fe3+0.05Mn3+0.01]1.96(Si2.97)O12, which is similar to sample-3 from the same area.
Sample-4 from Chihuahua, Mexico clearly shows two separate phases with sharp contact boundaries (Figure 6). Line scans and cation content across the separate phases that occur as lamellar features (Figure 7a,b) show that the Al3+ and Fe3+ cations are inversely correlated. The elemental maps for sample-4 clearly indicate two separate phases that contain different amounts of Al3+ and Fe3+ cations (Figure 6b–d), whereas Ca atoms are distributed homogeneously throughout the crystal (Figure 6b). Chemical analyses from specific points (points 1 to 9 shown in Figure 6a and Figure 7b) indicate the composition of the different phases. The compositions that represent phase-4a and phase-4b are given in Table 1.
BSE images and elemental maps from two different areas of the sample-5 are shown in Figure 8. The yellow core (77% Grs), outer white layer (78 to 87% Grs), and the black boundary (44% Adr) between those layers have different compositions. The left column displays both w and y parts of grossular separated by B, which is andradite (Figure 8c). The right column displays only the white part of the crystal. BSE images and their corresponding elemental maps show variations in Al, Fe, and Ti contents. Chevron zig-zag features are clearly observed in Figure 8e,h.
Sample-6 from Aosta, Italy, appears homogeneous in plane-polarized light (PPL) and is birefringent in cross-polarized light (XPL; Figure 9a,b). The BSE image contains concentric growth features with light and dark contrasts that indicate slightly different compositions (Figure 9c). The brighter areas (higher mean atomic number) correspond to Fe-rich grossular, whereas the darker areas (lower mean atomic number) correspond to Al-rich grossular, ideally Ca3Al2Si3O12. The X-ray elemental maps show the distribution of Al, Fe, and Ti atoms, and subtle variations are observed, especially for Ti atoms (Figure 3d–f). Quantitative chemical analyses were obtained with EPMA from the points marked 1 to 10 (Figure 3c; Table 1). The scans along the line AB show an inverse relation between Fe3+ and Al3+ cations, homogeneous Ca, and slightly variable Ti distributions (Figure 9c and Figure 10). Two separate compositions may be deduced from the line scans, the elemental maps, and quantitative spot analyses (Table 1).

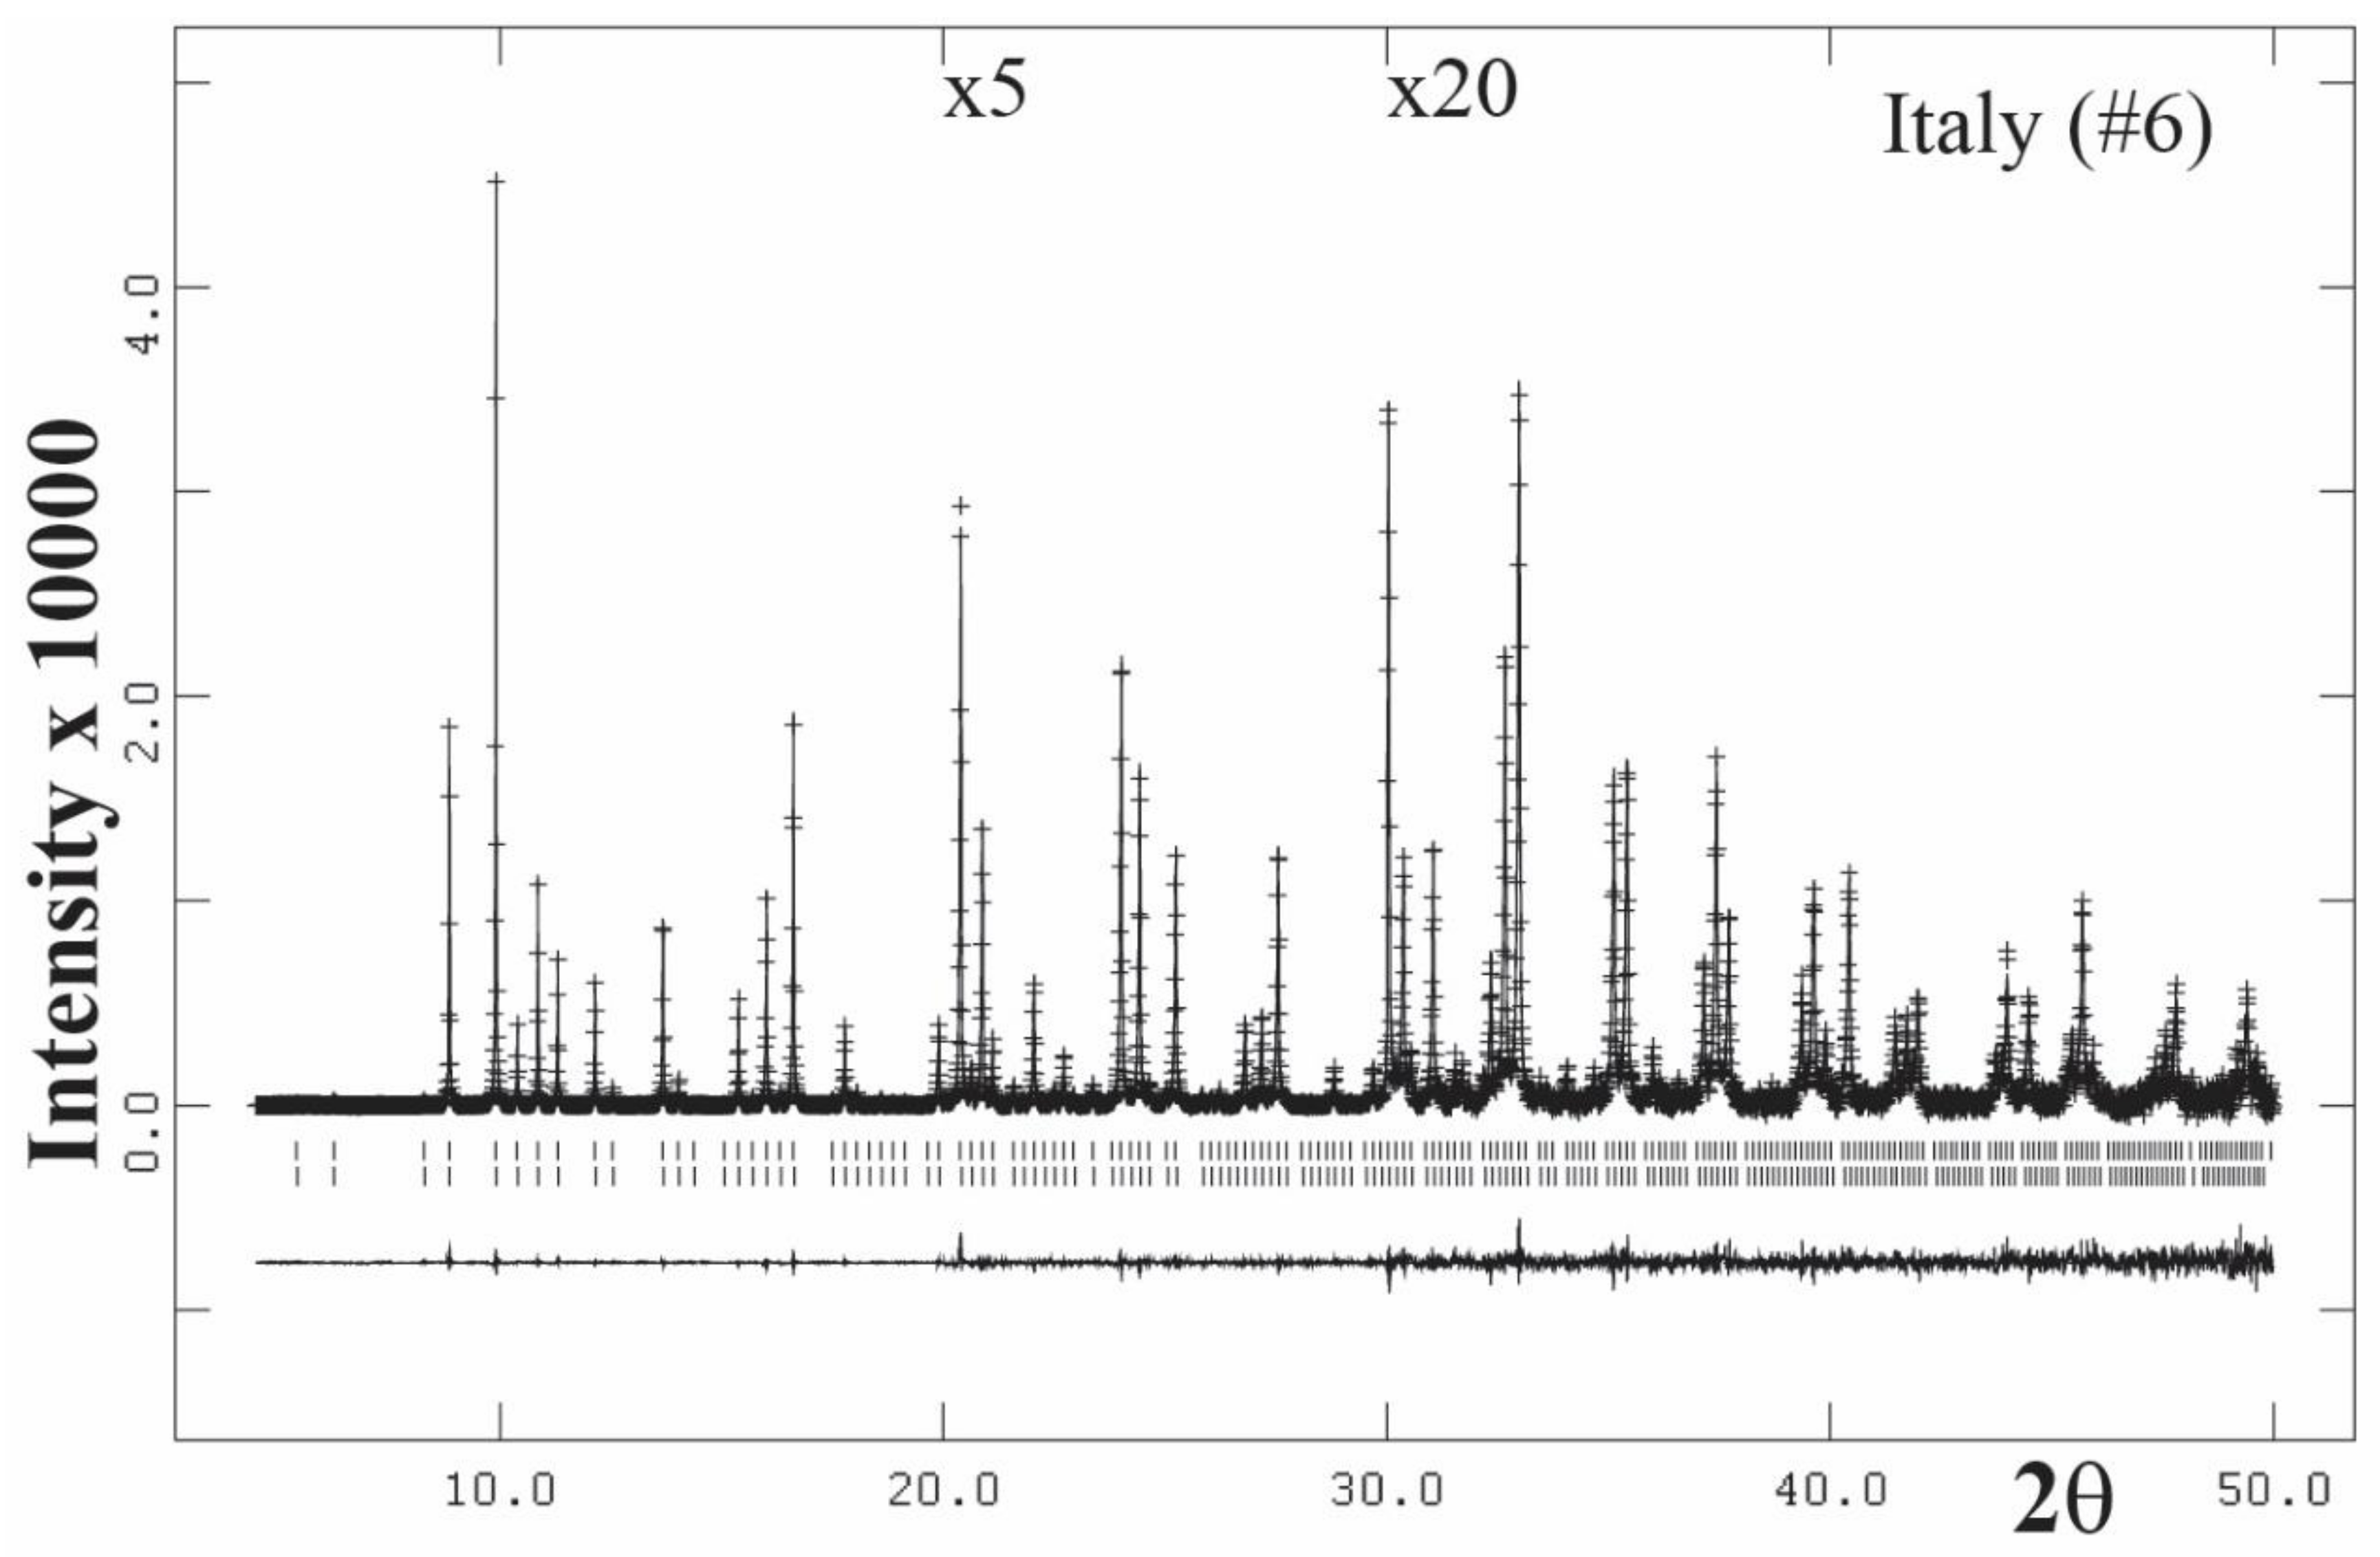
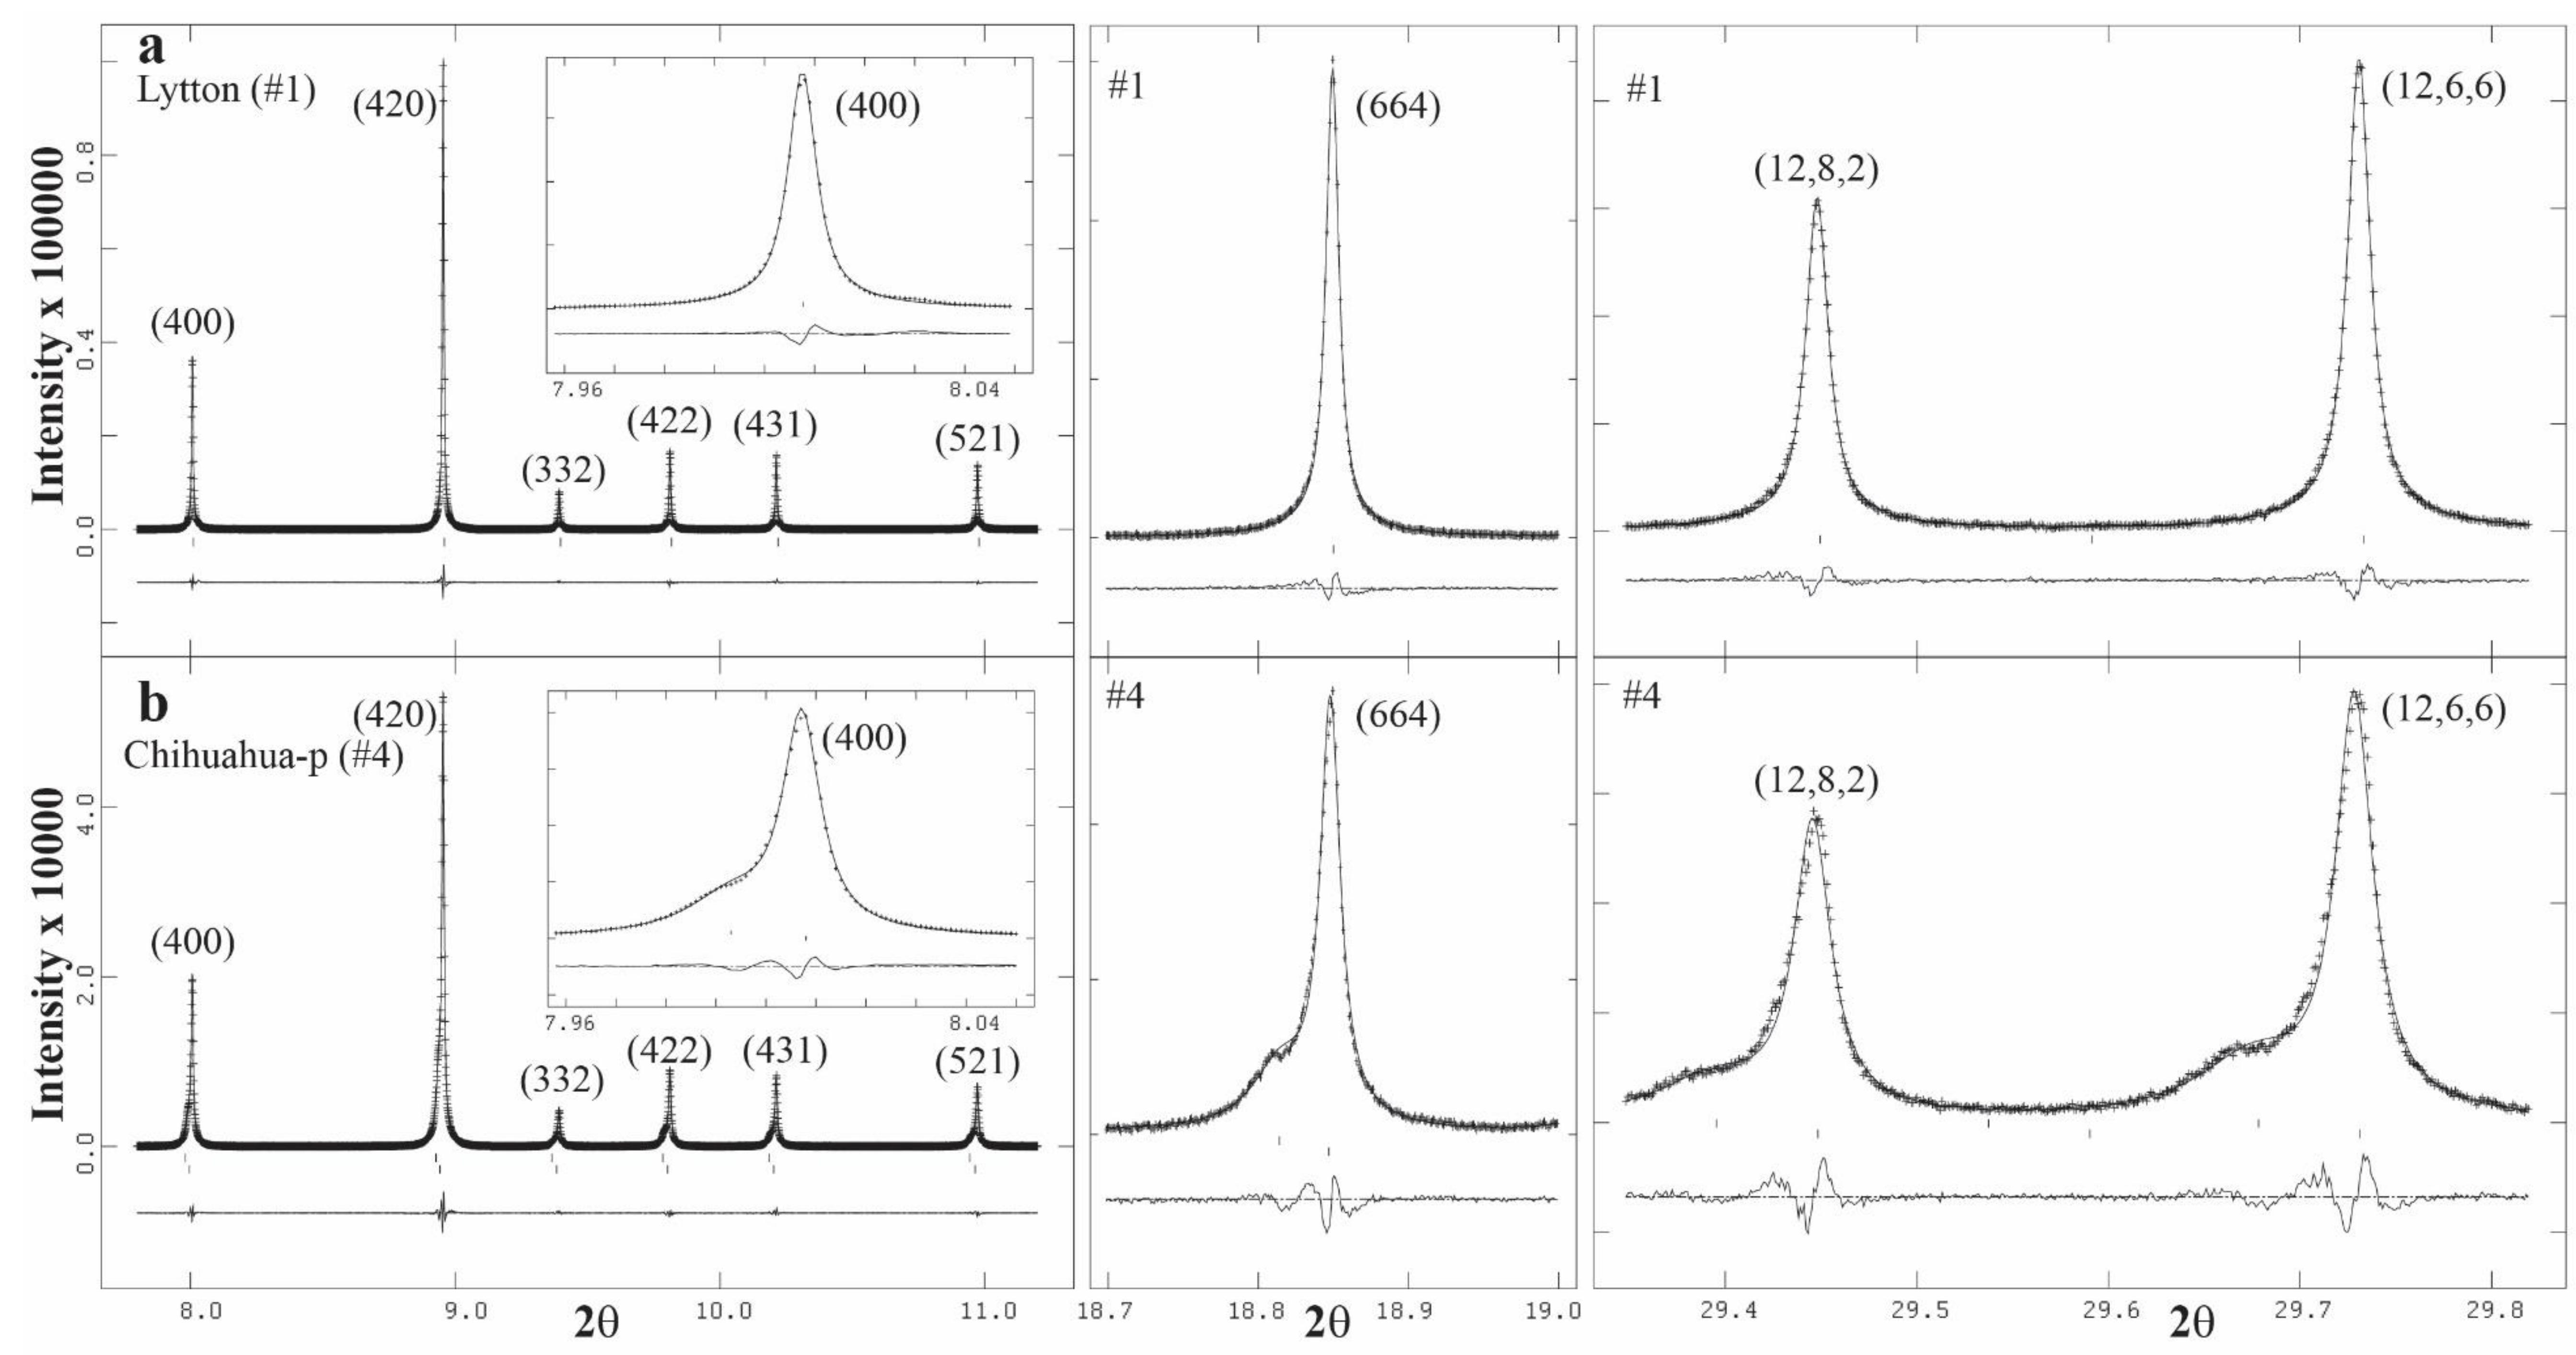
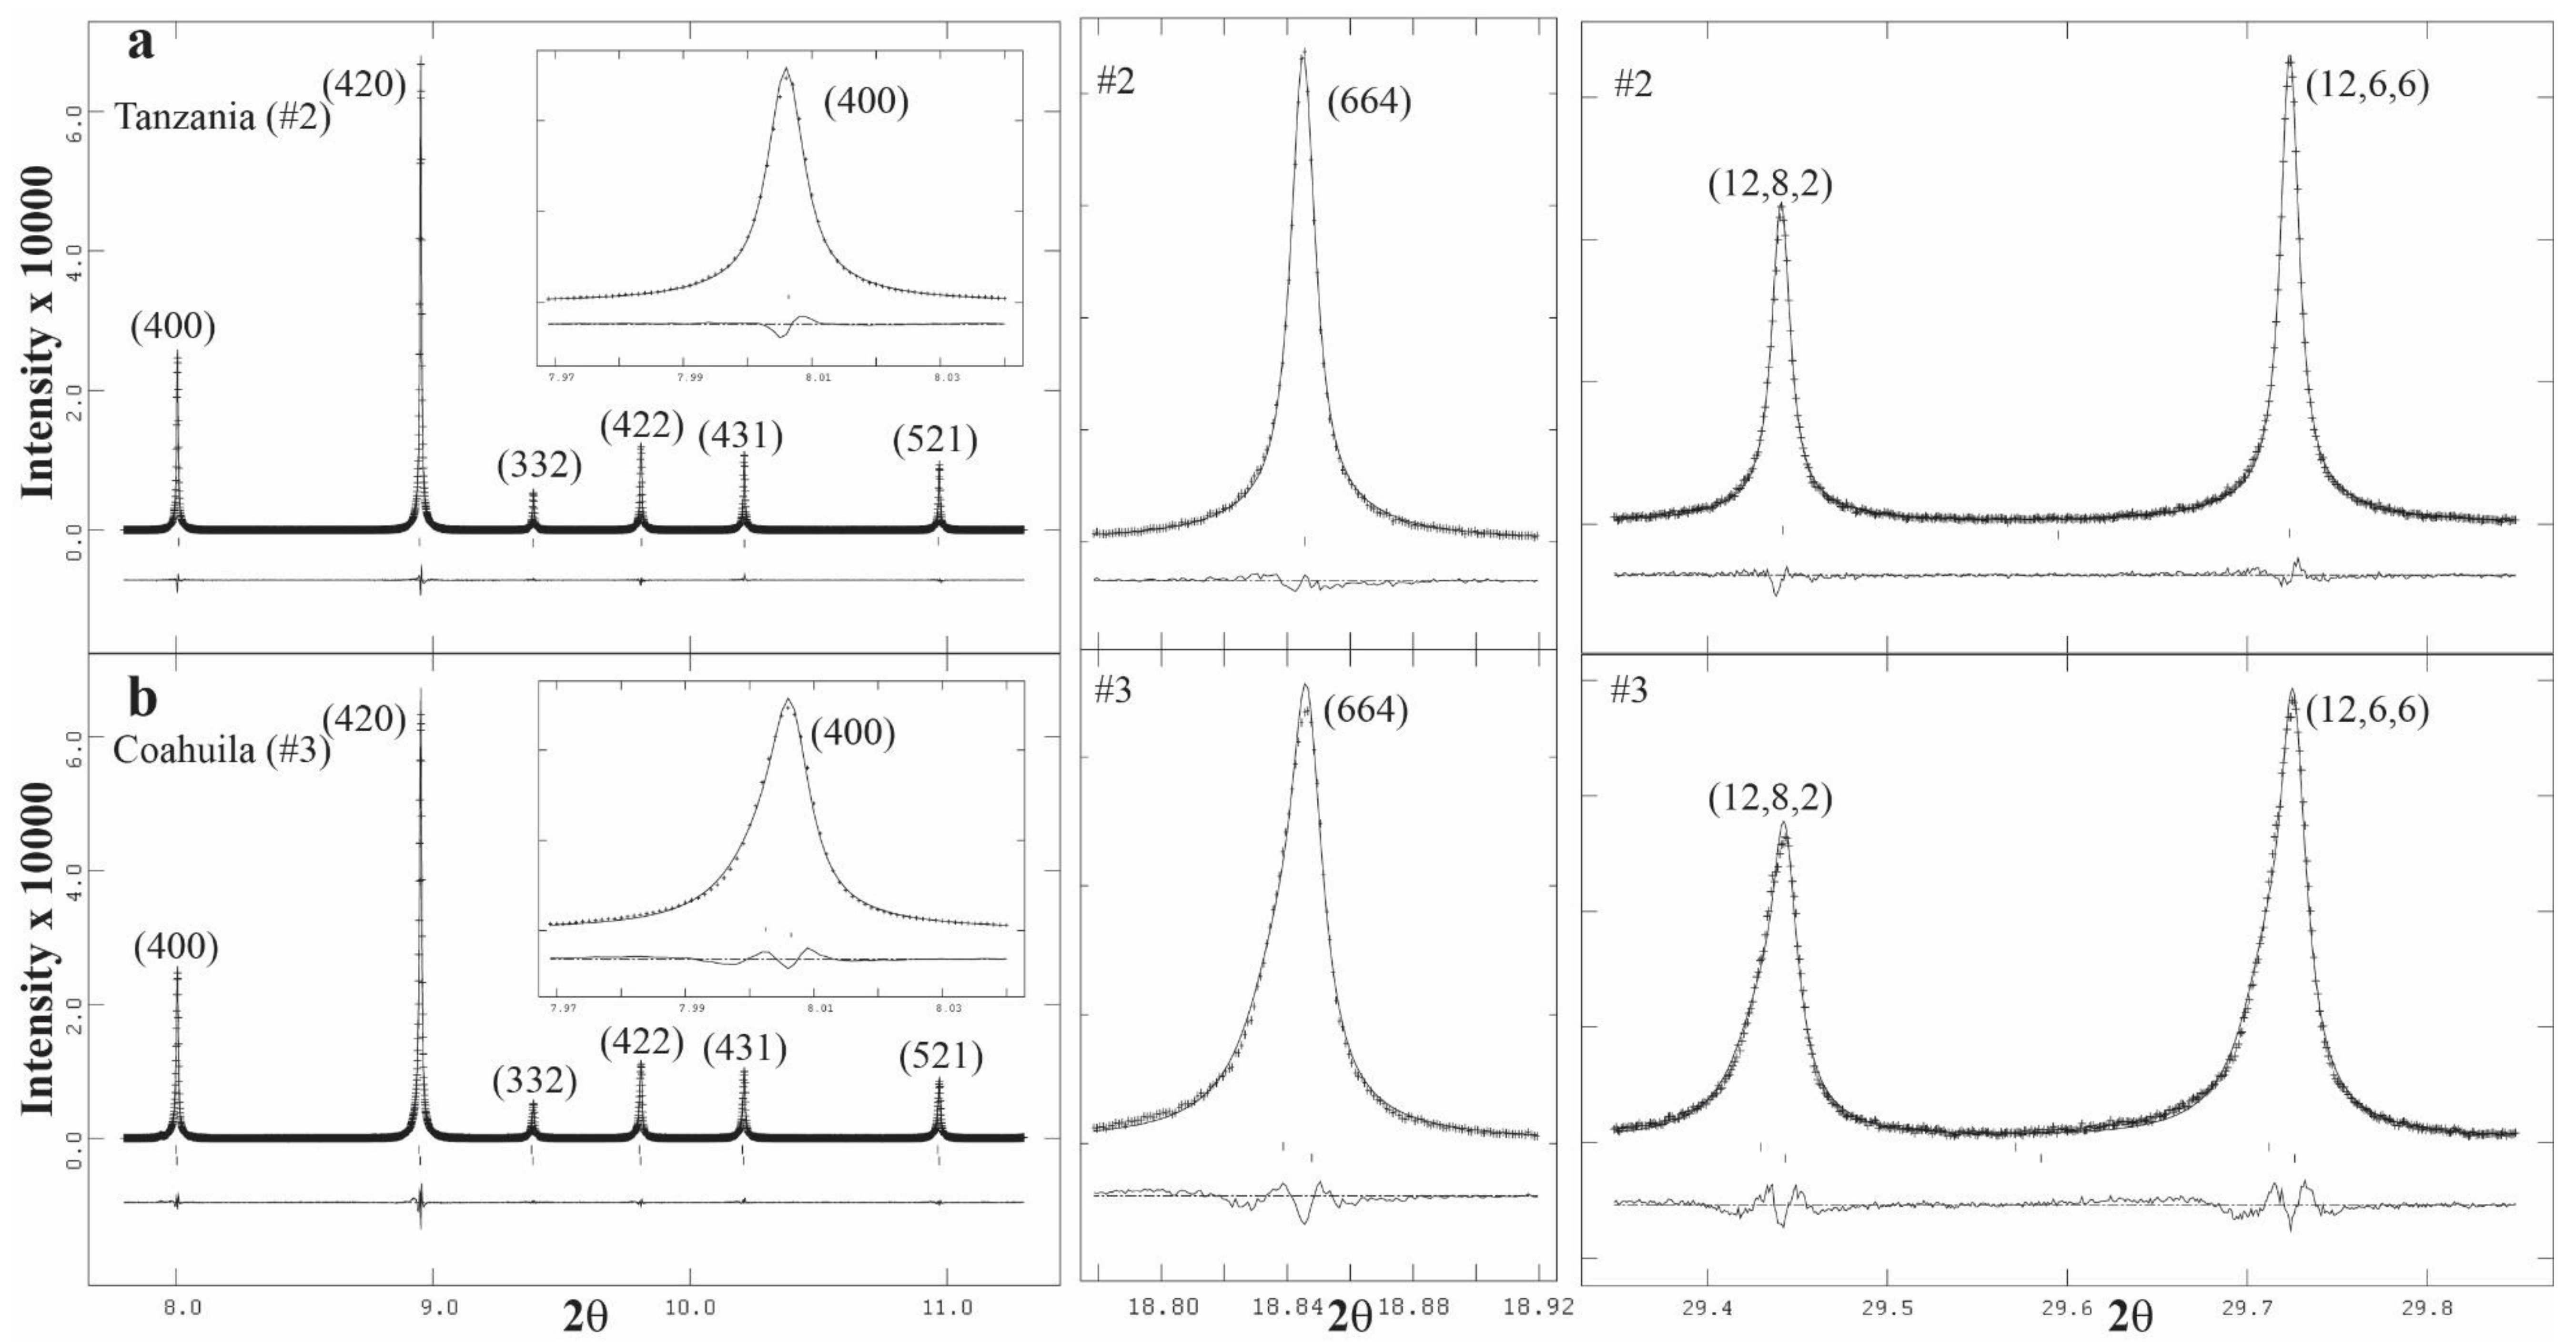
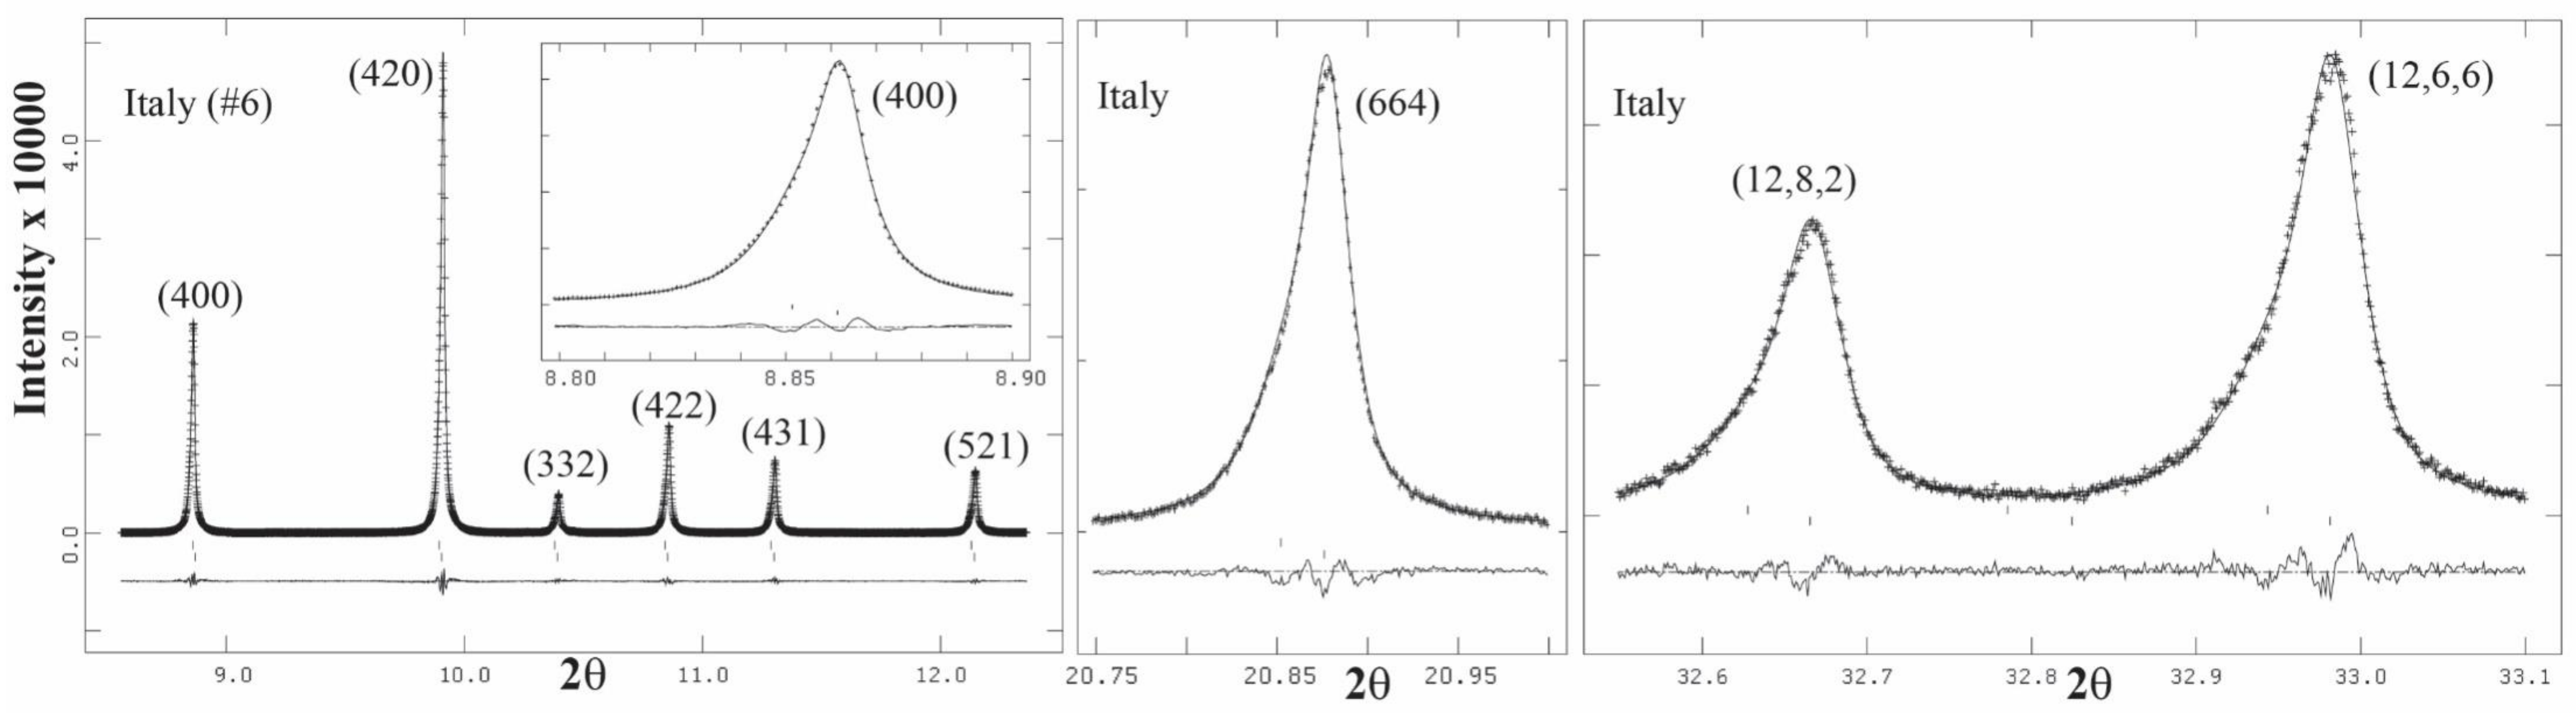
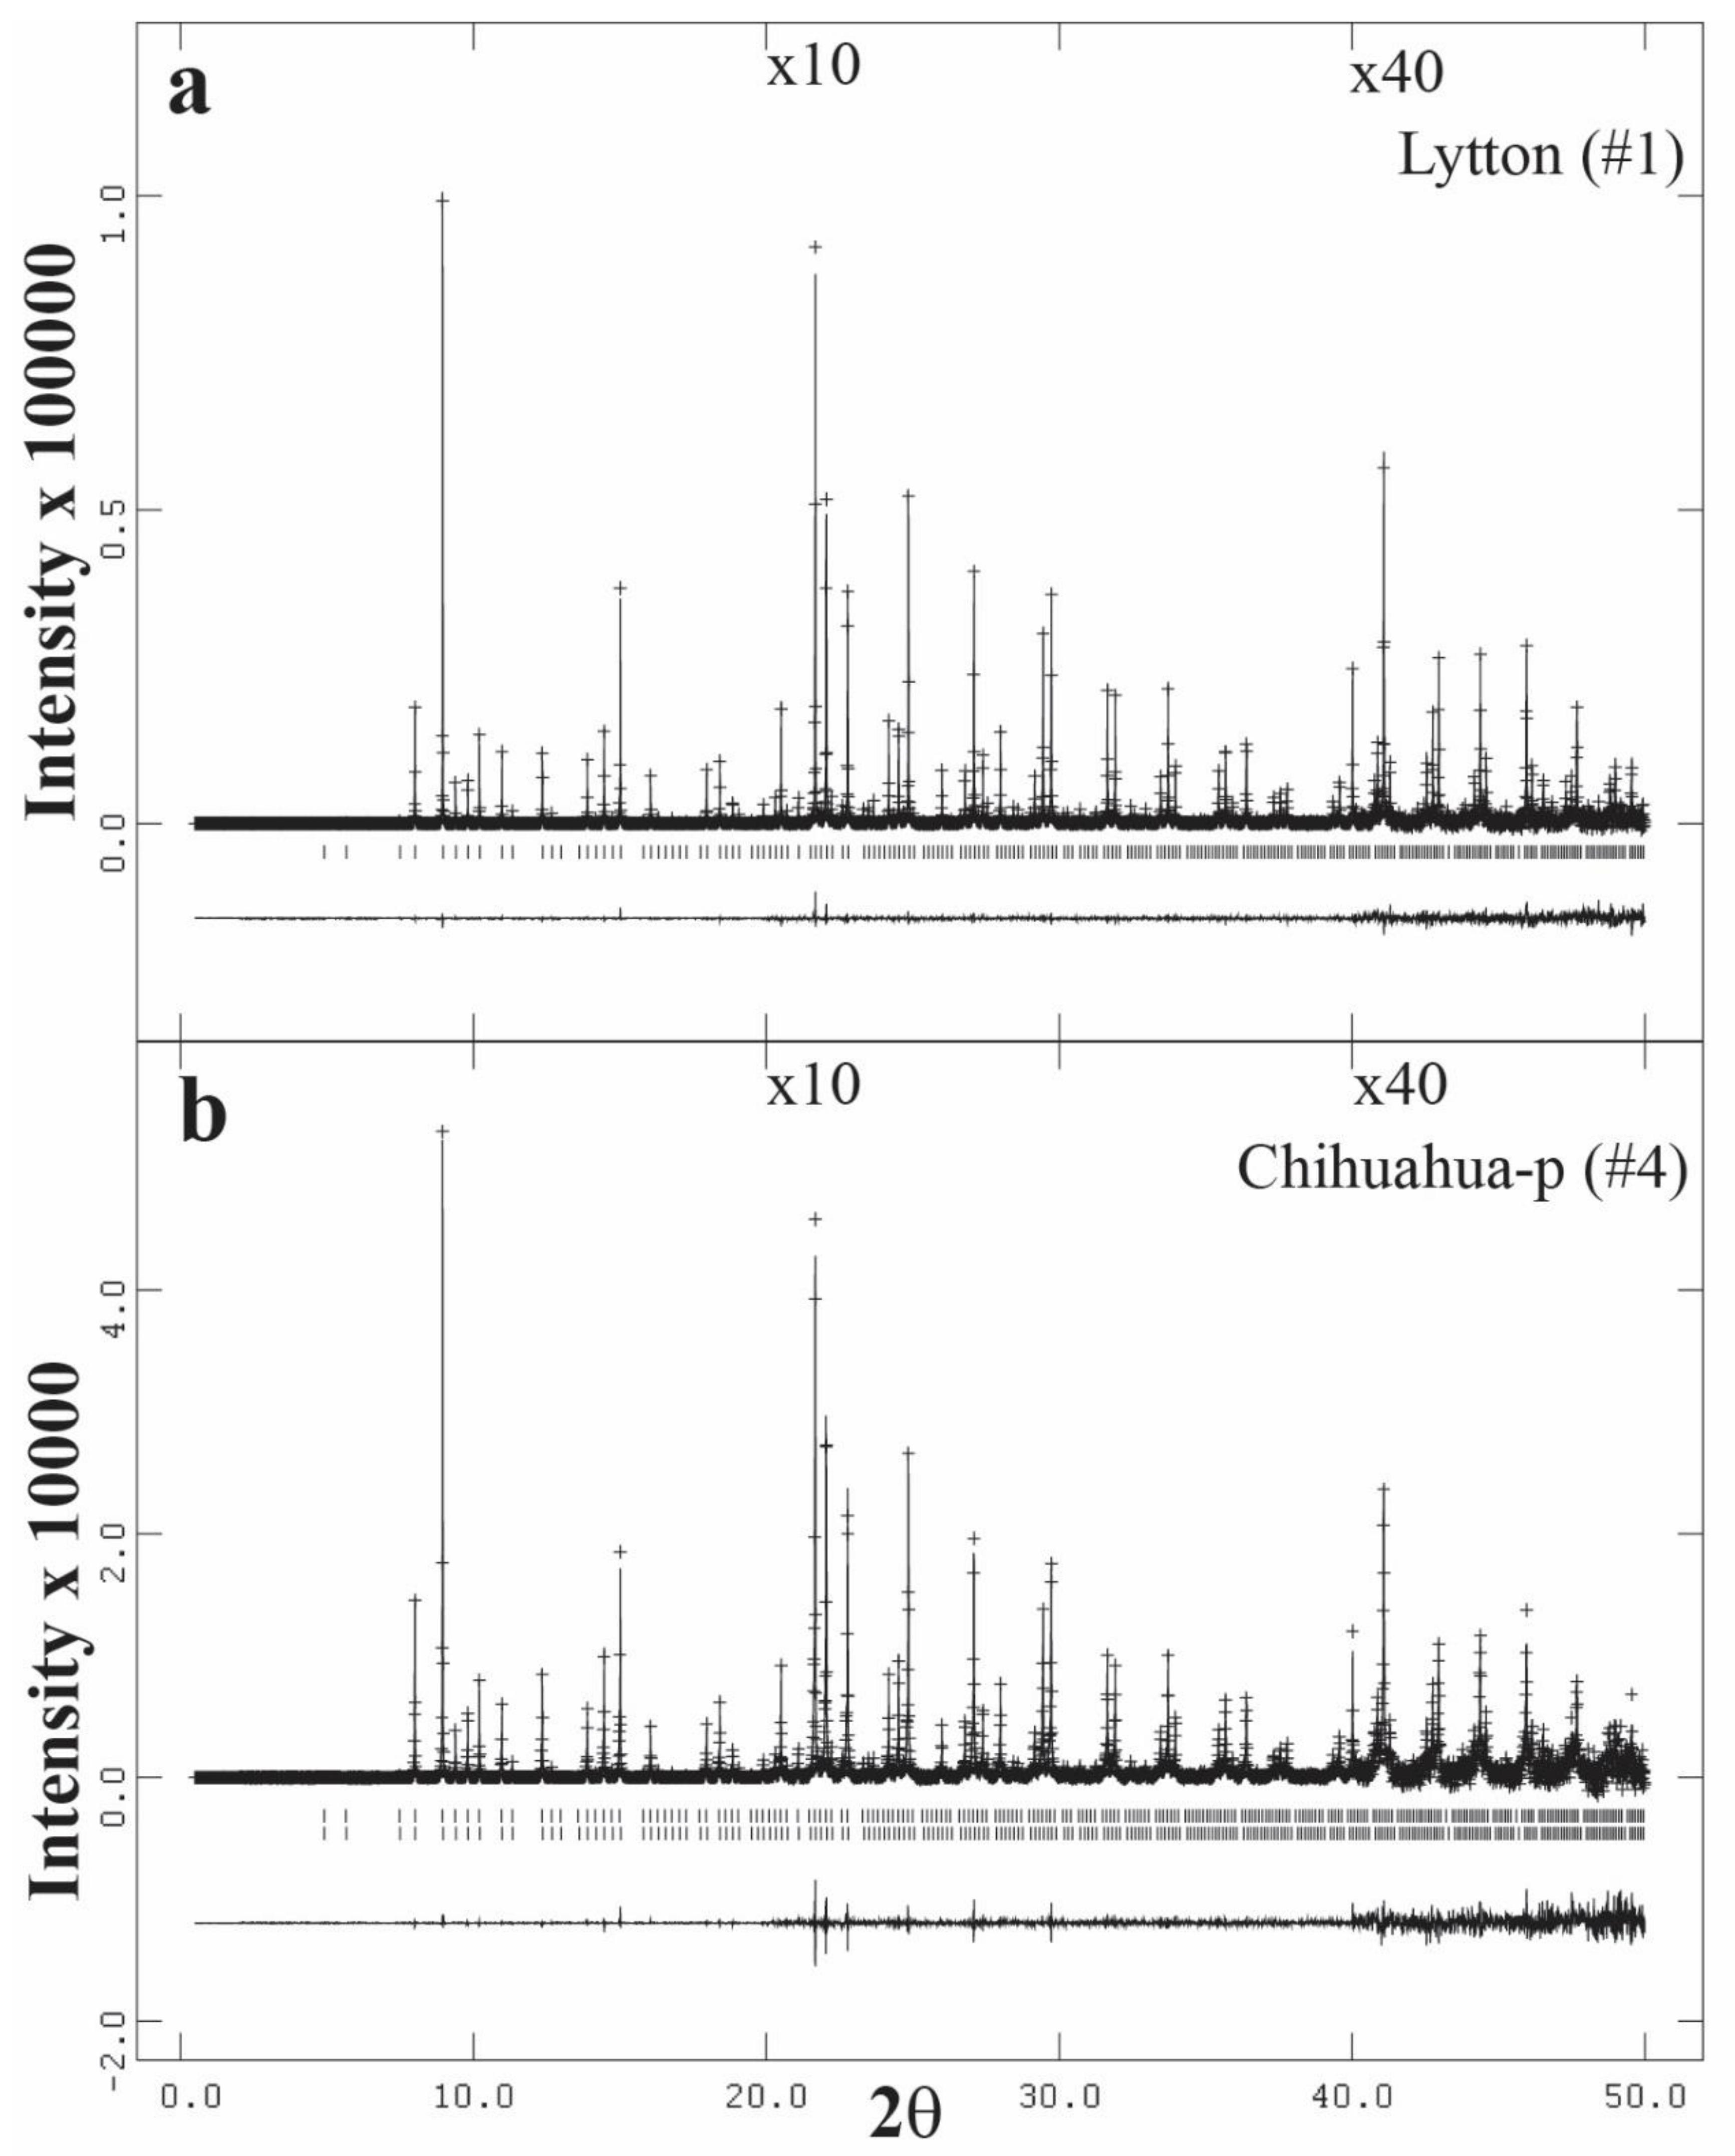
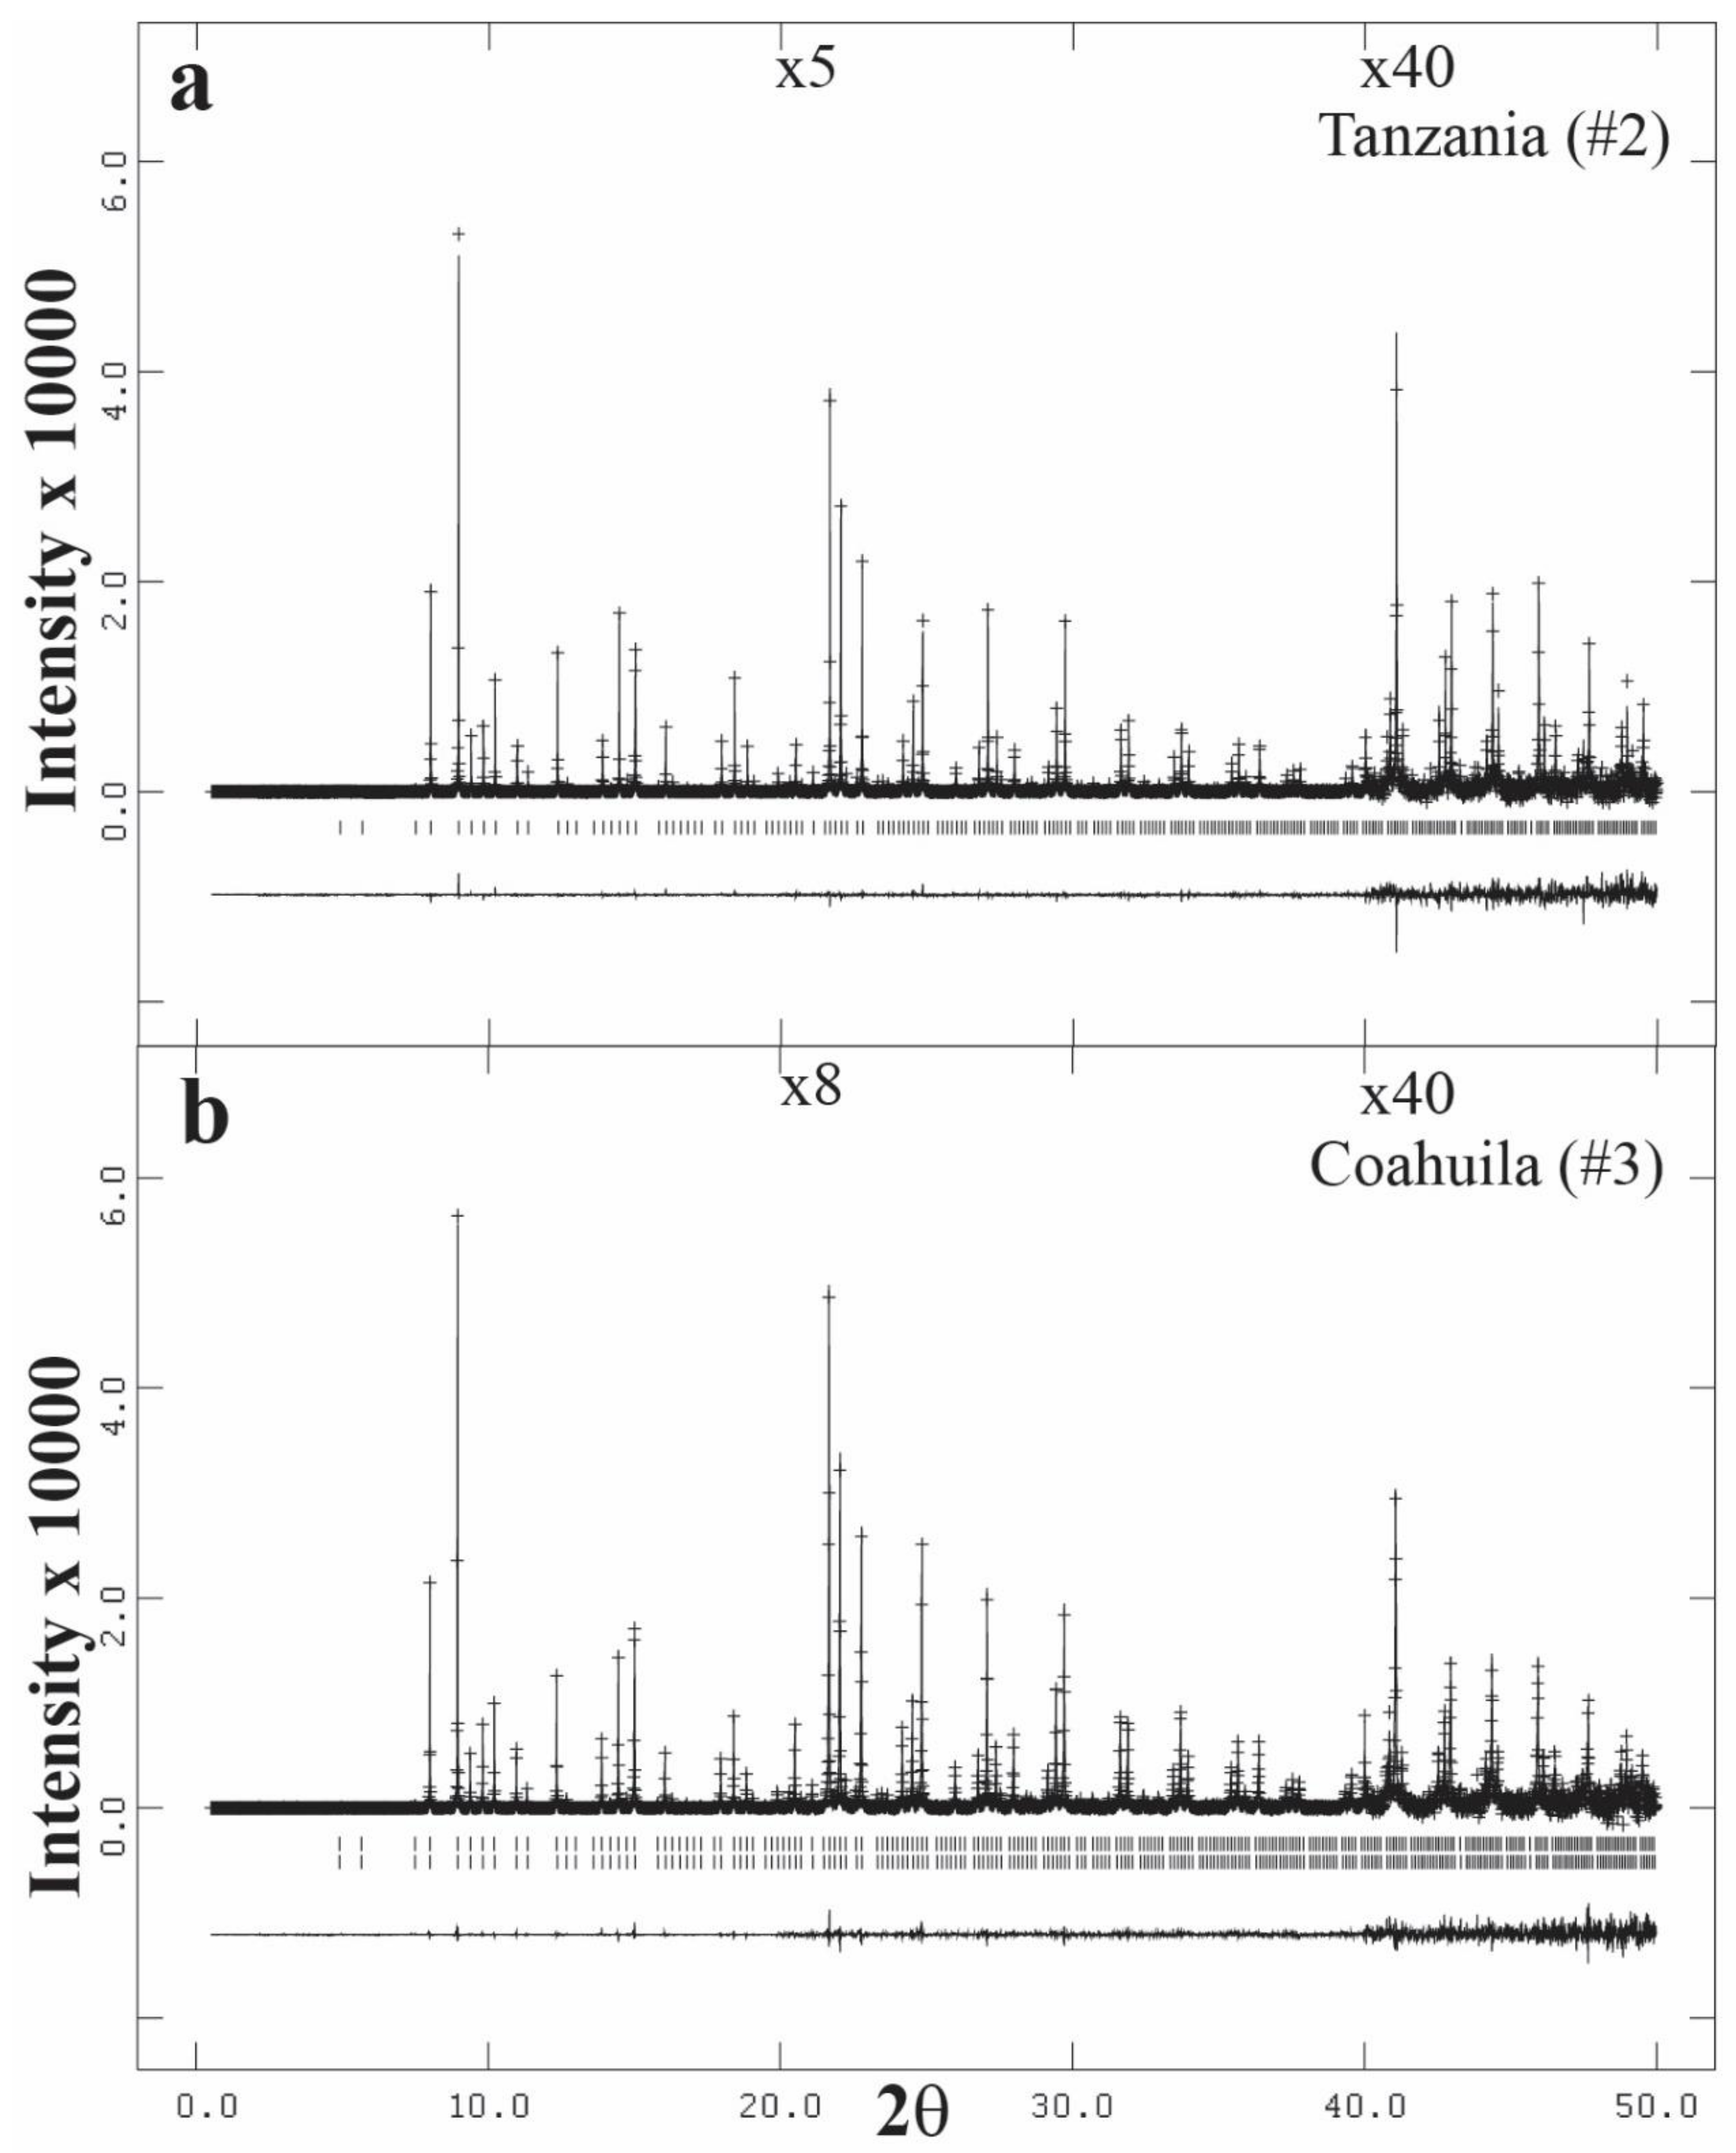
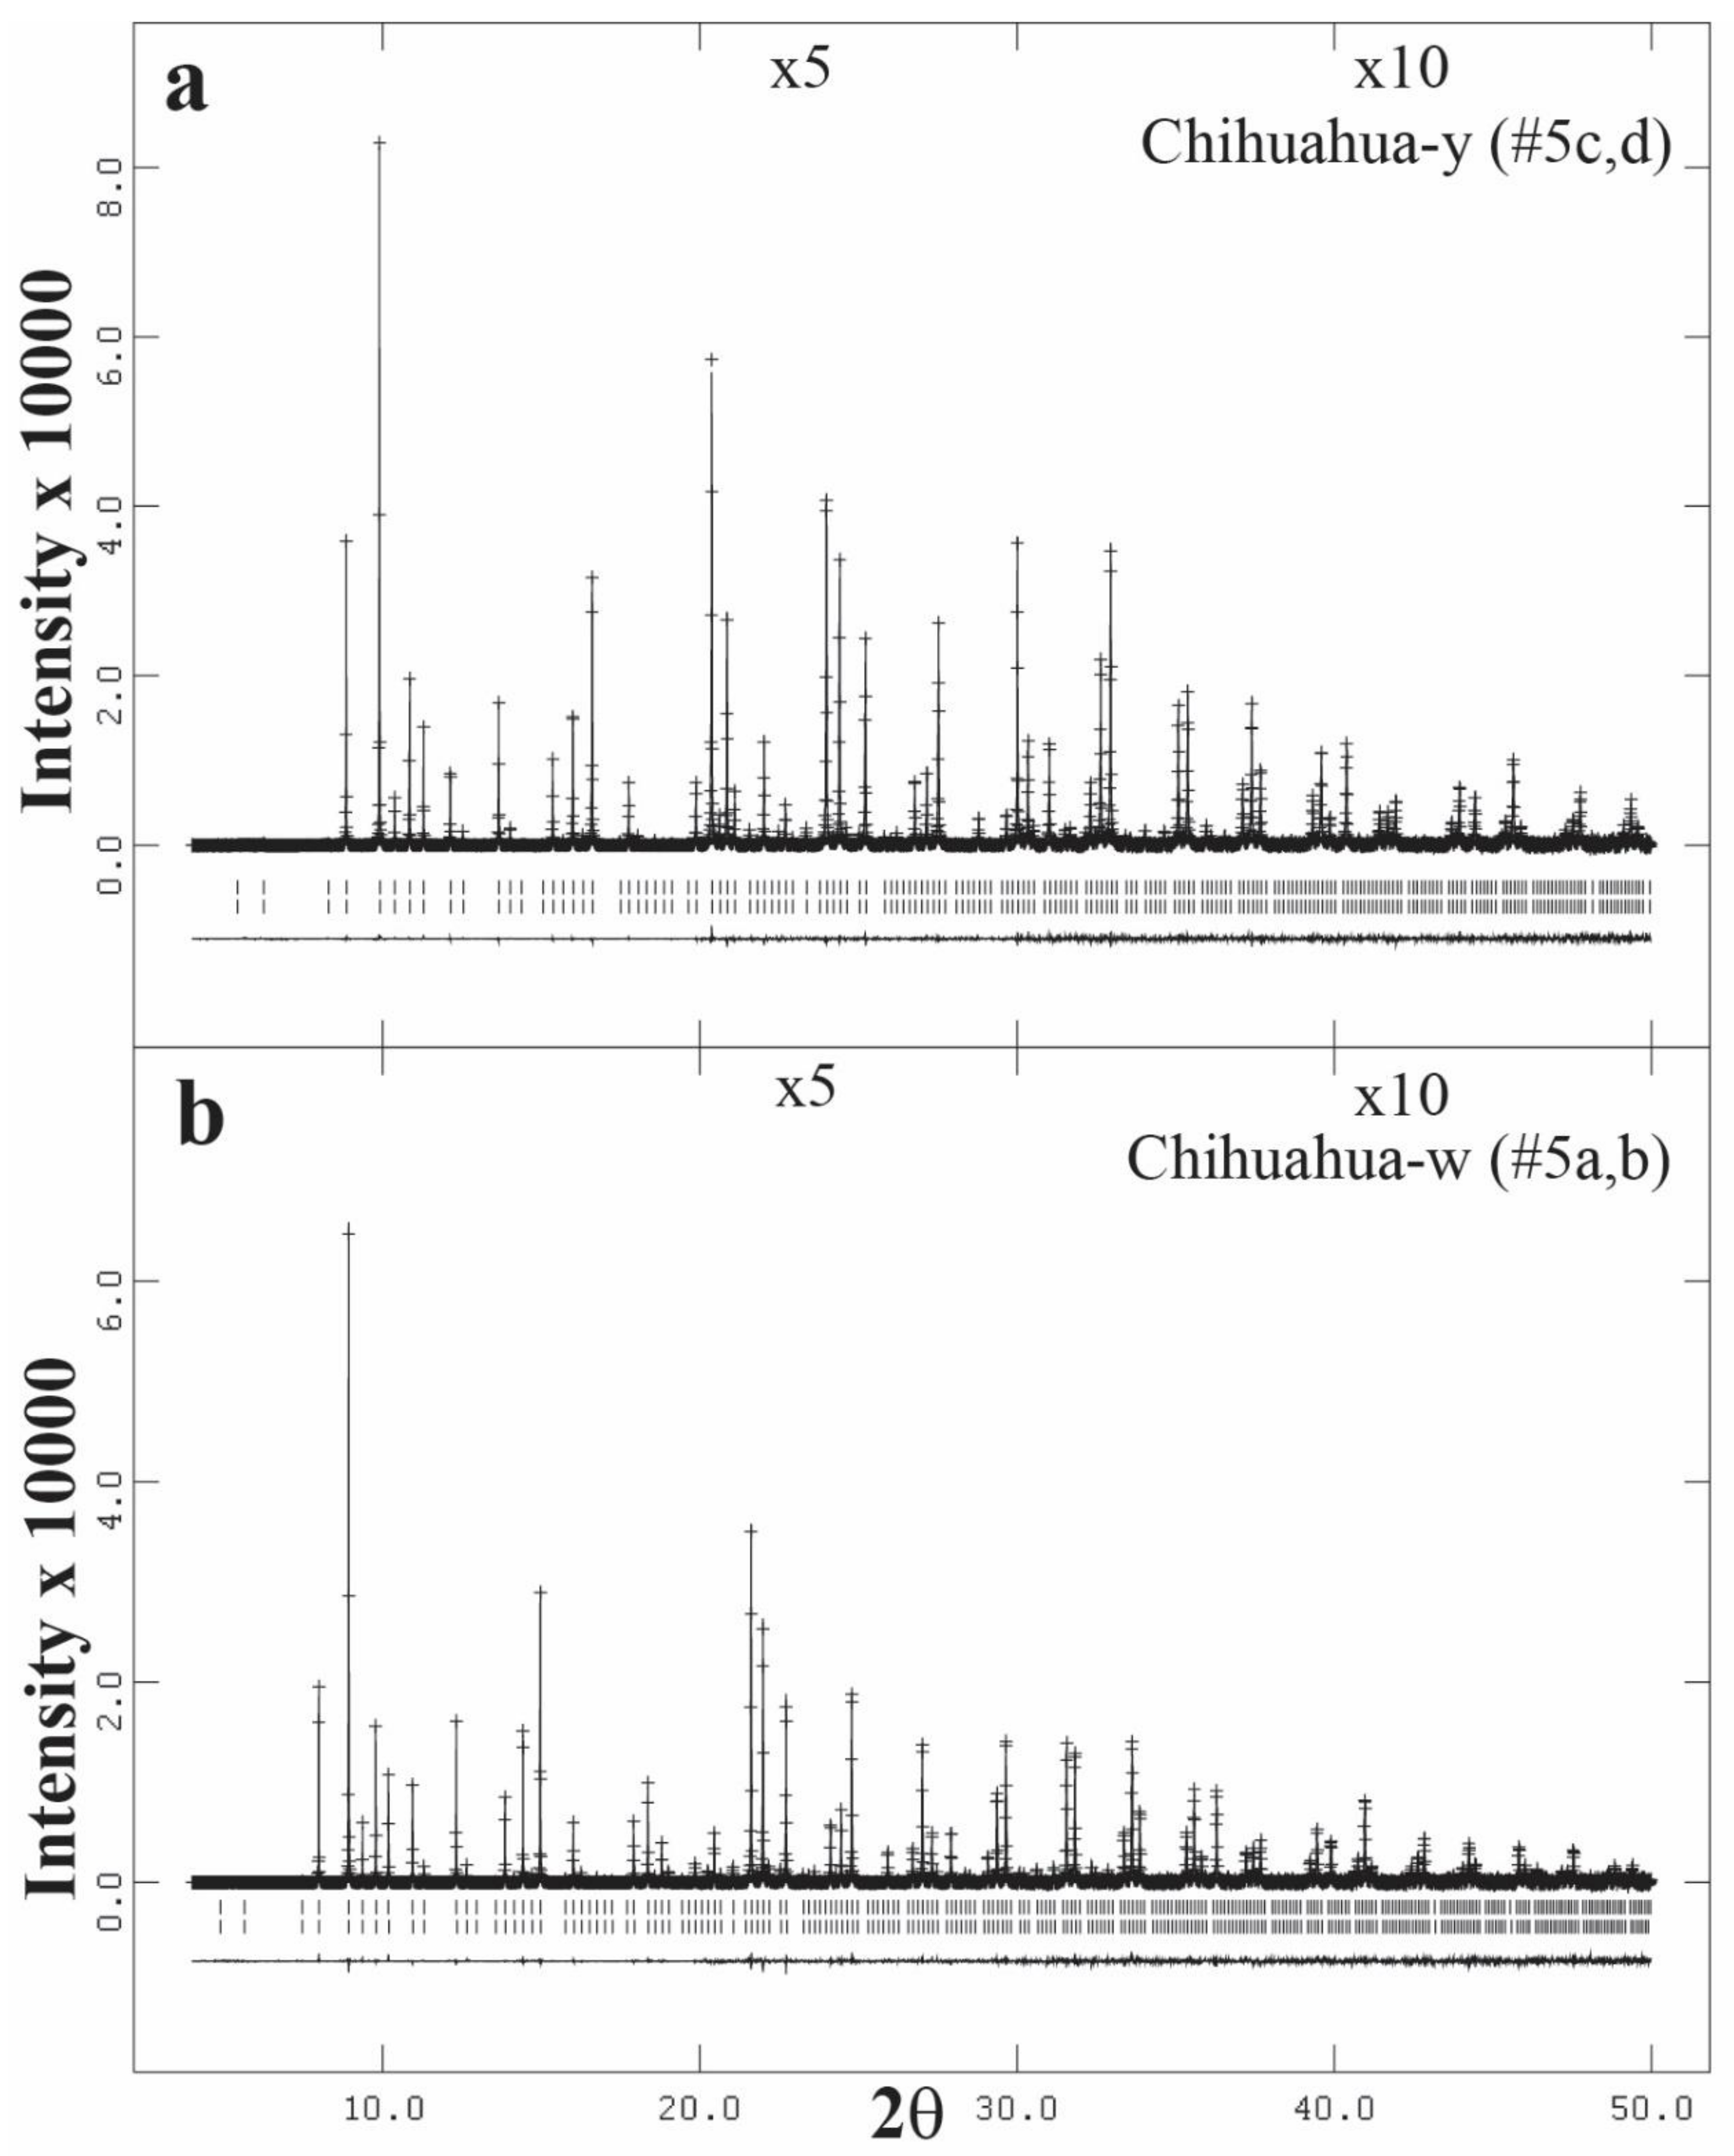
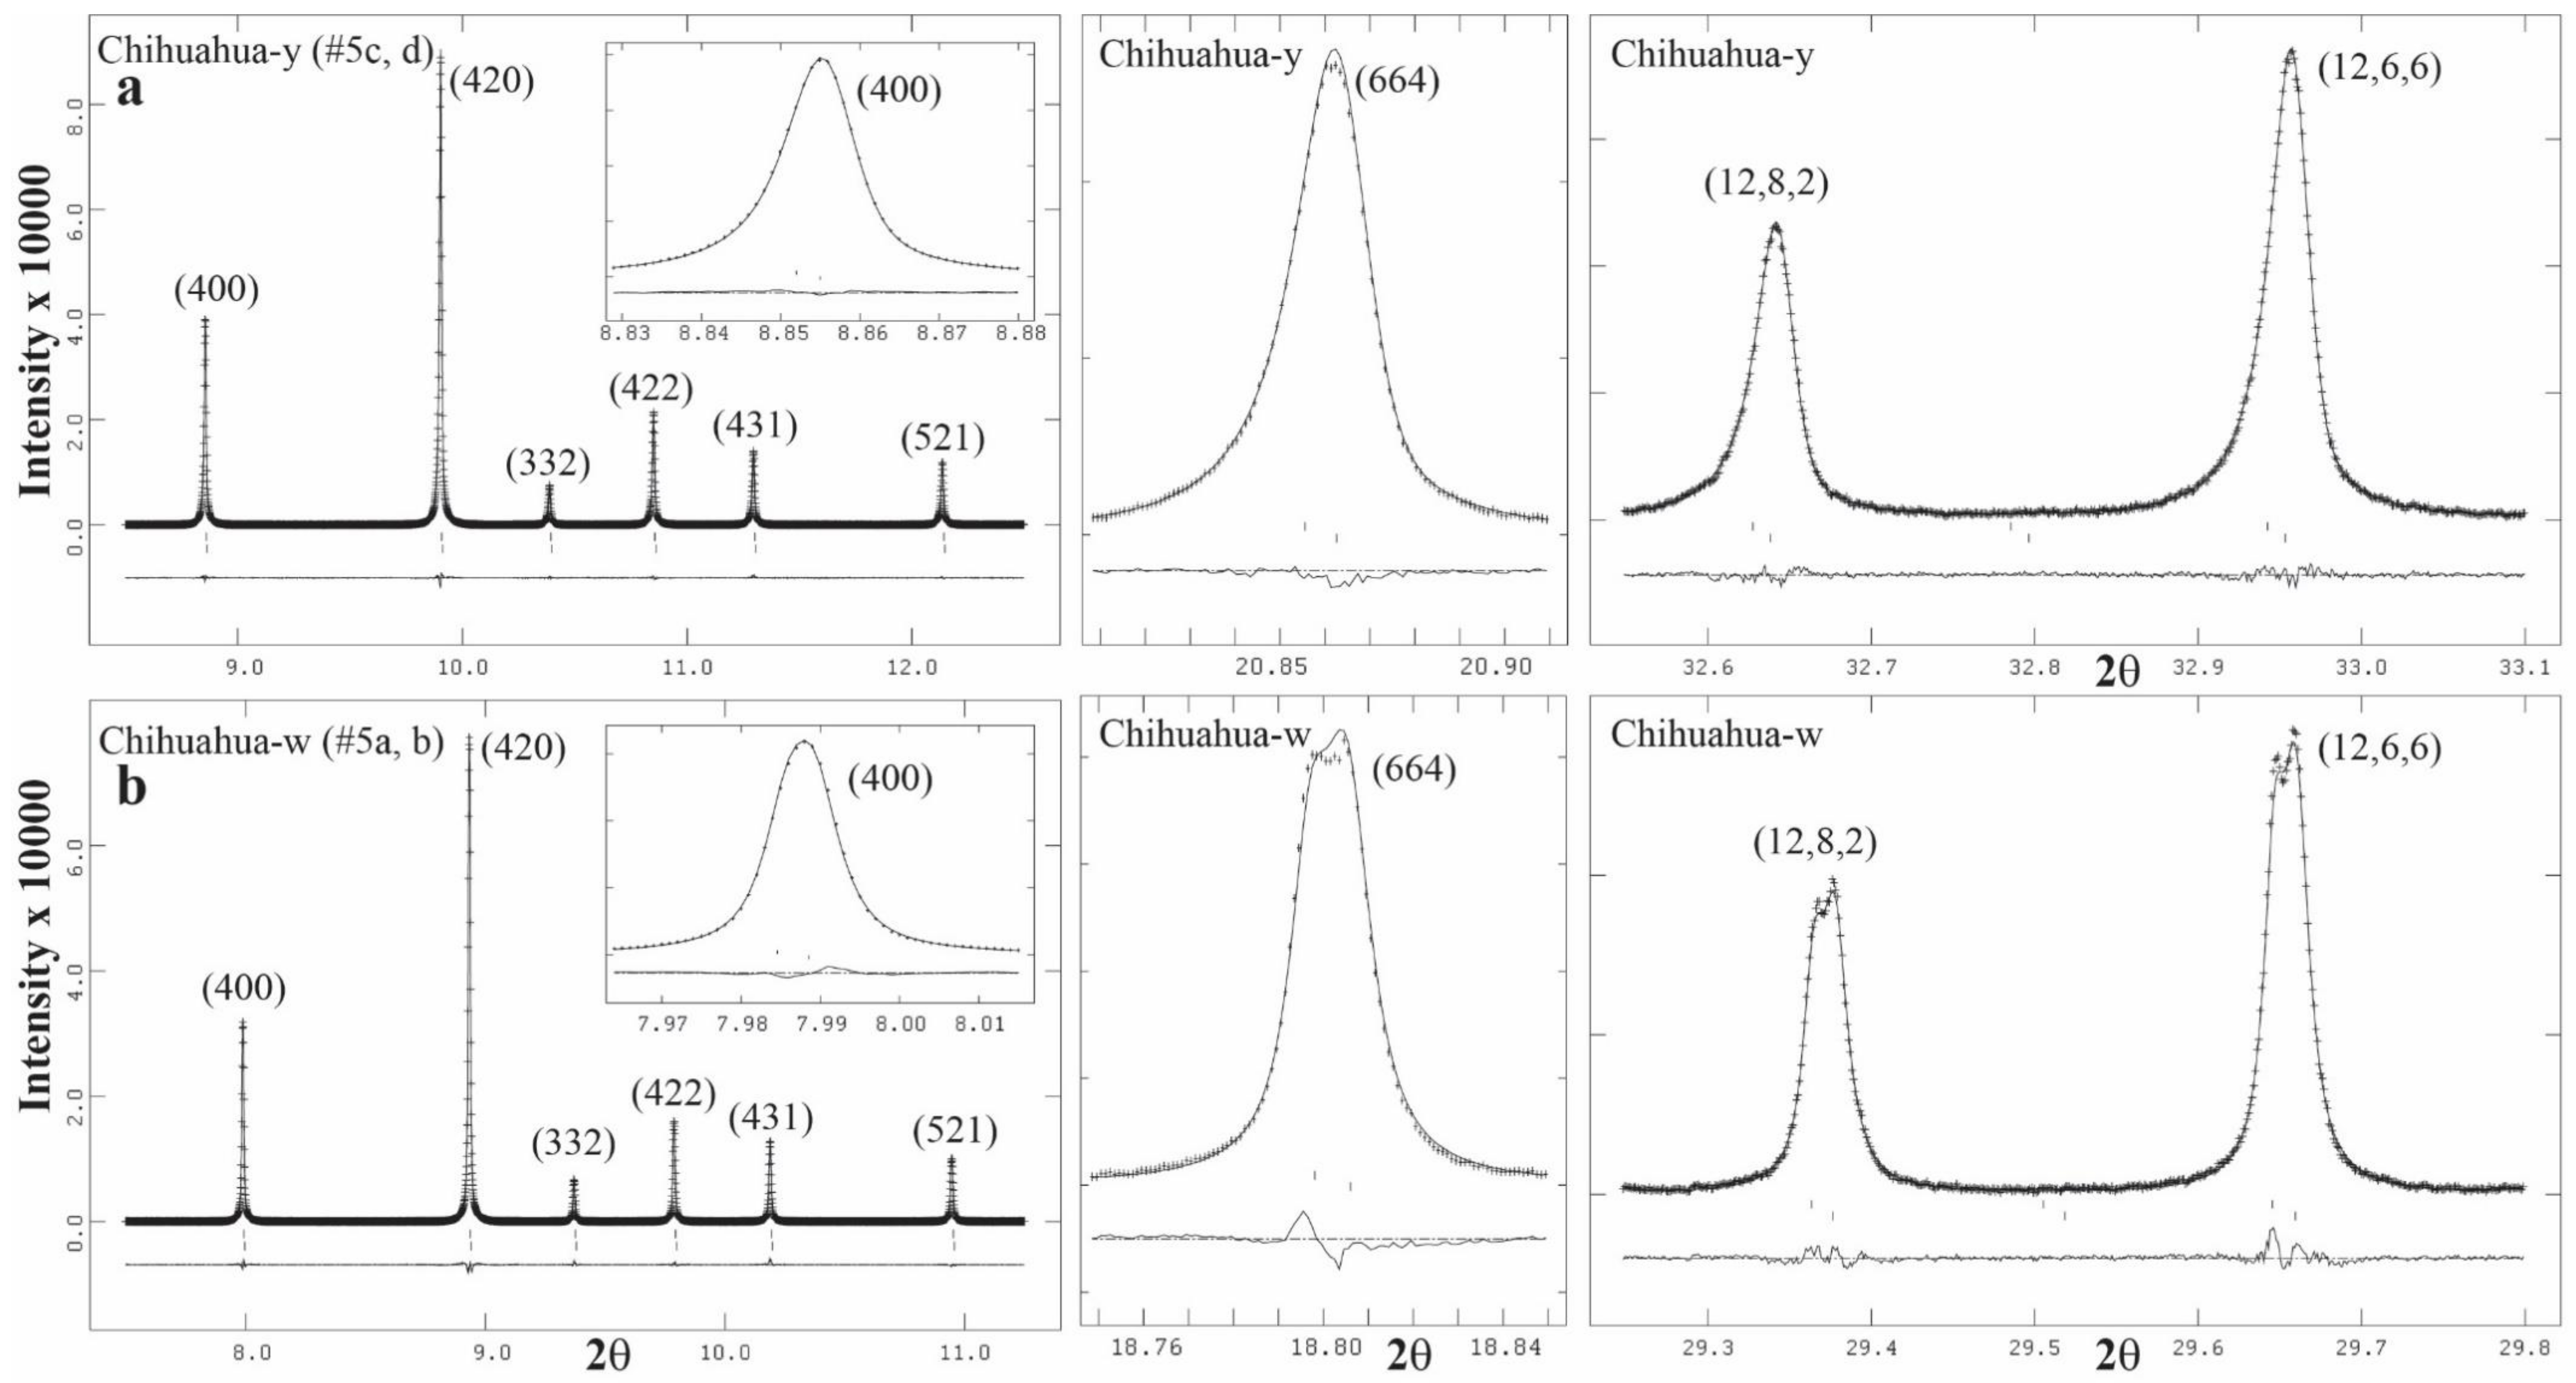
3.3. High-Resolution Powder X-ray Diffraction (HRPXRD) Traces

In Rietveld structure refinements, it is necessary to show the fit of the complete trace to show how well the structure was modelled. In addition, expanded parts of the trace are also needed to observe splitting, asymmetry, width, and sharpness of diffraction peaks. Multiple cubic phases in garnets are easily observed with HRPXRD. An example of a complete HRPXRD trace is shown for a single cubic phase of sample-1 (Figure 11a) and two cubic phases in sample-4 (Figure 11b). The complete traces for the other samples are also given (Figure 12, Figure 13 and Figure 14). The expanded HRPXRD traces for sample-1 shows a single cubic phase, where the peaks are very sharp and symmetrical (Figure 15a), whereas the two cubic phases in sample-4 are indicated by split peaks, especially for reflections 664, 12,8,2, and 12,6,6 (Figure 15b).
Sample-2 from Tanzania contains a single cubic phase with sharp, symmetric, and narrow peaks with no splitting of reflections (Figure 16a). The two phases in sample-3 are evident from the asymmetry in peaks (Figure 16b).
Both the yellow core of sample-5 and the white outer layer contains two cubic phases. The two phases in the yellow core (Chihuahua-y) of sample-5 are evident from the asymmetry in peaks (Figure 17a), whereas the white outer layer (Chihuahua-w) of the crystal clearly shows split reflections (Figure 17b). The two phases in sample-6 from Italy is indicated by the asymmetry in the reflections (Figure 18).
Diffraction peaks from garnets showing splitting were interpreted as arising from different phases, e.g., [31,32,33,34,35,36,37,38], which was confirmed from recent studies [1,3,4,6,7,8]. Hirai and Nakazawa [34] observed stratified (110) layers in an iridescent grandite garnet where the layers are composed of Fe-rich (Adr87) and Al-rich (Adr78) lamellae. Their selected-area electron diffraction (SAED) pattern shows the presence of two phases because of splitting of spots that are normal to the lamellae. From the split reflections, the difference in unit-cell size for the two phases was estimated to be about 0.02 Å. They interpreted the layered structure as arising from exsolution, that is, different phases [33,34] instead of oscillatory zoning, e.g., [18,73,74,80]. Pollok et al. (2001) observed oscillatory zoning on a very fine scale in grandite garnets and their HRTEM images show that the compositional interfaces are sharp and coherent. However, their TEM image and SAED pattern show nonperiodic lamellae with interfaces normal to (110) and small diffraction peak splitting, which was not interpreted as two separate phases, as was done by Hirai and Nakazawa [33,34]. In a recent study on an andradite that contains stratified layers, Antao and Klincker [6] observed three separate cubic phases (Adr97, Adr93, and Adr87) and the crystal structure of the three phases were refined using HRPXRD data. The differences in cell parameters among the three phases are 0.007 and 0.070 Å.
Allen and Buseck [13] studied anisotropic near-endmember grossular samples using XRD, FTIR, TEM (SAED and HRTEM), and EPMA. They observed homogeneous compositions and did not observe any split reflections in electron diffraction patterns. They used unit-cell parameters that are nearly cubic to refine the crystal structure in a lower symmetry space group I 1 ¯ and indicated that there may be cation order in the X and Y sites. They suggested that such cation order gives rise to birefringence in near-endmember grossular. Crystal structures that were refined in unnecessarily low symmetry space groups were heavily criticized [81,82].
The crystal structure of several uvarovite samples was examined in symmetry lower than the standard cubic symmetry for garnet [26,83]. They observed Cr3+-Al order on the Y-site and OH distribution in a noncubic manner; these features were attributed to the reduction in cubic symmetry. However, they stated: “The SAED patterns gave no evidence of a deviation from cubic symmetry. HRTEM images exhibit no indications for the occurrence of micro-twinning” [83]. In addition, their EPMA analyses of four analyses per prepared crystal reveal that their samples are chemically homogenous. Therefore, compositional zoning can be ruled out as a possible reason for optical anisotropy. The EPMA data confirmed that these garnets are, to a good approximation, simple binary uvarovite–grossular solid solutions [83].

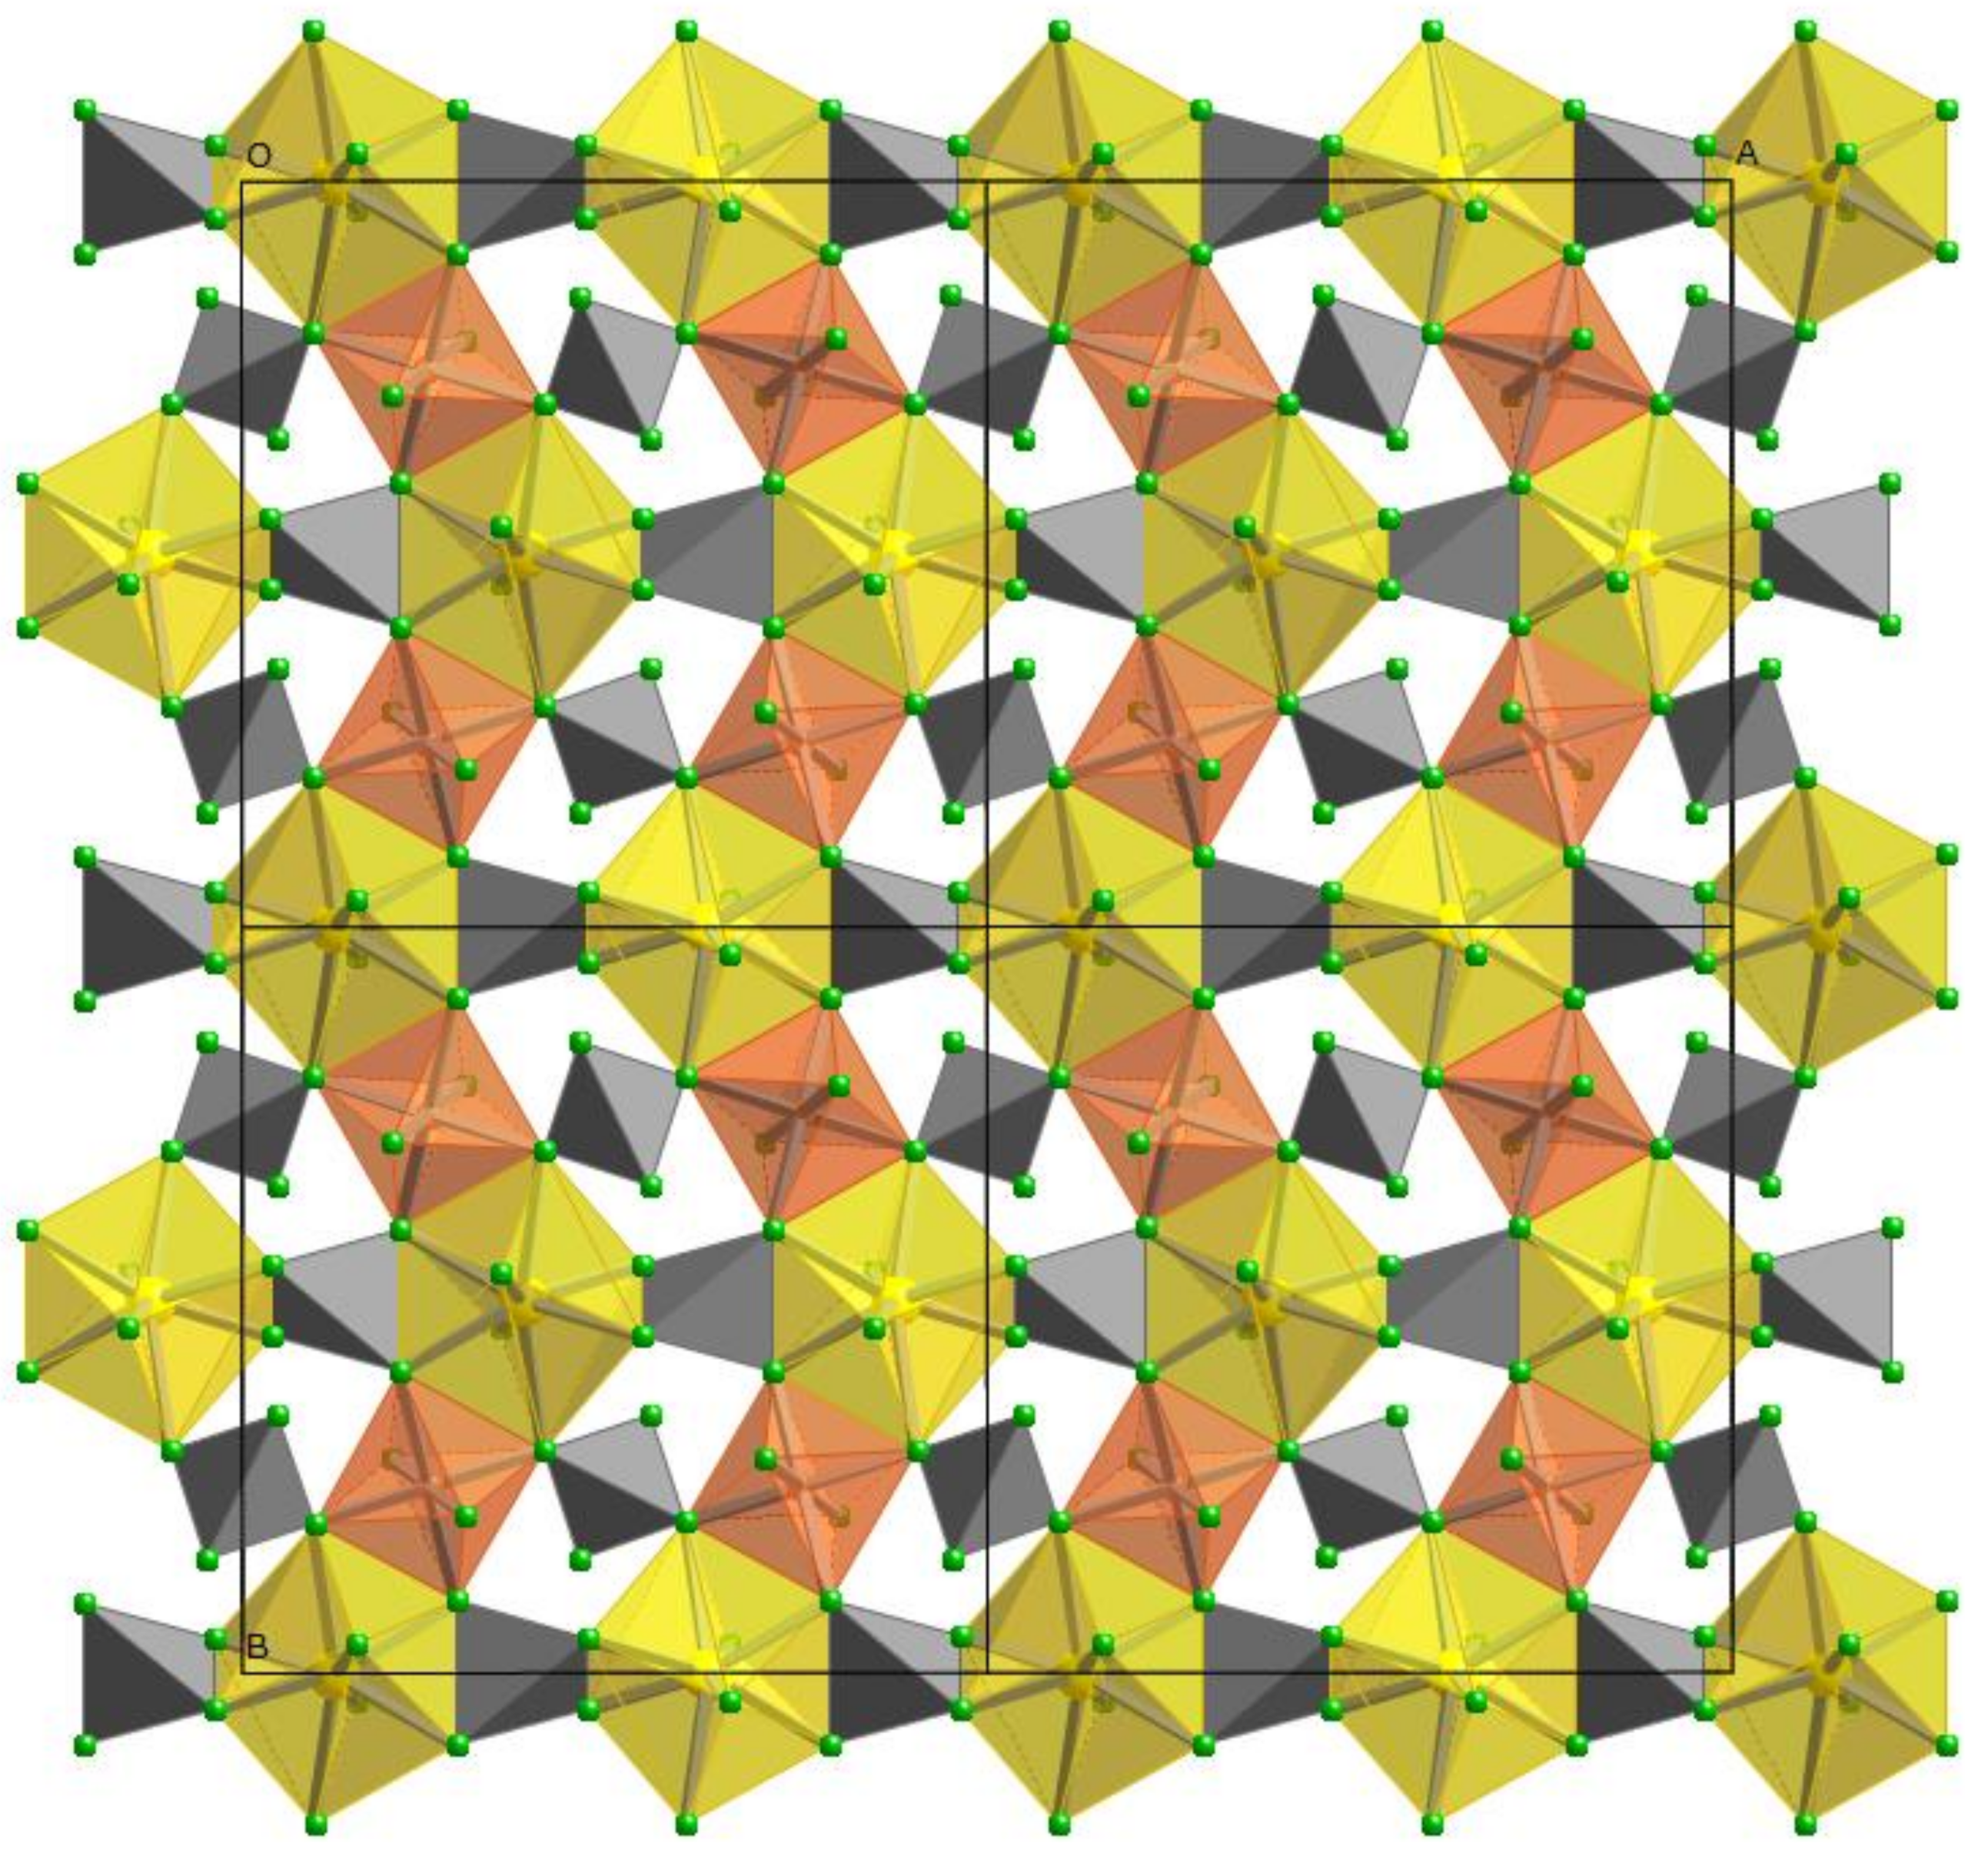
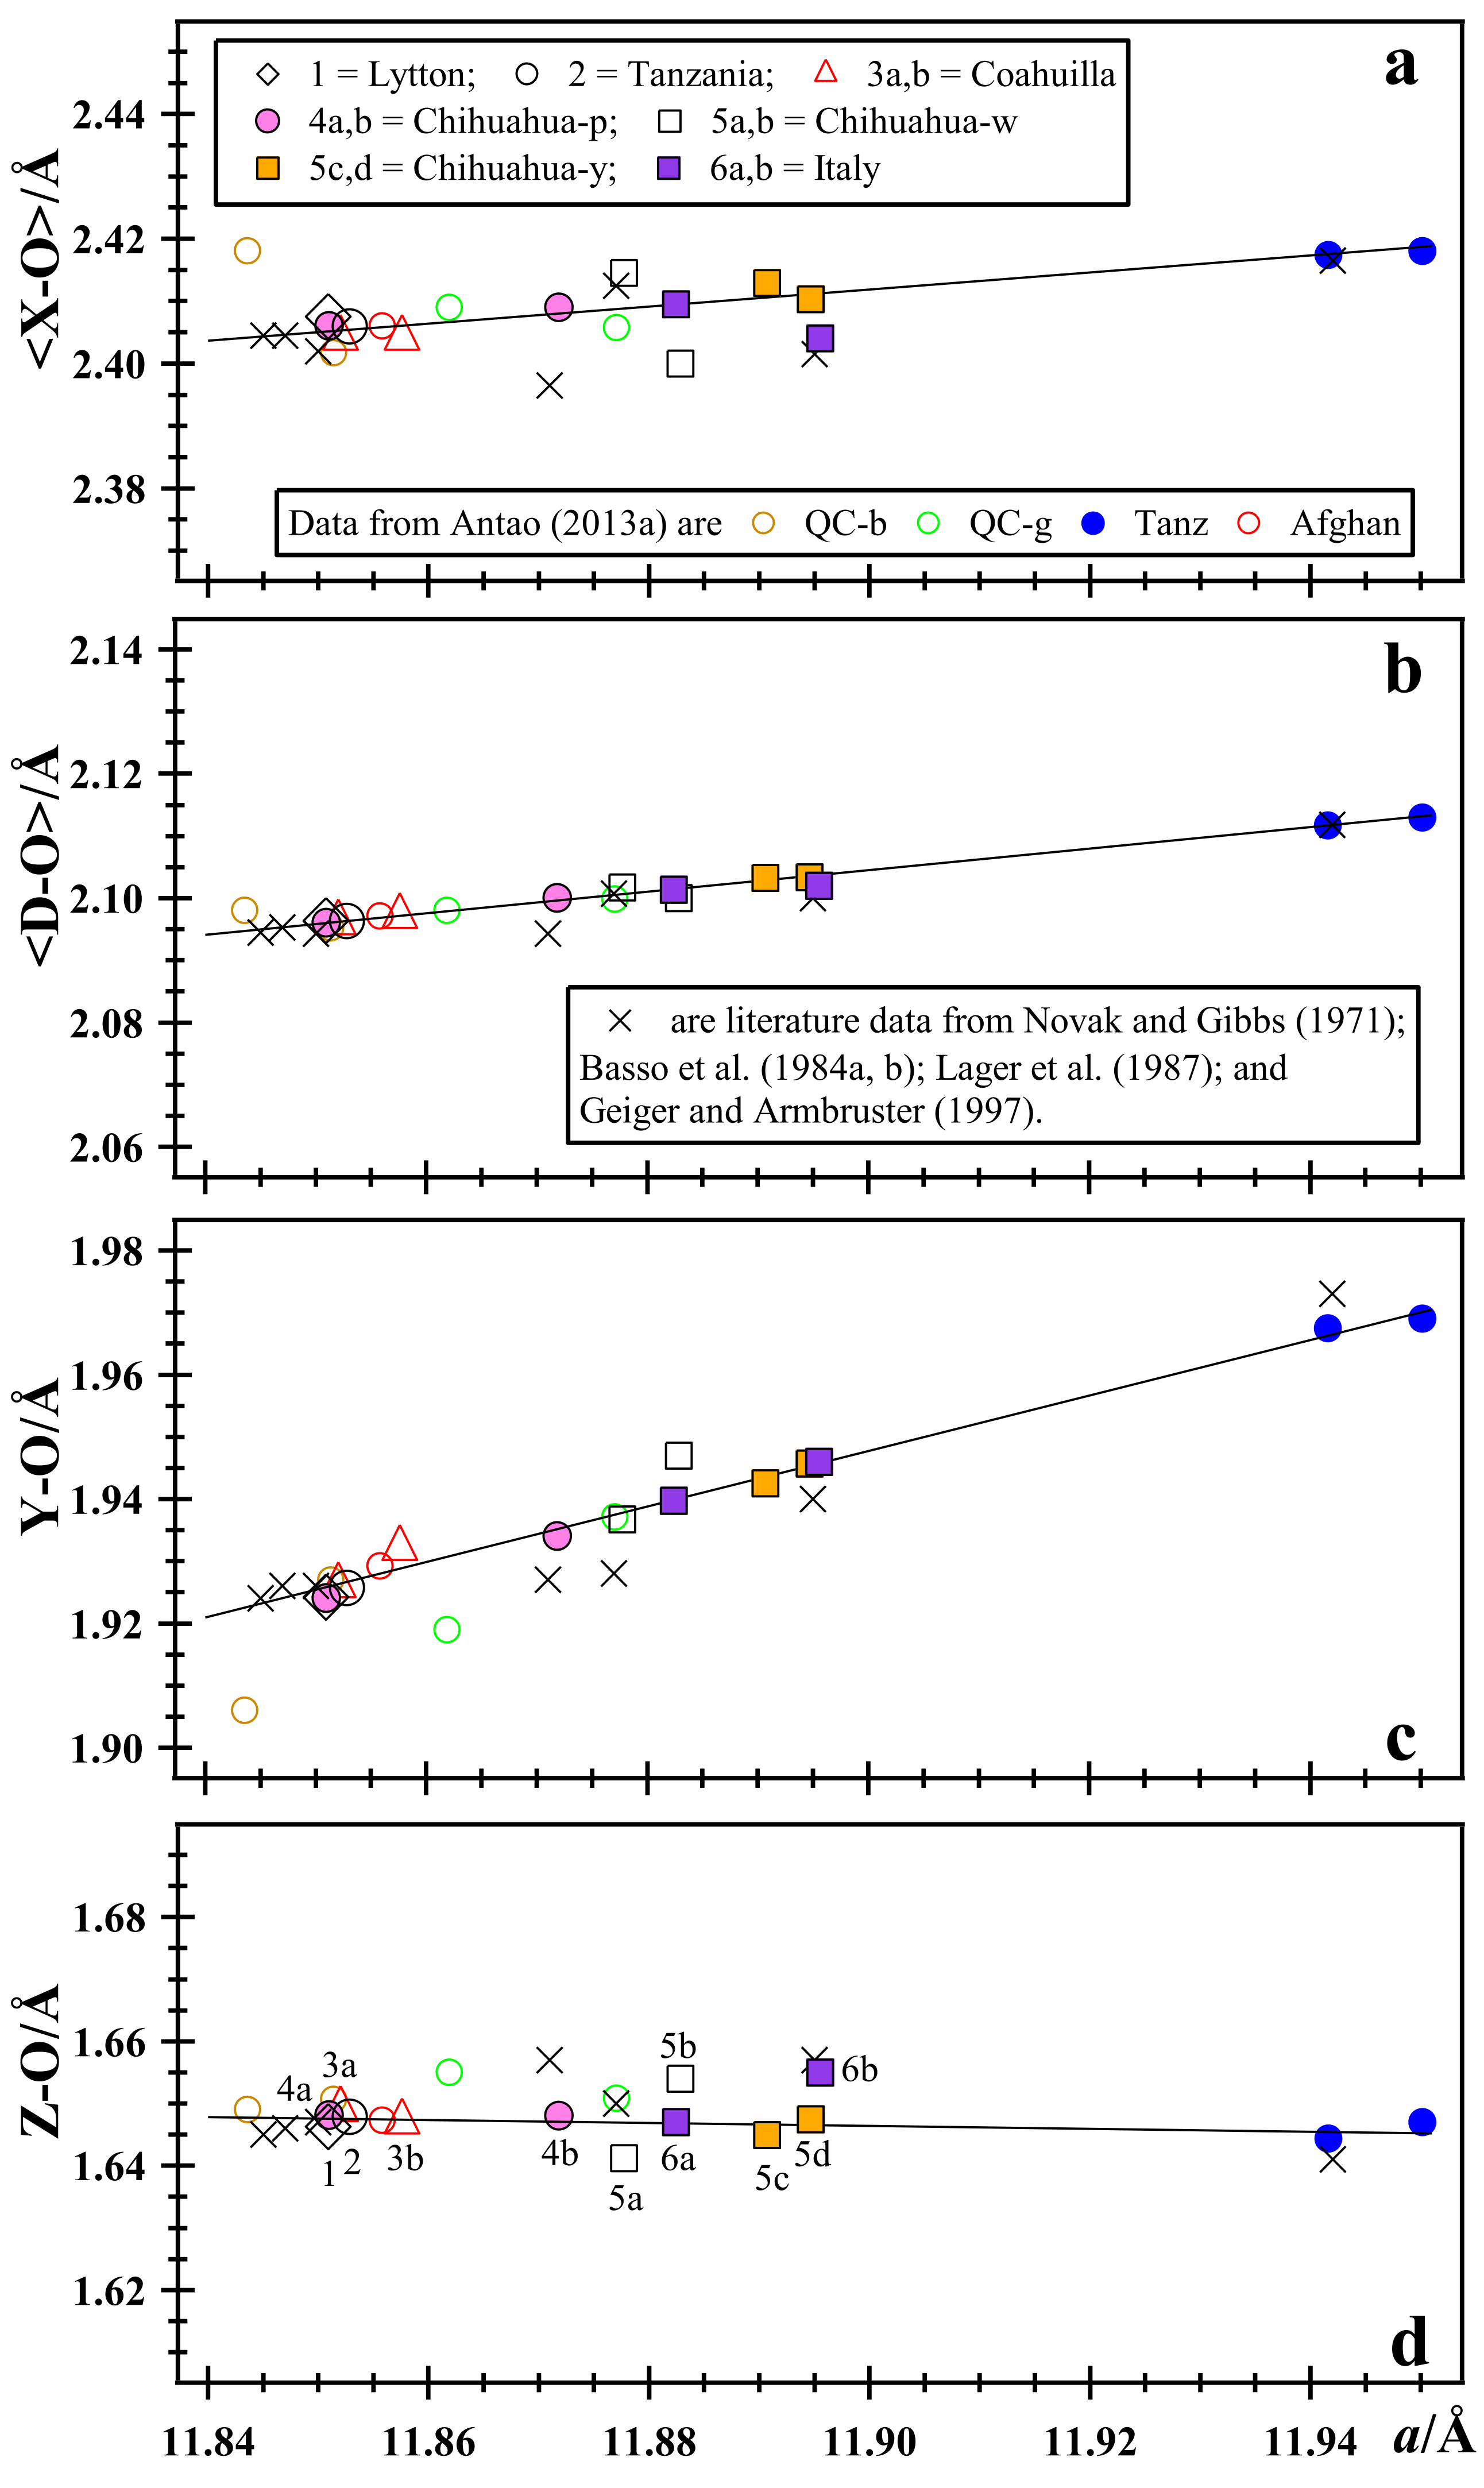
3.4. Rietveld Refinements and Structural Variations across Grossular–Andradite Solid Solutions

In this study, the sofs calculated from the chemical analysis are similar to those obtained by the Rietveld refinements (Table 3). The EPMA sofs for the six samples are close to 1, including the Ca atom in the Y site and Si atom in the Z site. The sum of the Al and Fe atoms in the Y site is also close to 1. Samples-5 and -6 contain significant amounts of Fe3+ cations replacing Al atoms. Except for samples-1 and -2, the two phases in each of the other samples have significantly different Y(sof) that are expected to give rise to different Y-O distances (Table 4).
The EPMA results show that the Z site is filled with Si atoms, so the Z(sof) can be fixed to 1. However, Z(sof) was refined in this study and is >0.92 for all the samples (Table 3). These slight deficiencies for the Si(sof) (<0.08) may be experimental error or may indicate minor (O4H4), but such substitutions are insignificant in these samples because the Si-O bond distances are nearly constant (Table 4). If (O4H4) substitution occurs in grossular, then Z(sof) is <1, the unit-cell edge increases, the Si-O bond distances increase, and simultaneously the Y-O distances decrease from their corresponding values in the hydrous phase (see Figure 8 in Antao [84]). Small amounts of OH in near-endmember grossular were detected by IR in several studies [13,17,29]. It is possible that some of the grossular samples may contain minor amounts of (O4H4) substitution, but because the amount is small, this discussion is reserved for samples that contain a significant amount of Si atom deficiencies, where the (O4H4) substitution can be detected by X-ray diffraction. Examples of such samples are pink and green “jade” from South Africa [84]), or katoite samples, e.g., [36,85,86].
The EPMA results indicate the X site is filled with Ca atoms, which is also confirmed by the Rietveld refinements. The difference between the sofs obtained by the two methods is quite small, which is also the case for the Y site (Table 3).
The unit-cell and bond distances for grossular samples from this study and the literature are compared (Figure 19). Data from all the single-crystal structure refinements shown in Figure 19 were done in the cubic space group, I a 3 ¯ d , where only single phases and no split reflections were observed. The bond distances obtained by the single-crystal method are similar to those obtained by HRPXRD (Figure 19), so both methods give similar structural results. Grossular data are included in Figure 19 if their unit-cell parameters are between 11.840 and 11.951 Å. End member grossular and andradite have a ≈ 11.85 and a ≈ 12.05 Å, respectively. In Figure 19, the data points with the maximum unit-cell parameters are for a two-phase sample from Tanzania [1], and these are similar to a hydrogarnet with a ≈ 11.94 Å [87], and different from the single-phase “hessonite” from Tanzania (grossular sample-2 in this study). There is a cluster of three data points from single-crystal studies on grossular samples from Asbestos, Quebec [88], Ramona, California [89], and a synthetic grossular sample [90]; all with nearly the same unit-cell edge between 11.84 and 11.85 Å (Figure 19). Three other samples are classified as hydrogarnets and have unit-cell parameters between 11.87 and 11.90 Å [91]. Several data points obtained with HRPXRD have a ≈ 11.85 Å. Sample-6 from Italy with the most Fe3+ content has the largest unit-cell parameter among the samples used in this study (Figure 19). Data for a few samples appear to show minor (O4H4) substitution, in particular, those hydrogarnet samples studied by Basso et al. [91].
The O atom is on a general O atom position in the garnet structure and the positions for all the cation sites are fixed. Because each O atom is four coordinated by one Z, one Y, and two X sites in a tetrahedral configuration, substitution on any one cation site has only minor effects on the other sites, as reflected in their bond distances [3]. The Z-O distances are nearly constant and are within the range 1.64 to 1.65 Å (Figure 19d) because the Z site is filled with Si atoms. The X site is filled exclusively with Ca atoms, so the <X-O> distance increases slightly in response to substitution on the Y site (Figure 19a). The Z and X sites have minor influence on the structural variations in grossular, which is controlled mainly by atoms in the Y site.
The Y site contains negligible amounts of other atoms besides Al and Fe atoms (Table 1). The major variations occur for the dominant Al and Fe atoms with sample-6 containing the most Fe3+ cations (Table 1). EPMA results shows that the Y(sofs) are different for the six samples in this study, which is confirmed by the structure refinements (Table 3). Each two-phase sample have different Y-O distances (Figure 19c).
The Y-O distance increases the most because of the substitution of Fe3+ (radius = 0.645 Å) for Al3+ (radius = 0.535 Å), as expected for a solid solution from anhydrous grossular, Ca3Al2Si3O12, towards anhydrous andradite, Ca3Fe3+2Si3O12. For some samples, there appears to be an increase in Z-O distance and a corresponding decrease in Y-O distance, which may indicate minor hydrogarnet substitution, especially for the hydrogarnet samples studied by Basso et al. [91] and the green grossular labelled Quebec-g with the smaller unit-cell edge (Figure 19c,d).
The <D-O> distances (<D-O> = {(Z-O) + (Y-O) + (X-O) + (X’-O)}/4) vary linearly with the a unit-cell parameter, as was previously pointed out by Antao and Klincker ([6]; Figure 19b). All the data points shown in Figure 19b essentially fall on the straight line for <D-O>, but the other distances (Z-O, <X-O>, and Y-O) show some scatter (Figure 19a,c,d). Satisfactory coordination of the O atom appears to be most important for the garnet structure.
The HRPXRD results are of comparable accuracy and are very similar to the single-crystal results shown in Figure 8. However, none of the single-crystal studies observed multiple phases. Single crystal is not the appropriate technique to study a multiple-phase assemblage. Moreover, TEM studies on near-endmember grossular did not observe multiple phases [13].

3.5. Is There a Miscibility Gap between Grossular and Andradite Solid Solutions?

The two-phase intergrowths may be considered as exsolution, as was predicted by theoretical calculations, e.g., [92,93], and was also interpreted as exsolution by Hirai and Nakazawa [33,34]. However, it is puzzling to rationalize exsolution in near-endmember grossular because exsolution usually occurs midway in a solid-solution series as in the alkali feldspars and pyroxenes. Oscillatory compositional zoning in garnet is relatively common and has been attributed to changing chemical or physical conditions during growth [73,94].
Formation of a two-phase intergrowths in grossular samples may be related to crystal growth and changes in oxygen fugacity (fO2), activity of SiO2 (aSiO2), etc., as the crystals grow at relatively low temperature (<300 °C) that prevents diffusion or homogenization. Near-endmember grossular occurs in rocks that were formed by metasomatism below 300 °C [95]. Strain arises from structural mismatch of two cubic phases and gives rise to anisotropy. This study shows two-phase intergrowths in several grossular samples; each phase has different amounts of atoms on the Y site, as judged by the variation in Y-O distances and Y(sofs). Some of these ideas are confirmed in sample-5 where the yellow core is about 77% Grs and the white rim is 78 to 87% Grs, whereas the boundary is about 44% Adr, which clearly shows that the chemical conditions had changed during crystal growth.

Funding

This research was funded by a NSERC Discovery Grant to SMA, grant number 10013896.

Data Availability Statement

Not applicable.

Acknowledgments

The academic editor and two anonymous reviewers are thanked for comments that helped improve this manuscript. Sample M30122 is from the Royal Ontario Museum. Robert Marr is thanked for his help with EPMA data collection. The HRPXRD data were collected at the X-ray Operations and Research beamline 11-BM, Advanced Photon Source (APS), Argonne National Laboratory (ANL). Use of the APS was supported by the U.S. Dept. of Energy, Office of Science, Office of Basic Energy Sciences, under Contract No. DE-AC02-06CH11357.

Conflicts of Interest

The author declares no conflict of interest.

References

  1. Antao, S.M. Is near-endmember birefringent grossular non-cubic? New evidence from synchrotron diffraction. Can. Mineral. 2013, 51, 771–784. [Google Scholar] [CrossRef]
  2. Geiger, C.A.; Stahl, A.; Rossman, G.R. Raspberry-red grossular from Sierra de Cruces Range, Coahuila, Mexico. Eur. J. Mineral. 1999, 11, 1109–1113. [Google Scholar] [CrossRef]
  3. Antao, S.M. Three cubic phases intergrown in a birefringent andradite-grossular garnet and their implications. Phys. Chem. Miner. 2013, 40, 705–716. [Google Scholar] [CrossRef]
  4. Antao, S.M. The mystery of birefringent garnet: Is the symmetry lower than cubic? Powder Diffr. 2013, 28, 281–288. [Google Scholar] [CrossRef]
  5. Antao, S.M. Crystal structure of morimotoite from Ice River, Canada. Powder Diffr. 2014, 29, 325–330. [Google Scholar] [CrossRef] [Green Version]
  6. Antao, S.M.; Klincker, A.M. Origin of birefringence in andradite from Arizona, Madagascar, and Iran. Phys. Chem. Miner. 2013, 40, 575–586. [Google Scholar] [CrossRef]
  7. Antao, S.M.; Klincker, A.M. Crystal structure of a birefringent andradite-grossular from Crowsnest Pass, Alberta, Canada. Powder Diffr. 2013, 29, 20–27. [Google Scholar] [CrossRef]
  8. Antao, S.M.; Round, S.A. Crystal chemistry of birefringent spessartine. Powder Diffr. 2014, 29, 233–240. [Google Scholar] [CrossRef] [Green Version]
  9. Wang, Y.; Sun, Q.; Duan, D.; Bao, X.; Liu, X. The study of crystal structure on grossular-andradite solid solution. Minerals 2019, 9, 691. [Google Scholar] [CrossRef] [Green Version]
  10. Brauns, R. Die Optischen Anomalien der Kristalle; Preisschr. Jablonowski Ges.: Leipzig, Germany, 1891. [Google Scholar]
  11. Brewster, D. On the optical figures produced by the disintegrated surfaces of crystals. Philos. Mag. Ser. 1853, 6, 16–30. [Google Scholar] [CrossRef]
  12. Mallard, E. Anomalies optiques. Ann. Mines. Mem. VII Ser. 1876, 10, 60. [Google Scholar]
  13. Allen, F.M.; Buseck, P.R. XRD, FTIR, and TEM studies of optically anisotropic grossular garnets. Am. Mineral. 1988, 73, 568–584. [Google Scholar]
  14. Brown, D.; Mason, R.A. An occurrence of sectored birefringence in almandine from the Gangon terrane, Labrador. Can. Mineral. 1994, 32, 105–110. [Google Scholar]
  15. Deer, W.A.; Howie, R.A.; Zussman, J. Rock-Forming Minerals: Orthosilicates; Longman Group Limited: New York, NY, USA, 1982; Volume 1A, 919p. [Google Scholar]
  16. Deer, W.A.; Howie, R.A.; Zussman, J. An Introduction to the Rock-Forming Minerals, 2nd ed.; John Wiley: New York, NY, USA, 1992. [Google Scholar]
  17. Rossman, G.R.; Aines, R.D. The hydrous components in garnets: Grossular-hydrogrossular. Am. Mineral. 1991, 76, 1153–1164. [Google Scholar]
  18. Akizuki, M. Origin of optical variations in grossular-andradite garnet. Am. Mineral. 1984, 66, 403–409. [Google Scholar]
  19. Akizuki, M.; Takéuchi, Y.; Terada, T.; Kudoh, Y. Sectoral texture of a cubo-dodecahedral garnet in grandite. Neues Jahrb. Mineral. Mon. 1998, 12, 565–576. [Google Scholar]
  20. Frank-Kamenetskaya, O.V.; Rozhdestvenskaya, L.V.; Shtukenberg, A.G.; Bannova, I.I.; Skalkina, Y.A. Dissymmetrization of crystal structures of grossular-andradite garnets Ca3(Al, Fe)2(SiO4)3. Struct. Chem. 2007, 18, 493–503. [Google Scholar] [CrossRef]
  21. Griffen, D.T.; Hatch, D.M.; Phillips, W.R.; Kulaksiz, S. Crystal chemistry and symmetry of a birefringent tetragonal pyralspite75-grandite25 garnet. Am. Mineral. 1992, 77, 399–406. [Google Scholar]
  22. Kingma, K.J.; Downs, J.W. Crystal-structure analysis of a birefringent andradite. Am. Mineral. 1989, 74, 1307–1316. [Google Scholar]
  23. Shtukenberg, A.G.; Popov, D.Y.; Punin, Y.O. Growth ordering and anomalous birefringence in ugrandite garnets. Mineral. Mag. 2005, 69, 537–550. [Google Scholar] [CrossRef]
  24. Htukenberg, A.G.; Punin, Y.O.; Frank-Kamenetskaya, O.V.; Kovalev, O.G.; Sokolov, P.B.; Shtukenberg, A.G.; Punin, Y.O.; Frank-Kamenetskaya, O.V.; Kovalev, O.G.; Sokolov, P.B. On the origin of anomalous birefringence in grandite garnets. Mineral. Mag. 2001, 65, 445–459. [Google Scholar] [CrossRef]
  25. Takéuchi, Y.; Haga, N.; Umizu, S.; Sato, G. The derivative structure of silicate garnets in grandite. Z. Krist. 1982, 158, 53–99. [Google Scholar] [CrossRef]
  26. Wildner, M.; Andrut, M. The crystal chemistry of birefringent natural uvarovites: Part II. Single-crystal X-ray structures. Am. Mineral. 2001, 86, 1231–1251. [Google Scholar] [CrossRef]
  27. Cesare, B.; Nestola, F.; Johnson, T.; Mugnaioli, E.; Della Ventura, G.; Peruzzo, L.; Bartoli, O.; Viti, C.; Erickson, T. Garnet, the archetypal cubic mineral, grows tetragonal. Sci. Rep. 2019, 9, 14672. [Google Scholar] [CrossRef] [Green Version]
  28. Tančić, P.; Kremenović, A.; Vulić, P. Structural dissymmetrization of optically anisotropic Grs64±1Adr36±1Sps2 grandite from Meka Presedla (Kopaonik Mt., Serbia). Powder Diffr. 2019, 35, 7–16. [Google Scholar] [CrossRef]
  29. McAloon, B.P.; Hofmeister, A.M. Single-crystal absorption and reflection infrared spectroscopy of birefringent grossular-andradite garnets. Am. Mineral. 1993, 78, 957–967. [Google Scholar]
  30. Krivovichev, S.V.; Panikorovskii, T.L.; Yakovenchuk, V.N.; Selivanova, E.A.; Ivanyuk, G.Y. Trigonal variation in the garnet supergroup: The crystal structure of nikmelnikovite, Ca12Fe2+Fe3+3Al3(SiO4)6(OH)20, from Kovdor massif, Kola Peninsula, Russia. Mineral. Mag. 2021, 1–22. [Google Scholar] [CrossRef]
  31. Bank, H. Über grossular und hydrogrossular. Z. Dtsch. Gemmol. Ges. 1982, 31, 93–96. [Google Scholar]
  32. Ganguly, J.; Cheng, W.; O’Neill, H.S.C. Syntheses, volume, and structural changes of garnets in the pyrope-grossular join: Implications for stability and mixing properties. Am. Mineral. 1993, 78, 583–593. [Google Scholar]
  33. Hirai, H.; Nakazawa, H. Visualizing low symmetry of a grandite garnet on precession photographs. Am. Mineral. 1986, 71, 1210–1213. [Google Scholar]
  34. Hirai, H.; Nakazawa, H. Grandite garnet from Nevada: Confirmation of origin of iridescence by electron microscopy and interpretation of a moiré-like texture. Am. Mineral. 1986, 71, 123–126. [Google Scholar]
  35. Koritnig, S.; Rösch, H.; Schneider, A.; Seifert, F. Der Titan-zirkon-granat aus den Kalksilikatfels-Einschlüssen des Gabbro im Radautal, Harz, Bundesrepublik Deutschland. Tschermaks Mineral. Petrogr. Mitt. 1978, 25, 305–313. [Google Scholar] [CrossRef]
  36. Lager, G.A.; Armbruster, T.; Rotella, F.J.; Rossman, G.R. OH substitution in garnets: X-ray and neutron diffraction, infrared, and geometric-modeling studies. Am. Mineral. 1989, 74, 840–851. [Google Scholar]
  37. Manning, P.G.; Owens, D.R. Electron microprobe, X-ray diffraction, and spectral studies of South African and British Columbian “jades”. Can. Mineral. 1977, 15, 512–517. [Google Scholar]
  38. Zabinski, W. Hydrogarnets. Pr. Mineral. 1966, 3, 69. [Google Scholar]
  39. Schingaro, E.; Lacalamita, M.; Mesto, E.; Ventruti, G.; Pedrazzi, G.; Ottolini, L.; Scordari, F. Crystal chemistry and light elements analysis of Ti-rich garnets. Am. Mineral. 2016, 101, 371–384. [Google Scholar] [CrossRef]
  40. Bosi, F.; Hatert, F.; Hålenius, U.; Passero, M.; Miyawaki, R.; Mills, S.J. On the application of the IMA-CNMNC dominant-valency rule to complex mineral compositions. Mineral. Mag. 2019, 83, 627–632. [Google Scholar] [CrossRef] [Green Version]
  41. Grew, E.S.; Locock, A.J.; Mills, S.J.; Galuskina, I.O.; Galuskin, E.V.; Hålenius, U. Nomenclature of the garnet supergroup. Am. Mineral. 2013, 98, 785–811. [Google Scholar] [CrossRef]
  42. Armbruster, T.; Birrer, J.; Libowitzky, E.; Beran, A. Crystal chemistry of Ti-bearing andradites. Eur. J. Mineral. 1998, 10, 907–921. [Google Scholar] [CrossRef]
  43. Moore, T. What’s new in minerals. Mineral. Rec. 1998, 29, 128. [Google Scholar]
  44. Ferrando, S.; Frezzotti, M.L.; Orione, P.; Conte, R.C.; Compagnoni, R. Late-Alpine rodingitization in the Bellecombe meta-ophiolites (Aosta Valley, Italian Western Alps): Evidence from mineral assemblages and serpentinization-derived H2-bearing brine. Int. Geol. Rev. 2010, 52, 1220–1243. [Google Scholar] [CrossRef]
  45. Locock, A.J. An excel spreadsheet to recast analyses of garnet into end-member components, and a synopsis of the crystal chemistry of natural silicate garnets. Comput. Geosci. 2008, 34, 1769–1780. [Google Scholar] [CrossRef]
  46. Antao, S.M.; Hassan, I.; Wang, J.; Lee, P.L.; Toby, B.H. State-of-the-art high-resolution powder X-ray diffraction (HRPXRD) illustrated with Rietveld structure refinement of quartz, sodalite, tremolite, and meionite. Can. Mineral. 2008, 46, 1501–1509. [Google Scholar] [CrossRef]
  47. Lee, P.L.; Shu, D.; Ramanathan, M.; Preissner, C.; Wang, J.; Beno, M.A.; Von Dreele, R.B.; Ribaud, L.; Kurtz, C.; Antao, S.M.; et al. A twelve-analyzer detector system for high-resolution powder diffraction. J. Synchrotron Radiat. 2008, 15, 427–432. [Google Scholar] [CrossRef]
  48. Wang, J.; Toby, B.H.; Lee, P.L.; Ribaud, L.; Antao, S.M.; Kurtz, C.; Ramanathan, M.; Von Dreele, R.B.; Beno, M.A. A dedicated powder diffraction beamline at the advanced photon source: Commissioning and early operational results. Rev. Sci. Instrum. 2008, 79, 085105. [Google Scholar] [CrossRef]
  49. Antao, S.M.; Dhaliwal, I. Growth oscillatory zoning in erythrite, ideally Co3(AsO4)2·8H2O: Structural variations in vivianite-group minerals. Minerals 2017, 7, 136. [Google Scholar] [CrossRef]
  50. Antao, S.M.; Hassan, I.; Crichton, W.A.; Parise, J.B. Effects of high pressure and temperature on cation ordering in magnesioferrite, MgFe2O4, using in situ synchrotron X-ray powder diffraction up to 1430 K and 6 GPa. Am. Mineral. 2005, 90, 1500–1505. [Google Scholar] [CrossRef]
  51. Antao, S.M.; Hassan, I.; Mulder, W.H.; Lee, P.L. The R-3cR-3m transition in nitratine, NaNO3, and implications for calcite, CaCO3. Phys. Chem. Miner. 2008, 35, 545–557. [Google Scholar] [CrossRef]
  52. Ehm, L.; Michel, F.M.; Antao, S.M.; Martin, C.D.; Lee, P.L.; Shastri, S.D.; Chupas, P.J.; Parise, J.B. Structural changes in nanocrystalline mackinawaite (FeS) at high pressure. J. Appl. Crystallogr. 2009, 42, 15–21. [Google Scholar] [CrossRef]
  53. Hassan, I.; Antao, S.M.; Hersi, A.A. Single-crystal XRD, TEM, and thermal studies of the satellite reflections in nepheline. Can. Mineral. 2003, 41, 759–783. [Google Scholar] [CrossRef]
  54. Hassan, I.; Antao, S.M.; Parise, J.B. Haüyne: Phase transition and high-temperature structures obtained from synchrotron radiation and Rietveld refinements. Mineral. Mag. 2004, 68, 499–513. [Google Scholar] [CrossRef]
  55. Parise, J.B.; Antao, S.M.; Michel, F.M.; Martin, C.D.; Chupas, P.J.; Shastri, S.; Lee, P.L. Quantitative high-pressure pair distribution function analysis. J. Synchrotron Radiat. 2005, 12, 554–559. [Google Scholar] [CrossRef]
  56. Ehm, L.; Antao, S.M.; Chen, J.H.; Locke, D.R.; Michel, F.M.; Martin, C.D.; Yu, T.; Parise, J.B.; Lee, P.L.; Chupas, P.J.; et al. Studies of local and intermediate range structure in crystalline and amorphous materials at high pressure using high-energy X-rays. Powder Diffr. 2007, 22, 108–112. [Google Scholar] [CrossRef] [Green Version]
  57. Skinner, L.B.; Benmore, C.J.; Antao, S.M.; Soignard, E.; Amin, S.A.; Bychkov, E.; Rissi, E.; Parise, J.B.; Yarger, J.L. Structural changes in vitreous GeSe4 under pressure. J. Phys. Chem. 2011, 116, 2212–2217. [Google Scholar] [CrossRef]
  58. Antao, S.M.; Hassan, I. Thermal analyses of sodalite, tugtupite, danalite, and helvite. Can. Mineral. 2002, 40, 163–172. [Google Scholar] [CrossRef] [Green Version]
  59. Zaman, M.; Schubert, M.; Antao, S. Elevated radionuclide concentrations in heavy mineral-rich beach sands in the Cox’s Bazar region, Bangladesh and related possible radiological effects. Isot. Environ. Health Stud. 2012, 48, 512–525. [Google Scholar] [CrossRef]
  60. Kitamura, K.; Komatsu, H. Optical anisotropy associated with growth striation of yttrium garnet, Y3(Al,Fe)5O12. Krist. Technik. 1978, 13, 811–816. [Google Scholar] [CrossRef]
  61. Rietveld, H.M. A profile refinement method for nuclear and magnetic structures. J. Appl. Crystallogr. 1969, 2, 65–71. [Google Scholar] [CrossRef]
  62. Larson, A.C.; Von Dreele, R.B. General Structure Analysis System (GSAS); Los Alamos National Laboratory Report, LAUR 86-748; Los Alamos National Laboratory: Los Alamos, NM, USA, 2000.
  63. Toby, B.H. EXPGUI, a graphical user interface for GSAS. J. Appl. Crystallogr. 2001, 34, 210–213. [Google Scholar] [CrossRef] [Green Version]
  64. Cagliotti, G.; Paoletti, A.; Ricci, F.P. Choice of collimators for a crystal spectrometer for neutron diffraction. Nucl. Instrum. 1958, 3, 223–228. [Google Scholar] [CrossRef]
  65. Thompson, P.; Cox, D.E.; Hastings, J.B. Rietveld refinement of Debye-Scherrer synchrotron X-ray data from alumina. J. Appl. Crystallogr. 1987, 20, 79–83. [Google Scholar] [CrossRef] [Green Version]
  66. Antao, S.M.; Salvador, J.J. Crystal chemistry of birefringent uvarovite solid solutions. Minerals 2019, 9, 395. [Google Scholar] [CrossRef] [Green Version]
  67. Antao, S.M.; Mohib, S.; Zaman, M.; Marr, R.A. Ti-rich andradites: Chemistry, structure, multi-phases, optical anisotropy, and oscillatory zoning. Can. Mineral. 2015, 53, 133–158. [Google Scholar] [CrossRef]
  68. Antao, S.M.; Zaman, M.; Gontijo, V.L.; Camargo, E.S.; Marr, R.A. Optical anisotropy, zoning, and coexistence of two cubic phases in andradites from Quebec and New York. Contrib. Mineral. Petrol. 2015, 169, 10. [Google Scholar] [CrossRef]
  69. Antao, S.M.; Cruickshank, L.A. Two cubic phases in kimzeyite garnet from the type locality Magnet Cove, Arkansas. Acta Crystallogr. 2016, B72, 846–854. [Google Scholar] [CrossRef]
  70. Antao, S.M. Schorlomite and morimotoite: What’s in a name? Powder Diffr. 2014, 29, 346–351. [Google Scholar] [CrossRef]
  71. Antao, S.M.; Cruickshank, L.A. Crystal structure refinements of tetragonal (OH,F)-rich spessartine and henritermierite garnets. Acta Crystallogr. 2018, B74, 104–114. [Google Scholar] [CrossRef]
  72. Akizuki, M. Growth structure and crystal symmetry of grossular garnets from the Jeffrey mine, Asbestos, Quebec, Canada. Am. Mineral. 1989, 74, 859–864. [Google Scholar]
  73. Jamtveit, B. Oscillatory zonation patterns in hydrothermal grossular-andradite garnet: Nonlinear dynamics in regions of immiscibility. Am. Mineral. 1991, 76, 1319–1327. [Google Scholar]
  74. Pollok, K.; Jamtveit, B.; Putnis, A. Analytical transmission electron microscopy of oscillatory zoned grandite garnets. Contrib. Mineral. Petrol. 2001, 141, 358–366. [Google Scholar] [CrossRef]
  75. Antao, S.M.; Hassan, I. A two-phase intergrowth of genthelvite from Mont Saint-Hilaire, Quebec. Can. Mineral. 2010, 48, 1217–1223. [Google Scholar] [CrossRef]
  76. Antao, S.M. Linear structural trends and multi-phase intergrowths in helvine-group minerals, (Zn,Fe,Mn)8[Be6Si6O24]S2. Minerals 2021, 11, 325. [Google Scholar] [CrossRef]
  77. Antao, S.M.; Hovis, G.L. Structural variations across the nepheline (NaAlSiO4)-kalsilite (KAlSiO4) series. Am. Mineral. 2021, 106, 801–811. [Google Scholar] [CrossRef]
  78. Antao, S.M.; Nicholls, J.W. Crystal chemistry of three volcanic K-rich nepheline samples from Oldoinyo Lengai, Tanzania and Mount Nyiragongo, Eastern Congo, Africa. Front. Earth Sci. 2018. [Google Scholar] [CrossRef]
  79. Zaman, M.M.; Antao, S.M. A possible radiation-induced transition from monazite-(Ce) to xenotime-(Y). Minerals 2021, 11, 16. [Google Scholar] [CrossRef]
  80. Ivanova, T.I.; Shtukenberg, A.G.; Punin, Y.O.; Frank-Kamenetskaya, O.V.; Sokolov, P.B. On the complex zonality in grandite garnets and implications. Mineral. Mag. 1998, 62, 857–868. [Google Scholar] [CrossRef]
  81. Baur, W.H.; Fischer, R.X. On the significance of small deviations from higher symmetry. Mineral. Mag. 2003, 67, 793–797. [Google Scholar] [CrossRef]
  82. Baur, W.H.; Tillmanns, E. How to avoid unnecessarily low symmetry in crystal structure determination. Acta Crystallogr. 1986, b42, 95–111. [Google Scholar] [CrossRef]
  83. Andrut, M.; Wildner, M. The crystal chemistry of birefringent natural uvarovites: Part I. Optical investigations and UV-VIS-IR absorption spectroscopy. Am. Mineral. 2001, 86, 1219–1230. [Google Scholar] [CrossRef]
  84. Antao, S.M. Crystal chemistry of birefringent hydrogrossular. Phys. Chem. Miner. 2015, 42, 455–474. [Google Scholar] [CrossRef]
  85. Armbruster, T. Structure refinement of hydrous andradite, Ca3Fe1.54Mn0.02Al0.26(SiO4)1.65(O4H4)1.35, from the Wessels mine, Kalahari manganese field, South Africa. Eur. J. Mineral. 1995, 7, 1221–1225. [Google Scholar] [CrossRef]
  86. Ferro, O.; Galli, E.; Papp, G.; Quartieri, S.; Szakall, S.; Vezzalini, G. A new occurrence of katoite and re-examination of the hydrogrossular group. Eur. J. Mineral. 2003, 15, 419–426. [Google Scholar] [CrossRef]
  87. Basso, R.; Cimmino, F.; Messiga, B. Crystal chemical and petrological study of hydrogarnets from a Fe-gabbro metarodingite (Gruppo Di Voltri, Western Liguria, Italy). Neues Jahrb. Mineral. Abh. 1984, 150, 247–258. [Google Scholar]
  88. Novak, G.A.; Gibbs, G.V. The crystal chemistry of the silicate garnets. Am. Mineral. 1971, 56, 1769–1780. [Google Scholar]
  89. Lager, G.A.; Rossman, G.R.; Rotella, F.J.; Schultz, A.J. Neutron-diffraction structure of a low-water grossular at 20 K. Am. Mineral. 1987, 72, 766–768. [Google Scholar]
  90. Geiger, C.A.; Armbruster, T. Mn3Al2Si3O12 spessartine and Ca3Al2Si3O12 grossular garnet: Structural dynamic and thermodynamic properties. Am. Mineral. 1997, 82, 740–747. [Google Scholar] [CrossRef]
  91. Basso, R.; Cimmino, F.; Messiga, B. Crystal chemistry of hydrogarnets from three different microstructural sites of a basaltic metarodingite from the Voltri Massif (Western Liguria, Italy). Neues Jahrb. Mineral. Abh. 1984, 148, 246–258. [Google Scholar]
  92. Becker, U.; Pollok, K. Molecular simulations of interfacial and thermodynamic mixing properties of grossular-andradite garnets. Phys. Chem. Miner. 2002, 29, 52–64. [Google Scholar] [CrossRef]
  93. Ganguly, J. The energetics of natural garnet solid solution II. Mixing of the calcium silicate end-members. Contrib. Mineral. Petrol. 1976, 55, 81–90. [Google Scholar] [CrossRef]
  94. Stowell, H.H.; Menard, T.; Ridgway, C.K. Ca-metasomatism and chemical zonation of garnet in contact metamorphic aureoles, Juneau Gold Belt, Southeastern Alaska. Can. Mineral. 1996, 34, 1195–1209. [Google Scholar]
  95. Evans, B.W.; Johannes, J.; Oterdoom, H.; Trommsdorff, V. Stability of chrysotile and antigorite in the serpentinite multisystem. Schweiz. Mineral. Petrogr. Mitt. 1976, 56, 79–93. [Google Scholar]
Figure 1. Projection of a section of the grossular structure down the c axis showing the XO8 dodecahedra (yellow), YO6 octahedra (orange), ZO4 tetrahedra (grey), and O atoms (green spheres). The prominent edge-sharing and zig-zag arrangement of alternating octahedra and dodecahedra are clear from the four unit cells outlined (black lines). The X and Z sites contain Ca and Si atoms, respectively. The Y site contains both Al and Fe atoms.
Minerals 11 00767 g001
Figure 2. Samples used in this study are (1) “white jade” from Lytton, British Columbia, Canada; (2) orange-brown “hessonite” grossular from Tanzania; (3) euhedral crystals of raspberry-red grossular from Coahuila, Mexico; (4) deep-pink grossular from Chihuahua, Mexico; (5) grossular from Chihuahua, Mexico with a yellow core and a creamy-white outer layer. The dark material between the yellow and white parts is andradite. Both the white and yellow parts were used in this study. (6) Well-developed euhedral crystals of red grossular from Aosta, Italy.
Minerals 11 00767 g002
Figure 3. Thin-section images for birefringent grossular samples from Mexico: (a,b) raspberry-red sample-3 from Coahuila, (c,d) pink sample-4 from Chihuahua-p, and (e,f) creamy-white sample-5 from Chihuahua-w; (a,c,e) are in plane-polarized light (PPL), whereas (b,d,f) are in cross-polarized light (XPL). Birefringent, lamellar, mottled, or tweed-like features are contained in these samples. The scale bars in each image represent 100 μm. The lamellar features in (c,d) may represent different phases.
Minerals 11 00767 g003
Figure 4. Thin-section images for sample-5 from Chihuahua, Mexico: (ad) are plane-polarized light (PPL) and (eh) are the corresponding cross-polarized light (XPL) images. In (a,b), the white rim of the crystal is indicated by w, the yellow core is indicated by y, and the northeast diagonal band is the boundary (B) between w and y. Image (h) contains chevron features. Images (e,f) contain lamellar features, which may represent different phases. A euhedral face of the crystal (c,h) shows some mottling features. Important crystal features are only observed along special directions. The scale bar for all the images are shown in (a) and represents 1 mm.
Minerals 11 00767 g004
Figure 5. Backscattered electron (BSE) image (a) for a birefringent grossular sample-3 from Coahuila, Mexico, that corresponds to that in Figure 3a,b. This sample-3 contains two phases that have different contrast. The light bands and lines are parallel to the right edge of the crystal. A line scan along the line A to B in (a) is displayed in (b) and shows the inverse compositional variations in Al3+ and Fe3+ cations, whereas the Ca content is constant. The scale bar in (a) represents 100 μm. The line scan units are arbitrary.
Minerals 11 00767 g005
Figure 6. (a) Backscattered electron (BSE) image and elemental maps for sample-4 from Chihuahua-p, Mexico, showing (b) Ca content, (c) Al content, and (d) Fe content. Two separate phases may be deduced from the elemental maps, but such phases are most easily detected by HRPXRD (Figure 11). The intergrowths of two phases have contact boundaries that are parallel to northwest. Cations from the points marked 1 to 9 in (a) are shown in Figure 7b. A line scan from A to B in (a) across the crystal is provided (Figure 7a).
Minerals 11 00767 g006
Figure 7. (a) Line scans along the line A to B in (Figure 6a) showing the inverse relation between Fe3+ and Al3+ cation content and nearly homogeneous Ca content for sample-4 from Chihuahua-p, Mexico. Two separate phases may be deduced from the line scans and the elemental maps in Figure 6, but such phases are most easily detected by HRPXRD (Figure 11). (b) Quantitative chemical analyses from points 1 to 9 showing the inverse relation between Al and Fe atoms in the Y site (Figure 6a). Note that Fe + Al = 2 apfu. The line scan units are arbitrary.
Minerals 11 00767 g007
Figure 8. BSE images and elemental maps from two areas of sample-5 from Chihuahua-w, -y, and B (boundary between w and y), Mexico, are shown. The different parts of the crystal are labelled in (c), where the white outer layer of the crystal is indicated by w, the yellow core is indicated by y, and B is the boundary between w and y. Left and right columns represents the two different areas. The left column displays both w and y parts of grossular separated by B, which is andradite. The right column displays only the white outer layer of the crystal. (a,e) Backscattered electron (BSE) images and their corresponding elemental maps are shown in their respective columns. (b,f) Al content, (c,g) Fe content, and (d,h) Ti content. Chevron zig-zag features are clearly observed in (e,h) because the two cubic phases contain different amounts of Ti atoms. The inverse relation between Fe and Al atoms is contained in the images.
Minerals 11 00767 g008
Figure 9. Images for sample-6 from Aosta, Italy. Thin-section images are in (a) plane-polarized light (PPL) and (b) cross-polarized light (XPL) that shows birefringence. (c) The BSE image contains light and dark contrasts that indicate different compositions. The X-ray elemental maps show the distribution of (d) Al, (e) Fe, and (f) Ti atoms. Chemical analyses were obtained from the points marked 1 to 10 in (c). Concentric growth features are observed in the BSE image and in the atom distribution maps. Subtle compositional differences are observed. The BSE image, elemental maps, and optical images have the same orientation and scale. The scale bar in (c) represents 100 μm.
Minerals 11 00767 g009
Figure 10. (a) Line scans along the line A to B in Figure 9c showing the inverse relation between Fe3+ and Al3+ cations, homogeneous Ca, and variable Ti distributions. The scans indicate Fe-poor and Fe-rich phases. (b) Quantitative chemical analyses from points 1 to 10 showing the inverse relation between Al and Fe atoms in the Y site (Figure 9c; Table 1). Note that Fe + Al = 2 apfu. The line scan units are arbitrary.
Minerals 11 00767 g010
Figure 11. Complete HRPXRD traces for (a) sample-1 from Lytton, Canada, and (b) sample-4 from Chihuahua-p, Mexico. Data for sample-4 were modelled using two slightly different cubic phases, whereas sample-1 was modelled with a single cubic phase. The difference curve (IobsIcalc) is shown at the bottom. Short vertical lines indicate allowed reflection positions. The intensities and difference curves that are above 20° and 40° 2θ are multiplied by 10 and 40, respectively. Similar features are displayed in other traces shown. To avoid repetition, these descriptions will not be repeated.
Minerals 11 00767 g011
Figure 12. Complete HRPXRD traces for the grossular samples from (a) Tanzania (sample-2) and (b) Coahuilla, Mexico (sample-3). Data for sample-3 was modelled using two slightly different cubic phases, whereas sample-2 was modelled with a single cubic phase.
Minerals 11 00767 g012
Figure 13. Complete HRPXRD traces for sample-5 from Chihuahua, Mexico. The trace in (a) is from the white part of the crystal and that in (b) is from the yellow core of the crystal. Data for sample-4 was modelled using two slightly different cubic phases.
Minerals 11 00767 g013
Figure 14. Complete HRPXRD trace for sample-6 from Italy. Data for sample-6 was modelled using two slightly different cubic phases.
Minerals 11 00767 g014
Figure 15. Expanded scale for the same reflections from (a) Lytton (sample-1) and (b) Chihuahua-p (sample-4) samples. Each reflection peak in (b) is clearly split into two because of the two different cubic phases, whereas those for the single cubic phase in (a) are sharp, narrow, and symmetrical.
Minerals 11 00767 g015
Figure 16. The same reflections are displayed for samples from (a) Tanzania (sample-2) and (b) Coahuilla, Mexico (sample-3). Each reflection peak in (b) is clearly asymmetric because of two different cubic phases, whereas those for the single cubic phase in (a) are sharp, narrow, and symmetrical.
Minerals 11 00767 g016
Figure 17. The same reflections are displayed for the two-phase samples from (a) Chihuahua-y, Mexico (sample-5) and (b) Chihuahua-w, Mexico (sample-5). Each reflection peak in (a) is asymmetric because of two different cubic phases, whereas those in (b) show clear splitting from the two phases.
Minerals 11 00767 g017
Figure 18. Expanded scale for sample-6 from Italy. Each reflection peak is clearly asymmetric because of two different cubic phases in the sample. There is a small hump on the left side off each reflection, especially the 12,6,6 reflection.
Minerals 11 00767 g018
Figure 19. Structural variations for grossular samples. (a) Average <X-O>, (b) mean <D-O>, (c) Y-O, and (d) Z-O distances vary linearly with the a unit-cell parameter that range from 11.840 to 11.951 Å. The range on the y-axis (0.08 Å) is the same in each plot, so the differences in each plot can be compared (also from the slopes of the trend lines). Straight lines are meant as guide to the eyes. The Z-O distances are nearly constant. The average <X-O> and <D-O> distances change by small amounts compared to the Y-O distance that changes the most and has the steepest slope. The Y site controls the structural variations. Data from Antao [1] for grossular samples from Quebec, Tanzania, and Afghanistan are shown as open circles. Single-crystal data for seven samples are shown as triangles [87,88,89,90,91]. Errors bars are smaller than the symbols. Data from this study shows details that were not observed in previous SCXRD studies, which is an inappropriate technique to examine multiphase samples.
Minerals 11 00767 g019
Table 1. EPMA results for six grossular samples.
Oxide (wt.%)1. Lytton2. Tanzania3. Coahuila4. Chihuahua-p
Phase-3aPhase-3bPhase-4aPhase-4b
SiO239.7040.0240.2540.4439.4839.26
TiO20.000.040.210.120.010.10
Al2O322.1021.0622.5022.5722.2219.32
Cr2O30.010.000.000.0200.00
Fe2O30.622.460.230.350.24.43
MnO0.020.111.071.251.630.16
MgO0.010.000.800.820.450.29
CaO36.9837.2535.6135.6134.9236.12
99.44100.94100.66101.1898.999.68
Cations for 12 O atoms
Ca2+2.9942.9922.8442.8312.8432.957
Mn2+0.0010.0070.0670.0780.1050.010
Mg2+0.0010.0000.0890.0910.0510.033
∑X2.9962.9993.0003.0002.9993.000
Al3+1.9681.8601.9761.9731.9901.739
Fe3+0.0350.1390.0130.0190.0110.255
Ti4+0.0000.0020.0110.0070.0010.006
Cr3+0.0010.0000.0000.0010.0000.000
∑Y2.0042.0012.0002.0002.0012.000
Z = Si4+3.0003.0003.0003.0003.0003.000
End member mole %
Grossular (Grs)98.3192.7893.6193.0194.2985.54
Andradite (Adr)1.456.930.640.960.4612.73
Pyrope (Prp)0.040.002.963.041.71.1
Spessartine (Sps)0.040.232.242.613.490.34
Uvarovite (Uv)0.030.0093.0193.010.000.00
Schorlomite-Al0.000.010.960.960.000.00
Morimotoite-Mg0.000.003.043.040.000.00
Oxide (wt. %)5. Chihuahua-w 5. Chihuahua-y 5. Chihuahua-B 6. Italy
Phase-5aPhase-5bPhase-5cPhase-5dPhase-5ePhase-6aPhase-6b
SiO238.9738.5539.0639.0437.8739.7939.16
TiO20.031.761.241.124.980.150.17
Al2O319.3717.1317.1017.108.7018.3316.77
Cr2O30.000.000.010.000.000.000.03
Fe2O34.205.546.556.7114.916.428.24
MnO0.140.100.170.200.120.160.56
MgO0.000.000.000.010.000.340.35
CaO36.2435.9236.3436.2535.2836.5235.63
98.9599.00100.47100.43101.86101.71100.91
Cations for 12 O atoms
Ca2+2.9892.9952.9902.9852.9942.9502.924
Mn2+0.0090.0070.0110.0130.0000.0100.036
Mg2+0.0000.0000.0000.0010.0000.0390.040
∑X2.9983.0023.0012.9993.0022.9993.000
Al3+1.7571.5711.5481.5490.8121.6281.514
Fe3+0.2430.3240.3790.3880.8890.3640.475
Ti4+0.0020.1030.0720.0650.2970.0090.010
Cr3+0.0000.0000.0010.0000.0000.0000.002
∑Y2.0021.9981.9992.0011.9982.0012.000
Z = Si4+3.0003.0003.0003.0003.0003.0003.000
End member mole %
Grossular (Grs)87.5478.3377.0276.9540.3379.7873.16
Andradite (Adr)12.0716.2218.9319.4044.4418.2223.74
Pyrope (Prp)0.000.000.000.040.001.281.33
Spessartine (Sps)0.300.220.370.430.270.341.20
Uvarovite (Uv)0.000.000.030.000.000.000.00
Schorlomite-Al0.010.000.010.000.010.000.00
Morimotoite-Mg 0.000.000.000.000.0000.000.00
p = pink (sample-4), w = white, y = yellow, B = boundary (phase-5e) between white and yellow parts of sample-5. Numbers in bold represent the dominant end member.
Table 2. HRPXRD data and Rietveld refinement statistics for six grossular samples.
1. Lytton2. Tanzania3. Coahuila4. Chihuahua-p
Single-PhaseSingle-PhasePhase-3aPhase-3bPhase-4aPhase-4b
wt.%10010056.8(1)43.2(1)72.5(1)27.5(1)
a (Å)11.85091(1)11.85286(1)11.85202(1)11.85760(8)11.85100(1)11.87186(5)
* Δa (Å)---−0.00558-−0.02086
LY4.023.145.3111.757.524.8
** Strain (%)0.070.050.090.210.130.43
Reduced χ21.2621.0021.537 1.256
 R (F2)0.03430.04700.0455 0.0403
wRp0.05200.04890.0656 0.0605
Nobs6786461325 1363
λ (Å)0.41374(2)0.41370(2)0.41370(2) 0.41370(2)
Data points479924799547995 47995
5. Chihuahua-w5. Chihuahua-y6. Italy
Phase-5aPhase-5bPhase-5cPhase-5dPhase-6aPhase-6b
wt.%63.3(1)36.7(1)60.1(3)39.9(3)63.9(1)36.1(2)
a (Å)11.87775(1)11.88285(1)11.89069(1)11.89468(3)11.88242(2)11.89553(7)
* Δa (Å)-−0.00510-−0.00399-−0.01311
LY5.639.724.788.868.223.9
** Strain (%)0.100.170.080.150.140.42
Reduced χ21.221 0.9869 1.185
 R (F2)0.0581 0.0243 0.0299
wRp0.0521 0.0316 0.0412
Nobs1296 1248 1007
λ (Å)0.41370(2) 0.45900(2) 0.45900(2)
Data points47995 47994 47994
* The strain and birefringence are proportional to Δa = (asubstrateafilm) [60]. For example, Δa = a(phase-3a) − a(phase-3b). The profile term LY is also a measure of strain. ** Isotropic strain (%) = 100 × LY × (π/18000). The minor phase is under more strain than the dominant phase and causes strain-induced birefiringence in cubic garnets.  R (F2) = Overall R-structure factor based on observed and calculated structure amplitudes = [Σ(Fo2Fc2)/Σ(Fo2)]1/2. The 2θ range = 2–50°.
Table 3. Atom coordinates *, isotropic displacement parameters, U × 100 (Å2), and sofs for six grossular samples.
1. Lytton2. Tanzania3. Coahuila4. Chihuahua-p
Single-PhaseSingle-PhasePhase-3aPhase-3bPhase-4aPhase-4b
Ca(X)U0.43(1)0.45(1)0.47(1)0.47(1)0.48(1)0.48(1)
Al(Y)U0.32(1)0.32(1)0.36(1)0.36(1)0.33(1)0.33(1)
Si(Z)U0.26(1)0.29(1)0.37(1)0.37(1)0.30(1)0.30(1)
Ox0.03835(3)0.03820(3)0.03791(7)0.0382(1)0.03818(4)0.0385(1)
y0.04505(2)0.04526(3)0.04525(7)0.0457(1)0.04516(4)0.0456(1)
z0.65121(3)0.65129(3)0.65144(9)0.6517(1)0.65120(5)0.6517(1)
U0.76(1)0.79(1)0.88(1)0.88(1)0.82(1)0.82(1)
Ca(X)sof0.944(1)0.952(1)0.949(2)0.928(3)0.947(1)0.946(3)
Al(Y)sof0.950(1)0.993(1)0.947(3)0.984(3)0.951(2)0.972(3)
Fe(Y)sof0.050(1)0.007(1)0.053(3)0.016(3)0.049(2)0.028(3)
Si(Z)sof0.937(1)0.938(1)0.932(2)0.950(3)0.937(1)0.932(3)
Ca(X)EPMA0.9991.0000.9940.9941.0020.996
Al(Y)EPMA0.9840.9300.9880.9870.9950.870
Fe(Y)EPMA0.0180.0700.0070.0100.0060.128
Si(Z)EPMA1.0001.0001.0001.0001.0001.000
Ca(X) Δ(sof)−0.055−0.048−0.045−0.066−0.055−0.050
Al(Y)Δ(sof)−0.0340.063−0.041−0.003−0.0440.103
Fe(Y)Δ(sof)0.033−0.0630.0470.0070.044−0.100
Si(Z)Δ(sof)−0.063−0.062−0.068−0.050−0.063−0.068
Ca(X) Δe−1.1−1.0−0.9−1.3−1.1−1.0
Al(Y)Δe−0.40.8−0.50.0−0.61.3
Fe(Y)Δe0.8−1.61.20.21.1−2.6
Si(Z)Δe−0.9−0.9−1.0−0.7−0.9−1.0
5. Chihuahua-w5. Chihuahua-y6. Italy
Phase-5aPhase-5aPhase-5cPhase-5dPhase-6aPhase-6b
Ca(X)U0.45(1)0.45(1)0.461(4)0.461(4)0.490(6)0.490(6)
Al(Y)U0.37(1)0.37(1)0.330(5)0.330(5)0.326(6)0.326(6)
Si(Z)U0.37(1)0.37(1)0.375(6)0.375(6)0.335(9)0.335(9)
Ox0.03883(5)0.03785(8)0.03870(6)0.03839(5)0.03839(5)0.03758(8)
y0.04503(5)0.04714(8)0.04565(6)0.04602(5)0.04574(4)0.04643(8)
z0.65182(6)0.65225(9)0.65200(6)0.65221(5)0.65192(5)0.65225(9)
U0.89(1)0.89(1)0.945(7)0.945(7)0.997(9)0.997(9)
Ca(X)sof0.937(2)0.940(2)0.951(2)0.934(1)0.939(1)0.953(2)
Al(Y)sof0.970(2)0.927(3)0.889(2)0.872(1)0.909(1)0.834(2)
Fe(Y)sof0.030(2)0.073(3)0.111(2)0.128(1)0.091(1)0.166(2)
Si(Z)sof0.933(2)0.935(2)0.938(2)0.943(1)0.926(1)0.919(2)
Ca(X)EPMA sof1.0001.0011.0011.0010.9950.998
Al(Y)EPMA sof0.8790.7860.7740.7750.8140.757
Fe(Y)EPMA sof0.1220.1620.1900.1940.1820.238
Si(Z)EPMA sof1.0001.0001.0001.0001.0001.000
Ca(X) Δ(sof)−0.063−0.061−0.050−0.067−0.056−0.045
Al(Y)Δ(sof)0.0920.1420.1150.0980.0950.077
Fe(Y)Δ(sof)−0.092−0.089−0.079−0.066−0.091−0.072
Si(Z)Δ(sof)−0.067−0.065−0.062−0.057−0.074−0.081
Ca(X) Δe−1.3−1.2−1.0−1.3−1.1−0.9
Al(Y)Δe1.21.81.51.31.21.0
Fe(Y)Δe−2.4−2.3−2.0−1.7−2.4−1.9
Si(Z)Δe−0.9−0.9−0.9−0.8−1.0−1.1
* X at (0, ¼, ⅛) with Ca dominant, Y at (0, 0, 0) with Al dominant, and Z at (⅜, 0, ¼) with Si dominant. O(sof) was fixed at 1.0. U parameter for the same site in phases 1 and 2 in each sample were constrained to be equal. Δ(sof) = sof (HRPXRD refinement)−sof (EPMA). Δe = electrons (HRPXRD refinement)−electrons (EPMA). For the last three rows, Δ(X sof) = difference between sofs obtained by refinements for the two phases, etc.
Table 4. Selected bond distances (Å) in six grossular samples.
1. Lytton2. Tanzania3. Coahuila4. Chihuahua-p
Phase-1Phase-2Phase-3aPhase-3bPhase-4aPhase-4b
Z-Ox41.6463(3)1.6478(4)1.649(1)1.647(1)1.6481(5)1.648(1)
Y-Ox61.9242(3)1.9257(4)1.926(1)1.932(2)1.9240(6)1.934(2)
X-Ox42.3244(3)2.3235(3)2.320(1)2.323(1)2.3232(5)2.328(1)
X′-Ox42.4905(3)2.4882(3)2.488(1)2.485(1)2.4888(5)2.489(1)
<X-O>[8]2.40752.40592.4042.4042.40602.409
* <D-O>[4]2.09642.09632.0962.0972.09602.100
∠Y-O-Z x1136.03(2)135.83(2)135.70(6)135.50(8)135.90(3)135.62(7)
5. Chihuahua-w5. Chihuahua-y6. Italy
Phase-5aPhase-5bPhase-5cPhase-5dPhase-6aPhase-6b
Z-Ox41.6412(7)1.654(1)1.6449(7)1.6475(6)1.6470(6)1.655(1)
Y-Ox61.9367(7)1.947(1)1.9425(7)1.9457(6)1.9397(6)1.946(1)
X-Ox42.3308(6)2.326(1)2.3326(6)2.3301(5)2.3287(5)2.323(1)
X′-Ox42.4982(6)2.474(1)2.4938(7)2.4900(6)2.4903(5)2.484(1)
<X-O>[8]2.41452.4002.41292.41032.40952.404
* <D-O>[4]2.10172.1002.10332.10342.10142.102
∠Y-O-Zx1136.06(4)134.42(6)135.62(4)135.26(3)135.484(34)134.72(6)
* <D-O> = {(Z-O) + (Y-O) + (X-O) + (X′-O)}/4, which is the average distance from the four-coordinated O atom.
Publisher’s Note: MDPI stays neutral with regard to jurisdictional claims in published maps and institutional affiliations.

