Article

The Colors of the Circus Mosaic from Barcino (Roman Barcelona): Characterization, Provenance, and Technology Issues

1
Departament de Geologia, Universitat Autònoma de Barcelona (UAB), Edifici C, 08193 Cerdanyola del Vallès, Catalonia, Spain
2
Institut Català d’Arqueologia Clàssica (ICAC), Plaça d’en Rovellat, 43003 Tarragona, Catalonia, Spain
3
Departamento de Ciències de l’Antiguitat i de l’Edad Mitjana, Universitat Autònoma de Barcelona (UAB), Edifici B, 08193 Cerdanyola del Vallès, Catalonia, Spain
4
Departamento de Geología, Geografía y Medio Ambiente, Facultad de Ciencias, Campus Científico Tecnológico, Universidad de Alcalá (UAH), 28805 Alcalá de Henares, Spain
5
ALBA Synchrotron Light Source, 08290 Barcelona, Spain
6
Department of Geosciences, IDAEA-CSIC, Jordi Girona 18-26, 08034 Barcelona, Catalonia, Spain
7
Museu d’Arqueologia de Catalunya, Passeig de Santa Madrona, 39, 08038 Barcelona, Catalonia, Spain
8
Freelance Conservator-Restorer, c/Sancho de Ávila 119, 10è, 5a, 08018 Barcelona, Catalonia, Spain
*
Author to whom correspondence should be addressed.
Minerals 2021, 11(7), 746; https://doi.org/10.3390/min11070746
Submission received: 7 June 2021 / Revised: 6 July 2021 / Accepted: 7 July 2021 / Published: 9 July 2021
(This article belongs to the Special Issue Colours in Minerals and Rocks)

Abstract

:
Archaeometric studies on mosaics often concentrate only on glass tesserae, while comprehensive studies including both stone and glass tesserae are scarce; however, both types of tesserae can sometimes bring relevant data to elaborate archaeological knowledge on a studied mosaic. In this paper, a representative set of tesserae from a large polychrome Roman mosaic retrieved in Barcelona (NE Spain) is investigated using various methods. Most of the techniques were directly applied on samples prepared as petrographic thin sections (including polarized-light, cathodoluminescence and electron microscopies, and synchrotron through-the-substrate μX-ray diffraction). The results indicate that, from the ten sampled stone tesserae, there are (i) seven limestones, one of them identified as Alveolina limestone (early Eocene) from the southern Pyrenees (ii) two sandstones from Barcelona’s Montjuïc hill (Miocene) and, (iii) a Carrara white marble from the Apuan Alps (Italy). The profuse presence of tesserae of both local and imported materials with well-known uses in architecture, epigraphy, and sculpture could imply that tesserae were a by-product of their main use. Two different production technologies were identified for the three sampled glass tesserae. The concurrent use of antimony- and tin-based opacifiers is in agreement with the accepted archaeological chronology of the mosaic (4th century AD).

1. Introduction

The taste for polychromy in ancient art assumed by many artistic expressions, includes floors, painted walls, and sculptures or the use of colorful stones or painted architectural elements. It is possible that mosaics are the best elements to analyze the richness of the kaleidoscopic decoration in the Classic world because some of them show a wide and condensed palette of colors without significant fading through time. Mosaics (opus tessellatum and opus vermiculatum) were made of small square-shaped tesserae. As with many other artistic and architectural changes, mosaics were implemented by the Romans over the Hellenistic civilization influence, who turned it into an art genre of significant scale. Decorative mosaics likely originated as an indigenous development in Greece [1], a variation of decorated pebble floors. The use of regular squared tesserae was possibly introduced for practical, aesthetic, and technical reasons. The first patterned pebble floors date from the 5th century BC and the first floors using tesserae date from the 3rd century BC. Tesserae were mainly cut from a variety of stones, but other materials were also used including pottery, glass, colored glass, or even shells. From the 1st century BC onwards, these decorated floors experienced a steady expansion throughout the entire Roman Empire. The first Roman mosaics were often reproduced earlier Greek mosaics that were produced by Greek artists, but later, the Romans created their own production schools developing original styles and establishing local workshops in the main cities of the Empire. Romans also used decorative mosaics for walls, ceilings, and walkways. Bichrome (black-and-white) and polychrome mosaics often attempted to copy the geometrical motives of contemporary wall paintings and some figurative mosaics are known to be copies of original paintings.
Decorated opus signinum floors from the Greek colony of Emporion (NE Spain) could be considered to be the oldest mosaics (3rd–2nd century BC) documented in the Iberian Peninsula [2]. In Hispania (Roman Iberian Peninsula), during the first two centuries of Imperial Rome, geometrical and ornamental bichrome mosaics were predominant [3] and they were inspired by Italic models, for example, the 1st century AD figured floors of the public baths from Barcino (Roman Barcelona, NE Spain), in present-day Sant Miquel square [4]. During the Antonine and Severan dynasties (96–235 AD) economic prosperity in Hispania entailed embellishment of private buildings and mosaics and polychrome compositions started to appear [2], which became widespread in the 3rd century. From the mid-3rd century AD onwards, Barbarian invasions (Franks and Alamanni) threatened the security of cities and promoted the rise of the rural world [2]. Villa complexes expanded and wealthy landowners decorated them with mosaics and frescoes frequently depicting hunting scenes [5]. The mosaic floor became widespread in all rural villae towards the end of antiquity. The monumental complex of Centcelles, not far from Tarraco (Tarragona), is possibly a villa that turned into a mausoleum and includes a circular room with a dome, datable to the first half of the 4th century AD, decorated with cupola mosaics with early Christian iconography [6]. The bichrome (black-and-white) mosaics were usually built using limestone (or occasionally volcanic rocks for black tesserae). In contrast, polychrome mosaics, already in the Hellenistic period, required a wider range of colors and motivated the use of a broad variety of rocks and artificial materials [7] (glass, faience, and pottery). However, in Roman Italy, glass entered systematically into the palette of mosaicists only from the early 1st century AD [8]. The Neptune mosaic (Italica, near Seville, S Spain), assembled in the 2nd century AD, combined a single central polychrome figure made of stone and glass tesserae in a black-and-white mosaic [2]. The remarkable Cosmological polychrome mosaic found in Mérida (W Spain), also dated in the 2nd century AD, stands out for the combination of stone (limestone, quartzite, and marble), precious material (lapis lazuli and gold), and glass tesserae [9]. Existing archaeometric characterization of tesserae from mosaics often concentrates on glass tesserae [10,11,12,13,14] and only rarely on stone tesserae, mainly marble [15] and limestone [16,17]. Comprehensive studies that have included different types of tesserae are rather scarce [18]. In this paper, we report the results of an archaeometric investigation on a representative set of tesserae from a large polychrome Roman mosaic retrieved in Barcelona. The objective is to provide a compositional and petrographic characterization of the color palette used to assemble the mosaic and also to infer provenance and technological data, as well as to discuss the corresponding archaeological implications.

2. Materials and Methods

2.1. The Circus Mosaic from Barcelona

Among the different mosaics hosted at the Archaeology Museum of Catalonia (MAC) in Barcelona, the Circus mosaic stands out. This large (7.99 × 3.56 m) polychrome mosaic (catalogue number MAC-19004) is presently on display fixed on Aerolam™ and held on a structure almost in a vertical position. The mosaic was found in 1860 at around 3 m underground during the demolition works of the Minor Royal Palace within the old city of Barcelona (in the present-day Comptessa de Sobradiel street) [19]. It would have belonged to the pavement of a luxurious domus in Barcino (Roman Barcelona).
The mosaic occupies a large rectangular area and the exact original longitude is actually unknown because the mosaic was already broken on its left side at the time of its discovery but it could have attained more than 9 m [20]. From its unearthing, the mosaic has been moved several times [19], some parts have been lost, and it has been reduced to several unconnected patches. In 1933, it was attached on a wall of one of the exhibition rooms of the MAC museum and the lost parts between the original patches were colored with an illusionistic technique on plaster to recreate the whole represented scene. In 1990, due to refurbishment works, the mosaic was disassembled again. Finally, the museum conservators reassembled it on its present support, in 2003, and the lacunae (i.e., the missing parts) are now only schematized using pale tones (Figure 1).
The theme depicted in the mosaic is the dénouement of a chariot race and the scene is divided into two parts. In the upper part, there is a representation of the spina (the median strip that separated the two linear sections of the racetrack) including ornate columns, statues, and an obelisk. In the lower part, there are four chariots that depict, from right to left, green, red, white, and blue teams. On the right, there is the winner and on the left a wrecked chariot. The whole scene is framed by a decorated border. The mosaic has received attention from many scholars due to its dimensions and richness in details and inscriptions. The published studies have mainly focused on the archaeological, iconographic, semantic, and historiographic interpretations [20,21,22,23]; however, no archaeometric characterization of the mosaic has been published to date. The mosaic is thought to portray an idealized and symbolic Roman circus chariot scene and chronologically it is believed to have been assembled in the first half of the 4th century AD [24]. The age is based on the archaeological context and on similar mosaics and mural paintings [20].

2.2. Sampling and Methods

A total of 13 tesserae, covering the main colors used in the mosaic, was extracted from their positions using a scalpel (Figure 1). They were labeled with numbers according to their positions within the mosaic from left to right. The sampled tesserae were embedded in epoxy resin and the resulting plastic blocks were sliced to prepare petrographic thin sections to be used for determining their lithic or glass nature. Most of the additional analyses were performed directly on the samples prepared as thin sections.

2.2.1. Colorimetry

The cut plastic blocks that remained from the thin-section preparation were used to perform colorimetric measurements on the freshly cut tesserae using an RM200QC instrument (X-rite Inc., Grand Rapids, MI, USA). The measurements were taken on wet samples after soaking them in water to obtain darker and shiner colors that emulate those obtained after effective finishing/polishing. The reproducibility and homogeneity of the measurements were checked by repeating all measurements three times on different spots and occasionally checking that in situ measurements on well-preserved tesserae produced similar colors.

2.2.2. Thin-Section Petrography (POM, CL)

The petrographic study was conducted by polarizing optical microscopy (POM) using a microscope (Nikon Eclipse E600, Tokyo, Japan) with transmitted light (TL) in both plane-polarized light (PPL) and cross-polarized light (XPL) modes as well as reflected light (RL). The images were retrieved using an attached camera (Nikon DS-Fi3). The selected thin sections were half stained with alizarin red S dye to detect the presence of CaCO3. In addition, for certain tesserae, additional cathodoluminescence (CL) measurements were performed on the thin sections using a CL8200 Mk5-1 equipment (Cambridge Image Technology Ltd., Welwyn Garden City, UK), operating at 15–18 kV with a gun current of ~200 μA. The CL images were recorded using different exposure times ranging from 1 to 4 s depending on the CL response.

2.2.3. SEM-EDS

For the three thin sections corresponding to glass tesserae, additional scanning electron microscopy (SEM) images were obtained along with chemical data from energy dispersive X-ray spectroscopy (EDS). The data were obtained using MERLIN and EVO MA10 microscopes (Zeiss, Jena, Germany) equipped with EDS Oxford LINCA and LINCA X-Max detectors (Oxford Ist., Oxford, UK), respectively.

2.2.4. tts-μXRD

Structural data from Synchrotron for through-the-substrate microdiffraction (tts-μXRD) were also obtained from the three thin sections of glass tesserae. Measurements were performed on the focused-beam station of the beamline BL04 [25] at the ALBA Synchrotron (Cerdanyola del Vallès, Spain). The energy used was 26.71 keV (λ = 0.4642 Å) and the diffraction patterns were recorded with a SX165 CCD detector (Rayonix, Evanston, IL, USA). The radial integration of the images was performed with d2Dplot software [26] and phase identification was performed using Panalytical Highscore Plus 2.0.1 software using the integrated PDF-2 database (ICDD).

2.2.5. XRF

Small chips of the three glass tesserae were subjected to macro- and micro-EDXRF analyses to obtain compositional data including trace elements. The dual macro- and micro-EDXRF approach has been proven to be useful for archaeometric characterization [27]. The macro-EDXRF measurements were done by using a touch control S2 Ranger EDXRF system (Bruker AXS GmbH, Karlsruhe, Germany) with a Pd X-ray tube and XFlash® Silicon Drift Detector (SDD, Peltier cooling at −50 °C, with 128 eV of resolution) (Bruker AXS GmbH, Karlruhe, Germany). The analyses were performed under vacuum, with a 300 s of effective acquisition time, at four different voltages (10, 20, 40, and 50 kV) to determine their bulk elemental composition from sodium (n = 11) to lead (n = 82). The micro-EDXRF analyses obtained in μg·cm2 were performed on microregions by using a benchtop small-spot spectrometer (XDV-SD model, Helmut Fischer GmbH, Sildelfingen, Germany) in open-air conditions (therefore, elements lighter than calcium (Z = 20) were not detectable).

2.2.6. Stable Isotopes Analyses

Small amounts of powdered marble tessera fragments were used to perform the oxygen and carbon isotope analyses. About 0.08 mg of powder was reacted, at 70 °C, with 100% phosphoric acid in a Kiel Device III, coupled online with a mass spectrometer MAT-252 (both devices from Thermo Finnigan LLC, San José, CA, USA). The results were calibrated with the NBS-18 and NBS-19 international reference materials. Carbon and oxygen isotopes are reported in ‰ deviation relative to Vienna Pee Dee Belemnite (V-PDB). The reproducibility, determined by replicate analysis of standards, was better than ±0.02‰ for carbon and ±0.06‰ for oxygen.

3. Results

3.1. Colorimetry

Preliminarily, the tessera colors were visually evaluated and the selection of samples was driven by the main distinguishable colors used to compose the mosaic. The appropriate description of color is not a trivial issue as it is a matter of perception, which greatly depends on the subjectivity of the observer. For correct color registration, objective colorimetric measurements were done using the Natural Color System (NCS) [28,29] notation and the parameters of the Commission Internationale de l’Eclairage (CIELAB color space) (see Table 1).
Colors in the NCS are defined by three percentages, blackness and chromaticness (both usually presented as a single four-character number), and hue expressed as the relative similarity to one or two of the chromatic elementary colors, which in this system are red (R), yellow (Y), green (G), and blue (B). The coordinates L*, a*, and b* from the CIELAB color space correspond to luminosity (L*, from 0 to 100) and the green-red and blue-yellow positions on the axes (a* and b*, usually defined in a range from −128 to 128). CIELAB is extensively used as a precise color specification space in heritage science [30,31] due to its uniform distribution of colors and their proximity to human perception of color [32]. Archaeologists are more accustomed to employing Munsell color charts [33]; however, the Munsell method has been questioned for being inaccurate and subjective [34,35]. Here, only the closest Munsell color to the measured NCS color was used to provide a word combination to refer to the obtained color.
Almost all the sampled tesserae exhibit homogeneous macroscopic colors, except tesserae #9 (rounded white spots in a pinkish background), #12 (light green, almost yellow, spots in a green background), and #13 (light gray veins in a white background). In addition, many types of tesserae show slight differences that allow the mosaic artist to create color gradients, which are particularly noticeable for tesserae #5 and #11 and for tesserae #7 and #8, in this last case, there is a chromatic continuum from both blue-type colors.
The glassy nature of tesserae #7 and #8 is clearly seen by macroscopic evaluation but it was not so obvious for tessera #12. However, #12 was also confirmed as a glass tessera after microscopic analysis. Therefore, the results are presented separately for glass and stone tesserae.

3.2. Stone Tesserae

3.2.1. Petrographic Characterization

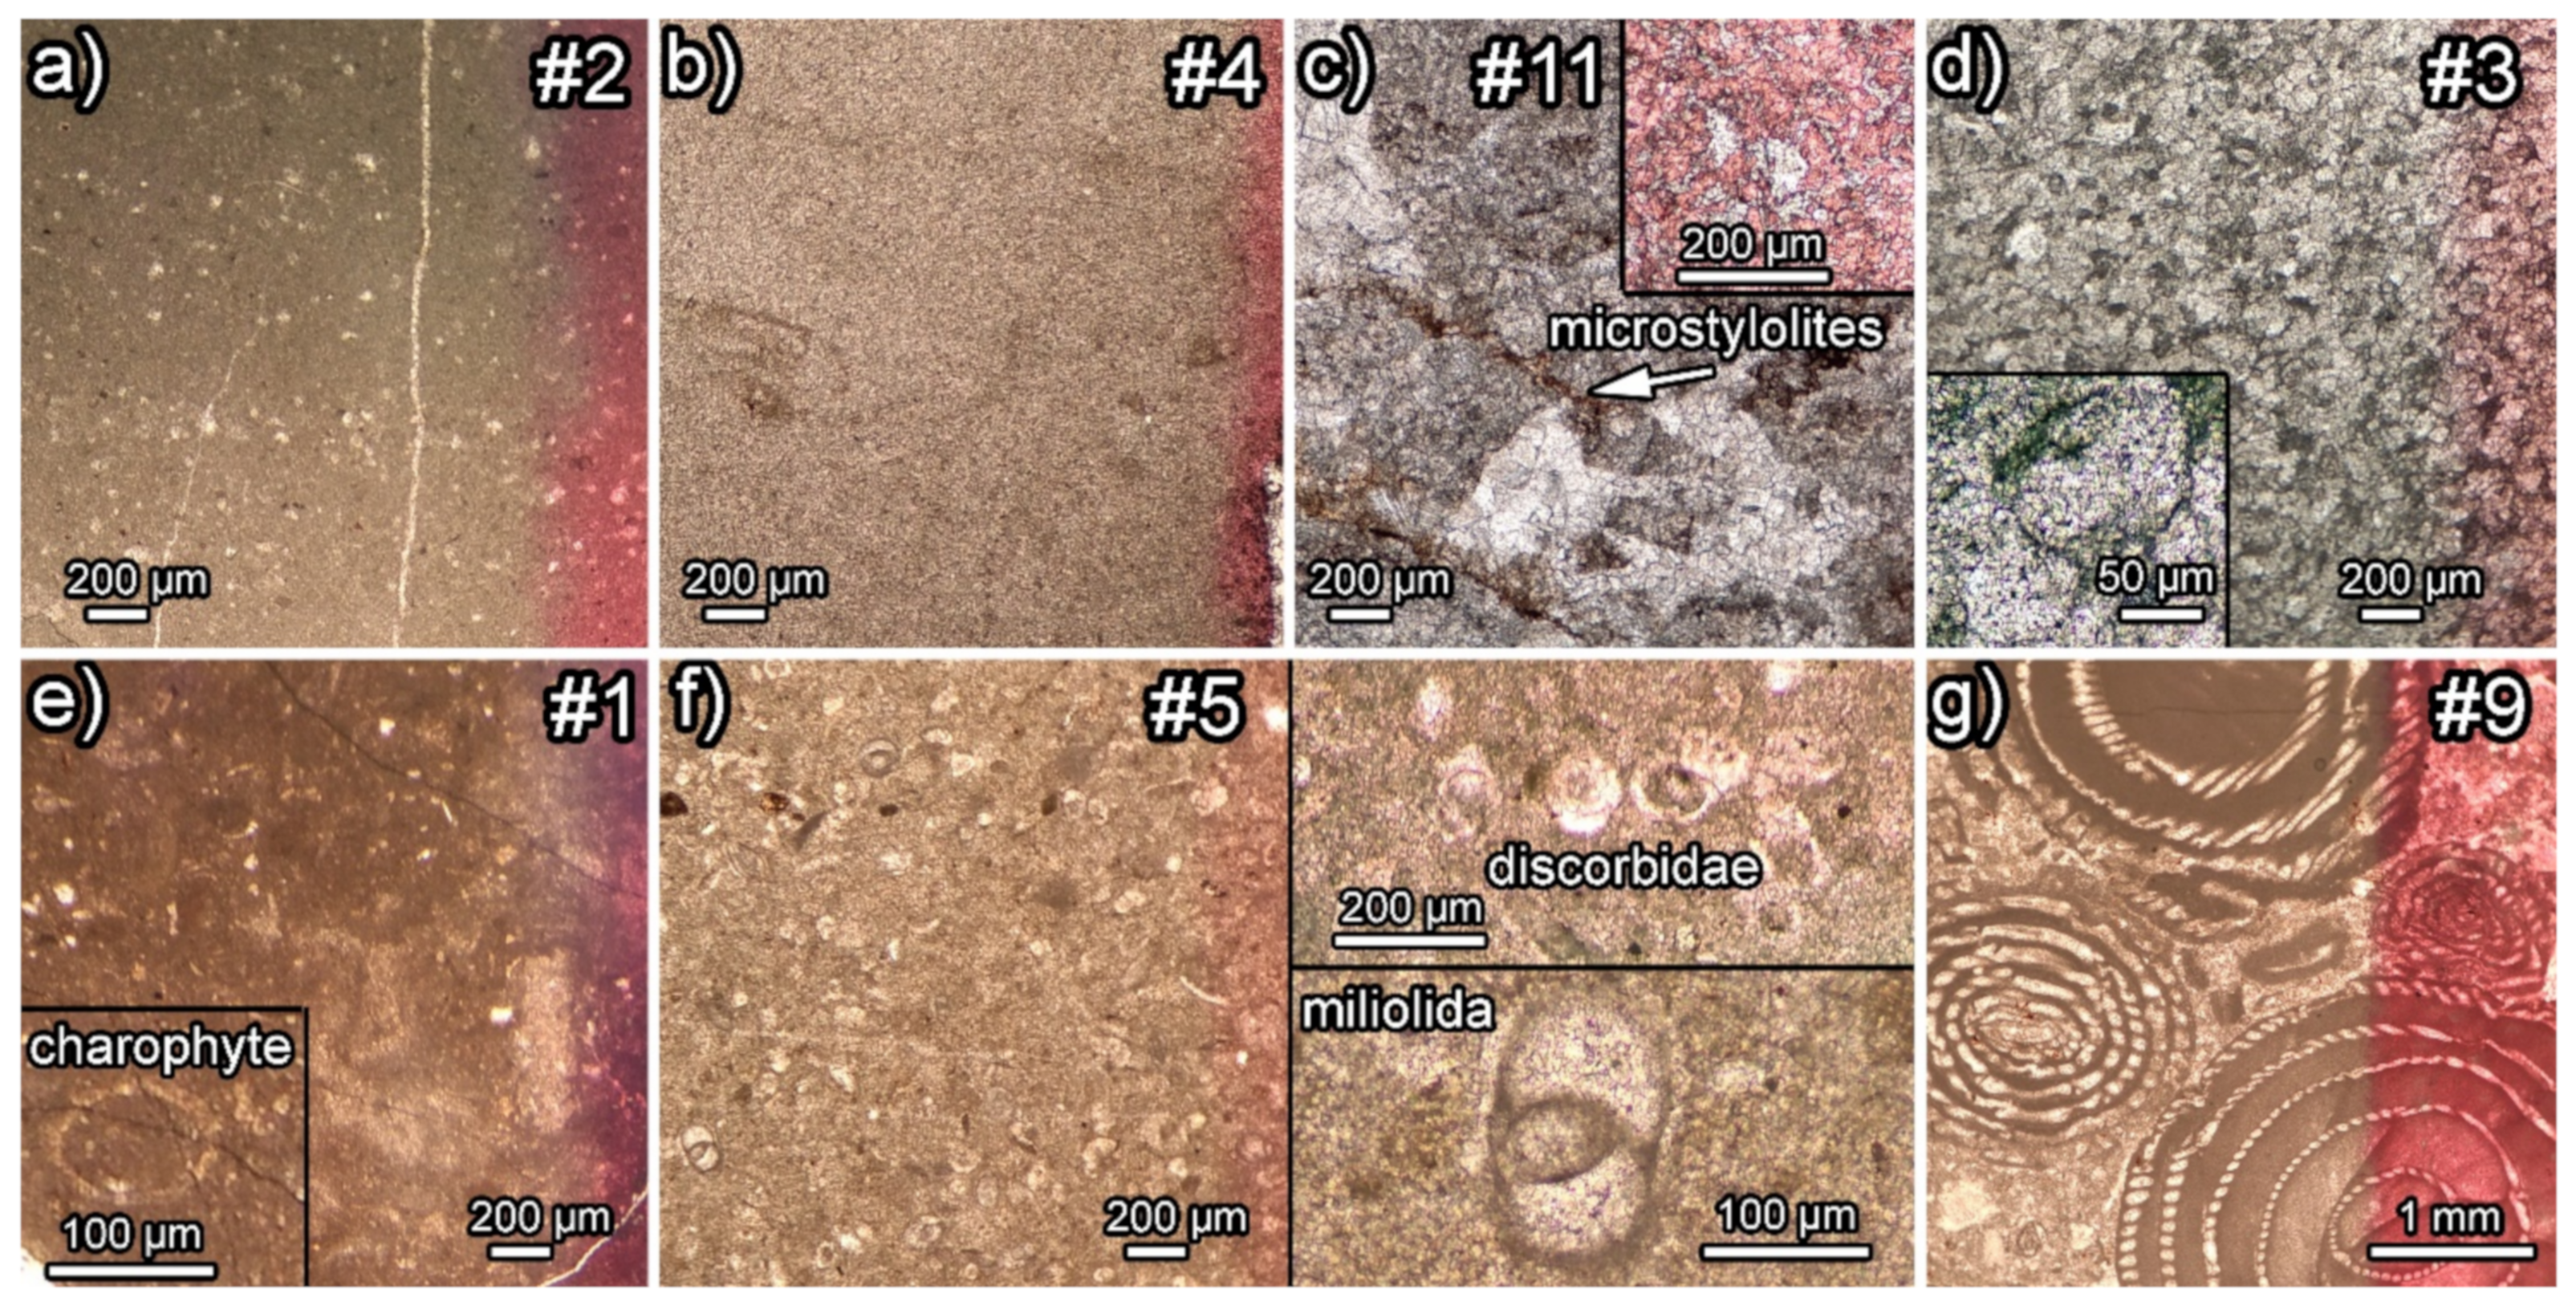
Limestones (Tesserae #1, #2, #3, #4, #5, #9, and #11)

Most of the sampled tesserae can be petrologically defined as calcitic limestones (all the corresponding thin sections turned red under alizarin red S assay). Some of these limestones only comprise micritic matrix or sparitic cement without or scarce fossiliferous content, whilst, in other tessera samples, bioclasts can be easily identified.
On the one hand, tesserae #2, #4, and #11 are micritic limestones with a minor presence of bioclasts (Figure 2a–c). Tessera #2 (pinkish gray) is the finest-grained sample, with only occasional larger rounded spar-filled grains and cracks. The fossil content is represented by a minor presence of thin-shelled bivalve fragments, and small porcelaneous foraminifera (possible Miliolida). Tessera #4 (grayish brown) is a mudstone with abundant, recrystallized, micritic matrix with a minor presence of ‘ghosts’ of unidentifiable bioclasts. Tessera #11 (weak red) seems to have had a micrite-rich texture, but it has been altered by diagenetic processes. The superimposed features include the recrystallization of most of the micritic matrix, precipitation of a dolomitic cement (not stained by alizarin red S) in fractures, and the formation of incipient iron-bearing microstylolites. Tessera #3 (white) is made of a sparitic limestone (Figure 2d) with crystals of around 100 μm diameter without fossils or other identifiable structures. As a result, the amount of information provided by these tesserae on the origin of the material is limited.
On the other hand, common bioclasts were identified in tesserae #1, #5, and #9. Tessera #5 (light yellowish brown) is made of a wackestone [36] (Figure 2f) with a common presence of porcelaneous-tested foraminifera (Miliolida) and hyaline-tested foraminifera (Rotaliida, family Discorbidae) as well as algae fragments and ostracod shells. Tessera #1 (dark gray) shows a wackestone texture with common bioclastic fragments (Figure 2e) including abundant fossil Charophyite algae fragments, along with bivalve fragments and ostracod shells. Tessera #9 (white dots in a pink/reddish background) is a bioclastic packstone [36] (Figure 2g) which is very rich in Alveolina. These large benthic foraminifera correspond to the white dots seen macroscopically. The matrix contains other types of porcelaneous foraminifera and fragments of echinoderms.

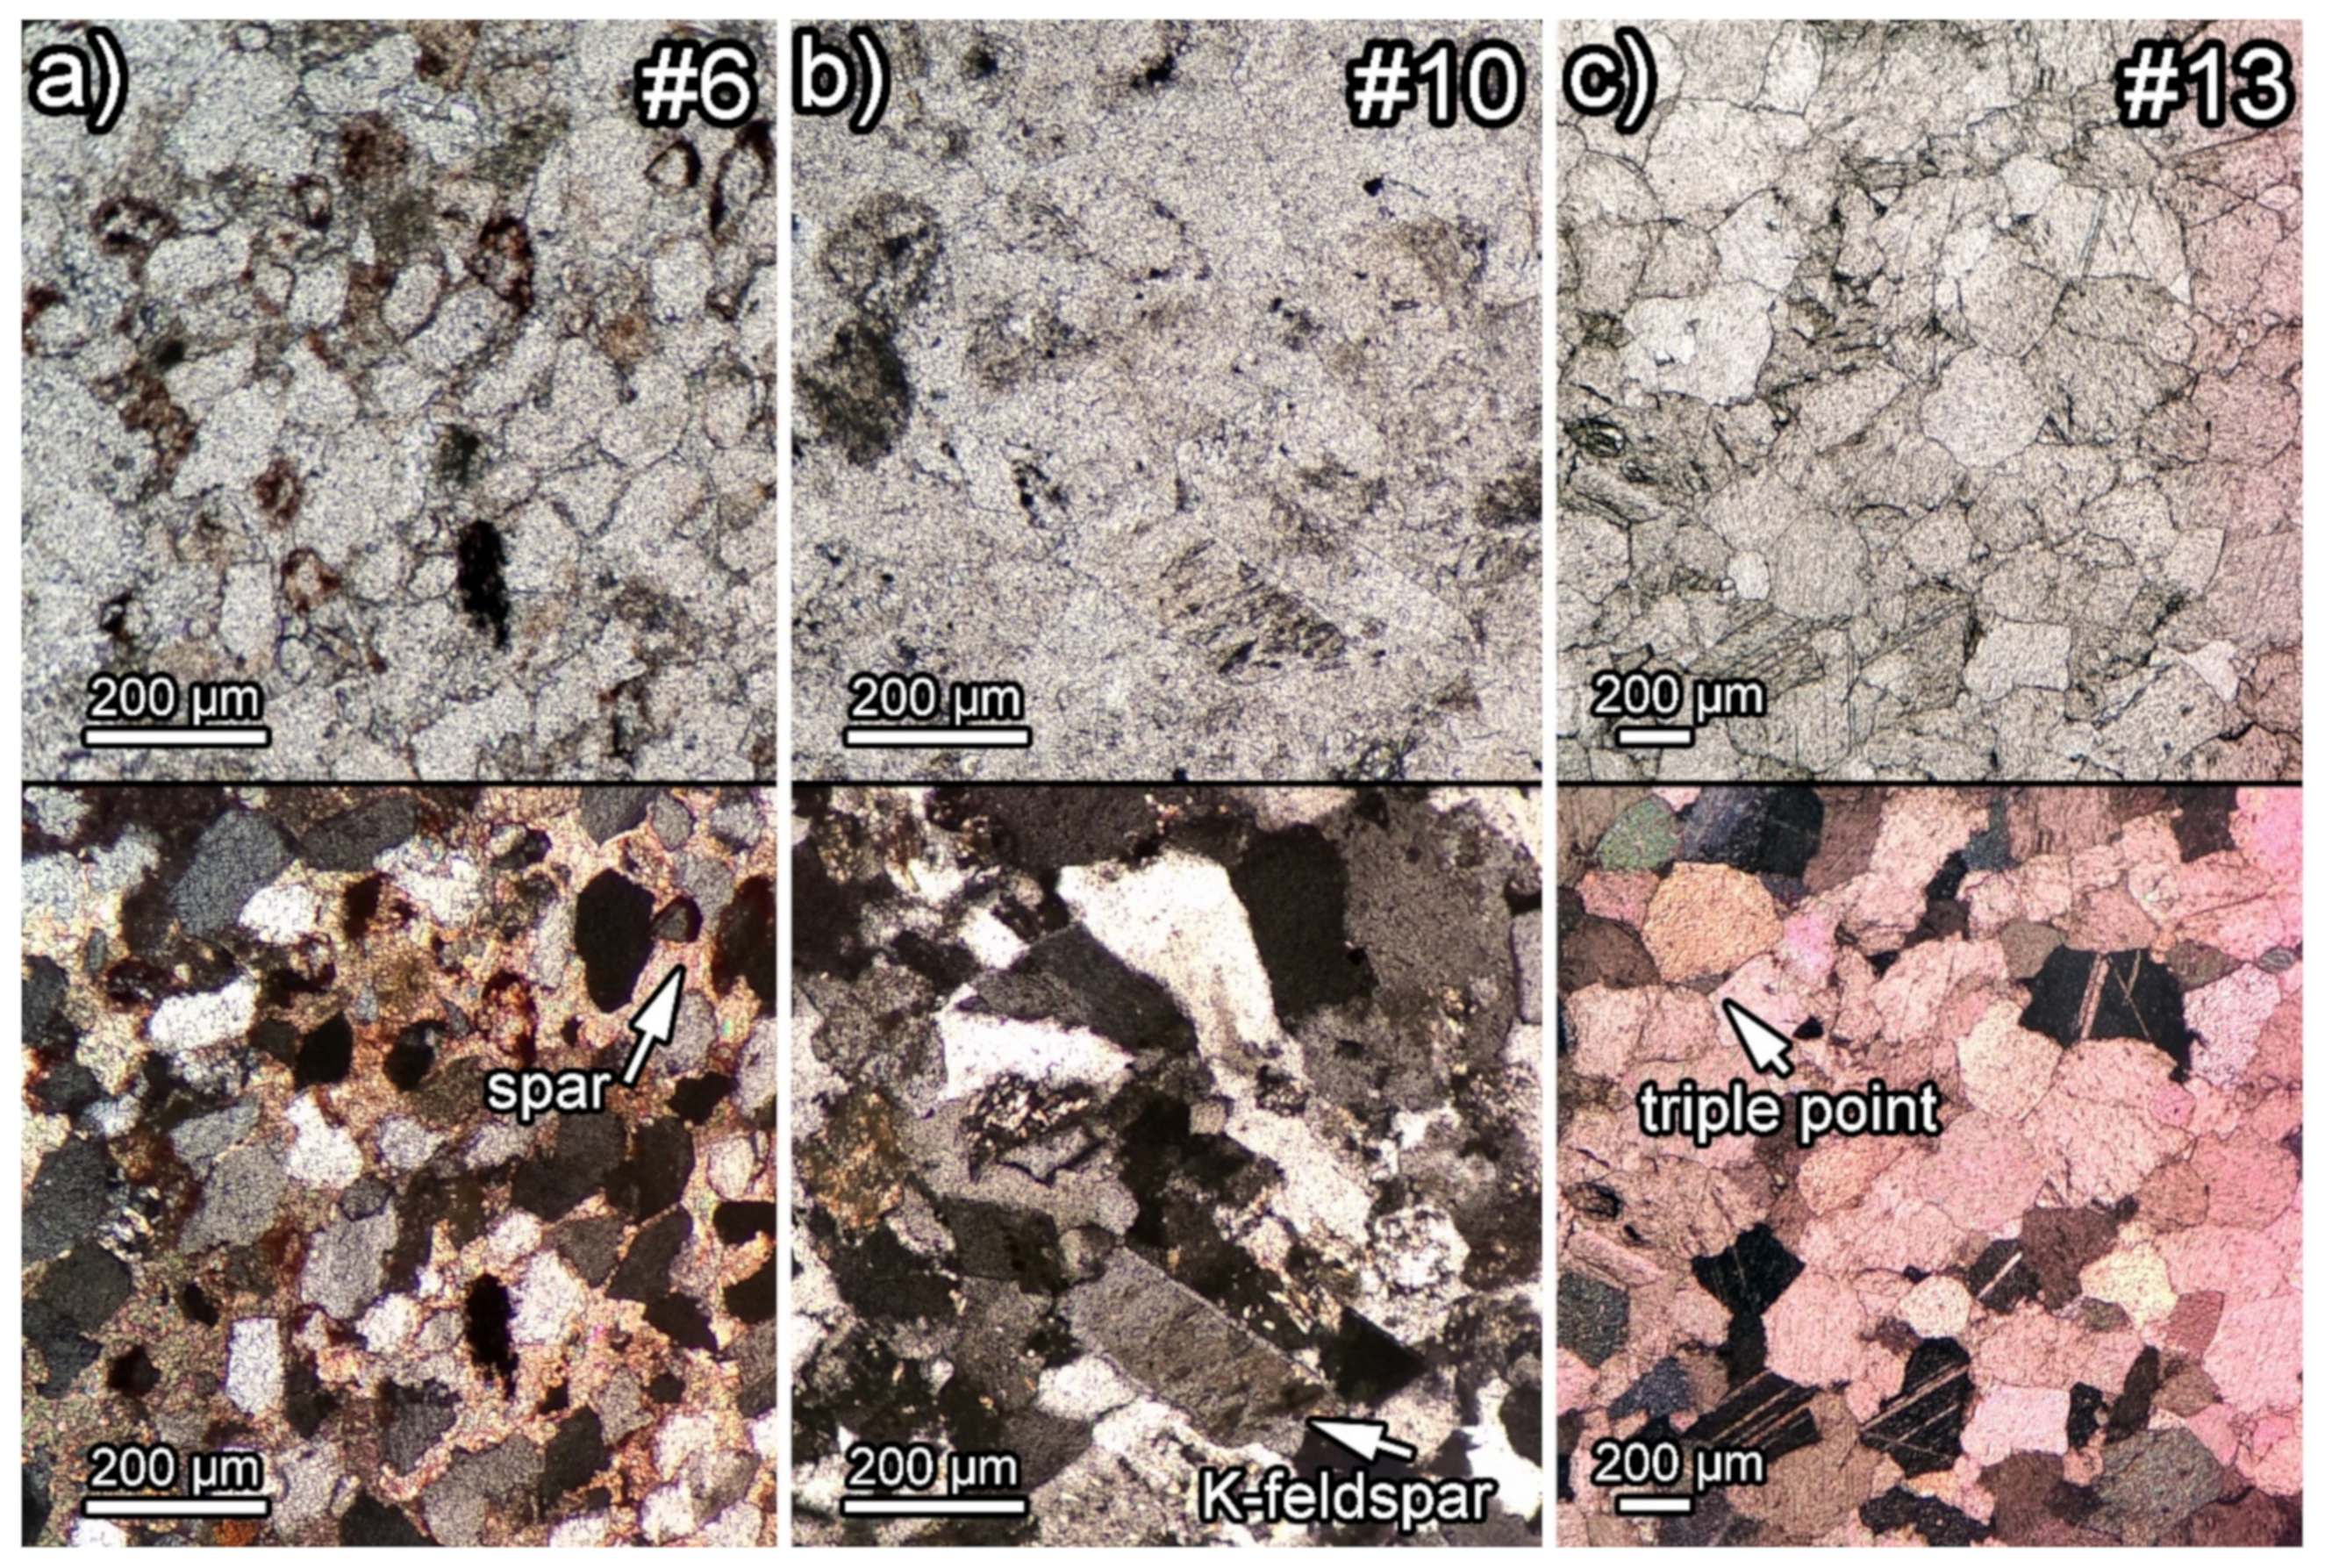
Sandstones (Tesserae #6 and #10)

Two tesserae from the Circus mosaic can be classified as siliciclastic fine-grained sandstones, which both contain mostly quartz and more-or-less altered K-feldspar grains (up to ~200 μm diameter) that are apparently angular shaped but they differ in the cement. For tessera #6 (dusky red), the presence of both spar and iron oxide cements (Figure 3a) is obvious. In contrast, for tessera #10 (greenish gray), calcareous components are absent, and the presence of cement is not obvious. Cement is not clearly distinguishable from the grains giving the sandstone a very compact and massive appearance, almost as if it had a granular igneous texture (Figure 3b). Cathodoluminescence measurements (see next section) reveal that both sandstones contain euhedral authigenic overgrowths.

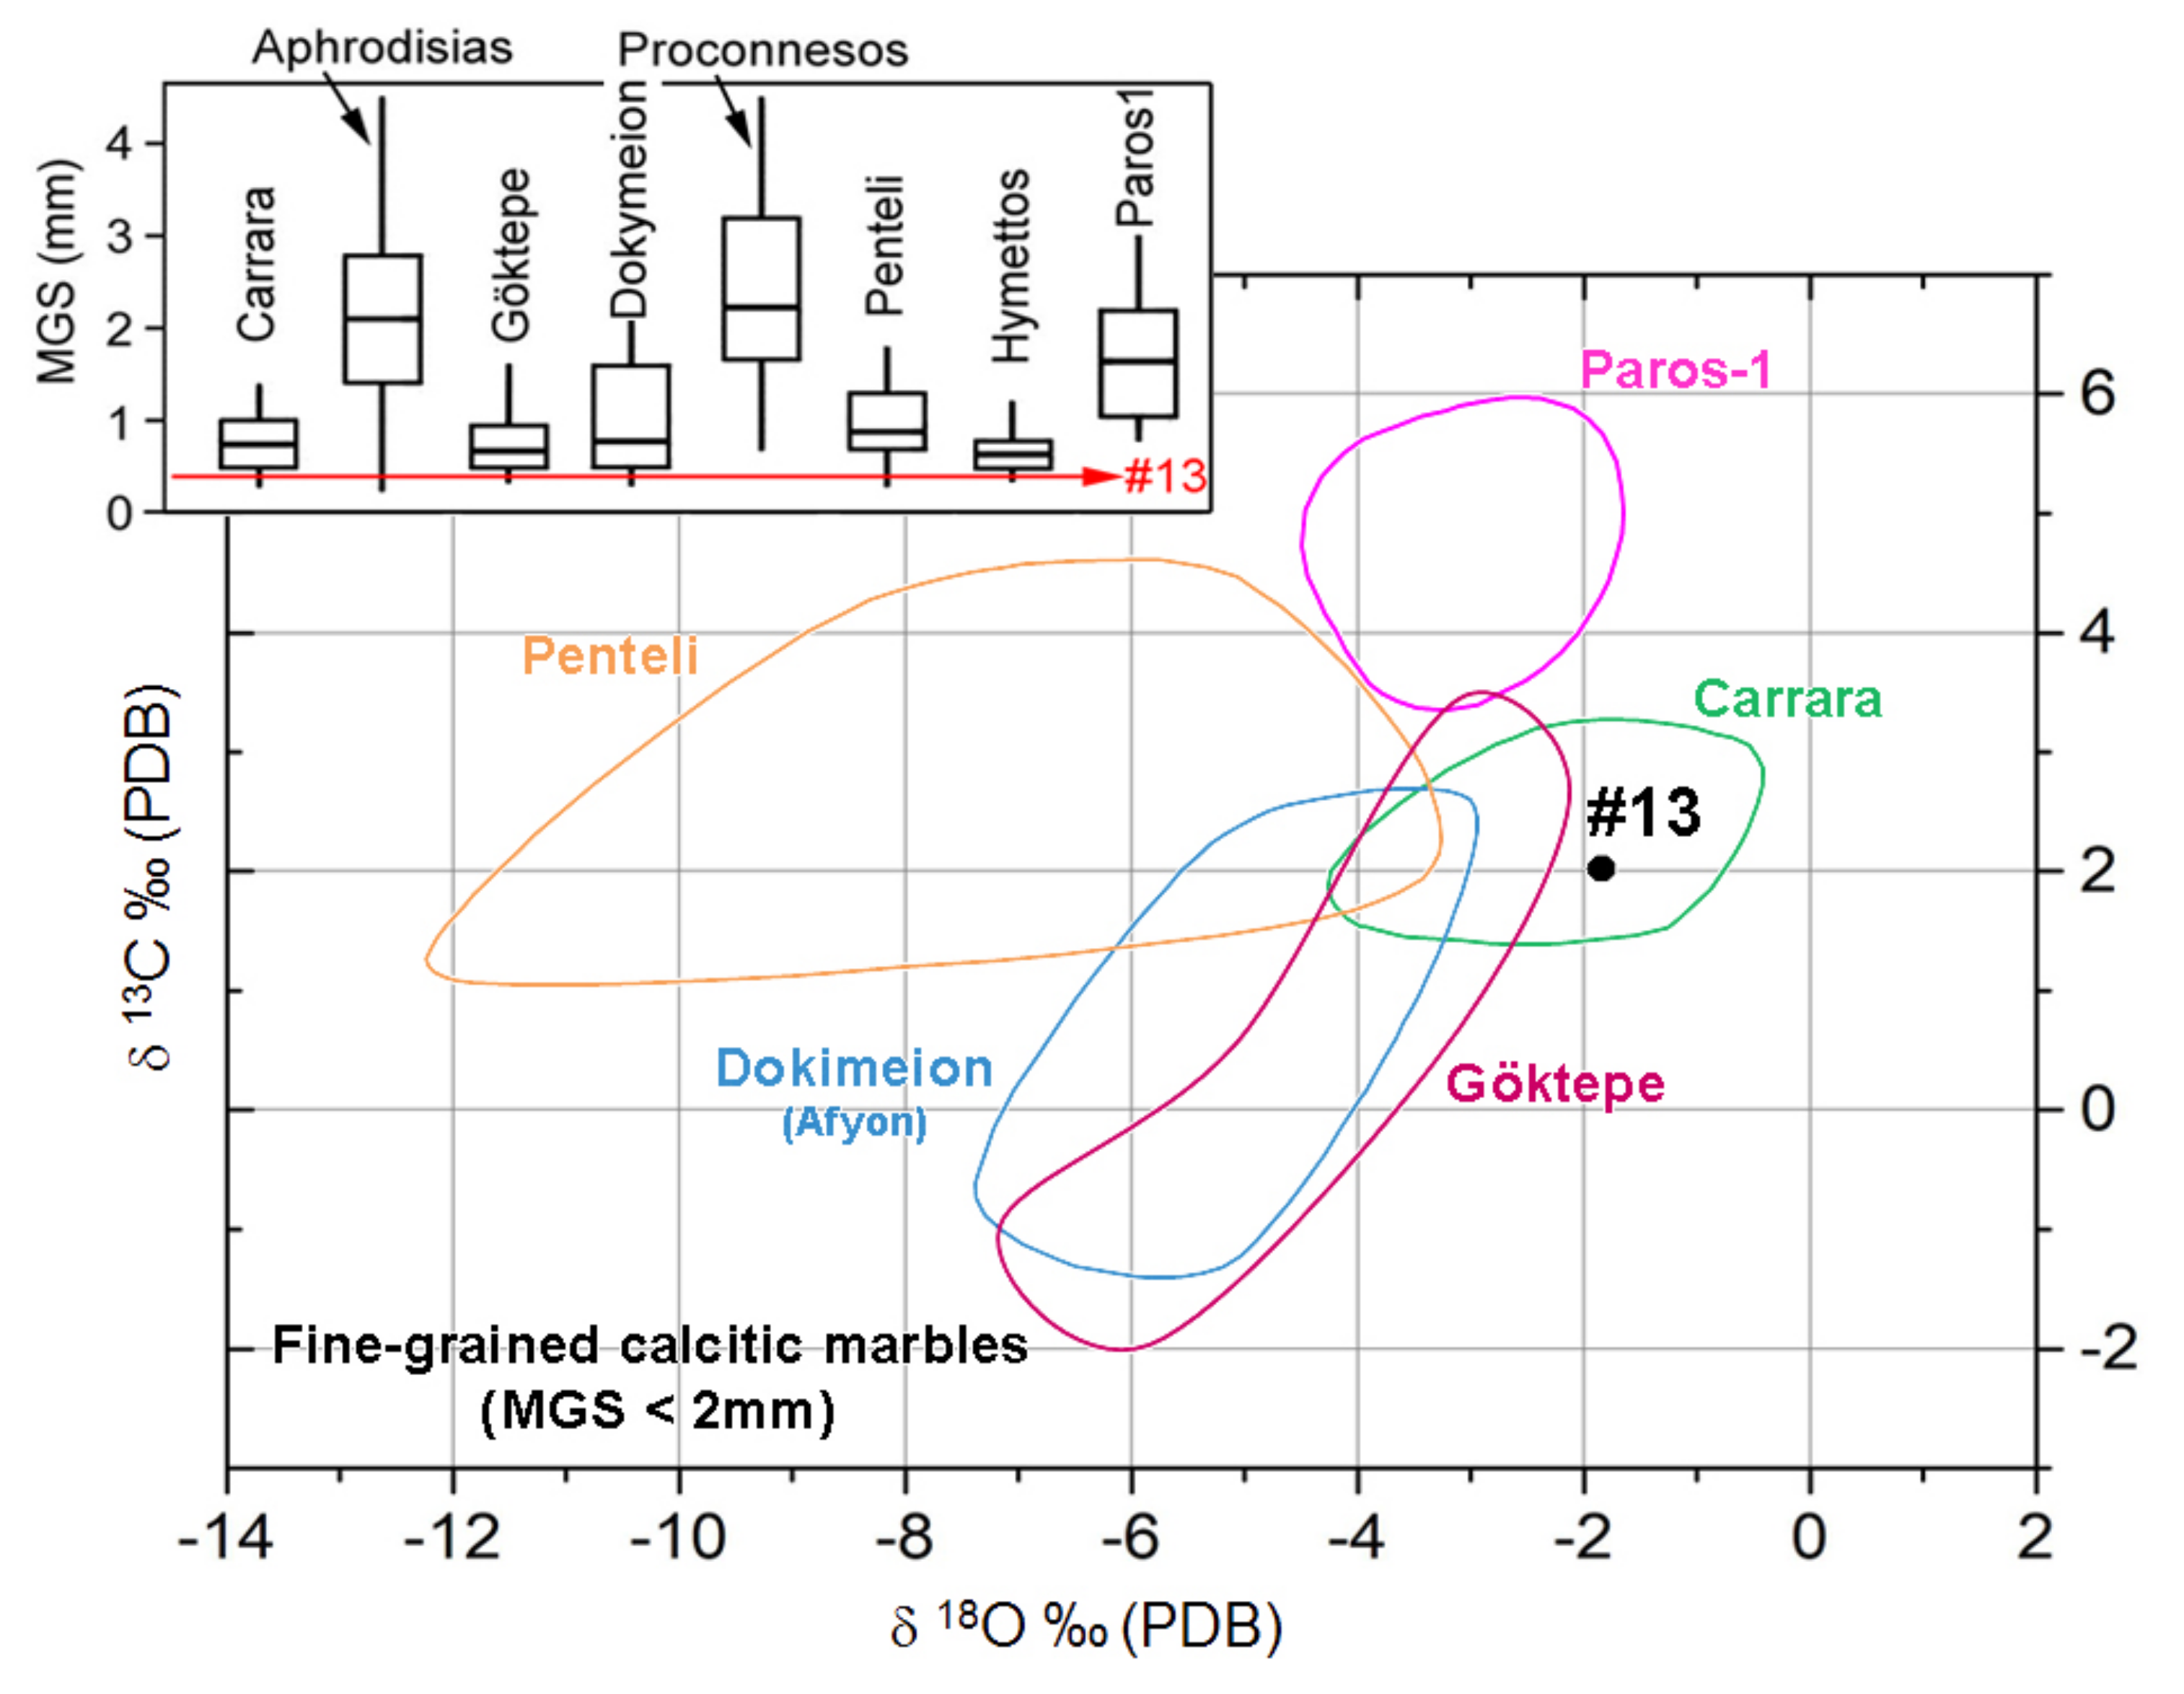
Marble (Tessera #13)

A thin section of tessera #13 (light gray) shows a homeoblastic polygonal mosaic of fine-grained equidimensional crystals (Figure 3c) of calcite (it became stained under alizarin red S assay). The crystals have a maximum grain size (MGS) of ~0.4 mm and occasional pressure twins. Calcite crystal boundaries are straight with common 120° corner angles (triple point joints) indicating equilibrium of surface energy and surface tensions. Additional isotopic analysis of this tessera helps to identify the origin of this fine-grained marble (see Section 3.2.3).

3.2.2. Cathodoluminescence of Selected Samples

Cathodoluminescence measurements were performed on thin sections of three different limestone tesserae (#3, #5, and #11), two sandstone tesserae (#6 and #10), and one white marble tessera (#13).
Cathodoluminescence (CL) is particularly useful to characterize sedimentary rocks and often allows the distinction between detrital, authigenic, and diagenetic phases, in particular for carbonate rocks [37]. This is because the cathodoluminescent response is highly sensitive to the presence of very low concentrations of trace elements within the minerals that can act as activators, sensitizers, and quenchers of the CL. Calcite has an intrinsic blue CL which is very weak [38] and Mn2+ and Fe2+ appear to be the most important activators and quencher elements, respectively, for this mineral. The presence of Mn2+ substituting the Ca2+ site with concentrations as low as 15 ppm activates a bright yellow cathodoluminescent response but this CL can turn orange, pink, or red for the simultaneous presence of Fe2+ (>200 ppm). For very high concentrations of Fe2+ (>1000 ppm), the CL turns dark red, red-brown, or can be completely inhibited [37]. This can be taken as general trends for calcite CL, but there is a complex relationship between CL and Fe/Mn concentration. In addition, the roles of other elements may be important or even dominate the cathodoluminescent response of calcite in certain cases [39].
Sparitic limestone from tessera #3 (white) shows a very low blue-violaceous CL (Figure 4a), possibly indicating a high purity of the calcite crystals that exhibit only the intrinsic luminescence of this mineral. In contrast, the micritic limestone containing porcelaneous-test foraminifera that constitutes tessera #5 (light yellowish brown) exhibits a more typical red CL (Figure 4b), revealing the presence of abundant micritic peloids (possibly formed by calcite bearing a higher Fe2+ content) with a lower CL intensity as compared with the matrix. In addition, the bioclasts that are visible under PPL also exhibit low CL intensity and are hardly perceptible in the CL images. In contrast, within the matrix, there are highly cathodoluminescent spots including some previously unnoticed bioclasts. Finally, the micritic limestone from tessera #11 (weak red) shows bright red CL micritic patches apparently cemented by a low CL micrite, the occasional spar-filled cracks comprise a yellow CL calcite interface and large non-CL crystals of calcite (Figure 4c). The CL features observed in these limestones would be useful in sedimentary studies of them or their fossil content [40] as they would essentially correlate with the Fe/Mg distribution of the diverse carbonatic components of the rock and diagenetic data could be inferred from it. However, in the context of provenance studies, these are not particularly diagnostic of specific geological formations, although the obtained CL could be a discriminant criterion for selecting compatible limestones among a set of local provenance candidates.
In contrast with limestone tesserae, the CL measurements on three other types of tesserae are extremely useful to readily identify their provenance. Thus, both sandstone tesserae (#6, dusky red and #10, greenish gray) exhibit quartz and K-feldspar clasts bearing clearly visible authigenic overgrowths that are hardly noticeable in the optical microscopy images due to the optical continuity between the clast and the authigenic cement. Quartz clasts show a very low CL (dark blue, dark gray, or maroon depending on the clast) but their overgrowths always appear to be completely black (i.e., not cathodoluminescent at all). K-feldspar clasts exhibit higher intensity CL with cyan tones and the corresponding overgrowths appear to be brownish blue (Figure 5). The presence of authigenic cement around the K-feldspar clasts is particularly rare. In the context of the local geology of the Barcelona region and surrounding areas, K-feldspar authigenic cement is specifically restricted to the Montjuïc sandstone (Miocene age), outcropping in the homonymous hill on the seafront of the city. There is an important difference between tesserae #6 and #10, i.e., #6, besides the overgrowths, contains carbonatic (high-intensity yellow CL) and iron oxide cements that are completely absent in #10 (Figure 4d,e). This difference allows one to identify the exact provenance of each tessera, #6 (dusky red) would be from the carbonate-rich nodules found in the upper Morrot unit [41] and #10 (greenish gray) from the overlying Castell unit [41]. The provenance identification of these two tesserae has been reported in a previous paper [42]. In addition to the sandstone tesserae, the CL measurements are also particularly conclusive to identify the marble tessera #13 (light gray). The thin section of this tessera exhibits a medium intensity orange CL (Figure 4f), quite homogenous but with a slightly higher intensity CL signal concentrating at the crystal boundaries. The petrographic features of this very fine-grained marble point to a high-quality classical marble and its particular CL features match with the Italian Carrara marble [43]. Among the other known candidates, Paros and Göktepe marbles would show a very low CL [44] (appearing the intrinsic blue-violaceous CL of calcite only after long exposure times) and Pentelic and Dokimeion marbles would show a patchy CL pattern including high and low intensity areas unrelated to the crystals [45].

3.2.3. Isotopic Analysis of Tessera #13

The archaeometric provenance approach for marbles is quite well established, often comprising a multi-technique approach combining petrography, cathodoluminescence, and stable carbon (δ13C) and oxygen (δ18O) isotopes [15,46,47]. The isotopic composition measured for the marble from tessera #13 (light gray) was plotted in a bivariate isotopic diagram including the reference fields for fine-grained classical marbles [48] adding an extra reference field for Göktepe marble [49] (Figure 6). The sampled marble lies well within the reference field of Carrara without any ambiguity with other reference fields. Therefore, the isotopic analysis reinforces the conclusion drawn from the CL measurements.

3.3. Glass Tesserae

3.3.1. Petrographic Characterization

Thin sections of the bluish tesserae (#7 and #8) appear homogeneously colored in transmitted light (TL) under plane-polarized light (PPL) apart from some occasional circular bubbles and opaque inclusions (Figure 7a,b). The inclusions appear to be scattered on all the glass surface, but, occasionally, they form bigger aggregates, for example, in tessera #8 a rather large cluster was found (Figure 7b). These thin sections are completely black under cross-polarized light (XPL), revealing the isotropic nature of glass. Under reflected light (RL), the opaque inclusions exhibit higher reflectance than the glass and despite the small size, recognizable morphologies are mostly euhedral indicating that the inclusions are crystals newly formed during the glass-making process.
In contrast, the thin-section texture of the sage green tessera (#12) appears to be quite heterogeneous, in part, probably due to alteration processes. It displays a fluidal-like matrix (transparent and green under PPL) and rather large (>0.2 mm) elliptical, ocellar, and rounded pores, often with a yellow-colored rim. The pores are usually partially, and sometimes completely, filled by precipitated minerals (Figure 7c). Under XPL, the discontinuous transparent areas appear to be extinguished but most of the filled pores and the green areas also appear to be colored with greenish and yellow tints. The central part of some pores appears to be opaque indicating that they are empty. Using the RL mode, it is possible to identify at least two different types of high reflectance mineral inclusions within the matrix, one with a grayish color (the most abundant and seemingly also present within some pores) and another with a yellowish color (rarer). Some opaque clods (under TL) in the matrix appear with a reddish hue in RL mode.
Once the glassy nature of these three tesserae was confirmed, their chemical compositions and the mineral identification of inclusions were obtained using other techniques.

3.3.2. SEM-EDX Measurements

Several representative areas of the glass matrices (free of microcrystals) of tesserae #7, #8, and #12 were analyzed using EDX and their mean values can be taken as the corresponding average compositions (see Table 2). In addition, microcrystallites and clods embedded in the glasses were also analyzed. Microcrystals appear to be scattered and isolated within the glass matrix but occasionally they form aggregates.
The chemical composition of glasses from tesserae #7 and #8 matches that of a typical soda-lime glass. In contrast, glass from tessera #12 deviates from typical soda-lime glass, exhibiting lower Na and Ca values (and higher K and Al values). Additionally, minor amounts of Pb and Sn were also detected, although these two elements would not be part of the glass matrix as their presence is related to microcrystals that act as opacifiers and/or coloring agents.
The composition of microcrystallites embedded in the glasses emphasizes the differences between the bluish and the green tesserae. In the first, crystals contain Sb (Figure 8) whereas in the latter they contain Sn and often Pb (Figure 9c,d).
Variable amounts of SiO2 (24 to 47 wt%) are detected in the analyses on crystals in bluish tesserae. We assumed that the observed crystals did not contain Si, and therefore the corresponding fraction of glass was subtracted from the analyses. After subtraction, most of the analyzed crystals in aggregates from #7 (Figure 8a,c) and #8 (Figure 8b) show Ca, Sb, and O ratios that point to stoichiometries close to CaSb2O6. Occasionally stoichiometries close to Ca2Sb2O7 were also detected in tessera #8 (Figure 8e). Apart from newly formed microcrystals, in tesssera #7 small relict clods (Figure 8d) were also identified. They are richer in Sb2O5 (~26 wt%) and CaO (~11 wt%) as compared with the glass and they include a detectable amount of CuO (~2.5 wt%).
In contrast, microcrystals found in the green tessera (#12) show a higher variability of compositions and they can be correlated with their optical properties (grayish or yellowish reflectance as seen in RL mode) (Figure 9a). Those exhibiting a grayish reflectance appear to contain Ca and Sn, and within these crystals there appear to be brighter crystals that contain Sn (Figure 9b). The scarcer and smaller crystals with yellowish reflectance contain Pb and Sn (Figure 9c). An abundant feature of this tessera is the presence of elongated pores, which often appear to be affected by secondary processes. Most of the pores have developed yellowish rims as seen under the optical microscope (Figure 9d inset), they appear to be partially filled with precipitates containing variable amounts of Pb and Ca. The analyses on the rims exhibit various compositions, but they are always enriched in PbO (7–12 wt%), CaO (4–10 wt%), CuO (~2 wt%), MgO (<4 wt%), and SnO2 (<3 wt%) as compared with the glass. Some pores deprived of rims appear to be fully occluded by a precipitate containing basically Ca (Figure 9e). Finally, analyses on the occasional clods (Figure 9f) (with a reddish hue under the optical microscope, in RL mode) present higher concentrations of Fe2O3 (~30 wt%), Al2O3 (~15 wt%), Na2O (~9 wt%), and MgO (~3.2 wt%) as compared with the glass.

3.3.3. SR tts-μXRD Measurements

The presence of hexagonal CaSb2O6 was confirmed as the main microcrystalline phase within the glassy matrices of tesserae #7 and #8 (Figure 10). Additionally, other Sb-bearing minor phases were also detected. Within #7 tesserae (arctic blue), cubic phase Sb6O13 was the main crystalline compound found in a relict clod (Figure 10b). Other minor phases, such as Ca5Sb5O17, were also identified, whereas in tessera #8 minor amounts of Pb2Al0.5Sb1.5O6.5 and Cu12Sb4S13 were also detected. However, Ca2Sb2O7 was not found.
Regarding tessera #12, the ubiquitous crystals with a grayish reflectance were identified as malayaite (CaSnSiO5) and they contained domains of cassiterite (SnO2) (Figure 11a). The very fine crystals with a yellow reflectance are mainly cubic PbSnO3 (Figure 11b), although other cubic similar phases, such as Pb2Sn2O6 and Pb3Sb2O8.47, were also occasionally detected. The precipitates within pores were cerussite (PbCO3) and minor calcite (CaCO3) for those within pores with yellow rims (Figure 11a). In contrast, pores without rims appear to be filled only with calcite. Finally, analyses on the reddish clods reveal a variable mixture of mineral phases always including hematite (Fe2O3), quartz (SiO2), and Mg-bearing silicates such as diopside (MgCaSi2O6) and cordierite (Mg2Al4Si5O18), see Figure 11a.

3.3.4. EDXRF Measurements

Representative XRF spectra for the bulk composition of the three glass tesserae are shown in Figure 12. The main excitation peaks detected are highlighted. Despite the lower sensitivity to light elements, EDXRF measurements yielded the bulk composition of the analyzed glass tesserae including trace elements (Table 3). Apart from the diverse sensitivities of the techniques, differences between EDX values (Table 2) and EDXRF values (Table 3) are due to the fact that the EDXRF measurements represent the whole-tessera compositions including glass, clod relicts, and microcrystals (both embedded in the glass and grown within the pores). Local micro-EDXRF confirmed this source of discrepancy and allowed us to perform the measurements on the areas with more vivid colors to track correlations between color intensity and trace elements. Some crystalline phases can be relevant coloring agents but the color in glasses is often caused by the addition of certain minor elements, which in their ionic form can integrate into the glass matrix [51] and these are often transition metals.
Bulk compositions of the bluish tesserae (#7 and #8) are similar and, in agreement with their identified microcrystals, both tesserae show a significantly higher amount of Sb as compared with the greenish tessera (#12). Conversely, tessera #12 exhibits a particularly higher tenure in Pb, but also in Cu and Sn, which is in agreement with the composition of its crystalline phases.
Subtle compositional differences between the bluish tesserae are a higher content of Cu and the presence of Zn in #7, whilst in tessera #8 there is a higher content of Mn and the presence of Co (see inset in Figure 12). Regarding tessera #12, trace element differences as compared with the other glass tesserae are the particular richness in Zn and Mn. It is also worthwhile to mention the presence of a certain amount of Co.

4. Archaeological Discussion

The Circus Mosaic from Barcino was essentially assembled using stone tesserae, these cover a broad color palette, particularly rich in warm colors but also including a variety of gray tones. Glass tesserae seem to be restricted to three colors that would be difficult to produce using stone materials (especially the bluish ones) and they are used in small quantities, basically as part of the charioteer’s clothing. The different abundances and uses of stone and glass tesserae are also possibly related to their different production costs. The high price attributed to colored glass prompts considering glass tesserae as a marker of luxury, even as late as the 4th century AD [52].
The analytical results from both types of tesserae can bring relevant data that contribute to the construction of archaeological knowledge on the studied mosaic, including its chronology. The possible geographical–geological origin and provenance of the rocks used for stone tesserae can help to infer the significance and chronology of the workshop that assembled it. Additionally, the composition of the glass tesserae can help to understand their technology of production with implications in knowledge and even chronology.

4.1. Provenance

Seven out of the ten sampled stone tesserae are calcitic limestones, a commonly used material in mosaics [53] and a readily available geological material around Barcelona. Large volumes of Mesozoic limestones outcrop in the nearby Garraf massif (some 30 km heading southwest along the coastline) but many other minor outcrops can be found even closer to the city. The lack of microfossils or, when present, their wide stratigraphical distribution makes it almost impossible to assign the limestone tesserae to specific geological formations, with the only exception of tessera #9 which has been identified as being made of Alveolina limestone of the Ilerdian age (early Eocene). Lithotypes of Alveolina limestones are typical of the so-called Alveolina limestone formations that outcrop in the southern Pyrenees within the Temp-Graus basin [54] and the Ripoll-Cadí basin [55]. The latter constitutes an area crossed by tributaries of the Llobregat river that flows into the Mediterranean Sea just south of Barcelona. This type of tessera is one of the few without a homogeneous color within the mosaic (it contains the rounded Alveolina fossils that appear as white spots in a pinkish background). The stone would have appeared precious to the artisans and their use within the mosaic is restricted to a few alignments of tesserae, always placed in the upper part of the horses’ tails.
The two sandstone tesserae (#6 and #10) were identified as made of Miocene Montjuïc sandstone. This rock outcrops in the Montjuïc hill that stands at the south of Barcelona, on the seafront. The observed quartz and K-feldspar authigenic overgrows, easily seen using CL, are the characteristic petrographic markers [42] which allow us to assign both tesserae to the same local provenance. In particular, tessera #10 (greenish gray) matches a lithotype of sandstone from the Castell unit [41]. This unit constitutes 70% of the outcrop at Montjuïc and its sandstones are known to have been intensively exploited since Roman times as construction and sculpture material as well as epigraphic support [56,57]. This type of tessera is profusely used in the Circus mosaic forming a wide longitudinal band that delimits the lower part of the spina. The abundance of this material within the mosaic agrees well with its known uses at larger scales, showing its availability as a by-product. In contrast, tessera #6 (dusky red) matches the features of silicified sandstones, bearing spar cement and forming levels of nodules that outcrop exclusively in the upper part of the Morrot unit at Montjuïc [42]. Consistently, this type of material is less frequently used within the mosaic.
Finally, the white marble tessera (#13) has been identified as Italian Carrara according to its petrographic features, CL signal, and isotopic signature. This marble that outcrops in the Apuan Alps was widely used and exported by the Romans, particularly during the 1st and 2nd centuries AD. In Roman Hispania, its epigraphical and architectural use, concentrates in the Tarraconensis province, especially in the northeast and along the coast [58]. As epigraphic support, it constitutes the most used white marble in Barcino [59] and architectural uses have also been reported [60], particularly in the 2nd century AD. Within the Circus mosaic, this type of tessera is possibly the most used as it constitutes the background of the scene. This profuse application could be proof that artisans were dealing with imported rough carved stones of Carrara marble and the tesserae of this material were also a by-product, similar to what we infer for the local Montjuïc sandstone. An alternative interpretation would be that the marble tesserae were produced by reusing bigger damaged pieces.

4.2. Production Technology

The three glass tesserae can be divided into two different types. On the one hand, bluish tesserae (#7 and #8) show many similarities and, within the mosaic, there is a continuum of tesserae with hues from light arctic blue to dark azure. These are used as part of the clothing of the chariot drivers of the white and red team and they are quite well preserved. On the other hand, the green tessera type (#12) appears to be weathered and apparently it was used for large parts of the green-team driver. Similarly, altered tesserae with a darker green-bluish color (not sampled but perhaps also made of glass) appear to be used for decorating the neck of a horse from the blue team. The driver of the blue-team chariot has not been preserved as he would have been located at the missing left corner of the mosaic. If present, the dress of such driver would perhaps have been largely made with similar green-bluish alterable tesserae.

4.2.1. Base Glass

Potentially, the composition of the glass matrices can provide data on raw materials, their sources, and even chronology as these have varied over time. The late Roman period was a period of transition, and in particular, within the 4th century AD, some new compositions of soda-lime-silica glass were introduced [61]. However, the compositional interference of opacifiers/pigments complicates the extraction of relevant data which is already a difficult task for colorless (or naturally colored) glass. Nevertheless, some attempts can be made using the local SEM-EDX measurements and the ‘reduced’ compositions.
The well-preserved bluish tesserae show a glassy matrix with a typical soda-lime-silica composition, indicating the use of natron as a flux, in accordance with ancient Roman and late-Antique glass. A comparison of the ‘reduced’ [62] values of alumina and calcium oxide would also support the use of natron [63] and match the compositional range of Roman colorless glasses dating from the 1st to 5th century AD [64] but none of the five compositional types for ancient natron glasses linked to primary production centers in the Levant and Egypt [63]. The ‘reduced’ composition of tessera #7 could fit within the HIMT type but it does not contain the expected high levels of Mn and Ti. It is difficult to determine the Sb, Mn, or Mn + Sb nature of the base glass because the detected levels of Mn are low and those of Sb are altered by the presence of Sb-bearing microcrystals. In any case, according to the soda/lime ratios, the base glass would be closer to Mn-decolorized glass [65,66].
In contrast, the glass matrix or the ‘reduced’ composition of tessera #12, with very low soda and very high alumina, and significant amounts of K and Fe, does not fit with any reference composition groups of glass [67]. The observed deterioration in composition could be the result of weathering of the corroded glasses, which appear to be usually enriched in Si, Fe, and Al and depleted in Na [68]. However, this alteration should affect the surface of the tessera and not the analyzed core. Nevertheless, the presence of cerussite (PbCO3) within most of the pores of the glass is strong evidence of alteration. Another likely interpretation is that the glass from these types of tesserae was recycled glass. The loss of sodium is a known effect of glass progressively reheated and contamination from the glass workshop equipment and the fuel ash could explain the incorporation of Fe, K, and Mg [66]. Recycling of Roman glass tesserae by remelting them is a well-documented practice in Medieval times [69,70,71] but some earlier examples have also been reported in the 3rd–5th centuries AD, in Italy [65,67,72] and France [73]. Assuming that the proportions of Mn and Sb detected by XRF are indicative of glass composition (no crystalline Mn- or Sb-bearing phases have been detected), their proportions would also support the recycling hypothesis [65,66].

4.2.2. Opacifiers

There are also differences between the two types of glass tesserae with regards to the opacifiers. The analyzed bluish tesserae are characterized by the presence of Ca antimoniates. These would have been formed by adding an antimony source to the molten glass. The antimoniate appear as euhedral newly formed crystals almost exclusively made of hexagonal CaSb2O6, which would indicate crystallization temperatures around or above 1094 °C [74]. The antimony source would have been stibnite (Sb2S3) or more likely roasted stibnite (Sb6O13 has been found within relict clods). In contrast, the green tessera opacifiers were Sn and Pb compounds added to the silica melt. These would have been a precalcined mixture of lead and tin metals (lead–tin calx) including mainly SnO2 and PbO. The resulting crystalline phases formed in the glass were malayaite (CaSnSiO5) and PbSnO3 (a well-known opacifier and yellow pigment). Cassiterite (SnO2) was also found but only in the form of remnant cores within malayaite. Malayaite is a tin analogue of titanite, and it is known to be formed by the reaction of cassiterite with SiO2. Experiments conducted in air have revealed that temperatures of 1100 °C [75] or 1400 °C [76] are required. According to the literature, both tin- and antimony-based opacifiers were used between the 2nd and the 1st centuries BC. However, antimony was increasingly employed and by the 1st century AD it had completely replaced tin-based phases. Later, in the 4th century AD, tin compounds reappeared and progressively substituted the antimony compounds [11,77,78]. One of the first claimed reappearances of tin oxide as an opacifier was actually documented in Hispania, in a purple-black glass tessera from a Roman site at Centcelles (4th century AD) [79]. However, some studies have revealed the coexistence of both opacifiers since the 1st century AD [80]. In any case, Pb stannate was rare before the 4th century [67] and its use in the Circus mosaic of Barcino can be used to confirm its suggested archaeological age. The concurrent use (though separately) of antimony- and tin-based phases in the glass tesserae of the same mosaic is particularly interesting, such use was already reported for the mosaic of the Casa delle Bestie Ferite in Aquileia (Italy), also dated within the 4th century AD [67].

4.2.3. Colorants

In addition to opacifiers, glass coloring was obtained by the combination of chromophore ions dissolved in the amorphous glass and coloring crystals. The color of arctic blue/turquoise tesserae, such as tessera #7, would be related to the presence of Cu (a 0.7 wt% CuO is found within the bulk composition of the tessera, although CuO was not detected in the glass areas analyzed by SEM-EDS). Therefore, copper would be heterogeneously dissolved within the glass matrix or perhaps in the form of sub-microcrystals (not detected by SR tts-μXRD). A concentration of 1 wt% CuO in soda-lime glasses, in the form of a combination of Cu1+ and Cu2+, has been found experimentally to produce a turquoise color [81]. The deep blue color of tesserae, such as tessera #8, is surely induced by the presence of very low amounts of cobalt. The coloring power of this metal is far greater than that of other transition metals and a few hundred ppm are enough to produce the effect [51,82]; 305 ppm were found within tessera #8. Cobalt is also present in tessera #12 (115 ppm) but the most abundant coloring agent within the sage green tessera is cubic PbSnO3, this is an opacifier and yellow pigment known as lead–tin yellow II or anima (formally Pb(Sn,Si)O3) [83]. The combination of blue (from Co) and yellow (from PbSnO3) would produce the green coloring effect for tesserae such as #12.
The production of cubic PbSnO3 yellow pigment is relatively complex, it requires mixing the Pb-Sn calx with pure silica (without alkalis) to promote transformation from orthorhombic PbSnO4 which would form initially in the lead–tin calx [84]. Firing the calx with silica and alkalis is known to produce decomposition of PbSnO3 and formation of secondary SnO2 [84]. Once produced, the yellow pigment would have been subsequently mixed with a pre-prepared glass melt during heating for a short period (to avoid dissolution) at not very high temperatures. The low temperatures agree with the presence of visible flow lines in tessera #12 and, according to its reduced composition, the pre-prepared melt could be recycled glass.

5. Conclusions

The archaeometric approach which combines several analytical techniques adapted to every type of sampled tesserae (different types of rocks and glass pastes) has proven to be a powerful tool for obtaining relevant data about provenance, raw materials, and glass-working technology.
The results obtained from the 13 sampled tesserae can be summarized as follows:
  • Ten samples were stone tesserae: seven limestones, two sandstones, and one marble. The provenance of four of the tesserae could be established: (i) a tessera made of Alveolina limestone (#9) of the early Eocene age from the southern Pyrenees; (ii) two tesserae made of siliciclastic sandstone (#6 and #10) of the Miocene age from Barcelona’s Montjuïc hill; and (iii) a tessera made of Carrara white marble (#13) from the Apuan Alps (Tuscany, Italy).
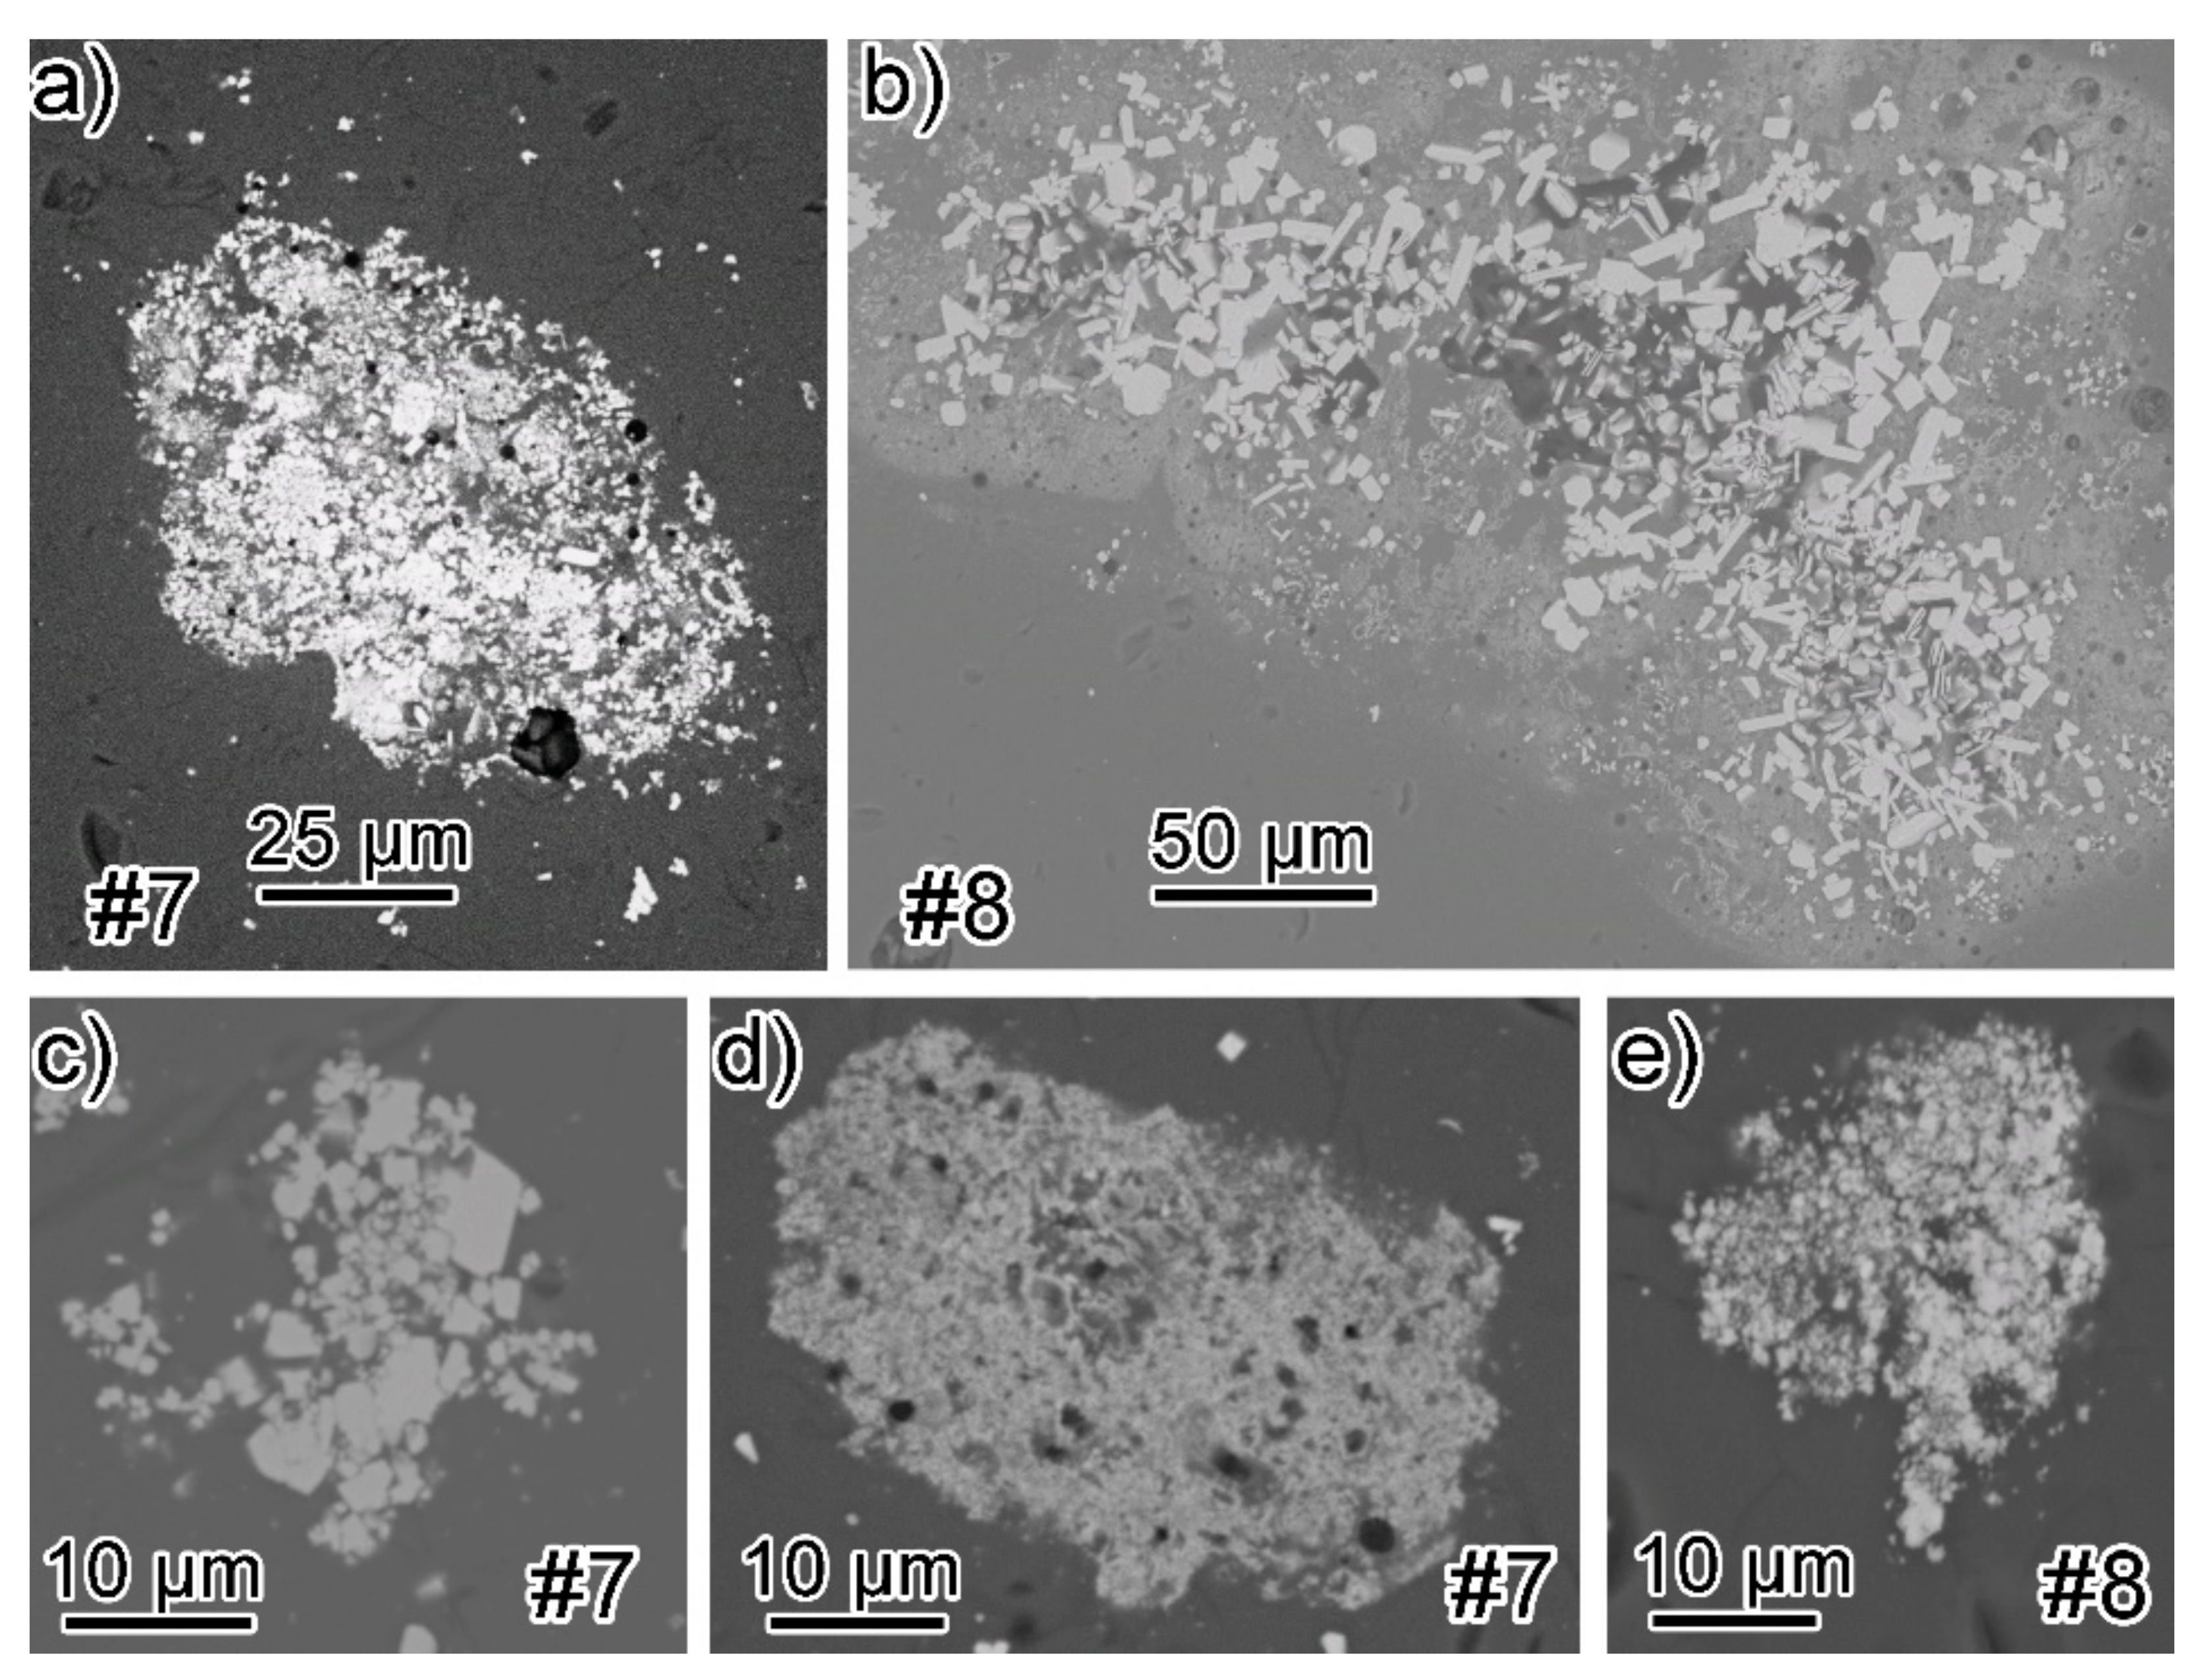
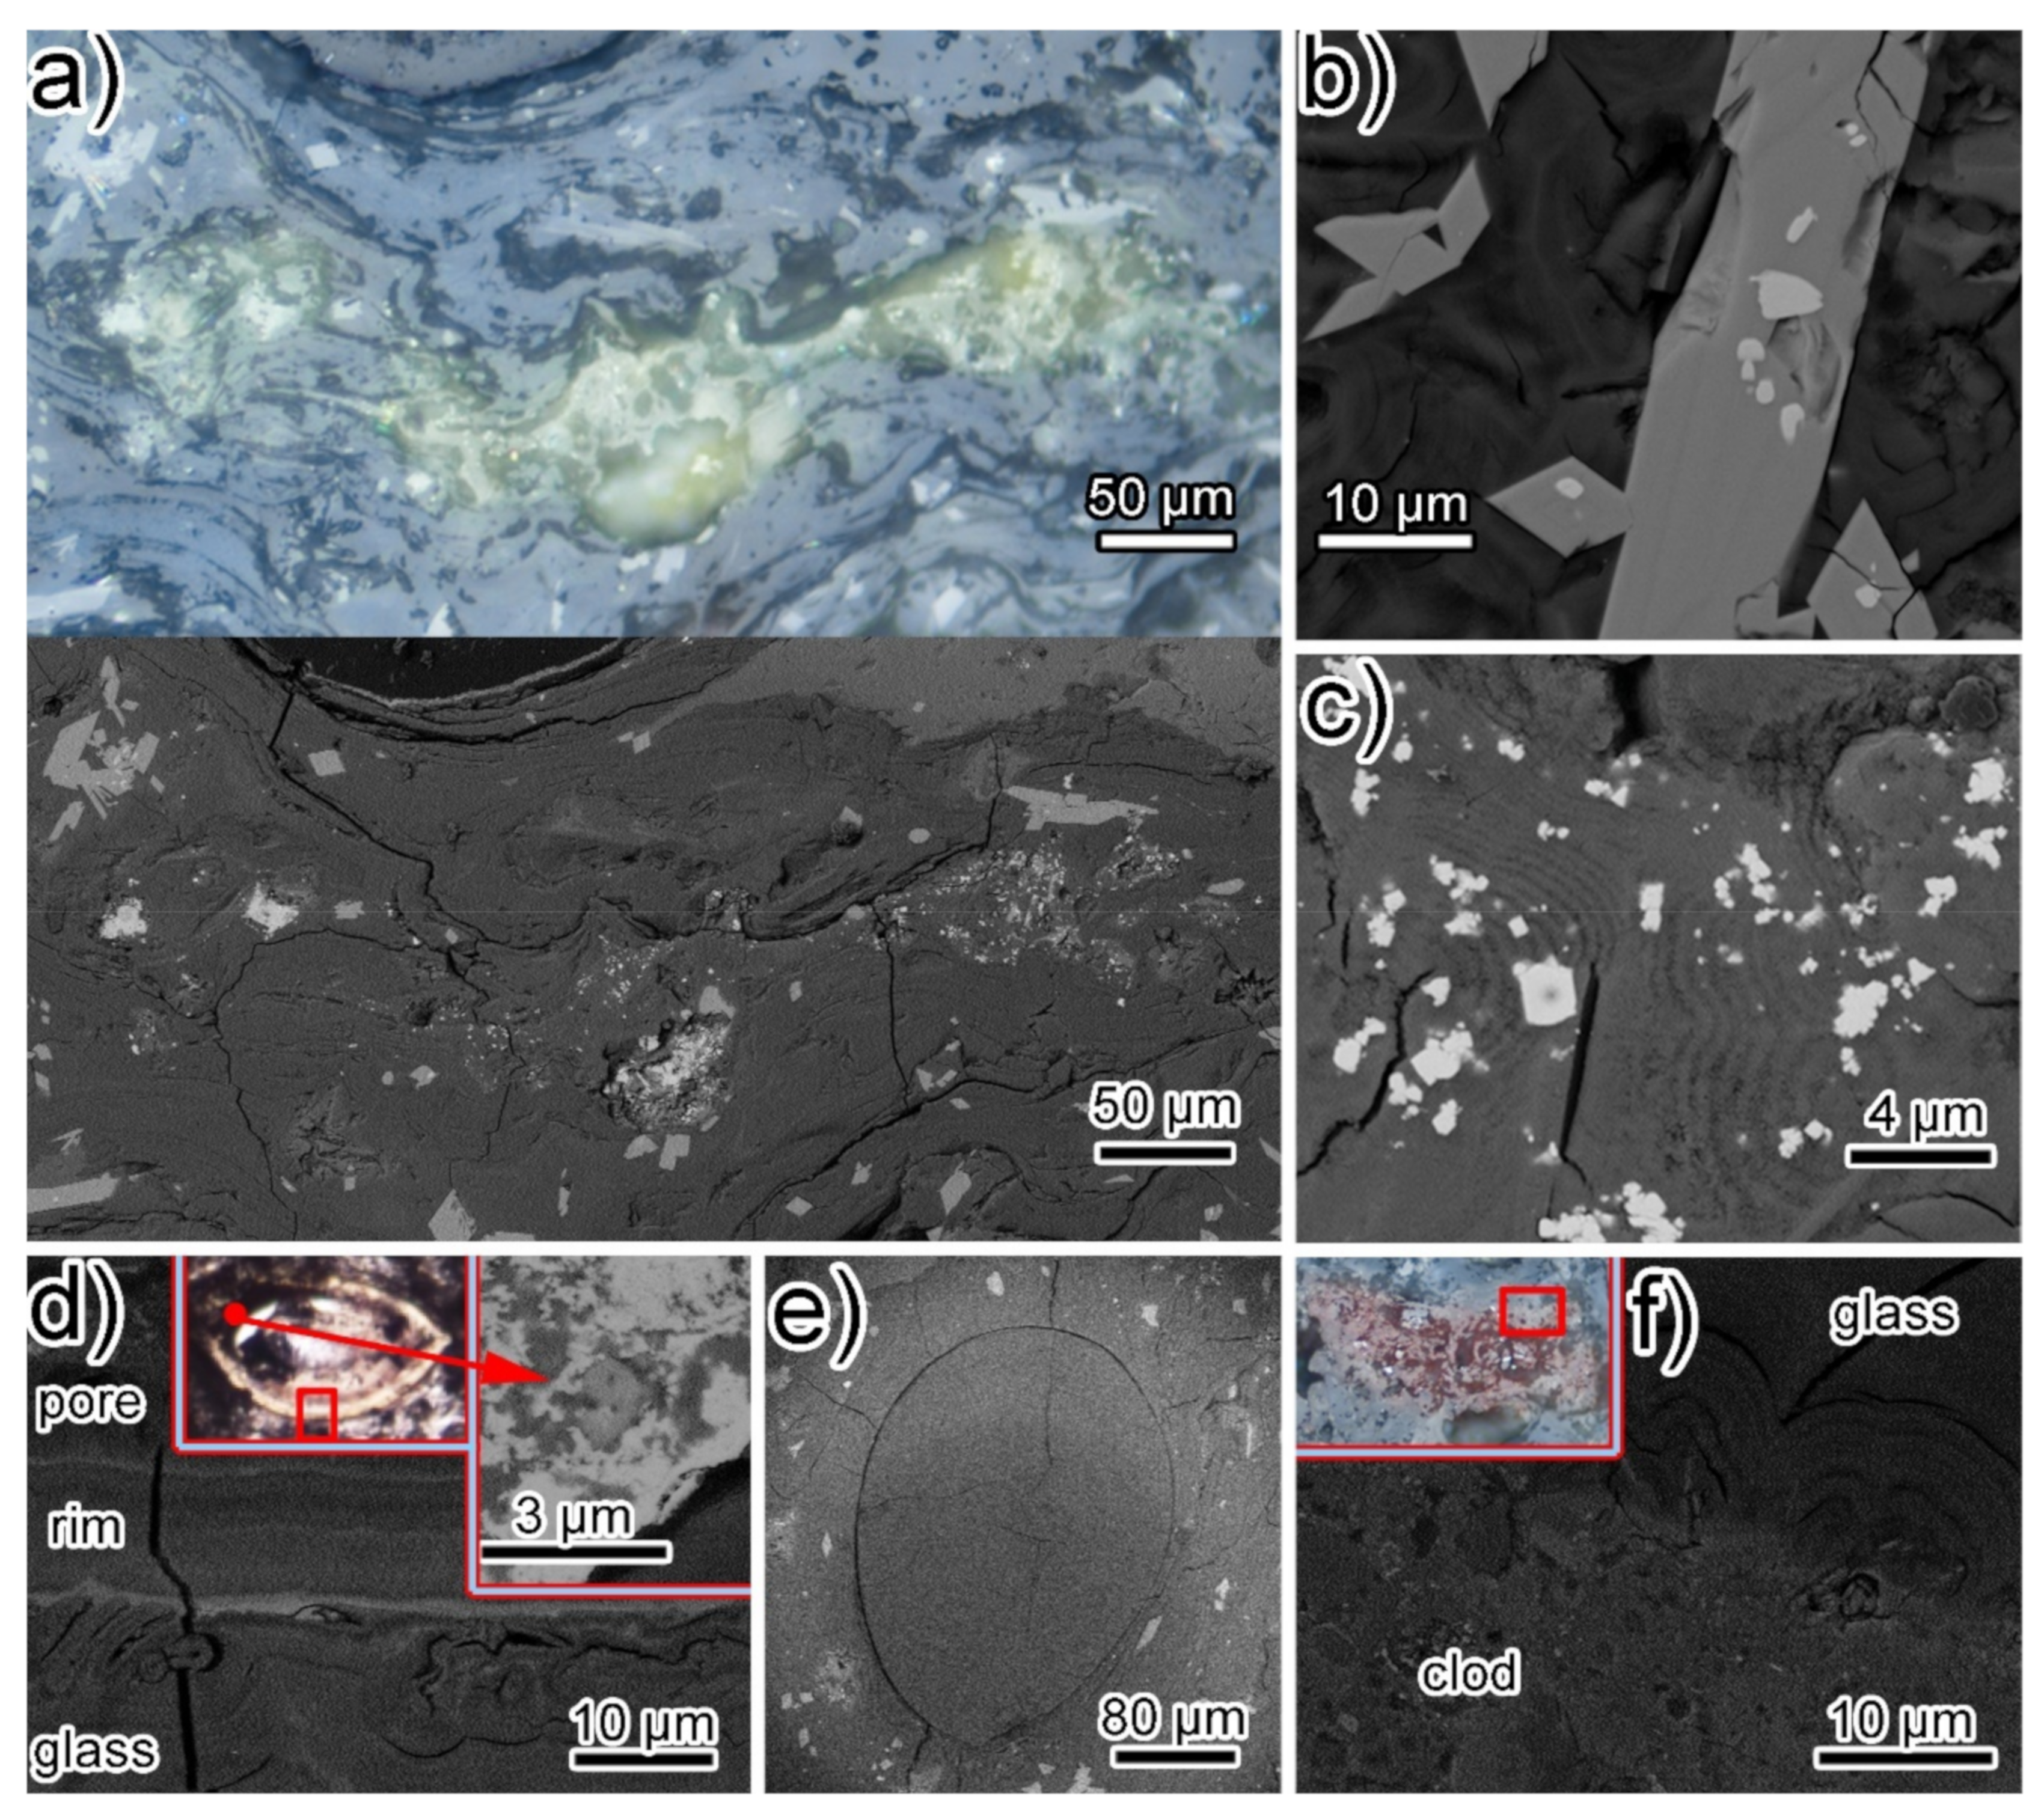
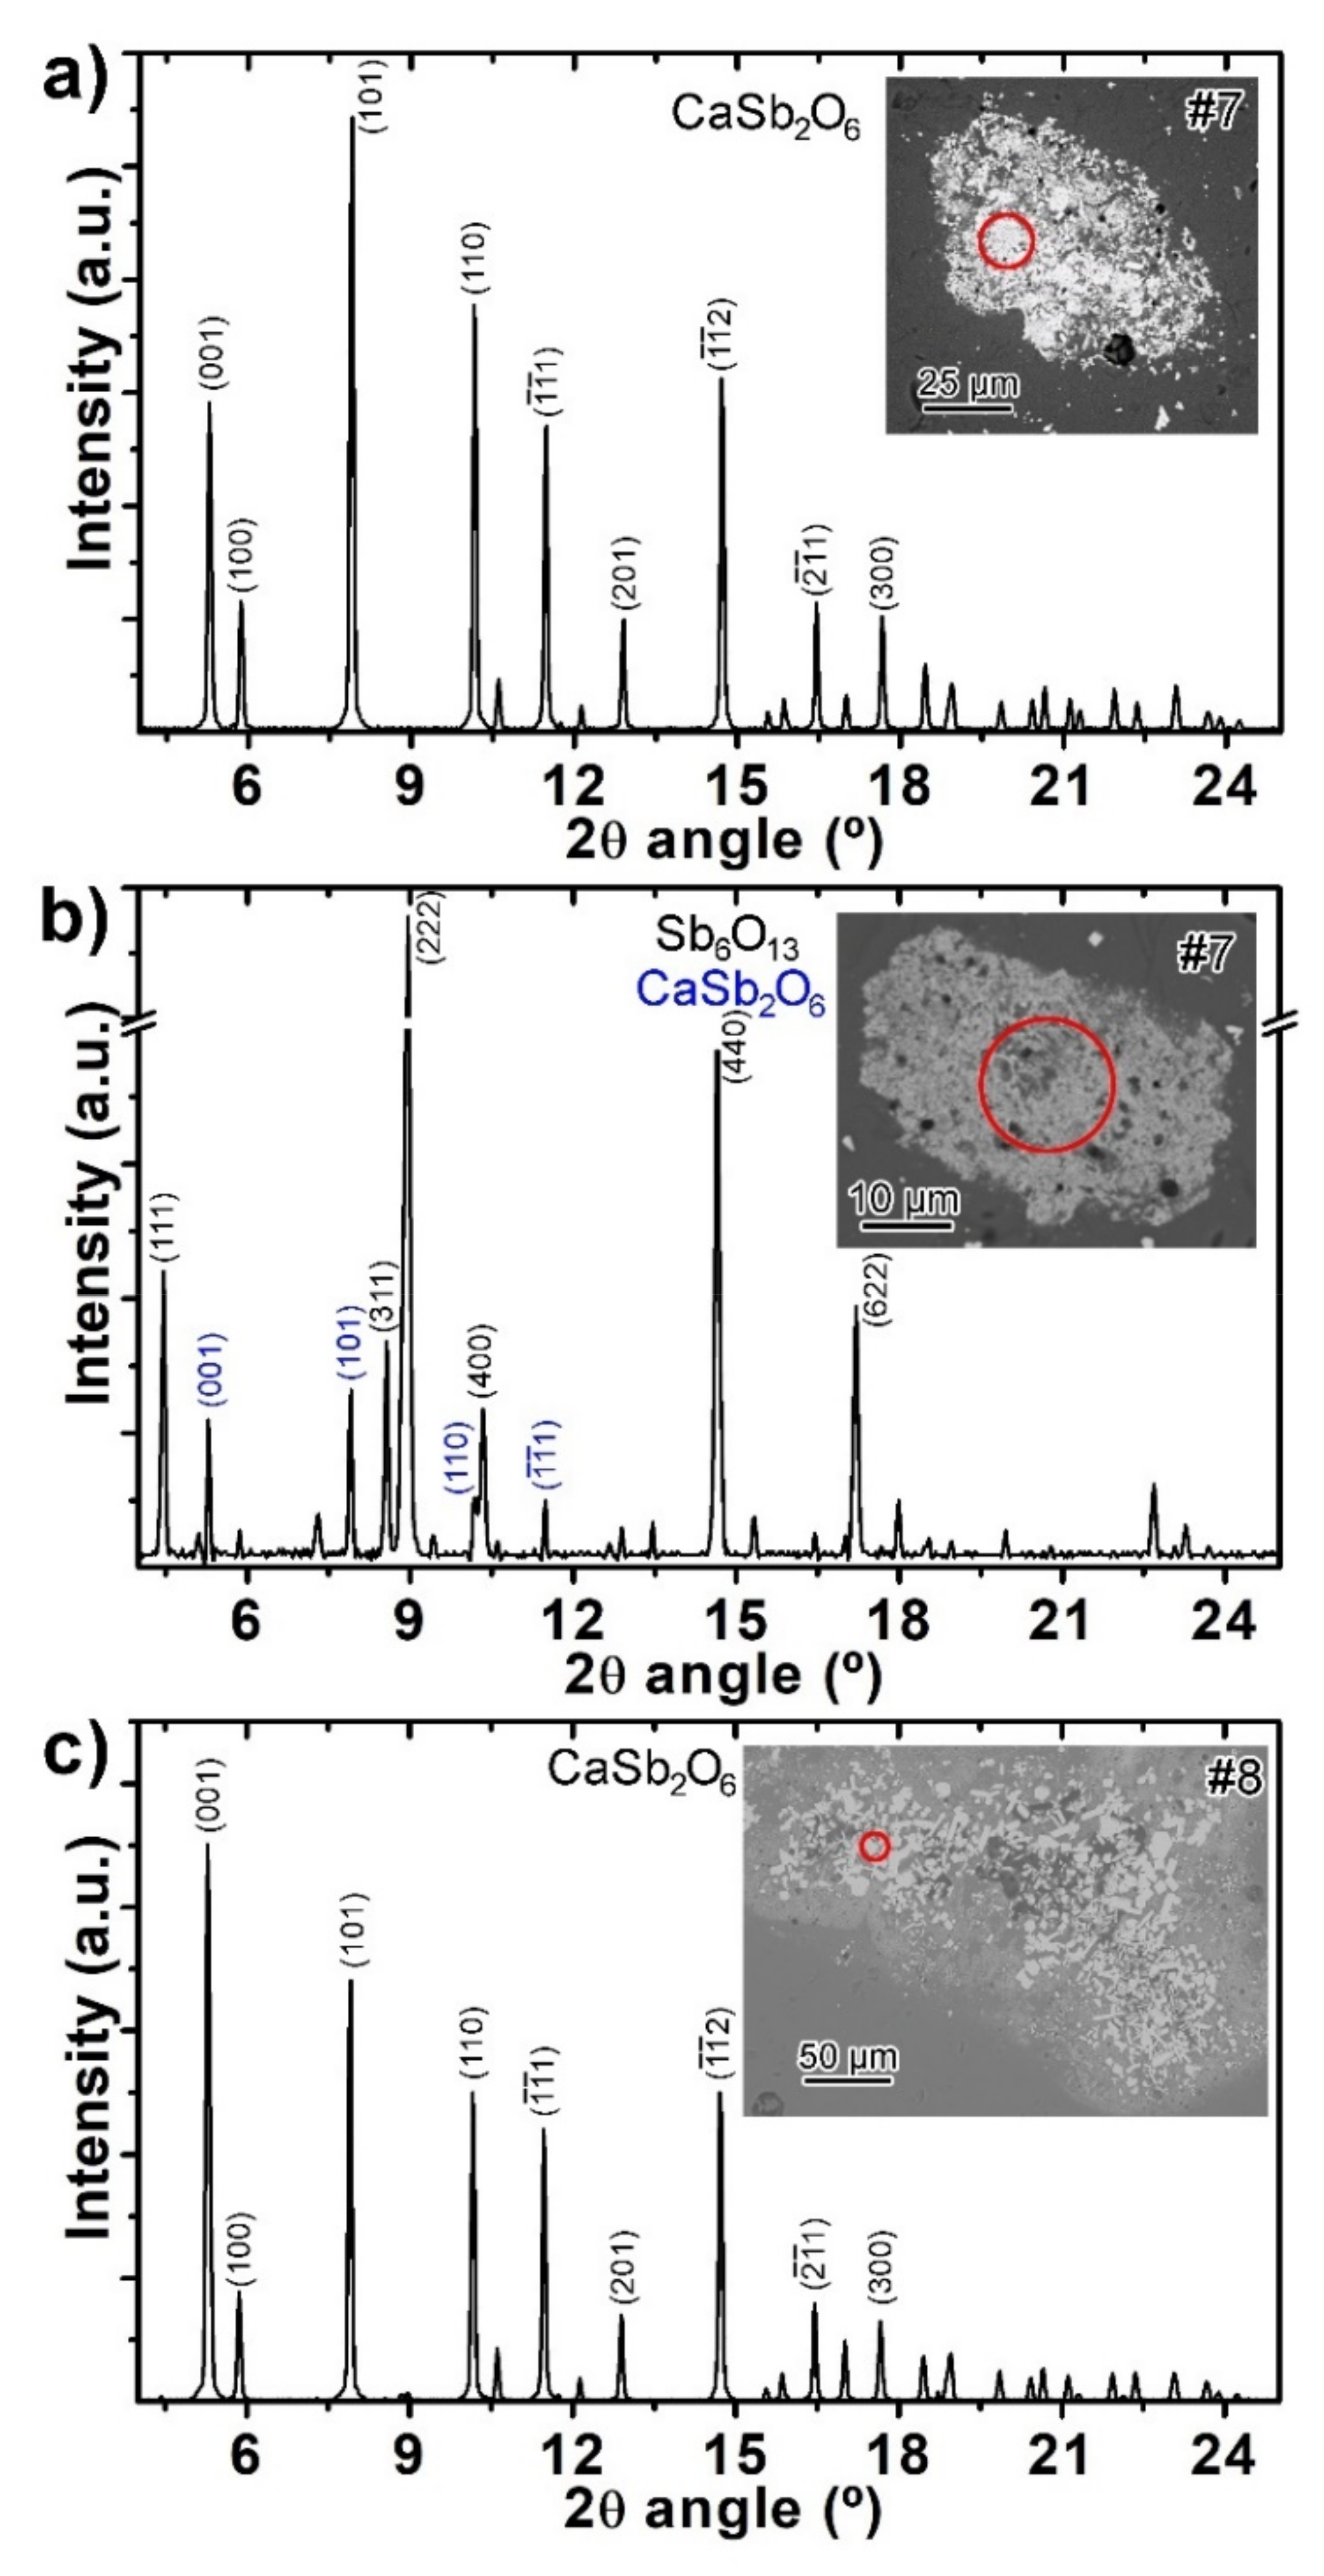
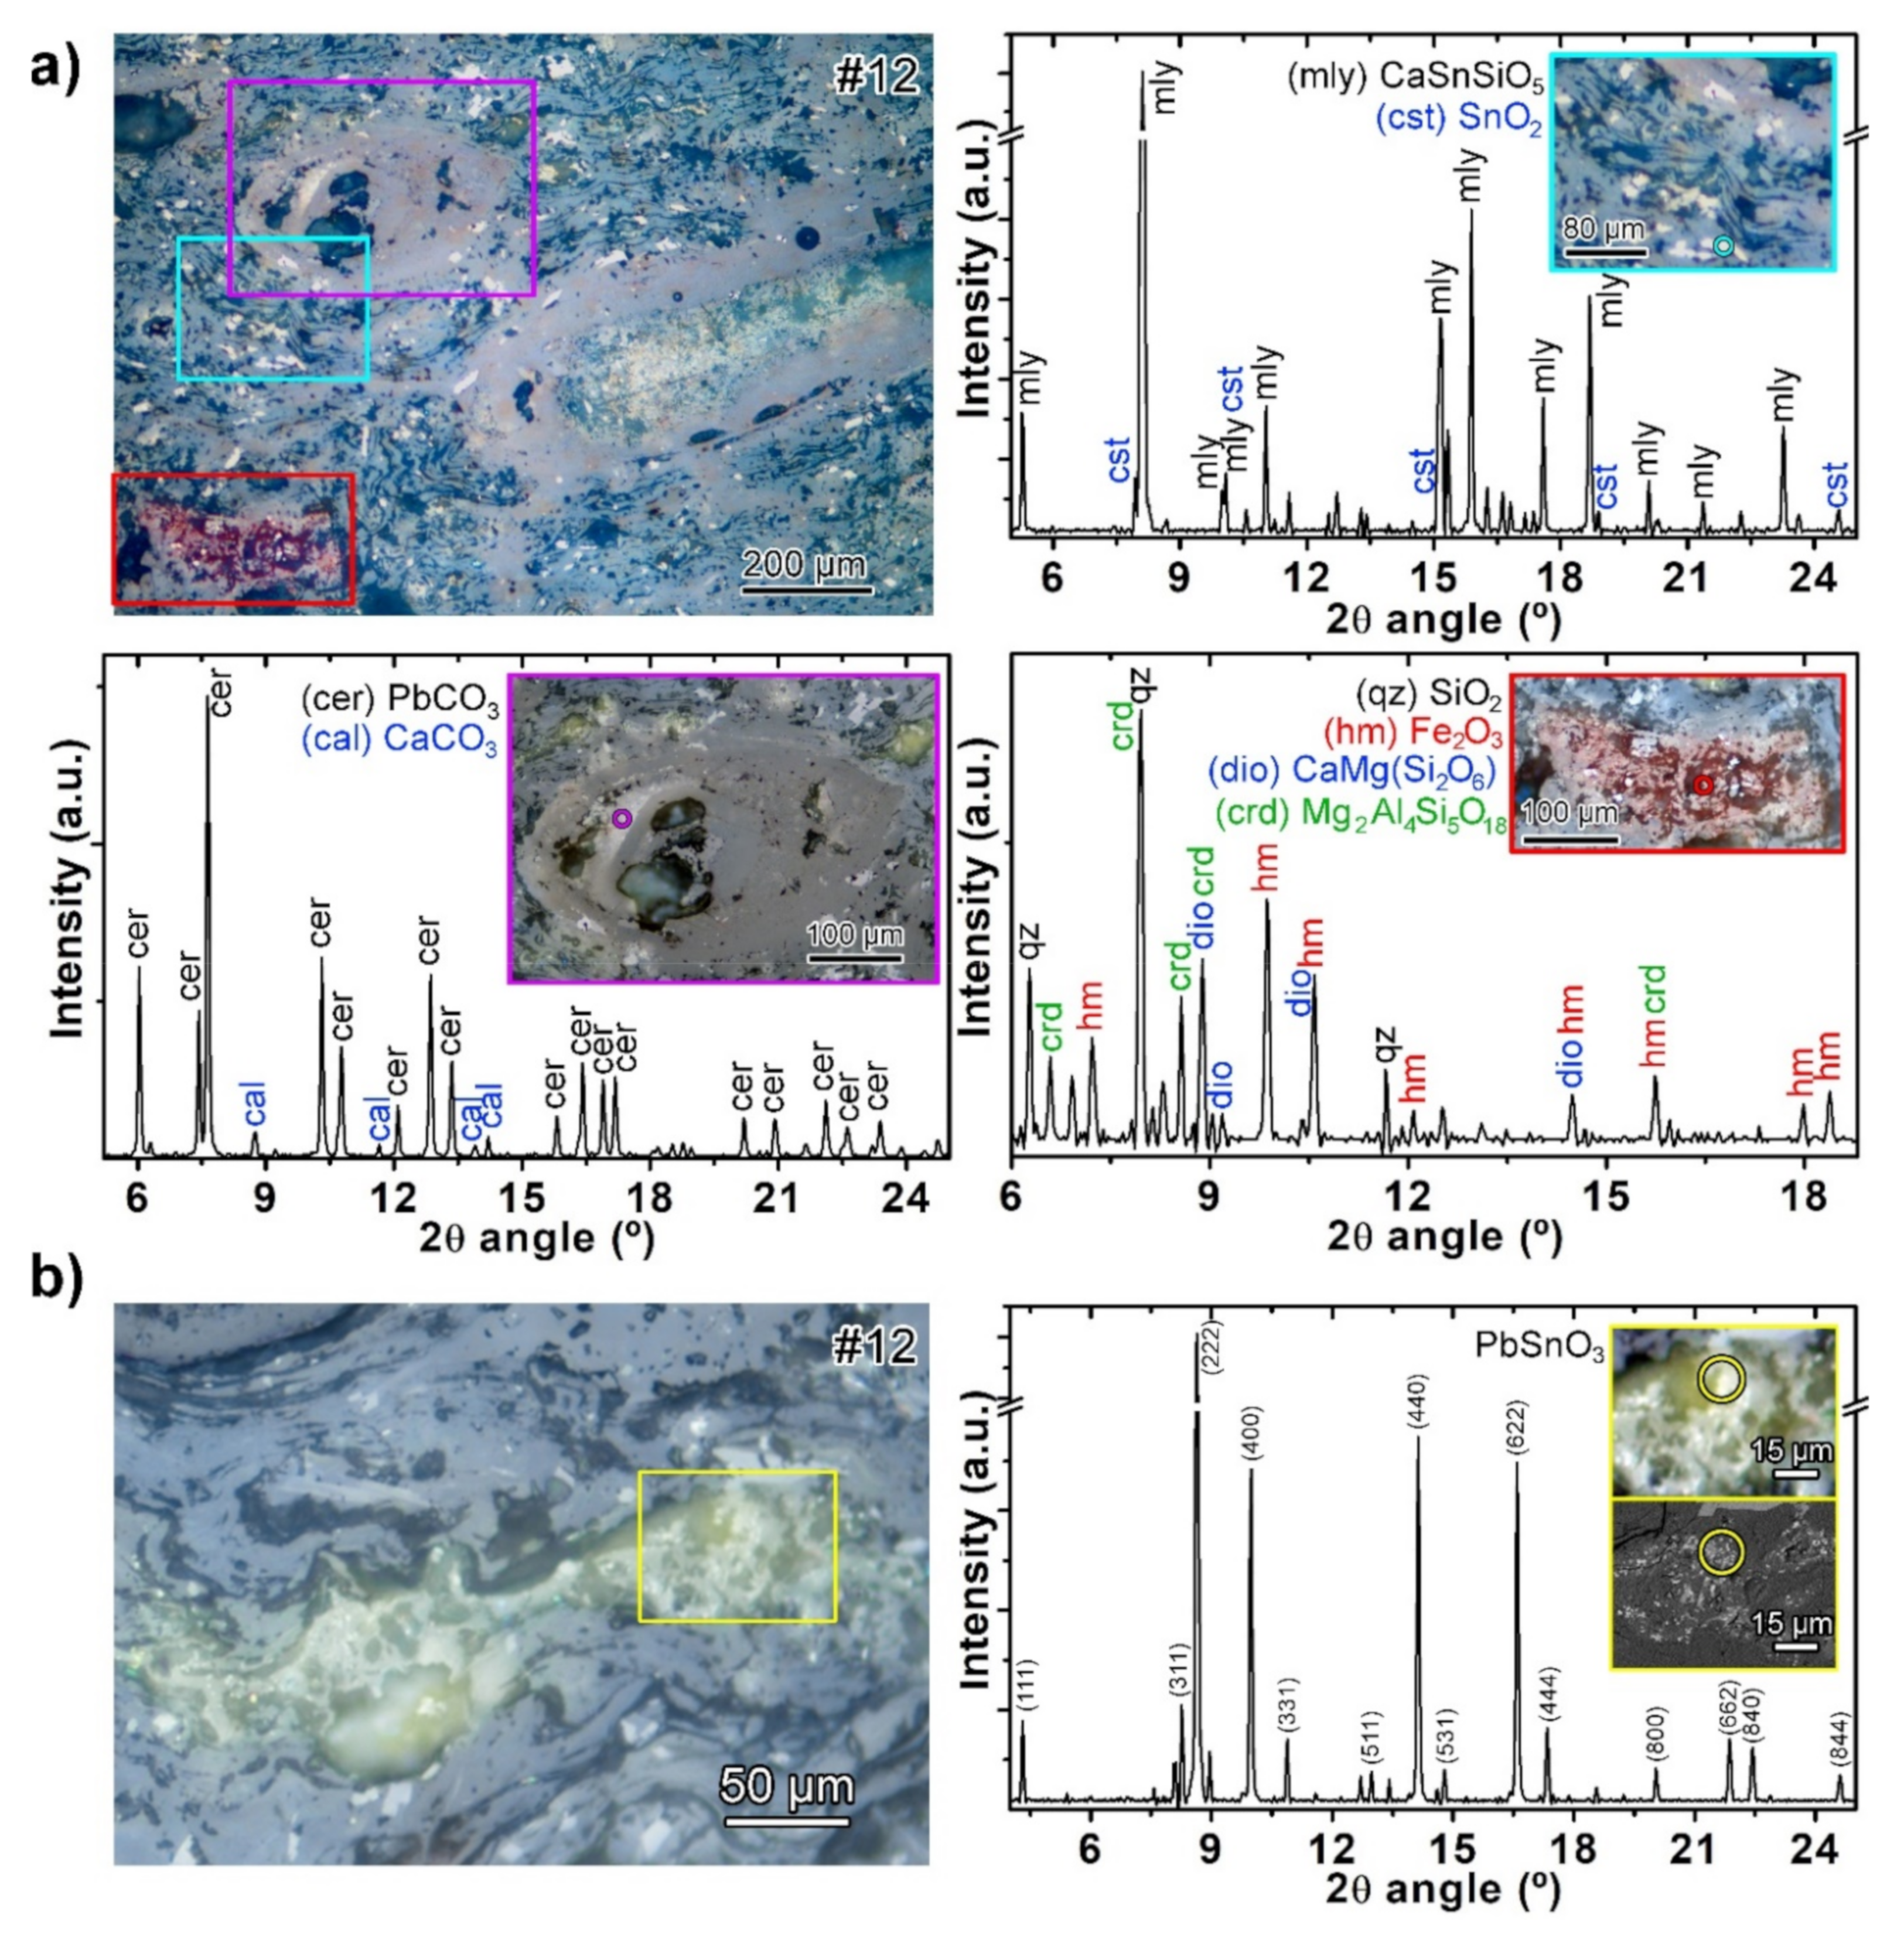
  • Three samples were glass tesserae: two bluish tesserae (#7 and #8) containing antimony-based opacifiers and a green tessera (#12) containing tin-based opacifiers and a base glass with hints of being recycled.
The profuse use of tesserae of types #10 and #13 within the mosaic is evidence of the use of both local (#10) and imported (#13) materials by the artisans of the mosaic workshop. The materials (Montjuïc sandstone and Carrara marble) are both known to have been extensively used for the architecture and sculptures of Barcino. These types of tesserae could be the result of recycling stone leftovers.
The rarest and most expensive types of tesserae were used in small quantities and reserved to build details of relevant members of the depicted scene, for example, bichrome tesserae, such as #9, which were used for the tails of the horses, and glass tesserae (#7, #8, and #12) which were used for the charioteer’s clothing and horses’ decorations. Regarding glass tesserae, the observed variations in the base glass, opacifying and coloring technologies, would imply that the material was gathered from more than one source. In particular, the coexistence of antimony- and tin-based opacifiers would suggest the survival of the traditional technology along with innovations that were possibly stimulated by the shortage of raw materials (antimony and perhaps the glass itself). This would reflect the transitional character of the period in which the mosaic was assembled, confirming the archaeological hypothesis on its chronology, i.e., the early 4th century AD.

Author Contributions

Conceptualization, L.C.; sampling, L.C. and I.M.; measurements and interpretation for colorimetry, L.A. and L.C.; for petrography, A.E., C.B. and L.C; for cathodoluminescence, L.C. and R.D.F.; for isotopic analysis, L.C.; for SEM-EDX, L.C. and R.D.F.; for SR tts-μXRD, O.V., L.C. and R.D.F.; for EDXRF, I.Q. and A.A.; writing—original draft preparation, L.C.; writing—review and editing, all authors. All authors have read and agreed to the published version of the manuscript.

Funding

This research was partially funded by Ajuntament de Barcelona (Institut de Cultura), contract number 17001904.

Data Availability Statement

The data presented in this study are available on request from the corresponding author. The data are not publicly available due to unfinished related ongoing further studies.

Acknowledgments

We thank the Museu d’Història de Barcelona (MUHBA), especially Montserrat Pugès for promoting the presented research. The Archaeological Museum of Catalonia (MAC) is also acknowledged, especially Jordi Principal for granting permission to sample the mosaic. We are indebted to Kusi Colonna-Petri (Servei d’Arqueologia de Barcelona) for the colorimetry measurements, Juan Diego Martín (Universitat de Barcelona) for giving us access to cathodoluminescence microscope, Joaquim Perona (Universitat de Barcelona) for the isotopic measurements, and Cristina Navarro (Servei de Microscòpia-UAB) for the SEM-EDX measurements. Finally, we would like to thank the editor as well as the anonymous reviewers for their valuable remarks and comments.

Conflicts of Interest

The authors declare no conflict of interest.

References

  1. Dunbabin, K.M.D. Mosaics of the Greek and Roman World; Cambridge University Press: New York, NY, USA, 2001. [Google Scholar]
  2. Blázquez, J.M. La cultura romana en Hispania: Mosaicos, arquitectura, pintura. In Historia de España Antigua, vol.II; Cátedra: Madrid, Spain, 1978. [Google Scholar]
  3. Blázquez, J.M. Mosaicos Romanos de España; Cátedra: Madrid, Spain, 2009. [Google Scholar]
  4. Guardia, M. Los Mosaicos de la Antiguedad Tardía en Hispania: Estudios de Iconografía; PPU: Barcelona, Spain, 1992. [Google Scholar]
  5. Blázquez, J.M. Villas hispano-romanas del Bajo Imperio decoradas con mosaicos mitológicos. In Mitología e Historia en los Mosaicos Romanos; Neira, L., Ed.; Ediciones JC: Madrid, Spain, 2010; pp. 89–110. [Google Scholar]
  6. Kiilerich, B. The State of Early Christian Iconography in the Twenty-first Century. Stud. Iconogr. 2015, 36, 99–134. [Google Scholar]
  7. Guimier-Sorbets, A.-M.; Nenna, M.-D. L’emploi du verre, de la faïence et de la peinture dans les mosaïques de Délos. Bulletin de Correspondance Hellénique 1992. [Google Scholar] [CrossRef]
  8. Boschetti, C. Vitreous Materials in Early Mosaics in Italy: Faience, Egyptian Blue, and Glass. J. Glass Stud. 2011, 53, 59–91. [Google Scholar]
  9. Del Hoyo Calleja, J. El mosaico del mitreo de Mérida. In Obras de Grecia y Roma; Montero Montero, M., Arcaz Pozo, J., Eds.; Sociedad Española de Estudios Clásicos: Alcalá de Henares, Spain, 2001; pp. 135–157. [Google Scholar]
  10. Licenziati, F.; Calligaro, T. Study of mosaic glass tesserae from Delos, Greece using a combination of portable μ-Raman and X-ray fluorescence spectrometry. J. Archaeol. Sci. Rep. 2016, 7, 640–648. [Google Scholar] [CrossRef]
  11. Fiorentino, S.; Chinni, T.; Vandini, M. Ravenna, its mosaics and the contribution of archaeometry. A systematic reassessment on literature data related to glass tesserae and new considerations. J. Cult. Herit. 2020, 46, 335–349. [Google Scholar] [CrossRef]
  12. Bonnerot, O.; Ceglia, A.; Michaelides, D. Technology and materials of Early Christian Cypriot wall mosaics. J. Archaeol. Sci. Rep. 2016, 7, 649–661. [Google Scholar] [CrossRef]
  13. Zoleo, A.; Brustolon, M.; Barbon, A.; Silvestri, A.; Molin, G.; Tonietto, S. Fe(III) and Mn(II) EPR quantitation in glass fragments from the palaeo-Christian mosaic of St. Prosdocimus (Padova, NE Italy): Archaeometric and colour correlations. J. Cult. Herit. 2015, 16, 322–328. [Google Scholar] [CrossRef]
  14. Drünert, F.; Palamara, E.; Zacharias, N.; Wondraczek, L.; Möncke, D. Ancient Roman nano-technology: Insight into the manufacture of mosaic tesserae opacified by calcium antimonate. J. Eur. Ceram. Soc. 2018, 38, 4799–4805. [Google Scholar] [CrossRef]
  15. Ricca, M.; Belfiore, C.M.; Ruffolo, S.A.; Barca, D.; De Buergo, M.A.; Crisci, G.M.; La Russa, M.F. Multi-analytical approach applied to the provenance study of marbles used as covering slabs in the archaeological submerged site of Baia (Naples, Italy): The case of the “Villa con ingresso a protiro”. Appl. Surf. Sci. 2015, 357, 1369–1379. [Google Scholar] [CrossRef]
  16. Šmuc, A.; Dolenec, M.; Lesar-Kikelj, M.; Lux, J.; Pflaum, M.; Šeme, B.; Županek, B.; Gale, L.; Kramar, S. Variety of Black and White Limestone Tesserae Used in Ancient Mosaics in Slovenia. Archaeometry 2017, 59, 205–221. [Google Scholar] [CrossRef]
  17. Tasker, A.; Wilkinson, I.P.; Fulford, M.G.; Williams, M. Provenance of chalk tesserae from Brading Roman Villa, Isle of Wight, UK. Proc. Geol. Assoc. 2011, 122, 933–937. [Google Scholar] [CrossRef] [Green Version]
  18. Barca, D.; Fiorenza, E.; D’Andrea, M.; Le Pera, E.; Musella, M.; Sudano, F.; Taliano Grasso, A. Chemical and Petrographic Characterization of Stone and Glass Tesserae in the Nereid and Geometric Mosaics from the S. Aloe Quarter in Vibo Valentia–Calabria, Italy. Minerals 2019, 9, 729. [Google Scholar] [CrossRef] [Green Version]
  19. Barral i Altet, X. Les Mosaïques Romaines et Medievales de la Regio Laietana; Publicaciones Eventuales: Barcelona, Spain, 1978. [Google Scholar]
  20. Darder Lissón, M. El mosaic circenc de Barcino. Implicacions iconogràfiques a partir de les aportacions semàntiques. Butlleí la R. Acadèmia Catalana Belles Arts St. Jordi 1994, VII–VIII, 251–281. [Google Scholar]
  21. Hübner, E. Musaico di Barcellona raffigurante giuochi circensi. Annali dell’Instituto di Corrispondenza Archeologica 1863, 35, 135–172. [Google Scholar]
  22. Balil, A. Mosaicos circenses de Barcelona y Gerona. Boletín de la Real Academia de la Historia 1962, 151, 257–399. [Google Scholar]
  23. Barral i Altet, X. Unes pintures murals romanes inèdites i el mosaic amb curses de circ de Barcelona. Cuadernos de Arqueología e Historia de la Ciudad 1973, 15, 31–68. [Google Scholar]
  24. Balil Illana, A. Sobre la cronología del mosaico circense de Barcelona. Archivo Español de Arqueología 1965, 38, 125. [Google Scholar]
  25. Fauth, F.; Peral, I.; Popescu, C.; Knapp, M. The new Material Science Powder Diffraction beamline at ALBA Synchrotron. Powder Diffr. 2013, 28, 360–370. [Google Scholar] [CrossRef]
  26. Vallcorba, O.; Rius, J. d2Dplot: 2D X-ray diffraction data processing and analysis for through-the-substrate microdiffraction. J. Appl. Cryst. 2019, 52, 478–484. [Google Scholar] [CrossRef]
  27. García-Florentino, C.; Maguregui, M.; Romera-Fernández, M.; Queralt, I.; Margui, E.; Madariaga, J.M. Usefulness of a Dual Macro- and Micro-Energy-Dispersive X-Ray Fluorescence Spectrometer to Develop Quantitative Methodologies for Historic Mortar and Related Materials Characterization. Anal. Chem. 2018, 90, 5795–5802. [Google Scholar] [CrossRef]
  28. Hård, A.; Sivik, L.; Tonnquist, G. NCS, natural color system—From concept to research and applications. Part II. Color. Res. Appl. 1996, 21, 206–220. [Google Scholar] [CrossRef]
  29. Hård, A.; Sivik, L.; Tonnquist, G. NCS, natural color system—From concept to research and applications. Part I. Color. Res. Appl. 1996, 21, 180–205. [Google Scholar] [CrossRef]
  30. Ma, W.; Walton, M.; Cossairt, O.; Bearman, G.; Doehne, E. Crowd-sourced mobile phone images for heritage conservation monitoring. In Proceedings of the Digital Heritage 2015 International Congress, Granada, Spain, 28 September–2 October 2015; IEEE: Piscataway, NJ, USA, 2015; Volume 1, pp. 111–114. [Google Scholar] [CrossRef]
  31. Wess, T. Smartphone citizen science: Can a conservation hypothesis be tested using non specialist technology? Herit. Sci. 2017, 5, 35. [Google Scholar] [CrossRef] [Green Version]
  32. Connolly, C.; Fleiss, T. A study of efficiency and accuracy in the transformation from RGB to CIELAB color space. IEEE Trans. Image Process. 1997, 6, 1046–1048. [Google Scholar] [CrossRef] [PubMed]
  33. Munsell, A.H. Atlas of the Munsell Color System; Howland & Company Inc.: Wadsworth, OH, USA, 1915. [Google Scholar]
  34. Gerharz, R.R.; Lantermann, R.; Spennemann, D.R. Munsell Color Charts: A Necessity for Archaeologists? Aust. J. Hist. Archaeol. 1988, 6, 88–95. [Google Scholar]
  35. Pegalajar, M.C.; Ruiz, L.G.B.; Sánchez-Marañón, M.; Mansilla, L. A Munsell colour-based approach for soil classification using Fuzzy Logic and Artificial Neural Networks. Fuzzy Sets Syst. 2020, 401, 38–54. [Google Scholar] [CrossRef]
  36. Dunham, R.J. Classification of Carbonate Rocks According to Depositional Texture1. In Classification of Carbonate Rocks—A Symposium; American Association of Petroleum Geologists: Tulsa, OK, USA, 1962; ISBN 9781629812366. [Google Scholar] [CrossRef]
  37. Hiatt, E.E.; Pufahl, P.K. Cathodoluminescence petrography of carbonate rocks: Application tounderstanding diagenesis, reservoir quality, and pore system evolution. In Cathodoluminescence and Its Application to Geoscience; Coulson, I., Ed.; Mineralogical Association of Canada: Québec, QC, Canada, 2014; pp. 75–96. [Google Scholar]
  38. Mason, R.A. Effects of heating and prolonged electron bombardment on cathodoluminescence emission from synthetic calcite. Chem. Geol. 1994, 111, 245–260. [Google Scholar] [CrossRef]
  39. Machel, H.G. Application of Cathodoluminescence to Carbonate Diagenesis. In Cathodoluminescence in Geosciences; Pagel, M., Barbin, V., Blanc, P., Ohnenstetter, D., Eds.; Springer: Berlin/Heidelberg, Germany, 2000; pp. 271–301. ISBN 978-3-662-04086-7. [Google Scholar] [CrossRef]
  40. England, J.; Cusack, M.; Paterson, N.W.; Edwards, P.; Lee, M.R.; Martin, R. Hyperspectral cathodoluminescence imaging of modern and fossil carbonate shells. J. Geophys. Res. Biogeosci. 2006, 111. [Google Scholar] [CrossRef] [Green Version]
  41. Parcerisa, D.; Gámez, D.; Gómez-Gras, D.; Usera, J.; Simó, A.; Carrera, J.A. Estratigrafía y petrología del subsuelo precuaternario del sector SW de la depresión de Barcelona (Cadenas Costeras Catalanas, NE de Iberia). Revista de la Sociedad Geológica de España 2008, 21, 93–109. [Google Scholar]
  42. Casas, L.; Di Febo, R.; Parcerisa, D. Petrographic Markers for Archaeometric Identification of Montjuïc Sandstone, the Flagship Stone of Barcelona (NE Spain). Minerals 2020, 10, 154. [Google Scholar] [CrossRef] [Green Version]
  43. Barbin, V.; Ramseyer, K.; Decrouez, D.; Burns, S.; Chamay, J.; Maier, J. Cathodoluminescence of white marbles: An overview. Archaeometry 2007, 34, 175–183. [Google Scholar] [CrossRef]
  44. Blanc, P.; Lapuente Mercadal, M.P.; Gutiérrez Garcia-Moreno, A. A New Database of the Quantitative Cathodoluminescence of the Main Quarry Marbles Used in Antiquity. Minerals 2020, 10, 381. [Google Scholar] [CrossRef]
  45. Lapuente, M.P.; Royo, H. Cathodoluminescence for the Characterization of ancient Marble: Problems and research perspective. In Ancient Quarries and Building Sites in Asia Minor, Research on Hierapolis in Phrygia and Other Cities in South-Western Anatolia: Archaeology, Archaeometry, Conservation; Ismaelli, T., Scardozzi, G., Eds.; Edipuglia: Bari, Italy, 2016; pp. 541–548. ISBN 978-88-7228-819-1. [Google Scholar] [CrossRef]
  46. Herz, N. Provenance determination of Neolithic to Classical Mediterranean marbles isotopes. Archaeometry 1992, 34, 185–194. [Google Scholar] [CrossRef]
  47. Brilli, M.; Savin, M.-C. Provenance study of the white marbles of the “Baths of Elagabalus” at the Palatine Hill in Rome. Archaeol. Anthropol. Sci. 2019, 11. [Google Scholar] [CrossRef]
  48. Gorgoni, C.; Lazzarini, L.; Pallante, P.; Turi, B. An Updated and Detailed Mineropetrographic and C-O Stable Isotopic Reference Database for the Main Mediterranean Marbles Used in Antiquity. In ASMOSIA 5—Interdisciplinary Studies on Ancient Stone, Proceedings of the Fifth International Conference of the Association for the Study of Marble and Other Stones in Antiquity, Museum of Fine Arts, Boston, MA, USA, 11 to 15 June 1998; Hermann, J.J., Herz, N., Newton, R., Eds.; Archetype: London, UK, 2002; pp. 115–131. [Google Scholar]
  49. Attanasio, D.; Bruno, M.; Prochaska, W.; Yavuz, A.B. A Multi-Method Database of the Black and White Marbles of Göktepe (Aphrodisias), Including Isotopic, EPR, Trace and Petrographic Data. Archaeometry 2015, 57, 217–245. [Google Scholar] [CrossRef]
  50. Antonelli, F.; Lazzarini, L. An updated petrographic and isotopic reference database for white marbles used in antiquity. Rend. Lincei 2015, 26, 399–413. [Google Scholar] [CrossRef]
  51. Vataj, E.; Hobdari, E.; Röhrs, S.; Vandenabele, P.; Civici, N. Analytical characterization of glass tesserae from mosaics of early Christian basilicas in Albania. Appl. Phys. A 2016, 123, 76. [Google Scholar] [CrossRef]
  52. Schibille, N.; Boschetti, C.; Valero Tévar, M.Á.; Veron, E.; de Juan Ares, J. The Color Palette of the Mosaics in the Roman Villa of Noheda (Spain). Minerals 2020, 10, 272. [Google Scholar] [CrossRef] [Green Version]
  53. Flügel, E.; Flügel, C. Applied microfacies analysis: Provenance studies of Roman mosaic stones. Facies 1997, 37, 1–48. [Google Scholar] [CrossRef]
  54. Hamon, Y.; Deschamps, R.; Joseph, P.; Doligez, B.; Schmitz, J.; Lerat, O. Integrated workflow for characterizing and modeling a mixed sedimentary system: The Ilerdian Alveolina Limestone Formation (Graus–Tremp Basin, Spain). Comptes Rendus Geosci. 2016, 348, 520–530. [Google Scholar] [CrossRef]
  55. Mey, P.H.; Nagtegaal, P.J.; Roberti, K.J.; Hartevelt, J.J.A. Lithostratigraphic subdivision of Post-Hercynian deposits in the South-Central Pyrenees, Spain. Leidse Geologische Mededelingen 1968, 41, 221–228. [Google Scholar]
  56. Garrido, E.A. Arquitectura y Urbanismo de Barcino en Época alto Imperial: La Decoración Arquitectónica de Edificios Públicos y Privados. 2011. Available online: https://www.tdx.cat/handle/10803/48641#page=1 (accessed on 1 June 2021).
  57. Ravotto, A. La Muralla de Barcino 2017. Available online: https://www.tdx.cat/handle/10803/402256#page=1 (accessed on 1 June 2021).
  58. Ruiz Rodríguez, J.C. La importación de Marmor Lunense en la Hispania Romana: El Paradigma de Tàrraco. Butlletí Arqueològic. 2012, 34–35, 87–114. [Google Scholar]
  59. Fabre, G.; Mayer, M.; Rodà, I. Inscriptions Romaines de Catalogne, IV: Barcino; Universitat de Barcelona: Barcelona, Spain, 1997; ISBN 9788447516568. [Google Scholar]
  60. Garrido, A.; Álvarez, A.; Domènech, A.; Gutierrez Garcia-M, A.; Llanza, I.; Royo, H. Marmora and other stones in the architectural decoration of early imperial Barcino (Barcelona, Spain). In Proceedings of the X International Conference of Association for the Study of Marble & Other Stones in Antiquity (ASMOSIA X), Rome, Italy, 21–26 May 2012; L’Erma di Bretschneider: Rome, Italy, 2012; pp. 135–142. [Google Scholar] [CrossRef]
  61. Foster, H.E.; Jackson, C.M. The composition of “naturally coloured” late Roman vessel glass from Britain and the implications for models of glass production and supply. J. Archaeol. Sci. 2009, 36, 189–204. [Google Scholar] [CrossRef]
  62. Silvestri, A.; Tonietto, S.; Molin, G.; Guerriero, P. The palaeo-Christian glass mosaic of St. Prosdocimus (Padova, Italy): Archaeometric characterisation of tesserae with copper- or tin-based opacifiers. J. Archaeol. Sci. 2014, 42, 51–67. [Google Scholar] [CrossRef]
  63. Boschetti, C.; Henderson, J.; Evans, J.; Leonelli, C. Mosaic tesserae from Italy and the production of Mediterranean coloured glass (4rd century BCE-4th century CE). Part I: Chemical composition and technology. J. Archaeol. Sci. Rep. 2016, 7, 303–311. [Google Scholar] [CrossRef]
  64. Ganio, M.; Boyen, S.; Fenn, T.; Scott, R.; Vanhoutte, S.; Gimeno, D.; Degryse, P. Roman glass across the Empire: An elemental and isotopic characterization. J. Anal. At. Spectrom. 2012, 27, 743–753. [Google Scholar] [CrossRef] [Green Version]
  65. Silvestri, A.; Molin, G.; Salviulo, G. The colourless glass of Iulia Felix. J. Archaeol. Sci. 2008, 35, 331–341. [Google Scholar] [CrossRef]
  66. Freestone, I.C. The Recycling and Reuse of Roman Glass: Analytical Approaches. J. Glass Stud. 2015, 57, 29–40. [Google Scholar]
  67. Maltoni, S.; Silvestri, A. Innovation and tradition in the fourth century mosaic of the Casa delle Bestie Ferite in Aquileia, Italy: Archaeometric characterisation of the glass tesserae. Archaeol. Anthropol. Sci. 2018, 10, 415–429. [Google Scholar] [CrossRef]
  68. Abd-Allah, R. Devitrification behavior of corroded glass: Four case studies. Mediterr. Archaeol. Archaeom. 2007, 7, 39–49. [Google Scholar]
  69. Paynter, S.; Jackson, C.M. Re-used Roman rubbish: A thousand years of recycling glass. Post-Class. Archaeol. 2016, 6, 31–52. [Google Scholar]
  70. Silvestri, A.; Marcante, A. The glass of Nogara (Verona): A “window” on production technology of mid-Medieval times in Northern Italy. J. Archaeol. Sci. 2011, 38, 2509–2522. [Google Scholar] [CrossRef]
  71. Schibille, N.; Freestone, I.C. Composition, Production and Procurement of Glass at San Vincenzo al Volturno: An Early Medieval Monastic Complex in Southern Italy. PLoS ONE 2013, 8, 1–13. [Google Scholar] [CrossRef] [PubMed]
  72. Boschetti, C.; Leonelli, C. Glass Coloring and Recycling in Late Antiquity: A New Case Study from Aquileia (Italy). J. Glass Stud. 2016, 58, 69–86. [Google Scholar]
  73. Foy, D. Les Revêtements muraux en verre à la fin de l’Antiquité: Quelques témoignages en Gaule méridionale. J. Glass Stud. 2008, 50, 51–65. [Google Scholar]
  74. Lahlil, S.; Biron, I.; Galoisy, L.; Morin, G. Rediscovering ancient glass technologies through the examination of opacifier crystals. Appl. Phys. A 2008, 92, 109–116. [Google Scholar] [CrossRef]
  75. Piña, C.; Arriola, H.; Nava, N. Study of Malayaite and Malayaite Cobalt Pigment. Hyperfine Interact. 2005, 161, 93–97. [Google Scholar] [CrossRef]
  76. Takenouchi, S. Hydrothermal synthesis and consideration of the genesis of malayaite. Mineralium Deposita 1971, 6, 335–347. [Google Scholar] [CrossRef]
  77. Maltoni, S.; Silvestri, A. A Mosaic of Colors: Investigating Production Technologies of Roman Glass Tesserae from Northeastern Italy. Minerals 2018, 8, 255. [Google Scholar] [CrossRef] [Green Version]
  78. Tite, M.; Pradell, T.; Shortland, A. Discovery, production and use of tin-based opacifiers in glasses, enamels and glazes from the late Iron age onwards: A reassessment *. Archaeometry 2008, 50, 67–84. [Google Scholar] [CrossRef]
  79. Turner, W.; Rooksby, H. Further historical studies based on X-ray diffraction methods of the reagents employed in making opal and opaque glasses. Jahrbuch des Römisch-Germanischen Zentralmuseums Mainz 1961, 8, 1–6. [Google Scholar] [CrossRef]
  80. Verità, M.; Maggetti, M.; Sagui, L.; Santopadre, P. Colors of Roman Glass: An Investigation of the Yellow Sectilia in the Gorga Collection. J. Glass Stud. 2013, 55, 39–52. [Google Scholar]
  81. Klysubun, W.; Hauzenberger, C.A.; Ravel, B.; Klysubun, P.; Huang, Y.; Wongtepa, W.; Sombunchoo, P. Understanding the blue color in antique mosaic mirrored glass from the Temple of the Emerald Buddha, Thailand. X-Ray Spectrom. 2015, 44, 116–123. [Google Scholar] [CrossRef]
  82. Arletti, R.; Quartieri, S.; Vezzalini, G. Glass mosaic tesserae from Pompeii: An archeometrical investigation. Periodico di Mineralogia 2006, 76, 25–38. [Google Scholar]
  83. Moretti, C.; Hreglich, S. Opacification and colouring of glass by the use of “anime”. Glas. Technol. 1984, 25, 277–282. [Google Scholar]
  84. Matin, M. Tin-based opacifiers in archaeological glass and ceramic glazes: A review and new perspectives. Archaeol. Anthropol. Sci. 2019, 11, 1155–1167. [Google Scholar] [CrossRef] [Green Version]
Figure 1. In the center, a general view of the Circus mosaic, and the smaller surrounding images illustrate the zoomed parts to identify the numbered tesserae in their original locations before their extraction.
Minerals 11 00746 g001
Figure 2. POM images of thin sections (PPL) of limestone tesserae from the Circus mosaic. The right red bands correspond to positive alizarin red S test: (a) #2 (pinkish gray) micritic limestone; (b) #4 (grayish brown) micritic limestone; (c) #11 (weak red) recrystallized micritic limestone with spar veins and microstylolites (inset, detail showing non stained dolomite); (d) #3 (white) sparite-rich limestone (inset, detail of calcite crystal); (e) #1 (dark gray) wackestone (inset, detail of algae fragment); (f) #5 (light yellowish brown) wackestone (on the right, detail of hyaline-tested (top) and porcelaneous-tested (bottom) foraminifera); (g) #9 (white dots in a pinkish background) Alveolina limestone.
Minerals 11 00746 g002
Figure 3. POM images of thin sections of some sampled stone tesserae from the Circus mosaic including the same area viewed under PPL (top) and XPL (bottom): (a) Sandstone #6; (b) sandstone #10; (c) marble #13 with a red band corresponding to a positive alizarin red S test.
Minerals 11 00746 g003
Figure 4. Petrographic images of thin sections of some sampled stone tesserae from the Circus mosaic including the same areas viewed under CL (top) and PPL (bottom): (a) #3 limestone; (b) #5 limestone; (c) #11 limestone; (d) #6 and (e) #10 sandstones showing authigenic overgrowths on quartz (Qz) and K-felspar (Kfs) grains; (f) marble #13.
Minerals 11 00746 g004
Figure 5. Detail of a K-feldspar grain under CL (cyan) in tesserae #6 and #10. They both show recognizable authigenic overgrowths (dark brownish blue), additionally, in tessera #6 there is also a rim of carbonatic cement (bright yellow).
Minerals 11 00746 g005
Figure 6. Isotopic signature of marble from tessera #13 plotted in a diagram depicting the isotopic fields for the main fine-grained classical marbles (after [48,49]). Top-left inset, MGS of tessera #13 plotted against several reference MGS box bars of calcitic marbles (after [50]).
Minerals 11 00746 g006
Figure 7. POM images of thin sections of the sampled glass tesserae from the Circus mosaic: (a) Arctic blue tessera #7, PPL (top) and RL (bottom) corresponding to the square enclosing opaque inclusions; (b) dark azure tessera #8, PPL (top) and RL (bottom) corresponding to the square area enclosing opaque inclusions; (c) sage green tessera #12, on the left general view including large pores and the matrix as seen in PPL (top) and XPL (bottom), on the right enlarged areas viewed under RL displaying gray and yellow microcrystal inclusions (top) and a reddish clod (bottom).
Minerals 11 00746 g007
Figure 8. SEM images of Sb-bearing crystal aggregates and clods taken from thin sections of the sampled glass bluish tesserae from the Circus mosaic: (a) Crystal aggregate from tessera #7, also shown in Figure 7a; (b) crystal aggregate from tessera #8, also shown in Figure 7b; (c) smaller crystal aggregate from tessera #7; (d) clod relict from tessera #7, also shown in Figure 7a; (e) smaller crystal aggregate from tessera #8.
Minerals 11 00746 g008
Figure 9. Detailed images of features found within the thin section of the sampled green glass tessera #12 from the Circus mosaic: (a) Microcrystals with gray and yellowish reflectance as seen in POM in RL mode (top) and the same area seen by SEM (bottom); (b) zoomed SEM image of crystals of gray reflectance including brighter domains; (c) zoomed SEM image of crystals of yellowish reflectance; (d) SEM image of the glass matrix and the rim of a large pore (central inset, PPL POM image of the pore with indication of the SEM viewed areas, and, inset on the right, SEM image of the opaque pore-filling); (e) SEM image of a large filled pore deprived of rim; (f) SEM image of the glass matrix in contact with a clod relict (inset. POM (in RL mode) image of the whole reddish clod with indication of the SEM viewed area).
Minerals 11 00746 g009
Figure 10. Representative diffractograms obtained by SR tts-μXRD from the crystal aggregates found embedded within glass matrix of the bluish tesserae: (a) CaSb2O6 pattern from an aggregate from tessera #7; (b) pattern showing peaks of Sb2O13 and minor CaSb2O6 from a clod relict from tessera #7; (c) CaSb2O6 pattern from an area of the big aggregate from tessera #8. Corresponding SEM images with indication of the irradiated area (red circle) are also shown.
Minerals 11 00746 g010
Figure 11. Representative diffractograms obtained by SR tts-μXRD from the crystalline features found within the green glass tessera #12: (a) POM image in RL mode with several highlighted colored rectangles, also shown as insets in the diffraction patterns, where the corresponding irradiated areas are marked with circles: ((right) grayish reflectance crystals including malayaite (mly) and cassiterite (cst), (bottom-left) pore filling including cerussite (cer) and calcite (cal); (bottom-right) reddish relict clod including quartz (qz), hematite (hm), diopside (dio) and cordierite (crd)). (b) POM image in RL mode with a highlighted rectangle, also shown as an inset (along with the equivalent SEM image) in the diffraction pattern on the right, where the corresponding irradiated area is marked with a circle, they correspond to yellowish reflectance crystals of cubic PbSnO3.
Minerals 11 00746 g011
Figure 12. Representative bulk EDXRF patterns for the three sampled glass tesserae from the Circus mosaic showing relevant element peaks. In particular, Sb and Cu for tesserae #7 (arctic blue); Sb for tessera #8 (dark azure); and Pb, Sn, and Cu for tessera #12 (green). Inset, detail to reveal the presence of Co, in #12 and specially in #8.
Minerals 11 00746 g012
Table 1. Table includes close-up images of the thirteen sampled types of tesserae and their measured colors using both NCS and CIELAB systems, the color name corresponds to the closest Munsell color.
Sample#1#2#3#4#5#6#7
Picture Minerals 11 00746 i001 Minerals 11 00746 i002 Minerals 11 00746 i003 Minerals 11 00746 i004 Minerals 11 00746 i005 Minerals 11 00746 i006 Minerals 11 00746 i007
NCSS 7005 Y20RS 2010 Y50RS 1005 Y30RS 5010 Y10RS 4020 Y30RS 7010 Y90RS 5020 B50G
L*35.6475.8386.6553.9758.232.4947.97
a*1.916.921.253.119.939.45−14.19
b*6.2113.2710.0513.7421.765.67−3.43
Color namedark graypinkish graywhitegrayish brownlight yellowish browndusky redgrayish arctic blue
Sample#8#9#10#11#12#13
Picture Minerals 11 00746 i008 Minerals 11 00746 i009 Minerals 11 00746 i010 Minerals 11 00746 i011 Minerals 11 00746 i012 Minerals 11 00746 i013
NCSS 7010 B10GS 2010 Y70RS 6005 G50YS 5020 Y90RS 6020 G30YS 3005 Y20R
L*33.1975.7647.5644.6138.7669.27
a*−5.517.54−2.9115.4−9.891.38
b*−5.989.545.148.4813.9610.02
Color namedark grayish azurepinkish whitegreenish grayweak redsage greenlight gray
Table 2. Arithmetic means (m) and standard deviations (σ) of the chemical composition (wt%) obtained by SEM-EDS on several small areas (free of visible microcrystals) of the three sampled glass tesserae.
Compound#7 (Arctic Blue)#8 (Dark Azure)#12 (Sage Green)
mσmσmσ
Na2O (%)13.30.314.911.20.2
MgO (%)nd nd 0.50.1
Al2O3 (%)2.60.21.71.57.70.8
SiO2 (%)70.51.871.92.774.95.5
Cl (%)1.10.12.21od
K2O (%)0.90.1od 3.21.3
CaO (%)6.40.27.80.43.20.8
MnO (%)0.70.1nd nd
FeO (%)0.90.2od 1.61.3
CuO (%)nd od 0.90.8
SnO2 (%)nd nd 2.21.7
Sb2O5 (%)3.42.1nd nd
PbO (%)od nd 4.73.0
nd, not detected; od, occasionally detected.
Table 3. Bulk composition of the three sampled glass tesserae as obtained by EDXRF.
Compound#7 (Arctic Blue)#8 (Dark Azure)#12 (Green)
Na2O (%)4.44.52.2
Al2O3 (%)4.65.60.8
SiO2 (%)69.670.241.6
K2O (%)0.91.41.6
CaO (%)11.69.612.4
Fe2O3 (%)1.51.84.0
CuO (%)0.70.22.4
SnO2 (%)0.40.113.8
Sb2O5 (%)2.74.00.3
PbO (%)0.40.820.1
Mn (ppm)12515402420
Co (ppm)nd305115
Zn (ppm)600nd2710
Rb (ppm)305065
Sr (ppm)9757551090
Zr (ppm)225260195
nd, not detected.
Publisher’s Note: MDPI stays neutral with regard to jurisdictional claims in published maps and institutional affiliations.

