Article

High-Pressure Raman Spectroscopy and X-ray Diffraction Study on Scottyite, BaCu2Si2O7

1
Department of E-Learning Design and Management, National Chiayi University, Chiayi 621302, Taiwan
2
Center for High Pressure Science & Technology Advanced Research, Shanghai 201203, China
3
Guanghua Institute of Gemmology and Mineral Resources, Jiangxi University of Applied Sciences, Nanchang 330100, China
4
Department of Earth Sciences, National Cheng-Kung University, Tainan 70101, Taiwan
*
Authors to whom correspondence should be addressed.
Minerals 2021, 11(6), 608; https://doi.org/10.3390/min11060608
Submission received: 29 April 2021 / Revised: 29 May 2021 / Accepted: 3 June 2021 / Published: 7 June 2021
(This article belongs to the Special Issue Minerals under Extreme Conditions)

Abstract

:
In situ high-pressure synchrotron X-ray diffraction and Raman spectroscopic experiments of scottyite, BaCu2Si2O7, were carried out in a diamond anvil cell up to 21 GPa at room temperature. X-ray diffraction patterns reveal four new peaks near 3.5, 3.1, 2.6 and 2.2 Å above 8 GPa, while some peaks of the original phase disappear above 10 GPa. In the Raman experiment, we observed two discontinuities in /dP, the slopes of Raman wavenumber (ν) of some vibration modes versus pressure (P), at approximately 8 and 12 GPa, indicating that the Si-O symmetrical and asymmetrical vibration modes change with pressure. Fitting the compression data to Birch–Murnaghan equation yields a bulk modulus of 102 ± 5 GPa for scottyite, assuming Ko′ is four. Scottyite shows anisotropic compressibility along three crystallographic axes, among which c-axis was the most compressible axis, b-axis was the last and a-axis was similar to the c-axis on the compression. Both X-ray and Raman spectroscopic data provide evidences that scottyite undergoes a reversible phase transformation at 8 GPa.

1. Introduction

Rock-forming minerals that occur on the Earth’s crust may change structures and physical properties in the mantle environment. Numerous high-pressure experiments in Earth sciences were focused on silicate minerals that are directly relevant to the Earth’s interior. Some orthosilicate minerals, such as olivine, show that the SiO4 tetrahedron is relatively rigid; not until pressures as high as 30 GPa do SiO4 tetrahedron start to show signs of distortion. The distortion of SiO4 tetrahedron is interpreted as due to the distortion of Si-O-Si linkage, which was recognized by the kink in the /dP (the slopes of Raman wavenumber (ν) versus pressure (P)) plot [1]. In contrast, before the distortion of SiO4 tetrahedron, the most easily distorted crystal structure took place on the bond connection between cation and SiO4 tetrahedron. Therefore, it would be interesting to look into sorosilicates that have two tetrahedrons shared and linked by one oxygen atom, forming a basic structural unit of Si2O7. The SiO4 tetrahedron is considered to be a rigid body and not easy to be compressed.
Scottyite, named after Michael M. Scott, is a Ba-Cu sorosilicate, BaCu2Si2O7, [2]. As a newly found mineral, scottyite is a very rare mineral, first reported as an unnamed Ba-Cu silicate from Eifel, Germany [3,4,5]. It was then identified as an orthorhombic system with space group Pbnm and unit-cell parameters a = 6.866 Å, b = 13.901 Å, c = 6.902 Å, and V = 625.70 Å3 [6]. It was later found in many other localities, including the Wessels mine, Kalahari Manganese Fields, Northern Cape Province, Republic of South Africa, from which the unit-cell parameters are determined as a = 6.8556 Å, b = 13.1725 Å, c = 6.8901 Å, and V = 622.21 Å3 on the basis of a single-crystal XRD study [2]. The structure of scottyite is based on a tetrahedral framework consisting of SiO4 and CuO4 tetrahedrons. The flattened CuO4 tetrahedrons share corners with one another to form chains parallel to the c-axis. These chains are interlinked by Si2O7 tetrahedral dimers and Ba2+ cations, which are bonded to seven O atoms of irregular coordination numbers. Within the CuO4 tetrahedral chain, the Cu-O-Cu angle is 124.49°, which is responsible for the antiferromagnetic coupling in BaCu2Si2O7 [2,7,8,9].

2. Experimental Method

2.1. Raman Spectroscopy

Small chips of natural scottyite crystal (RRUFF Project, deposition no. R120077, from the Wessels mine, Republic of South Africa) with a dimension of 80 μm were used as a starting material in the Raman spectroscopic experiment. In this high pressure work, a disk of T301 stainless steel with a thickness of 250 μm was used as a gasket. The gasket was first compressed between the diamond anvils to make an indentation on which a hole of 150 μm was then drilled for the sample chamber. The sample was loaded in the chamber using a 4:1 methanol:ethanol mixture as pressure-transmitting medium. It was then gradually compressed to high pressure and then decompressed to room pressure. The ruby fluorescence method was used for pressure measurement [10] after each pressure increment. We measured more than two ruby grains to make sure that the pressure of the compressed sample remained hydrostatic. A Horiba iHR550 unit installed at the Department of Earth Sciences, National Cheng Kung University, was used in the Raman spectroscopic study. A semiconductor laser beam of 458 nm was used as an excitation source. The laser light of 100 mW was focused on the sample in the diamond cell, and Raman signals were collected in a back-scattered way by the CCD detector. The recording time of each Raman spectrum was 60 s (averaged by 3 times of acquisition). During each measurement, pressure was recorded before and after each Raman spectrum was collected. Both compression (loading) and decompression (unloading) processes were conducted.

2.2. X-ray Diffraction

Synchrotron X-ray diffraction method was applied to the study of the behaviors of natural scottyite (RRUFF Project, deposition no. R120077, from the Wessels mine, Republic of South Africa) at high pressure. The powder of scottyite was then loaded into the hole (200 µm in diameter) in a T301 stainless steel gasket, prepared in the same way as the high pressure Raman measurement. After the chamber was loaded with the sample, it was then filled with silicon oil as a pressure-transmitting medium, and then gradually compressed to high pressure and decompressed to room pressure. Pressure determination was achieved by observing the shift of the ruby R1 emission line. More than two ruby grains were measured, to make sure that the pressure remained hydrostatic.
The X-ray diffraction (XRD) experiment was carried out at PLS-II 5A beamline at the Pohang Accelerator Laboratory, South Korea. The size of the X-ray beam was confined to 100 µm and the position of the beam was adjusted to fall on the center of the sample chamber in each run. Pressure was gradually increased up to about 17 GPa and then decreased relatively rapidly back to the ambient conditions. The scattering data were collected by MAR345 detector and integrated using the FIT2D v10.132 (ESRF) [11]. Lattice parameters were calculated by a least-square method developed by Novak and Colville [12].

3. Results

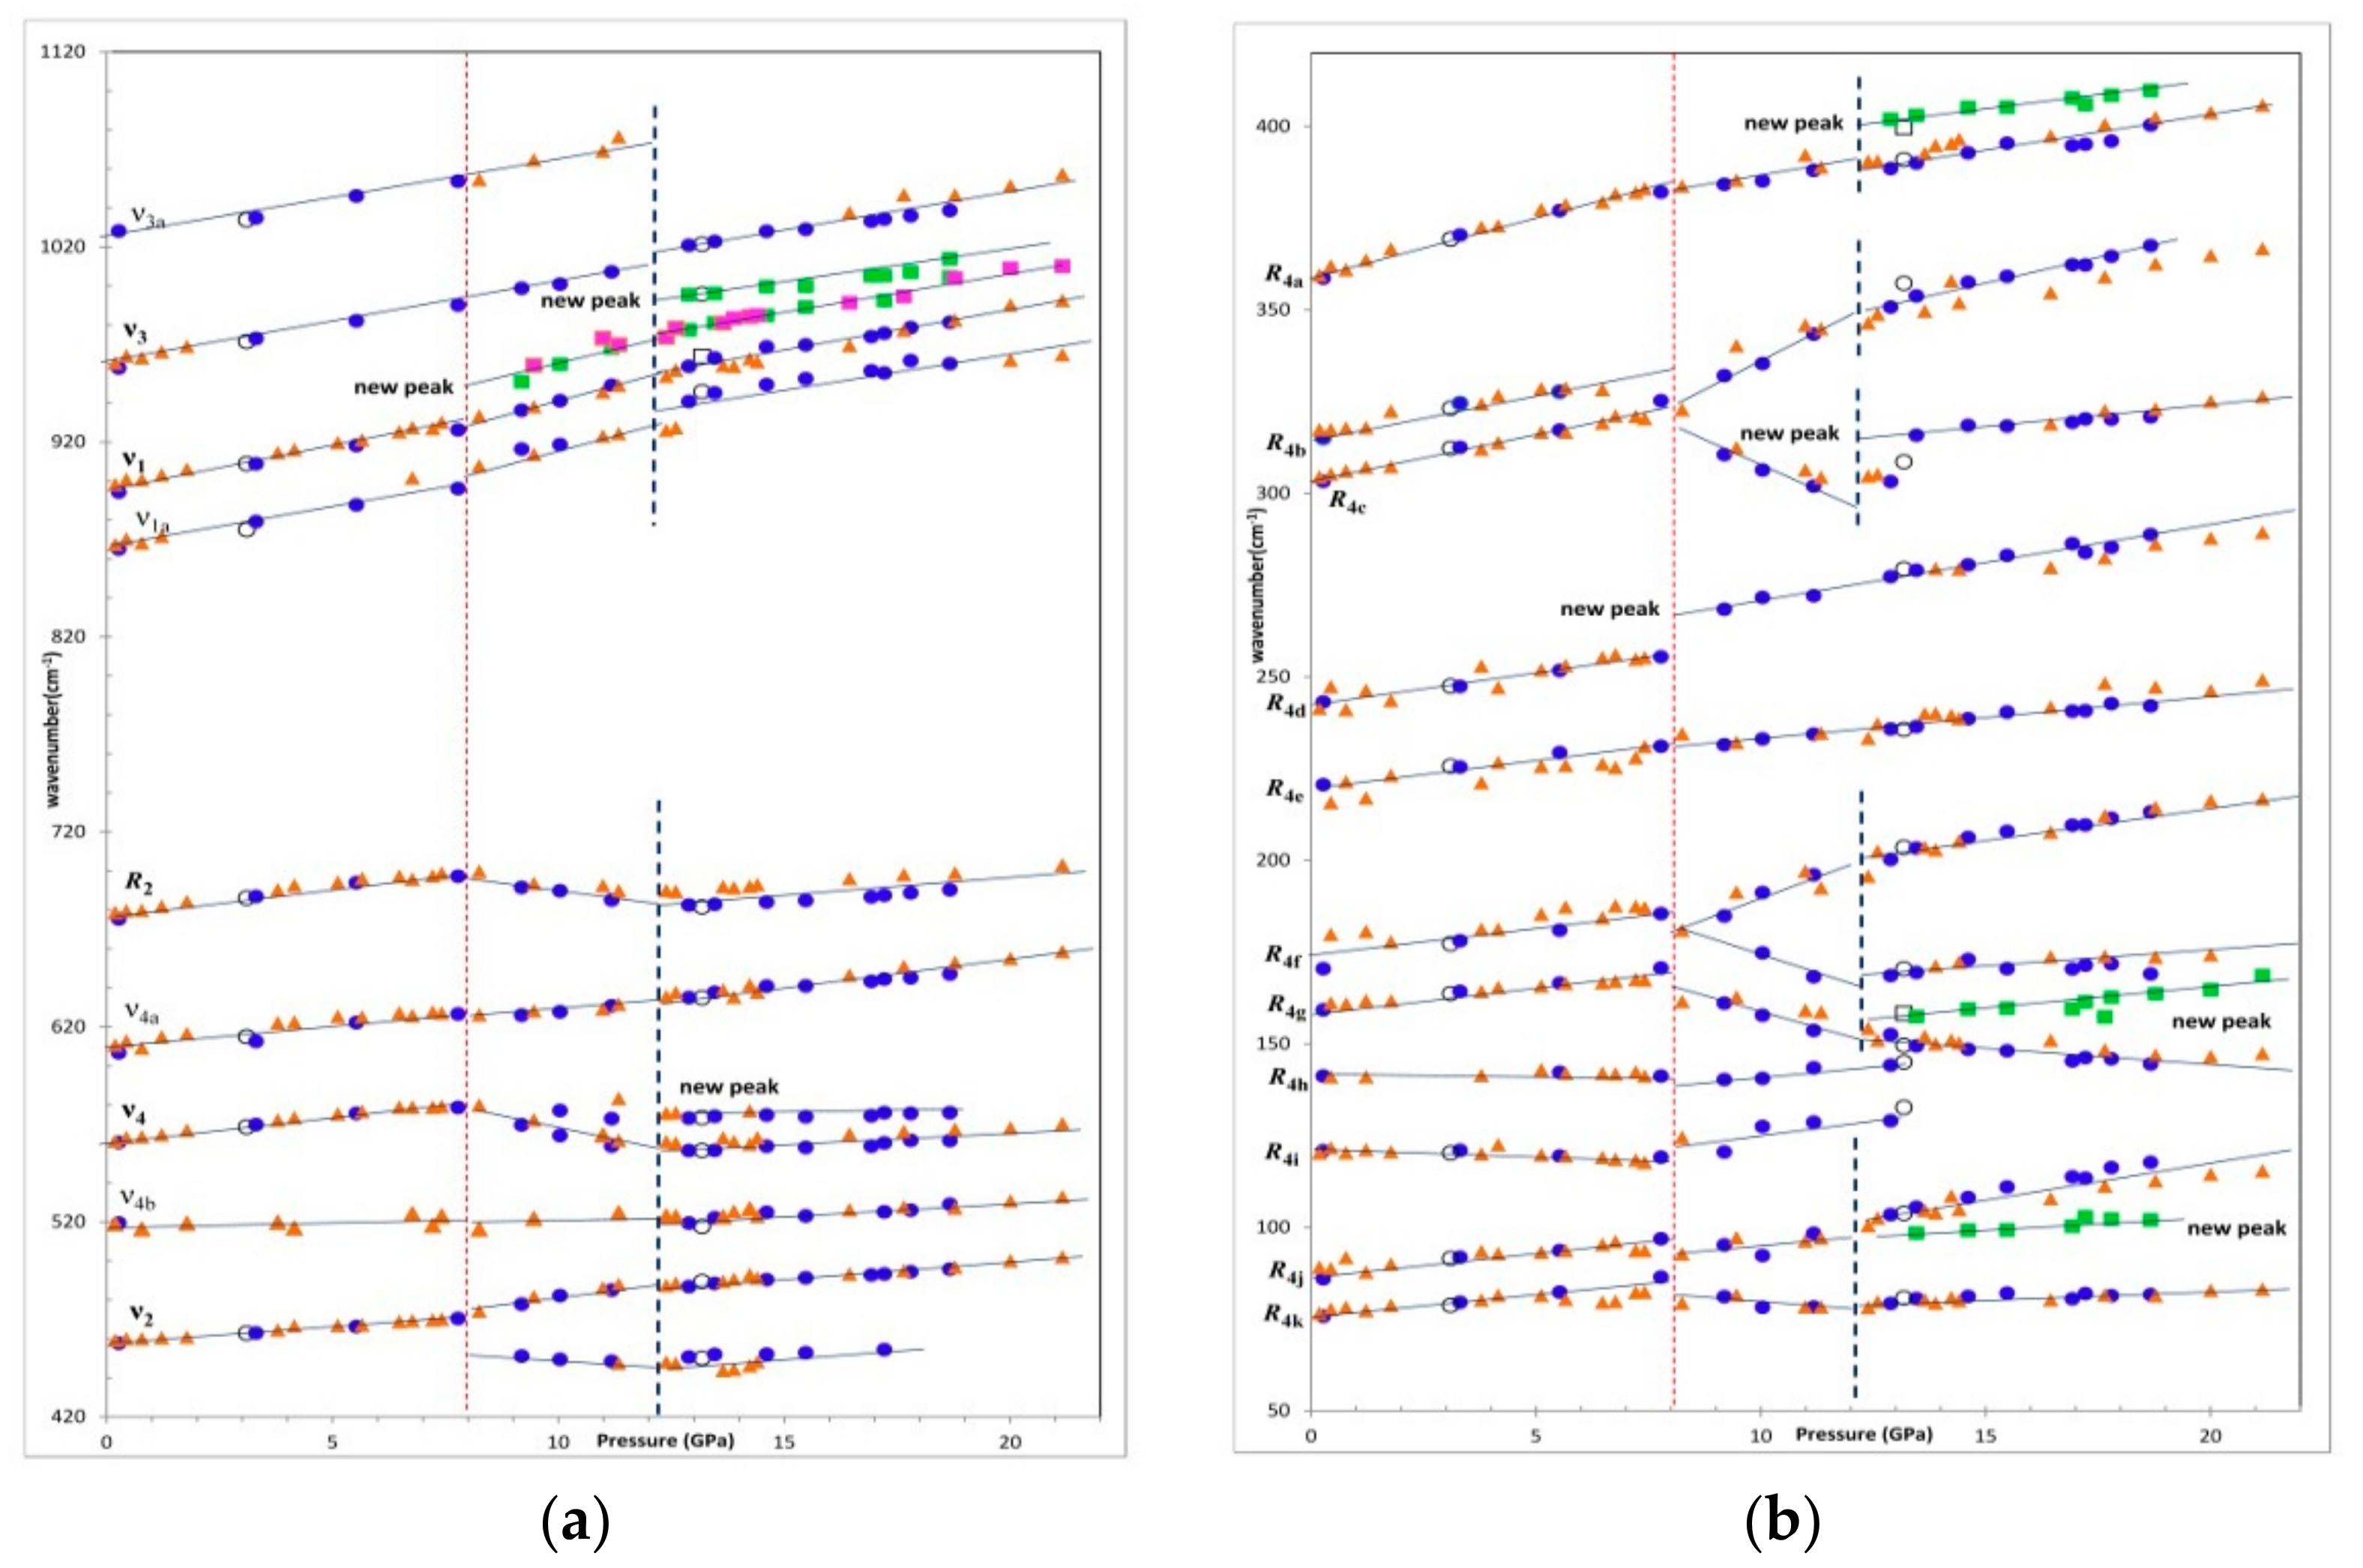
3.1. Raman Spectroscopy

The Raman spectra of scottyite are arbitrarily divided into four regions. Region 1 (ν1 and ν3 modes), between 800 and 1100 cm−1, contains bands attributed to the Si-O symmetric and antisymmetric stretching vibrations within the SiO4 tetrahedrons. Region 2, between 660 and 700 cm−1, includes bands resulting from the Si-Obr-Si (Obr: bridging O atom) bending vibrations within the Si2O7 tetrahedral dimers. Region 3 (ν2 and ν4 modes) ranges from 420 to 660 cm−1, and contains modes related to the O-Si-O symmetric and anti-symmetric bending vibrations within the SiO4 tetrahedrons. The bands in Region 4, below 420 cm−1, are mainly related to Cu–O interactions and lattice vibrational modes, as well as the rotational and translational modes of SiO4 tetrahedrons [2].
Table 1 shows the comparison of our results of Raman data of scottyite with the previous investigation at the room pressure. Some of the representative Raman spectra of scottyite were taken during the loading and unloading processes of the experiment in this study (Figure 1). The ν1 mode (895 cm−1) and ν3 mode (1016, 958 and 863 cm−1) in Region 1, Si-Obr-Si bending mode (675 cm−1) in Region 2, and ν2 mode (458 cm−1) and ν4 mode (608, 579 and 560 cm−1) in Region 3 are observed at the ambient conditions in this study. From Figure 1 and Figure 2a,b, the frequencies of most Raman modes are found to increase with increasing pressure, except peak R2, ν4, ν2, R4c, R4f, R4g and R4k between 8 and 12 GPa. The intensity of most of the peaks becomes weaker with increasing pressure while some Raman bands (such as R2, ν4 and ν2 mode) remain quite sharp at all pressures. It is found that the ν1 mode of scottyite becomes broader, and one distinct peak (new peak) is found on the right shoulder when the pressure exceeds 8 GPa, and an additional new peak was found above 12 GPa. The intensity of the new peak becomes stronger and shifts to a lower wavenumber with increasing pressure. The R2 mode of scottyite remains quite sharp at all pressures, but shifts to lower wavenumber with increasing pressure between 8 and 12 GPa. The ν3a mode of scottyite becomes weaker with increasing pressure between 8 and 12 GPa, and disappears above 12 GPa. We also found some new peaks on ν1, R4d modes between 8 and 12 GPa and ν1, ν4, R4a, R4c, R4j modes above 12 GPa.
The discontinuities of the linear trend on the /dP (Raman modes shift as function of pressure) are also shown in Table 2 and Table 3. All the modes of scottyite show discontinuity in the /dP slope at ~8 GPa, and some modes show additional discontinuity at 12 GPa. During the unloading process, all vibrational modes persist until 8 GPa where all modes shift back to the position as the loading process. Below 8 GPa, the decompression data are similar to those of the compression ones. There are seven peaks that show negative slop between 8 and 12 GPa (R2, ν4, ν2, R4c, R4f, R4g and R4k).
The discontinuity behaviors of each region are as the following: for Region 1(ν1 and ν3 modes), between 800 and 1100 cm−1, the slope of wavenumber vs. pressure (/dP) is from 3.51–4.29 cm−1/GPa to 2.99–5.59 cm−1/GPa. Some new peaks show the slope (/dP) from 2.68 to 5.24 cm−1/GPa. For Region 2, between 660 and 700 cm−1, the slope of wavenumber vs. pressure (/dP) is from 2.68 cm−1/GPa to 1.32 cm−1/GPa, but shows a negative trend between 8 and 12 GPa. For Region 3 (ν2 and ν4 modes), between 420 to 660 cm−1, the slope of wavenumber vs. pressure (/dP) is from 1.9–2.26 cm−1/GPa to 0.78–1.89 cm−1/GPa, and two peaks show a negative slope between 8 and 12 GPa. For Region 4, below 420 cm−1, the slope of wavenumber vs. pressure (/dP) is from 0.13–3.14 cm−1/GPa to −0.93–2.44 cm−1/GPa.

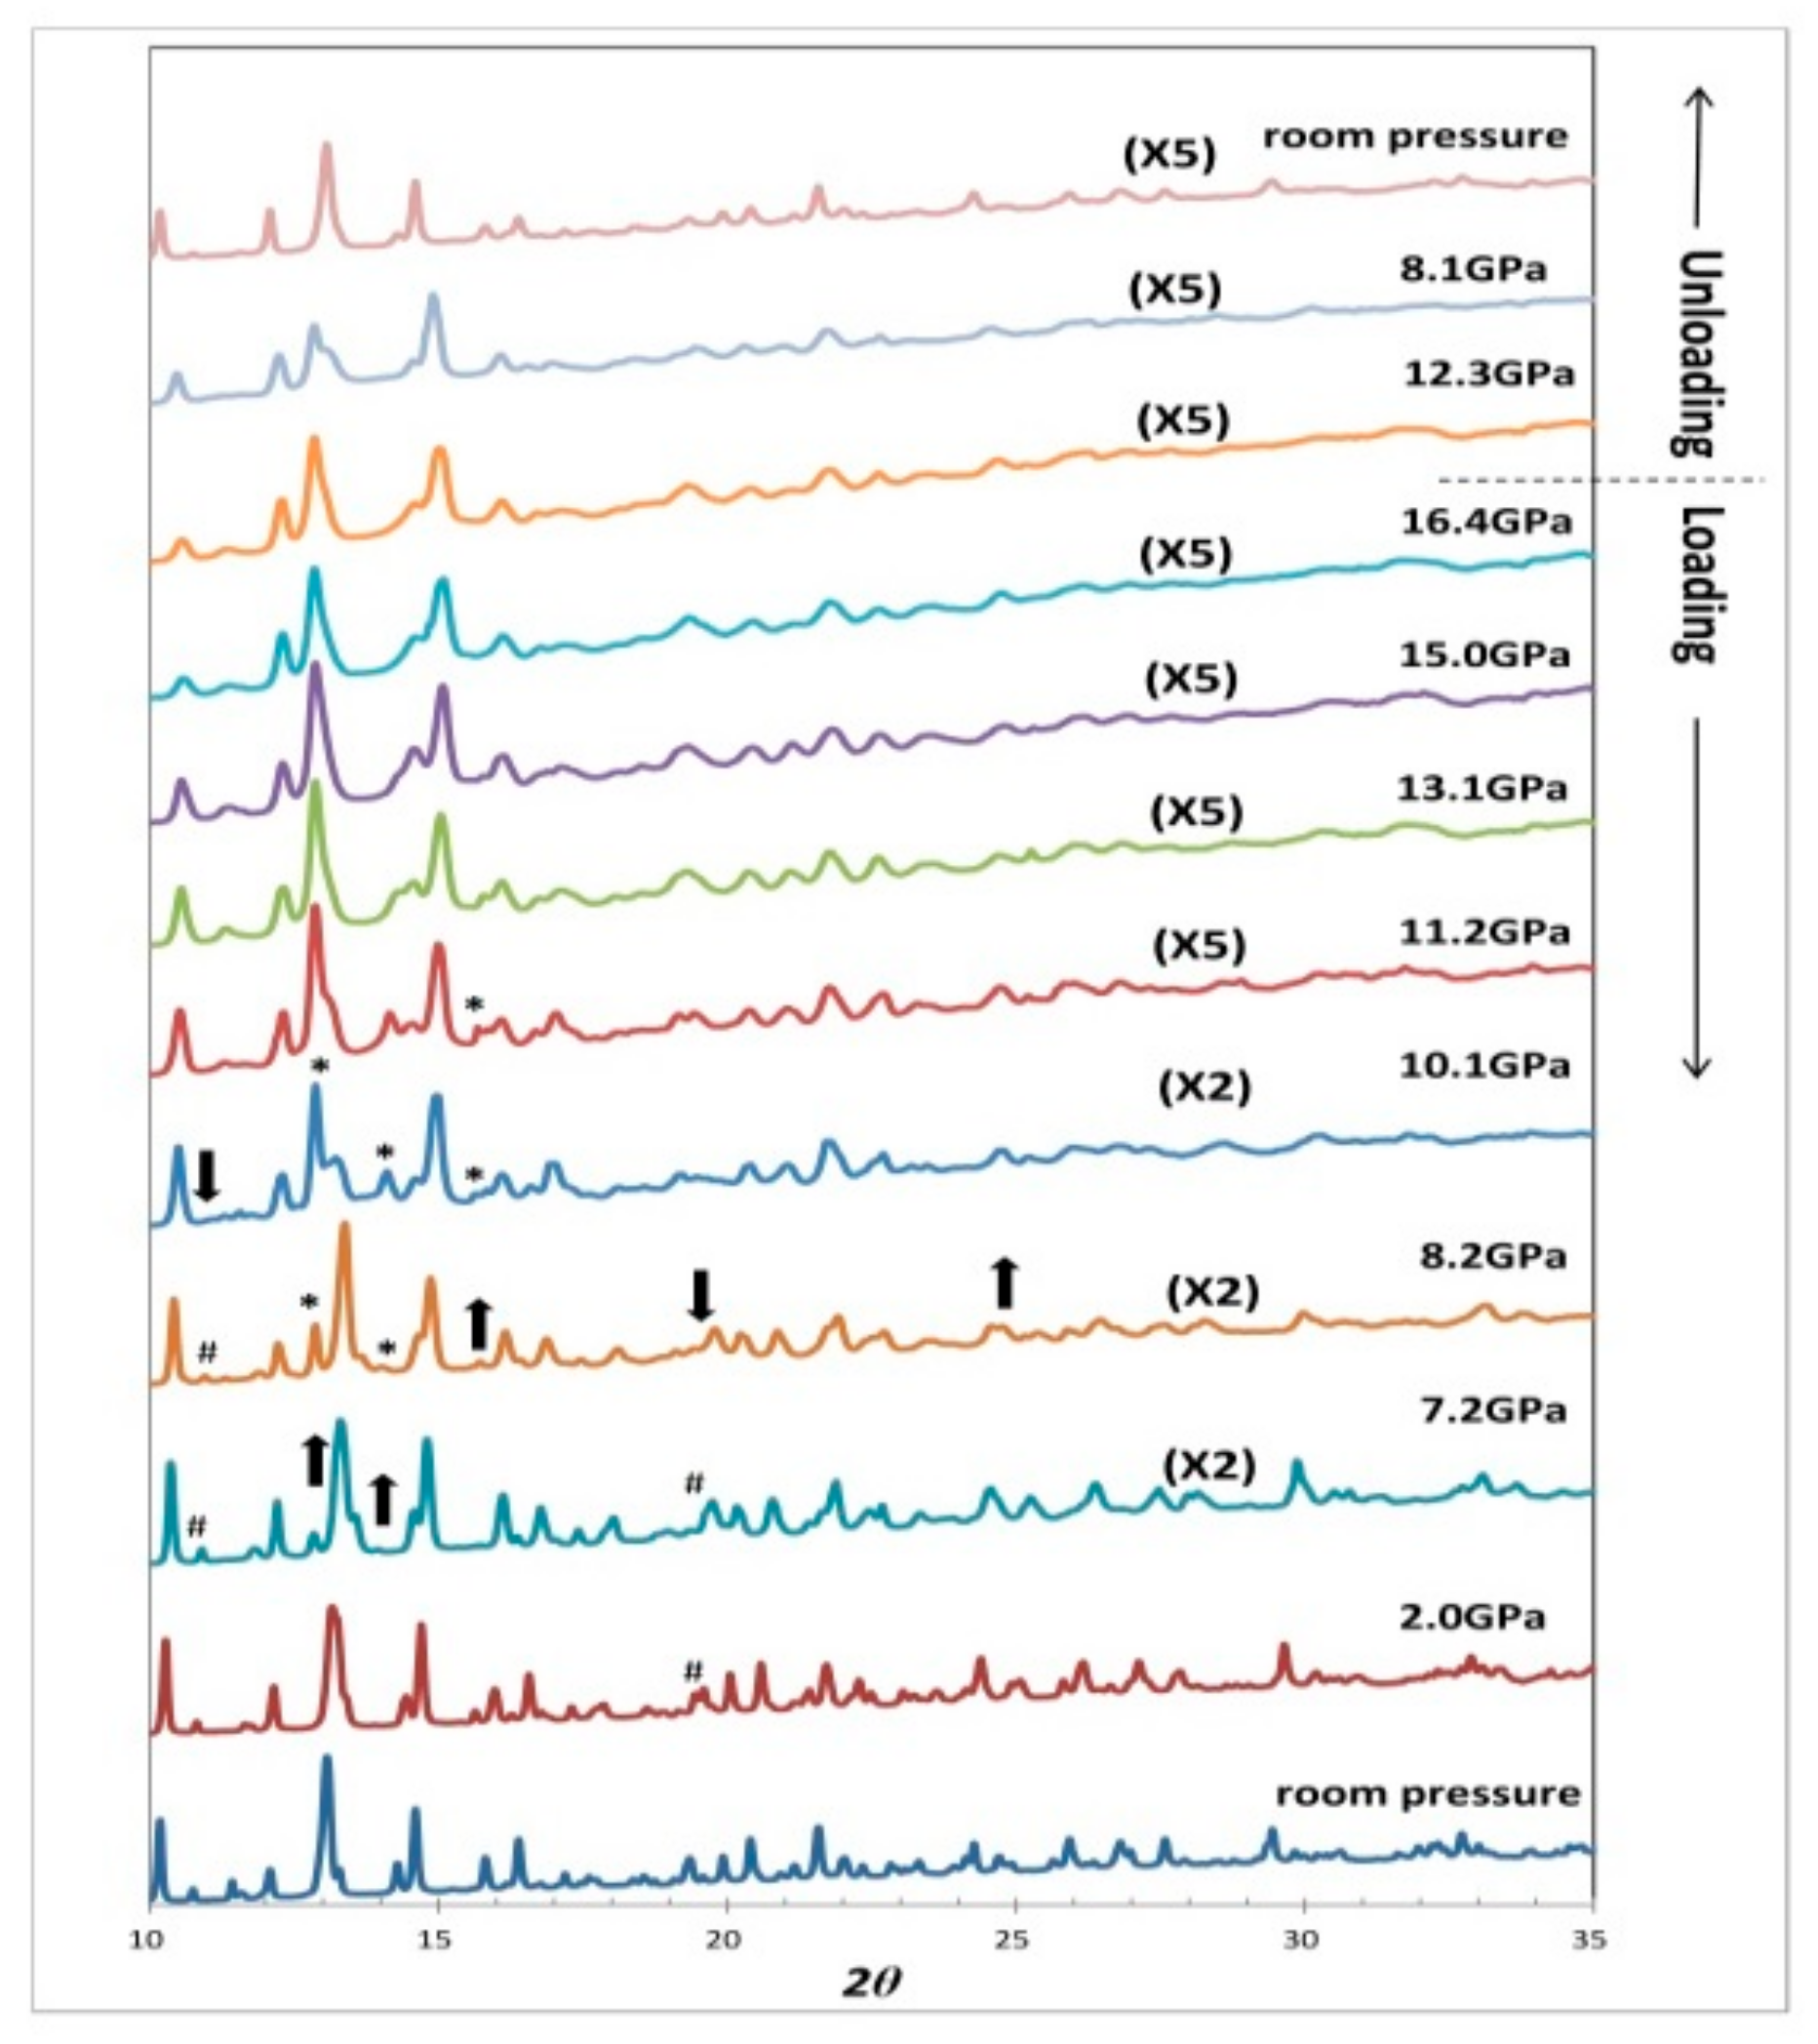
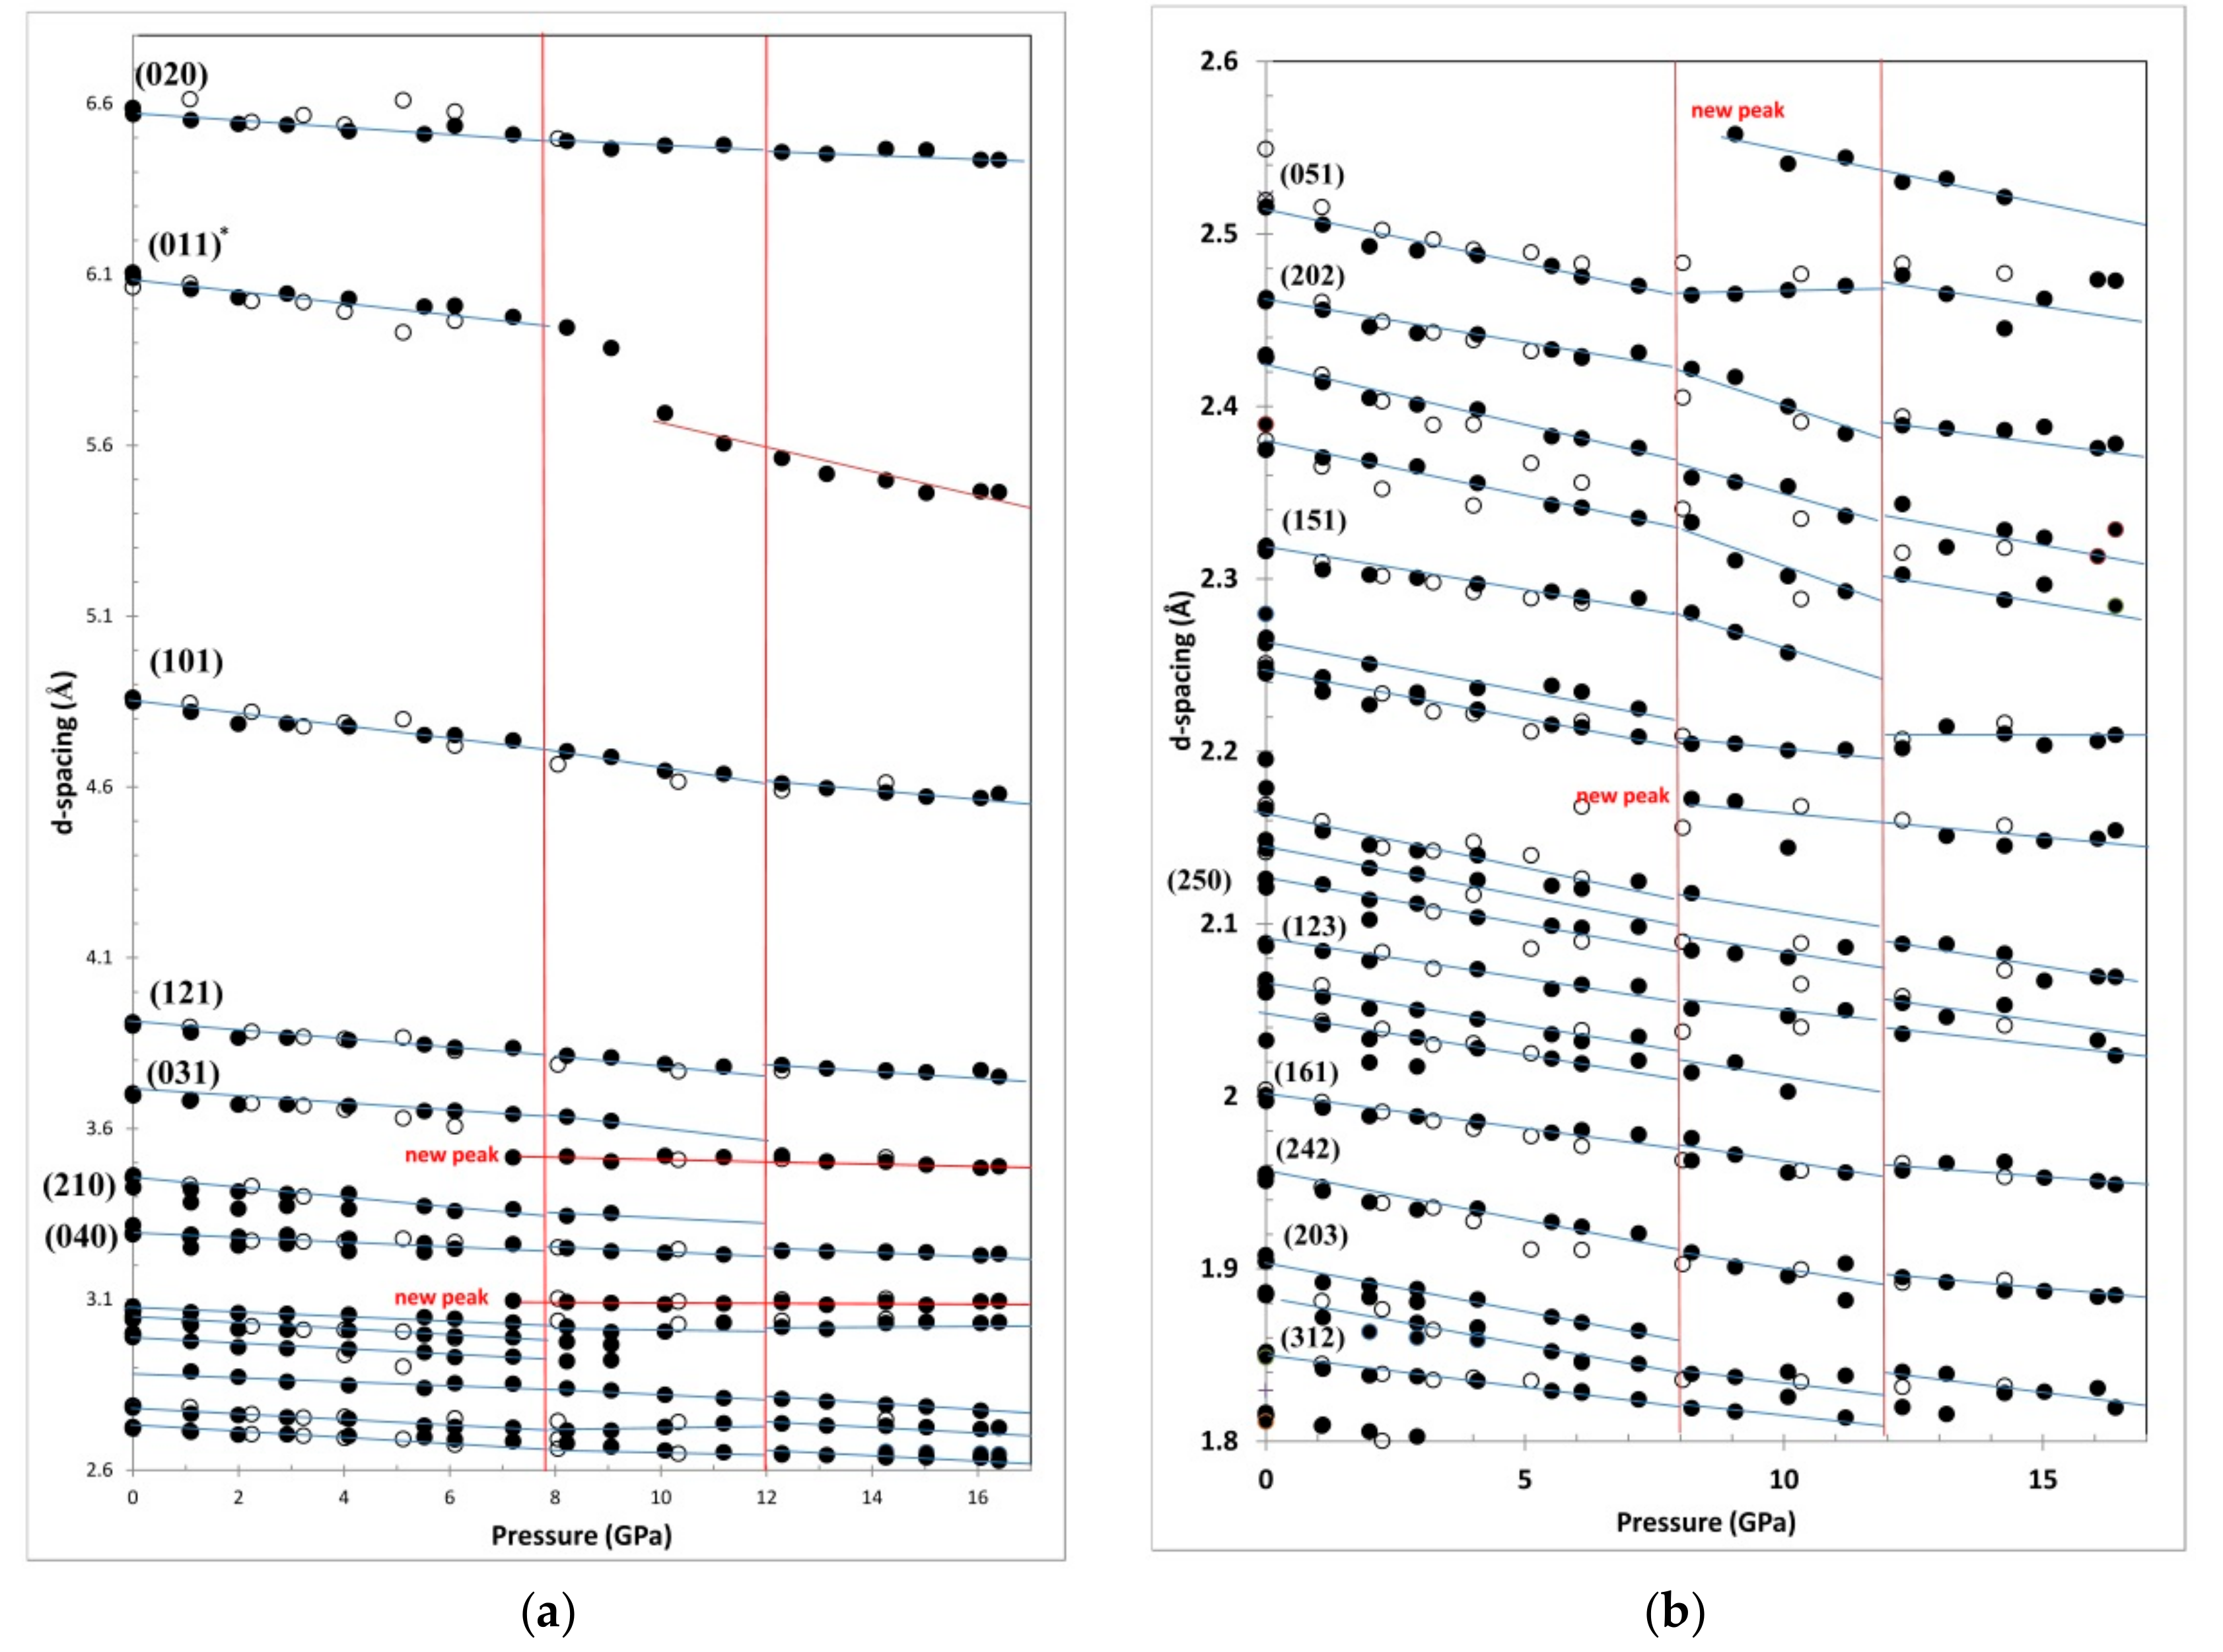
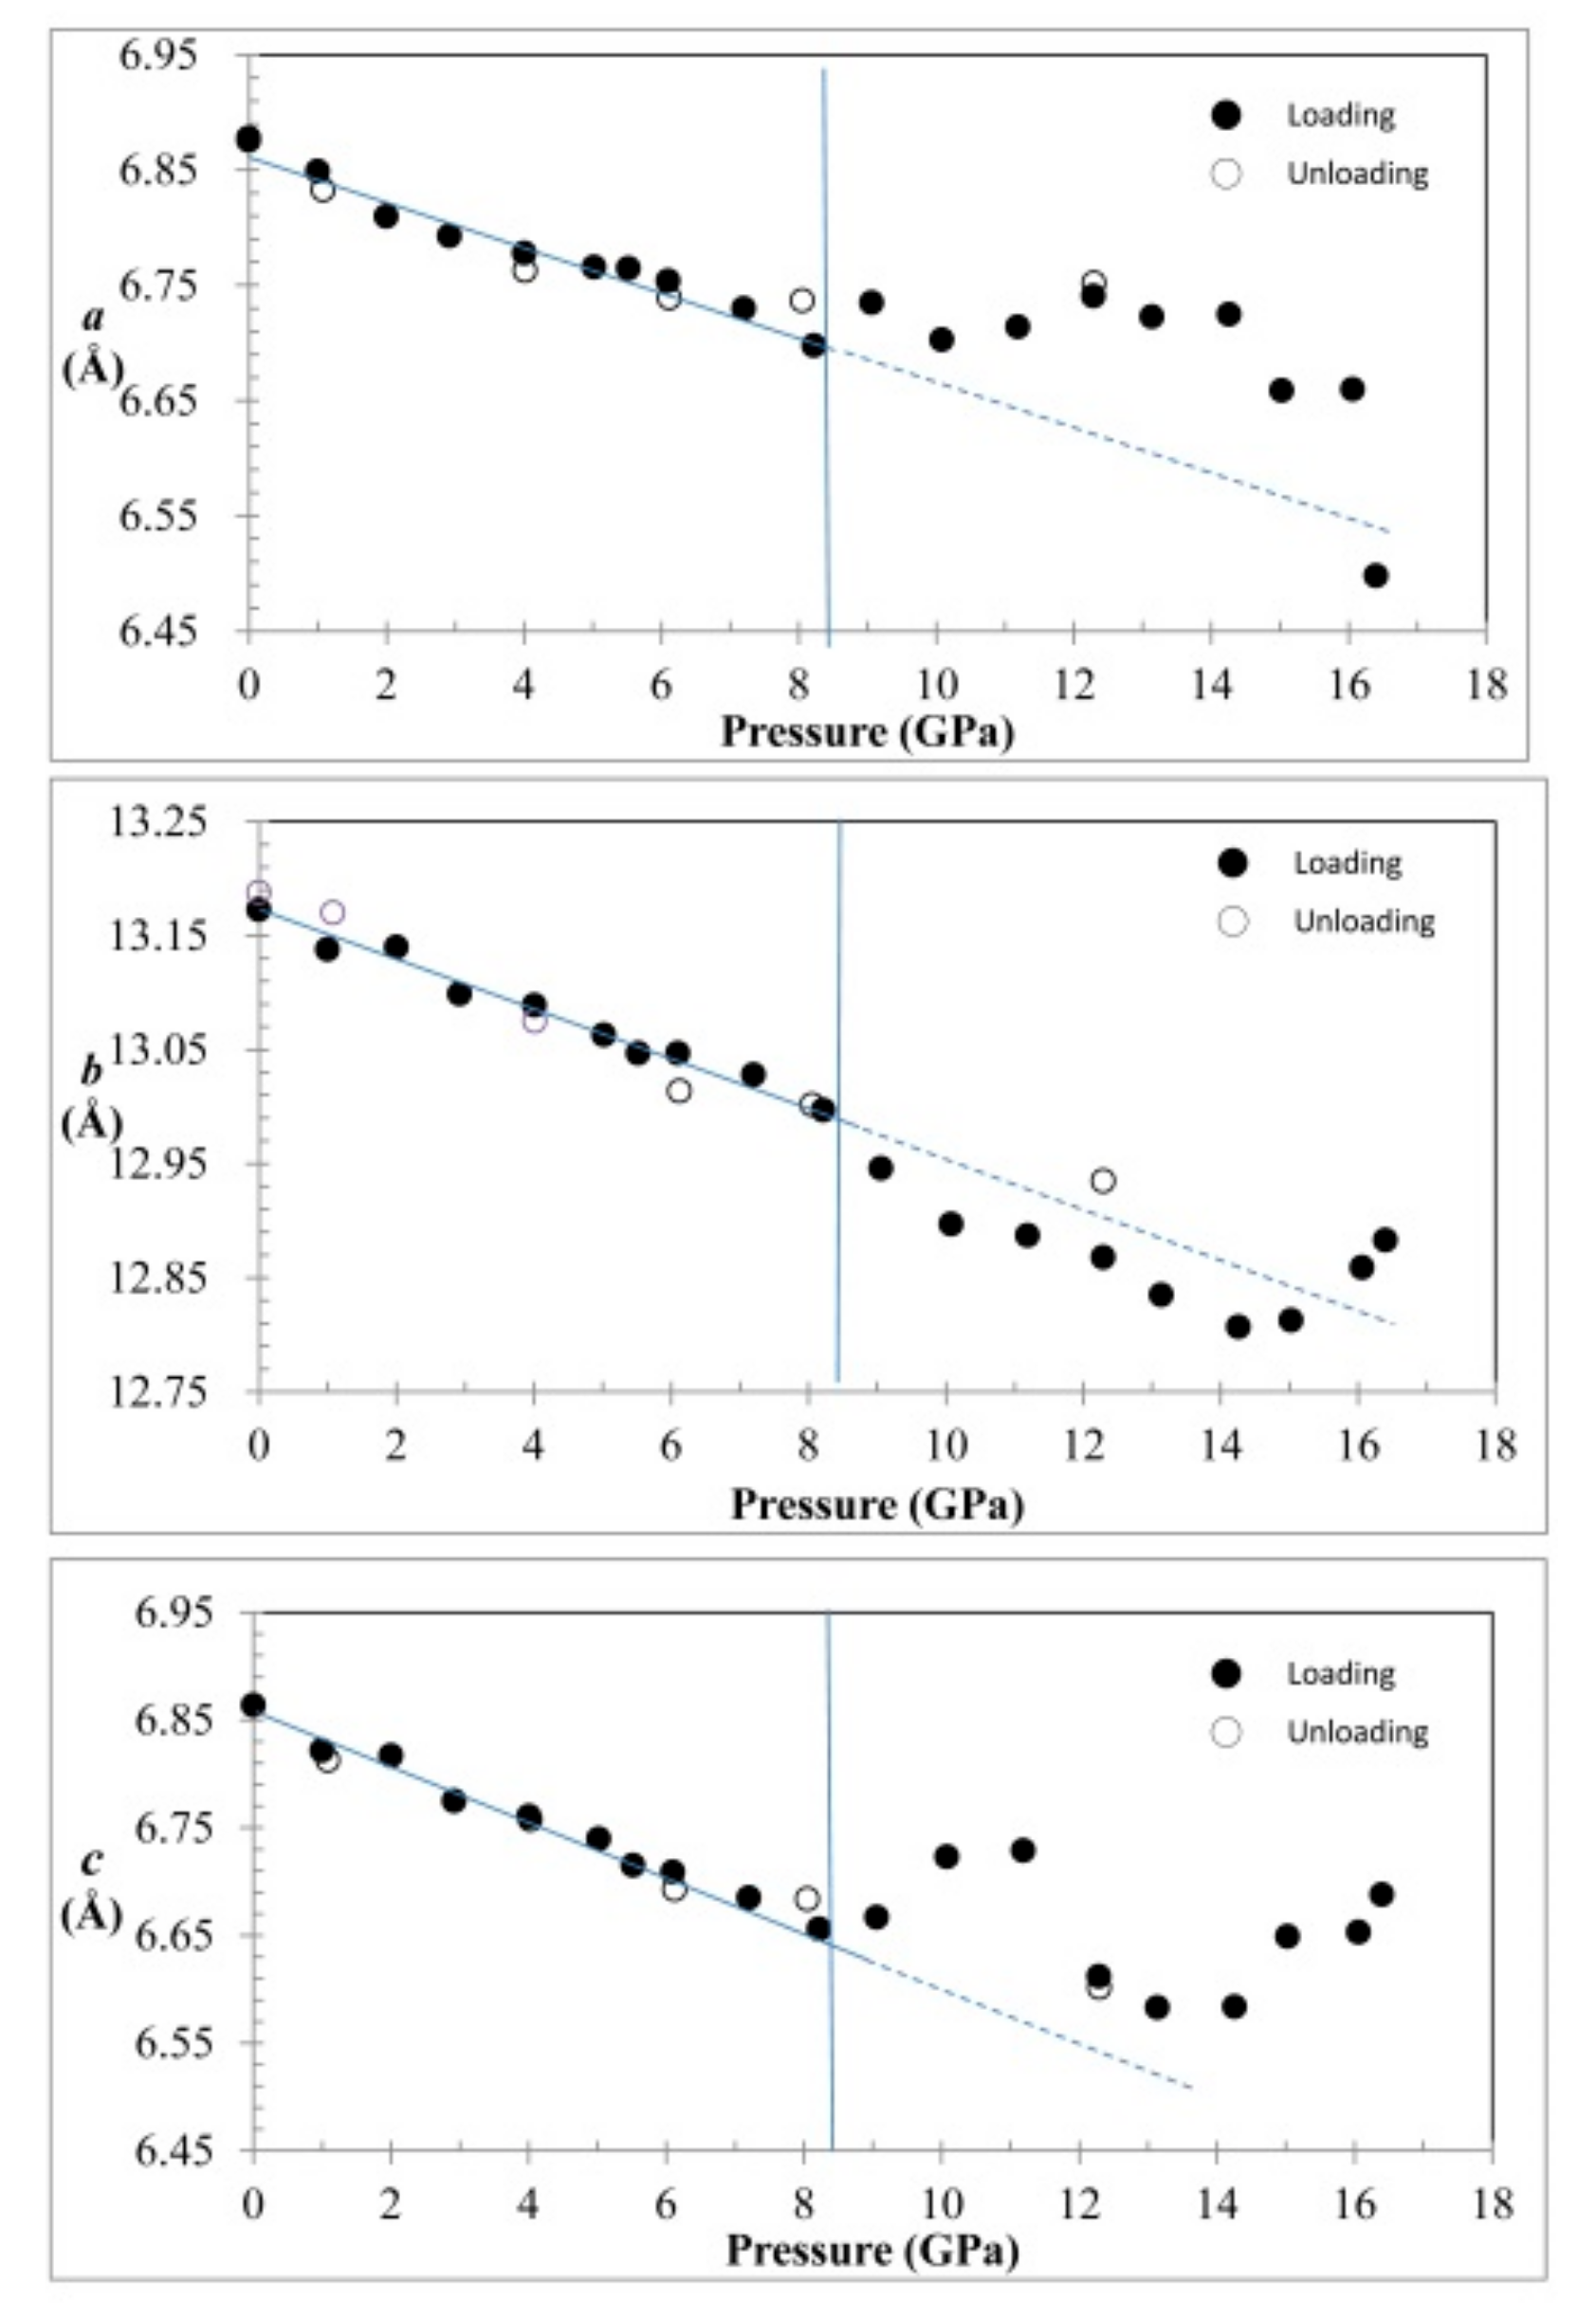
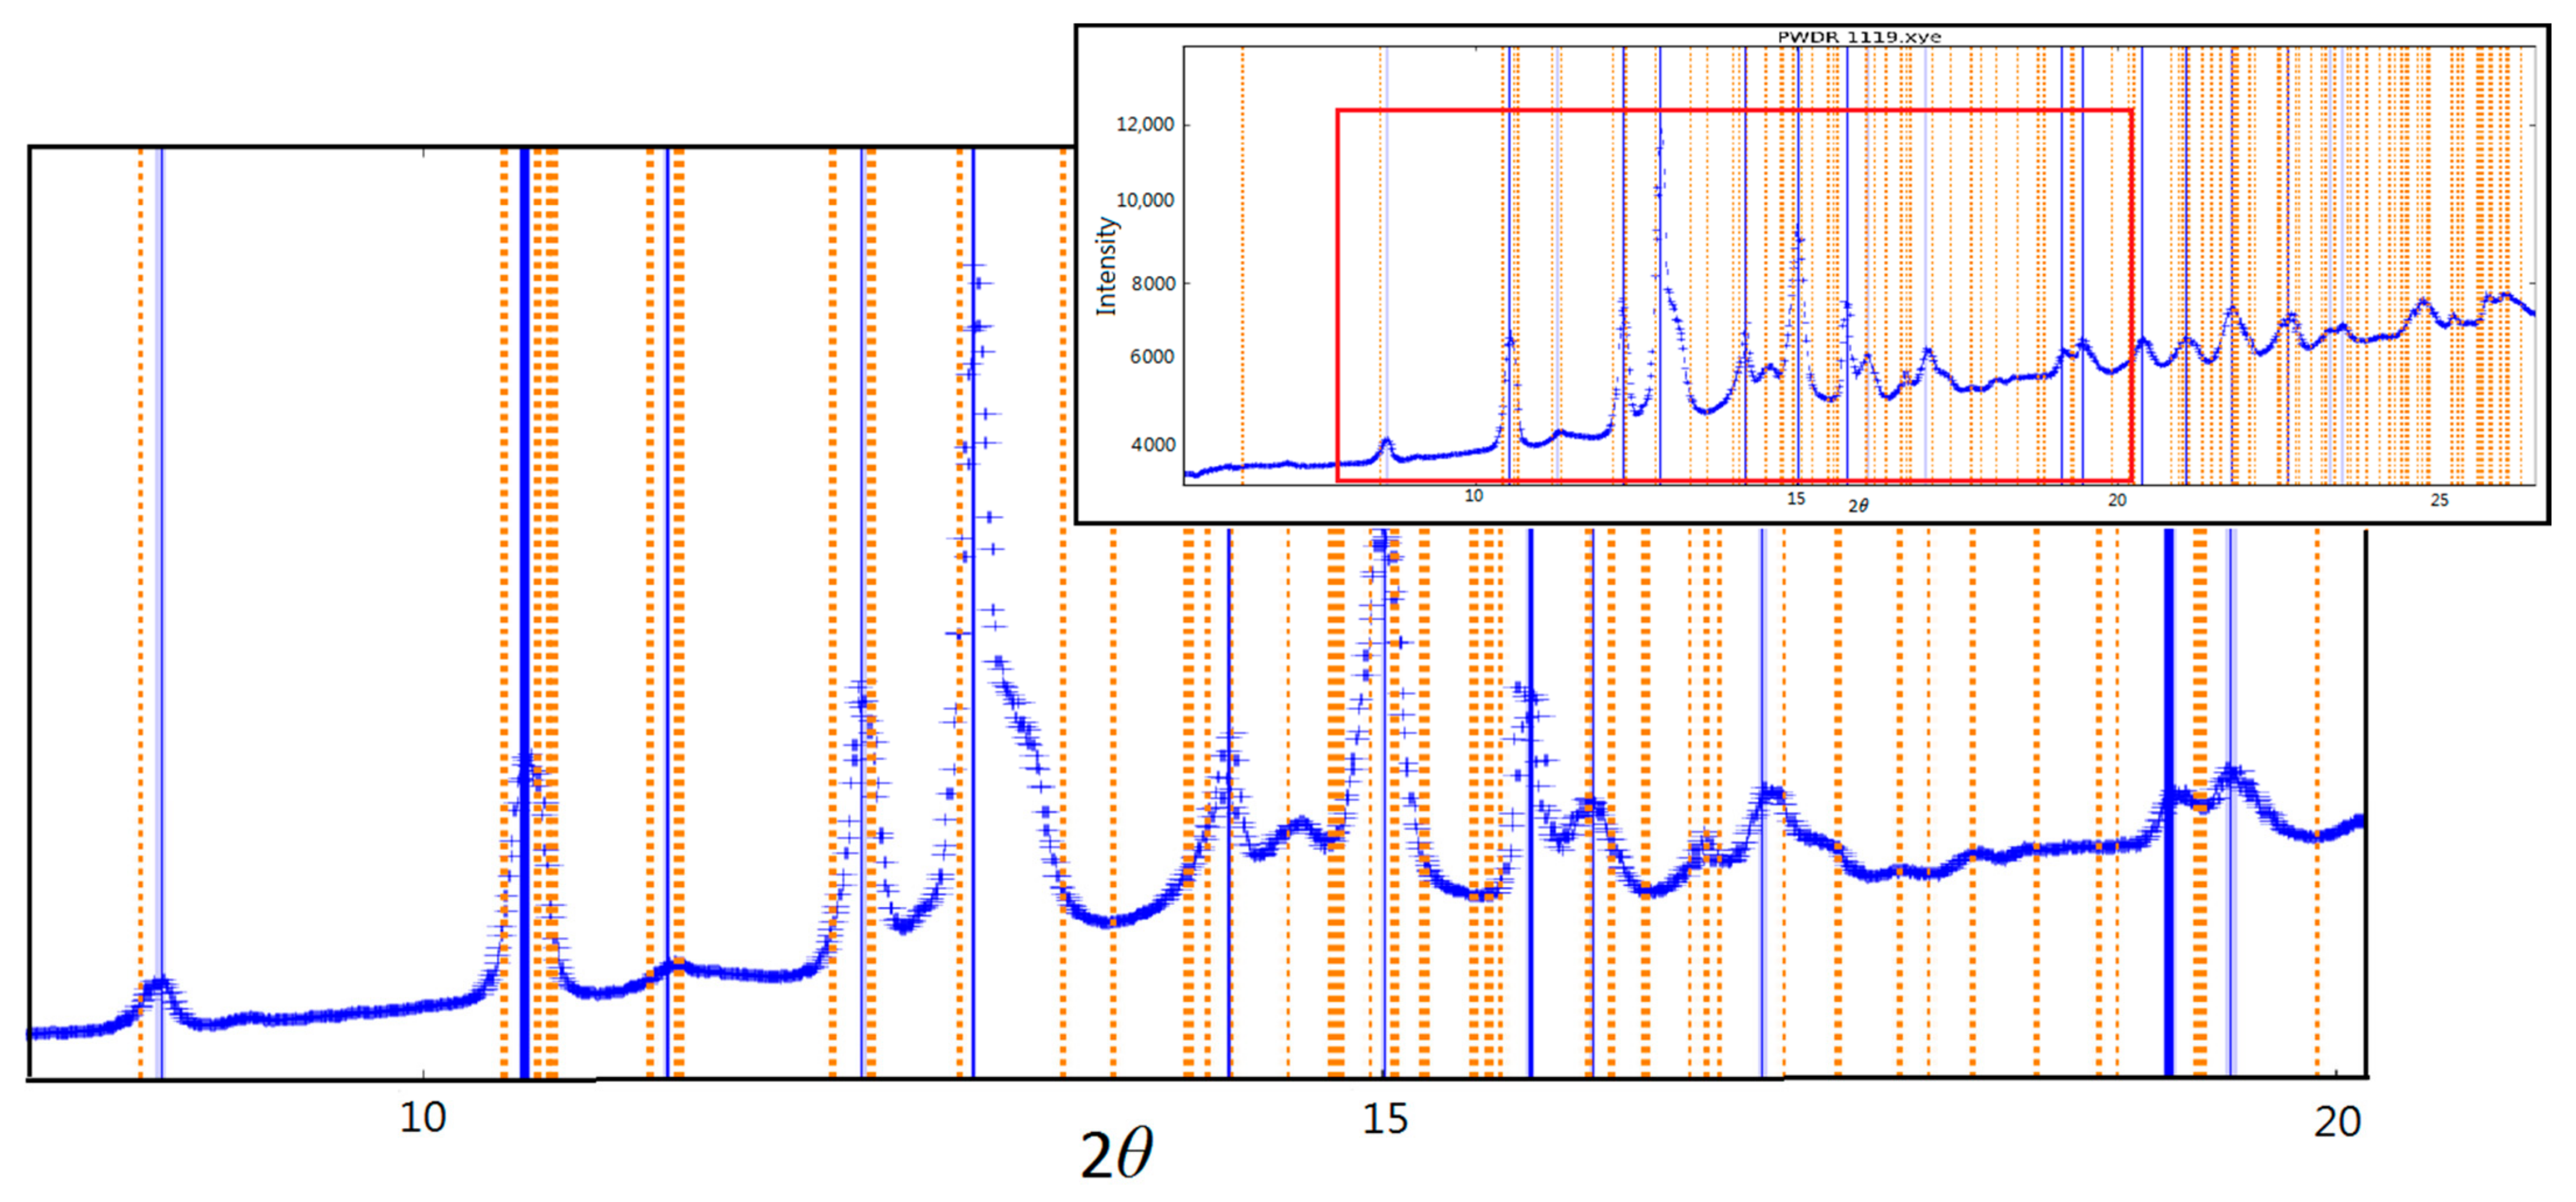
3.2. X-ray Diffraction Studies

A series of X-Ray Diffraction patterns are overlain to show the structural changes with pressure in scottyite in Figure 3. Several new peaks were observed above 8 GPa, which indicates the transformation of scottyite to high-pressure phase (Figure 3). The variations in d-spacings of the diffraction peaks as a function of pressure for scottyite are plotted in Figure 4. The calculated cell parameters, a, b and c, with the change in pressure are plotted in Figure 5, and tabulated in Table 4.
At first glance, the diffraction patterns of scottyite shown in Figure 3 do not seem to show a very significant change with pressure. However, closer examination of these patterns reveals some minor changes during the compression process. With an increase in pressure, we observed that four new diffraction peaks show up near 8 GPa. Figure 3 and Figure 4a,b display four new peaks in the intervals between (031) and (210); (040) and (102); near (051) and (250) diffractive planes, the d-spacing of which is near 3.5, 3.1, 2.6 and 2.2 Å, respectively, above 8 GPa. Some peaks either disappear or were merged with other peaks when the pressure was over 10 GPa, such as (031), (210), (201), (022), (151) and (321) diffractive planes. The appearance of more diffraction peaks implies that the high-pressure phase of scottyite has a lower symmetry.
The variations in a/a0, b/b0, c/c0 and molar volume with pressure for scottyite are listed in Table 4. The compression data are fitted to the Birch–Murnaghan equation (Equation (1)).
P   = 3 2 K o Vo / V 7 / 3 Vo / V 5 / 3 1 3 4 4 K o Vo / V 2 / 3 1
We obtain a bulk modulus (Ko) value of scottyite as 102 ± 5 GPa (assuming that Ko′ is 4) (Figure 6).

4. Discussion

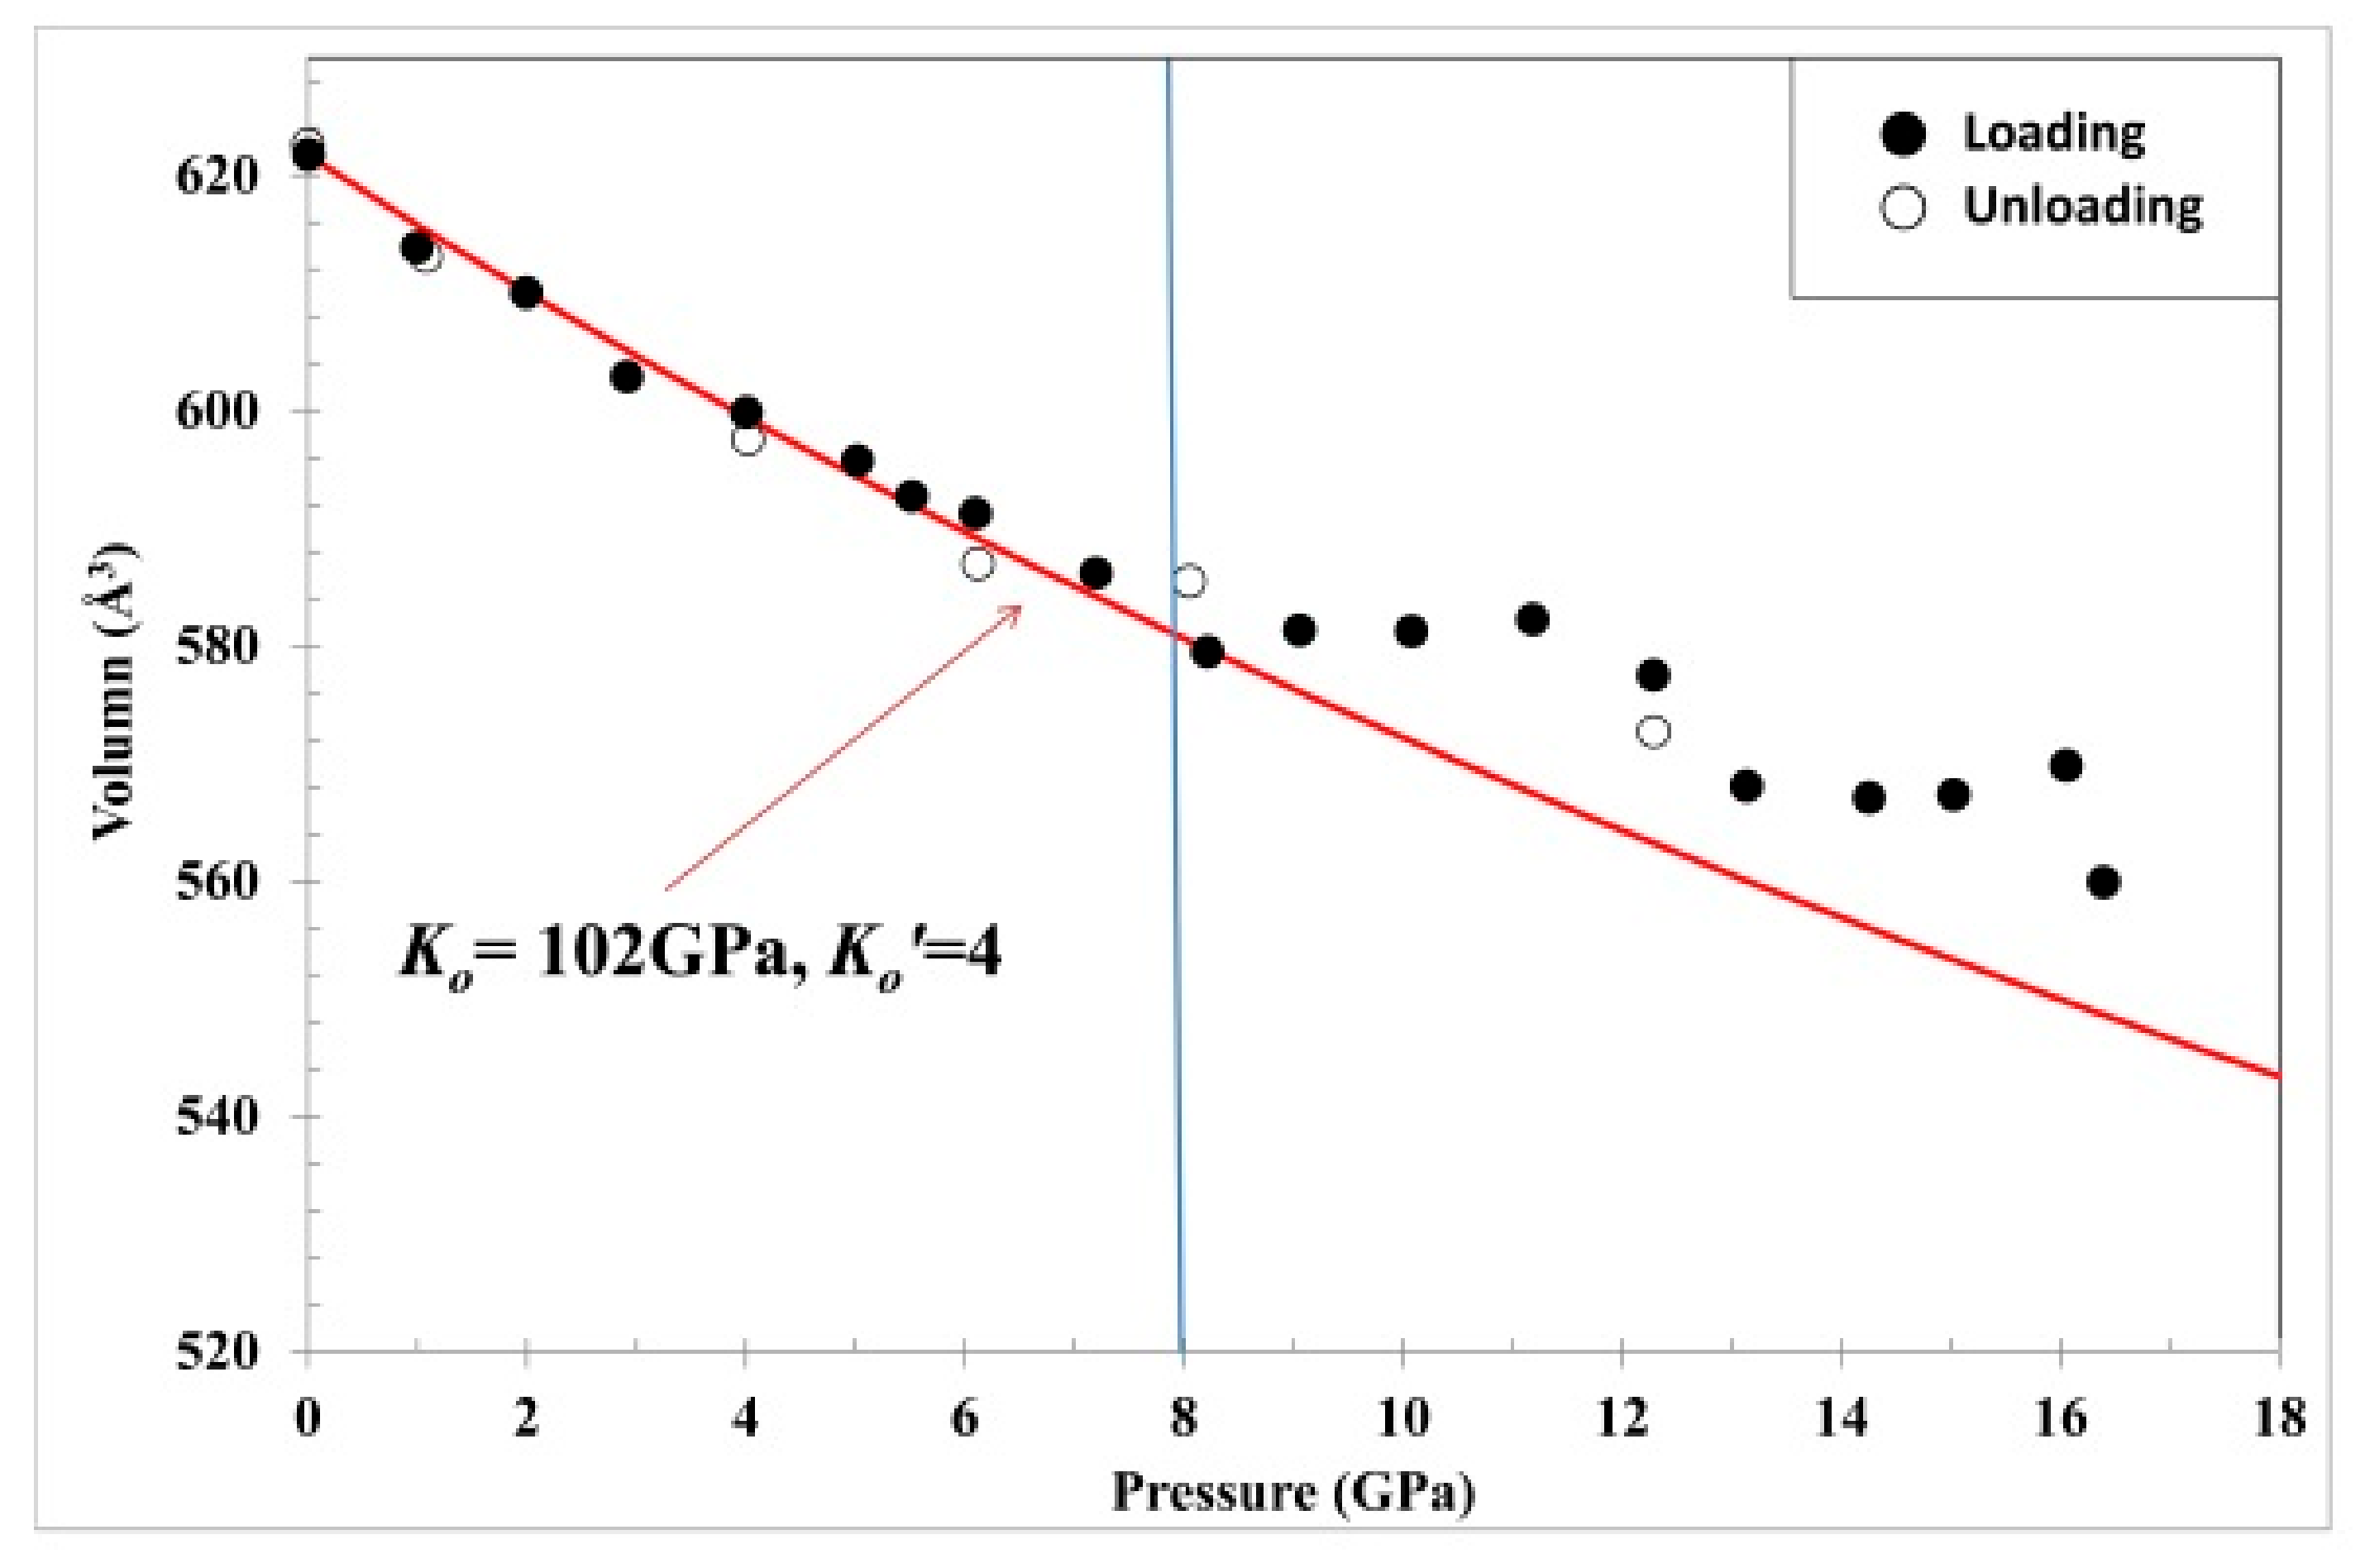
4.1. Anisotropic Compressibility

We found that the c-axis was the most compressible axis in scottyite, the b-axis was the least, and the a-axis was similar to the c-axis on the compression (Figure 5 and Table 4). The scottyite structure is based on a tetrahedral framework consisting of SiO4 and CuO4 tetrahedrons. The CuO4 tetrahedrons are considerably flattened, and they share corners to form chains parallel to the c-axis. The chains are interlinked by the Si2O7 dimers oriented parallel to the b-axis. [2,6,7] The largest bond distance of M-O was Ba-O (2.825 Å) where Ba2+ cations are in the framework channels. The SiO4 is a rigid body and is linked to the Si2O7 dimer, so it is hard to compress. However, CuO4 tetrahedron layers are parallel to the ac-plane, thus making the a-axis and c-axis relatively easy to compress.

4.2. The Pressure of the Phase Transition

The four new peaks in the diffraction patterns and the discontinuities in the slopes of d-spacing versus pressure plot all occurred at approximately 7–8 GPa, which is quite distinct for scottyite. Figure 5 shows the variations in the a-, b- and c-parameters of scottyite with pressure, assuming that the scottyite structure remains during the loading and unloading processes. From Figure 5, we observed a kink in their compression curves at about 8 GPa in all three crystallographic axes. Above 9 GPa, the lattice parameters behave in a less compressible way, and show larger values than those extrapolated from the low pressures, which is not reasonable. The offset of the lattice parameters on the a-axes and c-axes direction is similar. All the lattice parameters are reversible under the unloading process. The deviation from the normal compression behavior in scottyite is more clearly seen in Figure 6. Below 8 GPa, the compression data can be fitted to a bulk modulus of 102 GPa with Ko′ = 4 by the Birch–Murnaghan equation (Equation (1)), but the data show a large deviation from the normal compression curve above 8 GPa. Some XRD peaks disappeared or merged with other peaks when the pressure exceeded 10 GPa.
In addition, we also found the discontinuities of each Raman mode in the /dP plot at near 8 GPa, and some Raman modes showed negative slop of dν/dP between 8 and 12 GPa. Most of the trend with the negative slop of dν/dP belonged to R2 (Si-O-Si bending mode), ν4 (SiO4 anti-symmetric bending) and ν2 (SiO4 symmetric bending) which deserves further investigation in order to understand the mechanism of the phase transition. We conclude that scottyite has encountered a structural phase transition at 8 GPa and the transition is reversible.

4.3. Post-Scottyite Structure Analysis

Preliminary high-pressure Raman and X-ray investigation provided evidence that a reversible phase transition takes place at 8 GPa in scottyite. We have tried to analyze the post-scottyite structure with GSAS-II program [13], and the most suitable candidate for the high pressure phase is maybe the monoclinic system of the Bravais lattice C2/m, with unit-cell parameters of a = 5.67 Å, b = 5.12 Å, c = 18.58 Å, β = 91.64° and molar volume of V = 539.3 Å3 at 11.19 GPa. The fitting pattern is shown in Figure 7. However, since there are still many peaks that cannot be matched, the structure that we proposed above may need further experimental data and analysis to justify it.
A comparison of crystallographic data of BaM2Si2O7-type (M = Be, Mg, Mn, Fe, Co, Zn, and Cu) minerals [2,14,15,16,17,18] shows that the structure with the monoclinic system is M = Mg, Mn, Fe, Co, and Zn. There is a strong resemblance among them in the structure (Table 5). The radius of Cu2+ is similar to Mg2+, Co2+ and Zn2+, so we speculate that the post-scottyite phase may be similar among these compounds. However, this still needs to be verified by a single-crystal X-ray diffraction experiment.
From the Table 5, we know that the angle of Si-O-Si in the monoclinic BaM2Si2O7-type structure is between 124.5° and 127.2°, which is smaller than in the scottyite structure (134.3° [2]). In other words, the compression deformation of the scottyite crystal maybe mainly occurs in Si-O-Si linkage formation, and thus results in CuO4 tetrahedra layer were compressed and adjusted. This then makes the a-axis and c-axis directions the most to be compressed.
The compression behavior of scottyite may be applied to silicates of similar structure, which is of significant meaning in the understanding of bonding characteristics of sorosilicates. Despite the fact that the structure of the post-scottyite phase has not been solved in this study, it is feasible that detailed single crystal XRD experiments in the future will help to resolve it.

Author Contributions

Conceptualization, P.-L.L.; Data curation, P.-L.L. and E.H.; Formal analysis, P.-L.L. and J.K.; Funding acquisition, P.-L.L. and J.K.; Project administration, P.-L.L.; Writing—original draft, P.-L.L. and E.H.; Writing—review & editing, P.-L.L., E. Huang and J.K. All authors have read and agreed to the published version of the manuscript.

Funding

This project was supported by the Ministry of Science and Technology (MOST) (MOST-106-2116-M-415-002). The installation of Raman spectroscope was funded by the Ministry of Science and Technology, grant numbers MOST 105-2116-M-006-019 to J.K., and partially supported by the grants from the “Core Facility Center”, National Cheng Kung University, and “Geochemical Precious Instrument Platform Project: Southern Branch Ministry of Science.

Data Availability Statement

Not applicable.

Acknowledgments

We wish to thank J. Kung’s and Yongjae lee’s laboratories (Yonsei University, South Korea) for their technical support in this study during the experiments at Department of Earth Sciences, National Cheng Kung University, ROC and the Pohang Accelerator Laboratory, South Korea, respectively. Our thanks are also due to Bob Downs and Hexiong Yang for information regarding the origin of scottyite specimens (RRUFF Project, University of Arizona).

Conflicts of Interest

The authors declare no conflict of interest. The funders had no role in the design of the study; in the collection, analyses, or interpretation of data; in the writing of the manuscript, or in the decision to publish the results.

References

  1. Durben, D.J.; Mcmillan, P.F.; Wolf, G.H. Raman study of the high-pressure behavior of forsterite (Mg2SiO4) crystal and glass. Am. Mineral. 1993, 78, 1143–1148. [Google Scholar]
  2. Yang, H.; Downs, R.T.; Evans, S.H.; Pinch, W.W. Scottyite, the natural analog of synthetic BaCu2Si2O7, a new mineral from the Wessels mine, Kalahari Manganese Fields, South Africa. Am. Mineral. 2013, 98, 478–484. [Google Scholar] [CrossRef]
  3. Hentschel, G. Die Lavaströme der Graulai: Eine neue Fundstelle in der Westeifel. Lapis 1993, 12, 11–23. (In German) [Google Scholar]
  4. Blass, G.; Graf, H.-W.; Kolitsch, U.; Sebold, D. The new finds from the volcanic Eifel (II). Miner. Welt 2009, 20, 38–49. (In German) [Google Scholar]
  5. Blass, G.; Schüller, W. “Unglaubliche” Kupfermineralien aus der Vulkaneifel: Auf’m Kopp bei Neroth. Lapis 2011, 36, 21–28. (In German) [Google Scholar]
  6. Janczak, J.; Kubiak, R.; Glowiak, T. Structure of barium copper pyrosilicate at 300 K. Acta Crystallogr. 1990, C46, 1383–1385. [Google Scholar] [CrossRef]
  7. Yamada, T.; Hiroi, Z.; Takano, M. Spin-1/2 quantum antiferromagnetic chains with tunable super exchange interactions found in BaCu2(Si1-xGex)2O7. J. Solid State Chem. 2001, 156, 101–109. [Google Scholar] [CrossRef]
  8. Yamada, T.; Takano, M.; Hiroi, Z. Spin-1/2 quantum antiferromagnetic chains with adjustable super exchange interactions found in BaCu2(Si1-xGex)2O7. J. Alloys Compd. 2001, 317–318, 171–176. [Google Scholar] [CrossRef]
  9. Shapenkov, S.V.; Zolotarev, A.A., Jr.; Zhitova, E.S.; Krivovichev, S.V.; Krzhizhanovskaya, M.G. High-temperature behavior of synthetic analogues of scottyite BaCu2Si2O7 and colinowensite BaCuSi2O6. Zap. RMO 2017, 146, 125–134. [Google Scholar]
  10. Mao, H.K.; Xu, J.; Bell, P.M. Calibration of the ruby pressure gauge to 800 kbar under quasi-hydrostatic conditions. J. Geophys. Res. 1986, 91, 4673–4676. [Google Scholar] [CrossRef]
  11. Hammersley, A.P.; Svensson, S.O.; Hanfland, M.; Fitch, A.N.; Häusermann, D. Two-Dimensional Detector Software: From Real Detector to Idealised Image or Two-Theta Scan. High Press. Res. 1996, 14, 235–248. [Google Scholar] [CrossRef]
  12. Novak, G.A.; Colville, A.A. A practical interactive least-squares cell-parameter program using an electronic spreadsheet and a personal computer. Am. Mineral. 1989, 74, 488–490. [Google Scholar]
  13. Toby, B.H.; Von Dreele, R.B. GSAS-II: The genesis of a modern open-source all purpose crystallography software package. J. Appl. Crystallogr. 2013, 46, 544–549. [Google Scholar] [CrossRef]
  14. Cannillo, E.; Mazzi, F.; Rossi, G. Crystal structure of andremeyerite, BaFe(Fe,Mn,Mg)Si2O7. Am. Mineral. 1988, 73, 608–612. [Google Scholar]
  15. Adams, R.D.; Layland, R. Syntheses, structural analyses, and unusual magnetic properties of Ba2CoSi2O7 and BaCo2Si2O7. Inorg. Chem. 1996, 35, 3492–3497. [Google Scholar] [CrossRef]
  16. Park, C.-H.; Choi, Y.-N. Crystal structure of BaMg2Si2O7 and Eu2+ luminescence. J. Solid State Chem. 2009, 182, 1884–1888. [Google Scholar] [CrossRef]
  17. Lu, G.X.; Yang, L.Q.; Lin, J.H. One-dimensional magnetic interaction in BaMn2Si2O7. Solid State Commun. 2000, 114, 113–116. [Google Scholar] [CrossRef]
  18. Lin, J.H.; Lu, G.X.; Du, J.; Su, M.Z.; Loong, C.-K.; Richardson, J.W., Jr. Phase transition and crystal structures of BaZn2Si2O7. J. Phys. Chem. Solids 1999, 60, 975–983. [Google Scholar] [CrossRef]
Figure 1. A series of Raman spectra of scottyite showing the effect of pressure on the Raman modes. The ν1 and ν4 mode is the more intense Raman modes in scottyite. The distinct peak (new peak) is marked “↑”. Arrows (←, →) indicate the direction of peak movement.
Minerals 11 00608 g001
Figure 2. The variations in the wavenumber for each Raman mode of scottyite with pressure. (a) Wavenumber range: 420–1120 cm−1; (b) wavenumber range: 50–420 cm−1. Data for loading process are shown as solid symbols (two runs: red triangle and blue round shape) and those for unloading process as open symbols. The dotted line means the discontinuity of the slope on each Raman mode. There are some new peaks (green/pink square shape) during the loading process which are on ν1, R4d modes between 8 and 12 GPa and R4a, R4c, R4j modes above 12 GPa. The solid lines are the eyeball linear fit of the data.
Minerals 11 00608 g002
Figure 3. A series of X-Ray Diffraction patterns showing the sequences of phase transitions in scottyite during the loading and unloading processes. Scottyite exhibits four new peaks above 7–8 GPa (indicated by “↑” and “*”) suggesting the onset of phase transition. In addition, some peaks disappeared or merged (indicated by “↓” and “#”) when the pressure is over 10 GPa. The scottyite phase was recovered during the unloading process.
Minerals 11 00608 g003
Figure 4. The variations in d-spacing for each diffraction peak in various phase of scottyite. (a) 2.6–6.8; (b) d-spacing range: 1.8–2.6. (*: Intensity weak, the trend is for reference only; solid circles: loading; open circles: unloading).
Minerals 11 00608 g004
Figure 5. The compressibility of the lattice parameters (a, b and c) of scottyite with pressure up to 17 GPa (solid circles: loading; open circles: unloading).
Minerals 11 00608 g005
Figure 6. The compression data as fitted to the Birch–Murnaghan equation, to give a bulk modulus, Ko, of 102 GPa, assuming Ko’ = 4. Above 8 GPa, (assuming that the structure remains unchanged) it is clearly seen that all the data deviate from the compression curve.
Minerals 11 00608 g006
Figure 7. Comparison of the XRD pattern at 11.19 GPa with the diffraction peaks of candidate high-pressure phase obtained by GSAS-II. The blue lines are the XRD peak positions at 11.19 GPa and the orange lines are the diffraction peaks obtained by GSAS-II. The inserted figure is the entire diffraction pattern.
Minerals 11 00608 g007
Table 1. Major Raman bands for scottyite on a previous experiment study and on this Raman spectroscopic study.
Major Raman Bandsν1
Strong, Sharp;
SiO4 Symmetric Stretching
ν2
Very Strong, Sharp;
SiO4 Symmetric Bending
ν3
Relatively
Weak;
SiO4 Anti-symmetric Stretching
ν4
Relatively Strong, Sharp;
SiO4 Anti-Symmetric Bending
R2 1
Strong, Sharp;
Si-O-Si Bending Mode
R4 1
Strong to Weak;
SiO4
Rotational and Translational Modes
Yang et al. [2]8964591019, 958, 866612, 578, 560675<420
This study8954581016, 958, 863608, 579, 560675358, 315, 303, 243, 220, 170, 159, 141, 120, 86, 75
1R2, R4 means second and fourth region on the Raman spectra of scottyite.
Table 2. The variations in the slope (/dP, cm−1/GPa) of each Raman mode in scottyite.
Raman Modeν1v2ν3ν4R2
ν1NewNewν1aν2ν2aν3v3aν4Newν4aR2
<8 GPa slope4.27--4.121.904.283.512.26-2.092.68
8–12 GPa slope5.595.24-4.093.57−1.334.29-−4.68-2.44−3.35
>12 GPa slope3.623.972.683.351.560.78--1.251.121.891.32
-: no data.
Table 3. The variations in the slope (/dP, cm−1/GPa) of each Raman mode in scottyite.
Raman ModeR4
NewabcNewdNewefghijk
c1c2f1f2g1g2j1j2
<8 GPa slope-3.142.442.31-1.66-1.621.951.480.130.580.960.57
8–12 GPa slope-1.94-5.78−4.27--1.751.435.54−5.71−3.721.693.911.79−1.35
>12 GPa slope1.181.53-2.44-0.92-1.071.760.19−0.930.96--2.350.950.12
-: no data.
Table 4. The unit cell parameters, molar volume and their normalized ratios of scottyite in the loading and unloading processes.
Pressure (GPa)abcVa/a0b/b0c/c0V/V0
0.016.87613.1736.864621.721111
1.006.84913.1386.822613.860.9960.9970.9940.987
2.006.8113.1406.817610.010.9900.9970.9930.981
2.926.79313.0996.775602.850.9880.9940.9870.970
4.016.77813.0896.761599.820.9860.9940.9850.965
5.026.76613.0636.74595.710.9840.9920.9820.958
5.526.76513.0476.715592.690.9840.9900.9780.953
6.106.75413.0476.709591.190.9820.9900.9770.951
7.206.73013.0286.685586.130.9790.9890.9740.943
8.226.69812.9976.656579.430.9740.9870.9700.932
9.066.73512.9466.667581.300.9790.9830.9710.935
10.086.70312.8976.723581.190.9750.9790.9790.935
11.196.71412.8876.729582.220.9760.9780.9800.936
12.296.74112.8686.602572.680.9800.9770.9620.921
13.146.72312.8356.583568.050.9780.9740.9590.914
14.266.72512.8076.584567.060.9780.9720.9590.912
15.036.65912.8136.649567.300.9680.9730.9690.912
16.066.6612.8596.653569.770.9690.9760.9690.916
16.406.49812.8836.688559.880.9450.9780.9740.901
Unloading
12.296.75212.9356.612577.470.9820.9820.9630.929
8.056.73713.0026.684585.480.9800.9870.9740.942
6.126.73913.0146.693586.990.9800.9880.9750.944
4.026.76313.0756.758597.580.9840.9930.9850.961
1.086.83313.1706.813613.110.9941.0000.9930.986
0.016.87813.1886.864622.611.0001.0011.0001.001
Table 5. The crystal structure of some BaM2Si2O7-type minerals with the monoclinic system.
Chemical FormulaSpace GroupUnit-Cell ParametersSi-O-Si (°)
abcβ
BaFe2Si2O7 [14]P21/c7.48813.7857.085118.23127.2
BaCo2Si2O7 [15]C2/c7.21312.78113.76290.299124.5
BaMg2Si2O7 [16]C2/c7.24612.71413.74890.211125.2
BaMn2Si2O 7 [17]C2/c7.29512.96314.03290.248no data
BaZn2Si2O7-25 °C [18]C2/c7.27812.80113.68790.093124.8
Publisher’s Note: MDPI stays neutral with regard to jurisdictional claims in published maps and institutional affiliations.

