
Zircon Chemistry and Oxidation State of Magmas for the Duobaoshan-Tongshan Ore-Bearing Intrusions in the Northeastern Central Asian Orogenic Belt, NE China


Abstract
1. Introduction
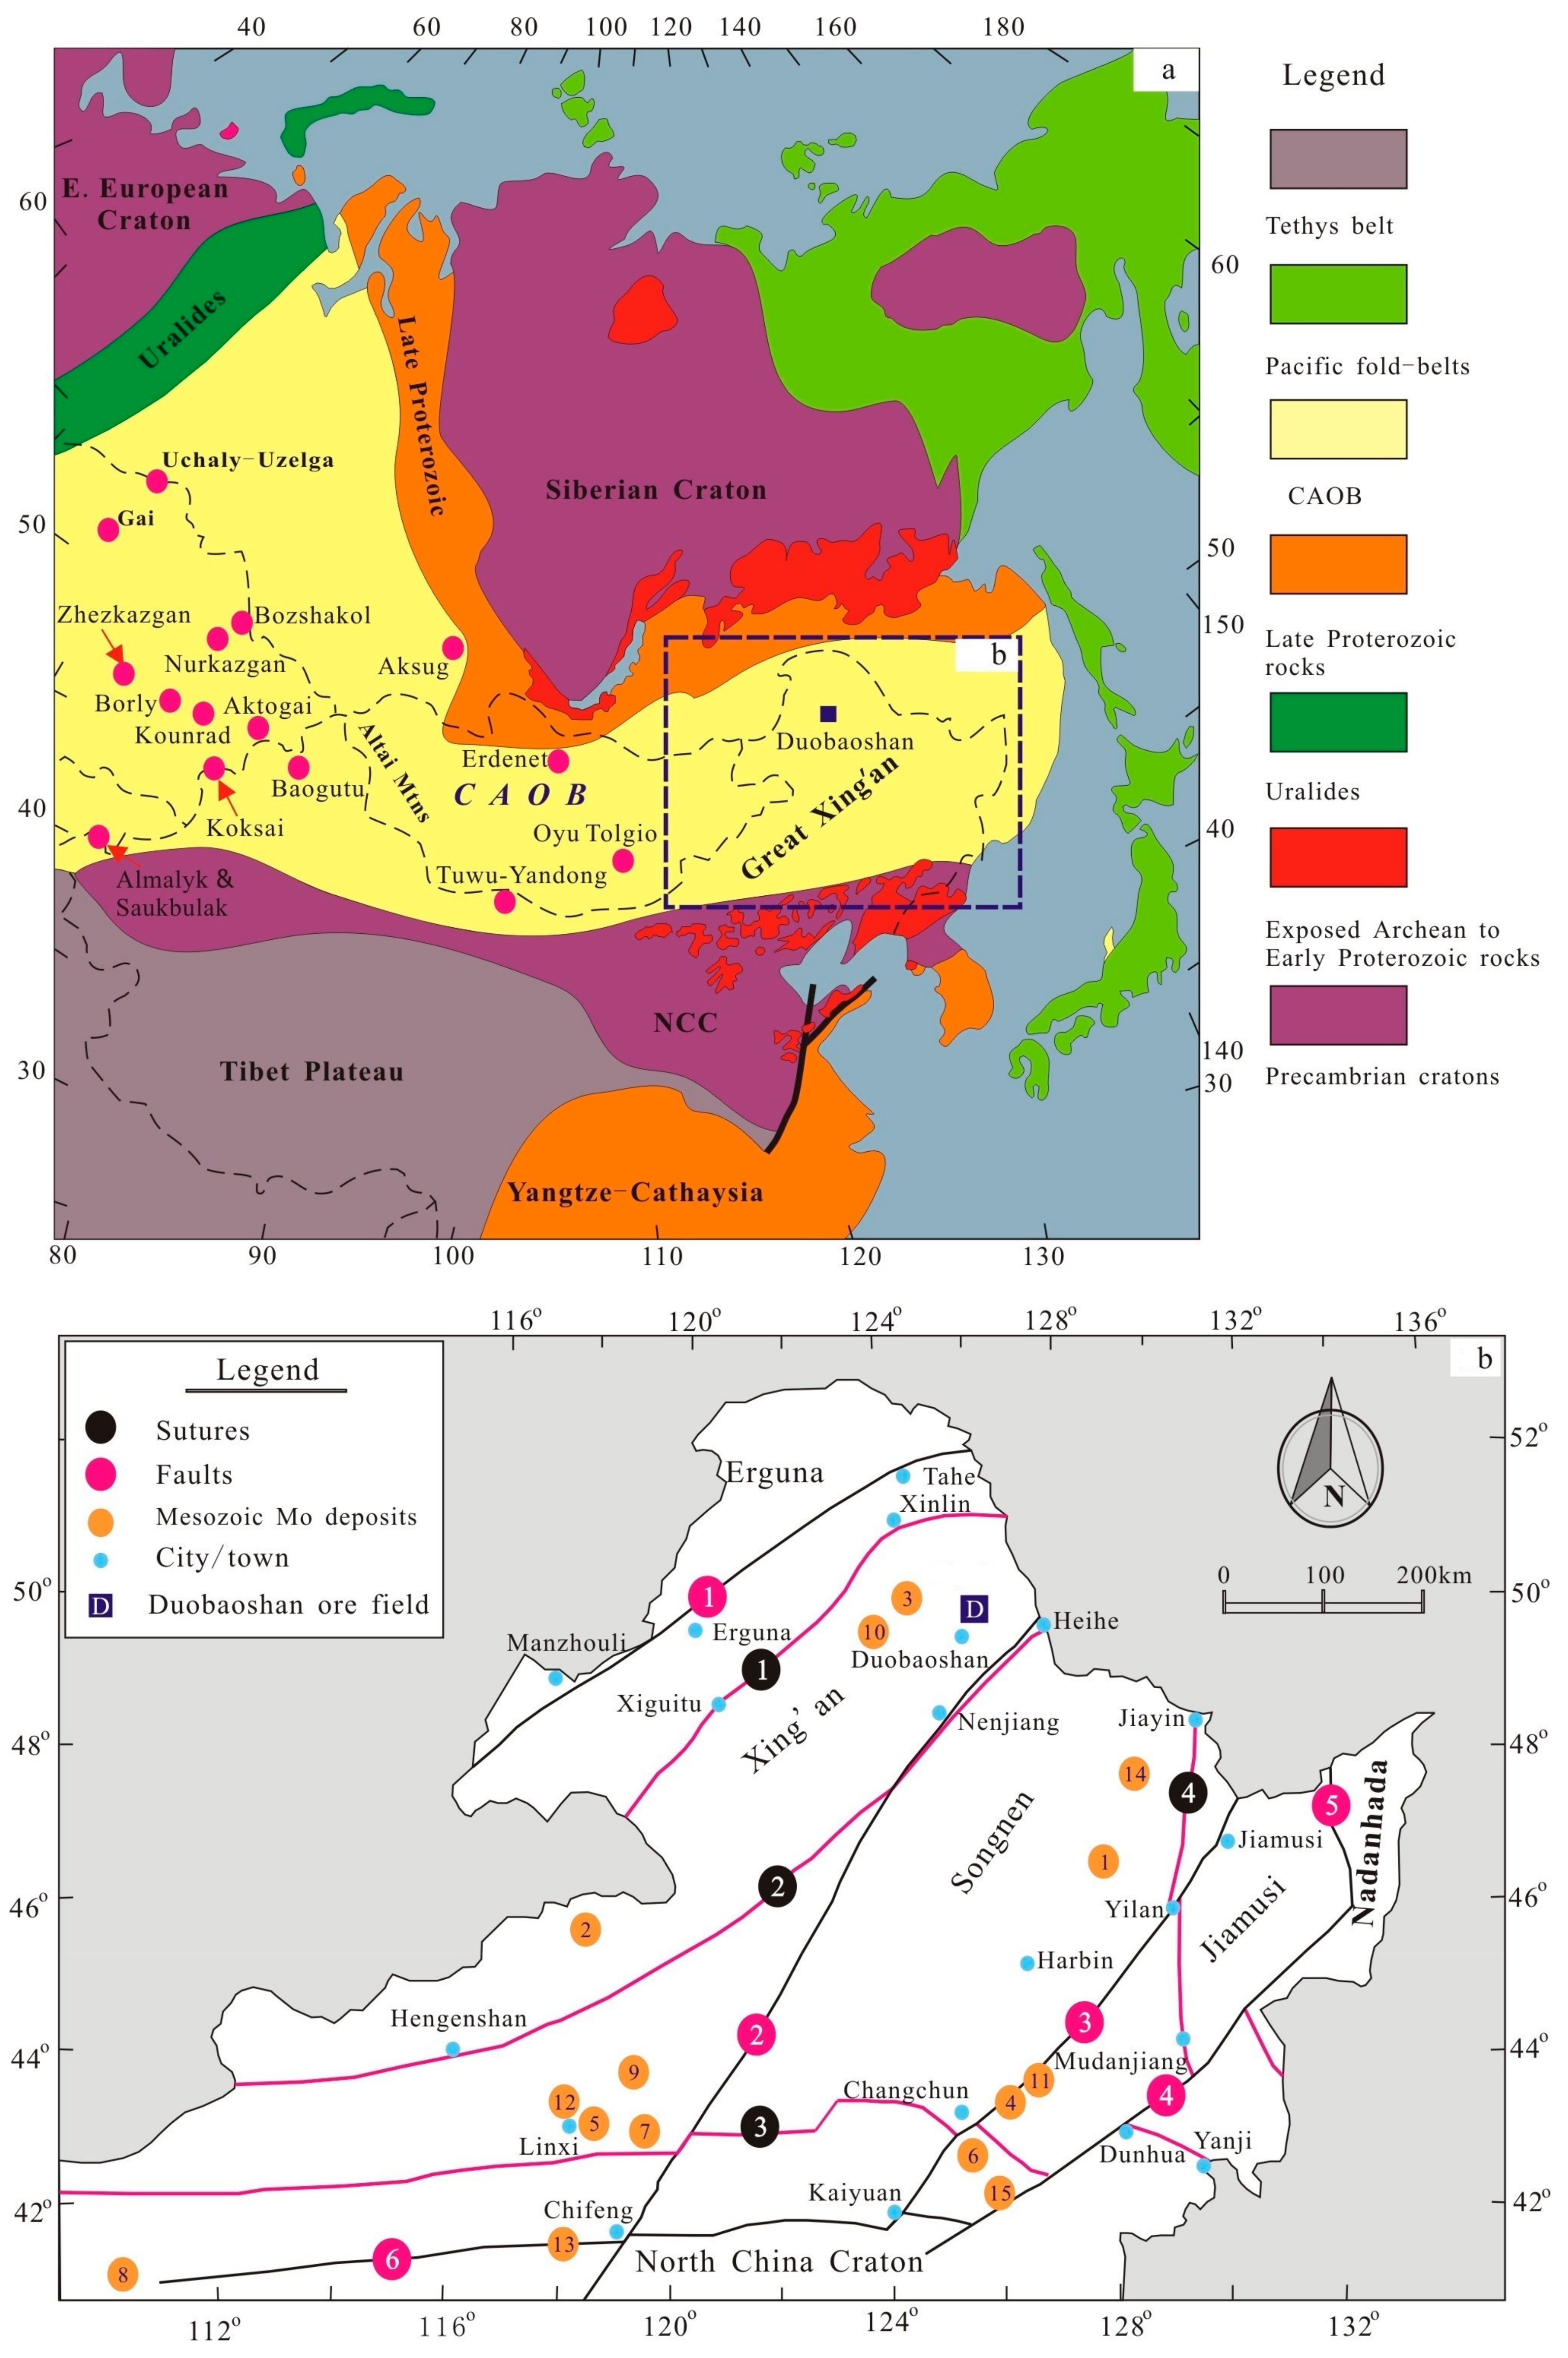
2. General Geology
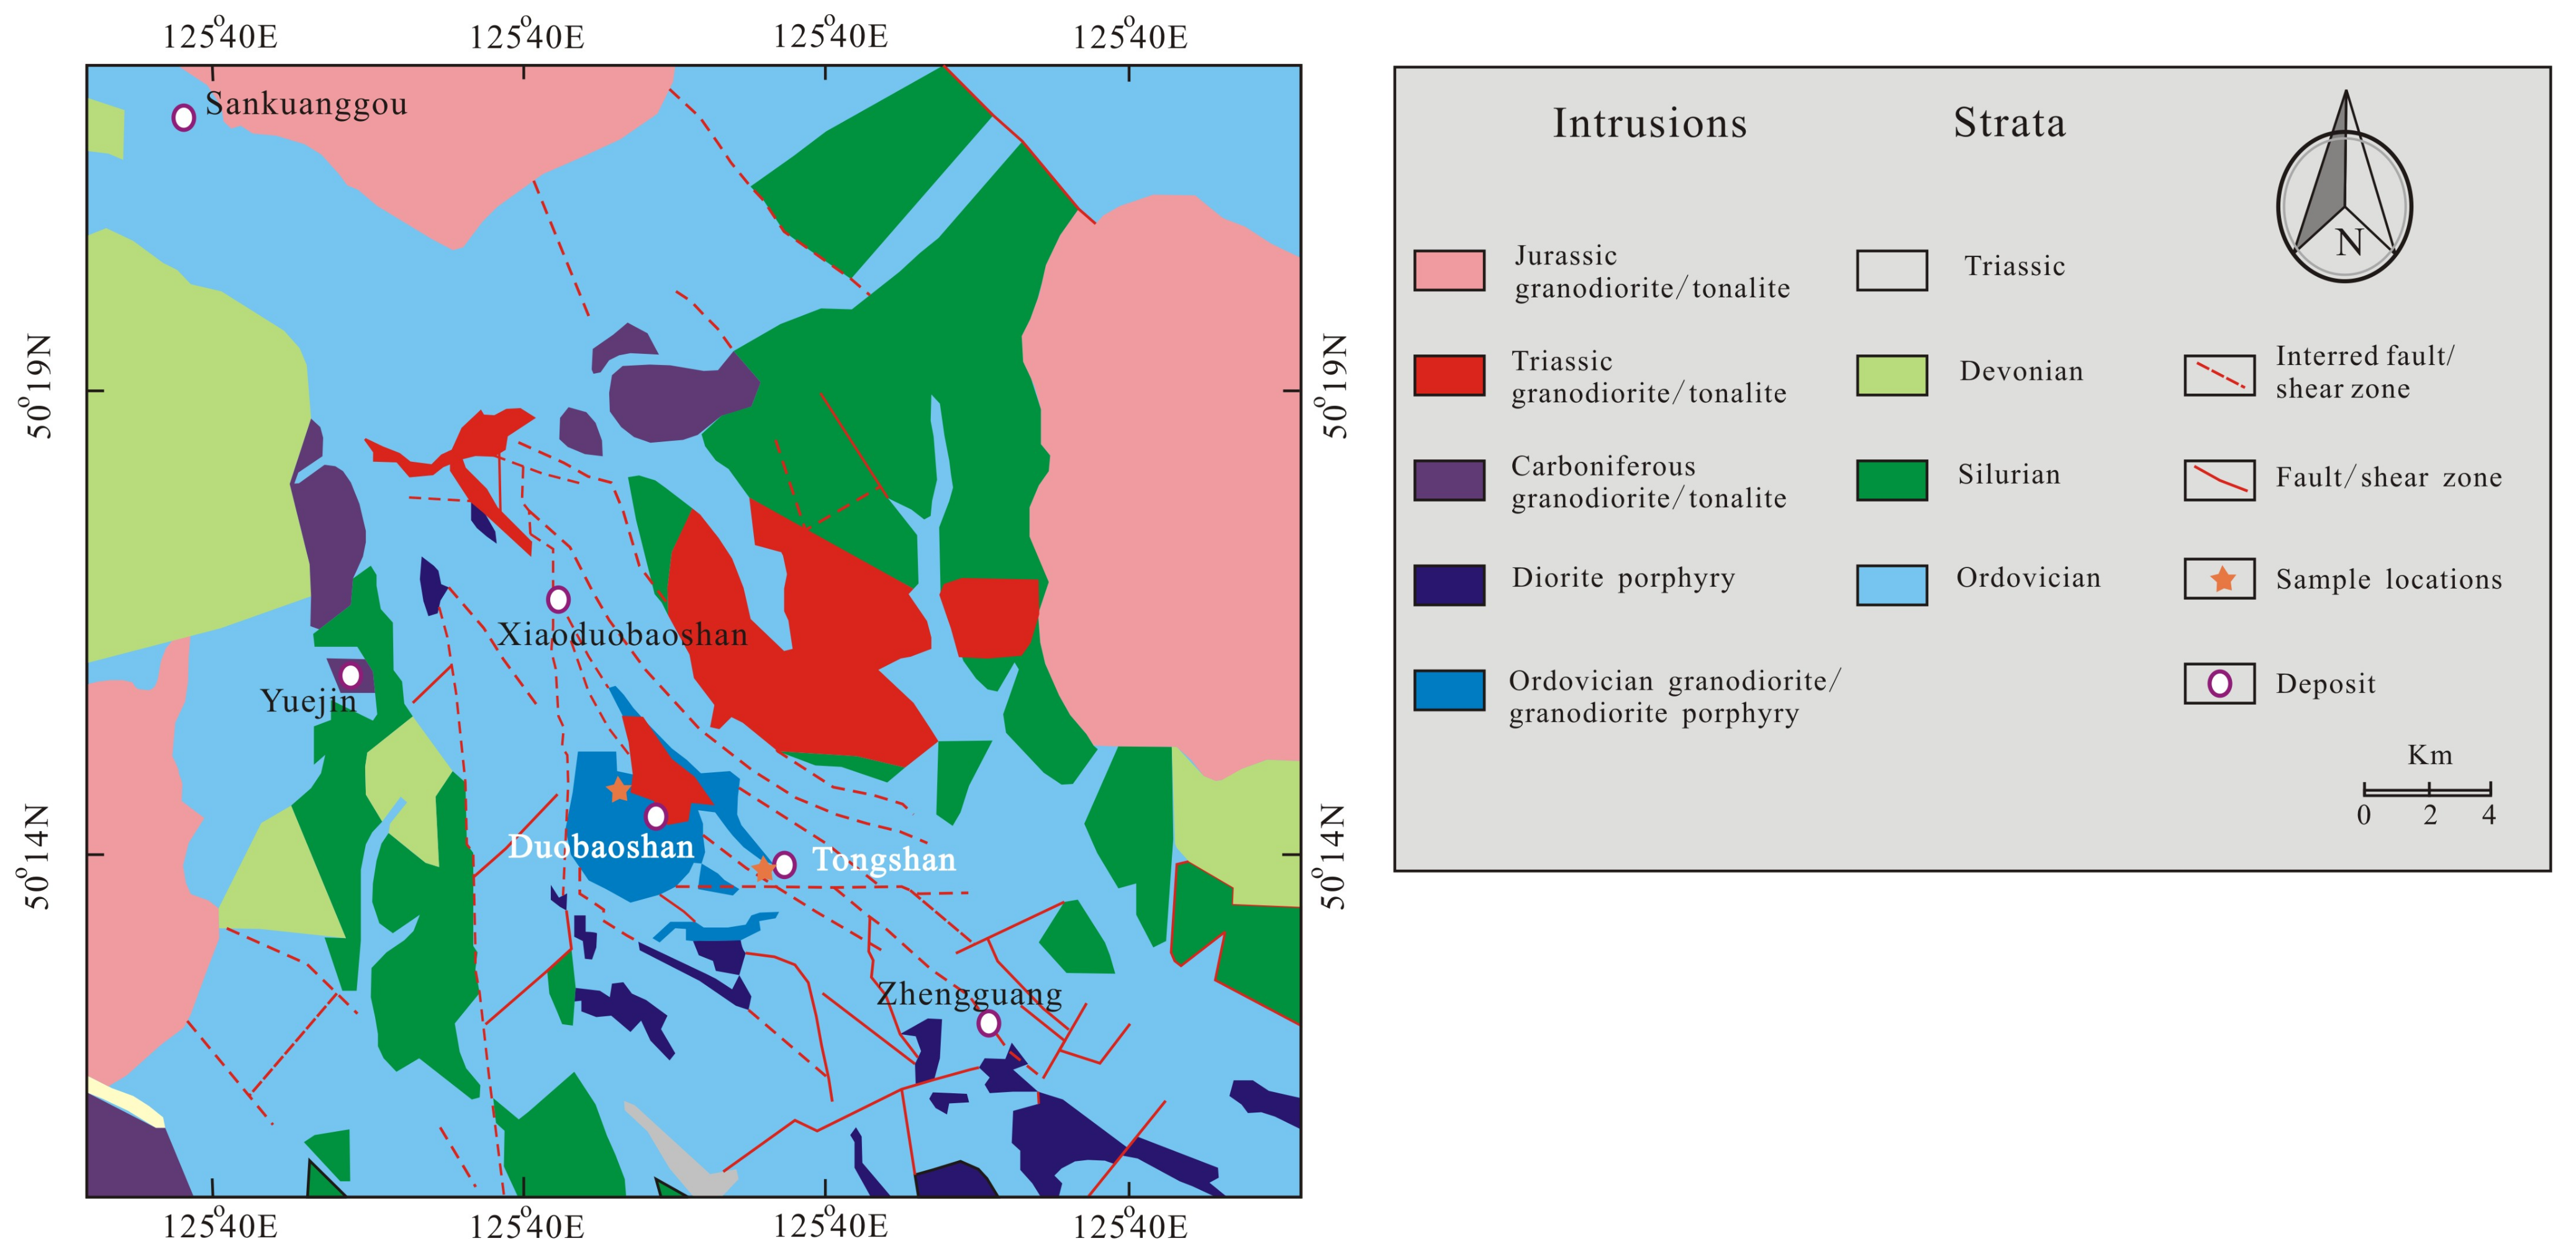
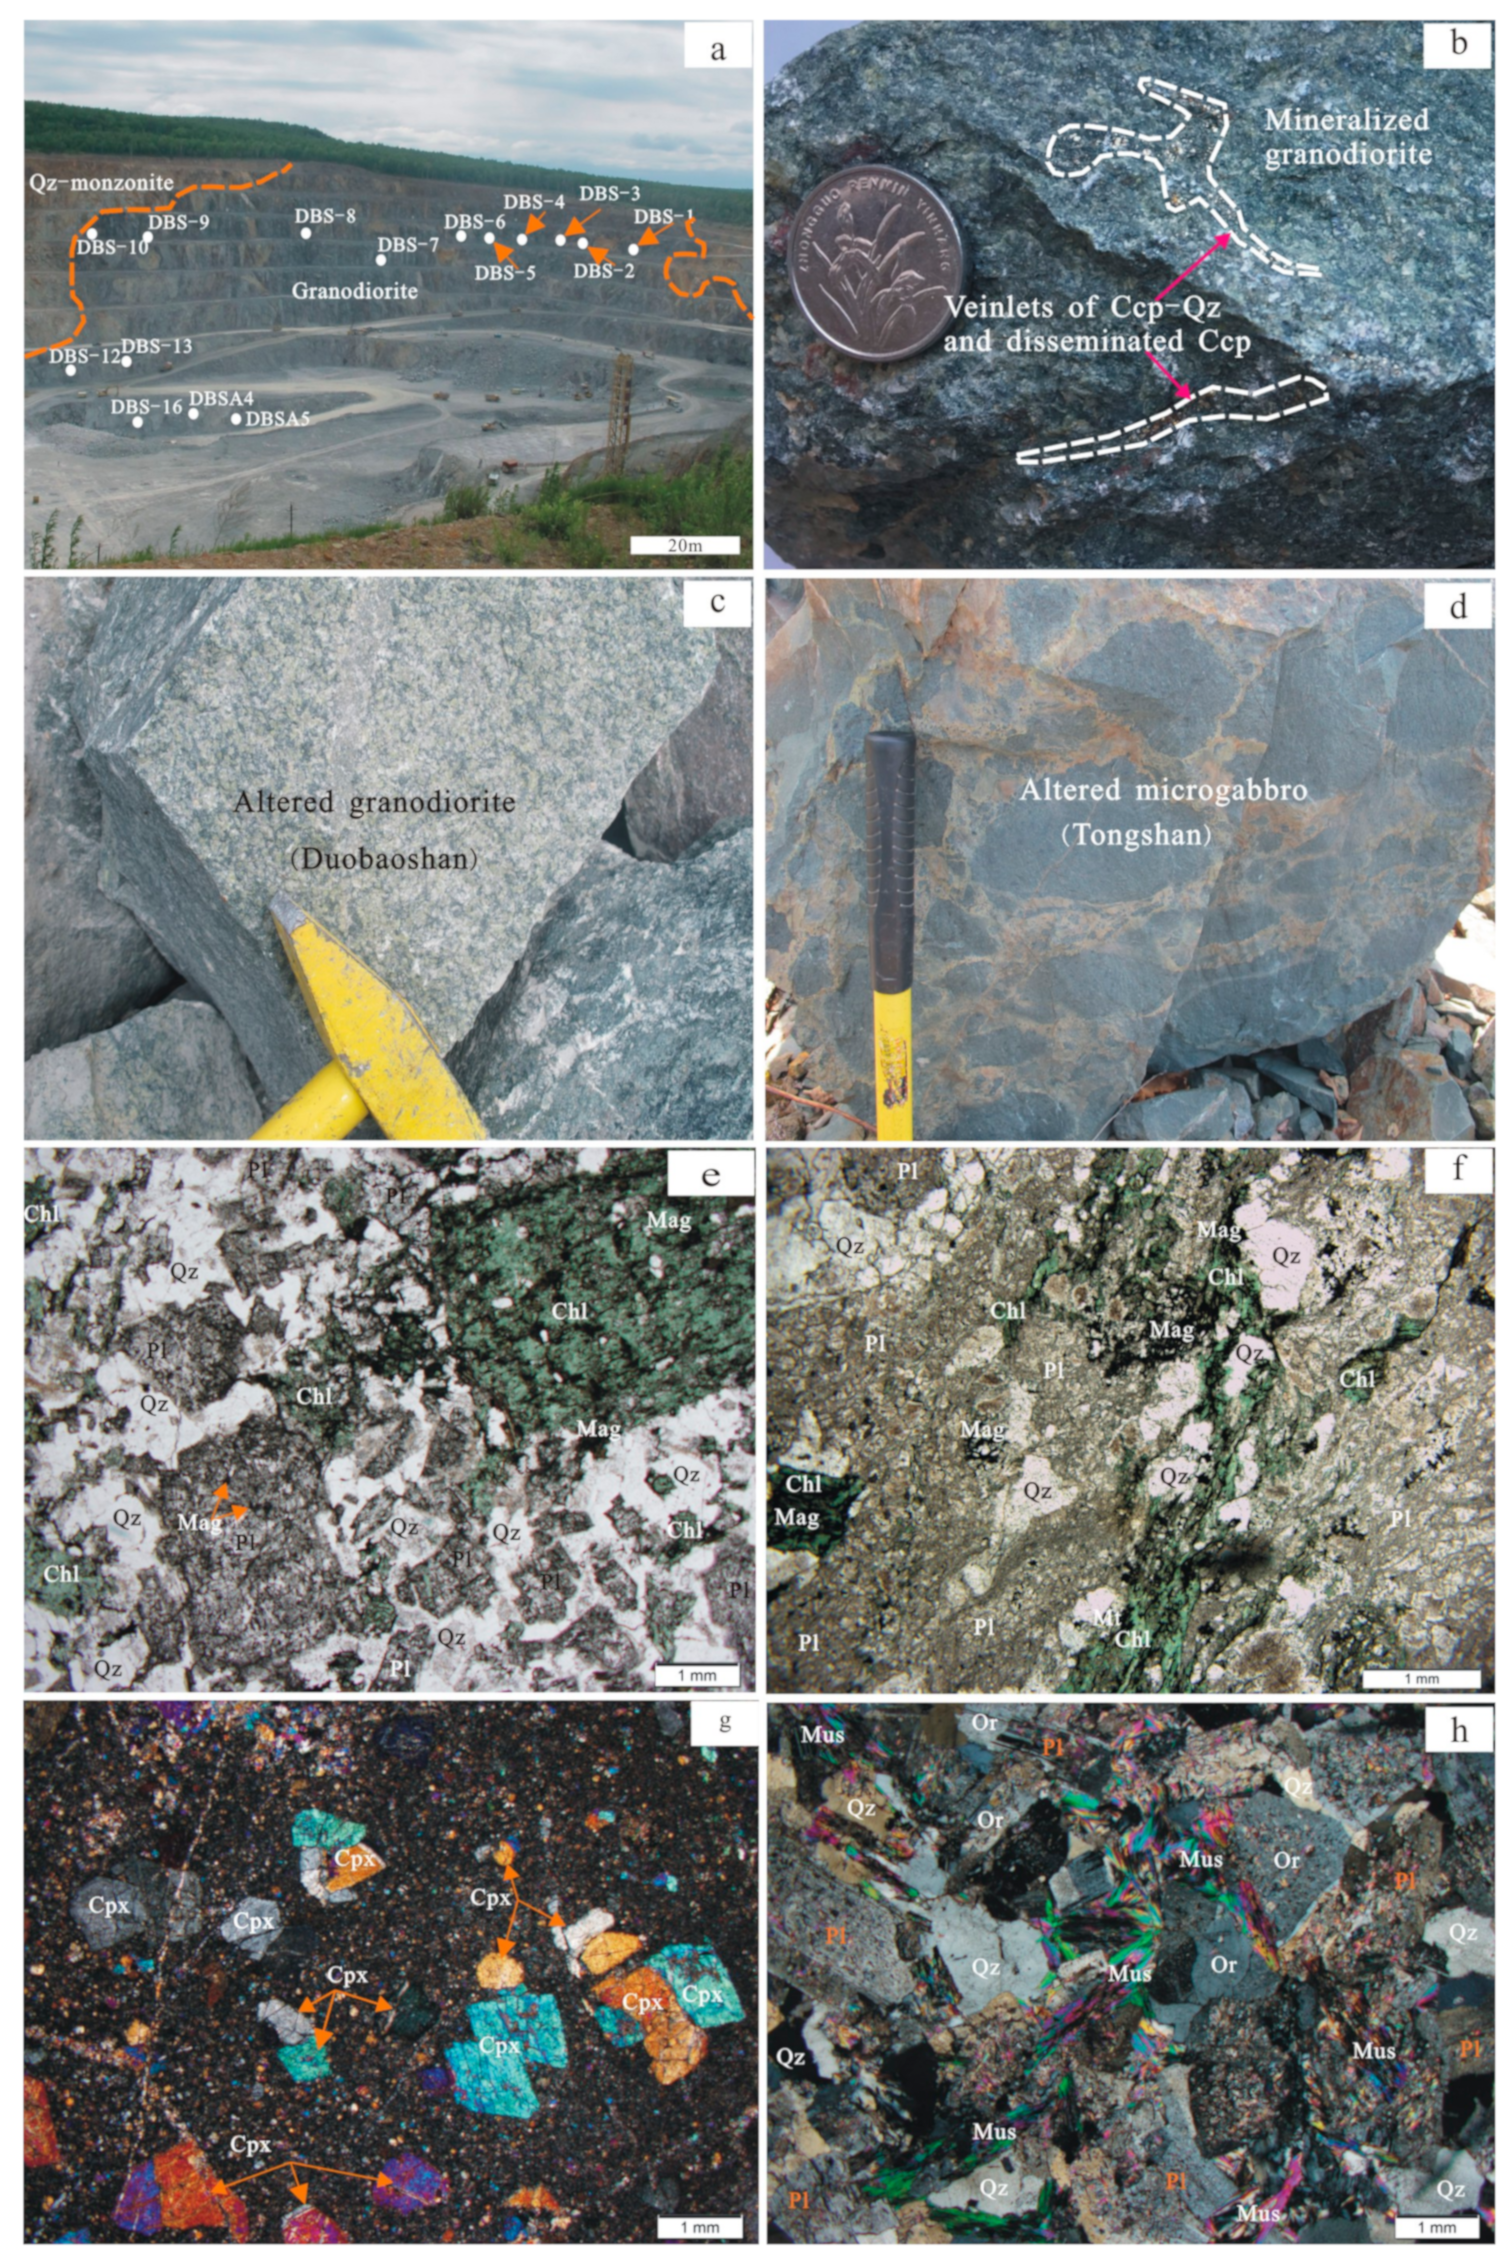
3. Geology of the DBS-TS Area
4. Analytical Procedures
4.1. Whole-Rock Chemical Composition
4.2. Zircon Trace-Element Analyses
5. Results
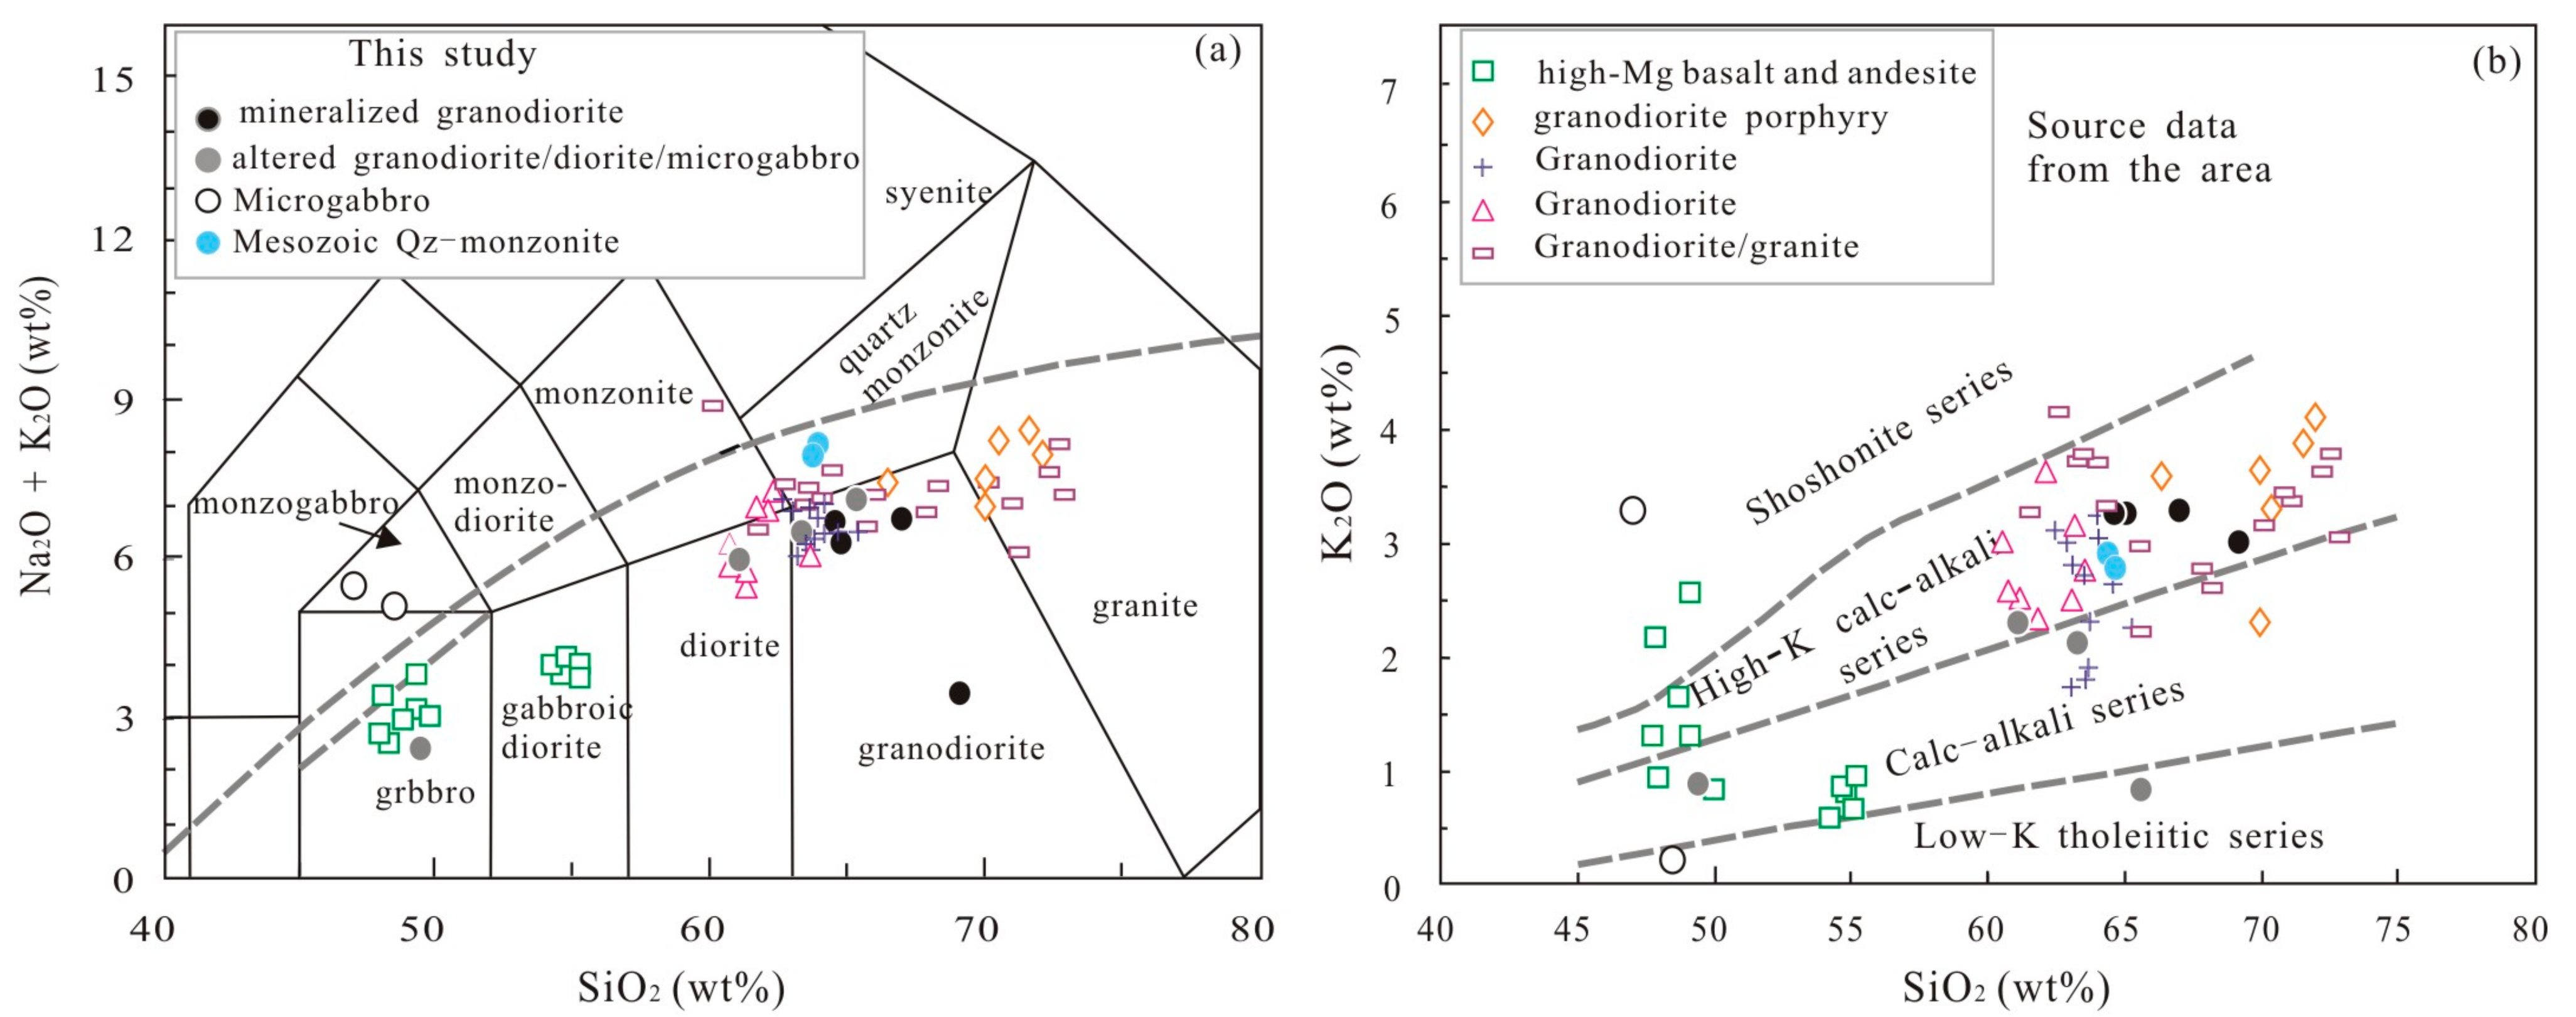
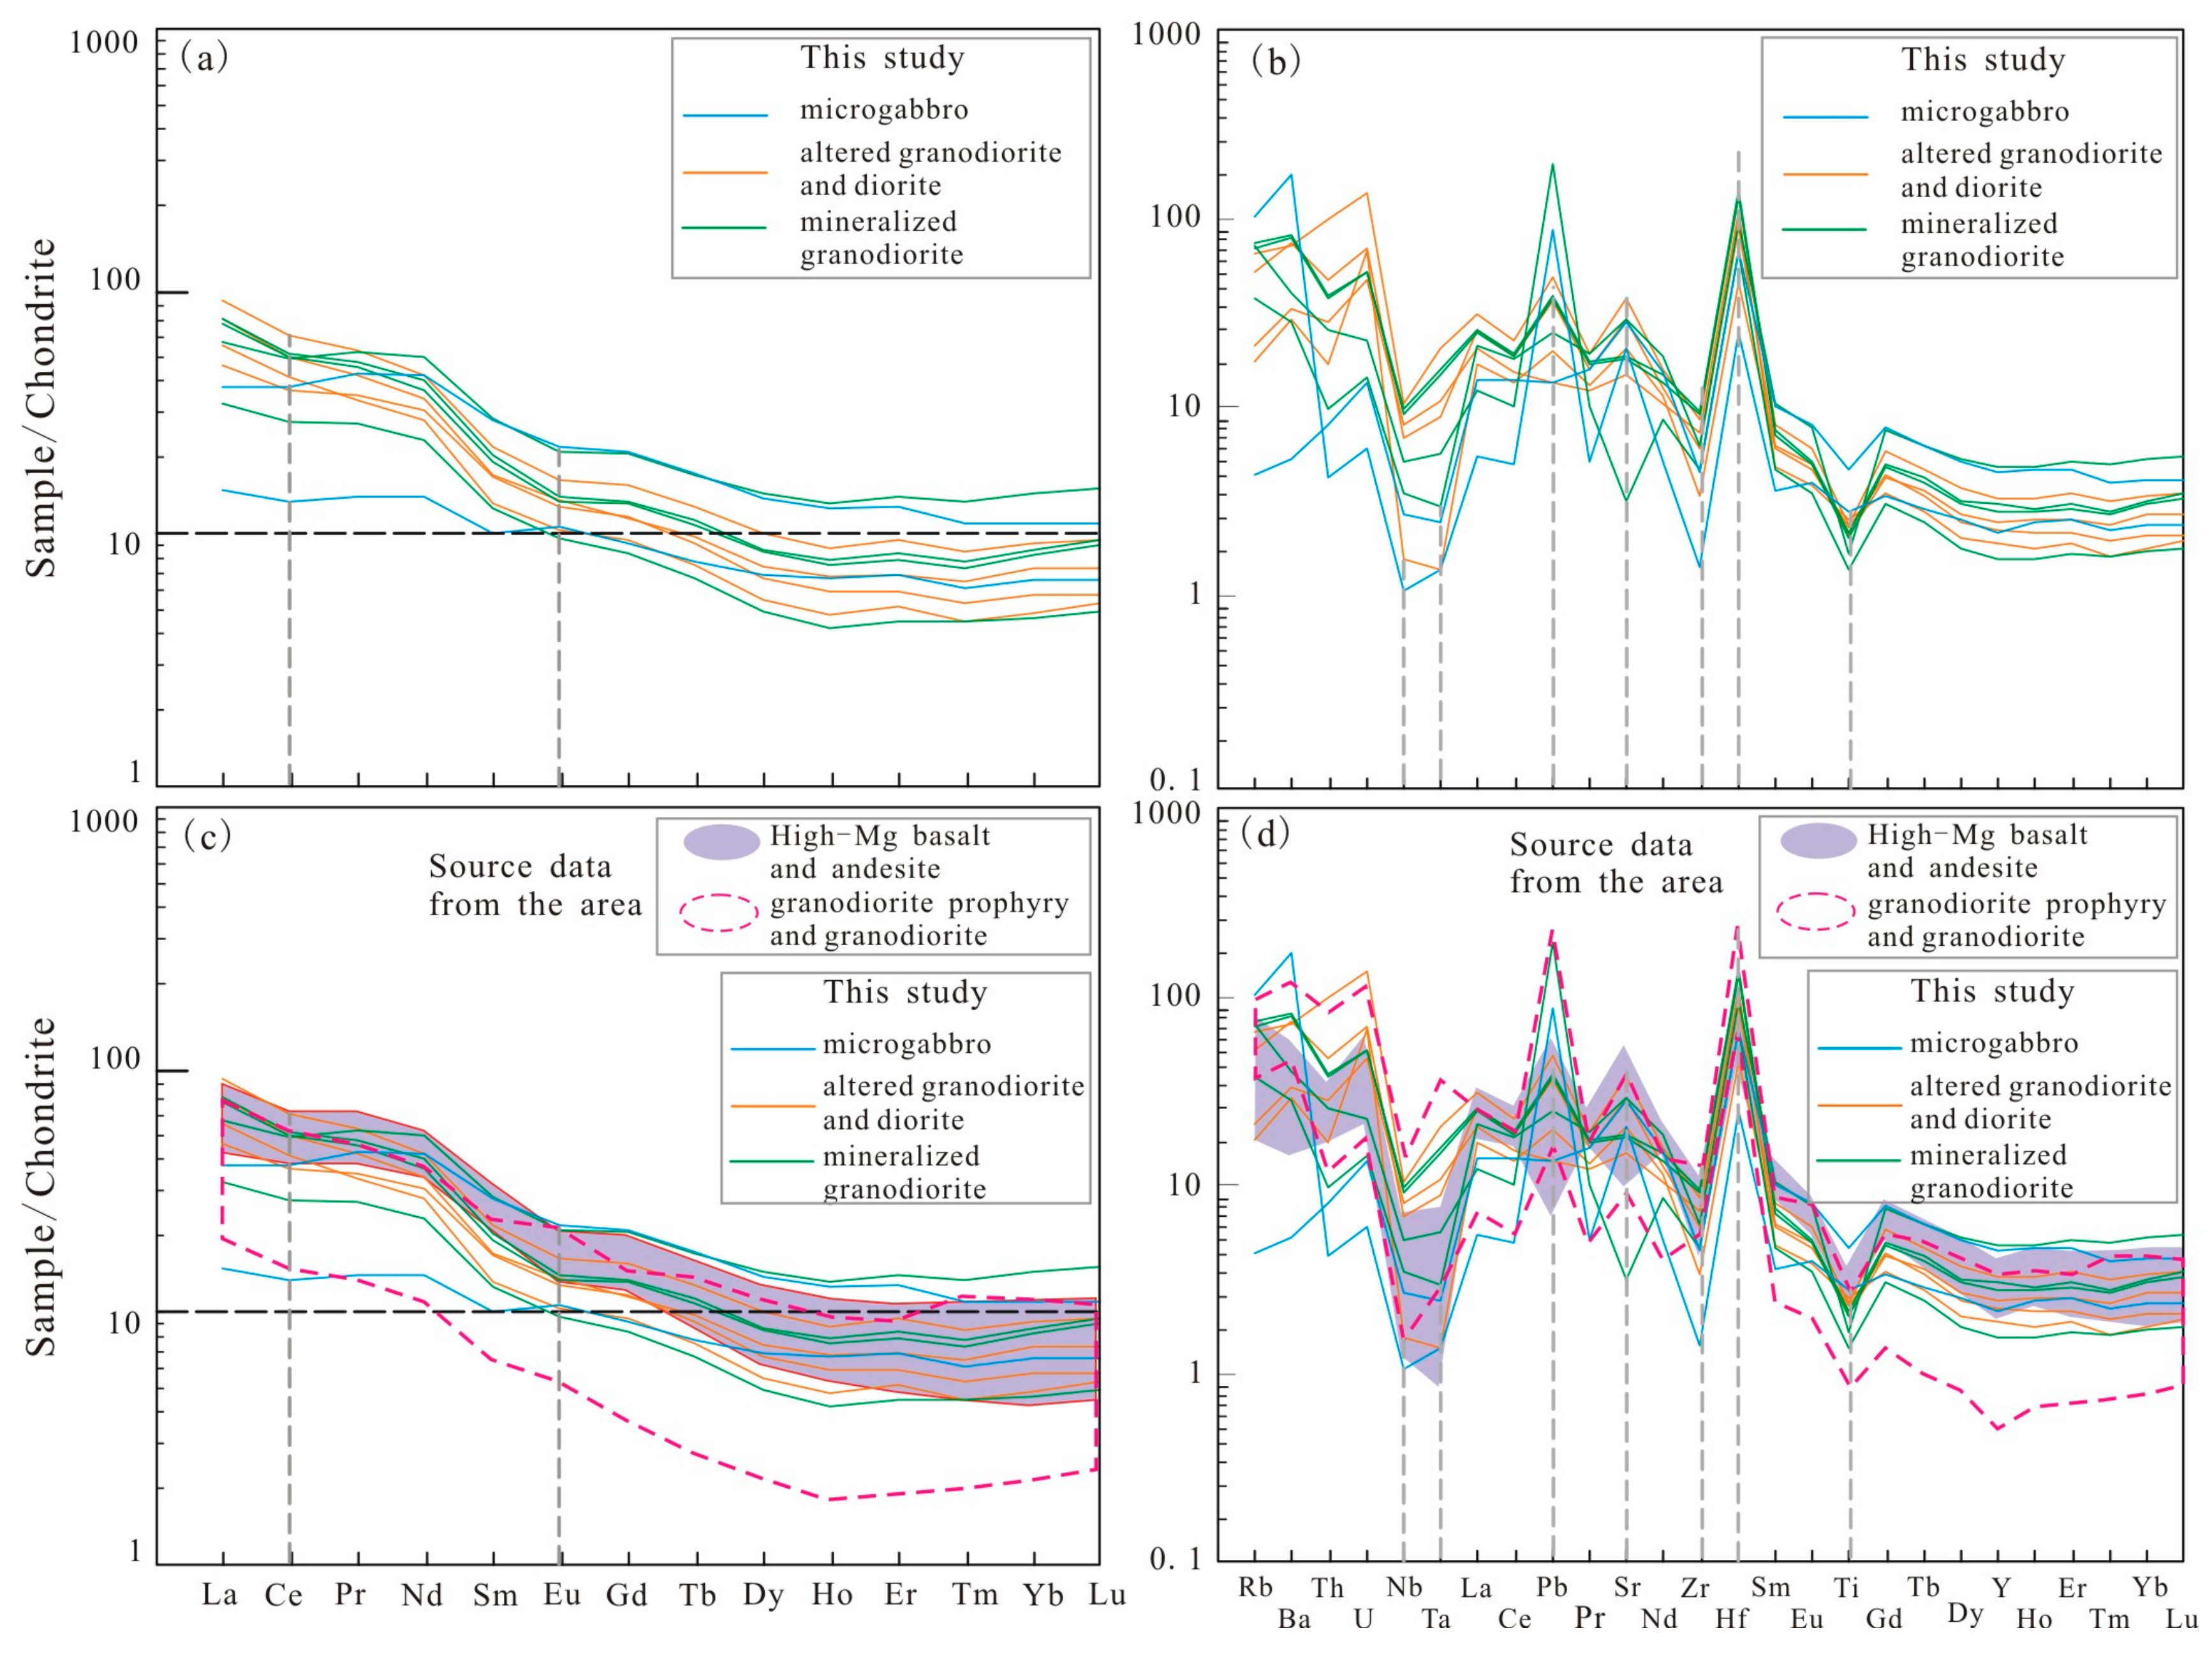
5.1. Whole-Rock Geochemistry
5.2. Zircon Geochemistry
5.3. Crystallization Temperatures of Zircon
5.4. Magma Oxidation State
6. Discussions
6.1. Origin of the Ordovician Intrusions Hosting the DBS-TS Cu-Mo Deposit
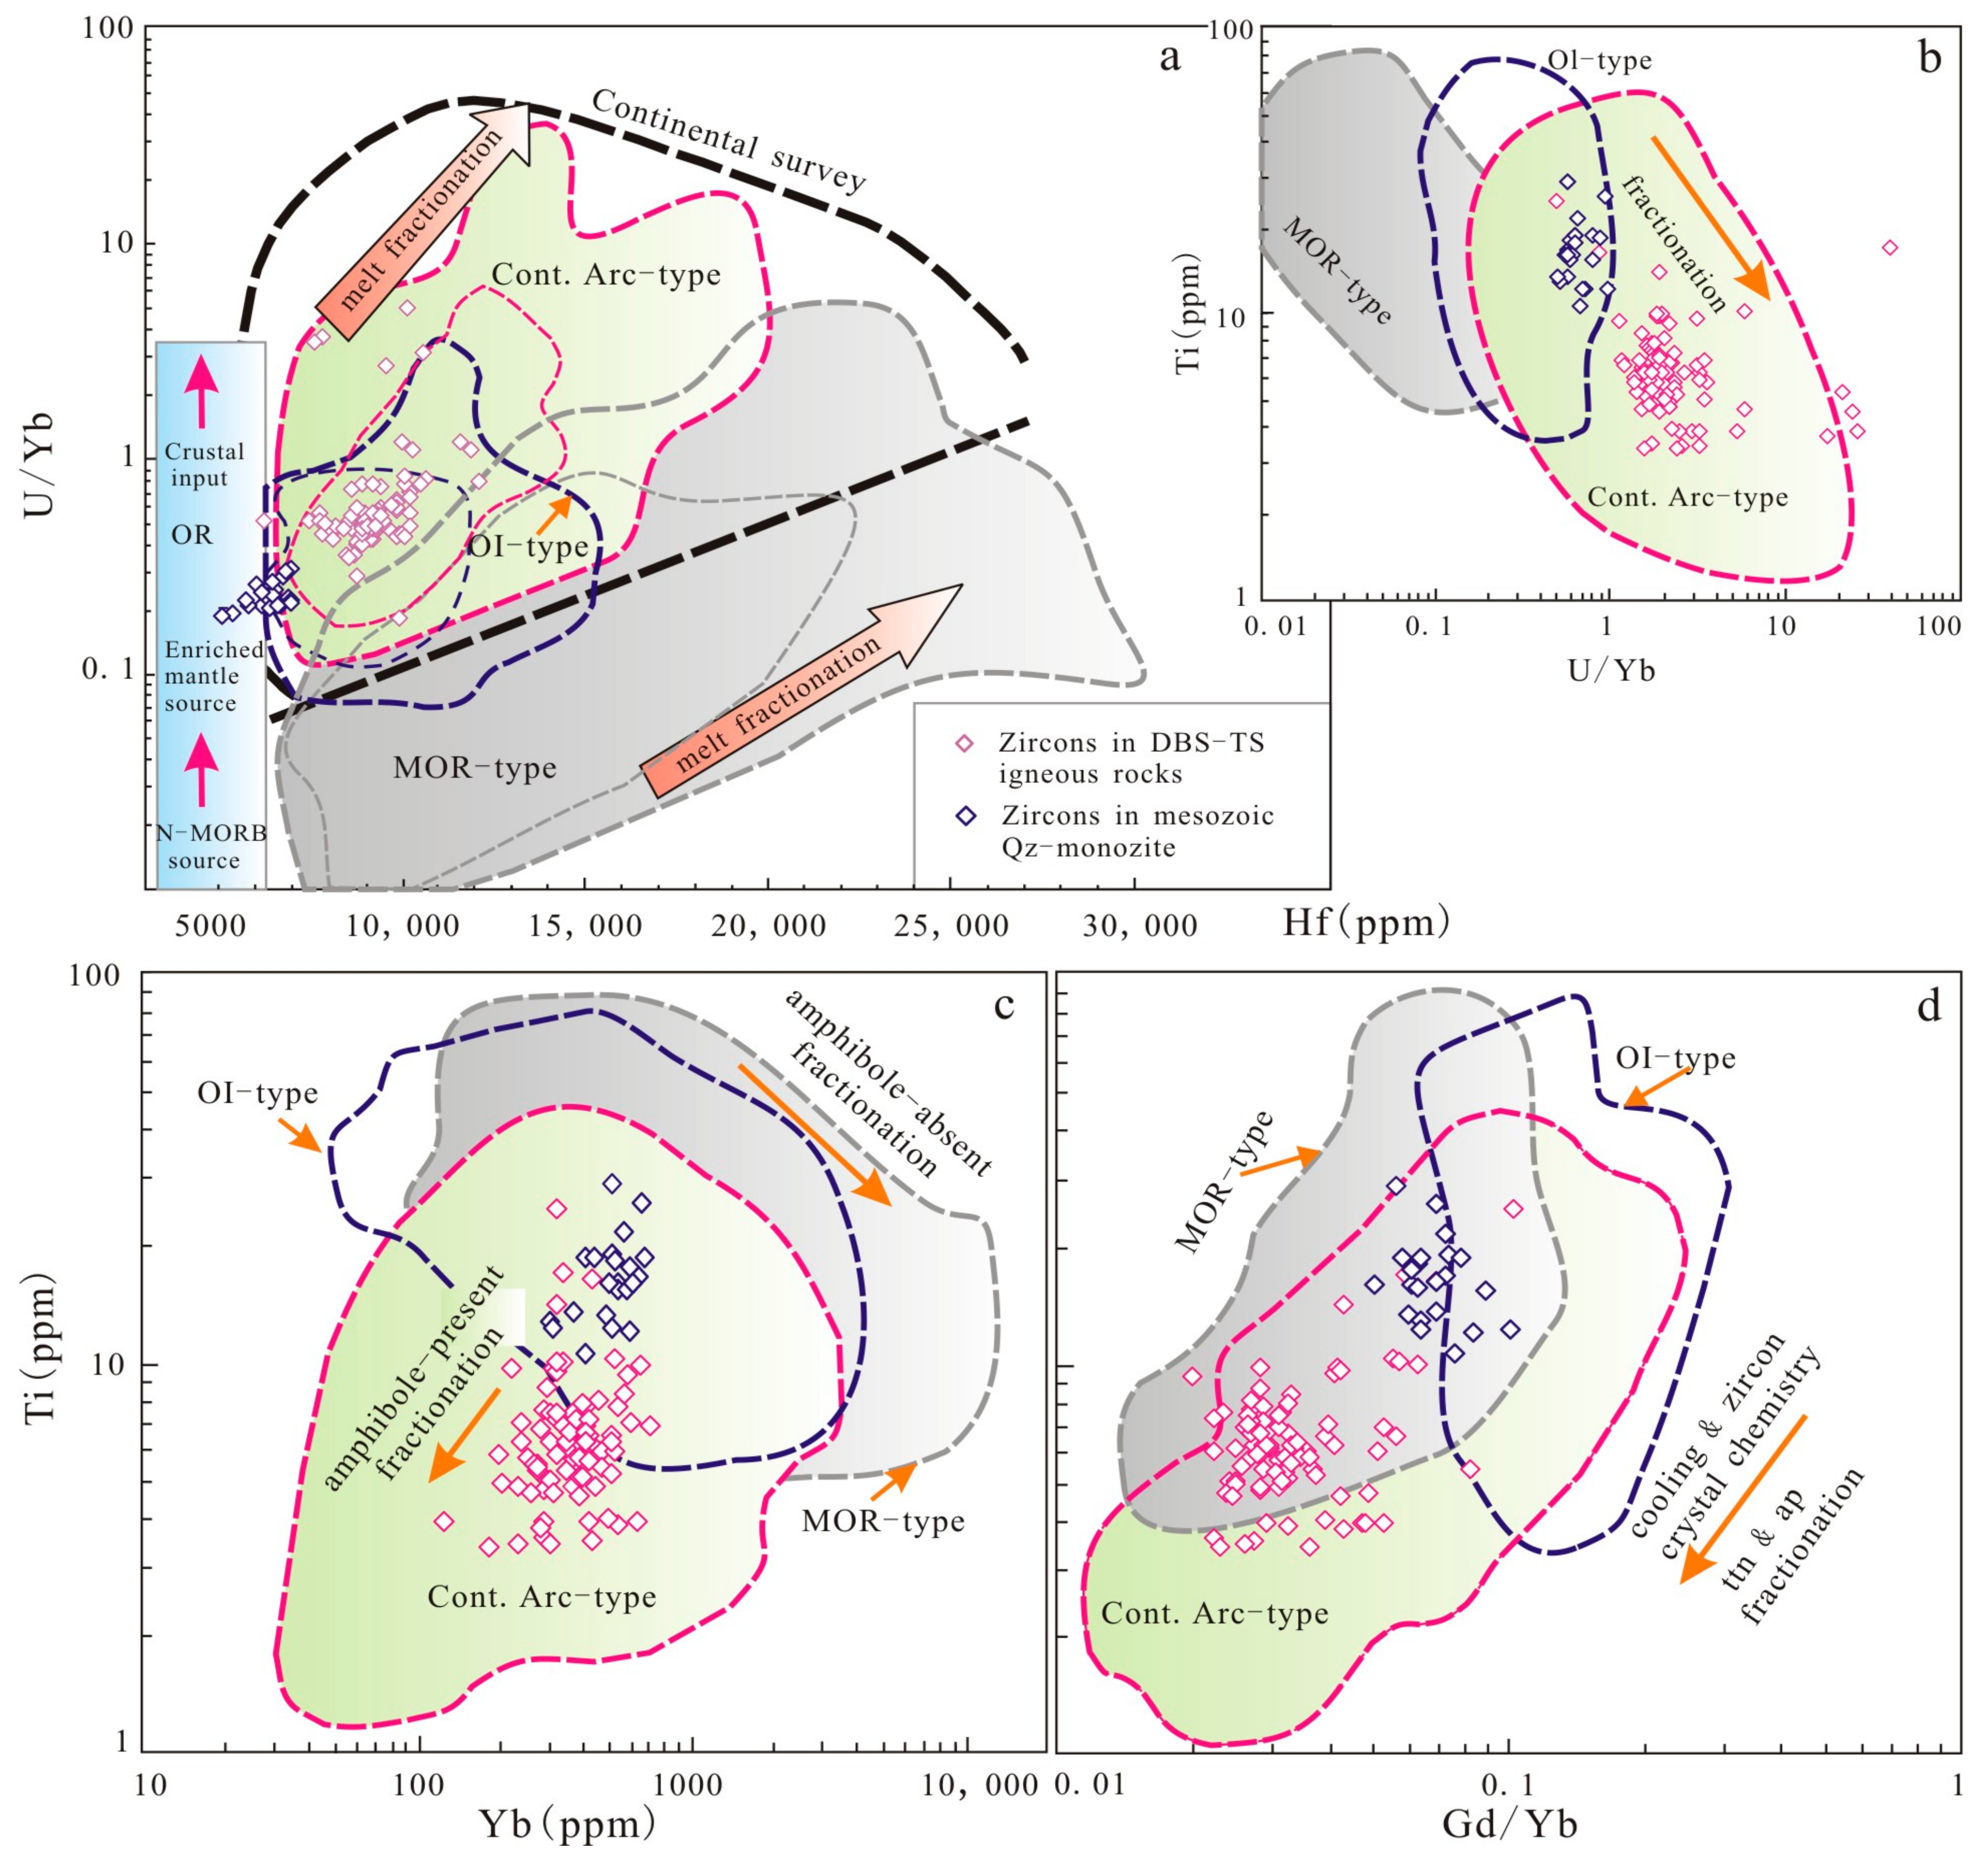
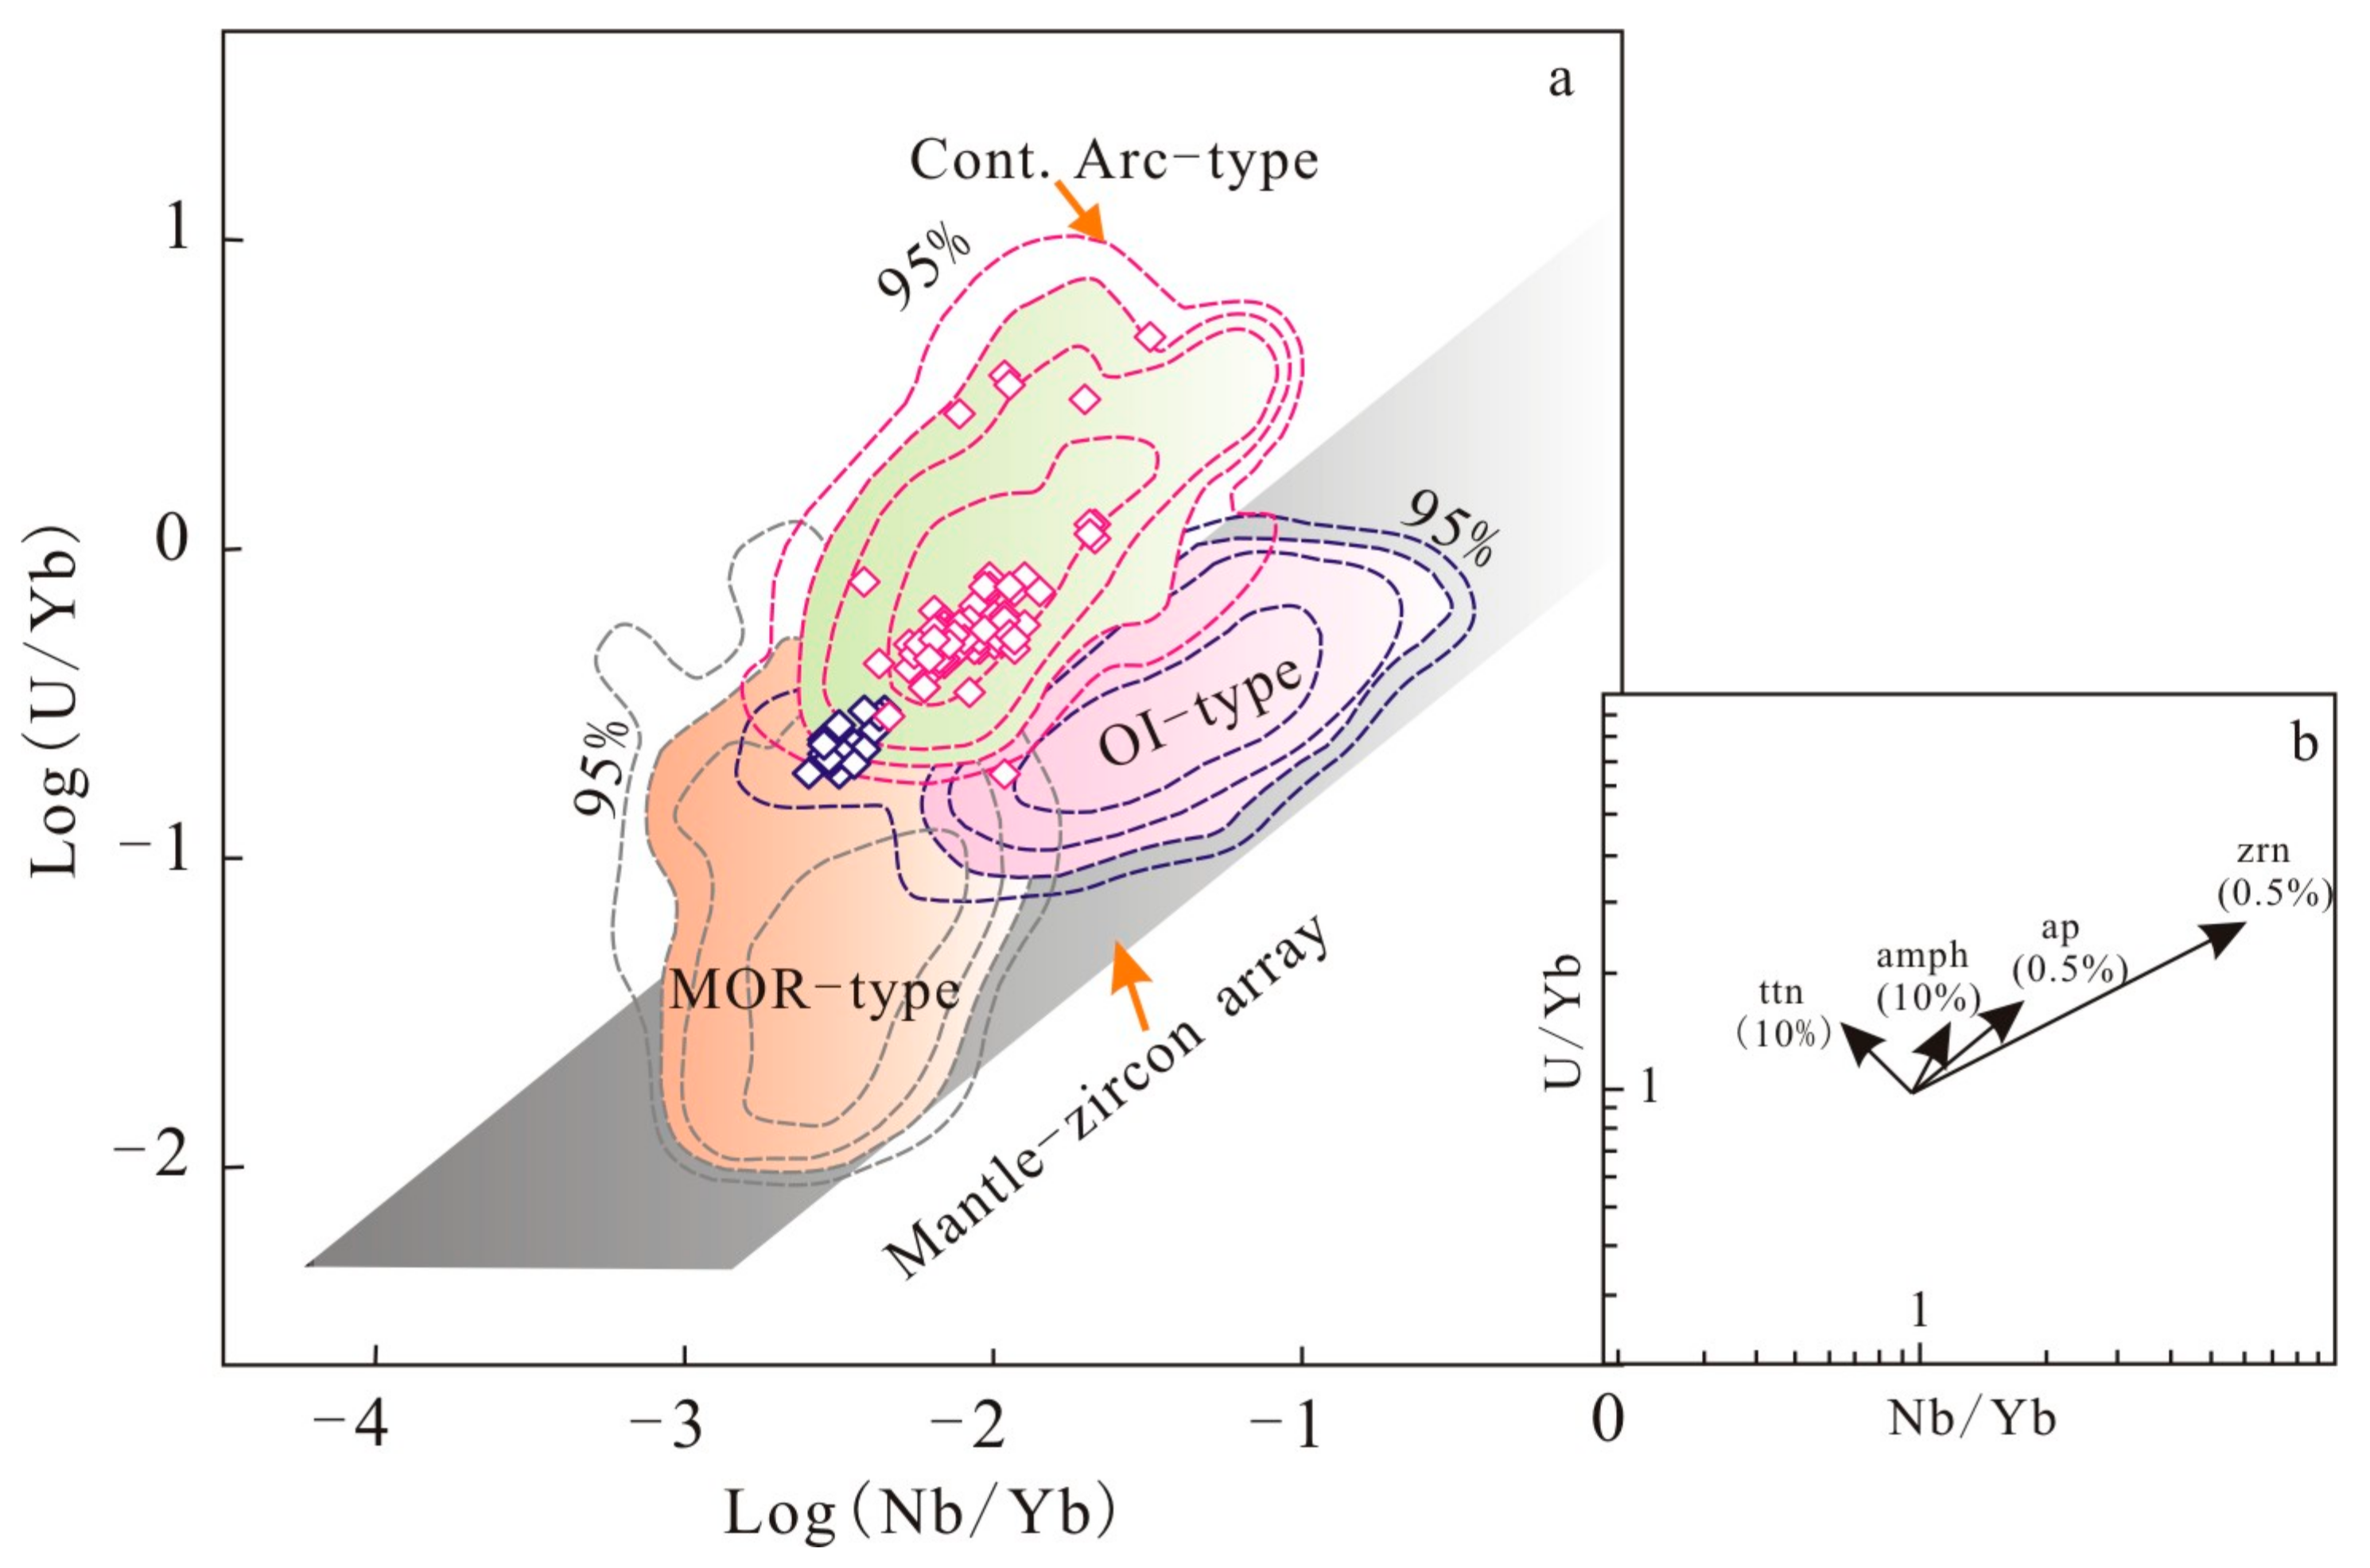
6.1.1. Tectonic Setting Based on Zircon Trace Elements Geochemistry
6.1.2. Origin of Magmas for the Ordovician Host Intrusions Based on Whole-Rock and Zircon Chemistries
6.2. Oxidation States of Parental Magmas for the DBS-TS Dioritic to Granodioritic Intrusions Based on Zircon Compositions
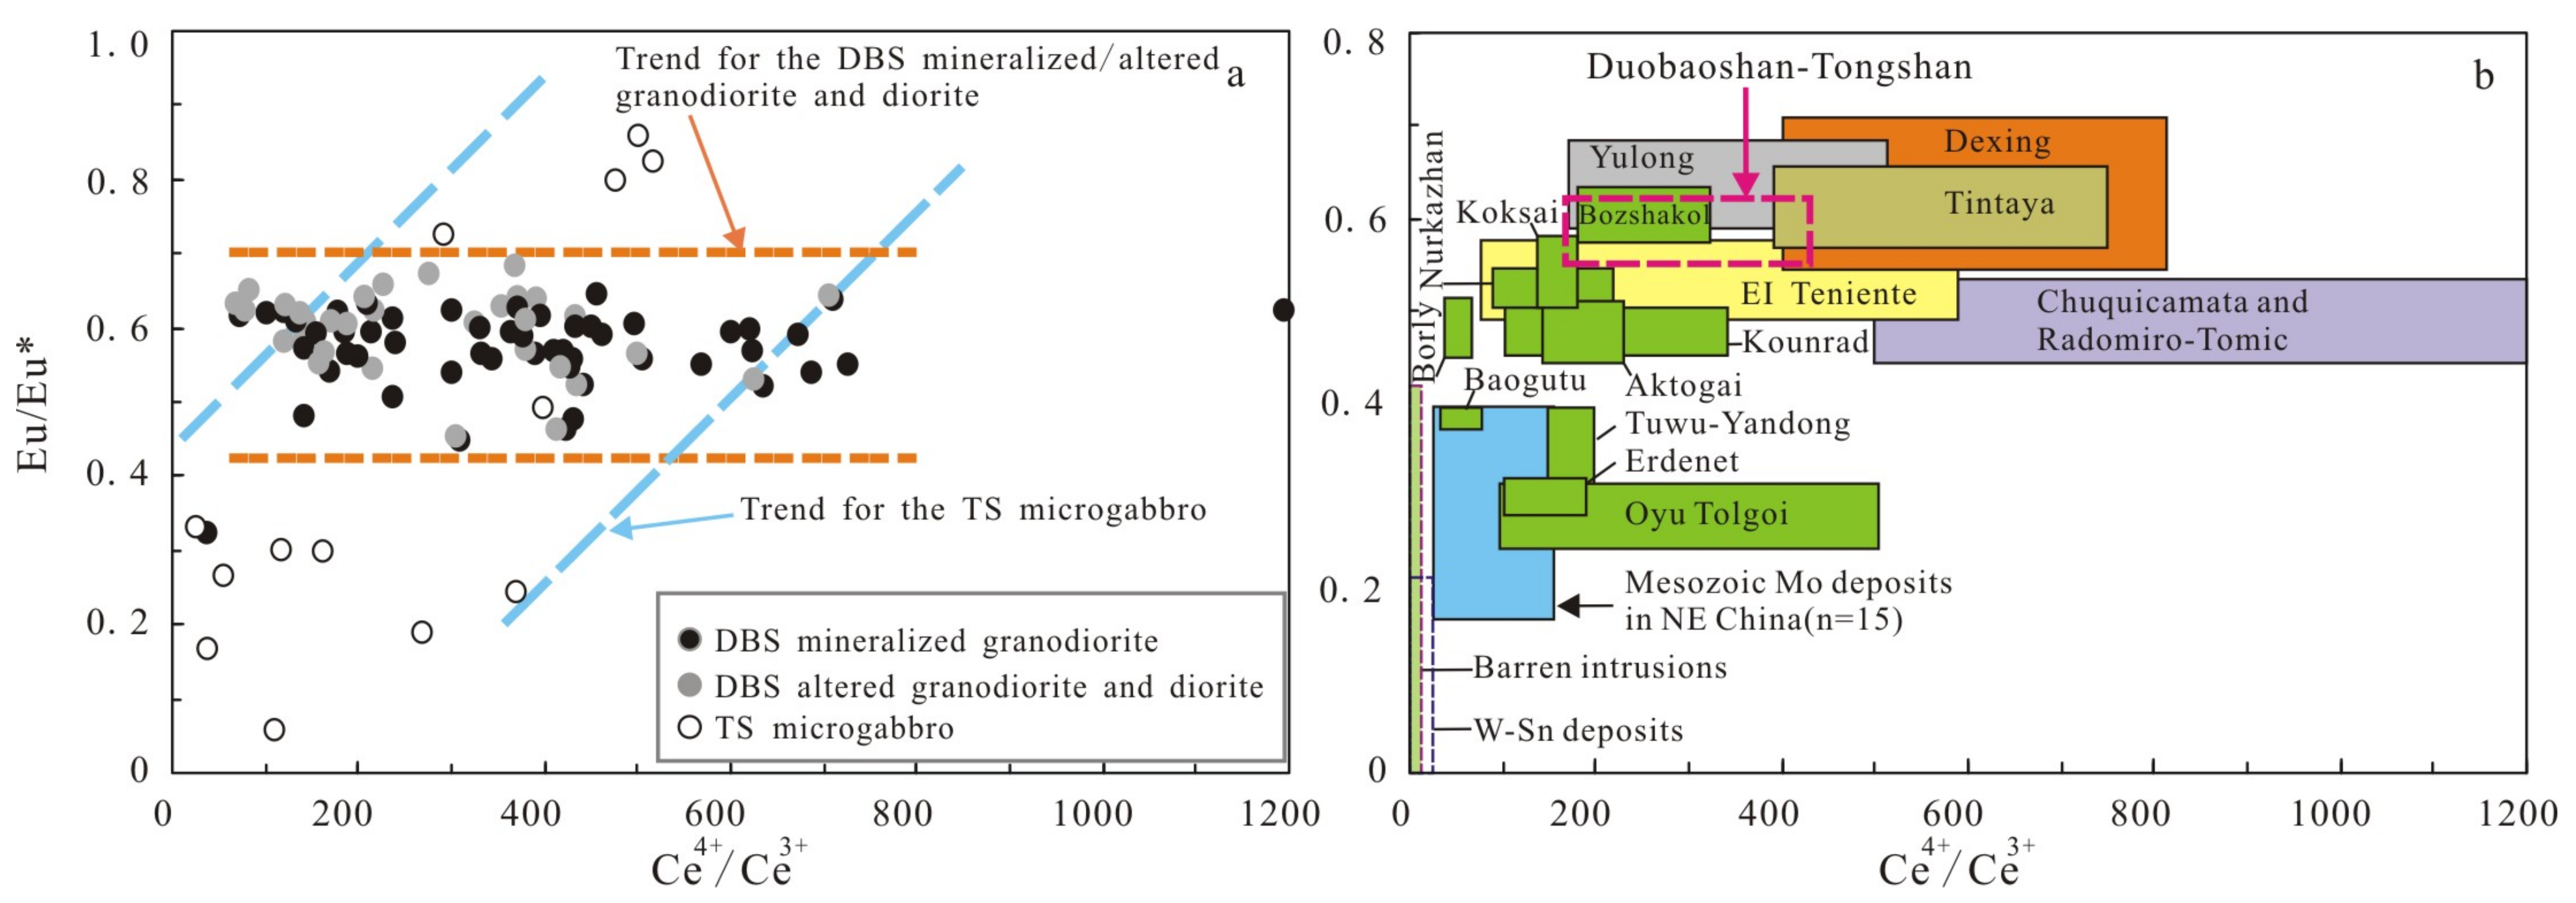
6.2.1. Cerium Anomalies in Zircon
- (1)
- Controlling factors of zircon Ce anomalies
- (2)
- Zircon Ce anomalies and fertility of intrusions
- (3)
- Zircon Ce anomalies and oxidation state of magma
6.2.2. Europium Anomaly (Eu/Eu*) and Its Controlling Factors
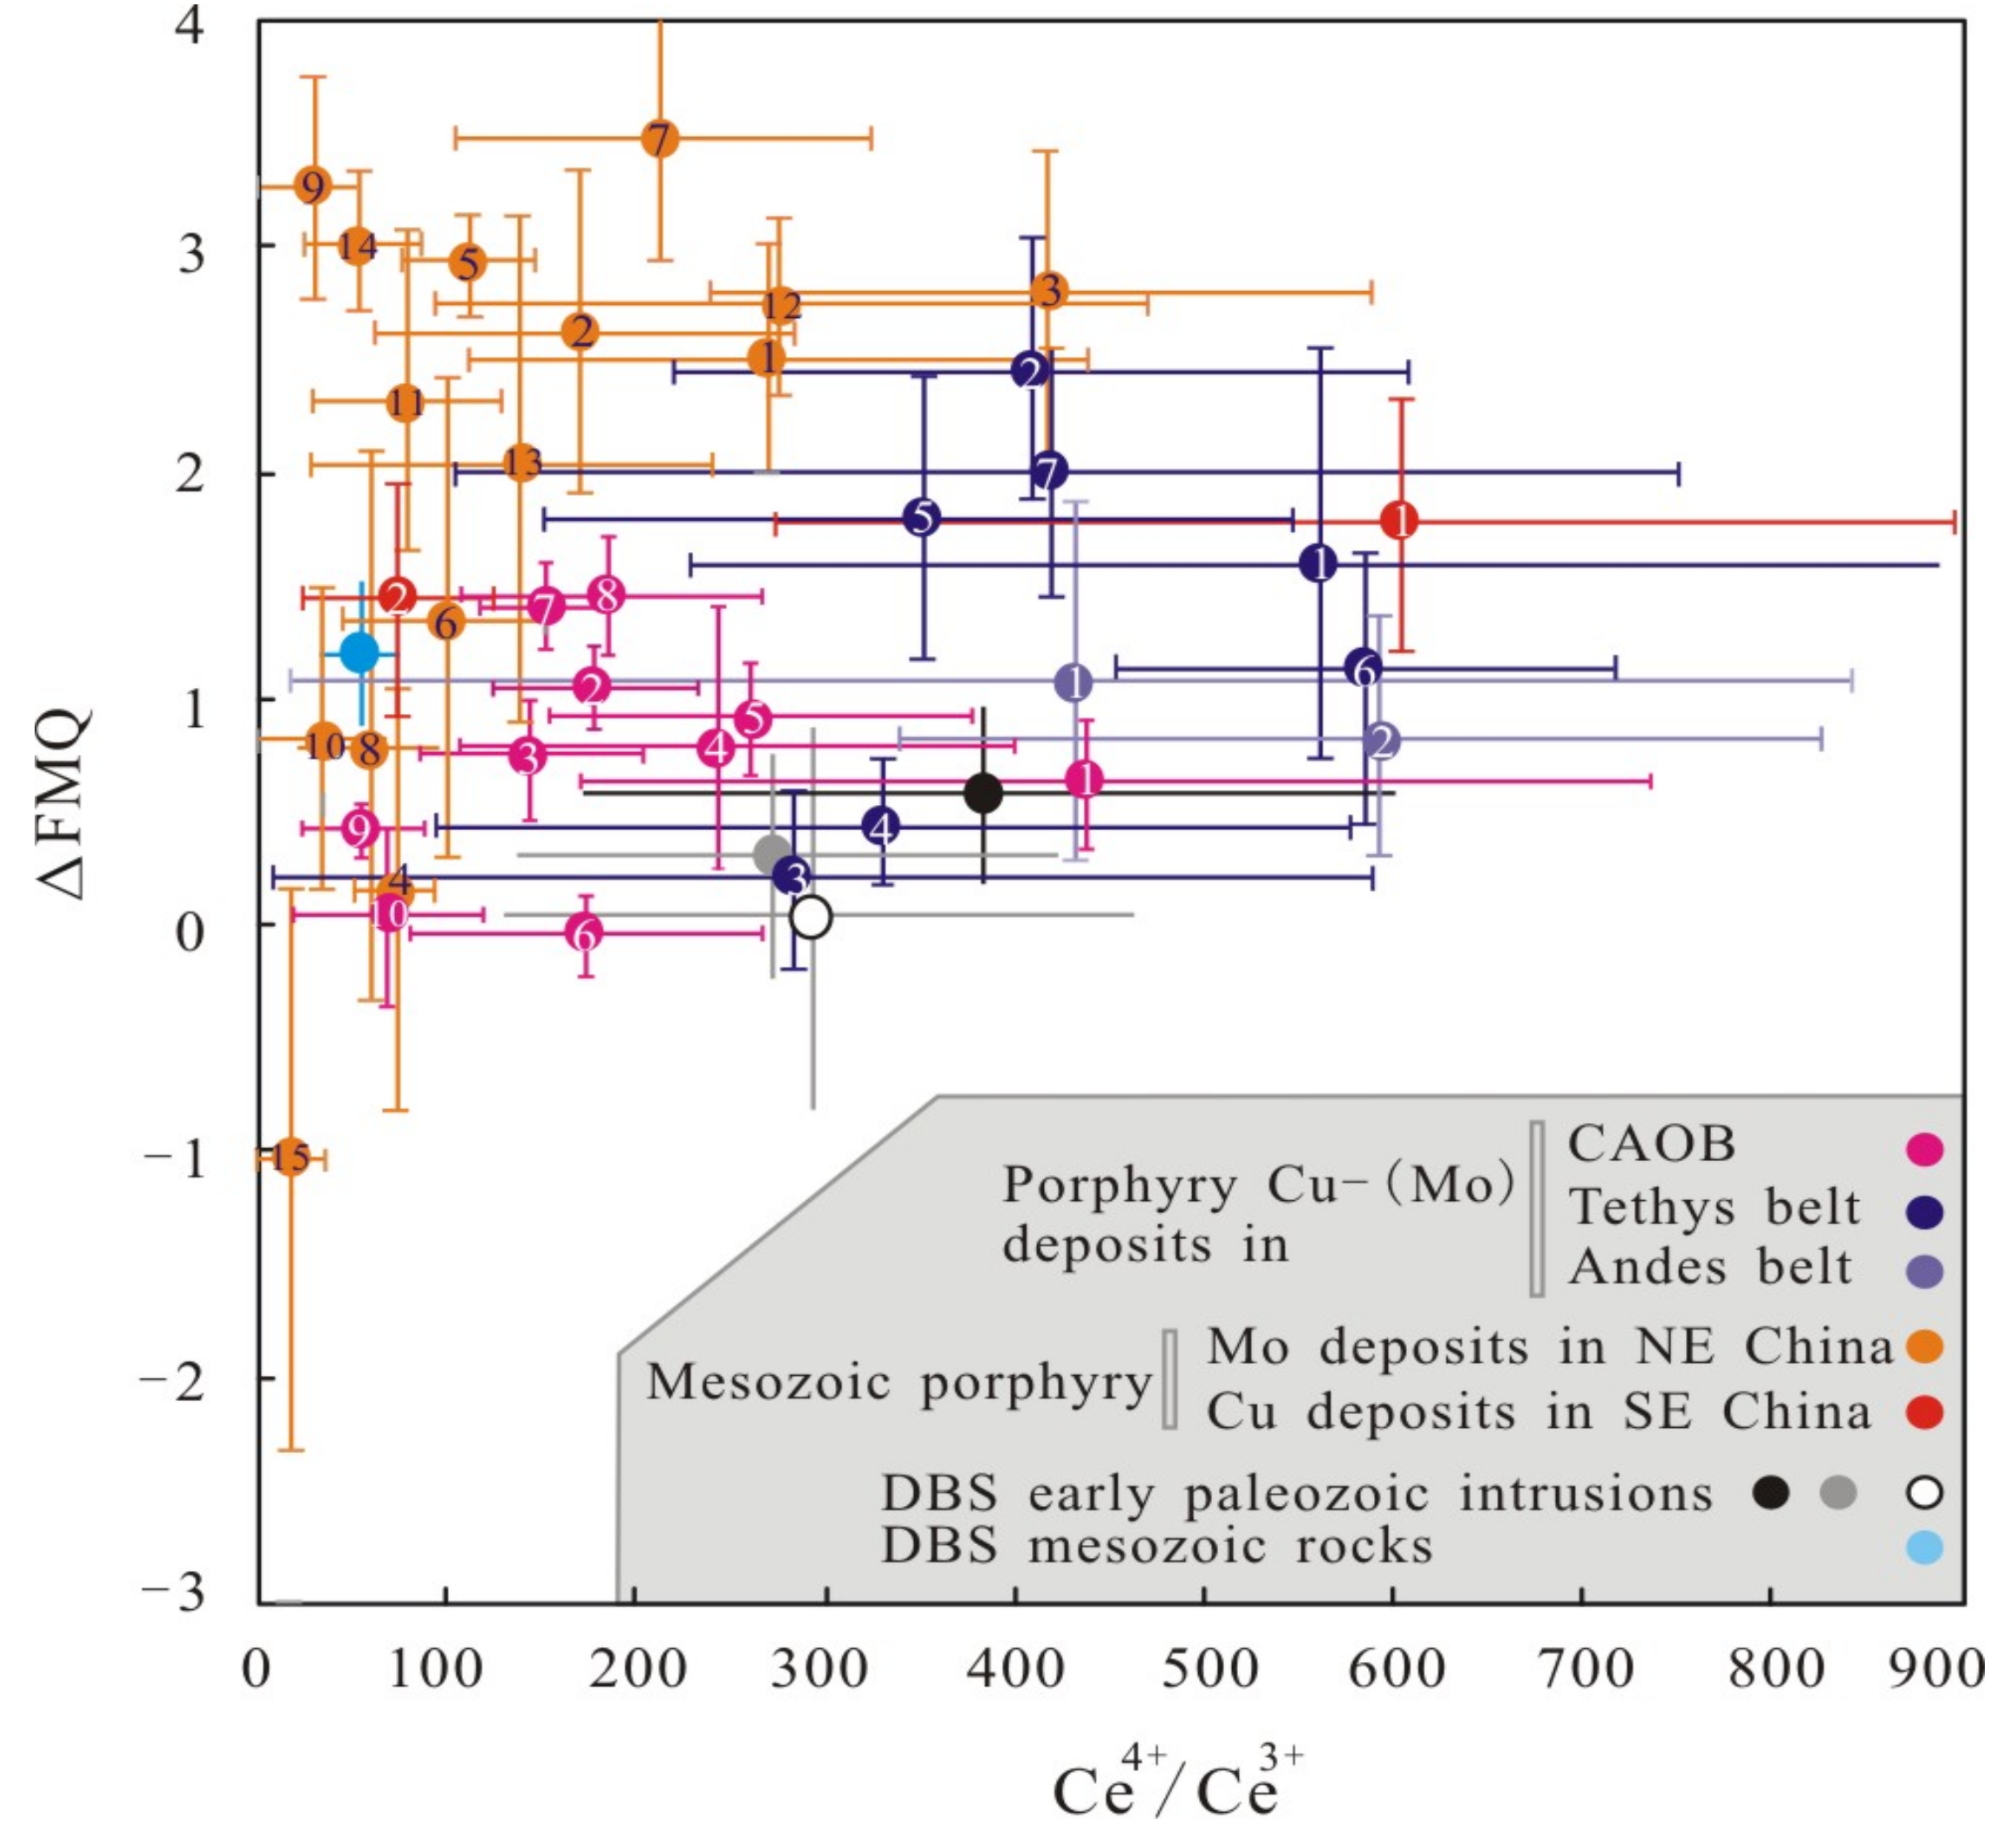
6.2.3. Values of fO2 and Implications for Magma Source and Mineralization
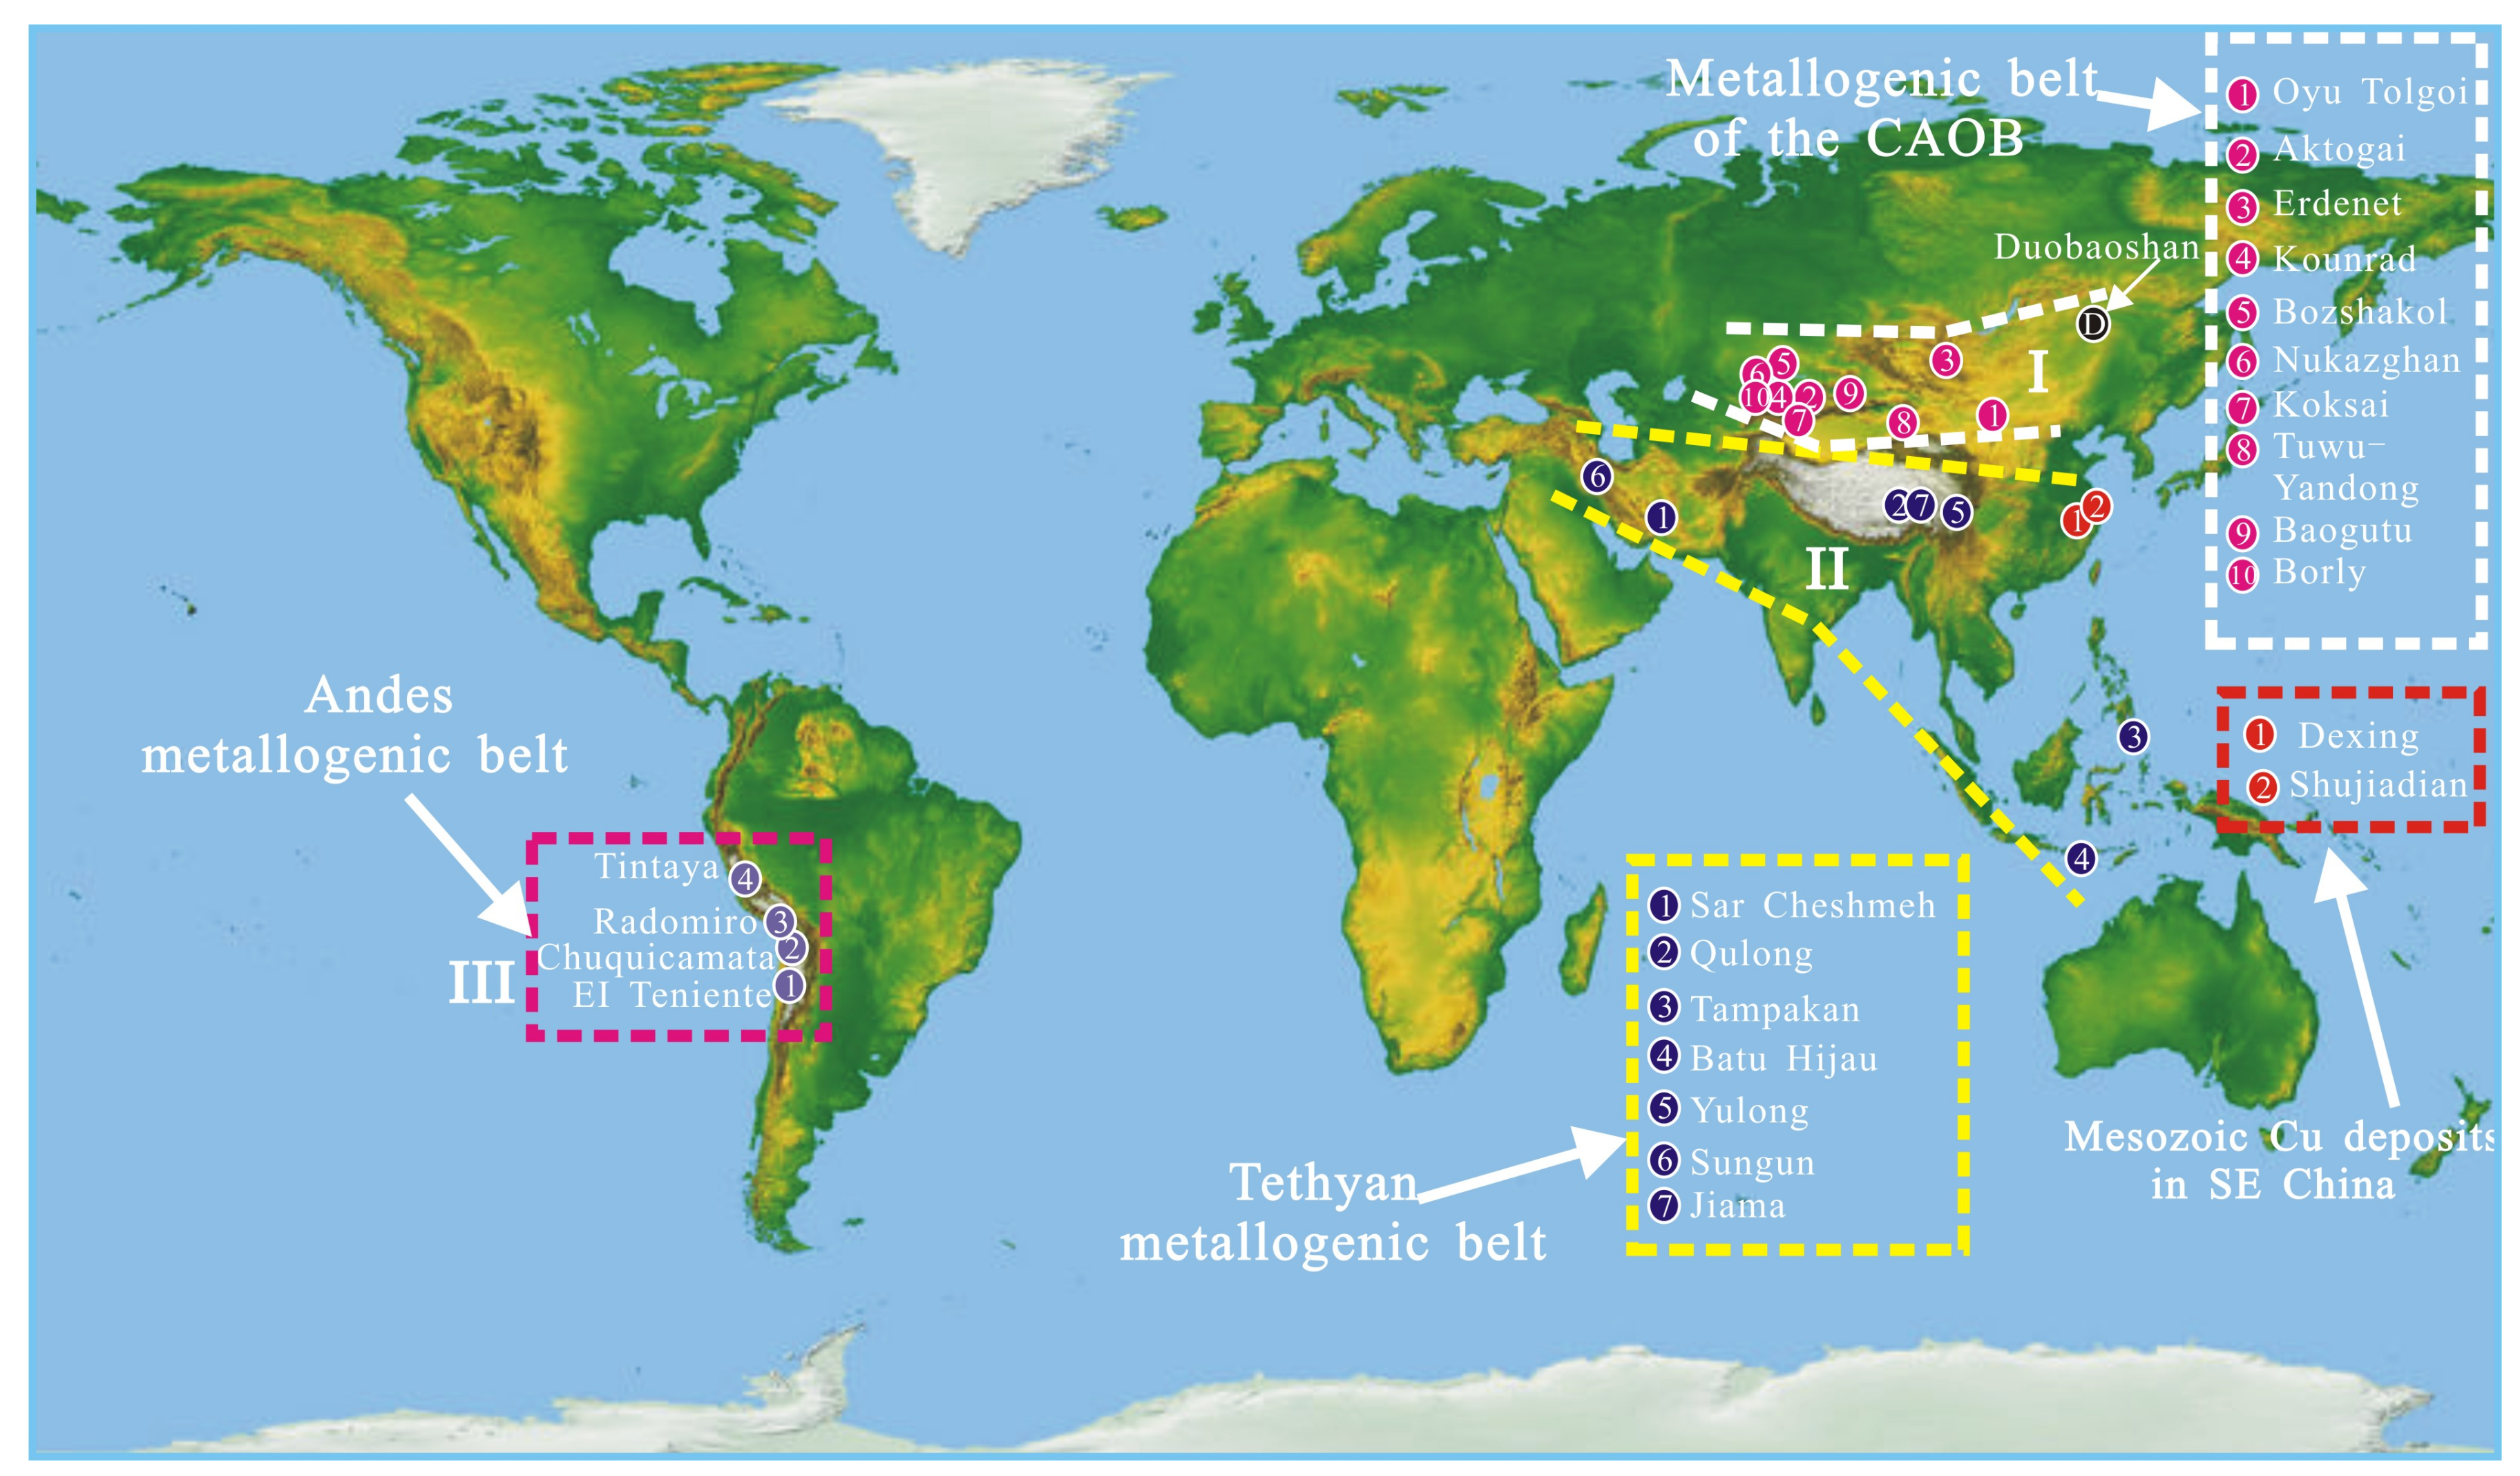
6.3. Comparison with Other Fertile Granitic Intrusions Hosting Porphyry Cu-Mo-(Au) Deposits in NE China and Elsewhere
6.3.1. Tectonic Setting and Provenance for Magmatic Zircons
6.3.2. Cerium and Eu Anomalies (Ce4+/Ce3+, Ce/Nd and Eu/Eu*) in Zircons
6.3.3. Oxidation State of Magmas
7. Conclusions
- (1)
- The DBS-TS ore-bearing intrusions were formed from water-rich magmas. The hydrous magmas formed by partial melting of a juvenile lower crust/lithospheric mantle, or metasomatized mantle wedge in a continental-arc setting during northwestward subduction of the Paleo-Asian Oceanic plate below the Xing’an block.
- (2)
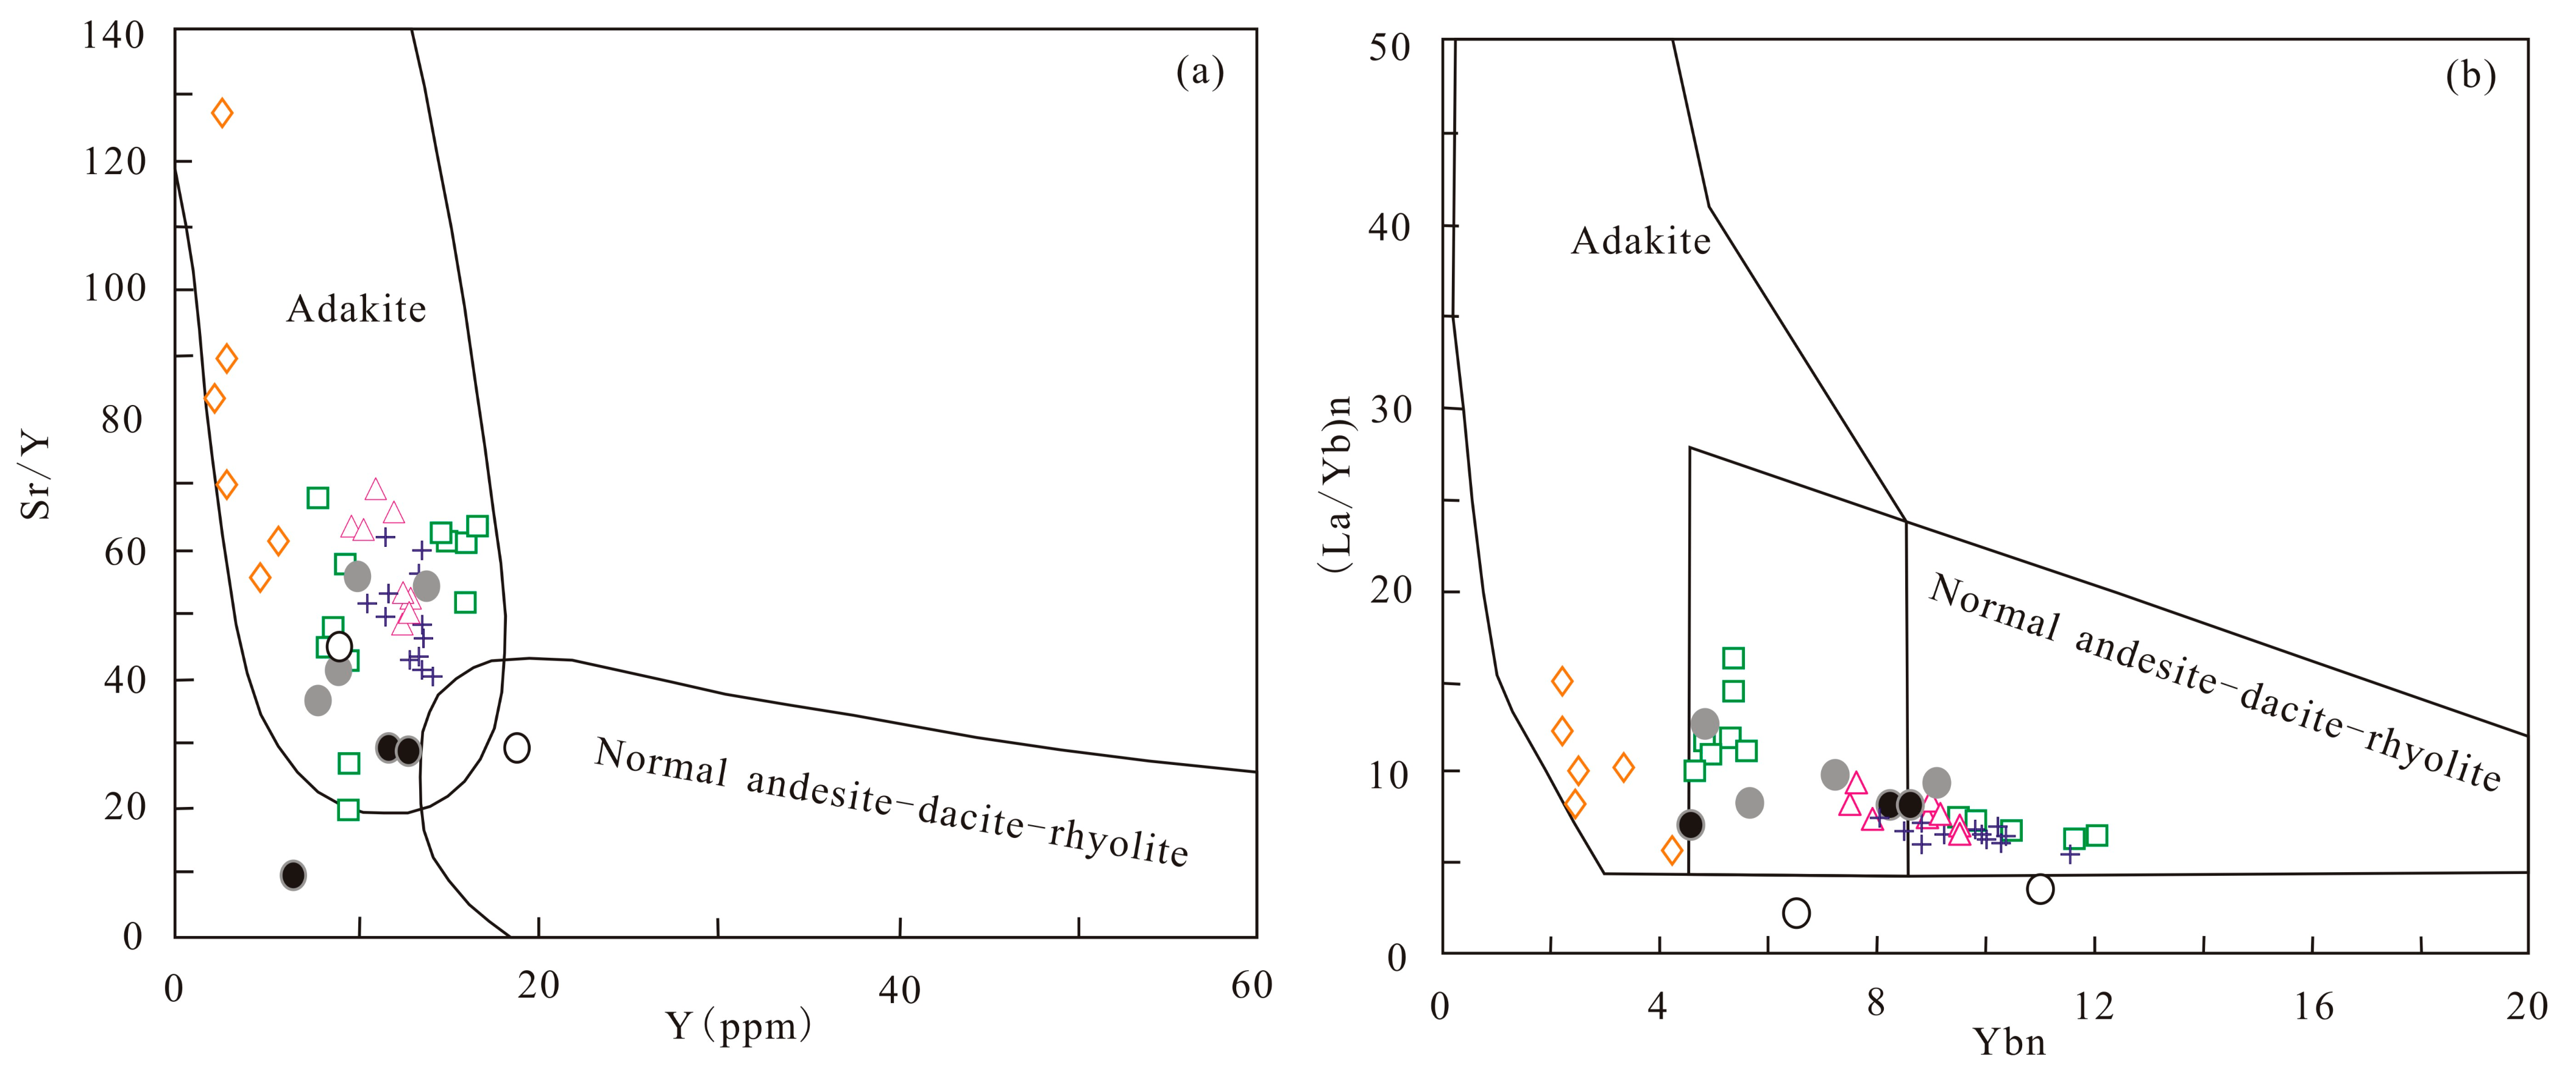
- The dioritic and granodioritic intrusions show an adakitic signature of high Sr/Y and low HREE, due to fractional crystallization of amphibole in water-rich magmas.
- (3)
- Ratios of Ce4+/Ce3+ and Ce/Nd in zircons range from 174 to 461 (mean 322 ± 203) and from 7.4 to 20.3 (mean 14.9 ± 7.8) for samples from DBS-TS deposit, which confirms a positive correlation between the two parameters.
- (4)
- The magma oxidation state is calculated to be FMQ +1.0 (±1.2) to +1.5 (±1.2) for mineralized samples and of FMQ +1.4 (±1.2) to +4.2 (±1.4) for variably altered samples using the hydrous-based equation by Smythe and Brenan [1]. The values are comparable to recalculated values using the same equation for fertile intrusions hosting the porphyry Cu-Mo-(Au) deposits in the central and western CAOB and elsewhere.
- (5)
- Although the magnitude of Ce anomalies in zircons is affected by the magmatic compositions and fractional crystallization of REE-rich minerals, positive anomalies of Ce are still associated with fertile porphyry systems. The values, however, may not be a valid fertility indicator of magmas.
Supplementary Materials
Author Contributions
Funding
Data Availability Statement
Acknowledgments
Conflicts of Interest
References
- Wu, F.Y.; Jahn, B.M.; Wilde, S.; Sun, D.Y. Phanerozoic crustal growth: U-Pb and Sr-Nd isotopic evidence from the granites in northeastern China. Tectonophysics 2000, 328, 89–113. [Google Scholar] [CrossRef]
- Wu, F.Y.; Sun, D.Y.; Li, H.M.; Jahn, B.M.; Wilde, S. A-type granites in northeastern China: Age and geochemical constraints on their petrogenesis. Chem. Geol. 2002, 187, 143–173. [Google Scholar] [CrossRef]
- Chen, Y.J.; Zhang, C.; Li, N.; Yang, Y.F.; Deng, K. Geology of the Mo deposits in Northeast China. J. Jilin Univ. 2012, 42, 1223–1268, (In Chinese with English abstract). [Google Scholar]
- Bai, L.A.; Sun, J.G.; Gu, A.L.; Zhao, K.Q.; Sun, Q.L. A review of the genesis, geochronology, and geological significance of hydrothermal copper and associated metals deposits in the Great Xing’an Range, NE China. Ore Geol. Rev. 2014, 61, 192–203. [Google Scholar] [CrossRef]
- Guo, F.; Fan, W.M.; Wang, Y.J.; Lin, G. Petrogenesis of the late Mesozoic bimodal volcanic rocks in the Southern Da Hinggan Mts, China. Acta Petrol. Sin. 2001, 17, 161–168, (In Chinese with English abstract). [Google Scholar]
- Fan, W.M.; Guo, F.; Wang, Y.J.; Lin, G. Late Mesozoic calc-alkaline volcanism of post-orogenic extension in the northern Da Hinggan mountains, Northeastern China. J. Volcanol. Geotherm. Res. 2003, 121, 115–135. [Google Scholar] [CrossRef]
- Meng, Q.R. What drove late Mesozoic extension of the northern China-Mongolia tract? Tectonophysics 2003, 69, 155–174. [Google Scholar] [CrossRef]
- Hao, Y.J.; Ren, Y.S.; Duan, M.X.; Zhao, H.L.; Tong, K.Y.; Sun, Z.M. Tectonic setting of Triassic magmatic and metallogenic event in the Duobaoshan mineralization area of Heilongjiang Province, NE China. Geol. J. 2017, 52, 67–91. [Google Scholar] [CrossRef]
- Deng, K.; Li, Q.G.; Chen, Y.J.; Zhang, C.; Zhu, X.F.; Xu, Q.W. Geochronology, geochemistry and Sr-Nd-Pb-Hf isotopes of the early Jurassic granodiorite from the Sankuanggou intrusion, Heilongjiang Province, Northeastern China: Petrogenesis and geodynamic implications. Lithos 2018, 296–299, 113–128. [Google Scholar] [CrossRef]
- Hilde, T.W.C.; Uyeda, S.; Kroenke, L. Evolution of the western Pacific and its margin. Tectonophysics 1977, 38, 145–165. [Google Scholar] [CrossRef]
- Hao, Y.J.; Ren, Y.S.; Duan, M.X.; Tong, K.Y.; Chen, C.; Yang, Q.; Li, C. Metallogenic events and tectonic setting of the Duobaoshan ore field in Heilongjiang province, NE China. J. Asian Earth Sci. 2015, 97, 442–458. [Google Scholar] [CrossRef]
- Ge, W.C.; Wu, F.Y.; Zhou, C.Y.; Zhang, J.H. Porphyry Cu-Mo deposits in the eastern Xing’an-Mongolian Orogenic belt: Mineralization ages and their geodynamic implications. Chin. Sci. Bull. 2007, 52, 3416–3427. [Google Scholar] [CrossRef]
- Wu, G.; Chen, Y.C.; Sun, F.Y.; Liu, J.; Wang, G.R.; Xu, B. Geochronology, geochemistry, and Sr-Nd-Hf isotopes of the early Paleozoic igneous rocks in the Duobaoshan area, NE China, and their geological significance. J. Asian Earth Sci. 2015, 97, 229–250. [Google Scholar] [CrossRef]
- Jahn, B.M. The central Asian orogenic belt and growth of the continental crust in the Phanerozoic. Geol. Soc. Lond. Spec. Publ. 2004, 226, 73–100. [Google Scholar] [CrossRef]
- Liu, Y.J.; Li, W.M.; Feng, Z.Q.; Wen, Q.B.; Neubauer, F.; Liang, C.Y. A review of the Paleozoic tectonics in the eastern part of Central Asian Orogenic belt. Gondwana Res. 2017, 43, 123–148. [Google Scholar] [CrossRef]
- Shen, P.; Hattori, K.; Pan, H.D.; Jackson, S.; Seitmmuratova, E. Oxidation condition and metal fertility of granitic magmas: Zircon trace-element data from porphyry Cu deposits in the Central Asian Orogenic belt. Econ. Geol. 2015, 110, 1861–1878. [Google Scholar] [CrossRef]
- Porter, T.M. The geology, structure and mineralisation of the Oyu Tolgoi porphyry copper-gold-molybdenum deposits, Mongolia: A review. Geosci. Front. 2016, 7, 375–407. [Google Scholar] [CrossRef]
- Shu, Q.H.; Chang, Z.S.; Lai, Y.; Hu, X.L.; Wu, H.Y.; Zhang, Y.; Wang, P.; Zhai, D.G.; Zhang, C. Zircon trace elements and magma fertility: Insights from porphyry (-skarn) Mo deposits in NE China. Miner. Depos. 2019, 54, 645–656. [Google Scholar] [CrossRef]
- Yin, B.C.; Ran, Q.C. The tectonic environments of metallogenesis of Duobaoshan super large copper deposit. Acta Mineral. Sin. 1997, 17, 220–224, (In Chinese with English abstract). [Google Scholar]
- Wei, R.; Xu, J.H.; Zeng, Q.D.; Wang, Y.H.; Liu, J.M.; Chu, S.X. Fluid evolution of alteration and mineralization at the Duobaoshan porphyry Cu (Mo) deposit, Heilondiang province. Acta Petrol. Sin. 2011, 27, 1361–1374, (In Chinese with English abstract). [Google Scholar]
- Liu, J.; Wu, G.; Li, Y.; Zhu, M.T.; Zhong, W. Re-Os sulfide (chalcopyrite, pyrite and molybdenite) systematics and fluid inclusion study of the Duobaoshan porphyry Cu (Mo) deposit, Heilongjiang Province, China. J. Asian Earth Sci. 2012, 49, 300–312. [Google Scholar] [CrossRef]
- Xiang, A.P.; Yang, Y.C.; Li, G.T.; She, H.Q.; Guan, J.D.; Li, J.W.; Guo, Z.J. Diagenetic and metallogenic ages of Duobaoshan porphyry Cu-Mo deposit in Heilongjiang province. Kuangchuang Dizhi 2012, 31, 1237–1248, (In Chinese with English abstract). [Google Scholar]
- Zeng, Q.D.; Liu, J.M.; Chu, S.X.; Wang, Y.B.; Sun, Y.; Duan, X.X.; Zhou, L.L.; Qu, W.J. Re-Os and U-Pb geochronology of the Duobaoshan porphyry Cu-Mo-(Au) deposit, Northeast China, and its geological significance. J. Asian Earth Sci. 2014, 79, 895–909. [Google Scholar] [CrossRef]
- Zhao, C.; Qin, K.Z.; Song, G.X.; Li, G.M.; Li, Z.Z. Petrogenesis and tectonic setting of ore-related porphyry in the Duobaoshan Cu deposit within the eastern Central Asian Orogenic belt, Heilongjiang Province, NE China. J. Asian Earth Sci. 2018, 165, 352–370. [Google Scholar] [CrossRef]
- Zhao, C.; Qin, K.Z.; Song, G.X.; Li, G.M. Switch of geodynamic setting from the Paleo-Asian ocean to the Mongol-Okhotsk ocean: Evidence from granitoids in the Duobaoshan ore field, Heilongjiang province, Northeast China. Lithos 2019, 336–337, 202–220. [Google Scholar] [CrossRef]
- Zhao, C.; Qin, K.Z.; Song, G.X.; Li, G.M.; Li, Z.Z. Early Paleozoic high-Mg basalt-andesite suite in the Duobaoshan porphyry Cu deposit, NE China: Constraints on petrogenesis, mineralization, and tectonic setting. Gondwana Res. 2019, 71, 91–116. [Google Scholar] [CrossRef]
- Wu, G.; Liu, J.; Zhong, W.; Zhu, M.T.; Mei, M.; Wan, Q. Fluid inclusion study of the Tongshan porphyry copper deposit, Heilongjiang province, China. Acta Petrol. Sin. 2009, 25, 2995–3006, (In Chinese with English abstract). [Google Scholar]
- Hu, X.L.; Yao, S.Z.; Ding, M.C. Early Paleozoic magmatism and metallogeny in Northeast China: A record from the Tongshan porphyry Cu deposit. Miner. Depos. 2017, 52, 85–103. [Google Scholar] [CrossRef]
- Hattori, K. High-sulfur magma, a product of fluid discharge from underlying mafic magma: Evidence from mount Pinatubo, Philippines. Geology 1993, 21, 1083–1086. [Google Scholar] [CrossRef]
- Sillitoe, R.H. Porphyry copper systems. Econ. Geol. 2010, 105, 3–41. [Google Scholar] [CrossRef]
- Ballard, J.R.; Palin, J.M.; Campbell, I.H. Relative oxidation states of magmas inferred from Ce(IV)/Ce(III) in zircon: Application to porphyry copper deposits of northern Chile. Contrib. Mineral. Petrol. 2002, 144, 347–364. [Google Scholar] [CrossRef]
- Liang, H.Y.; Campbell, I.H.; Allen, C.; Sun, W.D.; Liu, C.Q.; Yu, H.X.; Xie, Y.W.; Zhang, Y.Q. Zircon Ce4+/Ce3+ ratios and ages for Yulong ore-bearing porphyries in eastern Tibet. Miner. Depos. 2006, 41, 152–159. [Google Scholar] [CrossRef]
- Zou, X.; Qin, K.; Han, X.; Li, G.; Evans, N.J.; Li, Z.; Yang, W. Insight into zircon REE oxy-barometers: A lattice strain model perspective. Earth Planet. Sci. Lett. 2019, 506, 87–96. [Google Scholar] [CrossRef]
- Buret, Y.; von Quadt, A.; Heinrich, C.; Selby, D.; Waille, M.; Petcheva, I. From a long-lived upper-crustal magma chamber to rapid porphyry copper emplacement: Reading the geochemistry of zircon crystals at Bajo de la Alumbrera (NW Argentina). Earth Planet. Sci. Lett. 2016, 450, 120–131. [Google Scholar] [CrossRef]
- Buret, Y.; Wotzlaw, J.F.; Roozen, S.; Guillong, M.; von Quadt, A.; Heinrich, C.A. Zircon petrochonological evidence for a plutonic-volcanic connection in porphyry copper deposits. Geology 2017, 45, 623–626. [Google Scholar] [CrossRef]
- Lee, R.G.; Dilles, J.H.; Tosdal, R.M.; Wooden, J.L.; Mazdab, F.K. Magmatic evolution of granodiorite intrusions at the El Salvador porphyry copper deposit, Chile, based on trace element composition and U/Pb age of zircons. Econ. Geol. 2017, 112, 245–273. [Google Scholar] [CrossRef]
- Lee, R.G.; Bryne, K.; D’Angelo, M.D.; Hart, C.J.R.; Hollings, P.; Gleeson, S.A.; Alfaro, M. Using zircon trace element composition to assess porphyry copper potential of the Guichon Creek batholith and highland valley Copper deposit, South-Central British Columbia. Miner. Depos. 2021, 56, 215–238. [Google Scholar] [CrossRef]
- Zhong, S.H.; Seltmann, R.; Qu, H.Y.; Song, Y.X. Characterization of the zircon Ce anomaly for estimation of oxidation state of magmas: A revised Ce/Ce* method. Mineral. Petrol. 2019, 113, 755–763. [Google Scholar] [CrossRef]
- Large, S.J.E.; von Quadt, A.; Wotzlaw, J.-F.; Guillong, M.; Heinrich, C.A. Magma evolution leading to porphyry Au-Cu mineralization at the Ok Tedi deposit, Papua New Guinea: Trace element geochemistry and high-precision geochronology of igneous zircon. Econ. Geol. 2018, 113, 39–61. [Google Scholar] [CrossRef]
- Large, S.J.E.; Buret, Y.; Wotzlaw, J.F.; Karakas, O.; Guillong, M.; von Quadt, A.; Heinrich, C.A. Copper-mineralized porphyries sample the evolution of large-volume silicic magma reservoir from rapid assembly to solidification. Earth Planet. Sci. Lett. 2021, 563, 116877. [Google Scholar] [CrossRef]
- Olson, N.H.; Dilles, J.H.; Kent, A.J.R.; Lang, J.R. Geochemistry of the Cretaceous Kaskanak Batholith and genesis of the Pebble porphyry Cu-Au-Mo deposit, Southwest Alaska. Am. Mineral. 2017, 102, 1597–1621. [Google Scholar] [CrossRef]
- Chelle-Michou, C.; Chiaradia, M.; Ovtcharova, M.; Ulianov, A.; Wotzlaw, J.F. Zircon petrochronology reveals the temporal link between porphyry systems and the magmatic evolution of their hidden plutonic roots (the Eocene Coroccohuayco deposit, Peru). Lithos 2014, 198, 129–140. [Google Scholar] [CrossRef]
- Loader, M.A.; Wilkinson, J.J.; Armstrong, R.N. The effect of titanite crystallisation on Eu and Ce anomalies in zircon and its implications for the assessment of porphyry Cu deposit fertility. Earth Planet. Sci. Lett. 2017, 472, 107–119. [Google Scholar] [CrossRef]
- Kobylinski, C.; Hattori, K.; Smith, S.; Plouffe, A. Protracted magmatism and mineralized hydrothermal activity at the Gibraltar porphyry copper-molybdenum deposit, British Columbia. Econ. Geol. 2020, 115, 1119–1136. [Google Scholar] [CrossRef]
- Smythe, D.J.; Brenan, J.M. Cerium oxidation state in silicate melts: Combined fO2, temperature and compositional effects. Geochim. Cosmochim. Acta 2015, 170, 173–187. [Google Scholar] [CrossRef]
- Smythe, D.J.; Brenan, J.M. Magmatic oxygen fugacity estimated using zircon-melt partitioning of cerium. Earth Planet. Sci. Lett. 2016, 453, 260–266. [Google Scholar] [CrossRef]
- Loucks, R.R.; Fiorentini, M.L.; Henriquez, G.J. New magmatic oxybarometer using trace elements in zircon. J. Petrol. 2020, 61. [Google Scholar] [CrossRef]
- Hattori, K. Porphyry copper potential in Japan based on magmatic oxidation state. Resour. Geol. 2018, 68, 126–137. [Google Scholar] [CrossRef]
- Dilles, J.H.; Kent, A.J.R.; Wooden, J.L.; Tosdal, R.M.; Koleszar, A.; Lee, R.G.; Farmer, L.P. Zircon compositional evidence for sulfur-degassing from ore-forming arc magmas. Econ. Geol. 2015, 110, 241–251. [Google Scholar] [CrossRef]
- Sengör, A.M.C.; Natal’in, B.A.; Burtman, V.S. Evolution of the Altaid tectonic collage and Paleozoic crustal growth in Eurasia. Nature 1993, 364, 299–307. [Google Scholar] [CrossRef]
- Windley, B.F.; Alexeiev, D.; Xiao, W.J.; Kröner, A.; Badarch, G. Tectonic model for accretion of the Central Asian Orogenic belt. J. Geol. Soc. Lond. 2007, 164, 31–47. [Google Scholar] [CrossRef]
- Kröner, A.; Kovach, V.; Belousova, E.; Hegner, E.; Armstrong, R.; Dolgopolova, A.; Seltmann, R.; Alexeiev, D.V.; Hoffmann, J.E.; Wong, J.; et al. Reassessment of continental growth during the accretionary history of the Central Asian Orogenic belt. Gondwana Res. 2014, 25, 103–125. [Google Scholar] [CrossRef]
- Xiao, W.J.; Windley, B.F.; Sun, S.; Li, J.L.; Huang, B.C.; Han, C.M.; Yuan, C.; Sun, M.; Chen, H.L. A tale of amalgamation of three Permo-Triassic collage systems in Central Asia: Oroclines, sutures, and terminal accretion. Annu. Rev. Earth Planet. Sci. 2015, 43, 477–507. [Google Scholar] [CrossRef]
- Meng, E.; Xu, W.L.; Pei, F.P.; Yang, D.B. Detrital-zircon geochronology of late Paleozoic sedimentary rocks in eastern Heilongjiang Province, NE China: Implications for the tectonic evolution of the eastern segment of the Central Asian Orogenic belt. Tectonophysics 2010, 485, 42–51. [Google Scholar] [CrossRef]
- Wu, F.Y.; Sun, D.Y.; Ge, W.C.; Zhang, Y.B.; Grant, M.L.; Wilde, S.A.; Jahn, B.M. Geochronology of the Phanerozoic granitoids in Northeastern China. J. Asian Earth Sci. 2011, 41, 1–30. [Google Scholar] [CrossRef]
- Cao, H.H.; Xu, W.L.; Pei, F.P.; Wang, Z.W.; Wang, F.; Wang, Z.J. Zircon U-Pb geochronology and petrogenesis of the late Paleozoic-early Mesozoic intrusive rocks in the eastern segment of the northern margin of the North China block. Lithos 2013, 170–171, 191–207. [Google Scholar] [CrossRef]
- Tang, J.; Xu, W.L.; Wang, F.; Wang, W.; Xu, M.J.; Zhang, Y.H. Geochronology and geochemistry of Neoproterozoic magmatismin the Erguna massif, NE China: Petrogenesis and implications for the breakup of the Rodinia supercontinent. Precambrian Res. 2013, 224, 597–611. [Google Scholar] [CrossRef]
- Li, Y.; Xu, W.L.; Wang, F.; Tang, J.; Pei, F.P.; Wang, Z.J. Geochronology and geochemistry of late Paleozoic volcanic rocks on the western margin of the Songnen-Zhangguangcai range massif, NE China: Implications for the amalgamation history of the Xing’an and Songnen-Zhangguangcai range massifs. Lithos 2014, 205, 394–410. [Google Scholar] [CrossRef]
- Shen, P.; Pan, H.D.; Hattori, K.; David, R.C.; Seitmuratova, E. Large Paleozoic and Mesozoic porphyry deposits in the Central Asian Orogenic belt: Geodynamic settings, magmatic sources, and genetic models. Gondwana Res. 2018, 58, 161–194. [Google Scholar] [CrossRef]
- Bai, L.A.; Sun, J.G.; Yong, Z.; Han, S.J.; Yang, F.C.; Men, L.J. Genetic type, mineralization epoch and geodynamical setting of endogenous copper deposits in the Great Xing’an Range. Acta Petrol. Sin. 2012, 28, 468–482, (In Chinese with English abstract). [Google Scholar]
- Yakubchuk, A.; Degtyarev, K.; Maslennikov, V.; Wurst, A.; Stekhin, A.; Lobanov, K. Tectonomagmatic settings, architecture, and metallogeny of the Central Asian copper province. Soc. Econ. Geol. Spec. Publ. 2012, 16, 403–432. [Google Scholar]
- Jochum, K.P.; Weis, U.; Stoll, B.; Kuzmin, D.; Yang, Q.; Raczek, I.; Gunther, D. Determination of reference values for NIST SRM 610–617 glasses following ISO guidelines. Geostand. Geoanal. Res. 2011, 35, 397–429. [Google Scholar] [CrossRef]
- Griffin, W.L.; Powell, W.J.; Pearson, N.J.; O’Reilly, S.Y. GLITTER: Data reduction software for laser ablation ICP-MS. Laser ablation-ICP-MS in the Earth sciences. Mineral. Assoc. Can. Short Course Ser. 2008, 40, 204–207. [Google Scholar]
- Jackson, S.E.; Dube, B.; Chapman, J.; Gao, J.F. Applications of LA-ICP-MS element mapping in mineral deposit research and exploration: Mineral deposit research for a high-tech world. In Proceedings of the 12th SGA Biennial Meeting, Uppsala, Sweden, 12–15 August 2013; Volume 1, pp. 201–204. [Google Scholar]
- Middlemost, E.A.K. Naming materials in the magma/igneous rock system. Earth Sci. Rev. 1994, 37, 215–224. [Google Scholar] [CrossRef]
- Du, Q.; Ma, X.Y.; Han, C.M.; Jiang, X.L. Genetic Discussion on Porphyry Copper Deposit; Geological Publishing House: Beijing, China, 2008. (In Chinese) [Google Scholar]
- Peccerillo, A.; Taylor, S.R. Geochemistry of Eocene calc-alkaline volcanic rocks from the Kastamonu area, Northern Turkey. Contrib. Mineral. Petrol. 1976, 58, 68–81. [Google Scholar] [CrossRef]
- Defant, M.J.; Drummond, M.S. Derivation of some modern arc magmas by melting of young subducted lithosphere. Nature 1990, 347, 662–665. [Google Scholar] [CrossRef]
- McDonough, W.; Sun, S. The composition of the Earth. Chem. Geol. 1995, 120, 223–253. [Google Scholar] [CrossRef]
- Ferry, J.M.; Watson, E.B. New thermodynamic models and revised calibrations for the Ti-in-zircon and Zr-in-rutile thermometers. Contrib. Mineral. Petrol. 2007, 154, 429–437. [Google Scholar] [CrossRef]
- Hayden, L.A.; Watson, E.B. Rutile saturation in hydrous siliceous melts and its bearing on Ti thermometry of quartz and zircon. Earth Planet. Sci. Lett. 2007, 258, 561–568. [Google Scholar] [CrossRef]
- Fu, B.; Page, F.Z.; Cavosie, A.J.; Clechenko, C.C.; Fournelle, J.; Kita, N.T.; Lackey, J.S.; Wilde, S.A.; Valley, J.W. Ti-in-zircon thermometry: Applications and limitations. Contrib. Mineral. Petrol. 2008, 156, 197–215. [Google Scholar] [CrossRef]
- Watson, E.B.; Harrison, T.M. Zircon saturation revisited: Temperature and composition effects in a variety of crustal magma types. Earth Planet. Sci. Lett. 1983, 64, 295–304. [Google Scholar] [CrossRef]
- Trail, D.; Watson, E.B.; Tailby, N.D. Ce and Eu anomalies in zircon as proxies for the oxidation state of magmas. Geochim. Cosmochim. Acta 2012, 97, 70–87. [Google Scholar] [CrossRef]
- Ridolfi, F.; Renzulli, A.; Puerini, M. Stability and chemical equilibrium of amphibole in calc-alkaline magmas: An overview, new thermobarometric formulations and application to subduction-related volcanoes. Contrib. Mineral. Petrol. 2010, 160, 45–66. [Google Scholar] [CrossRef]
- Blundy, J.; Wood, B. Prediction of crystal-melt partition coefficients from elastic moduli. Nature 1994, 372, 452–454. [Google Scholar] [CrossRef]
- Garwin, S.L. The Setting, Geometry and Timing of Intrusion-Related Hydrothermal Systems in the Vicinity of the Batu Hijau Porphyry Copper-Gold Deposit, Sumbawa, Indonesia. Ph.D. Thesis, University of Western Australia, Nedlands, Australia, 2000; p. 320. [Google Scholar]
- Rohrlach, B.D.; Loucks, R.R. Multi-million-year cyclic ramp-up of volatiles in a lower crustal magma reservoir trapped below the Tampakan copper-gold deposit by Mio-Pliocene crustal compression in the southern Philippines. In Super Porphyry Copper and Gold Deposits—A Global Perspective; Porter, T.M., Ed.; PCG Publishing: Adelaide, Australia, 2005; Volume 2, pp. 369–407. [Google Scholar]
- Holtz, F.; Johannes, W.; Tamic, N.; Behrens, H. Maximum and minimum water contents of granitic melts generated in the crust: A re-evaluation and implications. Lithos 2001, 56, 1–14. [Google Scholar] [CrossRef]
- Miao, L.C.; Fan, W.M.; Zhang, F.Q.; Liu, D.Y.; Jian, P.; Shi, G.H.; Tao, H.; Shi, Y.R. Zircon SHRIMP geochronology of the Xinkailing-Kele complex in the northwestern lesser Xing’an range, and its geological implications. Chin. Sci. Bull. 2004, 49, 201–209. [Google Scholar] [CrossRef]
- Zhou, M.F.; Zhang, H.F.; Robinson, P.T.; Malpas, J. Comments on “Petrology of the Hegenshan ophiolite and its implication for the tectonic evolution of northern China” by T. Nozaka and Y. Liu [Earth Planet. Sci. Lett. 202 (2002) 89–104]. Earth Planet. Sci. Lett. 2004, 217, 207–210. [Google Scholar] [CrossRef]
- Grimes, C.B.; Wooden, J.L.; Cheadle, M.J.; John, B.E. “Fingerprinting” tectono-magmatic provenance using trace elements in igneous zircon. Contrib. Mineral. Petrol. 2015, 170, 46. [Google Scholar] [CrossRef]
- Grimes, C.B.; John, B.E.; Kelemen, P.B.; Mazdab, F.; Wooden, J.L.; Cheadle, M.J.; Hanghøj, K.; Schwartz, J.J. The trace element chemistry of zircons from oceanic crust: A method for distinguishing detrital zircon provenance. Geology 2007, 35, 643–646. [Google Scholar] [CrossRef]
- Gao, S.; Rudnick, R.L.; Yuan, H.L.; Liu, X.M.; Liu, Y.S.; Xu, W.L.; Ling, W.L.; Ayers, J.; Wang, X.C.; Wang, Q.H. Recycling lower continental crust in the North China craton. Nature 2004, 432, 892–897. [Google Scholar] [CrossRef]
- Chung, S.L.; Liu, D.Y.; Ji, J.Q.; Chu, M.F.; Lee, H.Y.; Wen, D.R.; Lo, C.H.; Lee, T.Y.; Qian, Q.; Zhang, Q. Adakites from continental collision zones: Melting of thickened lower crust beneath southern Tibet. Geology 2003, 31, 1021–1024. [Google Scholar] [CrossRef]
- Guan, Q.; Zhu, D.C.; Zhao, Z.D.; Dong, G.C.; Zhang, L.L.; Li, X.W.; Liu, M.; Mo, X.X.; Liu, Y.S.; Yuan, H.L. Crustal thickening prior to 38Ma in southern Tibet: Evidence from lower crust-derived adakitic magmatism in the Gangdese batholith. Gondwana Res. 2012, 21, 88–99. [Google Scholar] [CrossRef]
- Long, X.P.; Wilde, S.A.; Wang, Q.; Yuan, C.; Wang, X.C.; Li, J.; Dan, W. Partial melting of thickened continental crust in central Tibet: Evidence from geochemistry and geochronology of Eocene adakitic rhyolites in the Northern Qiangtang terrane. Earth Planet. Sci. Lett. 2015, 414, 30–44. [Google Scholar] [CrossRef]
- Richards, J.P.; Kerrich, R. Adakite-like rocks: Their diverse origins and questionable role in metallogenesis. Econ. Geol. 2007, 102, 537–576. [Google Scholar] [CrossRef]
- Wang, R.; Richards, J.P.; Hou, Z.Q.; Yang, Z.M.; DuFrane, S.A. Increased magmatic water content—The key to Oligo-Miocene porphyry Cu-Mo ± Au formation in the eastern Gangdese belt, Tibet. Econ. Geol. 2014, 195, 1315–1339. [Google Scholar] [CrossRef]
- Lu, Y.J.; Loucks, R.R.; Fiorentini, M.L.; Yang, Z.M.; Hou, Z.Q. Fluid flux melting generated post-collisional high Sr/Y copper ore-forming water-rich magmas in Tibet. Geology 2015, 43, 583–586. [Google Scholar] [CrossRef]
- Wang, J.; Hattori, K.; Liu, J.G.; Song, Y.; Gao, Y.B.; Zhang, H. Shoshonitic- and adakitic magmatism of the early Paleozoic age in the western Kunlun orogenic belt, NW China: Implications for the early evolution of the northwestern Tibetan plateau. Lithos 2017, 286–287, 345–362. [Google Scholar] [CrossRef]
- Wang, Q.; Wyman, D.A.; Xu, J.F.; Zhao, Z.H.; Jian, P.; Xiong, X.L.; Bao, Z.W.; Li, C.F.; Bai, Z.H. Petrogenesis of Cretaceous adakitic and shoshonitic igneous rocks in the Luzong area, Anhui province (Eastern China): Implications for geodynamics and Cu-Au mineralization. Lithos 2006, 89, 424–446. [Google Scholar] [CrossRef]
- Rollinson, H. Using Geochemical Data: Evaluation, Presentation, Interpretation; Longman: Harlow, UK, 1993; p. 352. [Google Scholar]
- Sisson, T.W. Hornblende-melt trace-element partitioning measured by ion microprobe. Chem. Geol. 1994, 117, 331–344. [Google Scholar] [CrossRef]
- Moore, G.; Carmichael, I.S.E. The hydrous phase equilibria (to 3 kbar) of an andesite and basaltic andesite from Western Mexico: Constraints on water content and conditions of phenocryst growth. Contrib. Mineral. Petrol. 1998, 130, 304–319. [Google Scholar] [CrossRef]
- Bachmann, O.; Dungan, M.A.; Bussy, F. Insights into shallow magmatic processes in large silicic magma bodies: The trace element record in the Fish canyon magma body, Colorado. Contrib. Mineral. Petrol. 2005, 149, 38–349. [Google Scholar] [CrossRef]
- Prowatke, S.; Klemme, S. Trace element partitioning between apatite and silicate melts. Geochim. Cosmochim. Acta 2006, 70, 4513–4527. [Google Scholar] [CrossRef]
- Viala, M.; Hattori, K. Hualgayoc mining district, northern Peru: Testing the use of zircon composition in exploration for porphyry-type deposits. J. Geochem. Explor. 2021, 223, 106725. [Google Scholar] [CrossRef]
- Richards, J.P. Giant ore deposits formed by optimal alignments and combinations of geological processes. Nat. Geosci. 2013, 6, 911–916. [Google Scholar] [CrossRef]
- Wainwright, A.J.; Tosdal, R.M.; Wooden, J.L.; Mazdab, F.K.; Friedman, R.M. U-Pb (zircon) and geochemical constraints on the age, origin, and evolution of Paleozoic arc magmas in the Oyu Tolgoi porphyry Cu-Au district, southern Mongolia. Gondwana Res. 2011, 19, 764–787. [Google Scholar] [CrossRef]
- Chelle-Michou, C.; Chiaradia, M.; Béguelin, P.; Ulianov, A. Petrological evolution of the magmatic suite associated with the coroccohuayco Cu (-Au-Fe) porphyry-skarn deposit, Peru. J. Petrol. 2015, 56, 1829–1862. [Google Scholar] [CrossRef]
- Wang, G.G.; Ni, P.; Yao, J.; Wang, X.L.; Zhao, K.D.; Zhu, R.Z.; Xu, Y.F.; Pan, J.Y.; Li, L.; Zhang, Y.H. The link between subduction-modified lithosphere and the giant Dexing porphyry copper deposit, South China: Constraints from high-Mg adakitic rocks. Ore Geol. Rev. 2015, 67, 109–126. [Google Scholar] [CrossRef]
- Jiang, Y.H.; Jiang, S.Y.; Ling, H.F.; Dai, B.Z. Low-degree melting of a metasomatized lithospheric mantle for the origin of Cenozoic Yulong monzogranite-porphyry, east Tibet: Geochemical and Sr-Nd-Pb-Hf isotopic constraints. Earth Planet. Sci. Lett. 2006, 241, 617–633. [Google Scholar] [CrossRef]
- Li, J.X.; Qin, K.Z.; Li, G.M.; Cao, M.J.; Xiao, B.; Chen, L.; Zhao, J.X.; Evans, N.J.; McInnes, B.I.A. Petrogenesis and thermal history of the Yulong porphyry copper deposit, Eastern Tibet: Insights from U-Pb and U-Th/He dating, and zircon Hf isotope and trace element analysis. Mineral. Petrol. 2012, 105, 201–221. [Google Scholar] [CrossRef]
- Cooke, D.R.; Hollings, P.; Walshe, J.L. Giant porphyry deposits: Characteristics, distribution, and tectonic controls. Econ. Geol. 2005, 100, 801–818. [Google Scholar] [CrossRef]
- Muñoz, M.; Charrier, R.; Fanning, C.M.; Maksaev, V.; Deckart, K. Zircon trace element and O-Hf isotope analyses of mineralized intrusions from El Teniente ore deposit, Chilean Andes: Constraints on the source and magmatic evolution of porphyry Cu-Mo related magmas. J. Petrol. 2012, 53, 1091–1122. [Google Scholar] [CrossRef]
- Nardi, L.V.S.; Formoso, M.L.L.; Jarvis, K.; Oliveira, L.; Nato, A.C.B.; Fontana, E. REE, Y, Nb, U and Th contents and tetrad effect in zircon from a magmatic-hydrothermal F-rich system of Sn-rare metal-cryolite mineralized granites from the Pitinga mine, Amazonia, Brazil. J. S. Am. Sci. 2012, 33, 34–42. [Google Scholar] [CrossRef]
- Belousova, E.A.; Griffin, W.L.; O’Reilly, S.Y.; Fisher, N.I. Igneous zircon: Trace element compositions as an indicator of source rock type. Contrib. Mineral. Petrol. 2002, 143, 602–622. [Google Scholar] [CrossRef]
- Lu, Y.J.; Loucks, R.R.; Fiorentini, M.L.; McCuaig, T.C.; Evans, N.J.; Yang, Z.M.; Hou, Z.Q.; Kirkland, C.L.; Parra-Avila, L.A.; Kobussen, A. Zircon composition as a pathfinder for porphyry Cu ± Mo ± Au deposits in tectonics and metallogeny of the Tethyan Orogenic belt. Soc. Econ. Geol. 2016, 19, 329–347. [Google Scholar]
- Wones, D.R. Significance of the assemblage titanite + magnetite + quartz in granitic rocks. Am. Mineral. 1989, 74, 744–749. [Google Scholar]
- Hattori, K.; Keith, J.D. Contribution of mafic melt to porphyry copper mineralization: Evidence from mount Pinatubo, Philippines, and Bingham canyon, Utah, USA. Miner. Depos. 2001, 36, 799–806. [Google Scholar] [CrossRef]
- DeHoog, J.C.M.; Hattori, K.H.; Hoblitt, R.P. Oxidized sulfur-rich mafic magma at mount Pinatubo, Philippines. Contrib. Mineral. Petrol. 2004, 146, 750–761. [Google Scholar] [CrossRef]
- Wang, J.; Hattori, K.H.; Kilian, R.; Stern, C.R. Metasomatism of sub-arc mantle peridotites below southern South America: Reduction of fO2 by slab-melt. Contrib. Mineral. Petrol. 2007, 153, 607–624. [Google Scholar] [CrossRef]
- Wood, B.J.; Bryndzia, L.T.; Johnson, K.E. Mantle oxidation state and its relationship to tectonic environment and fluid speciation. Science 1990, 248, 337–345. [Google Scholar] [CrossRef]
- Ballhaus, C. Redox states of lithospheric and asthenospheric upper mantle. Contrib. Mineral. Petrol. 1993, 114, 331–348. [Google Scholar] [CrossRef]
- Arai, S.; Ishimaru, S. Insights into petrological characteristics of the lithosphere of mantle wedge beneath Arcs through peridotite xenoliths: A review. J. Petrol. 2008, 49, 665–695. [Google Scholar] [CrossRef]
- Wang, J.; Hattori, K.; Xie, Z.P. Oxidation state of lithospheric mantle along the northeastern margin of the North China craton: Implications for geodynamic processes. Int. Geol. Rev. 2013, 55, 1418–1444. [Google Scholar] [CrossRef]
- Candela, P.A. Controls on ore metal ratios in granitoid-related ore systems: An experimental and computational approach. Trans. R. Soc. Edinb. Earth Sci. 1992, 83, 317–326. [Google Scholar]
- Field, C.W.; Zhang, L.; Dilles, J.H.; Rye, R.O.; Reed, M.H. Sulfur and oxygen isotopes of pre-main stage porphyry Cu-Mo and late shallow main stage base mineral deposits, Butte district, Montana. Chem. Geol. 2005, 215, 61–93. [Google Scholar] [CrossRef]
- Rye, R.O. A review of the stable-isotope geochemistry of sulfate minerals in selected igneous environments and related hydrothermal systems. Chem. Geol. 2005, 215, 5–36. [Google Scholar] [CrossRef]
- Chambefort, I.; Dilles, J.H.; Kent, A.J.R. Anhydrite-bearing andesite and dacite as a source for sulfur in magmatic-hydrothermal mineral deposits. Geology 2008, 36, 719–722. [Google Scholar] [CrossRef]
- Chambefort, I.; Dilles, J.H.; Longo, A.A. Amphibole geochemistry of the Yanacocha volcanics, Peru: Evidence for diverse sources of magmatic volatiles related to gold ores. J. Petrol. 2013, 54, 1017–1046. [Google Scholar] [CrossRef]
- Loucks, R.R. Distinctive composition of copper-ore-forming arc magmas. Aust. J. Earth Sci. 2014, 61, 5–16. [Google Scholar] [CrossRef]
- Richards, J.P. The oxidation state, and sulfur and Cu contents of arc magmas: Implications for metallogeny. Lithos 2015, 233, 27–45. [Google Scholar] [CrossRef]
- Carroll, M.K.; Rutherford, M.J. Sulfur speciation in hydrous experimental glasses of varying oxidation state-results from measured wavelength shifts of sulfur X-rays. Am. Mineral. 1988, 73, 845–849. [Google Scholar]
- Hedenquist, J.W.; Lowenstern, J.B. The role of magmas in the formation of hydrothermal ore deposits. Nature 1994, 370, 519–527. [Google Scholar] [CrossRef]
- Urich, T.; Guenther, D.; Heinrich, C.A. Gold concentrations of magmatic brines and the metal budget of porphyry copper deposits. Nature 1999, 399, 676–679. [Google Scholar] [CrossRef]


| Lithology/Sample | Element (ppm) | P | Ti | Sr | Y | Zr | Nb | La | Ce | Pr | Nd | Sm | Eu | Gd | Tb | Dy | Ho | Er |
|---|---|---|---|---|---|---|---|---|---|---|---|---|---|---|---|---|---|---|
| Mineralized granodiorite | ||||||||||||||||||
| Sample DBS12 | mean | 134 | 5.65 | 0.45 | 587 | 460,915 | 2.30 | <0.005 | 12.0 | 0.05 | 0.94 | 1.80 | 0.83 | 9.61 | 3.32 | 43.5 | 18.3 | 97.7 |
| (n = 10) | sd | 20 | 0.91 | 0.08 | 204 | 14,661 | 0.65 | - | 7.74 | 0.02 | 0.43 | 0.81 | 0.27 | 4.49 | 1.43 | 16.7 | 6.4 | 31.0 |
| Sample DBS16 | mean | 114 | 5.36 | 0.46 | 580 | 448,952 | 2.06 | <0.005 | 12.8 | 0.03 | 0.67 | 1.38 | 0.61 | 8.15 | 2.95 | 39.3 | 17.1 | 94.7 |
| (n = 10) | sd | 24 | 1.42 | 0.08 | 154 | 14,625 | 0.63 | - | 5.78 | 0.01 | 0.21 | 0.37 | 0.16 | 2.24 | 0.81 | 10.6 | 4.5 | 24.4 |
| Sample DBSA4 | mean | 187 | 5.69 | 0.58 | 562 | 441,728 | 1.83 | <0.005 | 10.2 | 0.07 | 0.86 | 1.53 | 0.66 | 8.37 | 2.94 | 39.4 | 16.9 | 94.3 |
| (n = 11) | sd | 171 | 1.64 | 0.34 | 139 | 10,959 | 0.28 | - | 3.48 | 0.11 | 0.48 | 0.60 | 0.22 | 2.78 | 0.87 | 10.4 | 4.2 | 22.1 |
| Sample DBSA5 | mean | 151 | 6.25 | 0.54 | 541 | 440,628 | 1.78 | <0.005 | 10.1 | 0.05 | 0.78 | 1.49 | 0.66 | 8.28 | 2.90 | 38.1 | 16.2 | 87.7 |
| (n = 11) | sd | 86 | 1.45 | 0.31 | 242 | 12,294 | 0.46 | - | 4.41 | 0.05 | 0.59 | 1.03 | 0.36 | 4.87 | 1.49 | 18.4 | 7.3 | 36.1 |
| Altered granodiorite, diorite and microgabbro | ||||||||||||||||||
| Sample DBS1 | mean | 127 | 7.19 | 0.46 | 481 | 449,290 | 2.23 | <0.005 | 9.53 | 0.05 | 0.83 | 1.51 | 0.69 | 7.59 | 2.71 | 35.4 | 14.9 | 80.4 |
| (n = 10) | sd | 18 | 1.34 | 0.06 | 105 | 225,77 | 0.42 | - | 2.53 | 0.02 | 0.25 | 0.39 | 0.16 | 1.73 | 0.58 | 7.6 | 3.3 | 17.7 |
| Sample DBS8 | mean | 132 | 7.00 | 0.51 | 653 | 453,181 | 1.95 | <0.005 | 11.3 | 0.07 | 1.36 | 2.38 | 0.97 | 11.8 | 3.97 | 50.4 | 20.2 | 106 |
| (n = 12) | sd | 43 | 4.01 | 0.15 | 251 | 16,580 | 0.37 | - | 3.45 | 0.05 | 1.05 | 1.63 | 0.63 | 6.82 | 2.09 | 23.7 | 8.2 | 39 |
| Sample DBS4 | mean | 108 | 5.83 | 0.45 | 500 | 444,044 | 2.76 | <0.005 | 12.0 | 0.04 | 0.75 | 1.47 | 0.62 | 7.72 | 2.73 | 36.3 | 15.3 | 82 |
| (n = 9) | sd | 17 | 0.93 | 0.07 | 98 | 12,771 | 0.63 | - | 4.82 | 0.03 | 0.42 | 0.59 | 0.22 | 2.33 | 0.70 | 8.4 | 3.2 | 16 |
| Sample DBS7 | mean | 210 | 20.23 | 0.52 | 822 | 458,744 | 4.79 | <0.005 | 9.36 | 0.09 | 1.36 | 2.48 | 0.61 | 14.13 | 4.99 | 65.2 | 26.7 | 138 |
| (n = 7) | sd | 112 | 34.47 | 0.04 | 230 | 29,882 | 2.84 | - | 4.22 | 0.04 | 0.50 | 0.98 | 0.53 | 5.30 | 1.83 | 23.3 | 8.0 | 38.8 |
| Microgabbros in Tongshan intrusion | ||||||||||||||||||
| Sample TNS-1 | mean | 291 | 12.82 | 0.57 | 667 | 426,553 | 2.89 | <0.005 | 10.5 | 0.12 | 1.88 | 2.95 | 0.53 | 13.3 | 4.58 | 57.4 | 22.2 | 109 |
| (n = 5) | sd | 299 | 7.83 | 0.23 | 308 | 64,676 | 2.84 | - | 7.18 | 0.10 | 1.89 | 2.38 | 0.13 | 7.98 | 2.57 | 31.5 | 11.4 | 53 |
| Sample TNS-3 | mean | 198 | 7.0 | 0.97 | 580 | 394,203 | 2.41 | <0.005 | 17.8 | 0.04 | 0.86 | 1.94 | 0.80 | 11.03 | 3.76 | 45.213 | 17.6 | 86.9 |
| (n = 6) | sd | 162 | 3.2 | 1.33 | 111 | 19,866 | 0.45 | - | 7.62 | 0.01 | 0.26 | 0.61 | 0.38 | 3.25 | 1.18 | 13.741 | 4.5 | 17.2 |
| Qz—monzonite | ||||||||||||||||||
| Sample DBSA1 | mean | 269 | 17.2 | 1.24 | 1329 | 428,056 | 1.46 | 0.056 | 22.2 | 0.29 | 4.78 | 7.78 | 3.93 | 33.8 | 10.5 | 122 | 45.0 | 213 |
| (n = 11) | sd | 48 | 5.0 | 0.84 | 323 | 25,059 | 0.22 | 0.034 | 5.61 | 0.15 | 2.05 | 2.65 | 1.09 | 8.96 | 2.61 | 29 | 10.9 | 51 |
| Sample DBSA2 | mean | 289 | 16.4 | 1.01 | 1536 | 439,438 | 1.72 | 0.058 | 25.7 | 0.51 | 6.11 | 7.75 | 4.11 | 36.4 | 11.6 | 136 | 51.1 | 244 |
| (n = 11) | sd | 47 | 4.0 | 0.71 | 372 | 23,164 | 0.42 | 0.089 | 7.88 | 0.89 | 5.88 | 2.73 | 1.27 | 8.03 | 2.56 | 30 | 11.8 | 56 |
| Lithology/Sample | Element (ppm) | Tm | Yb | Lu | Hf | Th | U | Ce/Nd | (Ce/Ce*) a | (Ce4+/Ce3+) b | (Eu/Eu*) c | Hf/Y | U/Yb | Nb/Yb | Gd/Yb | log(U/Yb) | log(Nb/Yb) | |
| Mineralized granodiorite | ||||||||||||||||||
| Sample DBS12 | mean | 25.1 | 290 | 62.5 | 9530 | 60.4 | 159 | 14.1 | 65.5 | 308 | 0.57 | 17.6 | 0.55 | 0.008 | 0.032 | −0.27 | −2.10 | |
| (n = 10) | sd | 6.8 | 65 | 14.7 | 546 | 45.6 | 57 | 6.3 | 32.9 | 174 | 0.06 | 5.02 | 0.12 | 0.001 | 0.007 | 0.09 | 0.07 | |
| Sample DBS16 | mean | 24.2 | 284 | 62.5 | 9504 | 52.4 | 149 | 20.3 | 104 | 431 | 0.56 | 17.5 | 0.53 | 0.007 | 0.029 | −0.29 | −2.14 | |
| (n = 10) | sd | 6.1 | 67 | 14.6 | 557 | 22.2 | 48 | 8.6 | 58 | 193 | 0.05 | 4.98 | 0.10 | 0.001 | 0.003 | 0.09 | 0.06 | |
| Sample DBSA4 | mean | 23.6 | 273 | 62.5 | 9323 | 46.1 | 132 | 14.7 | 70.9 | 307 | 0.56 | 17.7 | 0.49 | 0.007 | 0.030 | −0.32 | −2.17 | |
| (n = 11) | sd | 5.1 | 54 | 12.3 | 560 | 18.9 | 32 | 7.3 | 42.8 | 185 | 0.03 | 5.61 | 0.11 | 0.001 | 0.005 | 0.09 | 0.07 | |
| Sample DBSA5 | mean | 21.9 | 254 | 55.6 | 8993 | 49 | 132 | 17.0 | 86.1 | 461 | 0.59 | 20.5 | 0.54 | 0.007 | 0.031 | −0.28 | −2.14 | |
| (n = 11) | sd | 8.3 | 88 | 18.8 | 718 | 26 | 44 | 9.2 | 64.2 | 290 | 0.05 | 11.5 | 0.12 | 0.002 | 0.009 | 0.09 | 0.10 | |
| Altered granodiorite, diorite and microgabbro | ||||||||||||||||||
| Sample DBS1 | mean | 21.5 | 261 | 51.6 | 8827 | 47.7 | 137 | 12.4 | 54.4 | 231 | 0.62 | 19.2 | 0.53 | 0.009 | 0.030 | −0.28 | −2.06 | |
| (n = 10) | sd | 5.2 | 69 | 11.2 | 854 | 17.3 | 44 | 4.6 | 25.2 | 111 | 0.05 | 5.21 | 0.12 | 0.001 | 0.006 | 0.09 | 0.07 | |
| Sample DBS8 | mean | 26.1 | 295 | 61.7 | 9114 | 61 | 144 | 13.1 | 60.7 | 266 | 0.57 | 16.5 | 0.50 | 0.007 | 0.038 | −0.31 | −2.17 | |
| (n = 12) | sd | 8.5 | 88 | 18.9 | 563 | 32 | 42 | 8.8 | 47.7 | 228 | 0.10 | 8.30 | 0.09 | 0.002 | 0.014 | 0.09 | 0.12 | |
| Sample DBS4 | mean | 20.9 | 244 | 53.1 | 9261 | 82 | 158 | 18.2 | 92.0 | 350 | 0.57 | 19.2 | 0.66 | 0.012 | 0.032 | −0.20 | −1.95 | |
| (n = 9) | sd | 4.1 | 46 | 9.2 | 366 | 71 | 49 | 5.8 | 37.7 | 128 | 0.06 | 3.76 | 0.22 | 0.004 | 0.008 | 0.13 | 0.12 | |
| Sample DBS7 | mean | 32.2 | 340 | 67.6 | 10153 | 124 | 347 | 7.4 | 33.3 | 174 | 0.33 | 13.1 | 1.13 | 0.014 | 0.045 | −0.04 | −1.91 | |
| (n = 7) | sd | 8.0 | 90 | 20.2 | 1323 | 91 | 190 | 3.6 | 24.9 | 82 | 0.27 | 3.30 | 0.92 | 0.007 | 0.021 | 0.30 | 0.27 | |
| Microgabbros in Tongshan intrusion | ||||||||||||||||||
| Sample TNS−1 | mean | 24.9 | 262 | 50.9 | 9690 | 143 | 358 | 7.4 | 28.5 | 197 | 0.37 | 16.4 | 1.37 | 0.012 | 0.051 | −0.16 | −2.06 | |
| (n = 5) | sd | 10.4 | 93 | 19.5 | 2135 | 262 | 497 | 4.3 | 16.4 | 154 | 0.24 | 5.45 | 2.01 | 0.012 | 0.031 | 0.53 | 0.35 | |
| Sample TNS−3 | mean | 20.1 | 220 | 39.1 | 8210 | 151.9 | 422 | 22 | 114 | 357 | 0.55 | 14.7 | 1.93 | 0.011 | 0.049 | 0.14 | −1.96 | |
| (n = 6) | sd | 3.1 | 29 | 6.1 | 741 | 91.2 | 336 | 10 | 50 | 177 | 0.30 | 3.91 | 1.50 | 0.002 | 0.009 | 0.42 | 0.08 | |
| Qz—monzonite | ||||||||||||||||||
| Sample DBSA1 | mean | 47.6 | 489 | 87.0 | 6246 | 85 | 109 | 5.00 | 19.8 | 45.9 | 0.75 | 4.95 | 0.23 | 0.003 | 0.070 | −0.65 | −2.52 | |
| (n = 11) | sd | 10.8 | 108 | 20.2 | 479 | 29 | 22 | 1.39 | 7.1 | 18.5 | 0.03 | 1.21 | 0.03 | 0.001 | 0.013 | 0.06 | 0.07 | |
| Sample DBSA2 | mean | 53.2 | 534 | 101 | 6487 | 93.1 | 125 | 5.76 | 23.5 | 62.6 | 0.75 | 4.41 | 0.23 | 0.003 | 0.068 | −0.64 | −2.50 | |
| (n = 11) | sd | 11.2 | 97 | 23.3 | 540 | 28.8 | 33 | 2.85 | 15.7 | 38.8 | 0.06 | 0.87 | 0.04 | 0.000 | 0.010 | 0.06 | 0.06 | |
| Lithology/Sample | Numbers of Analyzed Zircon | TTi (°C) a | Uncertainty | T-Zircon (°C) b | 5 wt.% H2O c | 4 wt.% H2O c | 6 wt.% H2O c | ΔFMQ f | Sd | |||||||||
|---|---|---|---|---|---|---|---|---|---|---|---|---|---|---|---|---|---|---|
| log fO2 d | Error | ΔFMQ e | Error | log fO2 d | Error | ΔFMQ e | Error | log fO2 d | Error | ΔFMQ e | Error | |||||||
| Mineralized granodiorite | ||||||||||||||||||
| DBS12 | 10 | 725 | 15 | n/a | −15.4 | 1.2 | 1.00 | 1.2 | −15.8 | 1.2 | 0.54 | 1.2 | −15.0 | 1.2 | 1.44 | 1.2 | 0.56 | 0.62 |
| DBS16 | 10 | 719 | 25 | 786 | −15.0 | 1.2 | 1.54 | 1.2 | −15.4 | 1.2 | 1.08 | 1.2 | −14.5 | 1.2 | 1.99 | 1.2 | 0.84 | 0.56 |
| DBSA4 | 11 | 724 | 25 | 790 | −15.1 | 1.2 | 1.37 | 1.2 | −15.5 | 1.2 | 0.91 | 1.2 | −14.6 | 1.2 | 1.82 | 1.2 | 0.54 | 0.45 |
| DBSA5 | 11 | 733 | 22 | 734 | −14.9 | 1.2 | 1.35 | 1.2 | −15.3 | 1.2 | 0.88 | 1.2 | −14.4 | 1.2 | 1.80 | 1.2 | 0.41 | 0.41 |
| Altered granodiorite, diorite and microgabbro | ||||||||||||||||||
| DBS1 | 10 | 747 | 17 | 716 | −14.5 | 1.2 | 1.41 | 1.2 | −15.0 | 1.2 | 0.96 | 1.2 | −14.1 | 1.2 | 1.85 | 1.2 | 0.22 | 0.23 |
| DBS8 | 12 | 737 | 46 | 752 | −14.4 | 1.2 | 1.54 | 1.2 | −14.9 | 1.2 | 1.09 | 1.2 | −14.0 | 1.2 | 1.97 | 1.2 | 0.54 | 0.52 |
| DBS4 | 9 | 728 | 14 | 716 | −14.0 | 1.3 | 2.41 | 1.3 | −14.3 | 1.3 | 1.95 | 1.3 | −13.5 | 1.3 | 2.86 | 1.3 | 0.61 | 0.45 |
| DBS7 | 7 | 792 | 128 | n/a | −11.6 | 1.4 | 4.19 | 1.4 | −12.1 | 1.4 | 3.75 | 1.4 | −11.2 | 1.4 | 4.61 | 1.4 | −0.94 | 1.89 |
| Microgabbros in Tongshan intrusion | ||||||||||||||||||
| TNS1 | 5 | 794 | 61 | n/a | −13.4 | 1.1 | 1.39 | 1.1 | −13.9 | 1.1 | 0.92 | 1.1 | −13.0 | 1.1 | 1.83 | 1.1 | −0.64 | 1.62 |
| TNS3 | 6 | 738 | 45 | n/a | −14.1 | 1.2 | 1.89 | 1.2 | −14.6 | 1.2 | 1.41 | 1.2 | −13.7 | 1.2 | 2.34 | 1.2 | 0.60 | 0.30 |
| Qz—monzonite | ||||||||||||||||||
| DBSA1 | 11 | 835 | 30 | 839 | −11.6 | 1.1 | 2.39 | 1.1 | −12.0 | 1.1 | 1.93 | 1.1 | −11.1 | 1.1 | 2.84 | 1.1 | 1.11 | 0.32 |
| DBSA2 | 11 | 830 | 26 | 837 | −11.5 | 1.1 | 2.53 | 1.1 | −12.0 | 1.1 | 2.07 | 1.1 | −11.1 | 1.1 | 2.98 | 1.1 | 1.28 | 0.22 |
Publisher’s Note: MDPI stays neutral with regard to jurisdictional claims in published maps and institutional affiliations. |
© 2021 by the authors. Licensee MDPI, Basel, Switzerland. This article is an open access article distributed under the terms and conditions of the Creative Commons Attribution (CC BY) license (https://creativecommons.org/licenses/by/4.0/).
Share and Cite
Wang, J.; Hattori, K.; Yang, Y.; Yuan, H. Zircon Chemistry and Oxidation State of Magmas for the Duobaoshan-Tongshan Ore-Bearing Intrusions in the Northeastern Central Asian Orogenic Belt, NE China. Minerals 2021, 11, 503. https://doi.org/10.3390/min11050503
Wang J, Hattori K, Yang Y, Yuan H. Zircon Chemistry and Oxidation State of Magmas for the Duobaoshan-Tongshan Ore-Bearing Intrusions in the Northeastern Central Asian Orogenic Belt, NE China. Minerals. 2021; 11(5):503. https://doi.org/10.3390/min11050503
Chicago/Turabian StyleWang, Jian, Keiko Hattori, Yanchen Yang, and Haiqi Yuan. 2021. "Zircon Chemistry and Oxidation State of Magmas for the Duobaoshan-Tongshan Ore-Bearing Intrusions in the Northeastern Central Asian Orogenic Belt, NE China" Minerals 11, no. 5: 503. https://doi.org/10.3390/min11050503
APA StyleWang, J., Hattori, K., Yang, Y., & Yuan, H. (2021). Zircon Chemistry and Oxidation State of Magmas for the Duobaoshan-Tongshan Ore-Bearing Intrusions in the Northeastern Central Asian Orogenic Belt, NE China. Minerals, 11(5), 503. https://doi.org/10.3390/min11050503