Article

Disseminated Gold–Sulfide Mineralization in Metasomatites of the Khangalas Deposit, Yana–Kolyma Metallogenic Belt (Northeast Russia): Analysis of the Texture, Geochemistry, and S Isotopic Composition of Pyrite and Arsenopyrite

by
Maxim V. Kudrin
1,*,
Valery Yu. Fridovsky
1,
Lena I. Polufuntikova
1,2 and
Lyudmila Yu. Kryuchkova
3
1
Diamond and Precious Metal Geology Institute, SB RAS, 677000 Yakutsk, Russia
2
M.K. Ammosov North-Eastern Federal University, 677000 Yakutsk, Russia
3
Centre for X-ray Diffraction Studies of the Research Park, Saint Petersburg State University, 199034 St Petersburg, Russia
*
Author to whom correspondence should be addressed.
Minerals 2021, 11(4), 403; https://doi.org/10.3390/min11040403
Submission received: 28 February 2021 / Revised: 6 April 2021 / Accepted: 7 April 2021 / Published: 12 April 2021

Abstract

:
At the orogenic gold deposits of the Yana–Kolyma metallogenic belt (northeast Russia) both Au–quartz-sulfide mineralization with native gold and disseminated sulfide mineralization with invisible Au developed. The textural and mineralogical-geochemical features, isotope-geochemical characteristics of gold-bearing sulfides from proximal metasomatites, and possible forms of Au occurrence in pyrite and arsenopyrite have been studied using electron microprobe, atomic absorption, LA-ICP-MS trace element, isotope analysis, and computed microtomography. Four generations of pyrite (Py1, diagenetic; Py2, metamorphic; Py3, metasomatic; Py4, veined) and two generations of arsenopyrite (Apy1, metasomatic; Apy2, veined) have been identified at the Khangalas deposit. In the proximal metasomatites, the most common are Py3 and Apy1. Studying their chemical composition makes it possible to identify the features of the distribution patterns of typochemical trace elements in pyrite and arsenopyrite, and to establish the nature of the relationship between Au and these elements. In Py3 and Apy1, structurally bound (solid solution) Au+ prevails, isomorphically entering the crystal lattice or its defects. Isotope characteristics of hydrothermal sulfides (δ34S = −2.0 to −0.6‰) indicate that mantle/magmatic sulfur was involved in the formation of the deposit, though the participation of sulfur from the host rocks of the Verkhoyansk clastic complex cannot be ruled out. The Khangalas deposit has much in common with other gold deposits of the Yana–Kolyma metallogenic belt, and from this point of view, the results obtained will help to better reveal their gold potential and understand their origin.

1. Introduction

The Late Jurassic–early Early Cretaceous Yana–Kolyma metallogenic belt (YKMB) is located in the central part of the Verkhoyansk–Kolyma folded region, in the boundary zone between the northeastern margin of the Siberian craton and the Kolyma–Omolon superterrane. Within the belt, gold deposits are concentrated in three sectors: Upper Kolyma, Upper Indigirka, and Adycha. The length of the belt is approximately 1000 km and the width is approximately 200 km. This is the richest gold province in northeast Russia, including the large Natalka (1500 t Au) and Degdekan (400 t Au) deposits. It is of global economic importance. Production of gold from the Yana–Kolyma belt since the 1930s was ~3200 t, with current estimated resources of about 5000 t Au [1,2]. This is comparable with the output of major Paleozoic–Mesozoic gold provinces of the world (Jiaodong, China; Juneau gold belt, AK, USA; Lachlan fold belt, Australia; Baikal fold belt, Russia; and Southern Tien Shan, Uzbekistan) [3]. To date, the areas with the most economic value within the YKMB are orogenic gold deposits with Au-quartz vein and/or Au-sulfide-quartz veinlet-disseminated types of mineralization. The origin and conditions of the localization of the first mineralization type have been much studied (e.g., [4,5,6,7,8,9] and many others). Recent research has shown great economic value of the insufficiently studied disseminated gold-bearing pyrite and arsenopyrite mineralization in the YKMB (see [10,11,12,13,14,15] and references therein). Disseminated sulfide mineralization is known both within the gold deposits [10,11,15,16,17,18,19] and in regional sulfidation zones [17,20,21,22] localized in transcrustal faults [12,23].
This work presents the mineralogy, geochemistry, isotopic composition, and gold content of disseminated mineralization in clastic rocks of the Khangalas orogenic gold deposit located in the Upper Indigirka sector of the YKMB [24,25]. In early research of the geology and ore content of the deposit, attention was focused on Au–quartz mineralization [26,27,28], its supergene alteration [28,29,30], and placer-to-primary source relationships [31]. In recent years, extensive prospecting work has been carried out within the Khangalas ore cluster. A large number of surface and underground mined workings have been completed. This made it possible to obtain new data on the mineralogy and geochemistry of the Khangalas deposit. Despite the fact that the current estimated reserves and resources of gold at the deposit are small (11 tonnes of Au, with a high average grade of 11.2 g/t Au [32]), the presence of gold-bearing pyrite and arsenopyrite in the wall–rock metasomatites is evidence that the total contained tonnage may be much higher. The Khangalas deposit has much in common with other gold deposits of the YKMB. From this standpoint, the findings presented here will help geologists and prospectors evaluate the overall potential gold resources of the region.

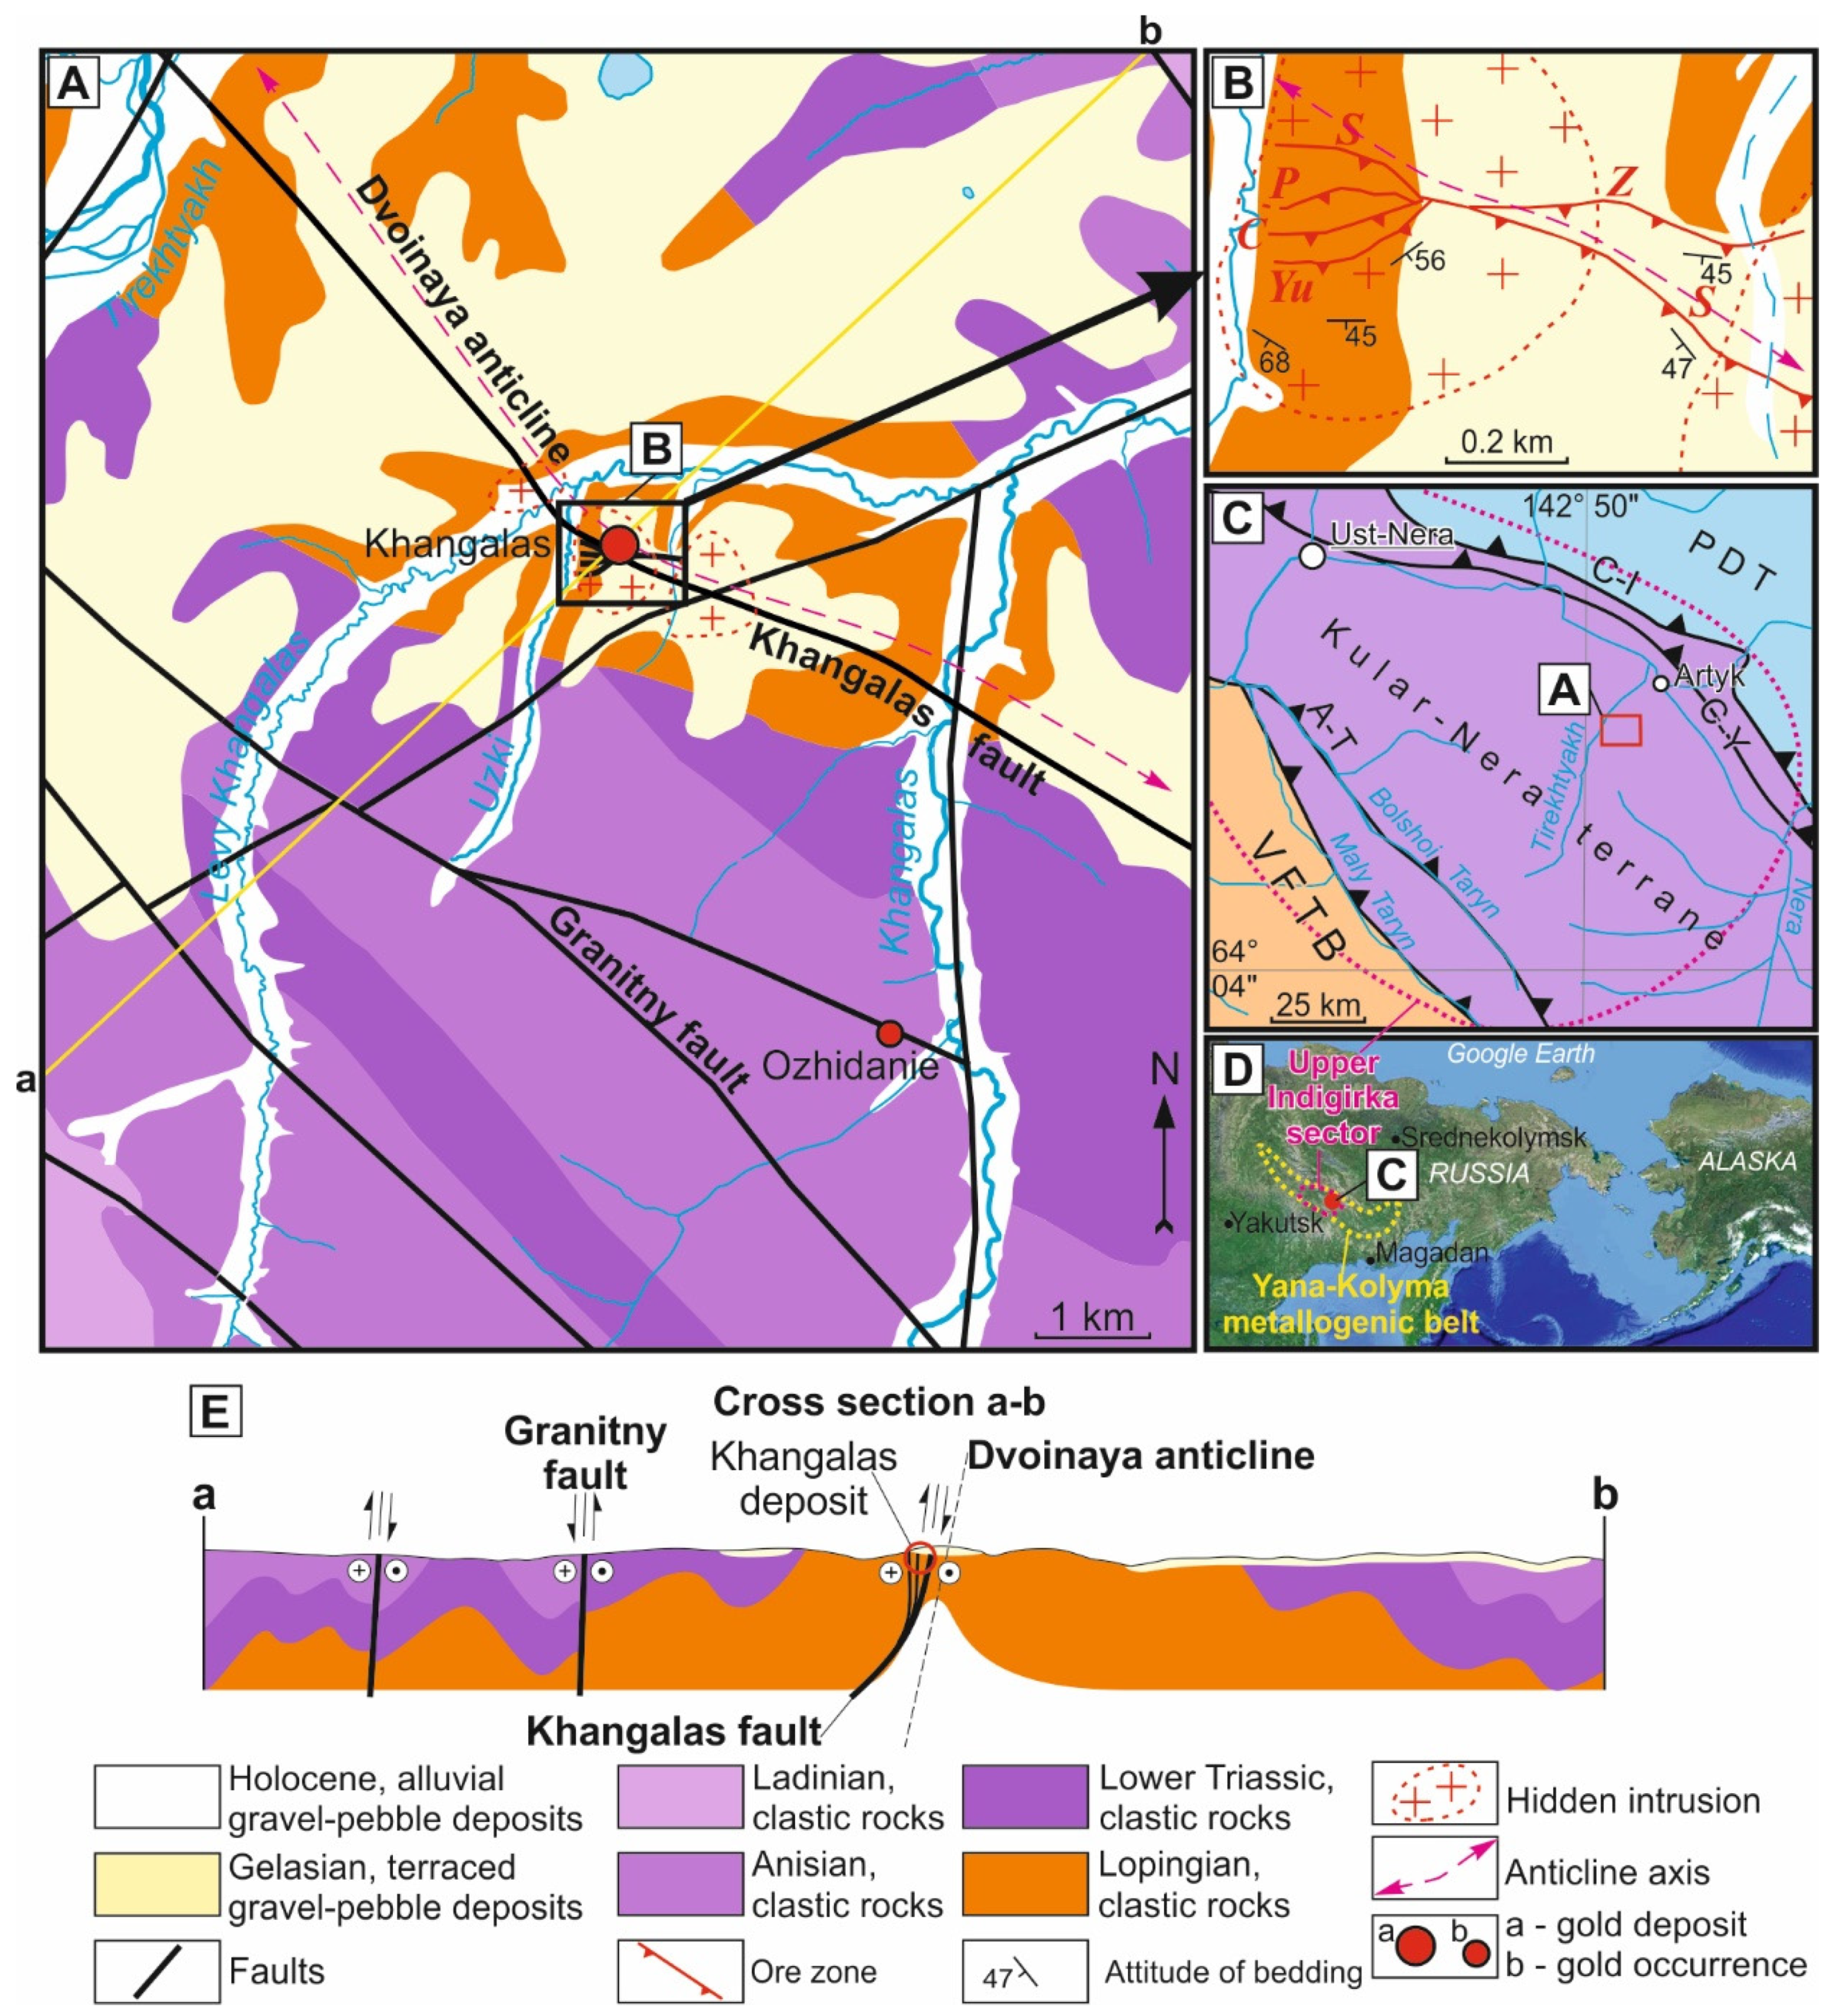
2. Regional Geology and Mineralization

2.1. Regional Tectonic Framework

The Khangalas deposit is located in the central part of the Yana–Kolyma metallogenic belt, which includes the Kular–Nera and the more easterly Polousny–Debin terranes, as well as the eastern part of the Verkhoyansk fold-and-thrust belt (Figure 1). The Kular–Nera terrane consists of Upper Permian, Triassic, and Lower Jurassic clastic sedimentary rock sequences, metamorphosed to initial stages of greenschist facies, and the Polousny–Debin terrane is composed mainly of Upper Triassic–Upper Jurassic turbidites. The terranes are separated by the Charky–Indigirka and Chai–Yureya faults. To the southwest, the regional-scale Adycha–Taryn fault separates the Kular–Nera terrane from the Verkhoyansk fold-and-thrust belt made of Mesoproterozoic–Lower Carboniferous carbonate–clastic and carbonate rocks and Upper Paleozoic–Mesozoic clastic rocks of the passive continental margin of the Siberian craton. The structural pattern of the Yana–Kolyma metallogenic belt is defined by linear folds and faults of NW strike, manifesting several deformation stages [9,33].
Magmatism in the Upper Indigirka sector is manifested by granitoids of intermediate to felsic intrusions and volcanics of the Tas–Kystabyt magmatic belt (J3–K1). Also present are mafic (162 ± 4 Ma, whole rock, Rb–Sr [34]), intermediate, and felsic dikes of the Nera–Bohapcha complex (151–145 Ma, U–Pb SHRIMP-II, zircons [23]). According to Parfenov et al. [35] and Parfenov and Kuzmin [33], the emplacement of the Late Jurassic granitoids was related to collision events. More recent data indicate that subduction processes were involved in their formation [36,37]. Tectonic structures, magmatism, and ore deposits of the YKMB were closely related to the Late Jurassic to earliest Early Cretaceous subduction, accretionary events at the eastern active continental margin of the Siberian craton [33]. The Upper Indigirka sector of the YKMB includes, from northeast to southwest, the Inyali–Debin, Olchan–Nera, Adycha–Taryn, and Adycha metallogenic zones. The Olchan–Nera zone hosts the Khangalas orogenic gold deposit.

2.2. Geology of the Khangalas Deposit

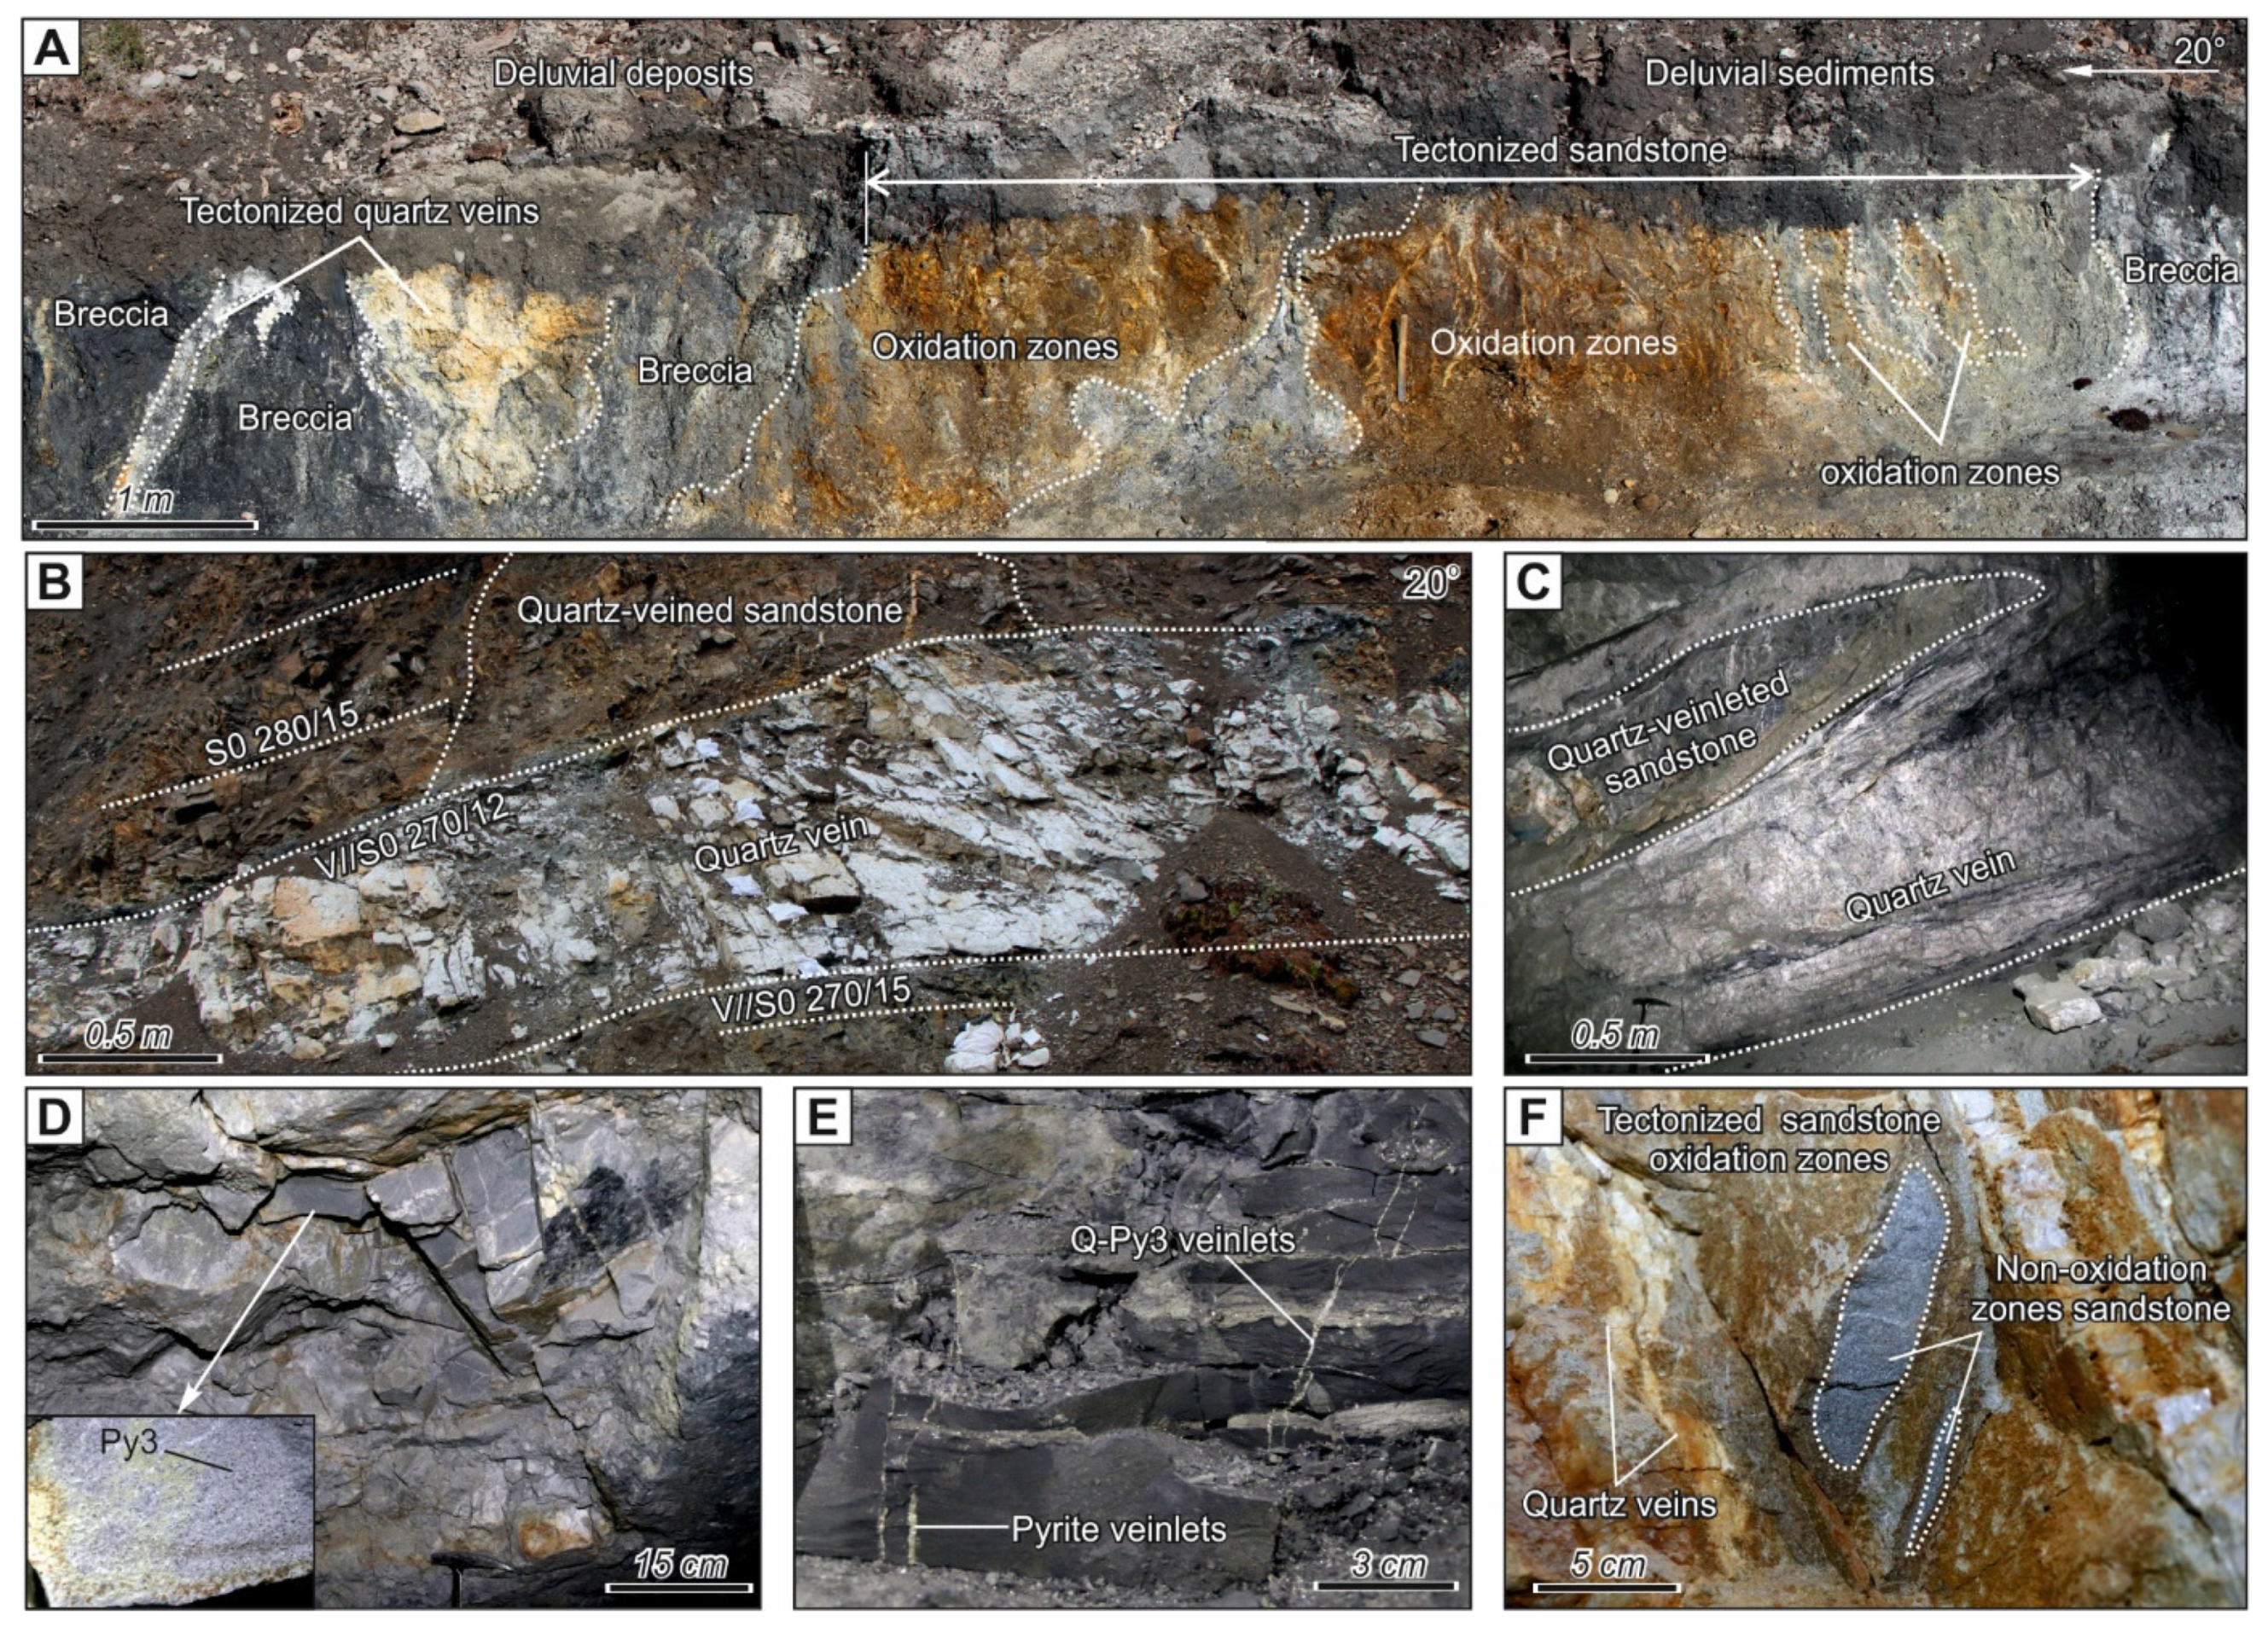
2.2.1. Structures and Host Rocks

The geology and structural-tectonic conditions of the formation and localization of the Khangalas deposit are described in detail in [25]. Here we give only a brief summary of the necessary information. Extraction of alluvial gold started in 1933, when the Khangalas Creek placers were first discovered. Later on, in 1947, the Khangalas lode gold deposit was discovered, and production of gold from quartz veins with pyrite, arsenopyrite, galena, sphalerite, and chalcopyrite began. The veins occur mostly at the border between sandy and shaly intervals, due to competency contrast. The deposit is localized in the crest of the Dvoinaya anticline of the Nera (Nera–Omchug) anticlinorium (Figure 1). The core of the anticline is composed of Upper Permian (Lopingian, P3) deposits. In the lower part of the section, with a thickness of more than 350 m, these are mainly massive brownish-gray and gray sandstones with thin siltstone interbeds. The upper part is dominated by a more than 450 m thick sequence of dark gray to black siltstones with included pebbles of sedimentary, igneous, and metamorphic rocks. The limbs of the anticline are made of Lower Triassic (T1) deposits (mainly dark gray shales, mudstones, and siltstones with rare interlayers of light gray sandstones with a thickness of 680–750 m) and Middle Triassic (T2a) sediments of the Anisian stage (alternating sandstones and siltstones with a thickness of 700–800 m). The Ladinian strata (T2l) consist of interbedded siltstones and sandstones with a total thickness of 850–950 m. The main ore-controlling tectonic structure is the Khangalas fault with a NW strike. This is represented at the Khangalas deposit by five extensive (up to 1400 m) mineralized ore zones (Severnaya, Promezhutochnaya, Centralnaya, Yuzhnaya, Zimnyaya) with low-sulfidation Au-type mineralization localized in the Dvoinaya anticline crest (Figure 1 and Figure 2A). The ore zones are up to 32 m thick and dip to the SW, S, and SE at 30°–50° to 70°–80° [25]. No evidence of magmatic activity is observed within the Khangalas deposit. Geophysical data suggest the presence of a granitoid pluton at depth [38]. The mineralization formed as a result of progressive fold-and-thrust deformations in the Verkhoyansk–Kolyma fold belt. These were initiated by orogenic processes in late Late Jurassic–early Early Cretaceous [25].

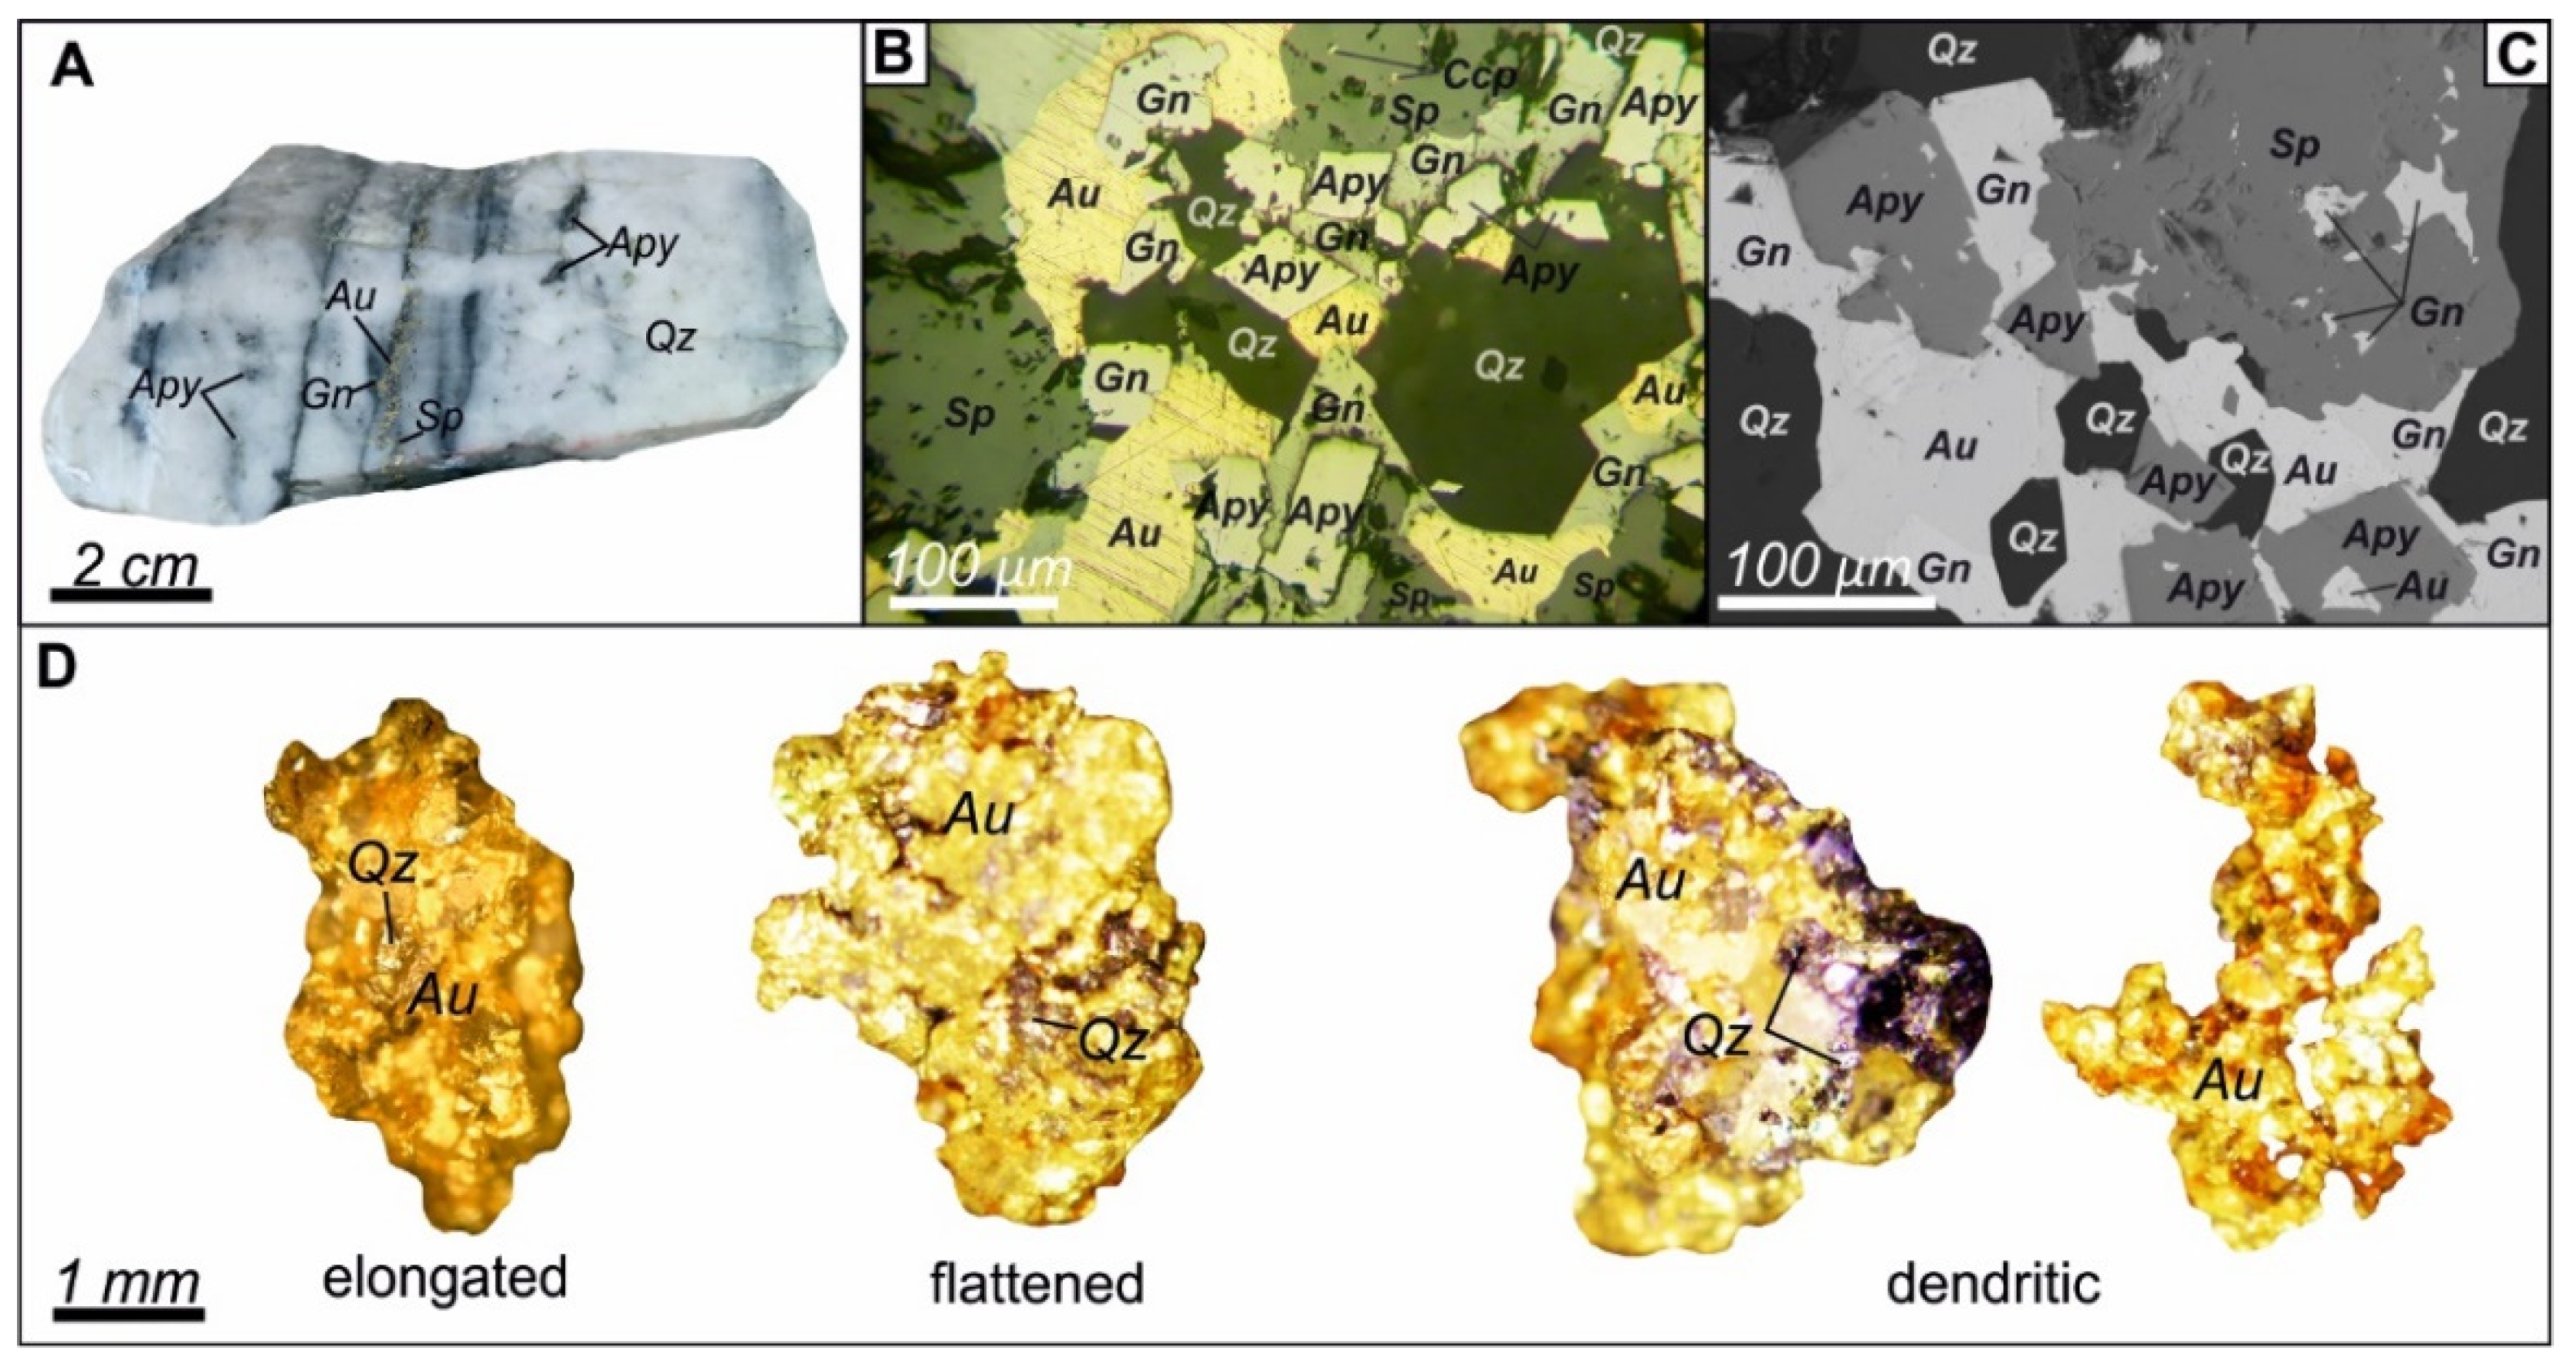
2.2.2. Mineralization

Gold mineralization in the Khangalas deposit is present as two types: Au–quartz-sulfide veins with native gold and sulfide–quartz disseminations with invisible gold hosted in quartz–sericite–carbonate metasomatites (Figure 3). The Au–quartz-sulfide mineralization is characterized as concordant and discordant quartz veins 0.1–1 m thick in swells up to 5 m (Figure 2 and Figure 3B,C). The content of sulfides reaches 1–3 vol.%. The main ore minerals are pyrite and arsenopyrite, with less common galena, sphalerite, and chalcopyrite. Accessory minerals include freibergite, boulangerite, tetrahedrite, Fe-gersdorffite, acanthite, and native gold. The veinlet-disseminated sulfide–quartz mineralization with invisible gold is localized both in the ore zones and in their walls (Figure 3D,E). The sulfide content reaches 3–3.5 vol.%, and pyrite and arsenopyrite predominate. Galena, sphalerite, chalcopyrite, native gold, and freibergite are rare. Gold content in the metasomatites varies from <1 ppm up to 5.29 ppm Au, with an average of 0.73 ppm.
At the Khangalas deposit, four stages of mineral formation are distinguished: two pre-ore preparatory (sedimentary and metamorphic), ore (hydrothermal), and post-ore (supergene) (Figure 4). During the sedimentary stage, accumulation of clastic material, a change in redox potential, mobilization of ore matter, and formation of diagenetic sulfide mineralization (Py1) took place. The metamorphic stage was marked by alteration of clastic rocks as a result of regional metamorphism and deformation processes, disseminated sulfide mineralization (Py2), and sericitization and chloritization of clastic rocks. The hydrothermal stage is characterized by four successive paragenetic associations:
1. The metasomatic quartz–pyrite–arsenopyrite association is localized in quartz veinlets within the wall rock with a quartz–carbonate–sericite matrix. The main ore minerals are auriferous pyrite (Py3) and arsenopyrite (Apy1), which occur as individual crystals, intergrowths, small aggregates ranging in size from fractions of a millimeter to 2–3 mm, and veins up to a few mm thick. Also observed are microcrystals and microaggregates of high-Co arsenopyrite (danaite), ranging in size from tens to 100–200 microns. Native gold is present here in an invisible, finely dispersed form. It forms very thin films and nanoinclusions in pyrite and arsenopyrite, and also occurs as an isomorphic impurity.
2. The vein quartz–pyrite–arsenopyrite association is present mainly in the ore bodies, composed of coarse and medium crystalline anhedral quartz. Pyrite (Py4) and arsenopyrite (Apy2) occur as aggregates up to 3–4 cm in size, veinlets up to 1 mm thick, and individual crystals up to 1–2 mm long (Figure 3A).
3. Au–Qz–polysulfide association is represented by small aggregates and microveinlets of sphalerite, chalcopyrite, and galena, and by native gold segregations (Figure 3B,C). They fill voids in quartz and cracks in pyrite and arsenopyrite of early associations. Native gold is elongated, flattened, and dendritic in form (Figure 3D). The size ranges from small to large (most common fractions are 0.5–0.8 mm) and the distribution is extremely uneven. The fineness of native gold averages 820‰–830‰ (min 780‰–max 850‰).
4. The quartz–carbonate–sulfosalt association is localized in cracks and voids of the early ore and vein minerals in the form of aggregates and individual grains. The principal mineral type is carbonate, represented by ankerite and ankerite–dolomite. Sulfosalts are sporadic and mainly include freibergite, tetrahedrite, and boulangerite.
The post-ore stage is characterized by supergene minerals. This is one of the characteristic features of the Khangalas deposit [29,40,42]. They are expressed as an oxidation zone with the formation of sulfates, arsenates, iron oxides, clay, and other minerals, extending to a depth of 50–100 m (Figure 2F). The authors have previously identified two unknown minerals from the oxidation zone: hydrous iron sulfate [40] and Fe–Al arsenate–phosphate–sulfate [41].

3. Materials and Methods

Samples for mineralogical-geochemical and isotope-geochemical studies were collected from natural outcrops and the walls and dumps of surface and underground mined workings. For mineralogical and geochemical studies of disseminated sulfide mineralization, thick polished sections (40 in total) and epoxy-mounted grains (90 sulfide grains in 8 mounts) were prepared. The textural and structural features of the ores were studied using a Karl Zeiss Axio M1 optical microscope. The qualitative chemical and mineral compositions of the samples were studied with the use of a JEOL JSM-6480LV scanning electron microscope equipped with an Energy 350 Oxford energy dispersive spectrometer (20 kV, 1 nA, beam diameter 1 μm) (analysts S.K. Popova and N.I. Khristoforova, Diamond and Precious Metal Geology Institute, Siberian Branch, Russian Academy of Sciences, Yakutsk).
The major element compositions of pyrite and arsenopyrite were determined by standard X-ray spectral analysis on a Camebax-Micro microanalyzer (analyst N.V. Khristoforova, Diamond and Precious Metal Geology Institute, Siberian Branch, Russian Academy of Sciences, Yakutsk). The analytical conditions were as follows: accelerating voltage of 20 kV; beam current of 25 nA; measurement time of 10 s; K series for Fe, Co, Ni, Cu and S; M series for Au and Pb; L series for As and Sb.; and wavelength-dispersive spectrometer (WDS) with LiF, PET, and TAP crystals. The standards used were: FeS2 for Fe and S, FeAsS for As, Fe-Ni-Co alloy for Co, Ni, Au-Ag alloy of fineness for Au and Ag, CuSbS2 for Sb, and PbS for Pb. The detection limits 0.01%. Trace elements in pyrite were studied on 9 grains of pyrite-3 and arsenopyrite-1 using a New Wave Research UP-213 laser ablation system (USA) coupled with an Agilent 7700x quadrupole mass spectrometer (Agilent Technologies, Santa Clara, CA, USA) (analyst D.A. Artemiev, Institute of Mineralogy, Ural Branch of the Russian Academy of Sciences, Miass). The measurements were carried out using a 213 nm Nd:YAG UV laser with fluence set at 1.8–5.5 J/cm2 (1.8–3.0 J/cm2 for pyrite, 3.0–4.5 J/cm2 arsenopyrite) and a rate of flow of He carrier gas at 0.5–0.65 L/min. Mass spectrometer settings were: RF power 1550 W, carrier gas Ar, flow rate 0.85–0.95 L/min, plasma-forming gas (Ar) flow rate 15 L/min, and auxiliary gas (Ar) flow rate 0.9 L/min. Data were acquired by singe spot and line analyses using a laser spot diameter of 25 to 80 µm and a frequency of 5–10 Hz. The analysis time for each sample was 90 s, comprising a 30 s measurement of background (laser off) and a 60 s analysis with laser on. Pre-ablation was performed for 3–4 s before each analysis. Between the analyses, and between analysis and pre-ablation, blowing with gas was done for 60–90 s.
The mass spectrometer was calibrated using calibration multi-element solutions and the NIST SRM-612 reference material. The amount of molecular oxides (232Th16O/232Th) was kept below 0.2%. The 238U/232Th ratio, when adjusted according to NIST SRM-612, was 1:1. External calibration standards USGS MASS-1 [43] and UQAC FeS-1 were used to analyze every 7–13 spots to account for drifting of the laser and mass spectrometer. Mass contents of elements for NIST SRM-612 and USGS MASS-1 were taken from the GeoReM database. Data processing and calculation were carried out using the Iolite software package [44]. As internal standard (IS) for pyrite, we used 57Fe measured by SEM-EMF. In some cases, normalization to 100% of the total components was performed according to standard techniques [45].
The Au and Ag contents were determined on powdery monomineral samples by atomic absorption spectrometry with electrothermal atomization on a Thermo Scientific iCE 3500 spectrometer (analysts A.E. Sannikova, E.L. Naryshkina, and E.I. Mikhailov, Diamond and Precious Metal Geology Institute, Siberian Branch, Russian Academy of Sciences, Yakutsk). Au and Ag content of more than 2 ppm was determined on an Agilent 4200 MP-AES atomic emission spectrometer with microwave-saturated plasma. X-ray computed microtomography was used to study the internal structure of minerals and identify high-density phases in sulfide grains; this non-destructive method makes it possible to visualize in 3D the distribution of phases with different density in the sample [46,47,48,49,50,51,52,53], etc. Microtomographic studies were carried out at the Centre for X-ray Diffraction Studies of the Research Park of St. Petersburg State University (analyst L.Yu. Kryuchkova). Samples of pyrite and arsenopyrite (31 in total) were studied by x-ray computed microtomography. Monomineral fractions 0.25–1.0 mm in size were hand-picked under a binocular microscope. The studies were carried out on a SkyScan-1172 microtomography scanner (Bruker microCT, Belgium). To reconstruct the array of shadow images, NRecon software (Bruker microCT) was used, which allows leveling instrument artifacts and setting the range of gray gradations corresponding to the value of x-ray absorption and, accordingly, x-ray density. To analyze the obtained microtomographic data, DataViewer and CTVox software (Bruker microCT) were used. For sulfur isotope analysis we used monosulfide fractions (5 samples) selected by hand and ground into powder. The analysis was performed in the Laboratory of Stable Isotopes of the Far Eastern Geological Institute, Far Eastern Branch of the Russian Academy of Sciences (Vladivostok; analyst T.A. Velivetskaya) using a Flash EA-1112 elemental analyzer (Thermo Scientific, Germany) in the S configuration according to the standard protocol for converting sulfur from sulfide to SO2. The 34S/32S isotope ratios were measured on a MAT-253 mass spectrometer (Thermo Scientific, Waltham, MA, USA) in continuous He flux mode. The measurements were performed against a standard laboratory gas SО2 calibrated according to international standards IAEA-S-1, IAEA-S-2, IAEA-S-3, and NBS-127. The results of δ34S measurements are given in reference to the international VCDT standard.

4. Results

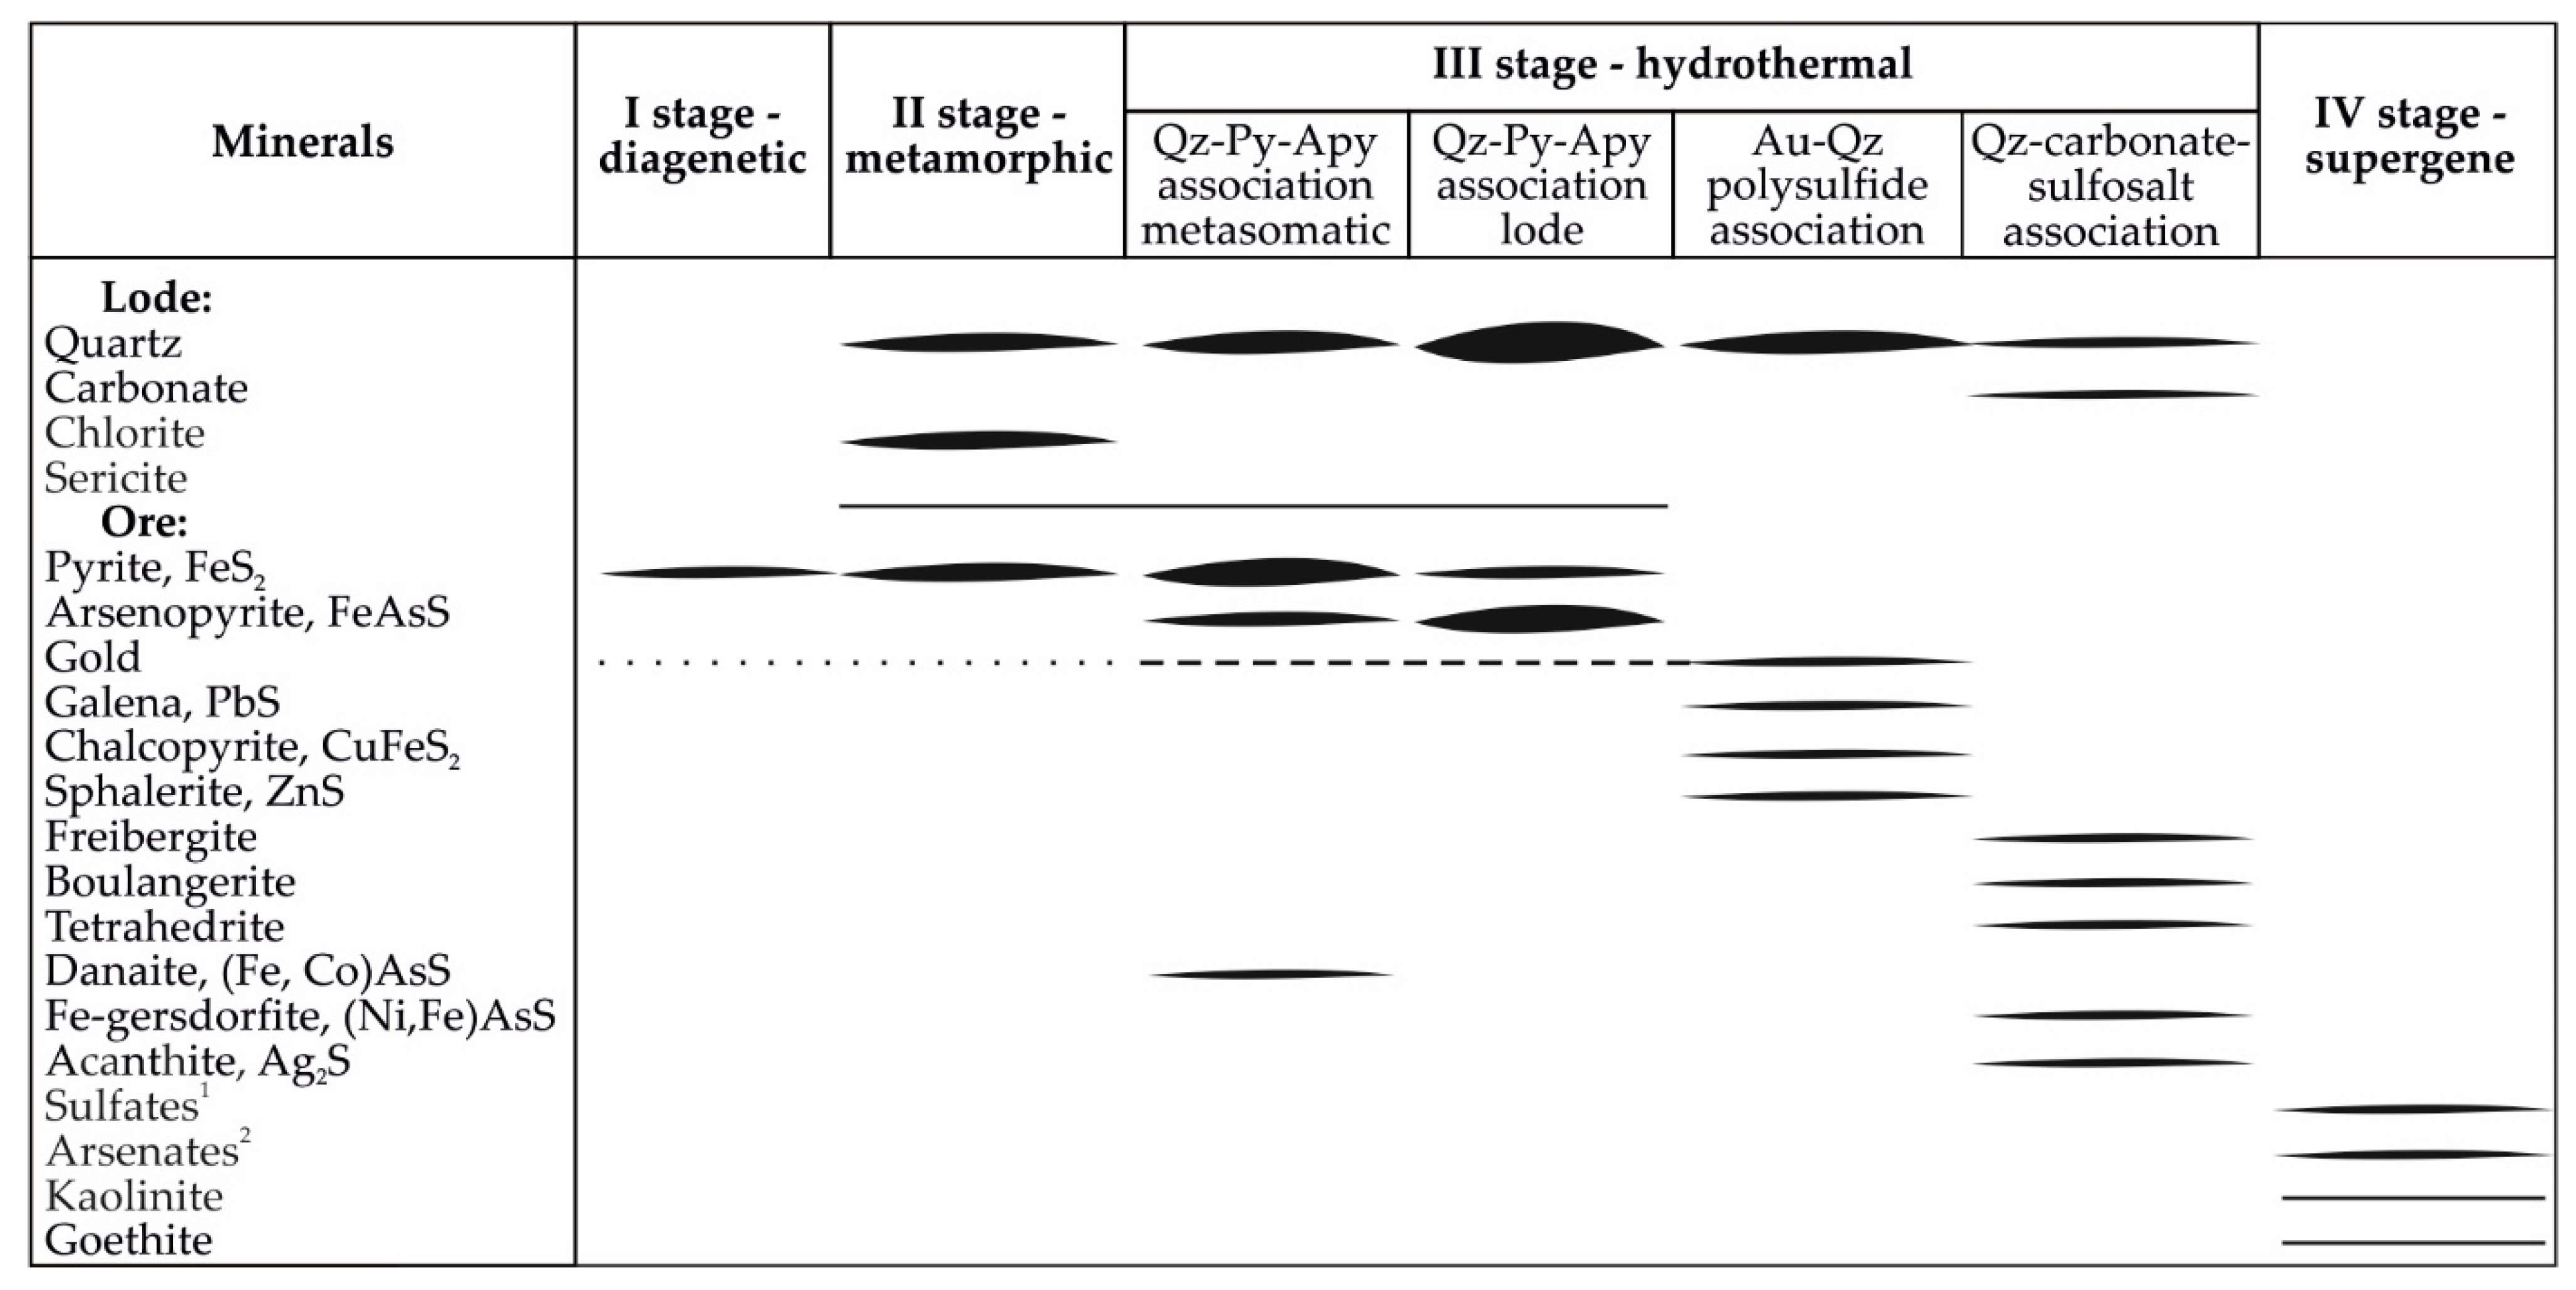
4.1. Pyrite and Arsenopyrite Types and Textures

At the Khangalas deposit, four generations of pyrite and two generations of arsenopyrite are established.

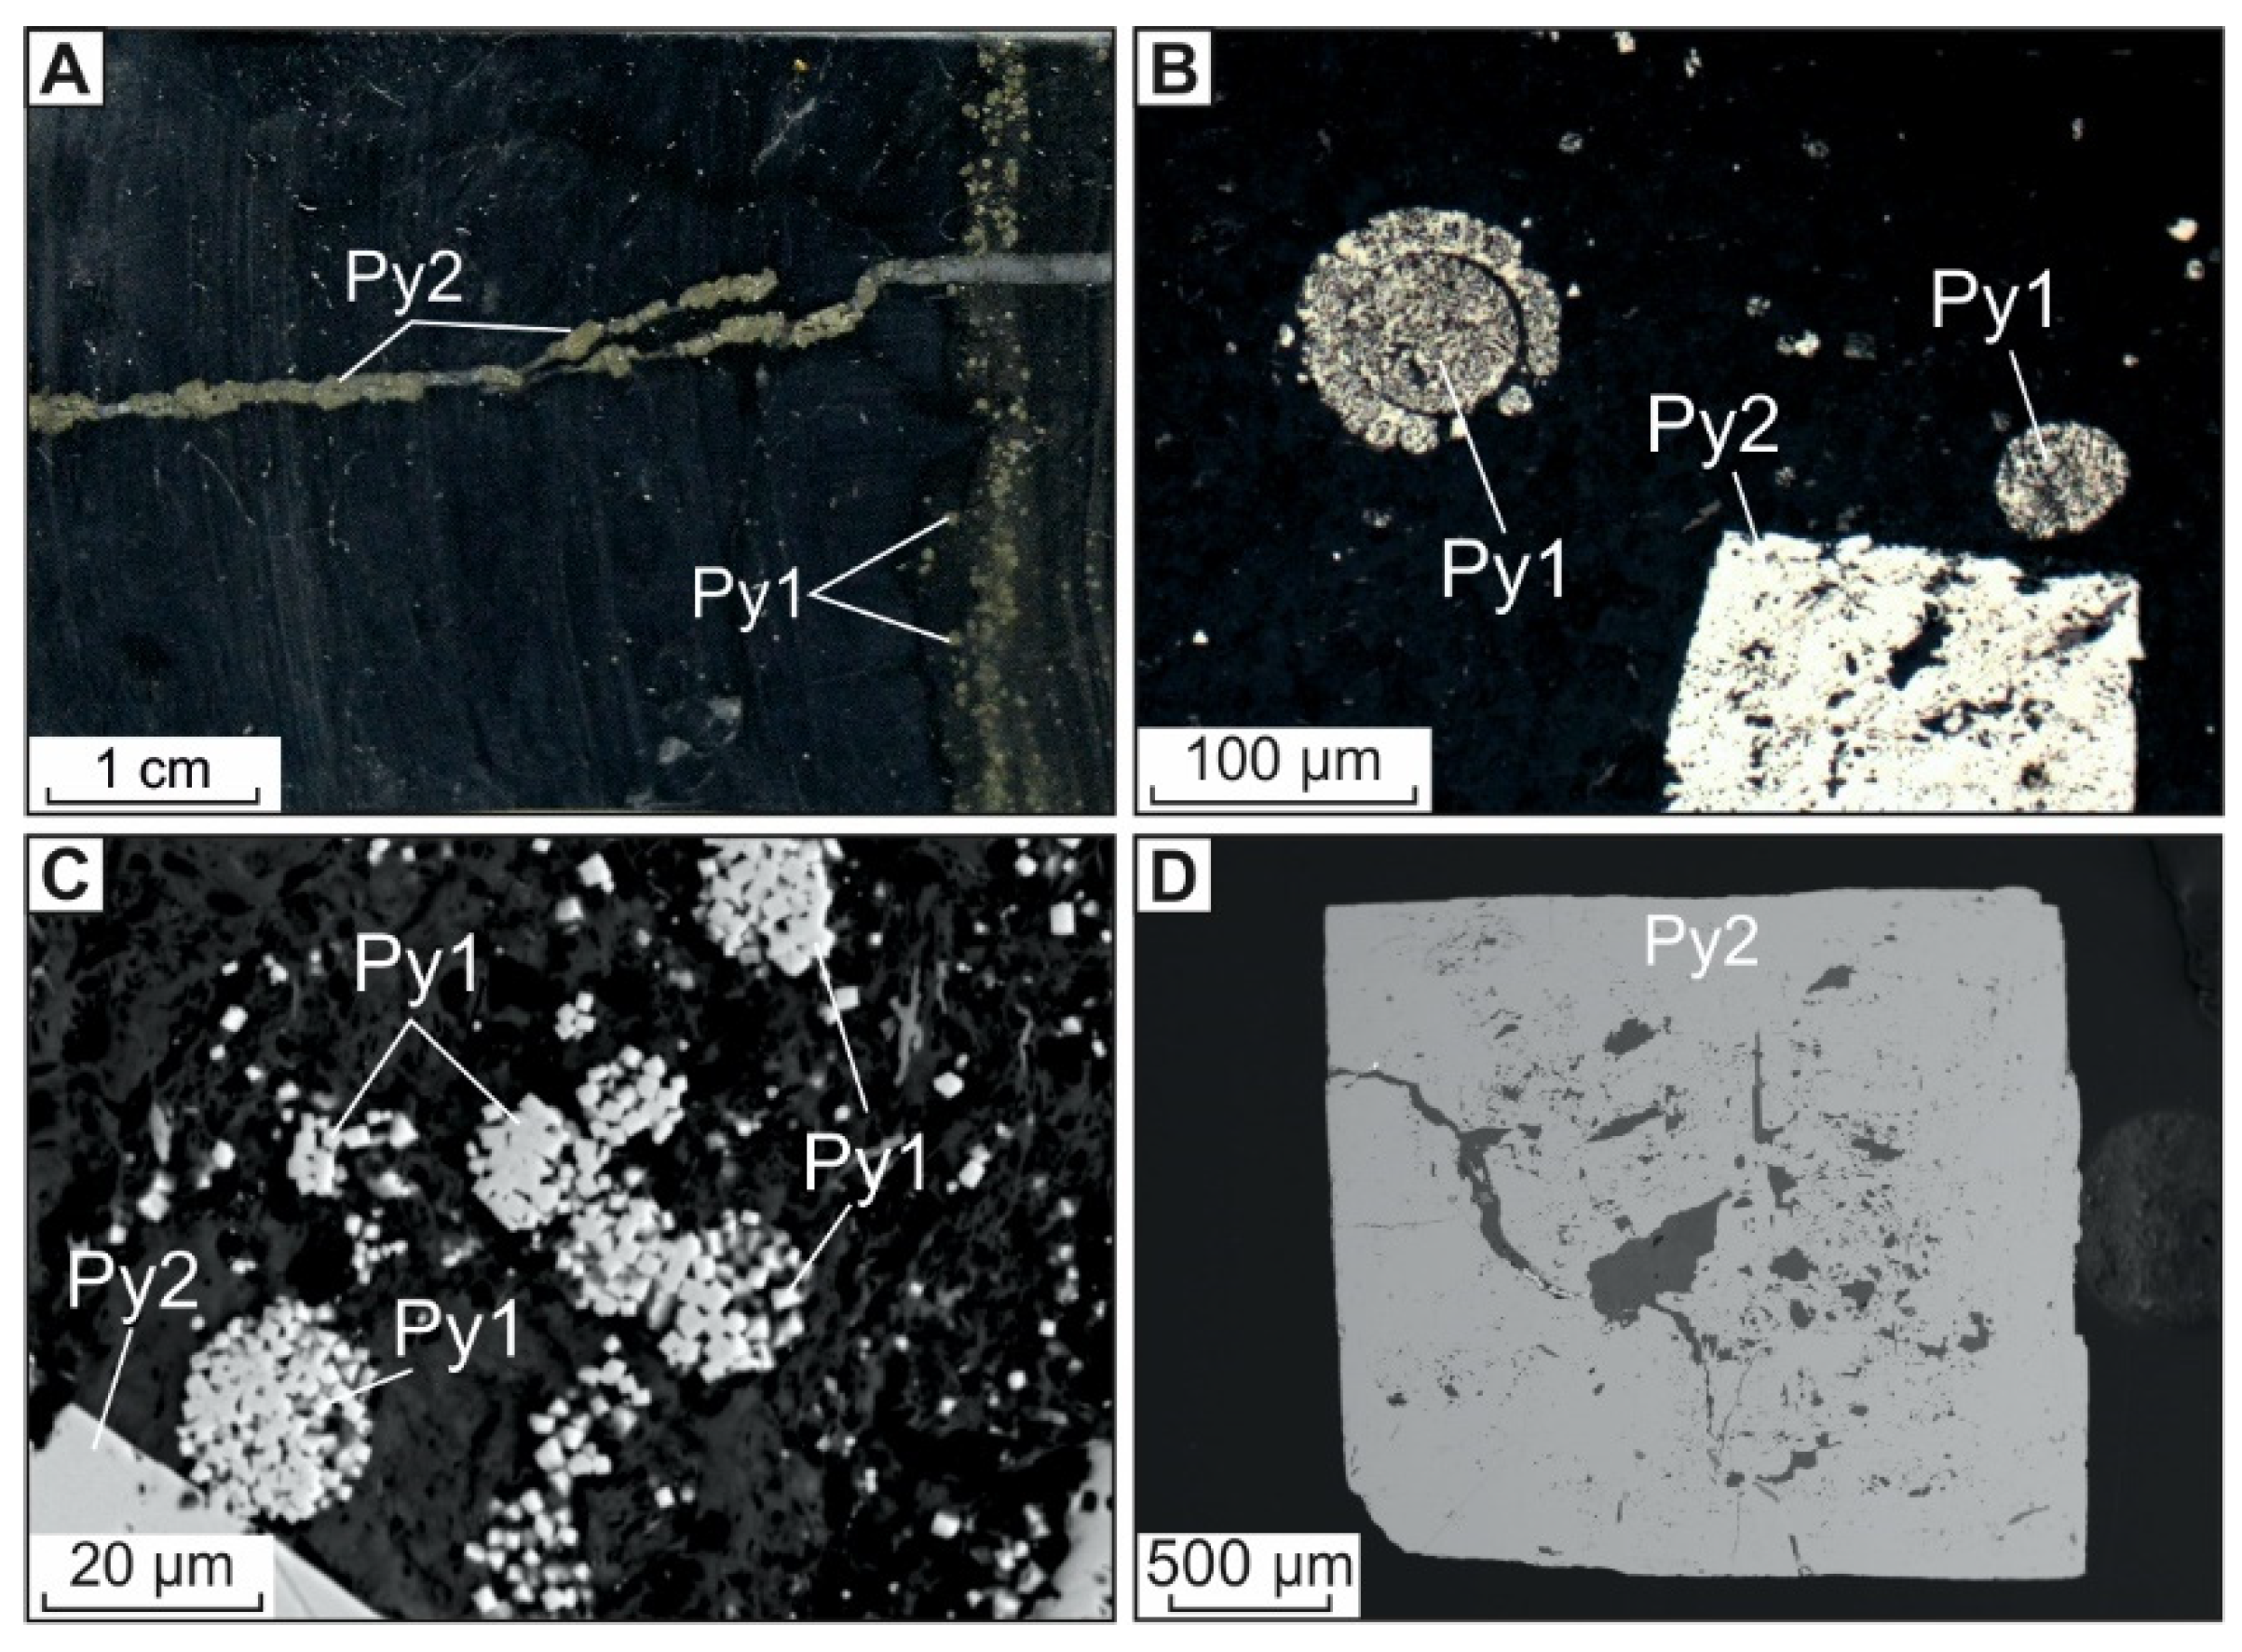
4.1.1. Diagenetic Pyrite (Py1)

Pyrite (Py1) was formed during sedimentation and diagenesis due to bacterially mediated sulfate reduction (Figure 5A,B). Framboids are represented by spherical aggregates ranging in size from 10 to 100 μm (Figure 5A,B). They are composed of pyrite microcrystals, sometimes have a zonal structure with a carbonaceous-silicic matrix, and form diffused or bedding-plane dissemination in sedimentary rocks (Figure 6C).

4.1.2. Metamorphic Pyrite (Py2)

Metamorphic inequigranular cubic pyrite (Py2) forms disseminated mineralization and fills in microcracks in sedimentary rocks (Figure 5B,D). Сrystal size ranges from 5–150 microns to 1–3 mm. Large crystals have microtextures characteristic of cataclasis and corrosion (Figure 5D).

4.1.3. Metasomatic Pyrite (Py3) and Arsenopyrite (Apy1)

The metasomatic quartz–pyrite–arsenopyrite association forms the basis of the vein-disseminated mineralization type with invisible gold in the wall rock metasomatites. Metasomatic Py3 and Apy1 occur as individual crystals, intergrowths, small aggregates, and veinlets up to a few mm thick in thin quartz veins (Figure 6). Apy1 is characterized by short prismatic to pseudo-pyramidal crystal shapes (Figure 6D,E, insets), while Py3 features complicated cubic shapes up to pyritohedra (Figure 6A, inset). The crystals size to 1–1.5 mm, less often to 2–3 mm. Py3 and Apy1 contain superimposed microinclusions of minerals of polysulfide and sulfosalt–carbonate associations (Figure 6F–H). In ~20% of Py3 and ~12% of Apy1 grains, inclusions of galena and rare inclusions of sphalerite and chalcopyrite (Figure 6F–I) were found. Microinclusions of tetrahedrite and freibergite were recorded in single samples. In only one sample, K-4-17, in interstices between crystals of arsenopyrite Apy1 and pyrite Py3, we found native gold about 15 µm in size with a fineness of 827‰ (Figure 6G).
X-ray computed microtomography (3D) of arsenopyrite (Apy1) and pyrite (Py3) grains from two samples collected from the Khangalas deposit showed that they consist of x-ray contrasting phases (Figure 7). Dense minerals are light to white in color, have isometric, subisometric, and flattened shapes, and are up to 10–15 μm in size in Apy1 (Figure 7A) and from a few to 30–40 μm in Py3 (Figure 7C,D). They form an impregnated texture. One can observe a linear-planar distribution of dense phases (or aggregates), probably confined to the defect and crystal growth zones. Uniform arsenopyrite grains are noted (Figure 7B). Native gold and galena are denser than pyrite and arsenopyrite.

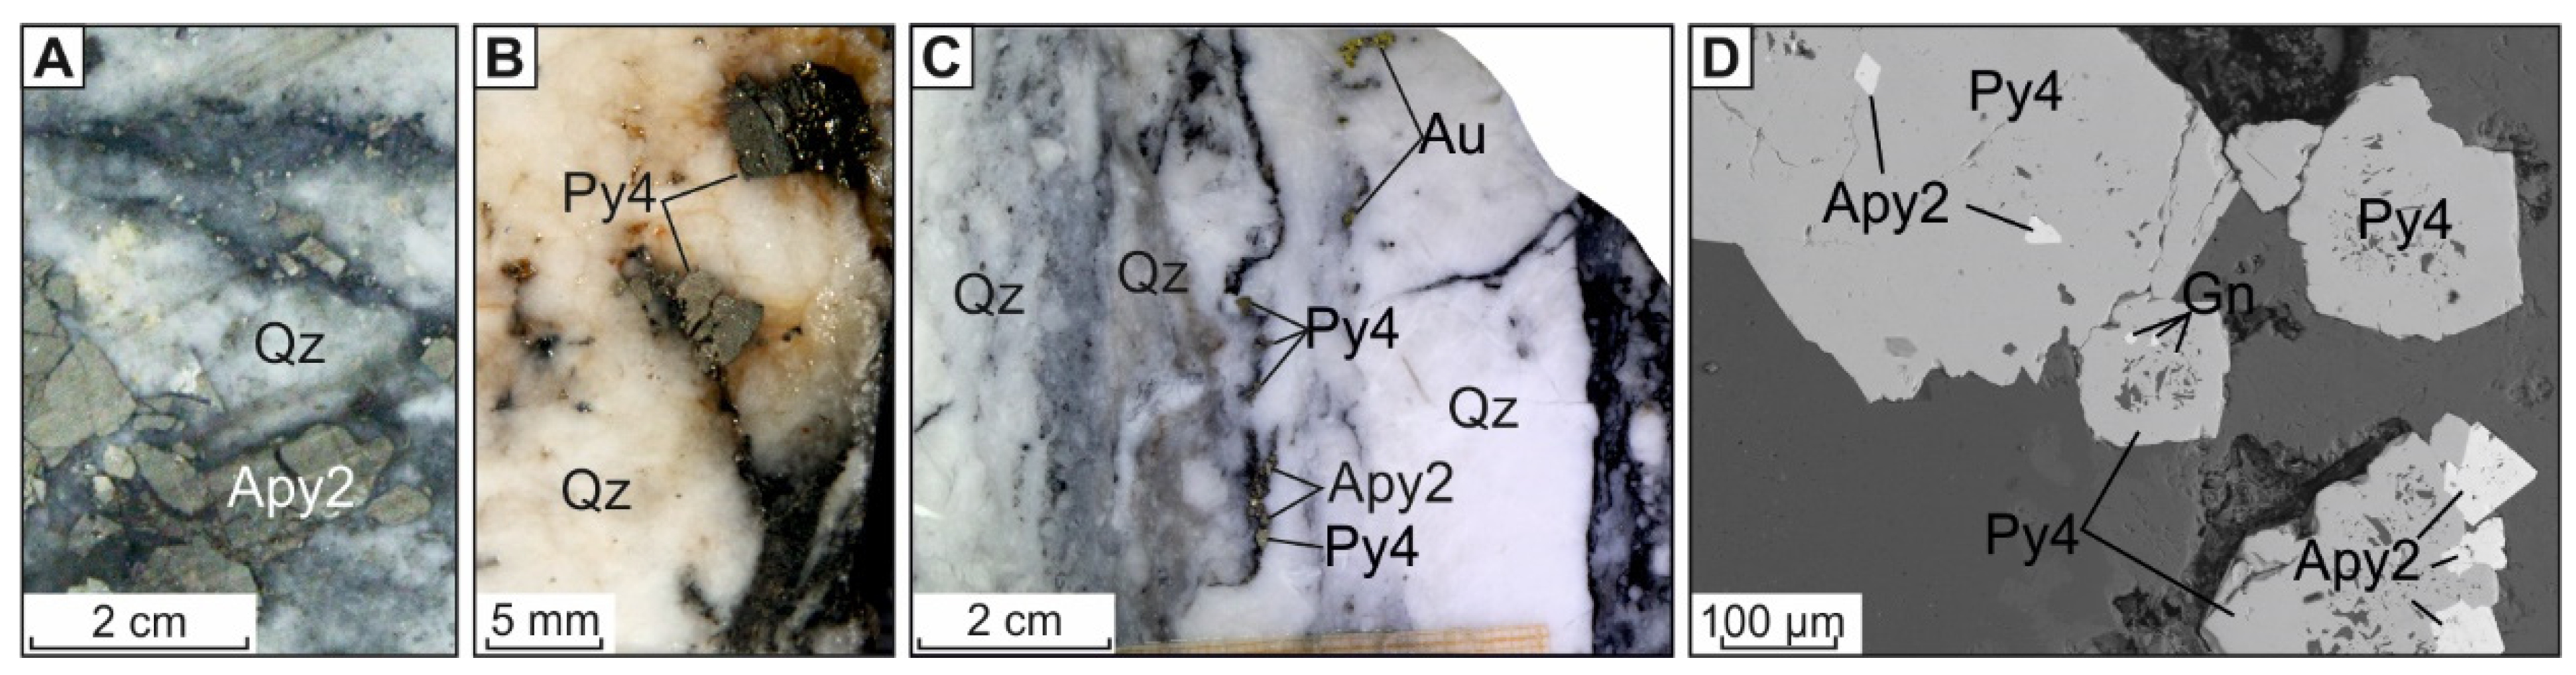
4.1.4. Vein Pyrite (Py4) and Arsenopyrite (Apy2)

The veined quartz–pyrite–arsenopyrite association forms the basis of the vein ore bodies of the deposit (Figure 8). Arsenopyrite Apy2 and pyrite Py4 crystallized simultaneously with quartz, and they occur as scattered small euhedral and anhedral grains and nests up to 1–2 cm in size, less often up to 3–5 cm, as well as veinlets oriented along carbonaceous bands in quartz (Figure 8A,B). Galena, chalcopyrite, sphalerite, and native gold form microinclusions in Apy2, Py4, and quartz crystals, and are confined to their fractures and growth zones (Figure 8C,D).

4.2. Composition of Pyrite and Arsenopyrite

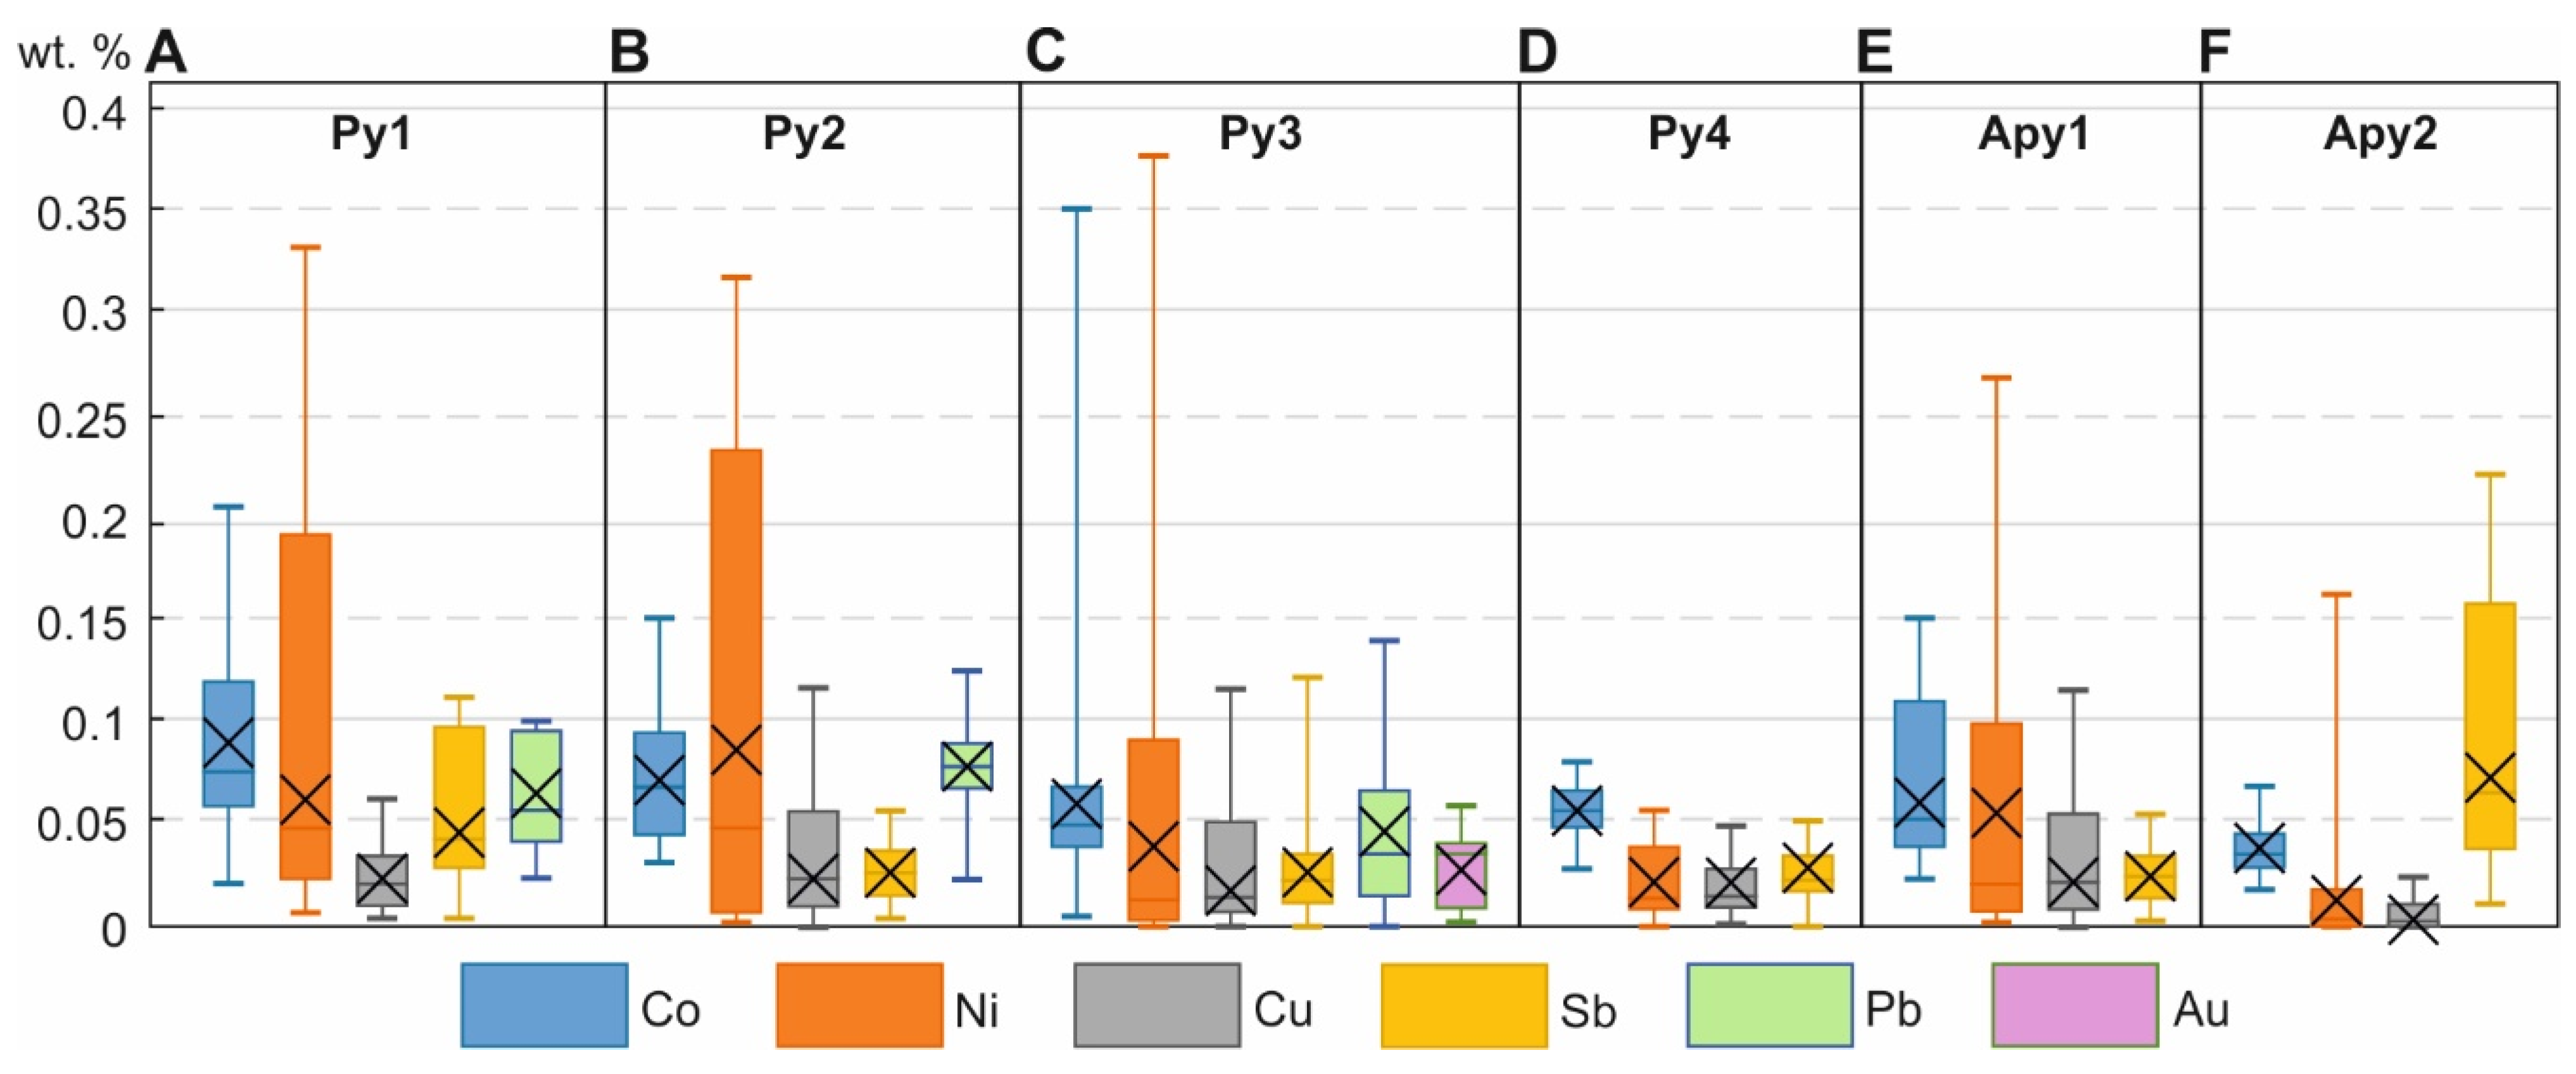
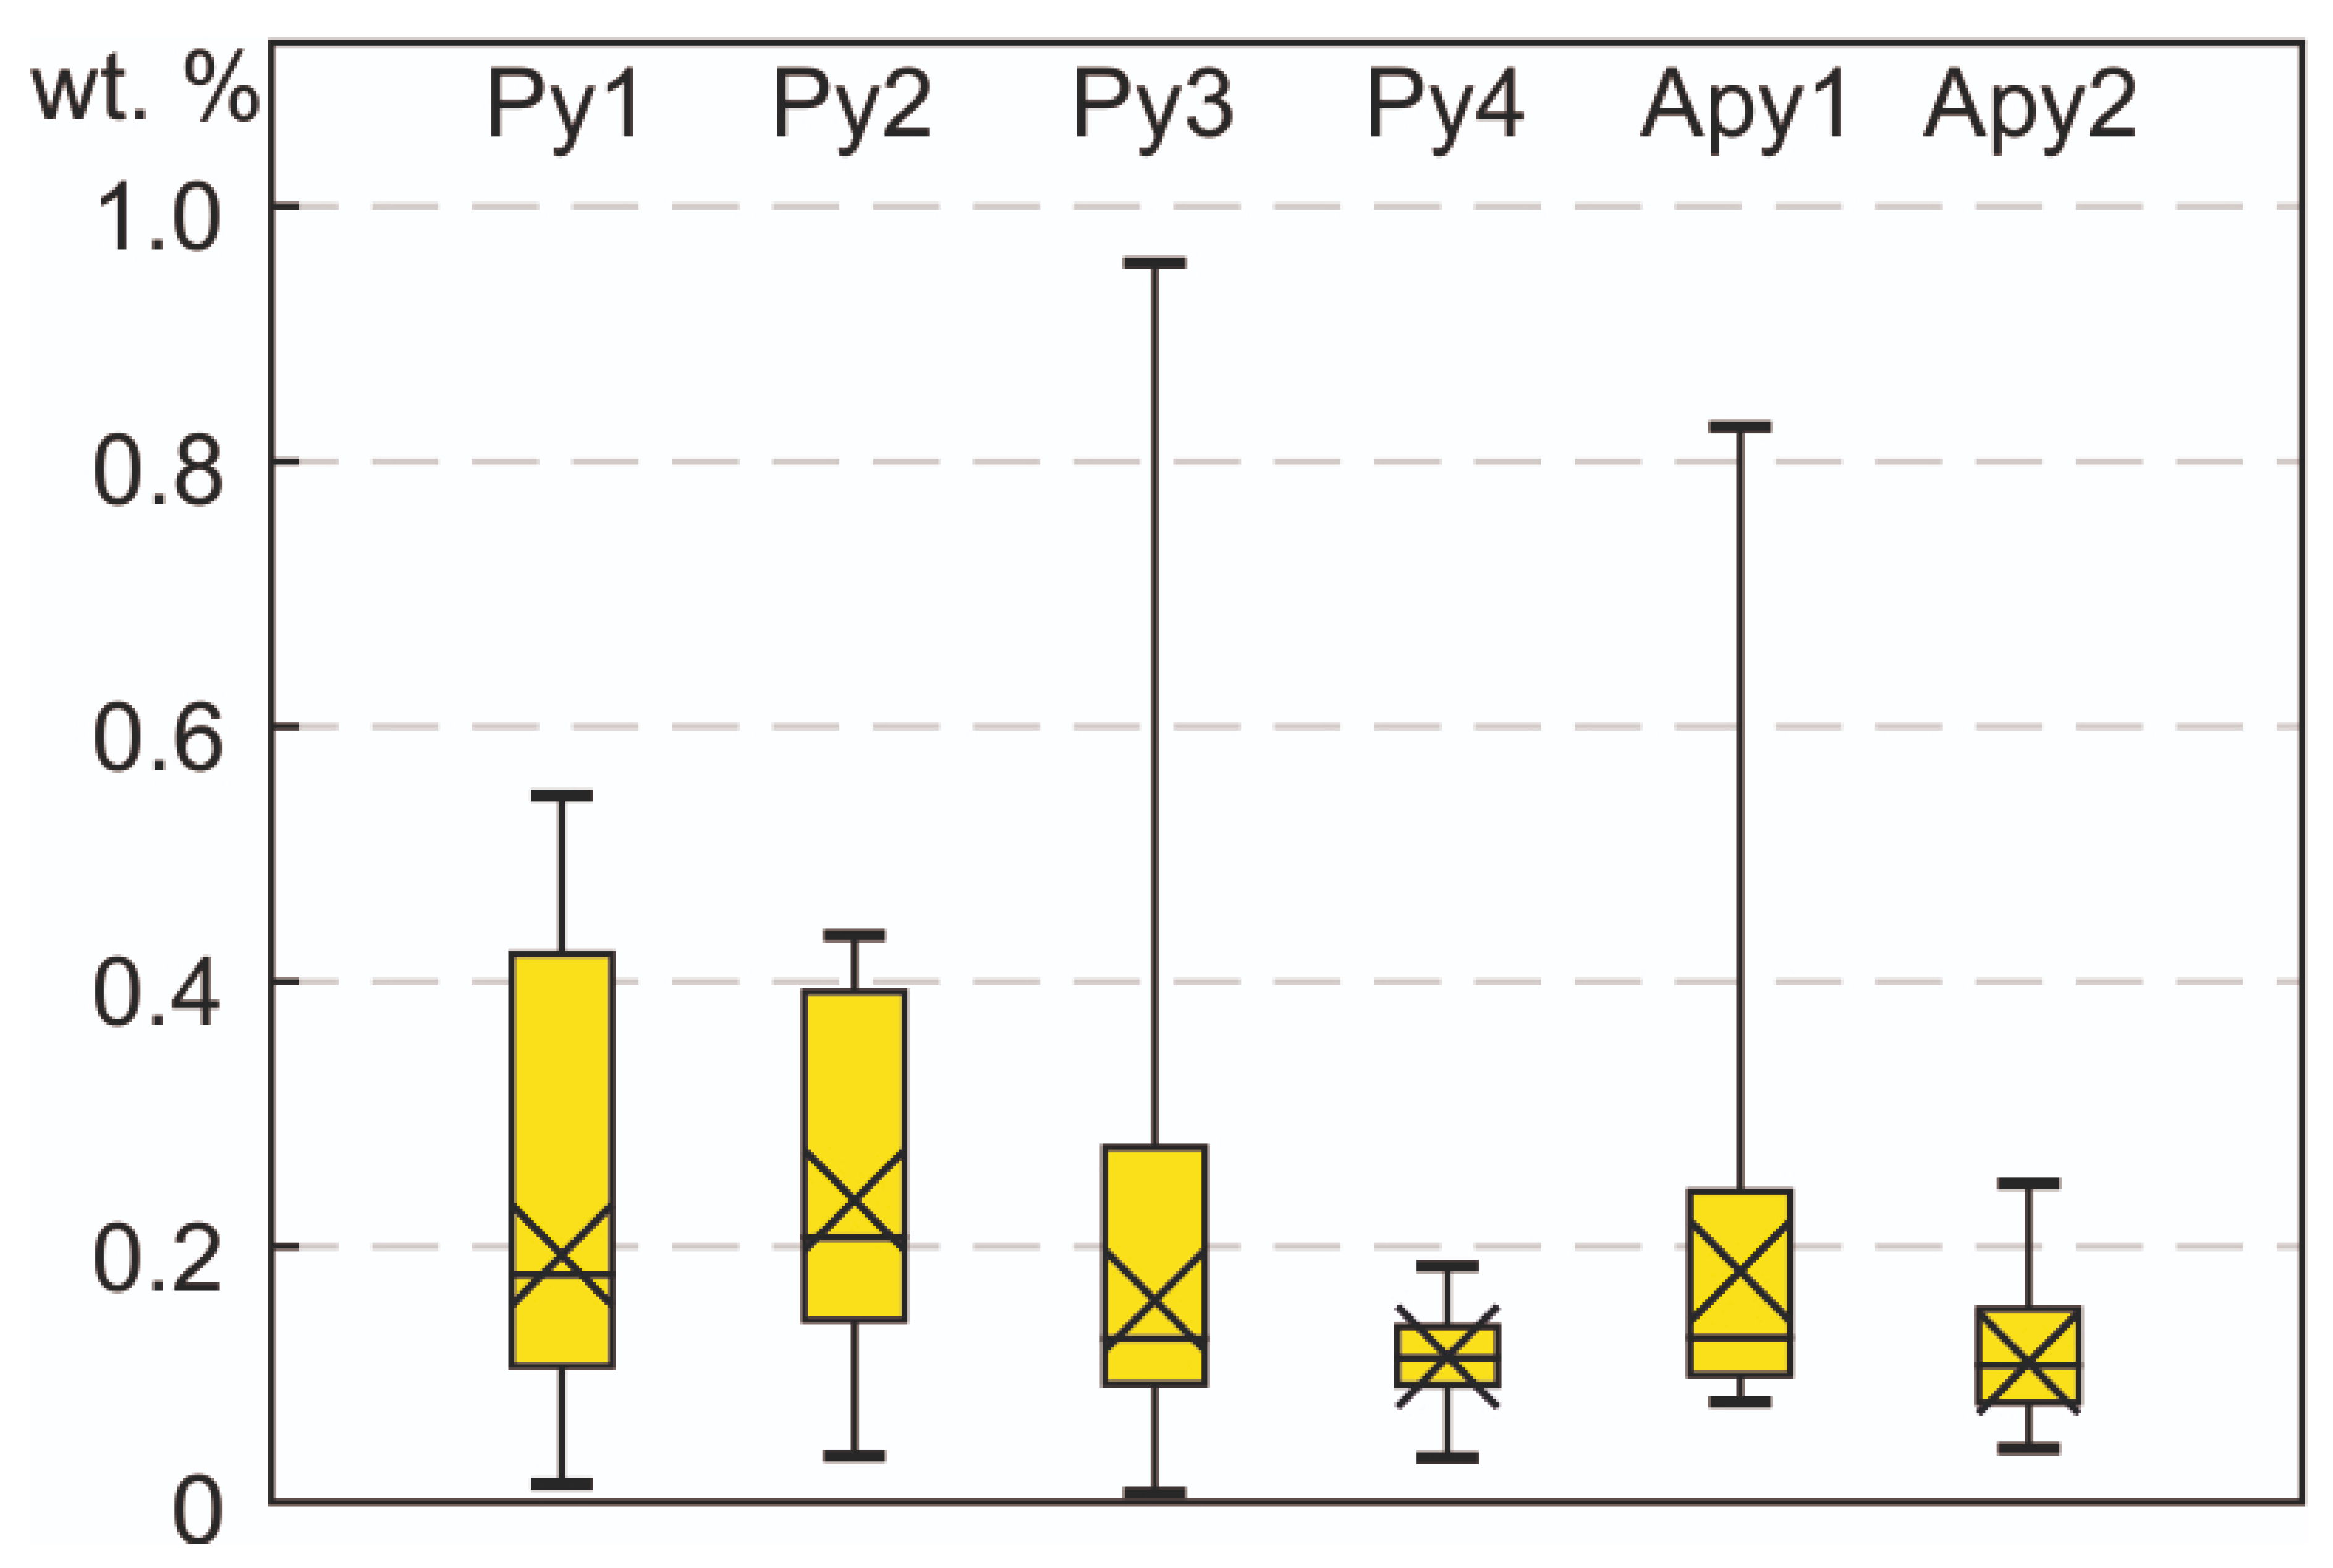
4.2.1. EPMA Results: Major and Minor Elements CAPS

The results of electron probe micro-analyzer (EPMA) spot analysis of the different varieties of pyrite are given in Table 1. All types of pyrite contain As, Co, Ni, Cu, and Sb impurities, the most abundant of which is As.
In Py1 and Py2, the total content of minor elements varies from 0.04 to 0.8 wt.%. The As concentrations are within 0.01–0.31 wt.%, making up 30–70% of the total. About 10% of the analyzed pyrite grains refer to the arsenic-free variety because their As values are below the detection limit of the probe. Py1 and Py2 have permanent minor elements of Co (coefficient of variation (CV) = 48%) and Ni (CV = 104%). Their contents range as follows: 0.02–0.2 wt.% Co and 0.02–0.33 wt.% Ni (Figure 9A,B). The Co/Ni ratio varies from 0.2 to 18.5; 70% of the analyzed grains have СCo > CNi, which are characterized by a strong correlation (r = 0.74). Copper constitutes 5–6% of the total amount of trace elements in Py1 and Py2 (0.02–0.11 wt.% Cu), and its content is variable, even within the same crystal. Another constant but quantitatively insignificant minor element in Py1 and Py2 is Sb (0.03–0.1 wt.% Sb). Correlation analysis revealed a Co–Ni–Pb geochemical association in Py1. The empirical formula of sedimentary and metamorphic pyrite is Fe0.96–1.04Ni0.0–0.01S2.00 (Ni is present in 18% of the analyzed grains).
In Py3, the total amount of minor elements varies from 0.38 to 3.27%, with the As proportion higher than 75%. The As content in 47% of the analyzed grains is 1–3 wt.%. The amounts Co, Ni, Cu, and Sb in Py3 are most subject to variation, but are generally comparable with those in Py1 and Py2 (Figure 9C). Cu is present in all analyzed grains, and its content varies from 0.02 to 0.2 wt.%, in rare cases ranging as high as 0.6 wt.%. Nickel is present in significant amounts in 60% of the analyzed grains (0.02–0.48 wt.% Ni). The Co/Ni ratio is from 0.2 to 32.5. In Py3, Co prevails over Ni, and their correlation coefficient is moderate (r = 0.6). The Cu content does not exceed 0.12 wt.%, and in 48% of the analyzed grains its concentration is below the detection limit. There is a moderate correlation between Cu and Au (r = 0.48). About 30% of the analyzed grains have Pb with an average content of 0.04 wt.%. The metasomatic Py3 formula is Fe0.98–1.08Ni0.0–0.01Co0.0–0.01S1.95–2.00As0.01–0.05.
In veined Py4, the total content of minor elements varies from 0.49 to 2.62 wt.%, of which 80–90% is As. Py4 is characterized by the permanent presence of Co, Ni, Cu, and Sb, but their total content is low (0.04–0.18 wt.%) (Figure 9D). Co is the most stable element (CV = 26%) with a content of 0.025–0.077 wt.%. The Ni in Py4 is the lowest of all pyrite generations (0.002–0.054 wt.%). The Co/Ni ratio is >1.0, so there is no correlation between these elements. The contents of Cu and Sb in Py4 remain unchanged, averaging 0.02–0.03 wt.%. A positive Sb–As correlation is observed (r = 0.6). A negative correlation between As and S (r = –0.42; Figure 10B) indicates isomorphic As → S substitution in the pyrite structure. The vein Py4 formula is Fe0.98–1.07S1.96–1.99As0.01–0.04.
In Apy1 and Apy2, Co, Ni, Cu, and Sb are typochemical minor elements. In 70% of analyzed Apy1 grains, the total content of trace elements does not exceed 0.2 wt.%. Ni shows uneven distribution in Apy1 (CV = 179%) and is the most abundant trace element (0.003–0.687 wt. % Ni) (Figure 9E). In 50% of analyzed Apy1 grains, the Cu concentration is below the detection limit of the probe, and it seldom exceeds 0.01 wt.%. The content of Co and Sb amounts to 0.06 wt.% on average. The formula of metasomatic Apy1 is Fe0.93–1.04As0.86–1.01S0.99–1.14.
In veined Apy2, the contents of Co, Ni, Cu, and Sb are lower than in Apy1 and do not exceed 0.24 wt.% in total (Figure 9F). Cobalt is a constant minor element; its content is two times lower than in Apy1 (0.015–0.067 wt.% Co), but always exceeds the nickel amount (Co/Ni = 1.1–22.5). Sb is steady and the most quantitatively significant minor element in Apy1, accounting for about 60% of the total volume (0.01–0.22 wt.% Sb). Cu concentration above the detection limit was recorded in only 20% of the analyzed grains and did not exceed 0.02 wt.%.

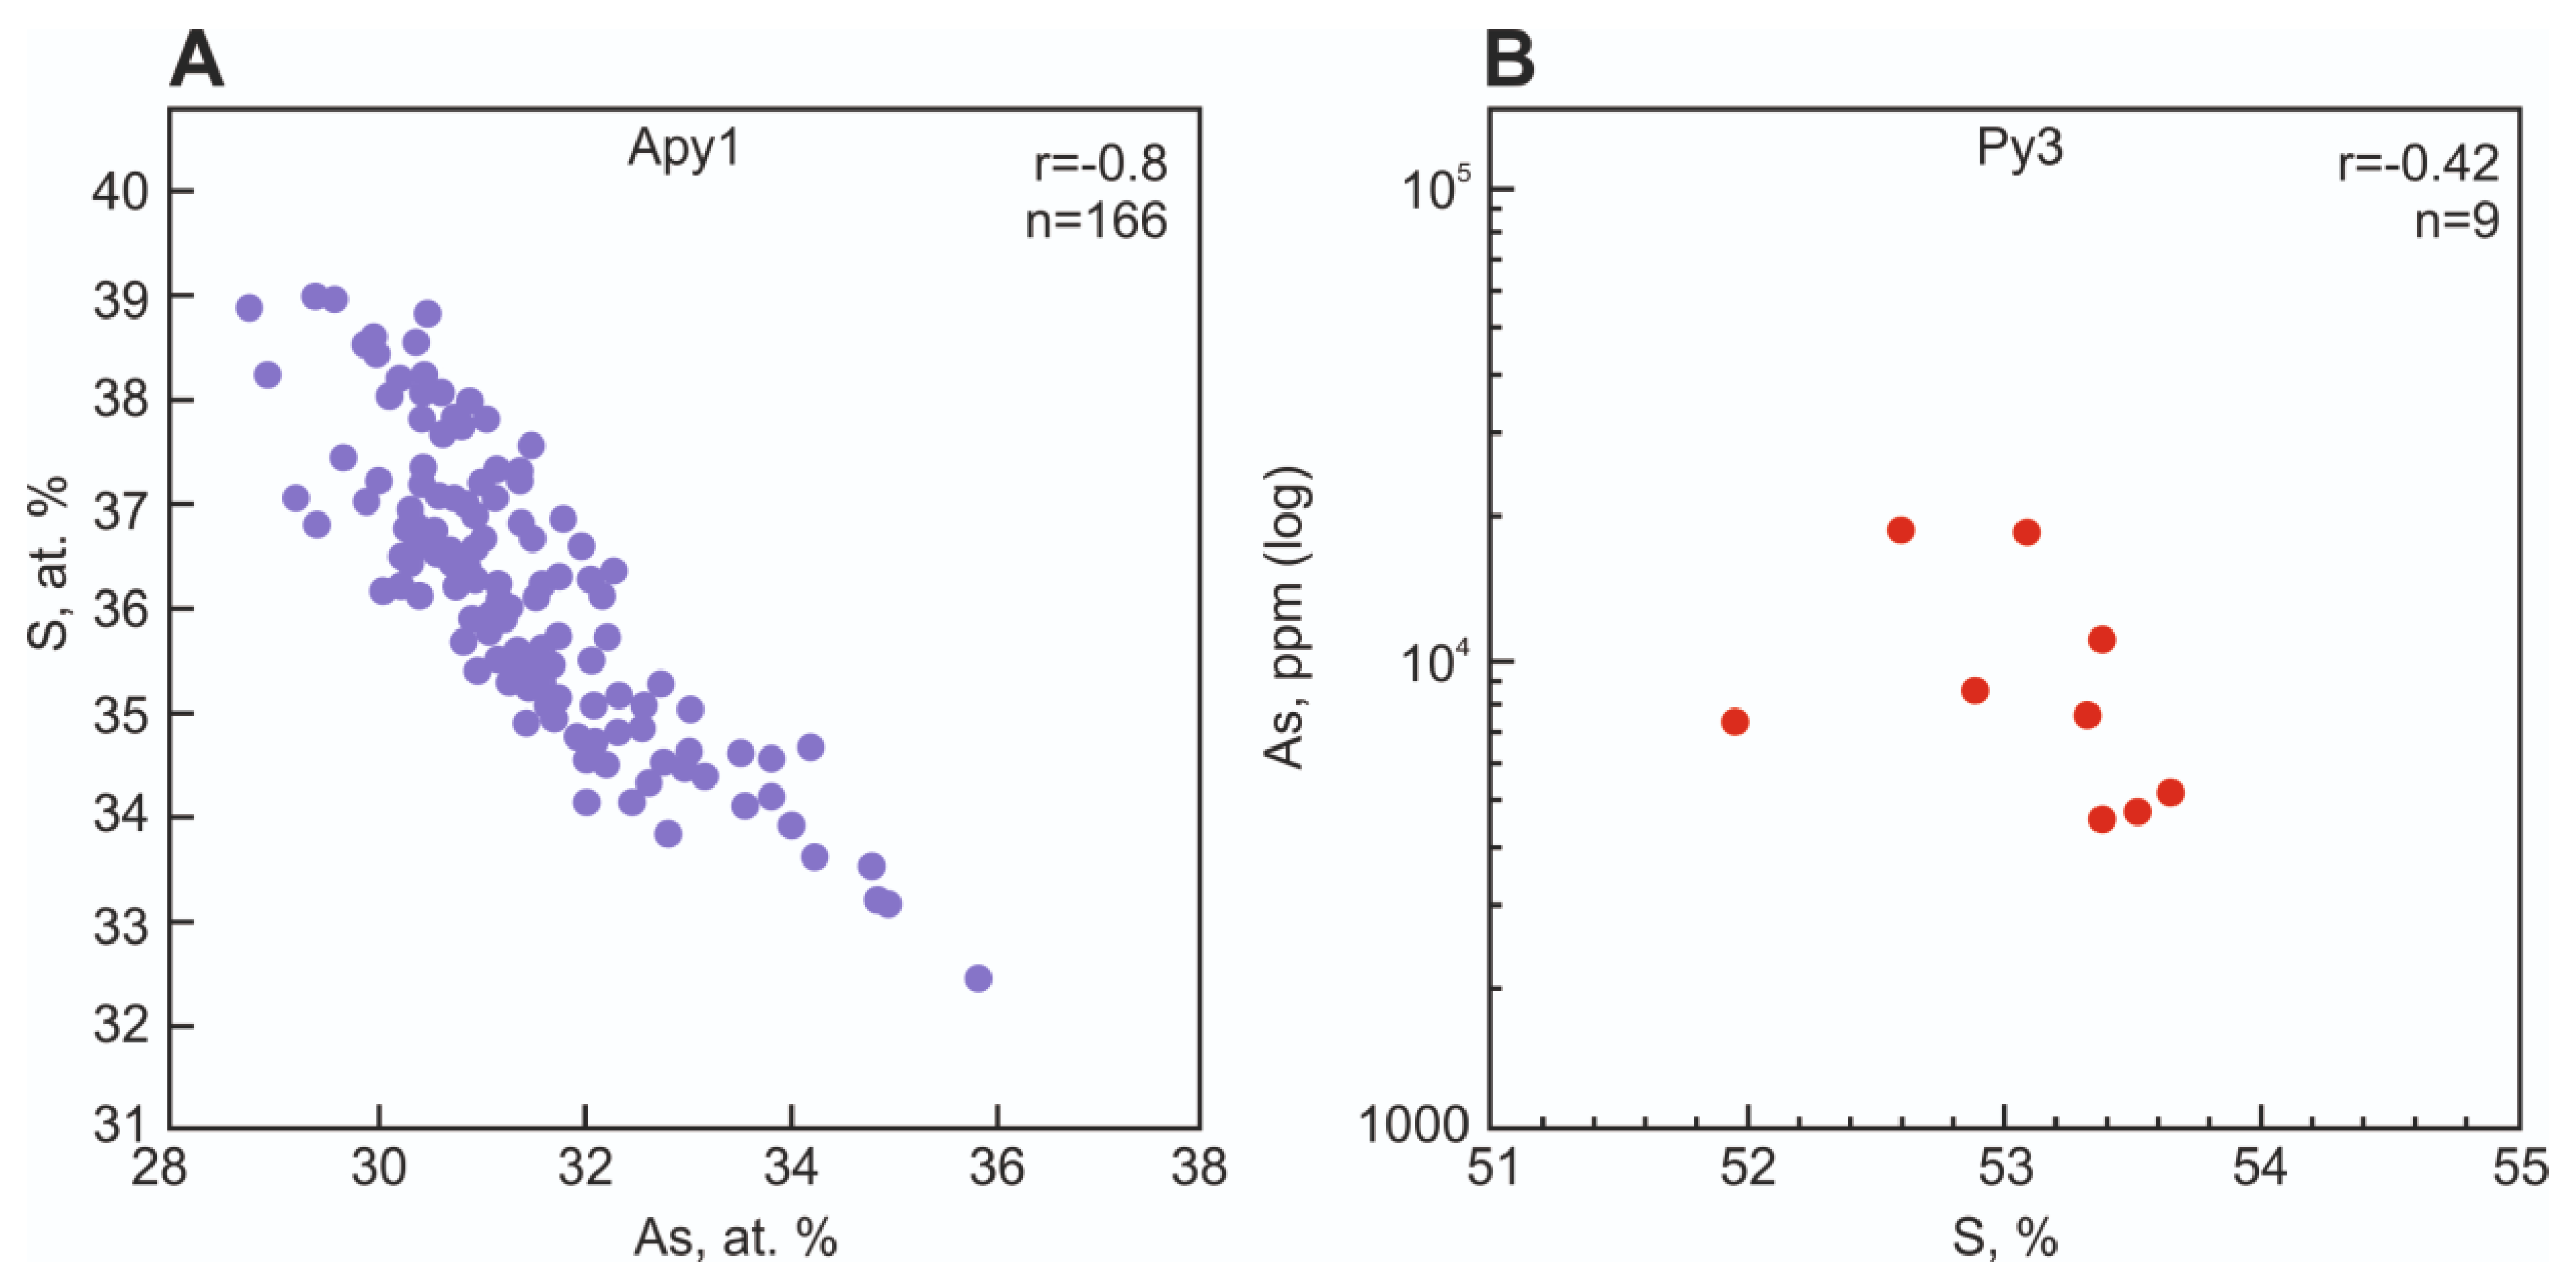
4.2.2. Gold and Trace Element Concentrations in Py3 and Apy1 According to LA-IСP-MS Data

The chemical composition of Py3 and Apy1 was studied in more detail, because these generations are the most widespread and have an elevated content of invisible gold (Table 2). According to the LA-IСP-MS data, Py3 contains, apart from typochemical elements (As, Co, Ni, Cu, and Sb), a number of trace elements, such as Zn (3.5–6.4 ppm, avg. 4.5 ppm), Ag (0.008–1.01 ppm, avg. 0.448 ppm), Cd (0.024–0.065 ppm, avg. 0.038 ppm), Te (0.06–0.31 ppm, avg. 0.15 ppm), Pb (0.5–860 ppm, avg. 110.0 ppm), Bi (0.02–0.93 ppm, avg. 0.26 ppm), Hg (0.01–0.36 ppm, avg. 0.21 ppm), and Au (0.1–15.9 ppm, avg. 3.4 ppm) (Table 2). Correlation analysis revealed several geochemical associations. Au has a high correlation with As (r = 0.9), Cu (r = 0.92), and Cd (r = 0.97).
According to LA-IСP-MS data, Apy1 grains contain, along with typochemical Co, Ni, Cu, and Sb elements, a number of trace elements including Zn (0.7–15.0 ppm, avg. 3.9 ppm), Ag (0.2–1.5 ppm, avg. 0.6 ppm), Te (0.01–8.00 ppm, avg. 1.87 ppm), Pb (2.0–76.0 ppm (avg. 18.7 ppm), Bi (0.1–1.4 ppm, avg. 0.6 ppm), Hg (0.25–1.95 ppm, avg. 0.72 ppm), and Au (0.3–6.1 ppm, avg. 1.5 ppm) (Table 2). Correlation analysis revealed several geochemical associations. Au has a moderate correlation with Cu (r = 0.59) and Zn (r = 0.63).

4.3. Gold Content of Sulfides from Proximal Metasomatites and in Veins

Table 3 shows the results of atomic absorption analysis of proximal metasomatites, their sulfides, and sulfides in veins. The average Au content in Py3 is 12.51 ppm and in Ag is 5.89 ppm. In Apy1, Au varies from 12.3 to 23.8 ppm (17.51 ppm on average), and Ag from 0.43 to 11.83 ppm (6.48 ppm on average). Proximal metasomatites contain Au from 0.001 to 5.29 ppm (0.81 ppm on average), and Ag from 0.007 to 0.14 ppm (0.06 ppm on average). The Au grade in Py4 averages 29.30 ppm and in Ag 6.35 ppm; in Apy2 the Au value amounts to 20.49 ppm, and in Ag 2.06 ppm.

4.4. Sulfur Isotopic Composition of Sulfides

The sulfur isotopic composition of sulfides at the Khangalas deposit has a narrow range of negative δ34S values close to 0 (−2.0 to 0.6‰) (Table 4), for gold-bearing Py3 it is δ34S = −0.6‰ (21.4 ppm Au, K-9-17), for Apy1 it is δ34S = −1.2‰ (12.3 ppm Au, K-4-17), and for Apy2 it is δ34S = −2.0 ‰ (KG-35-19).

5. Discussion

5.1. Pyrite and Arsenopyrite Types and Textures

The formation of pyrites took place for a long time, under changing physicochemical conditions, which is reflected in the morphology of crystals and the place of their formation. The morphology becomes more complex: from framboid and cubic forms to pentagonal dodecahedra. Rounded (framboid) microaggregates of Py1 were formed during the sedimentary–diagenetic stage of the clastic strata deposition subsequent to a change in the redox potential of the sedimentation environment. Py1 accumulations are often arranged parallel to the rock bedding. Some framboids have a zonal structure with fragments of rocks and minerals present in the central part. In part, early pyrites served as a substrate/nucleus for metamorphic Py2 formed during recrystallization. Accumulations of finely crystalline Py2 are confined to microfractures and foliation planes formed in the process of dislocation-metamorphic transformation of rocks. Py2 underwent cataclasis under the effect of late deformation processes. Py3 was developed in the wall rock zones; it has cubic and pentagonal-dodecahedral forms. The complication of crystal forms is accompanied by a change in the type of conductivity and the appearance of defects in the crystal lattice, which is a positive factor for isomorphic Au substitution into pyrite. Py3 is also characterized by a zonal or block structure, which provides the possibility for gold adsorbtion at interphase boundaries and crystal growth planes [54]. In quartz veins, Py4 occurs as intergrowths and aggregates, less often as individual grains altered in the course of cataclasis and corrosion processes. They contain numerous inclusions of late sulfides and native gold.
In the zone of wall rock metasomatism, along with Py3, euhedral short prismatic Apy1 is developed. It forms disseminated grains and intergrowths, as well as aggregates and microveinlets. Macroinclusions are most often represented by silicate minerals entrapped during the crystal growth. Late sulfides, sulfosalts, and native gold are recorded as microinclusions, which are confined to the crystal growth zones. From the results of AFM analysis, Vorobiev and Kozyrev [54] came to the conclusion that Au (III) is sorbed to a greater extent on the FeAsS surface, being reduced to Au (0). Thus, it can be assumed that the gold content of metamorphic arsenopyrite is partially related to the adsorption of gold nanoparticles on the crystal growth surfaces. Vein Apy2 forms nests and clusters, often in association with Py4. In some Apy2 grains, zoning is observed, which is expressed by microtextures of replacement of the central part of the crystals by late sulfides and native gold.

5.2. Composition of Pyrite and Arsenopyrite

All generations of pyrite and arsenopyrite from the Khangalas deposit have a nonstoichiometric composition. Elevated and reduced Fe/(S + As) values are observed (Py1: 0.48–0.52; Py2: 0.48–0.53; Py3: 0.47–0.54; Py4: 0.49–0.53; Apy1: 0.42–0.52; Apy2: 0.45–0.51).
The As/S atomic ratio is an indicator of the temperature in the sulfur-buffer group, i.e., it increases with increasing temperature (see [55,56,57], etc.). Apy1 from the Khangalas deposit has As/S < 1 (0.81 to 0.93). For Apy2, this ratio is higher: 30% of the analyzed grains have As/S > 1 (1.01 to 1.08). Kovalchuk et al. [55] studied the composition of arsenopyrite at the Vorontsovskoye deposit (Northern Urals, Russia) and showed that in arsenopyrite enriched in sulfur and depleted in gold, the ratio is As/S < 1, and in arsenopyrite depleted in sulfur and enriched in gold it is As/S > 1. The crystallization temperature and fugacity of sulfur in Apy1 are higher than in Apy2. These data suggest that the Apy2 vein of the Khangalas deposit crystallized at a higher temperature and S fugacity than Apy1. Arsenopyrite from the Khangalas deposit is characterized by negative correlation coefficients between As and S (r = –0.65 for Apy1 (Figure 10A) and r = –0.85 for Apy2), which reflects their pairwise replacement during crystallization [56,58,59,60,61].
Microprobe analysis of the chemical composition of pyrite and arsenopyrite revealed a range of stable minor and trace elements in them. The main indicator element in pyrite is As. Pre-ore pyrite has As ≤ 0.3 wt.%, while syn-ore pyrite exhibits As ≥ 0.3 wt.%. In diagenetic and metamorphic pyrites, As makes up 30–35% of the total volume of trace elements; in the ore-stage metasomatic and vein pyrite, the proportion of As reaches 85–91% (max 3.19 wt.% As). The distribution of As in pyrite is uneven even within one grain. For Py1 and Py2, increased As content in the center of grains is often observed; for Py3 and Py4, blocks of maximum As content are characteristic.
Other typochemical minor elements (Co, Ni, Sb, Cu, Pb) are present in all generations of pyrite and arsenopyrite, and their proportion decreases from the pre-ore to the hydrothermal stage (Figure 11).
Pyrite of early generations (Py1, Py2) is persistent in Cu content. In hydrothermal-metasomatic Py3 and Py4, the Cu content is reduced, and in Apy1 and Apy2, Cu concentration above the detection limit is found in only few grains. Most likely, this is due to the isomorphic Cu → Au substitution in sulfides.
Sb is a permanent trace element in pyrites and arsenopyrites. It can enter the pyrite structure isomorphically by replacing S to form [S–Sb]3− or [Sb–Sb]4− dumbbells [62]. The negative correlation (r = 0.3–0.6) between antimony and iron indicates the possibility of isomorphic Fe → Sb substitution.
The presence of As, Co, Ni, Sb, Cu, and Au in Py1 is related to muds enriched in organic matter laid down by the water of marginal oceanic basins or inland seas [63,64]. They were isomorphically incorporated into Py1. During regional dislocation-metamorphic events, the processes of recrystallization of Py1 and redistribution of trace elements in it took place. For example, in Py2, a drop in Co and Sb content and a slight increase in Ni value are observed. Under the influence of hydrothermal-metamorphic solutions, pyrite gets freed of early trace elements and becomes enriched in As, Sb, and Au. Thus, according to the results of microprobe analysis, we observe regular changes in the range and content of trace elements in pyrite and arsenopyrite during their formation and transformation. This is evidenced by the concentration of elements and the degree of supersaturation of the solution during crystallization and recrystallization of sulfides [65].

5.3. Invisible Gold and Its Relationship with Other Elements in Py3 and Apy1 According to LA-ICP-MS Data

Trace elements revealed by the LA-ICP-MS method in Py3 and Apy1 can be divided into several independent groups according to the degree of their connection. A stable paragenetic association with strong correlations (r = 0.8–0.9) in both pyrite and arsenopyrite is formed by the trace elements of the first group: Ti, V, W, Sn, Ga, Ba, Ag, Pt, and Pd. Py3 also includes Cr and Au, with a moderate degree of correlation (r = 0.5–0.6). They do not form isomorphic substitutions in pyrite and arsenopyrite; they are present as nanoinclusions. The enrichment of sulfides with trace elements of the first group could partly be due to the entrapment of microinclusions of early minerals during crystal growth. The second stable geochemical association, Cu–Zn–Au, is connected with a polysulfide vein association of the hydrothermal stage of mineral formation. The minerals of these elements (chalcopyrite, sphalerite, and native gold) are present in Py3 and Apy1 in the form of nano- and microinclusions. Both pyrite and arsenopyrite are characterized by strong Sb–Bi and Se–Te correlations. In Apy1, these elements can be combined into one geochemical association, which also includes Co and Ni. For Py3, the Sb–Bi pair is supplemented by Pb, and one more stable Co–Mn–Mo–Se–Te geochemical association is observed. It is possible that the enrichment with these elements occurred at later stages of mineral formation, due to a deeper source. In general, these data confirm the conclusions of many researchers regarding different depth sources for fluids at the gold ore objects of the YKMP [66,67].
LA-ICP-MS trace element analysis of metasomatic Py3 and Apy1 made it possible not only to determine a range of trace elements, but also to analyze the relationship between Au and various components of the system. Trace elements, including Au, can be found in pyrite in various forms: solid solution, nanoparticles, and microinclusions [15,17,61,68,69].
Using a scanning electron microscope, microinclusions of native gold about 15 μm in size were detected in only one sample out of about 200 examined Py3 and Apy1 grains (Figure 6G). All other inclusions are galena, sphalerite, and chalcopyrite, and less often tetrahedrite and freibergite. This allows us to conclude that the elevated Au content in Py3 and Apy1 may be due to the presence of micro- and nanoinclusions of native gold. Low content is typical for gold incorporated in the crystal lattice of pyrite or its defects [17,60,68,70,71,72].

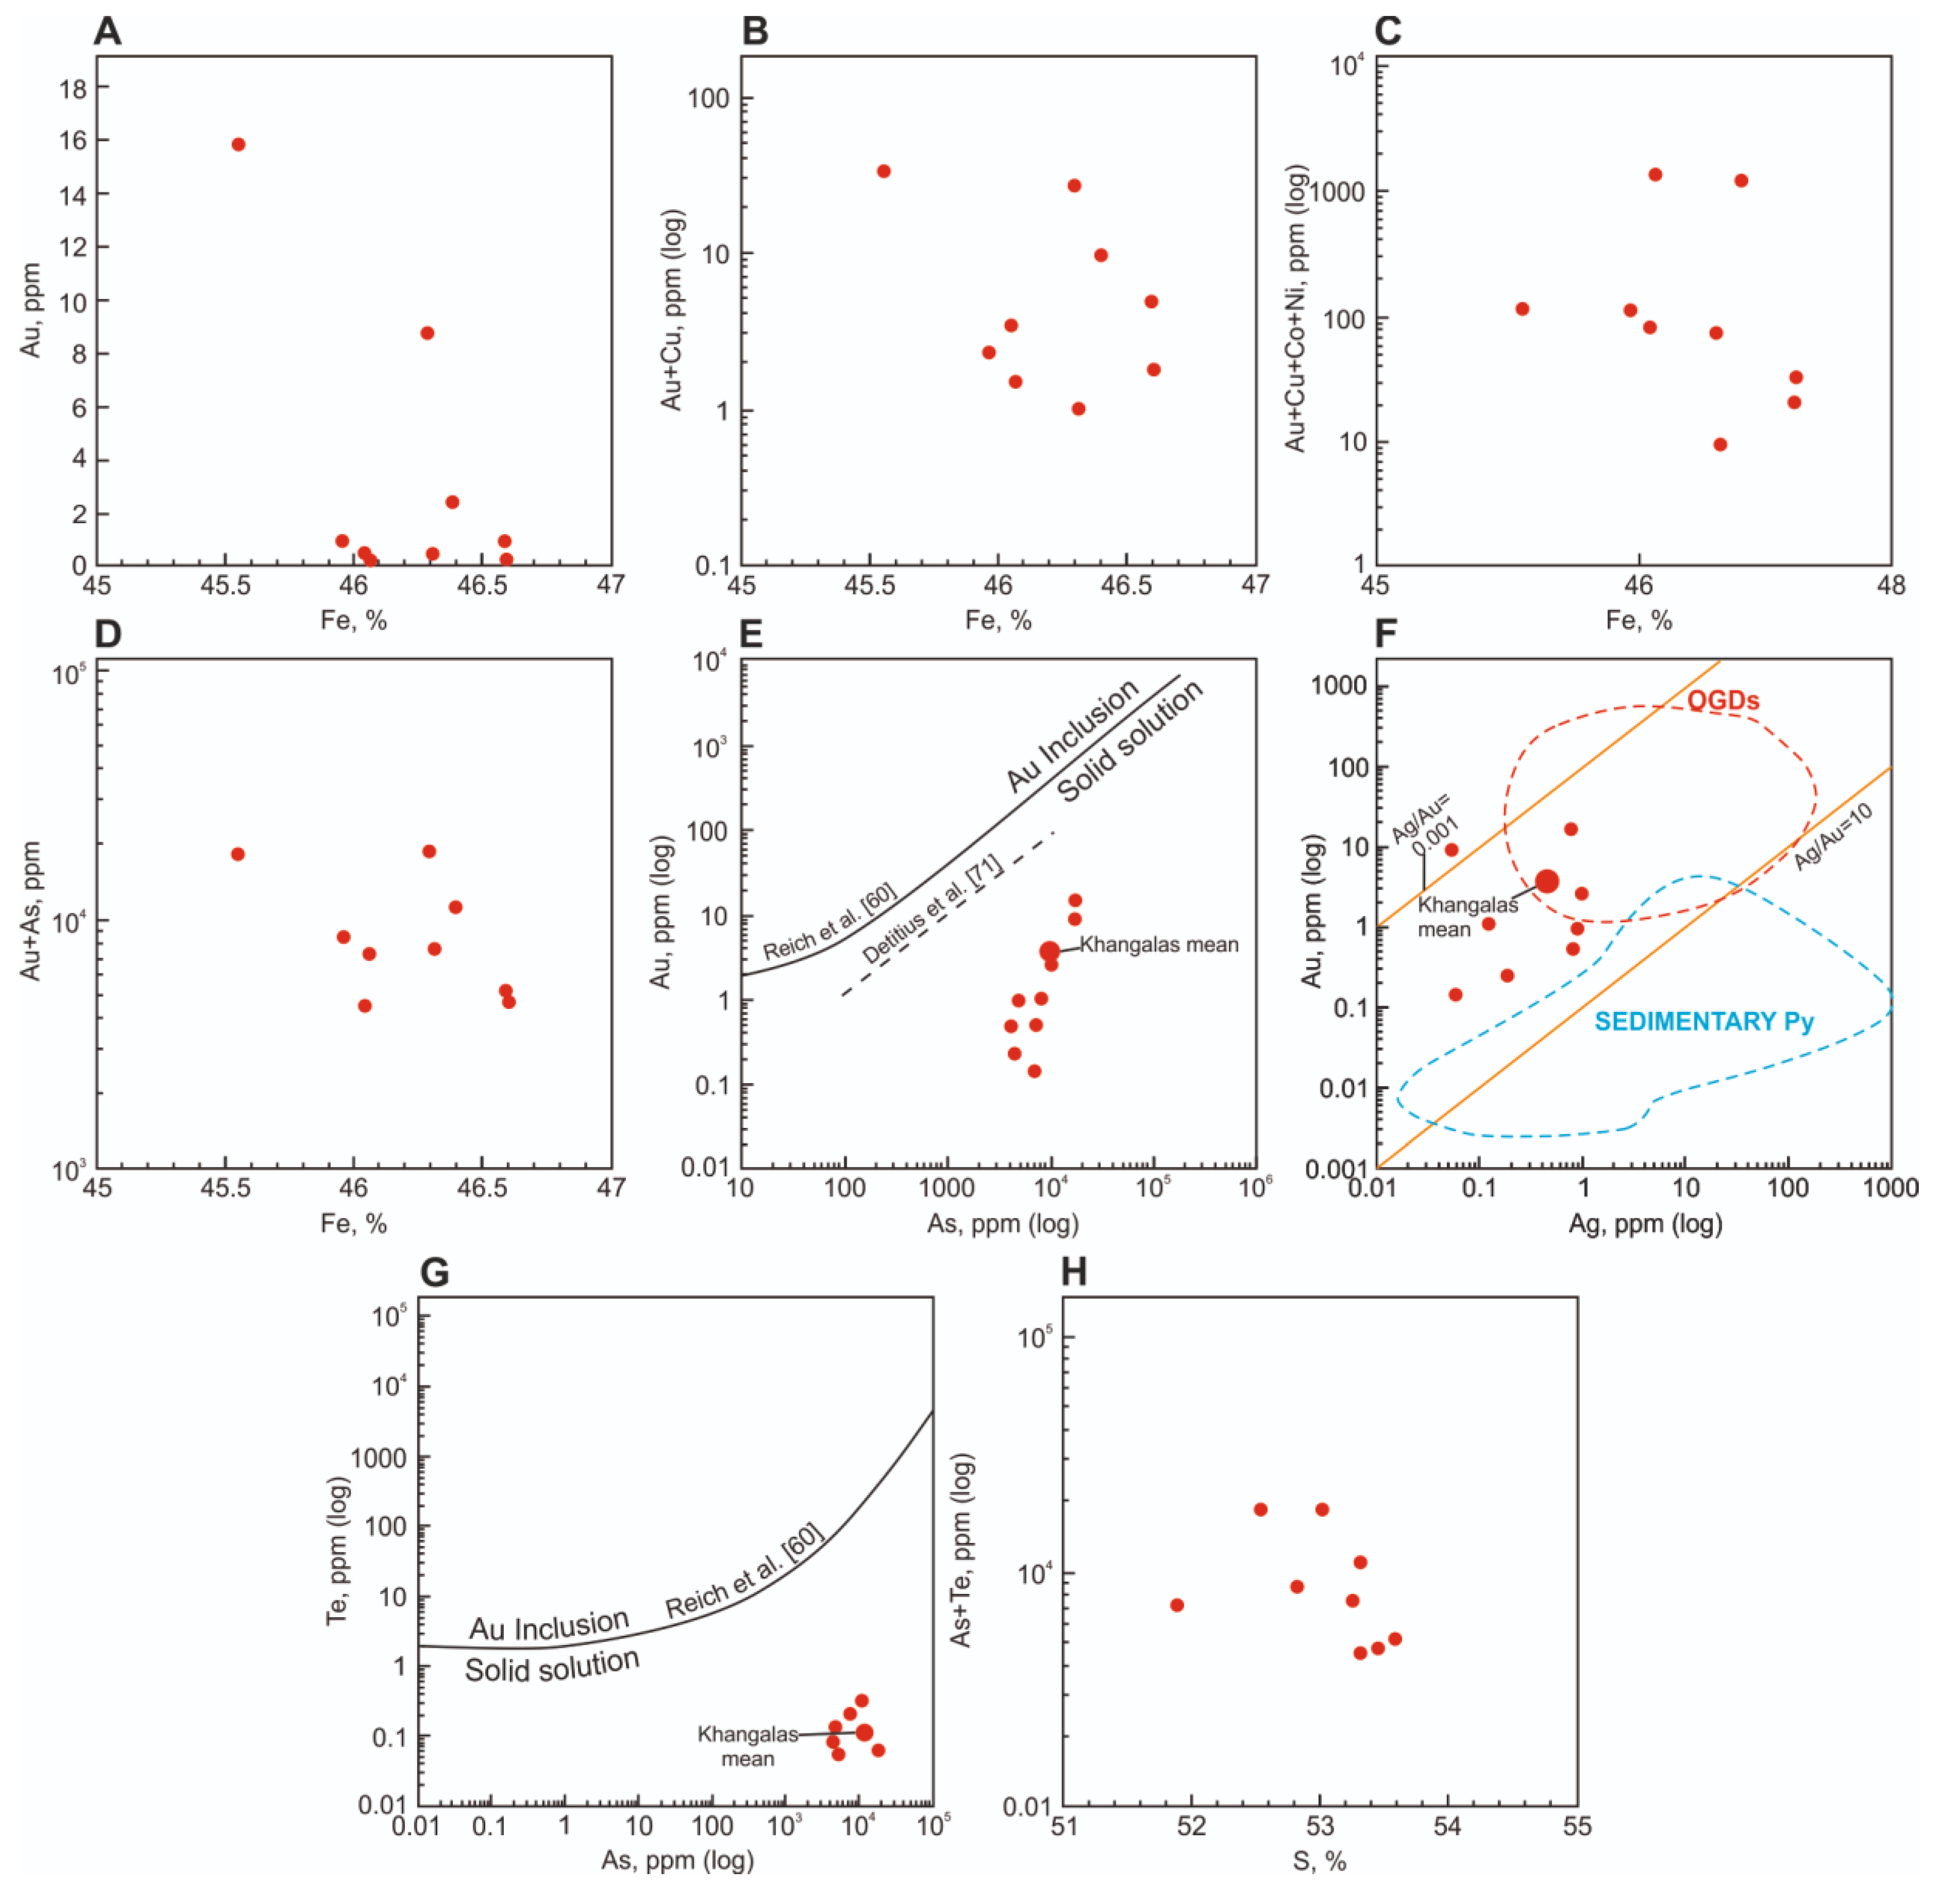
5.3.1. Invisible Gold in Py3

For Py3, a negative correlation is observed between Fe and Au (r = −0.6) (Figure 12A), which indicates an isomorphic Au ↔ Fe substitution [61]. A comparison of the physical characteristics of iron (atomic mass 55.85; Fe2+ ionic radius r = 0.80 Å) and gold (atomic mass 196.96; Au3+ ionic radius r = 0.85 Å; Au+ r = 1.37 Å) also confirms the possibility of isomorphic incorporation of Au into pyrite [73,74]. Chouinard et al. [75] proposed a conjugate substitution mechanism of Au3+ + Cu+ ↔ 2Fe2+ or Au+ + Cu+ + Co2+ + Ni2+ ↔ 3Fe2+ types (Figure 13B,C). According to Wang et al. [61], the marked negative relationship between (Au + As) and Fe in Py3 (Figure 12D) suggests that Au and As entered the lattice through isomorphic substitution for Fe under conditions of high oxygen fugacity (fO2).
There is a very close correlation between Au and As in Py3 from the Khangalas deposit (r = 0.9) (Figure 12E). Such a close relationship between Au and As (r > 0.5) in pyrite and arsenian pyrite from various types of gold deposits has been noted by many authors [17,60,68,71,76], etc. Elevated As content is characteristic of pyrite with excess iron (S/Fe = 1.9–1.98). In the pyrite structure, As isomorphically replaces S (Fe1.00(S1.98As0.02)2.00) to form, in some cases, arsenian pyrite (As > 1.7 %), which is typical for reducing conditions (see [60,77], etc.). Reich et al. [60] noted for epithermal and Carlin-type deposits increased Au solubility in the pyrite structure with increasing As content: CAu = 0.02 · CAs + 4 × 10⁻⁵.
Based on EPMA, LA-ICP-MS, SIMS, and l-PIXE analyses, Deditius and co-authors [71] studied the mechanism of Au and As incorporation and the solubility of gold in pyrite from various types of deposits. In addition to the Carlin and epithermal types, pyrites from porphyry Cu, Cu–Au, orogenic (OGD), volcanic-massive sulfide (VMS), iron-oxide copper-gold (IOCG), Witwatersrand Au, and coal deposits were studied. Deditius et al. [71] found that on the Au–As diagram, the analysis of pyrite from gold deposits showed that they form a wedge-shaped zone and most of the data points fall below the Au saturation line of the solution determined by Reich et al. [60] (Figure 12E). They show that Au+ is the dominant form of gold in the arsenian pyrite of the studied deposits. Analytical data [60] indicate that the Au solubility limit in arsenian pyrite of epithermal deposits is defined by an Au/As ratio of ~0.02. The solubility limit of Au in pyrite of orogenic deposits is lower (~0.004) [71].
Our LA-ICP-MS results for Py3 are in good agreement with those of Reich et al. [60] and Deditius et al. [71]. Figure 13F shows that, in the Au–As (ppm, log) coordinates, all samples of the studied Py3 from the Khangalas deposit fall into the field of structurally bound gold (Au+). These results are confirmed by the rather low Au content in the analyzed Py3: in most samples, Au does not exceed 2.5 ppm (Table 2). Earlier, Tauson et al. [76] showed that the content of the Au+ structural form in the studied pyrite samples from deposits of different genetic types in Russia (large Natalka and Degdekan orogenic gold-quartz deposits, Dukat volcanogenic-plutonogenic Au–Ag deposit, Dalnee and Oroch volcanic Au–Ag deposits, Sukhoi Log giant deposit with a debated genesis, Pokrovskoye epithermal Au–Ag deposit, Amur Dikes deposit with an unconventional type of mineralization, and Zun–Kholbinskoye deposit with a controversial genesis) and Uzbekistan (Kochbulak and Kyzylalmasay epithermal Au–Ag deposits) does not exceed ~5 ppm. Similar results were obtained by Deditius et al. [71] for pyrite from orogenic gold deposits, which, according to their data, contains less than 100 ppm Au. The higher Au content is mainly due to the presence of nano- and microparticles of native gold [78]. The occurrence of native superficially bound Au0 in sulfides of metasomatites is reported from deposits of various genetic types [60,68,76,79].
Keith et al. [70] applied the Au solubility line [60] to the Te–As system, which made it possible to distinguish between Te in a solid solution and Au-tellurides in inclusions in pyrite. As shown in Figure 12G, the Te–As values are below the Au solubility line, which indicates that Te is incorporated in the Py3 lattice. This is confirmed by the fact that no Au-telluride microinclusions were found in Py3 grains under a scanning electron microscope. There is a weak positive correlation between As and Te (r = 0.24), while the relationship between As + Te and S in Py3 is negative (Figure 12H); nevertheless, it is known that As significantly affects the appearance of Te nano- and microinclusions in pyrite due to structural distortions [70].
One of the criteria for discriminating between sedimentary and hydrothermal-metasomatic disseminated orogenic pyrite in sedimentary rocks is the Ag/Au ratio. According to Large and Maslennikov [68] and Gregory et al. [80], disseminated arsenian pyrite from deposits with Au–As associations (Mt. Olympus, Macraes) has small Ag/Au values (up to 1), while sedimentary pyrite features a higher Ag/Au ratio (up to 1000). The Ag/Au ratio in Py3 from the Khangalas deposit ranges from 0.01 to 1.7 (0.5 on average). Figure 12F shows the average Ag/Au ratio for Py3 of the Khangalas deposit, which falls within the field of orogenic deposits and is consistent with the results of [68].

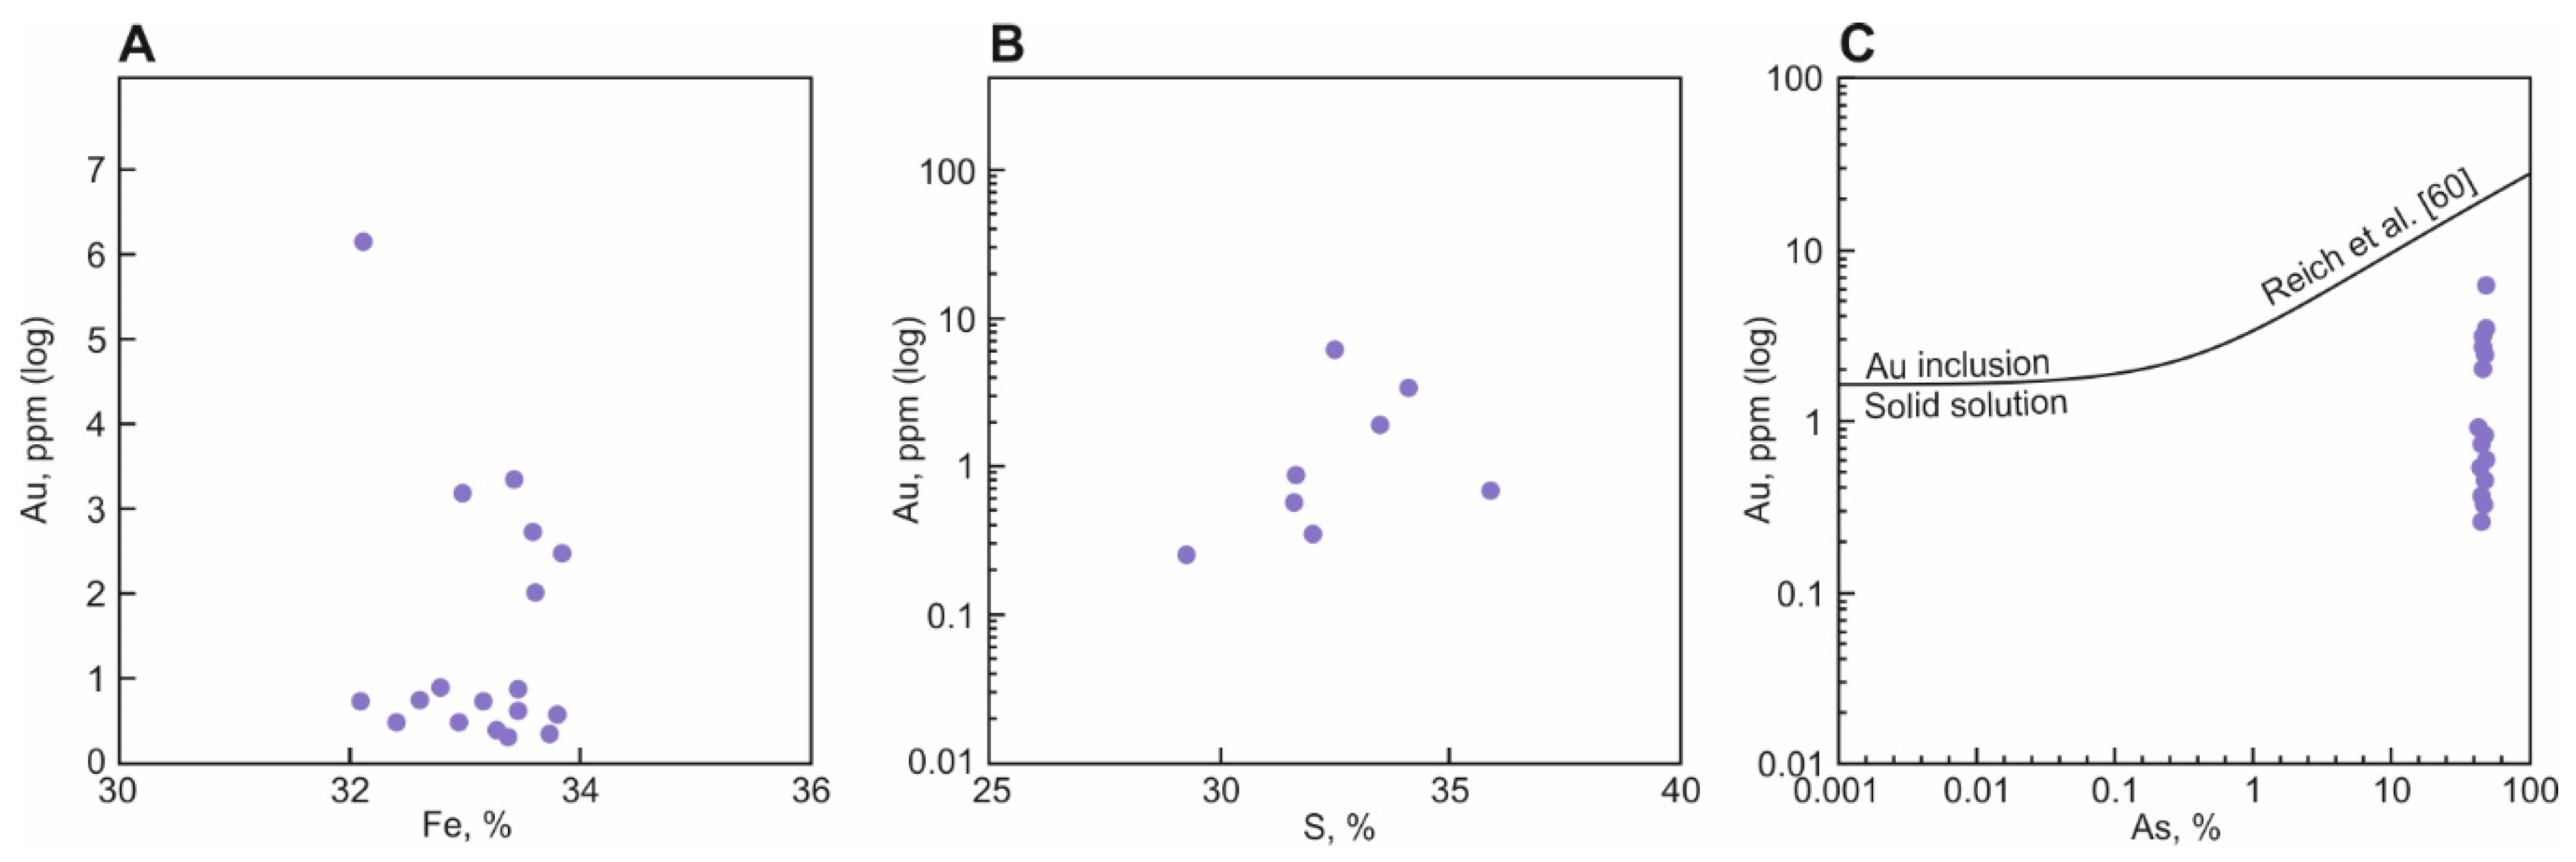
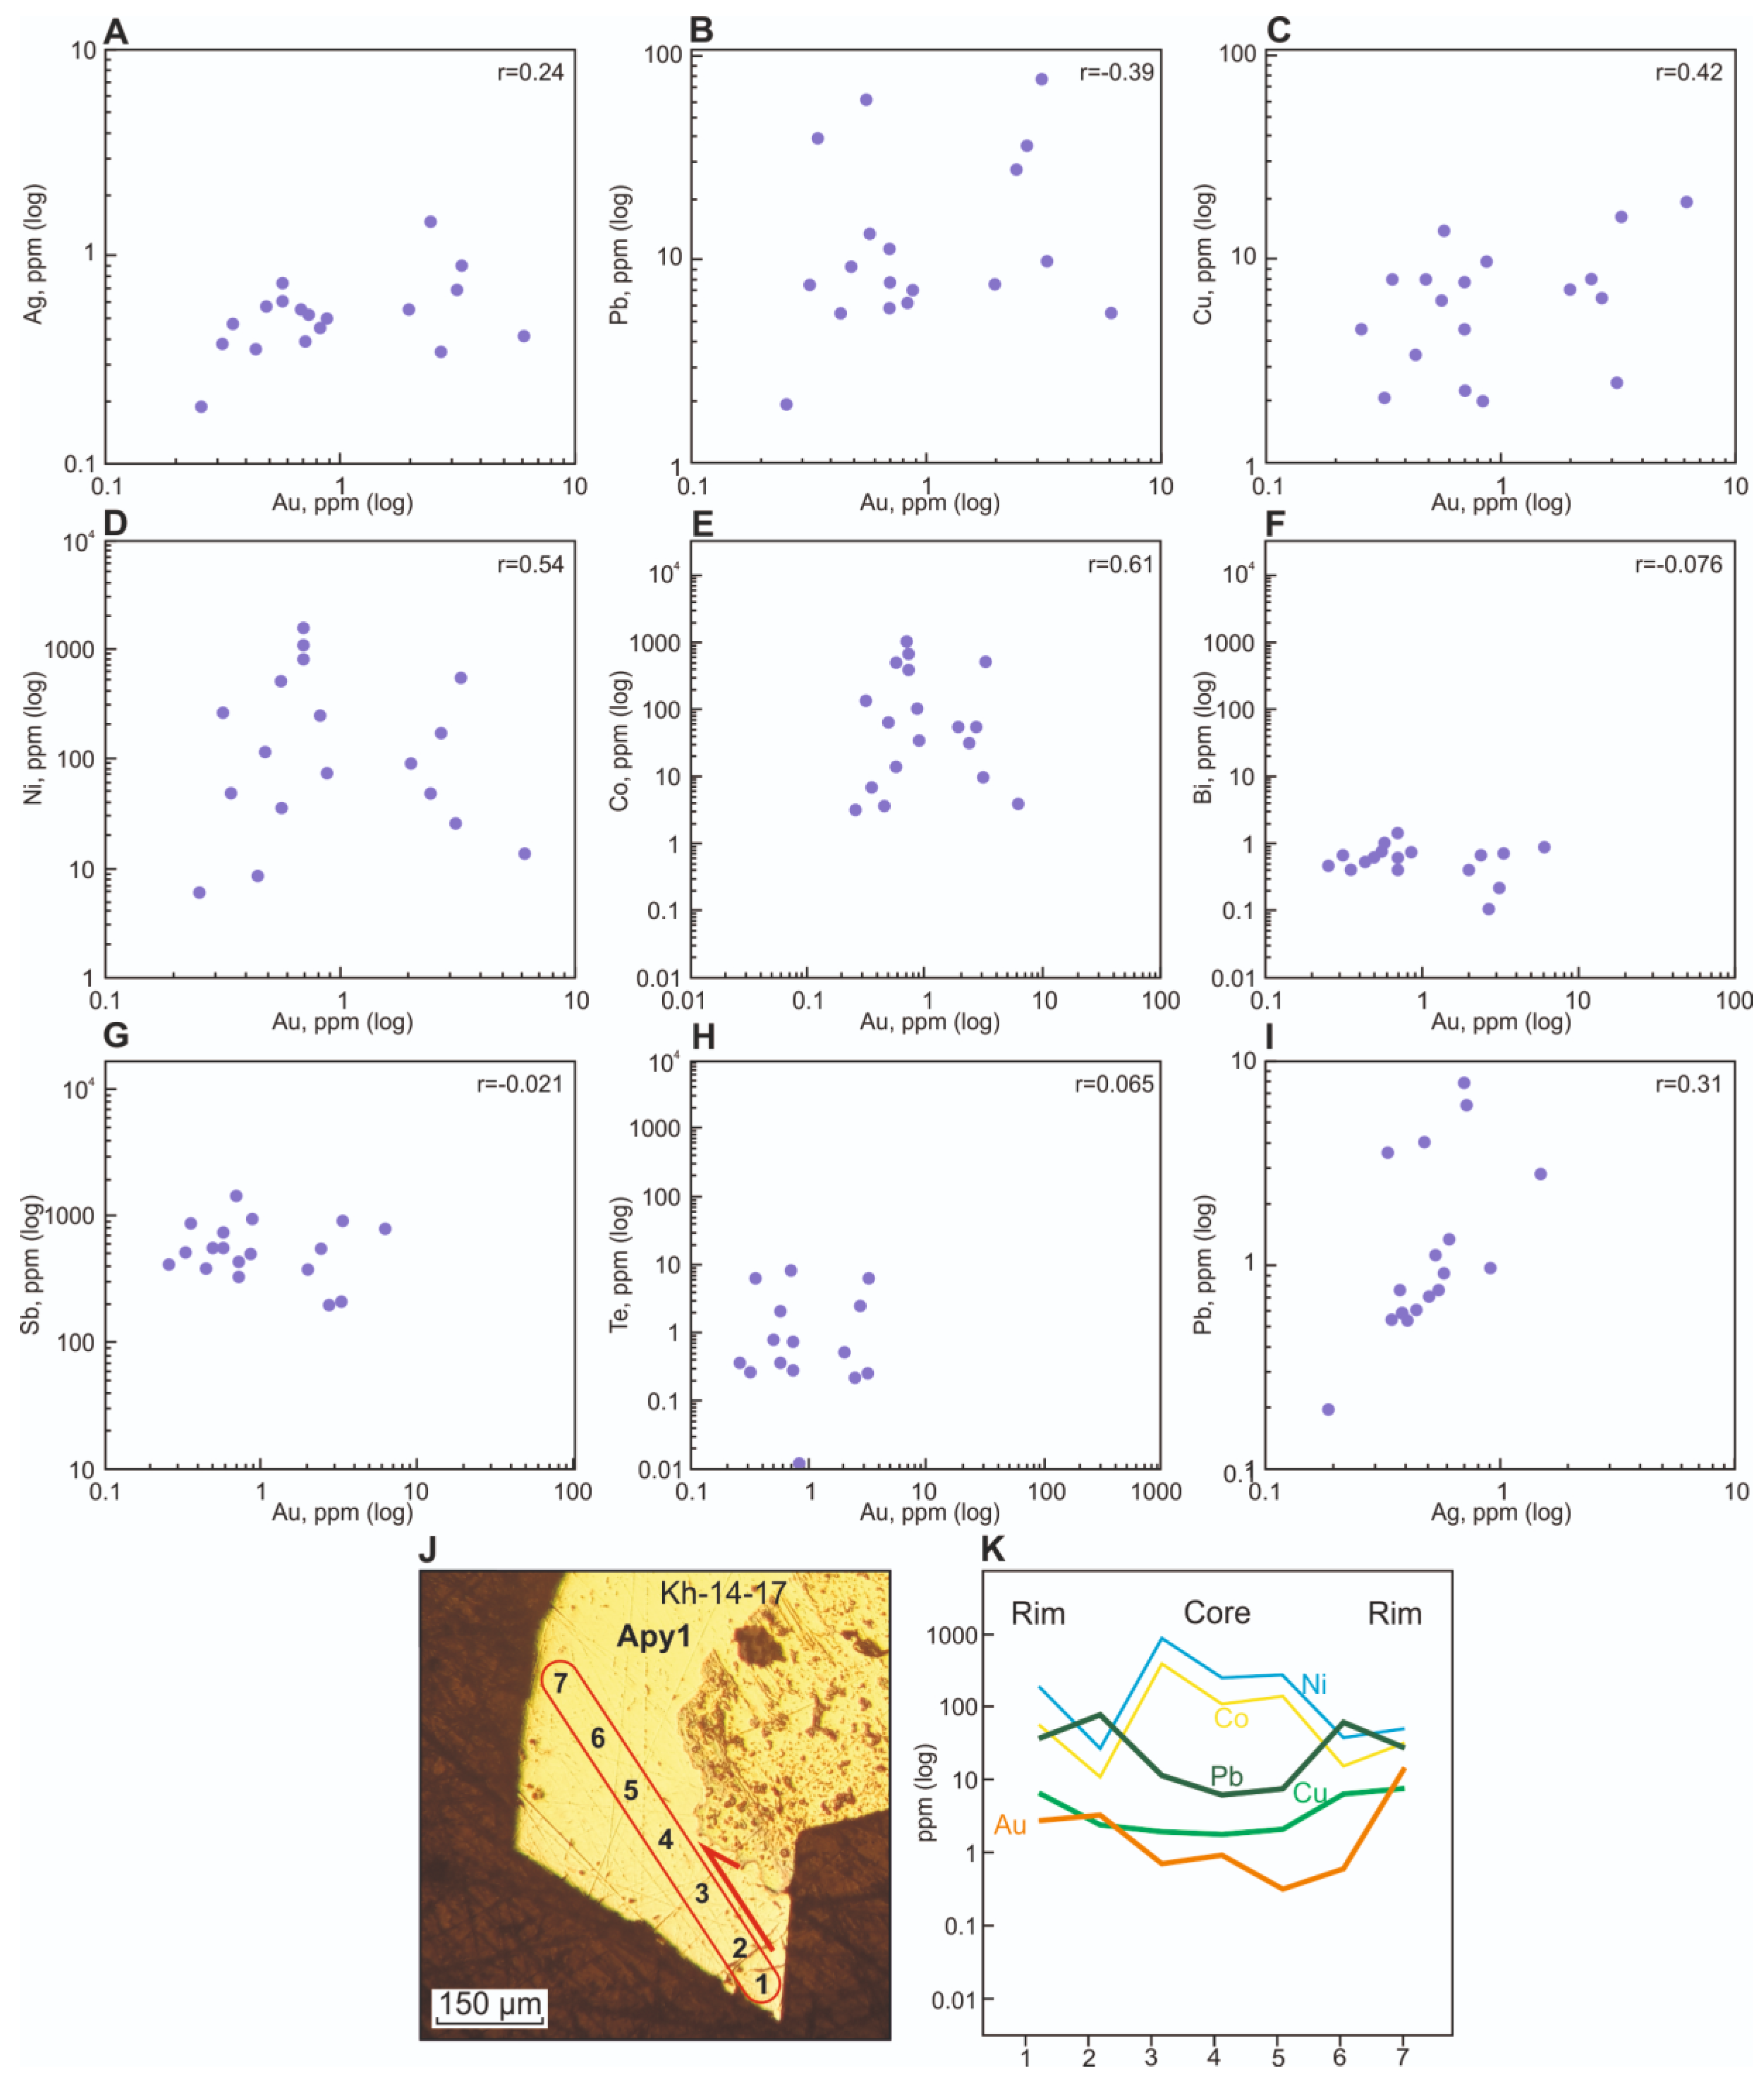
5.3.2. Invisible Gold in Apy1

The relationship between Au and Fe indicates the form of gold occurrence in arsenopyrite (see [55,58], etc.). Figure 13A shows an inverse correlation between Au and Fe in Apy1 of the Khangalas deposit, which is strong (r = −0.9) at Au > 2 ppm, and weak at Au < 2 ppm (r = −0.18). The strong inverse correlation between Au and Fe is due to isomorphic Au → Fe substitution in the arsenopyrite structure at Au > 2 ppm [55].
No direct Au vs. S or Au vs. As correlations are identified (Figure 13B,C), which is probably due to the heterogeneous composition of Apy1. As shown in Figure 13C, the Au/As values fall into the zone below the Au saturation line [60], which indicates the predominance of the Au+ structurally bound form in Apy1. This is confirmed by the low Au content (<6.1 ppm) in Apy1. At the same time, the results of atomic absorption analysis revealed high Au content in the bulk samples of Apy1 (Table 2), which indicates the presence of nano- and microparticles of native gold.
Correlation plots for Au concentrations with Ag, Pb, Cu, Ni, Co, Bi, Sb, and Te in Apy1 are shown in Figure 14A–H. Gold and silver do not show a significant correlation (Figure 14A), but gold has a noticeable positive correlation with Cu and Zn. A close positive correlation between Cu, Zn, and Pb elements and Au is recorded for arsenopyrite from layered quartz veins of the Samgwang deposit (Korea) [58]. In the Au vs. Pb correlation diagram (Figure 14B), a weak negative relationship (r = −0.39) is observed for Apy1 from the Khangalas deposit.
At the same time, Figure 14K shows that Au–Pb–Cu have a highly positive relationship in the Apy1 crystal. Qualitative line scanning with the use of LA-ICP-MS analysis has proved to be effective in recognizing variations in trace element concentrations in zoned or altered sulfide grains (Py, Apy) [58,81,82,83]. Using this method, we found that concentrations of invisible Au, Pb, and Cu tend to decrease from the rim to the core of the grains, while the contents of Co and Ni are noticeably higher in the central zones of the crystals (Figure 14K). A similar variation in the amount of trace elements within arsenopyrite of the Samgwang orogenic deposit (Korea) was shown by Lee et al. [58], who attributed this fact to later hydrothermal alteration. For the Khangalas deposit, the increased Au, Pb, and Cu in the rim of the Apy1 grain is associated with the input of a portion of fluids enriched in Au-polysulfide association. The rest of the trace elements do not show any clear regularity in their distribution within the Apy1 grain.
Apy1 from the Khangalas deposit shows a noticeable positive correlation of Au with Ni and Co (Figure 14D,E). This may indicate [58] the involvement of basic and ultrabasic sources in ore formation at the Khangalas deposit. The lack of correlation between Au and Bi, Sb, and Ag in Apy1 (Figure 14A,F,G) and the marked positive correlation between Ag and Pb (Figure 14I) indicate the contribution of Ag-, Bi-, and Sb-containing fluids to the formation of deposits, which is typical for the metallogenic specialization of the region [8,84,85].
Thus, LA-ICP-MS trace element analysis data show that Au in Apy1 and Py3 of the Khangalas deposit is present in the form of both invisible gold (solid solution in the crystal lattice/nanoparticles with a size of <100 nm) and native gold. The predominant form is the solid solution Au+ in the Py3 and Apy1 crystal lattices.

5.4. Gold Content of Proximal Metasomatites and Their Sulfides

The results of atomic absorption analysis of the proximal metasomatites and their sulfides at the Khangalas deposit showed that average Au content in Py3 (12.51 ppm) and Apy1 (17.51 ppm) is lower than in veined Py4 (29.30 ppm) and Apy2 (20.49 ppm, one measurement). For the proximal metasomatites, average Au content with a highly uneven distribution (CV = 225%) was 0.81 ppm. Taking the average Au content at 0.5 ppm, the length of the ore body at 1400 m, and the thickness of the proximal metasomatites at 50 m, the gold resources of Khangalas deposit to a depth of 100 m would amount to 9.1 t Au. A significant contribution of disseminated mineralization to gold reserves is also reported for other orogenic deposits of the Yana–Kolyma metallogenic belt (Natalka [10,11], Degdekan [11], Drazhnoe [86], etc.). For example, for the Drazhnoe deposit (Upper Indigirka sector of the YKMB), with reserves of 49.8 tonnes of gold with an average grade of 2.86 ppm, the contribution of disseminated sulfide ores with invisible gold is estimated at 75% [86,87].

5.5. Sources of Metals

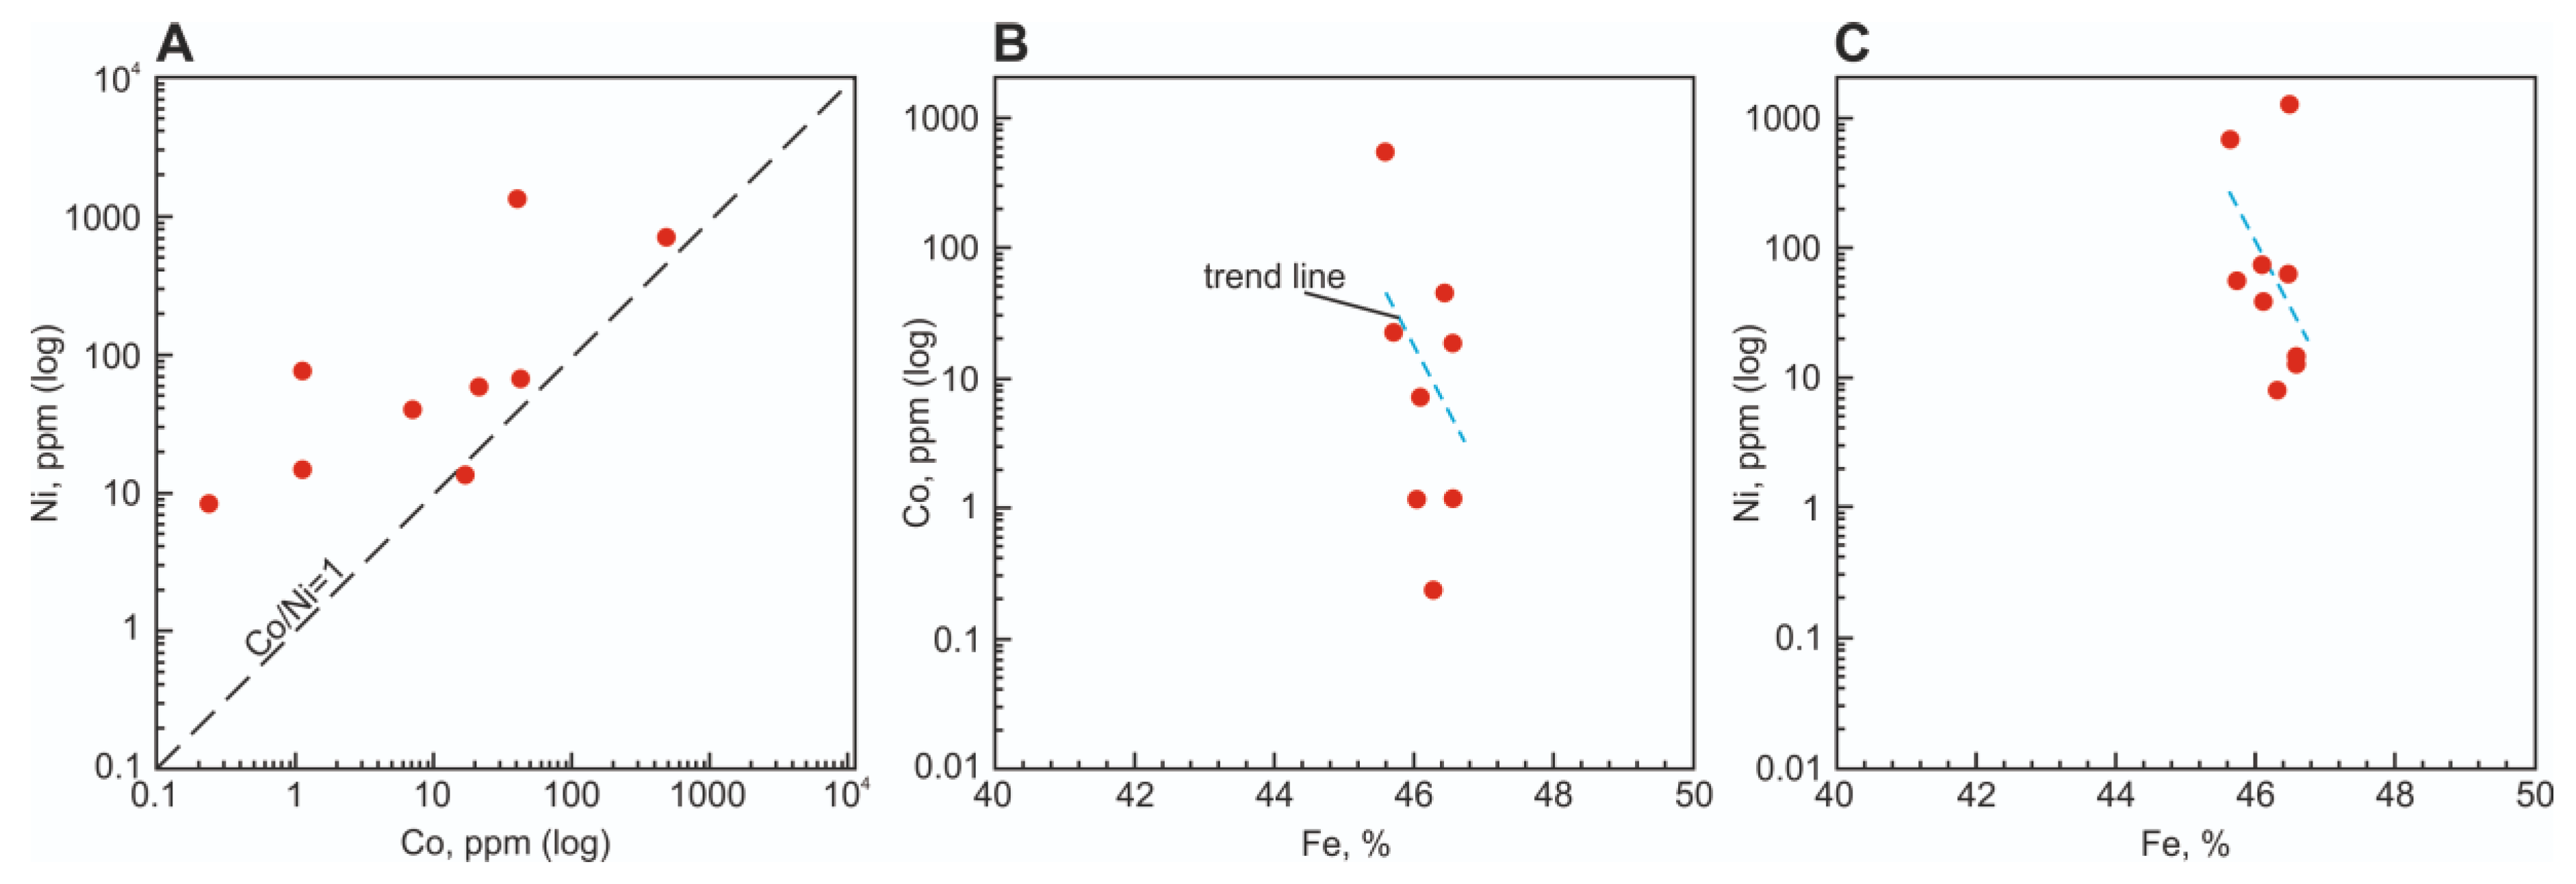
5.5.1. Pyrite Genesis as Evidenced by Co/Ni Ratio

The Co/Ni ratio reflects the genesis of pyrite [61,88,89,90]. In the studied samples, Co/Ni varied over a wide range (0.2–46.0), but in most analyses CCo > CNi (Co/Ni > 1.0). Increased Ni content (Co/Ni = 0.2–0.8) is characteristic of Py1 and Py2, and is recorded in the central part of zoned Py3 crystals. Variable correlations are observed between Co and Ni: a strong positive correlation (r = 0.64–0.73) in Py1 and Py2, a negative correlation (r = −0.6) in grains with elevated Ni content, and no correlation between Co and Ni in vein Py4 and Apy2. High concentrations of Ni in sulfides suggest, according to Lee et al. [58], that mafic and ultramafic components introduced into hydrothermal fluids were involved in the precipitation of sulfides (maximum 2230 ppm for Apy1, 1620 ppm for Apy2, 4830 ppm for Py3). Negative correlations between Co and Fe (r = −0.6) (Figure 15B) and Ni and Fe (r = −0.1, Figure 15C) in Py3 indicate the presence of Ni and Co in the crystal lattice through isomorphic substitution for Fe [61].

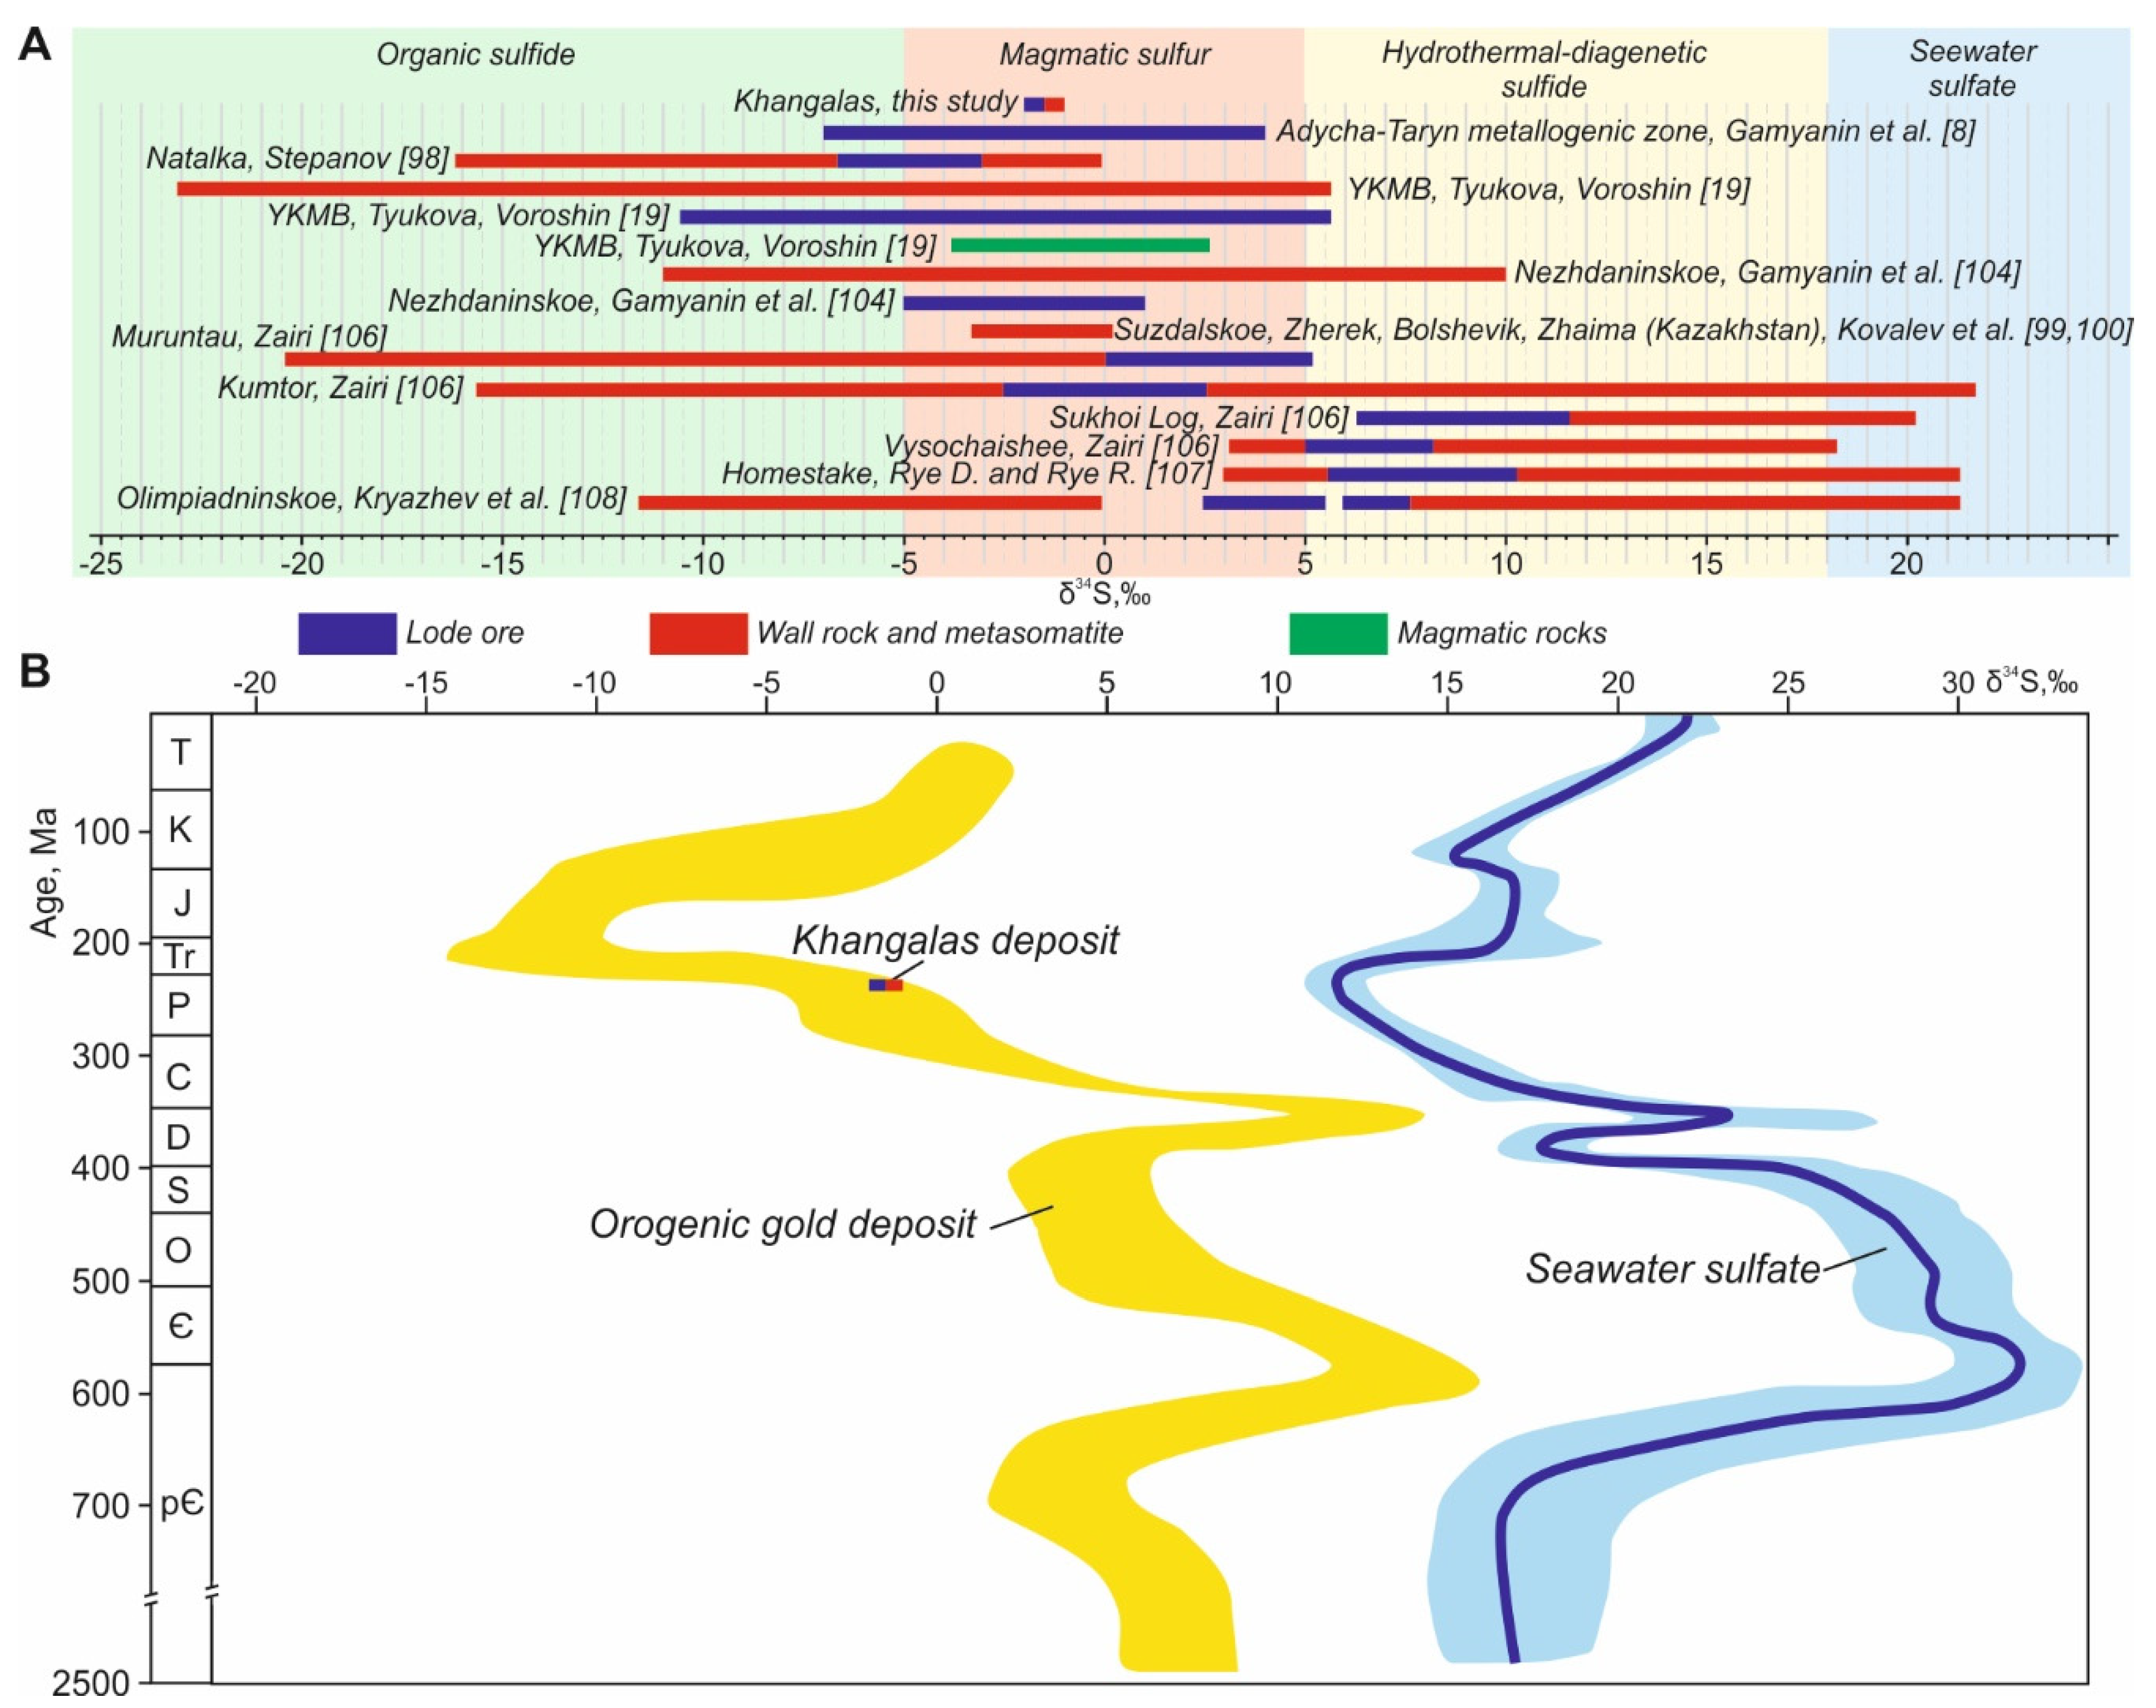
5.5.2. Origin of Hydrothermal Sulfides According to Stable Sulfur Isotopes

Examining stable isotopes in geological objects (rocks, mineralizing fluids, vein minerals, and ore deposits) has proven to be a powerful method that allows one to study their genesis in detail [91]. The genesis and sources of ore matter in orogenic Au deposits are controversial; first of all, the issue concerns the identification and assessment of the role of host rocks and deep-seated (magmatogenic and/or metamorphic) ore-bearing fluids in the process of ore formation (see [92,93,94] and references therein). The reported δ34S values for sulfide minerals from orogenic gold deposits range from −20‰ to + 25‰ [92]. As sulfur is an important complexing agent for gold, understanding the S source may be critical in identifying the source areas of gold. A number of researchers came to the conclusion that the δ34S composition in Phanerozoic deposits changes depending on the age of the host rock [92,95,96]. The sulfur isotopic composition of sulfides from the Khangalas deposit is in good agreement with these results (Figure 15B).
Based on the example of deposits in the Juneau gold belt [97] and on a comprehensive analysis of Jiaodong Province, China [92], it was shown that sulfur entered the composition of ore-forming fluids during the metamorphic conversion of pyrite into pyrrhotite. The sulfur source must have been a disseminated syngenetic/diagenetic pyrite in terranes being devolatilized at depth [95,96].
For gold deposits of the Yilgarn craton, at δ34S ~ 0, it was determined that the ore-forming fluid had a felsic magmatic or mantle-level source of sulfur [98]. The sulfur isotopic composition (δ34S = 0.0 to −3.3‰) in a number of gold–sulfide deposits in Kazakhstan indicates that the ore matter had a mantle-level source of sulfur with some contribution from the crust [99,100].
The sulfur isotopic composition in clastic strata of the Upper Kolyma region varies widely from −23.1 to +5.6‰ (Figure 16A) [19]. Tyukova and Voroshin [19] compared the δ34S of accessory sulfides of host rocks with the δ34S of sulfides of gold deposits in the Upper Kolyma gold-bearing region, and suggested the involvement of sulfur mobilized from clastic strata in the hydrothermal process. It is believed that the most probable source of sulfur in sulfides (δ34S −6.3 to + 2.6) from the Natalka orogenic deposit, the largest in the region, is the host rocks of the Verkhoyansk clastic complex [101,102]. Sulfur and arsenic were mobilized as a result of phase transformations of iron sulfides from clastic strata during the transformation of pyrite to pyrrhotite in the course of metamorphism.
For the orogenic gold deposits of the Adycha–Taryn metallogenic zone of the YKMB, a narrower interval of δ34S values is established: from −2.1‰ to +2.4‰ (Apy), from −6.6 to +5.4‰ (Py), and from −6.1‰ to +4.2‰ (antimonite) (Figure 16) [8]. For example, the δ34S values in sulfides are close to zero: −0.2‰ to +2.4‰ for Malo-Tarynskoe, −2.9‰ to −1.5‰ for Avgustovskoe, −3.6‰ to 1.3‰ for Kinyas, −1.7‰ to −1.2‰ for Pil, and −4.4‰ to −0.7‰ for Elginskoe and other gold deposits. These data are interpreted by the authors as indicating a magmatic source of sulfur with some contribution from the host rocks of the Verkhoyansk clastic complex.
We studied the S isotopic composition of Py3, Apy1, and Apy2 in five samples from the Khangalas deposit, and obtained a narrow range of negative δ34S values from −2.0‰ to −0.6‰ (Figure 16, Table 4). Similar sulfur isotopic compositions of arsenopyrite and pyrite of ore veins and disseminated mineralization of ore-hosting strata indicate their formation during a single hydrothermal event. The δ34S values of sulfides from the Khangalas deposit are close to those of the well-studied orogenic gold-sulfide deposits: Natalka (Upper Kolyma region) [103]; Suzdalskoe, Zhaima, Bolshevik, and Zherek (Kazakhstan) [99,100]; and deposits of the Adycha-Taryn metallogenic zone [8] (Figure 16A). For the large Nezhdaninskoe orogenic gold deposit in the Allakh–Yun metallogenic zone, deep magma chambers (−5‰ to +1‰ for vein ores) and sulfides of host rocks (Figure 16A) are considered as sulfur sources [104]. At the same time, the conclusions about the genesis of the fluid components here are ambiguous, as in the case of the Muruntau deposit [105]. Thus, mantle/magmatic sulfur was involved in the formation of the Khangalas deposit, but the participation of sulfur from the host rocks of the Verkhoyansk clastic complex cannot be ruled out. The small volume of the conducted isotope studies does not make it possible to represent the entire range of δ34S values for the Khangalas deposit. To obtain more information about the sources of ore matter, a comprehensive analysis of all generations of pyrite and arsenopyrite as well as thermobarometric and microelemental analysis of fluid inclusions are required.

6. Conclusions

Four generations of pyrite (Py1, diagenetic; Py2, metamorphic; Py3, metasomatic; and Py4, veined) and two generations of arsenopyrite (Apy1, metasomatic, and Apy2, veined) have been identified at the Khangalas deposit. All sulfide generations are characterized by nonstoichiometric compositions: Fe/(S + As) (Py1: 0.48–0.52; Py2: 0.48–0.53; Py3: 0.47–0.54; Py4: 0.49–0.53; Apy1: 0.42–0.52; Apy2: 0.45–0.51) and contain As, Co, Ni, Cu, and Sb. The main trace element is As, making up a major portion of the total amount.
For diagenetic Py1 and metamorphic Py2, the total content of trace elements varies from 0.04 to 0.8 wt.%, and the share of As is from 30% to 70%. The most widespread and commercially significant pyrite with a high content of invisible gold is Py3, which formed in the wall rock metasomatites and occupies up to 3% to 3.5% of their volume. The total content of trace elements in Py3 varies from 0.38% to 3.27%, and the proportion of As is more than 75%.
The results of LA-ICP-MS trace element analysis provide information on the form of occurrence of invisible gold in Py3 and Apy1. Some aspects of Au behavior in sulfides indicate the predominance of structurally bound Au+. A low Au content in sulfides (Py3, avg. 1.5 ppm; Apy2, avg. 7.6 ppm) is interpreted by some researchers [76] as an indicator of the structurally bound form of Au. In addition, the negative correlation between Au and Fe established for Py3 and Apy1 indicates isomorphic Au ↔ Fe substitution [52,55,58]. The close correlation between Au and As indicates that they have a common genesis. Their distribution patterns relative to the line limiting the transition of the solid solution Au+ to Au0 [57,71] also indicate the development of Au+ in Apy1 and Py3 from proximal metasomatites (Figure 13F,H). At the same time, a higher Au content was found in sulfides and proximal metasomatites (Py3: 39.32 ppm Au by atomic absorption; Apy1: 39.0 ppm by LA-ICP-MS). This may indicate the presence of micro- and nanoinclusions of native gold in sulfides, which is confirmed by the detection, with the use of a scanning electron microscope, of an Au0 microinclusion in the Py3 and Apy1 intergrowth in 1 out of about 200 grains studied. Indirect evidence of the presence of native gold inclusions in sulfides may be the large number of dense phases detected by computed microtomography. Isotope characteristics of hydrothermal sulfides (δ34S = −2.0‰ to −0.6‰) indicate that mantle/magmatic sulfur was involved in the formation of the deposit, but the participation of sulfur from the host rocks of the Verkhoyansk clastic complex cannot be ruled out.
The gold content of sulfides and proximal metasomatites determined during this study indicate that the Khangalas deposit has higher commercial potential than was thought before. It has much in common with other deposits of the Yana-Kolyma metallogenic belt. The results of this work make it possible to re-evaluate the reserves of orogenic gold deposits based on the study of disseminated sulfide mineralization with invisible gold. In these respects, Khangalas provides an exploration model useful in targeting similar gold deposits from the local to the regional scale.

Author Contributions

Conceptualization: V.Y.F. and M.V.K.; methodology, L.I.P., L.Y.K., V.Y.F. and M.V.K.; validation, V.Y.F., L.I.P. and M.V.K.; writing—original draft preparation, M.V.K., V.Y.F. and L.I.P.; writing—review and editing, V.Y.F., M.V.K. and L.I.P.; visualization, M.V.K.; supervision, V.Y.F.; project administration, V.Y.F.; funding acquisition, V.Y.F. and M.V.K. All authors have read and agreed to the published version of the manuscript.

Funding

This work was supported by the Diamond and Precious Metals Geology Institute, Siberian Branch of the Russian Academy of Sciences (DPMGI SB RAS), was partially funded by Russian Foundation for Basic Research (RFBR) (grant number 18-45-140040 r a), and by State scholarship of the Republic of Sakha (Yakutia) young researchers and graduate students.

Data Availability Statement

Not applicable.

Acknowledgments

The authors are grateful to all engineers for their accurate, timely and prompt analytical work. The authors are grateful to the engineer of DPMGI SB RAS Tarasov Ya.A. for his help in the preparation and selection of samples. The authors appreciate the staff of DPMGI SB RAS Zayakina N.V. and Vasileva T.I. for their interest and advice that helped improve the article. We are sincerely grateful to Alekseenko E.V. for translating the text.

Conflicts of Interest

The authors declare no conflict of interest.

References

  1. Goryachev, N.A.; Pirajno, F. Gold deposit and gold metallogeny of Far East Russia. Ore Geol. Rev. 2014, 59, 123–151. [Google Scholar] [CrossRef]
  2. Mikhailov, B.K.; Struzhkov, S.F.; Aristov, V.V.; Natalenko, M.V.; Tsymbalyuk, N.V.; Tyamisov, N.E.; Uzyunkoyan, А.А. Gold potensial of the Yana–Kolyma province. Ore Met. 2007, 5, 4–17. (In Russian) [Google Scholar]
  3. Kerrich, R.; Goldfarb, R.; Groves, D.; Garwin, S.; Jia, Y. The characteristics, origins, and geodynamic settings of supergiant gold metallogenic provinces. Sci. China Ser. D Earth Sci. 2000, 43, 68. [Google Scholar] [CrossRef]
  4. Goryachev, N.A. Geology of Mesozoic Gold–Quartz Vein Belts of Northeast Asia; NEISRI FEB RAS: Magadan, Russia, 1998. (In Russian) [Google Scholar]
  5. Gamyanin, G.N. Mineralogical and Genetic Aspects of Gold Mineralization of the Verkhoyansk–Kolyma Mesozoids; GEOS: Moscow, Russia, 2001. (In Russian) [Google Scholar]
  6. Fridovsky, V.Y. Structures of gold ore fields and deposits of Yana–Kolyma ore belt. In Metallogeny of Collisional Geodynamic Settings; Mezhelovsky, N.V., Gusev, G.S., Eds.; GEOS: Moscow, Russia, 2002; Volume 1, pp. 6–241. (In Russian) [Google Scholar]
  7. Amuzinsky, V.A. Metallogenic Epochs and Content of Ore Complexes of the Verkhoyansk Folded System; YSU Publishing House: Yakutsk, Russia, 2005. (In Russian) [Google Scholar]
  8. Gamyanin, G.N.; Fridovsky, V.Y.; Vikent’eva, O.V. Noble-metal mineralization of the Adycha–Taryn metallogenic zone: Geochemistry of stable isotopes, fluid regime, and ore formation conditions. Russ. Geol. Geophys. 2018, 59, 1271–1287. [Google Scholar] [CrossRef]
  9. Fridovsky, V.Y. Structural control of orogenic gold deposits of the Verkhoyansk–Kolyma folded region, northeast Russia. Ore Geol. Rev. 2018, 103, 38–55. [Google Scholar] [CrossRef]
  10. Goryachev, N.A.; Vikentyeva, O.V.; Bortnikov, N.S.; Prokofiev, V.Y.; Alpatov, V.A.; Golub, V.V. World-class Natalka gold deposit: REE distribution, fluid inclusions, stable oxygen isotopes and ore formation conditions (North-East of Russia). Gеol. Rudn. Mеst. 2008, 50, 414–444. (In Russian) [Google Scholar]
  11. Goryachev, N.A.; Sotskaya, O.T.; Mikhalitsyna, T.I.; Goryacheva, E.M.; Manshin, A.P. Estimation of Au-Pt-Pd-Ni in ores of typical deposits (Natalka, Degdekan) in the black shale strata of the Yana-Kolyma gold belt. Vestnik ONZ RAS 2012, 325–336. (In Russian) [Google Scholar]
  12. Goryachev, N.A.; Sotskaya, O.T.; Ignatiev, A.V.; Velivetskaya, T.I.; Goryacheva, E.M.; Semyshev, F.I.; Berdnikov, N.V.; Malinovsky, M.A.; Alshevsky, A.V. About sulfide mineralization of the zones of large faults of the Yana-Kolyma orogenic belt. Bull. Northeast Sci. Center FEB RAS 2020, 1, 11–29. (In Russian) [Google Scholar] [CrossRef]
  13. Sotskaya, O.T.; Goryachev, N.A. Micromineral forms of gold and silver in disseminated sulfide “black shale” ores (North-East of Russia). Geology and mineral resources of the North-East of Russia. In Proceedings of the All-Russian Conference, Yakutsk, Russia, 29–30 March 2012. (In Russian). [Google Scholar]
  14. Voroshin, S.V.; Tyukova, E.E.; Newberry, R.J.; Layer, P.W. Orogenic gold and rare metal deposits of the Upper Kolyma District, Northeastern Russia: Relation to igneous rocks, timing, and metal assemblages. Ore Geol. Rev. 2014, 62, 1–24. [Google Scholar] [CrossRef]
  15. Sidorova, N.V.; Aristov, V.V.; Grigorieva, A.V.; Sidorov, A.A. “Invisible” gold in pyrite and arsenopyrite from the Pavlik deposit (North-East of Russia). Dokl. Earth Sci. 2020, 495, 821–826. [Google Scholar] [CrossRef]
  16. Palyanova, G.A. Minerals of gold and silver in sulfide ores. Geol. Ore Depos. 2020, 62, 426–449. [Google Scholar] [CrossRef]
  17. Volkov, A.V.; Sidorov, A.A. Invisible gold. Bull. RAS 2017, 87, 40–49. (In Russian) [Google Scholar] [CrossRef]
  18. Tyukova, E.E.; Voroshin, S.V. Composition and Paragenesis of Arsenopyrite in Deposits and Host Rocks of the Upper Kolyma Region (to the Interpretation of the Genesis of Sulfide Associations); NEISRI FEB RAS: Magadan, Russia, 2007. (In Russian) [Google Scholar]
  19. Tyukova, E.E.; Voroshin, S.V. Isotopic composition of sulfur in sulfides from ores and host rocks of the Upper Kolyma region (Magadan region). Russ. J. Pac. Geol. 2008, 27, 29–43. (In Russian) [Google Scholar]
  20. Babkin, P.V.; Gelman, M.L.; Veldyaksov, F.F.; Pavlyuchenko, L.A. Prospects for identifying gold mineralization in sulfidization zones in the black shale strata of the North-East USSR. Kolyma 2001, 2, 14–22. (In Russian) [Google Scholar]
  21. Izmailov, L.I. Pyrrhotite Mineralization of Metal-Bearing Zones of the Kolyma River Basin; Science: Novosibirsk, Russia, 1976. (In Russian) [Google Scholar]
  22. Volkov, A.V.; Sidorov, A.A.; Goncharov, V.I.; Sidorov, V.A. Disseminated gold-sulfide deposits in the Russian Northeast. Geol. Ore Dep. 2002, 44, 159–174. [Google Scholar]
  23. Fridovsky, V.Y.; Yakovleva, K.Y.; Vernikovskaya, A.E.; Vernikovsky, V.A.; Matushkin, N.Y.; Kadilnikov, P.I.; Rodionov, N.V. Geodynamic Emplacement Setting of Late Jurassic Dikes of the Yana–Kolyma Gold Belt, NE Folded Framing of the Siberian Craton: Geochemical, Petrologic, and U–Pb Zircon Data. Minerals 2020, 10, 1000. [Google Scholar] [CrossRef]
  24. Fridovsky, V.Y.; Kudrin, M.V. Deformation structures of the Khangalassky ore cluster. Geology and mineral resources of the North-East of Russia. In Proceedings of the All-Russian scientific-practical Conference, Yakutsk, Russia, 31 March–2 April 2015; pp. 537–540. (In Russian). [Google Scholar]
  25. Fridovsky, V.Y.; Kudrin, M.V.; Polufuntikova, L.I. Multi-stage deformation of the Khangalas ore cluster (Verkhoyansk–Kolyma folded region, northeast Russia): Ore-controlling reverse thrust faults and post-mineral strike-slip faults. Minerals 2018, 8, 270. [Google Scholar] [CrossRef] [Green Version]
  26. Rozhkov, I.S.; Grinberg, G.A.; Gamyanin, G.A.; Kukhtinskiy, Y.G.; Solovyev, V.I. Late Mesozoic Magmatism and Gold Mineralization of the Upper Indigirsky Region; Science: Moscow, Russia, 1971. (In Russian) [Google Scholar]
  27. Amuzinsky, V.A.; Anisimova, G.S.; Zhdanov, Y.Y. Native Gold of Yakutia, Upper Indigirsky District; VO Nauka: Novosibirsk, Russia, 1992. (In Russian) [Google Scholar]
  28. Nesterov, N.V. Supergene Enrichment of Gold Deposits in Northeast Asia; Nauka: Novosibirsk, Russia, 1985. (In Russian) [Google Scholar]
  29. Kudrin, M.V.; Zayakina, N.V.; Vasilieva, T.I. Minerals of the oxidation zone of the Khangalas gold deposit (Eastern Yakutia). Geology and mineral resources of the North-East of Russia. In Proceedings of the VIII All-Russian Scientific-Practical Conference, Yakutsk, Russia, 18–20 April 2018; pp. 77–80. (In Russian). [Google Scholar]
  30. Kudrin, M.V.; Vasilieva, T.I.; Fridovsky, V.Y.; Zayakina, N.V.; Polufuntikova, L.I. Minerals of the weathering crust of the Khangalassky ore cluster (North-East of Russia). Geology and mineral resources of the North-East of Russia. In Proceedings of the IX All-Russian Scientific and Practical Conference, Yakutsk, Russia, 10–12 April 2019; pp. 53–56. (In Russian). [Google Scholar]
  31. Skryabin, A.I. Reconstruction of the Lateral Zoning of Gold Mineralization (Yano-Kolyma Belt); YSC SB RAS: Yakutsk, Russia, 2010. (In Russian) [Google Scholar]
  32. GeoInfoComLLC. Available online: http://mestor.geoinfocom.ru/publ/1-1-0-55 (accessed on 15 January 2021).
  33. Parfenov, L.M.; Kuzmin, M.I. Tectonics, Geodynamics and Metallogeny of the Territory of the Republic of Sakha (Yakutia); Parfenov, L.M., Kuzmin, M.I., Eds.; MAIK Nauka/Interperiodika: Moscow, Russia, 2001. (In Russian) [Google Scholar]
  34. Zaitsev, A.I.; Fridovsky, V.Y.; Vernikovskaya, A.E.; Kudrin, M.V.; Yakovleva, K.Y.; Kadilnikov, P.I. Rb–Sr isotopic study of basites of the dyke complex of the Taryn ore-magmatic system (Northeast Russia). Russ. J. Domes. Geol. 2018, 5, 50–61. (In Russian) [Google Scholar]
  35. Parfenov, L.M.; Berzin, N.A.; Khanchuk, A.I.; Badarch, G.; Belochenko, V.G.; Bulgatov, A.I.; Dril, C.I.; Kirillova, G.L.; Kuzmin, M.I.; Nokleberg, W.J.; et al. Model of orogenic belt formation in Central and Northeast Asia. Russ. J. Pac. Geol. 2003, 22, 7–41. (In Russian) [Google Scholar]
  36. Akinin, V.V.; Prokopiev, A.V.; Toro, J.; Miller, E.L.; Wooden, J.; Goryachev, N.A.; Alshevsky, A.V.; Bakharev, A.G.; Trunilina, V.A. U–PB SHRIMP ages of granitoids from the Main batholith belt (North East Asia). Dokl. Acad. Sci. 2009, 426, 216–221. [Google Scholar]
  37. Akinin, V.V.; Miller, E.L.; Toro, J.; Prokopiev, A.V.; Gottlieb, E.S.; Pearcey, S.; Trunilina, V.A. Episodicity and the dance of late mesozoic magmatism and deformation along the northern circum-pacific margin: NE Russia to the Сordillera. Earth-Sci. Rev. 2020, 208, 103272. [Google Scholar] [CrossRef]
  38. Akimov, G.Y. New age data on gold–quartz mineralization in the Verkhnyaya Indigirka area, Yakutia. Dokl. Acad. Sci. 2004, 398, 80–83. (In Russian) [Google Scholar]
  39. Whitney, D.L.; Ewans, B.W. Abbreviations of names of rock forming minerals. Am. Miner. 2010, 95, 185–187. [Google Scholar] [CrossRef]
  40. Kudrin, M.V.; Zayakina, N.V.; Fridovsky, V.Y.; Galenchikova, L.T. Hydrous ferric sulfate–Fe(SO4)(OH)·2H2O from the supergene zone of the Khangalas gold deposit, Eastern Yakutia, Russia. Notes Rus. Min. Soc. 2020, 149, 126–141. [Google Scholar]
  41. Zayakina, N.V.; Kudrin, M.V.; Fridovsky, V.Y. Unknown sulfate-arsenate-phosphate Al and Fe from the Khangalas deposit (Eastern Yakutia). Geology and Mineral Resources of the North-East of Russia. In Proceedings of the X All-Russian Scientific-Practical Conference with International Participation, Yakutsk, Russia, 8–10 April 2020; pp. 210–214. (In Russian). [Google Scholar]
  42. Nesterov, N.V. Secondary zoning of gold ore deposits in Yakutia. In Bulletin of the Tomsk Polytechnic University; TPU: Tomsk, Russia, 1970; pp. 242–247. (In Russian) [Google Scholar]
  43. Wilson, S.A.; Ridley, W.I.; Koenig, A.E. Development of sulphide calibration standards for the laser ablation inductively-coupled plasma mass spectrometry technique. J. Anal. At. Spectrom. 2002, 17, 406–409. [Google Scholar] [CrossRef]
  44. Paton, C.; Hellstrom, J.; Paul, B.; Woodhead, J.; Hergt, J. Iolite: Freeware for the visualisation and processing of mass spectrometric data. J. Anal. Atomic Spectrom. 2011, 26, 2508–2518. [Google Scholar] [CrossRef]
  45. Longerich, H.P.; Jackson, S.E.; Günther, D. Inter-laboratory note. Laser ablation inductively coupled plasma mass spectrometric transient signal data acquisition and analyte concentration calculation. J. Anal. Atomic Spectrom. 1996, 11, 899–904. [Google Scholar] [CrossRef]
  46. Nadeev, A.; Mikhailov, D.; Chuvilin, E.; Koroteev, D.; Shako, V. Visualization of clay and frozen substances inside porous rocks using X-ray micro-computed tomography. J. Microsc. Anal.–Tomogr. Suppl. 2013, 27, 8–11. [Google Scholar]
  47. Mayorova, T.P.; Statsenko, E.O.; Trifonov, A.A.; Nesterenko, G.V. X-ray microtomography and field emission electron microscopy – new possibilities for studying highly dispersed gold ores. Bull. Inst. Geol. KSC UB RAS. 2013, 11, 34–38. (In Russian) [Google Scholar]
  48. Krupskaya, V.V.; Zakusin, S.V.; Zhukhlistov, A.P.; Dorzhieva, O.V.; Sudin, V.V.; Kryuchkova, L.Y.; Zubkov, A.A. Newly formed smectite as an indicator of transformations of the geological environment under the influence of highly reactive solutions accompanying liquid radioactive waste. J. Geoecol. Engin. Geol. Hydrogeol. Geocr. 2016, 5, 412–421. [Google Scholar]
  49. Jarzyna, J.A.; Krakowska, P.I.; Puskarczyk, E.; Wawrzyniak-Guz, K.; Bielecki, J.; Tkocz, K.; Tarasiuk, J.; Wro’nski, S.; Dohnalik, M. X-ray computed microtomography—A useful tool for petrophysical properties determination. Comput. Geosc. 2016, 20, 1155–1167. [Google Scholar] [CrossRef] [Green Version]
  50. Voitenko, V.N. Form of crystallization of native gold in arsenopyrite ores of the Bazovskoye deposit (according to X-ray microtomography data). In Practical Microtomography, Proceedings of the III All-Russian Scientific Conference; SPBGU: St. Petersburg, Russia, 2014; pp. 26–28. (In Russian) [Google Scholar]
  51. Naumov, E.A.; Kovalev, K.R.; Kalinin, Y.A.; Palyanova, G.A.; Voitenko, V.N. The use of high-resolution X-ray tomography methods in mineralogical research. In Scientific and Methodological Foundations of Forecasting, Prospecting, Evaluation of Diamond, Precious and Non-Ferrous Metal Deposits; TSINIGRI: Moscow, Russia, 2019; pp. 126–127. (In Russian) [Google Scholar]
  52. Korost, D.V.; Kalmykov, G.A.; Yapaskurt, V.O.; Ivanov, M.K. Application of computer microtomography to study the structure of terrigenous reservoirs. Geol. Oil Gas. 2010, 2, 36–42. (In Russian) [Google Scholar]
  53. Korost, D.V.; Ariskin, A.A.; Pshenitsyn, I.V.; Khomyak, A.N. X-ray computed tomography as a method for reconstructing the 3d characteristics of dispersed sulfides and spinel in plagiodunites of the Yoko-Dovyren intrusion. Petrol 2019, 27, 401–419. (In Russian) [Google Scholar] [CrossRef]
  54. Vorobiev, A.E.; Kozyrev, E.N.; Honore, C. Communication nanorelief Pyrite and Arsenopyrite with the values of adsorption of gold. In Science, Education, Culture and Information and Educational Activities-the Basis of Sustainable Development of Mountain Territories, Proceedings of the VIII International Scientific-Practical Conference; SKGMI: Vladikavkaz, Russia, 2015; pp. 264–272. (In Russian) [Google Scholar]
  55. Kovalchuk, E.V.; Tagirov, B.R.; Vikentyev, I.V.; Chareev, D.A.; Tyukova, E.E.; Nikolsky, M.S.; Bortnikov, N.S. “Invisible” Gold in Synthetic and Natural Arsenopyrite Crystals, Vorontsovka Deposit, Northern Urals. Geol. Ore Dep. 2019, 61, 447–468. [Google Scholar] [CrossRef]
  56. Sharp, Z.D.; Essene, E.J.; Kelly, W.C. A re-examination of the arsenopyrite geothermometer; pressure considerations and applications to natural assemblages. Can. Mineral. 1985, 23, 517–534. [Google Scholar]
  57. Lentz, D.R. Sphalerite and arsenopyrite at the Brunswick No. 12 massive sulfide deposit, Bathurst camp, New Brunswick: Constraints on P-T evolution. Can. Mineral. 2002, 40, 19–31. [Google Scholar] [CrossRef] [Green Version]
  58. Lee, M.; Shin, D.; Yoo, B.; Im, H.; Pak, S.; Choi, S. LA-ICP-MS trace element analysis of arsenopyrite from the Samgwang gold deposit, South Korea, and its genetic implications. Ore Geol. Rev. 2019, 114, 103147. [Google Scholar] [CrossRef]
  59. Fleet, M.E.; Mumin, A.H. Gold-bearing arsenian pyrite and marcasite and arsenopyrite from Carlin Trend gold deposits and laboratory synthesis. Am. Mineral. 1997, 82, 182–193. [Google Scholar] [CrossRef]
  60. Reich, M.; Kesler, S.E.; Utsunomiya, S.; Palenik, C.S.; Chryssoulis, S.L.; Ewing, R.C. Solubility of gold in arsenian pyrite. Geochim. Cosmochim. Acta. 2005, 69, 2781–2796. [Google Scholar] [CrossRef]
  61. Wang, C.; Shao, Y.; Huang, K.; Zhou, H.; Zhang, J.; Liu, Z.; Liu, Q. Ore-Forming Processes at the Xiajinbao Gold Deposit in Eastern Hebei Province: Constraints from EPMA and LA-ICPMS Analysis. Minerals 2018, 8, 388. [Google Scholar]
  62. Pshenichkin, A.Y. On the form of finding trace elements in pyrite. Expl. Prot. Min. Resour. 2010, 11, 46–49. (In Russian) [Google Scholar]
  63. Large, R.R.; Bull, S.W.; Maslennikov, V.V. A carbonaceous sedimentary source rock model for Carlin-type and orogenic gold deposits. Econ. Geol. 2011, 106, 331–358. [Google Scholar] [CrossRef]
  64. Maslennikov, V.V.; Large, R.R.; Maslennikova, S.P.; Arkhireeva, N.S. Typochemism of pyrite and pyrrhotite as a reflection of the evolution of gold-bearing carbonaceous deposits in marginal oceanic structures. Metall. Anc. Mod. Oceans 2013, 19, 32–35. [Google Scholar]
  65. Samusikov, V.P. Regularities of the concentration of isomorphic-impurity elements in minerals during hydrothermal ore formation. Russ. Geol. Geoph. 2010, 51, 338–352. [Google Scholar]
  66. Bortnikov, N.S.; Gamyanin, G.N.; Vikentieva, O.V.; Prokofiev, V.Y.; Alpatov, V.A.; Bakharev, A.G. Composition and origin of fluids in the hydrothermal system of the Nezhdaninsky gold ore deposit (Sakha-Yakutia, Russia). Geol. Ore Depos. 2007, 49, 99–145. [Google Scholar] [CrossRef]
  67. Aristov, V.V.; Kryazhev, S.G.; Ryzhov, O.B.; Volfson, A.A.; Prokofiev, V.Y.; Sidorova, N.V.; Sidorov, A.A. Sources of fluids and ore matter of gold and antimony mineralization of the Adychansk ore region (Eastern Yakutia). Pap. Acad. Sci. 2017, 476, 174–180. [Google Scholar]
  68. Large, R.R.; Maslennikov, V.V. Invisible Gold Paragenesis and Geochemistry in Pyrite from Orogenic and Sediment-Hosted Gold Deposits. Minerals 2020, 10, 339. [Google Scholar] [CrossRef] [Green Version]
  69. Maslennikov, V.V.; Maslennikova, S.P.; Large, R.R.; Danyushevsky, L.V. Study of trace element zonation in vent chimneys from the Silurian Yaman-Kasay volcanic-hosted massive sulfide deposit (southern Urals, Russia) using laser ablation–inductively coupled plasma mass spectrometry (LA-ICPMS). Econ. Geol. 2009, 104, 1111–1141. [Google Scholar] [CrossRef]
  70. Keith, M.; Smith, D.J.; Jenkin, G.R.; Holwell, D.A.; Dye, M.D. A review of Te and Se systematics in hydrothermal pyrite from precious metal deposits: Insights into ore-forming processes. Ore Geol. Rev. 2018, 96, 269–282. [Google Scholar] [CrossRef]
  71. Deditius, A.P.; Reich, M.; Kesler, S.E.; Utsunomiya, S.; Chryssoulis, S.L.; Walshe, J.; Ewing, R.C. The coupled geochemistry of Au and As in pyrite from hydrothermal ore deposits. Geochim. Cosmochim. Acta 2014, 140, 644–670. [Google Scholar] [CrossRef] [Green Version]
  72. Vikentiev, I.V. Invisible and microscopic gold in pyrite: Research methods and new data for pyrite ores of the Urals. Geol. Ore Depos. 2015, 57, 267–298. [Google Scholar]
  73. Voitkevich, G.V.; Miroshnikov, A.E.; Povarenykh, A.S.; Prokhorov, V.G. A Short Guide to Geochem., 2nd ed.; Nedra: Moscow, Russia, 1977. (In Russian) [Google Scholar]
  74. Belikova, G.I.; Salikhov, D.N.; Berdnikov, P.G. On the question of gold isomorphism in pyrite. Geol. Collect. GI USC RAS 2002, 3, 190–193. (In Russian) [Google Scholar]
  75. Chouinard, A.; Paquette, J.; Williams-Jones, A.E. Crystallographic controls on trace-element incorporation in auriferous pyrite from the Pascua epithermal high-sulfidation deposit, Chile-Argentina. Can. Miner. 2005, 43, 951–963. [Google Scholar] [CrossRef] [Green Version]
  76. Tauson, V.L.; Kravtsova, R.G.; Smagunov, N.V.; Spiridonov, A.M.; Grebenshchikova, V.I.; Budyak, A.E. Structurally and superficially bound gold in pyrite from deposits of different genetic types. Russ. Geol. Geophys. 2014, 55, 273–289. [Google Scholar] [CrossRef]
  77. Gao, F.; Du, Y.; Pang, Z.; Du, Y.; Xin, F.; Xie, J. LA-ICP-MS Trace-Element Analysis of Pyrite from the Huanxiangwa Gold Deposit, Xiong’ershan District, China: Implications for Ore Genesis. Minerals 2019, 9, 157. [Google Scholar] [CrossRef] [Green Version]
  78. Vaughan, J.P.; Kyin, A. Refractory gold ores in Archaean greenstones, Western Australia: Mineralogy, gold paragenesis, metallurgical characterization and classification. Miner. Magaz. 2004, 68, 255–277. [Google Scholar] [CrossRef]
  79. Moskvitina, L.V.; Moskvitin, S.G.; Anisimova, G.S. Research of Nanoscale Gold by Methods of Tunneling and Atomic-Powered Microscopy with Chemical and Ion-Plasma Etching in the Kuchus Deposit (Republic Sakha (Yakutia). In International Science and Technology Conference “Earth Science”-Section One, Proceedings of the Iop Conference Series: Earth and Environmental Science, Russky Island, Russia, 4–6 March 2019; IOP Publishing Ltd.: Bristol, UK, 2019; Volume 272, pp. 1–7. [Google Scholar]
  80. Gregory, D.D.; Large, R.R.; Halpin, J.A.; Baturina, E.L.; Lyons, T.W.; Wu, S.; Danyushevsky, L.; Sack, P.J.; Chappaz, A.; Maslennikov, V.V.; et al. Trace element content of sedimentary pyrite in black shales. Econ. Geol. 2015, 110, 1389–1410. [Google Scholar] [CrossRef]
  81. Tomkins, A.G.; Mavrogenes, J.A. Redistribution of gold within arsenopyrite and lollingite during pro-and retrograde metamorphism: Application to timing of mineralization. Econ. Geol. 2001, 96, 525–534. [Google Scholar] [CrossRef]
  82. Morey, A.A.; Tomkins, A.G.; Bierlein, F.P.; Weinberg, R.F.; Davidson, G.J. Bimodal distribution of gold in pyrite and arsenopyrite: Examples from the Archean Boorara and Bardoc shear systems, Yilgarn craton, Western Australia. Econ. Geol. 2008, 103, 599–614. [Google Scholar] [CrossRef]
  83. Sung, Y.H.; Brugger, J.; Ciobanu, C.L.; Pring, A.; Skinner, W.; Nugus, M. Invisible gold in arsenian pyrite and arsenopyrite from a multistage Archaean gold deposit: Sunrise Dam, Eastern Goldfields Province, Western Australia. Miner. Dep. 2009, 44, 765. [Google Scholar] [CrossRef]
  84. Zaitsev, A.I.; Fridovsky, V.Y.; Yakovleva, K.Y.; Kudrin, M.V.; Vernikovskaya, A.E. Composition and age of the basitic dikes of the Nastenka site of the Malo–Tarynskoe orogenic gold deposit (Verkhoyansk–Kolyma folded region, Northeast Russia). In Proceedings of the 19th International Multidisciplinary Scientific GeoConference-SGEM, Albena, Bulgaria, 30 June–6 July 2019; pp. 99–108. [Google Scholar]
  85. Bortnikov, N.S.; Gamyanin, G.N.; Vikent’eva, O.V.; Prokof’ev, V.Y.; Prokop’ev, A.V. The Sarylakh and Sentachan gold–antimony deposits, Sakha-Yakutia: A case of combined mesothermal gold–quartz and epithermal stibnite ores. Geol. Ore Dep. 2010, 52, 339–372. (In Russian) [Google Scholar] [CrossRef]
  86. Aristov, V.V.; Prokofiev, V.Y.; Imamendinov, B.N.; Kryazhev, S.G.; Alekseev, V.Y.; Sidorov, A.A. Features of ore formation at the Drazhnoe gold-quartz deposit (Eastern Yakutia, Russia). Dokl. Earth Sci. 2015, 464, 879–884. [Google Scholar] [CrossRef]
  87. GV GOLD. Available online: https://www.gvgold.ru/ru/our-assets/taryn-business-unit/ (accessed on 25 January 2021).
  88. Bralia, A.; Sabatini, G.; Troja, F. A revaluation of the Co/Ni ratio in pyrite as geochemical tool in ore genesis problems. Miner. Depos. 1979, 14, 353–374. [Google Scholar] [CrossRef]
  89. Cook, N.J.; Ciobanu, C.L.; Mao, J.W. Textural control on gold distribution in As-free pyrite from the Dongping, Huangtuliang and Hougou gold deposits, North China craton (Hebei Province, China). Chem. Geol. 2009, 264, 101–121. [Google Scholar] [CrossRef]
  90. Azovskova, O.B.; Utochkina, N.V.; Zubova, T.P. Geochemical features of pyrite and marcasite from weathering crusts and “ancient” loose deposits of the Aktai area (Northern Urals). In EZHEGODNIK-2013, Tr. IGG UrO RAN; URO RAN: Ufa, Russia, 2014; Volume 161, pp. 238–245. (In Russian) [Google Scholar]
  91. Shanks, W. Stable Isotope Geochemistry of Mineral Deposits; Elsevier Ltd.: Amsterdam, The Nederland, 2014. [Google Scholar]
  92. Goldfarb, R.J.; Groves, D.I. Orogenic gold: Common or evolving fluid and metal sources through time. Lithos 2015, 233, 2–26. [Google Scholar] [CrossRef]
  93. LaFlamme, C.; Sugiono, D.; Thébaud, N.; Caruso, S.; Fiorentini, M.L.; Selvaraja, V.; Jeon, H.; Voute, F.; Martin, L. Multiple sulfur isotopes monitor fluid evolution of an orogenic gold deposit. Geoch. Cosmoch. Acta 2018, 222, 436–446. [Google Scholar] [CrossRef]
  94. Kryazhev, S.G. Isotope-geochemical and genetic models of gold deposits in carbonaceous-terrigenous strata. Domest. Geol. 2017, 1, 28–38. (In Russian) [Google Scholar]
  95. Chang, Z.; Large, R.; Maslennikov, V. Sulfur isotopes in sediment-hosted orogenic gold deposits: Evidence for an early timing and a seawater sulfur source. Geology 2008, 36, 971–974. [Google Scholar] [CrossRef] [Green Version]
  96. Goldfarb, R.J.; Miller, L.D.; Leach, D.L.; Snee, L.W. Gold deposits in metamorphic rocks of Alaska. Econ. Geol. 1997, 9, 151–190. [Google Scholar]
  97. Goldfarb, R.J.; Leach, D.L.; Rose, S.C.; Landis, G.P. Fluid inclusion geochemistry of gold-bearing quartz veins of the Juneau Gold Belt, southeastern Alaska-implications for ore genesis. Econ. Geol. 1989, 6, 363–375. [Google Scholar]
  98. Xue, Y.; Campbell, I.H.; Ireland, T.R.; Holden, P.; Armstrong, R. No mass-independent sulfur isotope fractionation in auriferous fluids supports a magmatic origin for Archean gold deposits. Geology 2013, 41, 791–794. [Google Scholar] [CrossRef]
  99. Kovalev, K.R.; Kalinin, Y.A.; Naumov, E.A.; Kolesnikova, M.K.; Korolyuk, V.N. Gold content of arsenopyrite of gold-sulfide deposits of East Kazakhstan. Geol. Geoph. 2011, 52, 225–242. [Google Scholar]
  100. Kovalev, K.R.; Kuzmina, O.N.; Dyachkov, B.A.; Vladimirov, A.G.; Kalinin, Y.A.; Naumov, E.A.; Kirillov, M.V.; Annikova, I.Y. Gold-sulfide disseminated mineralization of the Zhaima deposit (East Kazakhstan). Geol. Ore Dep. 2016, 58, 116–133. [Google Scholar] [CrossRef]
  101. Mikhalitsyna, T.I.; Sotskaya, O.T. The role of black-shales in the formation of gold-ore deposits Natalka and Pavlik (Yano-Kolymsky orogene belt). Russ. Geol. Geoph. 2020, 61, 1648–1671. [Google Scholar]
  102. Eremin, R.A.; Voroshin, S.V.; Sidorov, V.A.; Shakhtyrov, V.G.; Pristavko, V.A.; Gashtold, V.V. Geology and genesis of the Natalka gold deposit, Northeast Russia. Inter. Geol. Rev. 1994, 36, 1113–1138. [Google Scholar] [CrossRef]
  103. Stepanov, V.A. Zoning of Gold-Quartz Mineralization in Central Kolyma (Magadan Region, Russia); Dalnauka: Vladivostok, Russia, 2001. (In Russian) [Google Scholar]
  104. Gamyanin, G.N.; Bortnikov, N.C.; Alpatov, V.V. The Nezhdaninskoe Gold Ore Deposit is A Unique Deposit in the North-East of Russia; GEOS: Moscow, Russia, 2000. (In Russian) [Google Scholar]
  105. Seltmann, R.; Goldfarb, R.; Zu, B.; Creaser, R.; Dolgopolova, A.; Shatov, V. Muruntau, Uzbekistan: The World’s Largest Epigenetic Gold Deposit. Soc. Econ. Geol. 2020, 23, 497–521. [Google Scholar]
  106. Zairi, N.M. Isotope-Geochemical Models of the Formation of Deposits of Gold-Carbon Formation. Ph.D. Thesis, TSINIGRI, Moscow, Russia, 1992. (In Russian). [Google Scholar]
  107. Rye, D.M.; Rye, R.O. Homestake Gold Mine, South Dakota: I. Stable Isotope Studies. Econ. Geol. 1974, 69, 293–317. [Google Scholar] [CrossRef]
  108. Kryazhev, S.G.; Glukhov, A.P.; Rusinova, O.V.; Kuznetsova, S.V. Isotope-geochemical regime of the formation of the gold-quartz deposit Sovetskoe. In Applied Geochemistry (Analytical Research), 4th ed.; IMGRE: Moscow, Russia, 2003; pp. 154–164. (In Russian) [Google Scholar]
  109. Ohmoto, H. Stable isotope geochemistry of ore deposits. In High Temperature Geological Processes (Review in Mineralogy); Mineralogical Society of America: Washington, DC, USA, 1986; pp. 491–559. [Google Scholar]
  110. Claypool, G.E.; Holser, W.T.; Kaplan, I.R.; Sakai, H.; Zak, I. The age curves of sulfur and oxygen isotopes in marine sulfate and their mutual interpretation. Chem. Geol. 1980, 28, 199–260. [Google Scholar] [CrossRef]
Figure 1. (A,C,D) Regional location, (B) geological structure, and (E) cross-section of Khangalas deposit. Inset map: VFTB, Verkhoyansk fold-and-thrust belt; PDT, Polousny–Debin terrane; C-I, Charky–Indigirka fault; C-Y, Chai–Yureya failt; A-T, Adycha–Taryn fault. Mineralized crushed zones: S, Severnaya; P, Promezhutochnaya; C, Centralnaya; Yu, Yuzhnaya; Z, Zimnyaya.
Minerals 11 00403 g001
Figure 2. (AC) Mineral composition of vein-type ores, and (D) morphology of native gold of Khangalas deposit. (A) Banded quartz with inclusions of native gold (Au), galena (Gn), sphalerite (Sp), and arsenopyrite (Apy); (B,C) intergrowths of native gold (Au), galena (Gn), sphalerite (Sp), and chalcopyrite (Cсp) of the Au–polysulfide vein association and anhedral arsenopyrite (Apy) of quartz–pyrite–arsenopyrite vein association: (B) in reflected light, (C) in backscattered electrons. Hereafter, abbreviations for minerals are from [39].
Minerals 11 00403 g002
Figure 3. Ore bodies of the Khangalas deposit: (A) Yuzhnaya oxidized mineralized fault zone; (B) quartz–carbonate vein. Photographs taken in underground mine workings: (C) vein-type Au–quartz mineralization with native gold, Centralnaya zone, alt. 920 m a.s.l.; (D) disseminated type of mineralization with invisible gold in quartz–sericite–carbonate metasomatites, Centralnaya zone, alt. 920 m a.s.l.; (E) pyrite and quartz veinlets in sandstones, Centralnaya zone, alt. 920 m a.s.l.; (F) oxidized pyrite in sandstones, alt. 945 m a.s.l.
Minerals 11 00403 g003
Figure 4. Mineral paragenesis for Khangalas deposit. 1 Sulfates: gypsum, jarosite, mangazeite, amarantite, meta-aluminite, meta-alunogen, tamarugite, pickeringite, unknown hydrous iron sulfate [40]. 2 Arsenates: scorodite, kankite, bukovskiite, unknown Fe-Al arsenate-phosphate-sulfate [41].
Minerals 11 00403 g004
Figure 5. (A) Photo and (B) photomicrographs of Py1 and Py2 of Khangalas deposit in reflected light, and (C,D) backscattered electrons: (A) Py2 veinlets and Py1 bedding-plane dissemination in siltstone; (B,C) diagenetic Py1 and metamorphic Py2; (D) metamorphic Py2.
Minerals 11 00403 g005
Figure 6. (A,B) Photos and (C,D) photomicrographs of Py3 and Apy1 of Khangalas deposit in reflected light and (EH) backscattered electrons: (A) disseminations of metasomatic Py3 in sandstone; (B) vein-disseminated quartz-Py3-Apy1 mineralization; (C) Py3 veinlets and bedded-plane Py1 dissemination in siltstone; (D) euhedral Apy1; (E) Apy1 aggregate; (F) intergrowths of Py1, Py3, and Apy1 with galena inclusions (Gn); (G) inclusions of native gold (Au) and galena (Gn) in Py3 and Apy1. (H) inclusions of sulfides of gold–polysulfide association (Gn, galena; Ccp, chalcopyrite; Sp, sphalerite) in Py3. Insets: (A, inset a) cubic Py3; (A, inset b) pyritohedra Py3; (D, inset) short prismatic Apy1; (E, inset) pseudo-pyramidal Apy1.
Minerals 11 00403 g006
Figure 7. Three-dimensional visualization of Py3 and Apy1 of Khangalas deposit. (A) Apy1 grains with inclusions of dense minerals (galena, gold); (B) Apy1 without inclusions of x-ray contrasting phases; (C,D) Py3 aggregate with included dense minerals (galena, gold).
Minerals 11 00403 g007
Figure 8. (AC) Photographs and (D) photomicrograph of Py4 and Apy2 of Khangalas deposit (in backscattered electrons): (A) nest-like clusters and individual idiomorphic Apy2 crystals in quartz; (B) idiomorphic Py4 grains in quartz; (C) gold–polysulfide association with Py4, Apy2 in banded quartz; (D) Py4-Apy2 intergrowths with scattered galena (Gn) in quartz.
Minerals 11 00403 g008
Figure 9. Trace element contents by EPMA: (A) Py1; (B) Py2; (C) Py3; (D) Py4; (E) Apy1; (F) Apy2. Box boundaries are first and third quartiles, and line in middle of box is median. Lower border of line shows minimum value, upper shows maximum value, cross shows average value.
Minerals 11 00403 g009
Figure 10. Ratio of As and S in (A) Apy1 and (B) Py3.
Minerals 11 00403 g010
Figure 11. Variations in total content of Co, Ni, Sb, Cu, and Pb (wt.%) in sulfides of different generations, Khangalas deposit. Box boundaries are first and third quartiles, and line in middle of box is median. Lower border of line shows minimum value, upper shows maximum value, cross shows average value.
Minerals 11 00403 g011
Figure 12. Binary correlation diagrams for Ру3: (A) Fe vs. Au; (B) Fe vs. Au + Cu; (C) Fe vs. Au + Cu + Co + Ni; (D) Fe vs. Au + As; (E) As vs. Au; (F) Ag vs. Au, field of orogenic gold deposits (OGDs) and sedimentary Py after Large and Maslennikov [68]; (G) As vs. Te; (H) S vs. Te + As.
Minerals 11 00403 g012
Figure 13. Binary correlation diagrams for Ару1: (A) Fe vs. Au; (B) Au vs. S; (C) As vs. Au.
Minerals 11 00403 g013
Figure 14. Correlation diagrams for Apy1: (A) Au vs. Ag; (B) Au vs. Pb; (C) Au vs. Cu; (D) Au vs. Ni; (E) Au vs. Co; (F) Au vs. Bi; (G) Au vs. Sb; (H) Au vs. Te; (I) Ag vs. Pb. Distribution of some elements (K) inside Apy1 grain (sample K-14-17) (J).
Minerals 11 00403 g014
Figure 15. Ratio diagrams of (A) Co/Ni, (B) Fe/Co, and (C) Fe/Ni for Ру3.
Minerals 11 00403 g015
Figure 16. (A) S isotope composition of sulfides of Khangalas deposit [106,107,108]. Range of values of sulfur sources after Ohmoto [109] and Kryazhev [94]. (B) Variation in δ34S values of sulfides in global sediment-hosted orogenic gold deposits after Goldfarb et al. [96]. Heavy line and blue error envelope indicate seawater sulfate evolution curve from Claypool et al. [110].
Minerals 11 00403 g016
Table 1. Chemical composition of pyrites and arsenopyrites determined by EPMA (all values in wt.%.; nd, not detected).
No SampleFeSAsCoNiCuSbPb
Diagenetic Py1
1K-40-14; n = 11 47.48 45.99 46.79 * 55.82 51.78 54.37 0.31 0.03 0.15 0.13 0.05 0.09 0.17 0.02 0.06 0.06 0.01 0.03 0.05 0.01 0.03 nd
2K-55-14; n = 10 46.63 46.93 46.45 53.89 52.77 53.27 0.31 0.06 0.22 0.18 0.06 0.08 0.19 0.01 0.07 0.06 0.01 0.03 0.05 0.07 0.03 nd
3K-61-14; n = 5 46.99 45.78 46.66 54.44 52.93 53.84 0.30 0.08 0.18 0.11 0.05 0.07 0.05 0.01 0.02 0.02 0.01 0.02 0.06 0.03 0.04 nd
4K-23-14; n = 5 45.69 44.54 45.04 52.41 51.17 52.00 0.23 0.01 0.07 0.07 0.05 0.06 0.33 0.13 0.03 0.03 0.01 0.02 0.06 0.03 0.05 0.10 0.05 0.08
5Kpr2-4-14; n = 4 46.61 46.30 46.44 51.76 50.96 51.45 0.12 0.01 0.06 0.05 0.03 0.04 0.01nd 0.04 0.02 0.03 0.05 0.02 0.04
6K-4-14; n = 6 46.51 45.73 46.17 54.62 52.13 53.18 0.23 0.09 0.16 0.19 0.07 0.10 0.03 0.01 0.02 0.03 0.07 0.01 0.03 nd
7K-7-17; n = 19 47.40 45.06 46.04 53.89 51.41 52.74 0.28 0.02 0.17 0.20 0.02 0.11 0.14 0.01 0.07 0.04 0.01 0.01 0.11 0.01 0.05 nd
8KG-32-19, n = 146.8053.660.18nd0.02nd0.06nd
9KG-7-19, n = 146.5052.310.01nd0.01nd 0.05nd
Metamorphic Py2
10K-40-14; n = 4 46.97 45.91 46.65 54.89 50.60 53.73 0.15 0.09 0.13 0.15 0.08 0.10 0.06 0.03 0.05 0.04 0.02 0.03 0.03 0.01 0.02 nd
11K-55-14; n = 3 46.74 45.53 46.60 52.97 52.67 52.67 0.27 0.20 0.24 0.09 0.07 0.09 0.32 0.01 0.13 0.03 0.01 0.02 0.05 0.03 0.04 nd
12K-4-14; n = 4 46.70 46.13 46.50 52.88 51.71 52.14 0.25 0.03 0.16 0.07 0.05 0.06 0.02 0.01 0.01 0.03 0.01 0.02 0.03 0.02 0.03 nd
13K-23-14; n = 7 45.93 45.31 45.67 53.14 51.35 51.88 0.23 0.02 0.08 0.10 0.06 0.08 0.23 0.04 0.15 0.12 0.01 0.04 0.06 0.01 0.03 0.13 0.03 0.08
14KG-29-19; n = 4 46.98 46.48 46.74 53.95 52.66 53.32 0.14 0.01 0.06 0.05 0.03 0.04 0.01 0.06 0.01 0.03 0.03 0.01 0.02 0.11 0.02 0.07
Hydrothermal-metasomatic Py3
15K-32-14; n = 16 46.17 45.14 45.50 51.95 50.37 50.94 2.14 1.01 1.57 0.08 0.04 0.05 0.07 0.01 0.02 0.02 0.01 0.01 0.05 0.01 0.02 nd
16K-51-14; n = 27 46.91 44.91 46.00 53.59 50.25 51.84 2.22 0.56 1.31 0.17 0.05 0.09 0.25 0.01 0.04 0.05 0.01 0.03 0.04 0.01 0.02 nd
17K-52-14; n = 24 47.01 45.98 46.59 55.10 50.93 53.71 2.49 0.97 1.58 0.11 0.03 0.05 0.14 0.01 0.03 0.03 0.01 0.01 0.04 0.01 0.02 nd
18K-55-14; n = 6 46.59 46.02 46.36 53.32 51.30 52.24 1.03 0.31 0.67 0.21 0.07 0.12 0.10 0.01 0.06 0.04 0.01 0.03 0.06 0.02 0.04 nd
19K-61-14; n = 17 47.15 45.24 46.45 55.48 50.89 52.63 1.86 0.34 0.98 0.08 0.05 0.06 0.07 0.01 0.02 0.12 0.01 0.03 0.12 0.02 0.05 nd
20K-9-17/1; n = 18 46.63 44.87 45.98 54.16 51.04 52.81 1.71 0.31 0.95 0.12 0.06 0.08 0.11 0.01 0.03 0.06 0.01 0.03 0.10 0.01 0.03 nd
21K-4-17; n = 13 46.53 45.58 46.15 52.60 50.76 51.98 1.28 0.40 0.77 0.13 0.04 0.06 0.38 0.01 0.16 0.03 0.01 0.02 0.08 0.01 0.02 nd
22K-14-17; n = 19 46.85 45.36 46.22 54.28 52.82 53.63 1.59 0.38 0.81 0.50 0.05 0.11 0.48 0.01 0.16 0.03 0.01 0.01 0.04 0.01 0.02 0.01
23K-35-17; n = 24 46.98 45.59 46.43 53.39 50.31 51.56 1.81 0.45 1.03 0.13 0.04 0.06 0.24 0.01 0.06 0.06 0.01 0.02 0.06 0.01 0.03 0.13 0.01 0.07
24KG-12-19; n = 25 47.39 45.33 46.60 55.27 52.25 53.93 1.45 0.32 0.82 0.10 0.03 0.05 0.09 0.01 0.02 0.02 0.01 0.01 0.08 0.01 0.04 0.12 0.01 0.06
25KG-13-19; n = 39 46.95 45.50 46.35 54.02 51.59 53.04 2.23 0.33 0.93 0.54 0.04 0.08 0.15 0.01 0.03 0.05 0.01 0.02 0.05 0.01 0.02 0.06 0.01 0.02
26KG-9-19; n = 5 46.95 45.97 46.43 54.02 52.58 53.47 1.27 0.42 0.78 0.10 0.04 0.06 0.15 0.01 0.05 0.05 0.01 0.02 0.06 0.01 0.03 0.03 0.01 0.01
27KG-18-19; n = 26 46.86 45.82 46.48 53.61 50.76 52.89 2.29 0.56 1.27 0.13 0.04 0.07 0.27 0.01 0.04 0.04 0.01 0.01 0.08 0.01 0.02 0.05 0.01 0.02
28KG-24-19; n = 21 46.32 46.76 45.99 54.78 52.66 53.97 2.40 0.36 1.28 0.08 0.04 0.06 0.04 0.01 0.02 0.03 0.01 0.01 0.04 0.01 0.02 0.07 0.01 0.03
29KG-29-19; n = 20 47.17 45.78 46.51 53.62 58.88 52.51 1.88 0.42 1.08 0.62 0.03 0.08 0.23 0.01 0.04 0.06 0.01 0.02 0.05 0.01 0.02 0.13 0.01 0.05
30KG-30-19/1; n = 21 47.18 45.86 45.81 53.93 51.92 53.00 1.05 0.32 0.58 0.08 0.02 0.05 0.33 0.01 0.10 0.04 0.01 0.02 0.04 0.01 0.02 0.14 0.01 0.05
31Kpr-4-14; n = 9 46.84 44.87 46.52 51.87 48.88 51.38 0.97 0.31 0.75 0.08 0.02 0.05 0.04 0.01 0.02 0.02 0.01 0.01 0.07 0.01 0.03 0.03
32KG-30-19/2; n = 9 46.29 45.86 45.86 53.64 52.10 53.06 0.81 0.32 0.53 0.08 0.03 0.05 0.33 0.01 0.12 0.04 0.01 0.01 0.04 0.01 0.02 nd
33K-7-17; n = 10 46.99 45.44 46.08 53.88 49.99 52.44 1.96 0.98 1.37 0.02 0.04 0.01 0.01 0.02 0.01 0.01 0.01 nd
34K-5-14/1; n = 27 50.61 44.99 45.89 55.31 52.48 52.48 1.52 0.45 1.09 0.17 0.04 0.09 0.15 0.01 0.08 0.02 0.01 0.01 0.03 nd
Hydrothermal vein Py4
35KG-1-19; n = 14 47.56 46.30 46.88 54.41 52.86 53.65 1.14 0.35 0.85 0.08 0.05 0.06 0.04 0.01 0.02 0.05 0.01 0.02 0.05 0.01 0.03 nd
36K-45-14; n = 9 46.71 41.62 45.42 52.63 43.86 49.70 2.50 0.45 1.21 0.06 0.03 0.04 0.05 0.01 0.02 0.02 0.01 0.01 0.07 0.01 0.03 nd
Hydrothermal-metasomatic Apy1
37K-32-14; n = 10 33.60 32.12 33.00 20.78 18.88 19.98 44.83 40.40 42.36 0.05 0.03 0.04 0.10 0.01 0.03 0.03 0.01 0.01 0.10 0.02 0.05 nd
38K-51-14; n = 4 33.85 33.16 33.60 21.46 20.34 20.72 48.45 46.61 47.57 0.11 0.07 0.09 0.05 0.01 0.03 0.02 0.01 0.01 0.03 0.01 0.01 nd
39K-52-14; n = 5 35.24 34.36 34.69 23.70 21.77 22.37 44.21 41.93 43.52 0.04 0.02 0.03 0.05 0.01 0.03 0.02 0.01 0.01 0.13 0.05 0.09 nd
40K-4-17; n = 5 33.96 33.16 33.56 20.83 19.93 21.30 44.51 43.22 43.80 0.15 0.03 0.08 0.69 0.04 0.27 0.06 0.01 0.03 0.09 0.03 0.07 nd
41KG-9-19; n = 5 34.29 33.53 34.02 21.90 20.64 21.30 45.06 43.05 43.81 0.07 0.04 0.06 0.02 0.01 0.02 0.01 0.05 0.03 0.04 nd
42KG-30-19/1; n = 5 34.51 33.96 34.10 22.25 20.55 21.33 44.16 42.02 43.21 0.08 0.04 0.05 0.12 0.05 0.08 nd 0.15 0.02 0.08 nd
43K-7-17; n = 15 36.96 33.77 34.58 35.80 20.96 23.12 43.92 4.99 42.23 0.10 0.03 0.06 0.22 0.01 0.03 nd 0.16 0.01 0.06 nd
Hydrothermal vein Apy2
44KG-11-19; n = 43 35.66 31.59 33.02 22.62 19.03 20.50 49.97 41.76 47.52 0.07 0.02 0.03 0.16 0.01 0.04 0.002 0.22 0.01 0.06 nd
45K-21-14; n = 24 35.57 33.24 34.58 23.09 19.18 21.70 47.53 41.11 43.46 0.07 0.03 0.05 0.04 0.01 0.01 0.02 0.01 0.01 0.16 0.03 0.08 nd
* Maximum Minimum Mean .
Table 2. Data of LA-ICP-MS trace element analysis of Py3 and Apy1 of Khangalas gold deposit (all values in ppm; bdl, below detection limit; nd, not detected).
SampleSpot PositionAsTiVCrMnCoNiCuZnGaGeSeMoAgCdInSnSbTeWTlPbBiAuPdBaPtHgAu/Ag
K-4-17Asp10-6-2181.236.31.0452156515.9150.0361.993231.530.9nd0.0480.098905.92.440.0459.70.713.310.0252.250.0511.263.68
K-4-17Asp11-11-20605.073.41.4557.59374.20.0352.361040.560.550.570.1220.683850.50.830.017.410.41720.0122.490.0330.413.64
K-4-17Asp12-14-37.50.2042.61.16524534143.70.0551.826821.60.60.160.1190.187211.970.1290.1113.50.990.5740.0030.290.0060.30.96
K-4-17Asp13-15-0.80.0773.31.093.246.34.65.70.0191.861567.160.1860.070.0760.224160.350.0160.0261.950.4660.255bdl0.28bdl0.421.37
K-4-17Asp14-15-80.1322.30.37.2507.93.30.0851.9566.97.720.47nd0.119bdl8836.20.220.0338.90.4020.3520.0020.330.0280.820.75
K-4-17Asp15-25-0.970.1942.91.714.2213.619100.0132.011871.380.410.0430.1330.13778bdlbdl0.0125.490.896.130.0010.080.0570.9814.95
K-4-17Asp16-26-1.060.0690.591.35107016807.83.60.0212.173299.90.550.0360.1140.07141480.190.0437.831.420.70.0170.340.011.951.27
K-4-17Asp17-33-21.70.292.71.2935.7769.82.550.0592.01107200.5nd0.097bdl9260.010.0820.0197.120.770.88bdl0.110.0180.631.76
K-4-17LineA1-1-2950.621.15nd65122.1820.0143.82126.29.220.57nd0.0620.1265500.741.680.02399.180.6410.488bdl3.1bdl0.510.86
K-4-17LineA1-2-2420.420.71nd3.78.93.440.69bdl4.19983.050.350.10.060.3378bdl1.170.00385.430.560.44bdl2.2bdl1.031.26
K-4-17LineA1-3-320.1110.27nd72811824.571.630.00793.88145.76.030.388nd0.0590.14290.70.270.00495.790.6360.715bdl0.290.0040.641.84
K-4-17LineA2-3.10.08989nd56.51846.54.30.0584.0648.90.1560.341nd0.0350.12193.82.340.0350.04436.30.1132.7bdl4.20.0120.437.92
K-4-17LineA2-2.930.0255.6nd10.3226.12.462.470.00863.893.12.340.698nd0.0620.091208.80.240.0260.0176760.2263.16bdl2.610.020.954.53
K-4-17LineA2-3990.9451.89nd4018742.272.30.0513.89118.51.50.54nd0.05340.262328.30.280.930.029711.40.4540.715bdl2.820.0330.721.32
K-4-17LineA2-720.2012.2nd109.7250.82.051.690.0224.0971.28.680.448nd0.0520.184495bdl0.130.01786.160.7120.8330.0160.540.0080.461.86
K-4-17LineA2-990.3341.98nd1402762.072.280.03143.76118.511.850.3760.00310.05440.182512.60.2550.4510.00877.460.6590.319bdl1.080.0110.570.85
K-4-17LineA2-2780.613.1nd14.8437.56.32.290.01143.67130.311.070.732nd0.0510.218550.60.350.760.006760.20.7590.5620.0241.160.0100.610.77
K-4-17LineA2-77901514.8nd32.6507.912.080.163.92112.911.181.49nd0.0370.8534.30.2122.60.007127.40.6932.430.01130.50.0170.251.63
Minimum 0.80.00.30.33.26.32.10.70.00791.848.90.20.20.00.040.07193.80.010.020.0042.00.10.30.0010.080.0040.250.75
Maximum 7790.015.089.01.71070.01680.019.015.00.164.2329.021.61.50.60.130.801414.08.0022.600.11076.01.46.10.02530.50.0571.9514.95
Average 642.31.48.01.2210.3335.07.33.90.0403.1144.77.50.60.10.080.23588.51.871.880.02618.70.61.50.0123.040.0210.722.84
Std dev 1846.33.620.50.4309.8471.44.83.50.0381.082.06.30.30.20.00.2302.52.55.20.02521.00.31.60.0096.970.0170.413.52
CV 287%252%254%35%147%141%66%89%94%32%57%84%51%140%43%89%51%133%279%98%112%46%105%74%229%79%57%
K-4-17Py1-1489024707.1610.30.851.1314.43.963.510.1972.494.40.0790.92nd0.0050.2310.190.0569.710.0076660.2430.9550.0083.880.062bdl1.04
K-4-17Py2-371100.70.0280.380.570.2338.20.543.620.0552.676.20.210.0076nd0.00210.110.250.210.0670.0180.4790.0480.502bdl0.0080.00730.0266.05
K-4-17Py3-443908.60.1160.390.8217.513.41.583.80.0562.592.60.640.196nd0.0210.05920.130.0550.00743.710.0840.2360.010.160.0340.011.20
K-9-17Py4-742200.780.0580.520.411.1574.934.20.0182.467.20.0590.850.0240.00330.0334070.0830.0190.0658600.930.5070.00360.0080.0290.20.60
K-9-17Py5-81748036.10.350.980.47.0539194.70.192.713.50.0470.0550.0360.0170.076.19bdl0.080.0473.350.098.830.011.830.0370.33160.55
K-9-17Py6-101726023908.427.91.5321.356.9185.30.1912.664.50.710.80.0650.01050.3140.10.068.660.08926.70.44615.850.0134.680.0640.3619.81
K-14-17Py7-1110280770.2350.587.555056907.36.40.0092.6952.11.041.010.0270.00120.078.420.310.1120.0323.30.4572.50.00270.1510.0440.332.48
K-14-17Py8-136820790.1051.090.7441.612981.44.650.0362.740.30.290.062ndbdl0.11.050.210.0960.00282.750.0430.1430.00280.050.013bdl2.31
K-42-17Py9-1880302080.2740.770.7343.564.91.294.220.0182.6373.6bdl0.128nd0.00310.031bdl0.56bdl3.340.0241.0280.0070.0080.01bdl304.69
Minimum4220.00.70.0280.380.400.238.20.53.50.02.52.60.050.010.0240.0010.030.30.10.00.0030.50.020.10.0030.010.010.010.6
Maximum17480.02470.08.4210.307.55505.01298.019.06.40.22.773.61.041.010.0650.0210.31407.00.39.70.089860.00.9339.00.0134.680.060.36304.7
Average8942.2585.61.862.551.5170.9251.16.24.50.12.621.60.380.450.0380.0080.1152.90.22.20.033110.00.267.60.0071.200.030.2162.1
Std dev5147.91047.83.383.772.29163.6448.47.20.90.10.126.70.370.430.0230.0070.10133.40.14.00.031282.10.3012.90.0041.850.020.16105.3
CV58%179%182%148%151%231%179%116%20%96%3%124%96%96%61%95%85%252%70%186%94%257%115%170%60%155%63%79%
Table 3. Results of atomic absorption analysis of proximal metasomatites, their sulfides, and sulfides in quartz veins.
SampleMineral/RockContentAu/Ag
Au, ppmAg, ppm
K-4-17Ру37.398.730.8
K-9-17Ру321.45.643.8
K-9-17Ру322.377.82.9
K-14-17Ру33.541.312.7
K-14-17Ру30.761.150.7
KG-9-19Ру34.892.741.8
KG-32-19Ру310.065.441.8
KG-20-19Ру311.876.541.8
K-13-18Ру33.676.950.5
KG-8-19Ру339.3217.382.3
KG-30-19Ру312.361.1310.9
Average12.515.89
Std dev11.324.71
CV91%80%
K-4-17Ару112.30.4328.6
KG-26-19Ару116.4411.831.4
KG-29-19Ару123.87.23.3
Average17.516.49
Std dev5.825.73
CV33%88%
KG-23-19Ру427.074.466.1
K-5-17Ру49.423.472.7
KG-34-19Ру451.4211.134.6
Average29.306.35
Std dev21.094.17
CV72%66%
KG-35-19Ару220.492.069.9
K-4-17Sandstone with sulfides and quartz veinlets0.0840.0881.0
K-9-17Sandstone with sulfides and quartz veinlets0.7400.0848.8
K-14-17Sandstone with sulfides0.0010.0320.0
K-25-17Sandstone with sulfides0.2400.0425.7
K-27-17Sandstone with sulfides0.0590.0078.4
K-28-17Sandstone with sulfides0.0640.0970.7
K-40-17Sandstone with sulfides5.290.14237.3
K-41-17Siltstone with pyrite0.0060.0410.1
Average0.810.07
Std dev1.830.04
CV225%66%
Table 4. Sulfur isotopic composition of sulfides from metasomatites of Khangalas deposit.
SampleGenerationδ34SVCDT (‰)
1K-4-17Apy1−1.2
2KG-9-19Apy1−1.4
3K-9-17Py3−0.6
4KG-32-19Py3−1.3
5KG-35-19Apy2−2.0
Publisher’s Note: MDPI stays neutral with regard to jurisdictional claims in published maps and institutional affiliations.

