Article

Describing Phosphorus Sorption Processes on Volcanic Soil in the Presence of Copper or Silver Engineered Nanoparticles

by
Jonathan Suazo-Hernández
1,2,
Erwin Klumpp
3,
Nicolás Arancibia-Miranda
4,5,
Patricia Poblete-Grant
2,
Alejandra Jara
2,6,
Roland Bol
3 and
María de La Luz Mora
2,6,*
1
Doctoral Program in Science of Natural Resources, Universidad de La Frontera, Av. Francisco Salazar 01145, P.O. Box 54-D, Temuco, Chile
2
Center of Plant, Soil Interaction and Natural Resources Biotechnology, Scientific and Biotechnological Bioresource Nucleus (BIOREN-UFRO), Universidad de La Frontera, Avenida Francisco Salazar, 01145 Temuco, Chile
3
Institute of Bio- and Geosciences, Agrosphere (IBG–3), Forschungszentrum Jülich, Wilhelm Johnen Str., 52425 Jülich, Germany
4
Faculty of Chemistry and Biology, Universidad de Santiago de Chile, Av. B. O’Higgins, 3363 Santiago, Chile
5
Center for the Development of Nanoscience and Nanotechnology, CEDENNA, 9170124 Santiago, Chile
6
Department of Chemical Sciences and Natural Resources, Universidad de La Frontera, Av. Francisco Salazar 01145, P.O. Box 54-D, Temuco, Chile
*
Author to whom correspondence should be addressed.
Minerals 2021, 11(4), 373; https://doi.org/10.3390/min11040373
Submission received: 5 March 2021 / Revised: 25 March 2021 / Accepted: 29 March 2021 / Published: 1 April 2021
(This article belongs to the Special Issue Elemental Concentration and Pollution in Soil, Water, and Sediment)

Abstract

:
Engineered nanoparticles (ENPs) present in consumer products are being released into the agricultural systems. There is little information about the direct effect of ENPs on phosphorus (P) availability, which is an essential nutrient for crop growth naturally occurring in agricultural soils. The present study examined the effect of 1, 3, and 5% doses of Cu0 or Ag0 ENPs stabilized with L-ascorbic acid (suspension pH 2–3) on P ad- and desorption in an agricultural Andisol with total organic matter (T-OM) and with partial removal of organic matter (R-OM) by performing batch experiments. Our results showed that the adsorption kinetics data of H2PO4 on T-OM and R-OM soil samples with and without ENPs were adequately described by the pseudo-second-order (PSO) and Elovich models. The adsorption isotherm data of H2PO4 from T-OM and R-OM soil samples following ENPs addition were better fitted by the Langmuir model than the Freundlich model. When the Cu0 or Ag0 ENPs doses were increased, the pH value decreased and H2PO4 adsorption increased on T-OM and R-OM. The H2PO4 desorption (%) was lower with Cu0 ENPs than Ag0 ENPs. Overall, the incorporation of ENPs into Andisols generated an increase in P retention, which may affect agricultural crop production.

1. Introduction

In the past decade, the incorporation of engineered nanoparticles (ENPs) into consumer products [1,2] has led to a significant increase in their turnover from $250 billion in 2009 to $3 trillion in 2020 [3]. Two of the most widely used ENPs in consumer products are metallic copper (Cu0) and silver (Ag0), due to their antibacterial properties. Cu0 ENPs are added to biocides, electronics, paints, cosmetics, agrochemicals, ceramics, and film [1,3,4], whereas Ag0 ENPs are used in textiles, air filters, bandages, paints, food storage containers, agrochemicals, deodorants, toothpaste, and household appliances [5]. Thus, as a consequence of extensive and diverse commercial applications, these ENPs can be released into the environment. Soil is the main sink of disposal for most of the released ENPs [6]. Adverse effects on human health and ecosystems may be expected, making it necessary to improve our current understanding of environmental risks, fate, transformations and aggregation behaviors of metallic ENPs [7].
The geochemistry of metallic Cu0 and Ag0 ENPs in soils is complex, due to their chemical transformation between Cu0, Cu+ and Cu2+ as well as between Ag0 and Ag+, respectively [1,4], also due to their strong binding capacity to various soil components like clay minerals, organic matter, microorganisms, among others. Transformations of metallic ENPs in soil include oxidation, dissolution, and sulfidation. Over time, Cu0 ENPs can be oxidized in the soil to form CuO (tenorite) and Cu2O (cuprite) nanoparticles with a core-shell structure. Any of these, both forms of copper oxide nanoparticles, can dissolve and release cuprous and/or cupric ions into solution [8]. Meanwhile, the Ag0 ENPs show a slow oxidation process, which can be promoted in acid soils. The metallic ENPs oxidation in soils can be diminished when organic molecules are used as stabilizing agents [9]. Transformation on metallic ENPs is an important consideration to developing risk assessments of ENPs [4,9].
Several studies have intended to determine the effects caused by ENPs on soil properties. In these studies, it has been shown than due to metallic Cu0 and Ag0, ENPs are characterized by a high surface area and chemical reactivity, variable surface charge and chemical transformation [10]. Once in contact with soil, ENPs may therefore modify their structural and physico-chemical properties such as pH, electric conductivity, redox potential, porosity, and hydraulic conductivity [10,11,12]. This could affect reactions and processes of elements in soil, such as precipitation, dissolution, co-precipitation, complexation, oxidation/reduction, plant uptake, and ad- and desorption. Particularly, ad- and desorption are important because they control the availability and mobility of contaminants and nutrients [10]. In this context, Taghipour and Jalali [13] reported that metal oxide ENPs (Al2O3 and TiO2) caused immobilization of phosphorus (P) in calcareous soils from Hamadan, Western Iran, and reduced the bioavailability of P.
In volcanic soils (Andisol and Ultisol), P is an essential crop macronutrient and this soil contains between 1000 and 3500 mg·kg−1 [14]. However, P availability for plant growth is limited because it can form inner-sphere complexes by ligand exchange with surface -OH and -OH2+ groups of soil components like ferrihydrite, imogolite, allophane, and Al(Fe)-humus complexes [15,16,17]. Numerous studies have focused on P availability in volcanic soils considering the effects on soils of fertilizers [18], liming [19], microorganisms [20,21], enzymes [22], inorganic/organic ligands [23], specific surface area [24], surface charge [25], organic matter content [26], and pH and mineralogy [27].
In relation to effects caused by ENPs in volcanic soils, no studies have assessed the influence of metallic ENPs on the adsorption of nutrients. In this context, the aim of this research was to evaluate the effect of Cu0 or Ag0 ENPs on phosphorus sorption processes in volcanic soils and its relationship with organic matter content. Overall, the results provide new information about the implication of ENPs for nutrient availability in soils.

2. Materials and Methods

2.1. Chemicals Used

The reagents used were CuCl2·2H2O, AgNO3, L-ascorbic acid, KH2PO4, KCl, HCl, and KOH (analytical grade, Merck) and double-distilled water. The pH electrode (Orion Star A211 pH Benchtop Meter, Thermo Fischer Scientific Beverly, Waltham, MA, USA) was calibrated using standard buffers of 4.01, 7.01, and 10.01 (Hanna, Woonsocket, RI, USA).

2.2. Synthesis of Cu0 and Ag0 ENPs

CuCl2·2H2O and AgNO3 were used for the formation of Cu0, and Ag0 ENPs, respectively, and L-ascorbic acid was added as a reducing and capping agent [28]. Cu0 ENPs (or Ag0 ENPs) was synthesized by mixing 10.0 mmol·L−1 CuCl2·2H2O (or 10.0 mmol·L−1AgNO3) in 50 mL double-distilled water. An Erlenmeyer flask (100 mL), containing the CuCl2·2H2O (or AgNO3) solution, was heated in a water bath at 80 °C with magnetic stirring; 50 mL of L-ascorbic acid (1.0 mol·L−1) was added dropwise into the flask while stirring. The aqueous dispersion of stabilized Cu0 ENPs (or Ag0 ENPs) obtained was kept at 80 °C for 24 h and it was finally saved to ambient conditions for later research.

2.3. Soil Samples

The soil used was an Andisol belonging to Santa Barbara series from Southern Chile (36°50′ S; 71°55′ W). The soil was collected from the top 20 cm depth of the soil horizon. The soil was passed through a <2 mm mesh sieve and freeze-dried (total organic matter soil sample = T-OM). For partial removal of organic matter (OM), the T-OM soil sample was treated several times with H2O2 until adding did not result anymore in air bubbles emanating from the aqueous solution and maintained at 40 °C in a thermoregulated bath [29]. The resulting sample was then washed four times with double-distilled water (partial removal of OM soil sample = R-OM). Finally, both soil samples were freeze-dried and stored at 4 °C.

2.4. Characterization of Ag0 and Cu0 ENPs

The synthetized Cu0 and Ag0 ENPs were characterized using transmission electron microscopy (TEM) on a Hitachi model HT7700 (Hitachi, Tokyo, Japan) with Olympus camera (Veleta 2000 × 2000) using high resolution mode at 120 kV. The TEM images obtained were analyzed manually to calculate the particle size with the ImageJ program (version 1.50i, Wayne Rasband, National Institute of Health, Bethesda, MD, USA). The ultraviolet-visible (UV–Vis) spectra was recorded with a double-beam Rayleigh UV-2601 spectrophotometer (BRAIC Co. Ltd., Beijing, China) using 1 cm path length glass cell. The zeta potential (ZP) of Cu0 and Ag0 ENPs (25 mg) was measured in the presence of 10 mL KCl 0.01 M using a Nano ZS apparatus (Malvern Instruments, Worcestershire, UK) at 20 °C and the isoelectric point (IEP) was obtained from graphs of ZP versus pH. The Fourier-transform infrared spectroscopy (FT-IR) were recorded with a 1 mL of ENPs suspension. FT-IR analysis was realized using a Cary 630 spectrometer (Agilent Technologies, Santa Clara, CA, USA). The transmission spectrum was acquired with 4 cm−1 resolution and the operating range was 600 cm−1 to 4000 cm−1 at atmospheric pressure and 20 °C. The pH of the suspensions of ENPs was measured with 10 mL using a pH Meter.

2.5. Characterization of Soil Samples

The morphological characteristics of both soil samples were obtained by scanning electron microscopy with a STEM SU-3500 transmission module (Hitachi, Tokyo, Japan) and the QUANTAX 100 energy-dispersive X-ray spectrometer detector (EDX), (Bruker, Berlin, Germany) was used for the semi-quantitative analysis of the elemental composition (Al, Si, and Fe content). 20 mg of each soil sample were deposited onto 300-mesh Formvar/carbon-coated grids and were inspected under a high-vacuum. Confocal analysis was performed by laser scanning confocal microscopy (LSCM) using the Olympus Fluoview1000 (Olympus Optical Co., Melville, New York, NY, USA). 50 µL of the suspensions were collocated on a microscope slide with a micropipette and the sample was dried on a stove at 40 °C. The total organic carbon (TOC) of T-OM and R-OM soil samples was calculated using a Shimadzu TOC-V CPH instrument (Shimadzu, Tokyo, Japan). The TOC was transformed into soil organic matter content using the conversion factor of 1.72 [30]. The specific surface area of R-OM and T-OM soils was obtained using the Brunauer, Emmett and Teller (BET) theory. Approximately 200 mg of soil sample was degassed for 2 h at 105 °C and then was conducted using N2 gas at −196 °C in the relative pressure range (P/P0) of 0.05–0.4. Surface area measurements were made with a Quantachrome Nova 1000e analyzer (Quantachrome Instruments, Boynton Beach, FL, USA). The average pore volume and size were obtained using the Barrett-Joyner-Halenda (BJH) model. For the FT-IR absorption spectrum, soil samples were dried at 50 °C for 12 h to eliminate the interference produced by the absorption of the water molecules. To determine the functional groups in both soil samples, the analysis was performed under similar conditions to the ENPs. Soil pH was determined in 1:2.5 soil: double-distilled water ratio after 5 min shaking and 120 min resting, using the same pH Meter used for ENPs determination. Total P was extracted from the soil samples by alkaline oxidation with sodium hypobromite (NaBrO) [31]. After each extraction, the supernatant was filtered (5C, Advantec) and then the concentration of total P in the supernatant was determined using a spectrophotometer Rayleigh UV-2601 with a wavelength of 880 nm [32]. Exchangeable Al was extracted with KCl (1 M) and measured using a Unicam model Solaar 969 atomic absorption spectrophotometer (AAS) (Unicam Ltd, Cambridge, UK). Exchangeable base cations (Na, K, Mg and Ca) in soils were extracted using NH4Ac (1 M, pH 7.0) and were measured by AAS [33]. Effective cation exchange capacity (ECEC) was calculated as the sum of exchangeable Al plus the exchangeable base cations [33].
The ZP and IEP of the soil samples were determined pre- and post-adsorption of H2PO4 on T-OM and R-OM soil samples in the absence and presence of 5% Cu0 or Ag0 ENPs using the high point adsorption isotherms similar to the procedure followed by ENPs.

2.6. Adsorption Experiments

Batch experiments were conducted to investigate the adsorption of phosphate (indicated as H2PO4) on T-OM and R-OM soil samples in the absence and presence of 0, 1, 3, and 5% Cu0 or Ag0 ENPs doses (% w/w). Cu0 or Ag0 ENPs doses were added to 0.5 g (dry weight) of soil samples in polyethylene tubes and mixed with 20 mL H2PO4 solution. The adsorbed amounts of H2PO4 (qt, mmol·kg−1) were determined as the difference between initial concentration and final concentration of H2PO4 in the solution (Equation (1)).
q t = ( C 0   C t ) V w
where, Co is the initial concentrations of H2PO4 and Ct is the concentrations of H2PO4 at time t or the equilibrium concentration (mmol·L−1), w the weight (kg) of the soil and V is the volume (L).
To evaluate the pH effect on the adsorption of H2PO4 onto T-OM and R-OM soil samples, stock solutions of 6.47 mmol·L−1 of H2PO4 were prepared with double-distilled water at pH ranging from 4.5 to 8.5 by adding 0.1 M HCl or KOH and ionic strength 0.01 M KCl (background electrolyte). The H2PO4 solutions were added to soil samples with and without ENPs and were stirred at 200 rpm for 24 h at 20 ± 2 °C.
For the kinetic study, the initial solution of 6.47 mmol·L−1 of H2PO4 was adjusted to pH 5.5 ± 0.2 by adding 0.1 M HCl or KOH at ionic strength 0.01 M KCl and 20 ± 2 °C. Samples were taken from the suspension at 2.5, 5, 10, 30, 45, 60, 120, 180, 360, 720, and 1440 min, and H2PO4 was determined in solution. Furthermore, the initial pH (pHi) and the final pH (pHf) were measured after H2PO4 solution was added to soil samples (time 0 min) and after H2PO4 adsorption (1440 min), respectively.
Adsorption isotherms were obtained by varying the initial H2PO4 concentrations from 0.016 to 9.71 mmol·L−1 and were initially adjusted to pH 5.5 ± 0.2 and ionic strength 0.01 M KCl. The suspensions were stirred at 200 rpm in an orbital shaker at 20 ± 2 C for 24 h. To determine the effect of copper (Cu2+) or silver cations (Ag+) or L-ascorbic acid on H2PO4 adsorption onto T-OM and R-OM soil samples, adsorption isotherms were made in the presence of 3% Cu2+ or Ag+ or L-ascorbic acid (% w/w) under the aforementioned experimental conditions.
The desorption experiment was performed once the adsorption isotherm procedure had ended by adding 20 mL of double-distilled water three times, and the samples were then stirred at 200 rpm in an orbital shaker at 20 ± 2 °C for 24 h. The desorption percentages (%) were calculated by the equation used by Silva-Yumi et al. [34] All the samples of the adsorption experiments were first centrifuged at 10,000 rpm for 10 min, using a centrifuge RC-5B Plus (Sorvall, Newtown, CT, USA) and then filtered through 0.22 μm syringe filters. In all experiments, the concentration of H2PO4 in the supernatant was determined according to the procedure followed for total P. To minimize manipulation errors in the analysis, the adsorption experiments were performed in triplicate.

2.7. Data Analysis

The kinetics adsorption (e.g., pseudo-first-order, pseudo-second-order, and Elovich) and isotherm (e.g., Langmuir and Freundlich) models used in this study are presented in Table 1 and Table 2, respectively.
The data were evaluated through the Chi-square (χ2), adding the coefficient of determination (r2) (Equations (2) and (3)). The lowest χ2 and highest r2 values were used as the best fit [37]. The statistical analysis of the adsorption data was conducted using Origin Pro 8.0.
  χ 2 = ( q e , exp q e , cal ) 2 q e , cal
  r 2 = ( q e , mean q e , cal ) 2 ( q e , cal q e , mean ) 2 + ( q e , cal q e , exp ) 2
where, qe,mean is the average value of experimental adsorption capacity (mmol·kg−1), qe,cal is the equilibrium capacity from a model (mmol·kg−1) and qe,exp is the experimental adsorption capacity.

3. Results

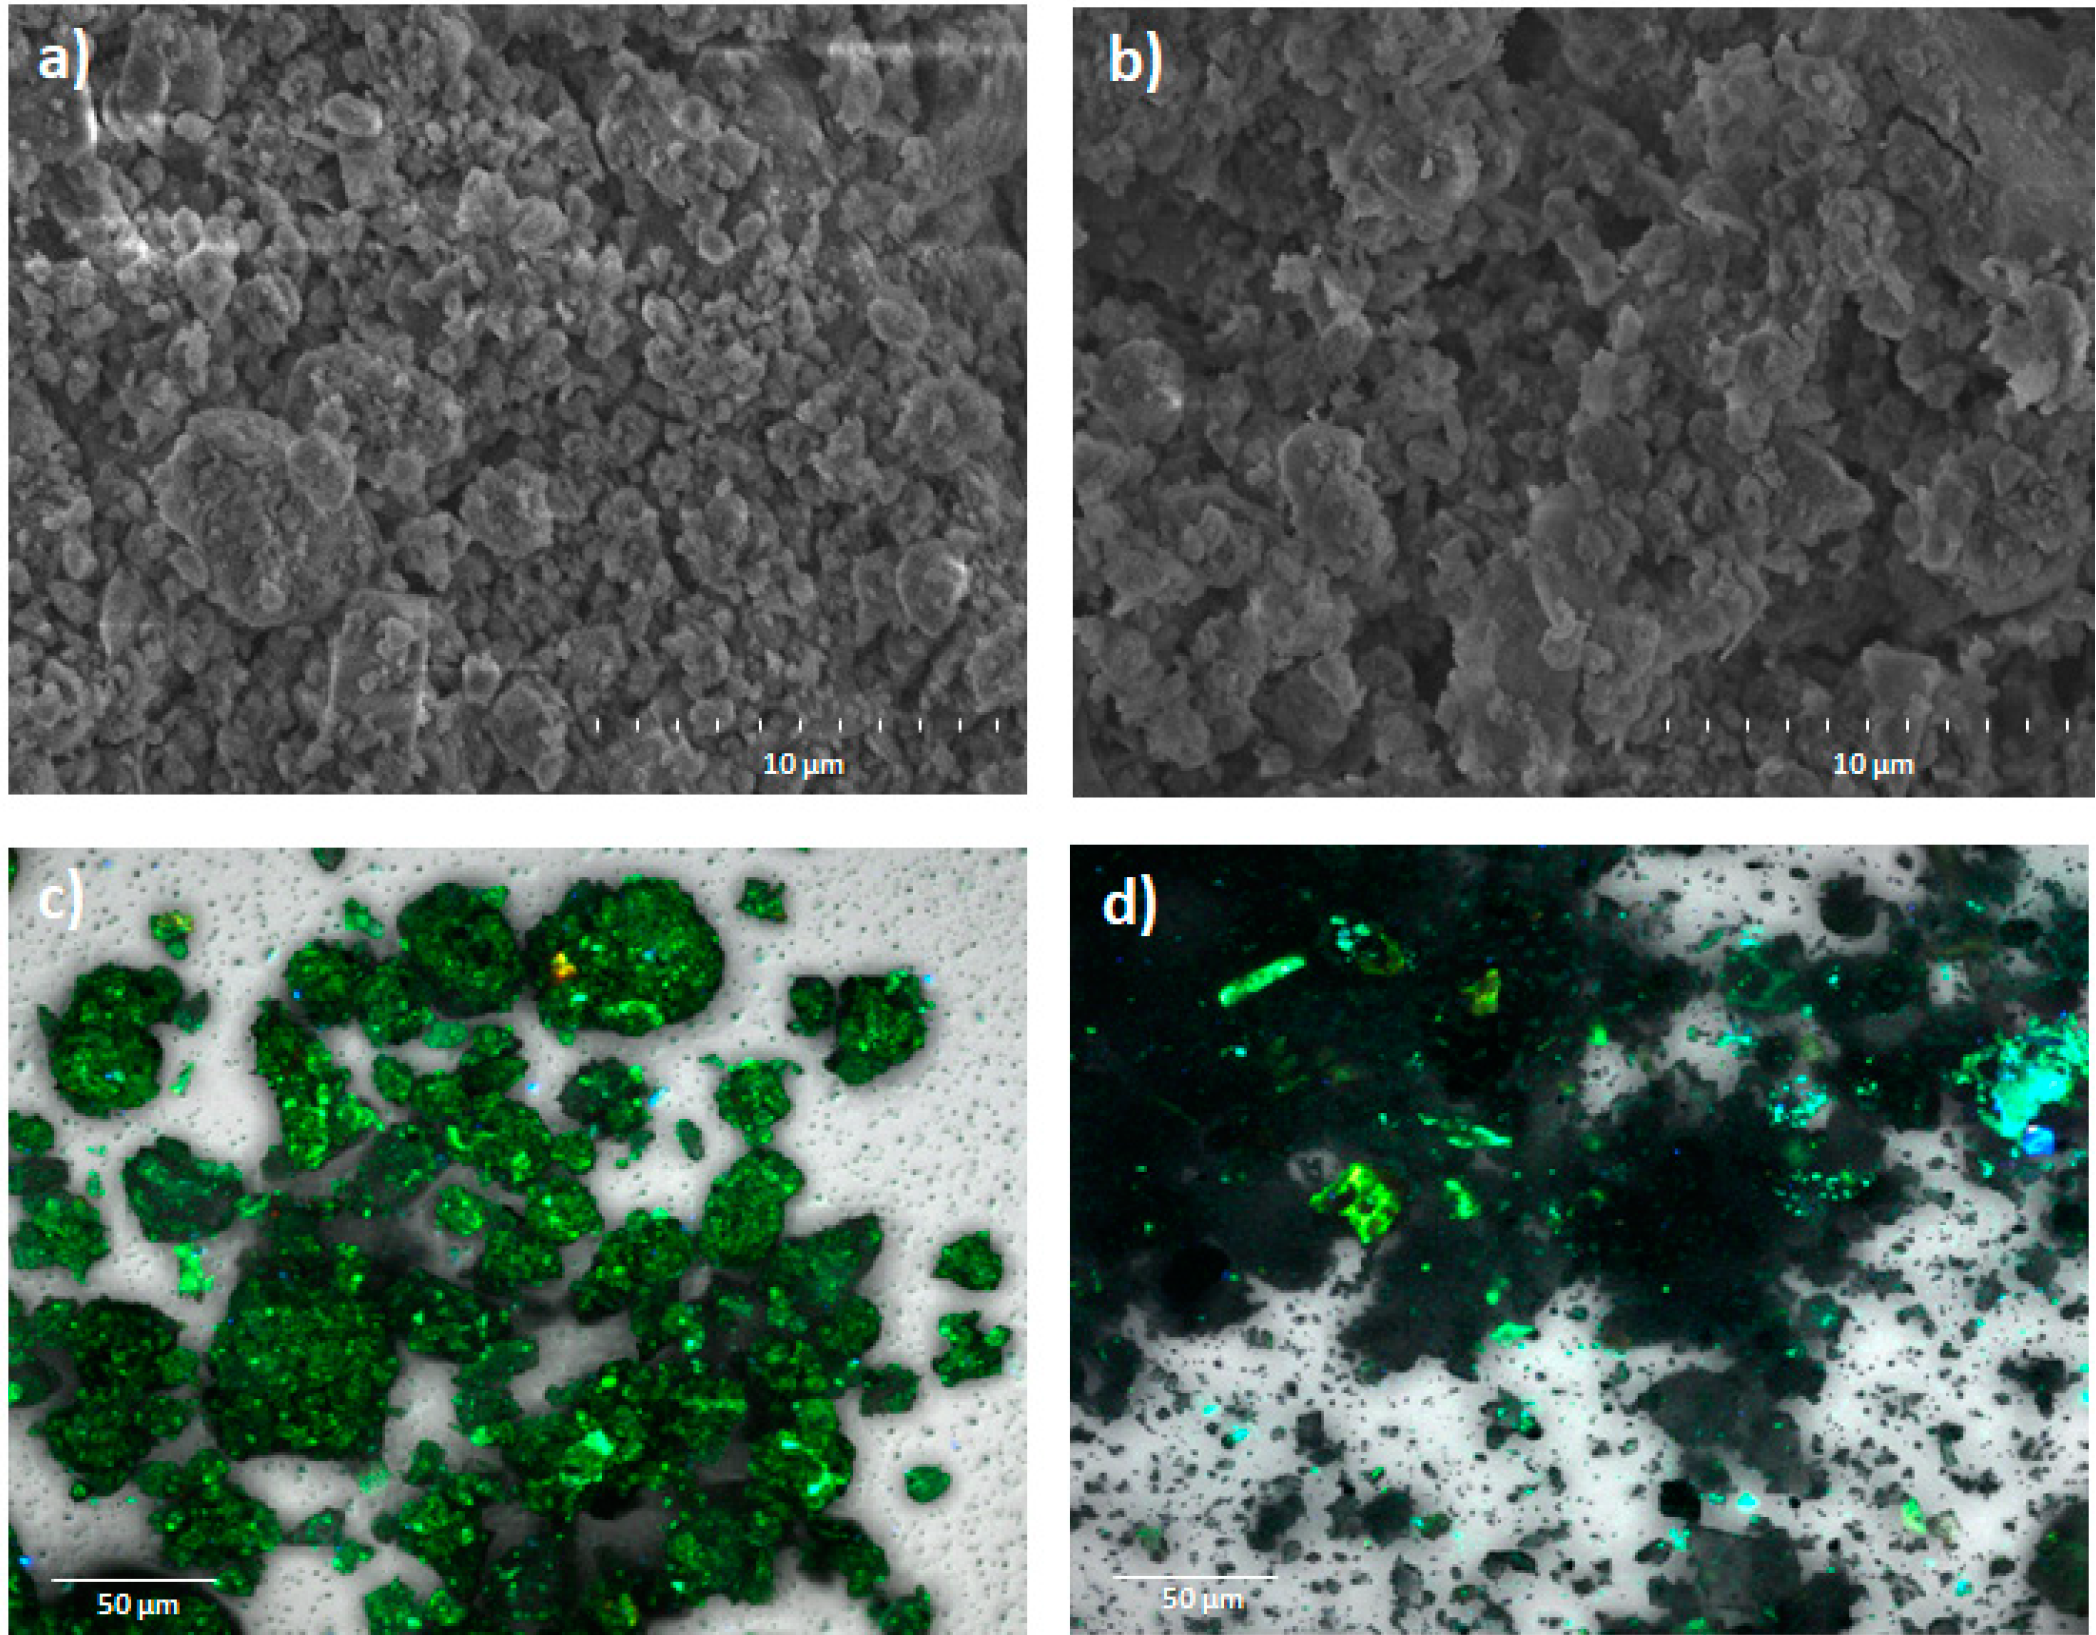
3.1. Characterization of Cu0 and Ag0 ENPs and Soils

The size, morphology, surface charge and the presence of functional groups on the surface of prepared ENPs were determined by TEM images, UV-Vis, ZP and FT-IR analyses. TEM images showed that both ENPs had spherical morphology (Figure S1a,b in Supplementary Materials). Cu0 ENPs had a diameter between 8 and 29 nm, whereas Ag0 ENPs showed a diameter between 7 and 27 nm (Figure S2a,b). The UV-Vis spectra of Cu0 and Ag0 ENPs showed an extended peak in the range of 342–512 and 337–474 nm, respectively (Figure S3). The FT-IR spectra for pure L-ascorbic acid showed a band corresponding to a stretching vibration carbon–carbon double bond at 1674 cm−1 and the peak of enol hydroxyl at 1322 cm−1 (Figure S4a). After the reduction of Cu2+ and Ag+ by L-ascorbic acid, the peaks disappeared and new peaks at 3481 cm−1 and 1636 cm−1 were observed (Figure S4b,c), which were associated with the conjugated hydroxyl and carbonyl groups, respectively. The pH of Cu0 and Ag0 ENPs suspension was 2.46 and 2.35, respectively. The IEP of Cu0 ENPs was 2.7, whereas Ag0 ENPs had a negatively charged surface in the studied pH range (Figure S5).
Physico-chemical properties of the soils untreated (T-OM) and treated with H2O2 (R-OM) are shown in Table 3. The T-OM and R-OM were a typical Andisol exhibiting acidic characteristics showing pH values of 5.40 (strongly acidic) for T-OM and 6.20 (slightly acidic) for R-OM. Total P and OM in T-OM were 1.8 and 3.1 times higher as compared to R-OM, whereas the Al and Fe contents for R-OM were 1.2 and 1.4 times higher than T-OM. The SEM images revealed a decreased number of aggregates in R-OM compared to T-OM (Figure 1a,b). The contrasting OM content was also indicated in confocal images (Figure 1c,d) by a higher green fluorescence intensity for T-OM as compared to R-OM images. The IEP for T-OM was 3.2, while it was 5.7 for R-OM. Furthermore, the BET-specific surface area and pore volume increased 1.4 and 11.5 times for R-OM in comparison to T-OM. The FT-IR analysis (Figure S6) showed that R-OM had bands at 1003 cm−1 and 913 cm−1 corresponding to alumina and silica-rich allophane, respectively, while T-OM only showed the band at 1003 cm−1 [29]. T-OM had more effective cation exchange capacity (ECEC) than R-OM (Table 3).

3.2. H2PO4 Adsorption on Soils with and without Cu0 or Ag0 ENPs

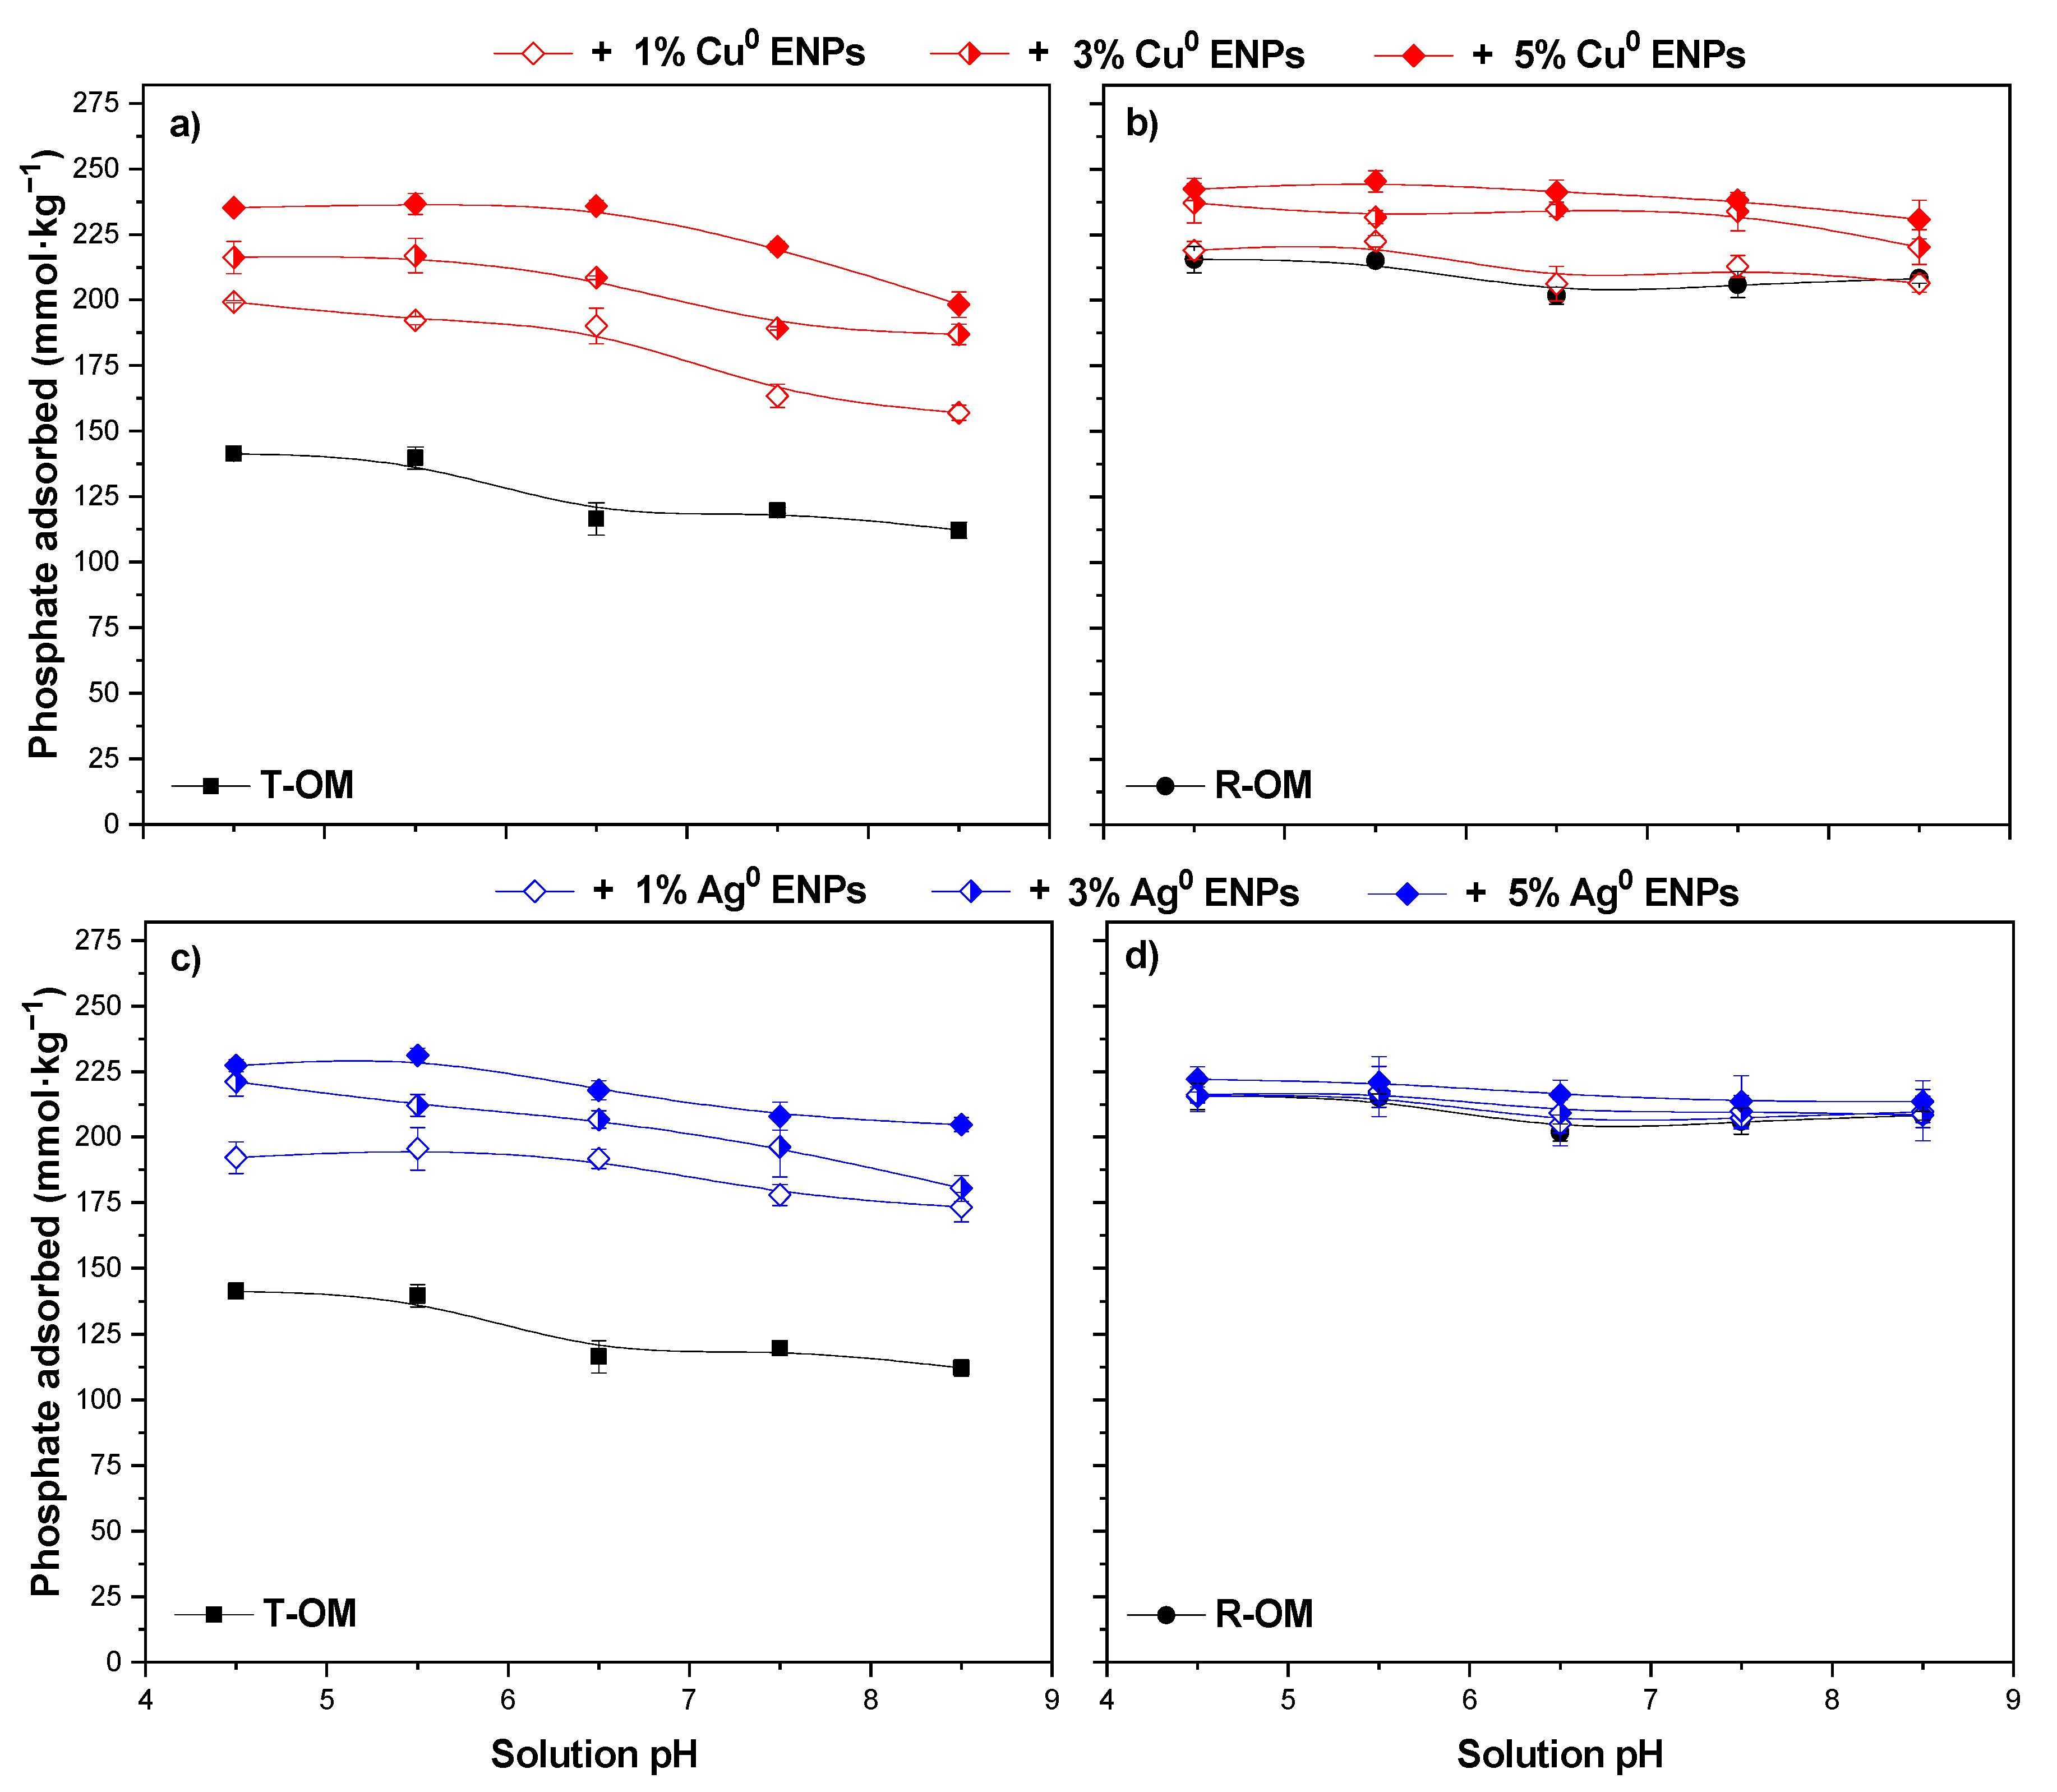
3.2.1. Effect of pH Solution

Figure 2 shows the effect of the H2PO4 pH solution between 4.5–8.5 on H2PO4 adsorption on T-OM and R-OM soil samples in the absence and presence of ENPs. The H2PO4 adsorbed on T-OM decreased slightly with increasing pH without and with ENPs. When Cu0 or Ag0 ENPs content increased, the H2PO4 adsorption on T-OM was 1.4–1.8 times higher than without ENPs (Figure 2a,c). In addition, the H2PO4 adsorption on R-OM increased with increased Cu0 ENPs doses, but with Ag0 ENPs showed no changes (Figure 2b,d).

3.2.2. Adsorption Kinetics

The kinetic studies are shown in Figure 3. We observed that increasing in contact time at pH 5.5 as well as in the presence of Cu0 or Ag0 ENPs there was a subsequent increase in the adsorption of H2PO4 in T-OM and R-OM soil samples. It was also shown that adsorption comprised a fast initial phase at 45 min, followed by a slower rate stage until equilibrium was reached at 360 min for T-OM and at 720 min for R-OM, whereas in the presence of ENPs for most systems it was reached at 720 min. Based on the Table 4, in the absence of ENPs after H2PO4 adsorption on T-OM and R-OM soil samples, the final pH (pHf) showed an increase in relation to the initial pH (pHi). A similar tendency was obtained with increasing the ENPs doses and the pHi and pHf values were lower compared with systems without ENPs.
To determine the kinetic constants and understand the adsorption mechanisms, the experimental kinetics data were modeled by the pseudo-second-order (PSO) Elovich (Table 5) and pseudo-first-order (PFO) (Table S1) models. PSO and PFO models describe the kinetics of the adsorbate on an adsorbent based on chemical-adsorption and physical-adsorption, respectively, with respect to the adsorbent capacity [36]. On the other hand, the Elovich model describes the sorption of adsorbate onto a heterogeneous surface [38,39].
Based on the higher r2 and the lower χ2 values, the PSO model fitted to the adsorption kinetics data better than the PFO model. According to the PSO model, the amount of H2PO4 adsorbed at equilibrium (qe,cal) in T-OM and R-OM soil samples increased with ENPs contents and it was higher in R-OM than T-OM, except for 3 and 5% Ag0 ENPs doses. The kinetic rate (k2) did not show a clear trend at low ENPs contents. However, it increased in T-OM with 5% Ag0 ENPs and with 3 and 5% Cu0 ENPs in R-OM as compared to the soils without ENPs. Similar behavior was observed for the initial adsorption rate (h) in the presence of ENPs leading to increases by adding 3% Cu0 and 5% Ag0 ENPs for T-OM and R-OM soil samples and 5% Cu0 for R-OM and 3% Ag0 ENPs for T-OM.
Experimental kinetic data at pH 5.5 in T-OM and R-OM soil samples without and with increasing Cu0 or Ag0 ENPs content also adequately fitted the Elovich model (r2 = 0.927 − 0.998 and χ2 = 9 − 279). This means that the H2PO4 adsorption happened on a heterogeneous substrate [38]. The initial rate (α) and the surface coverage (β) obtained from this model showed a similar tendency to h and k2, respectively, calculated from the PSO model. Thus, both PSO and Elovich models were capable of describing the kinetics of H2PO4 adsorption on volcanic soils. Similar results have been obtained by other researchers for an acid soil [40] and for adsorbents such as biochar [38] and chitosan [41].

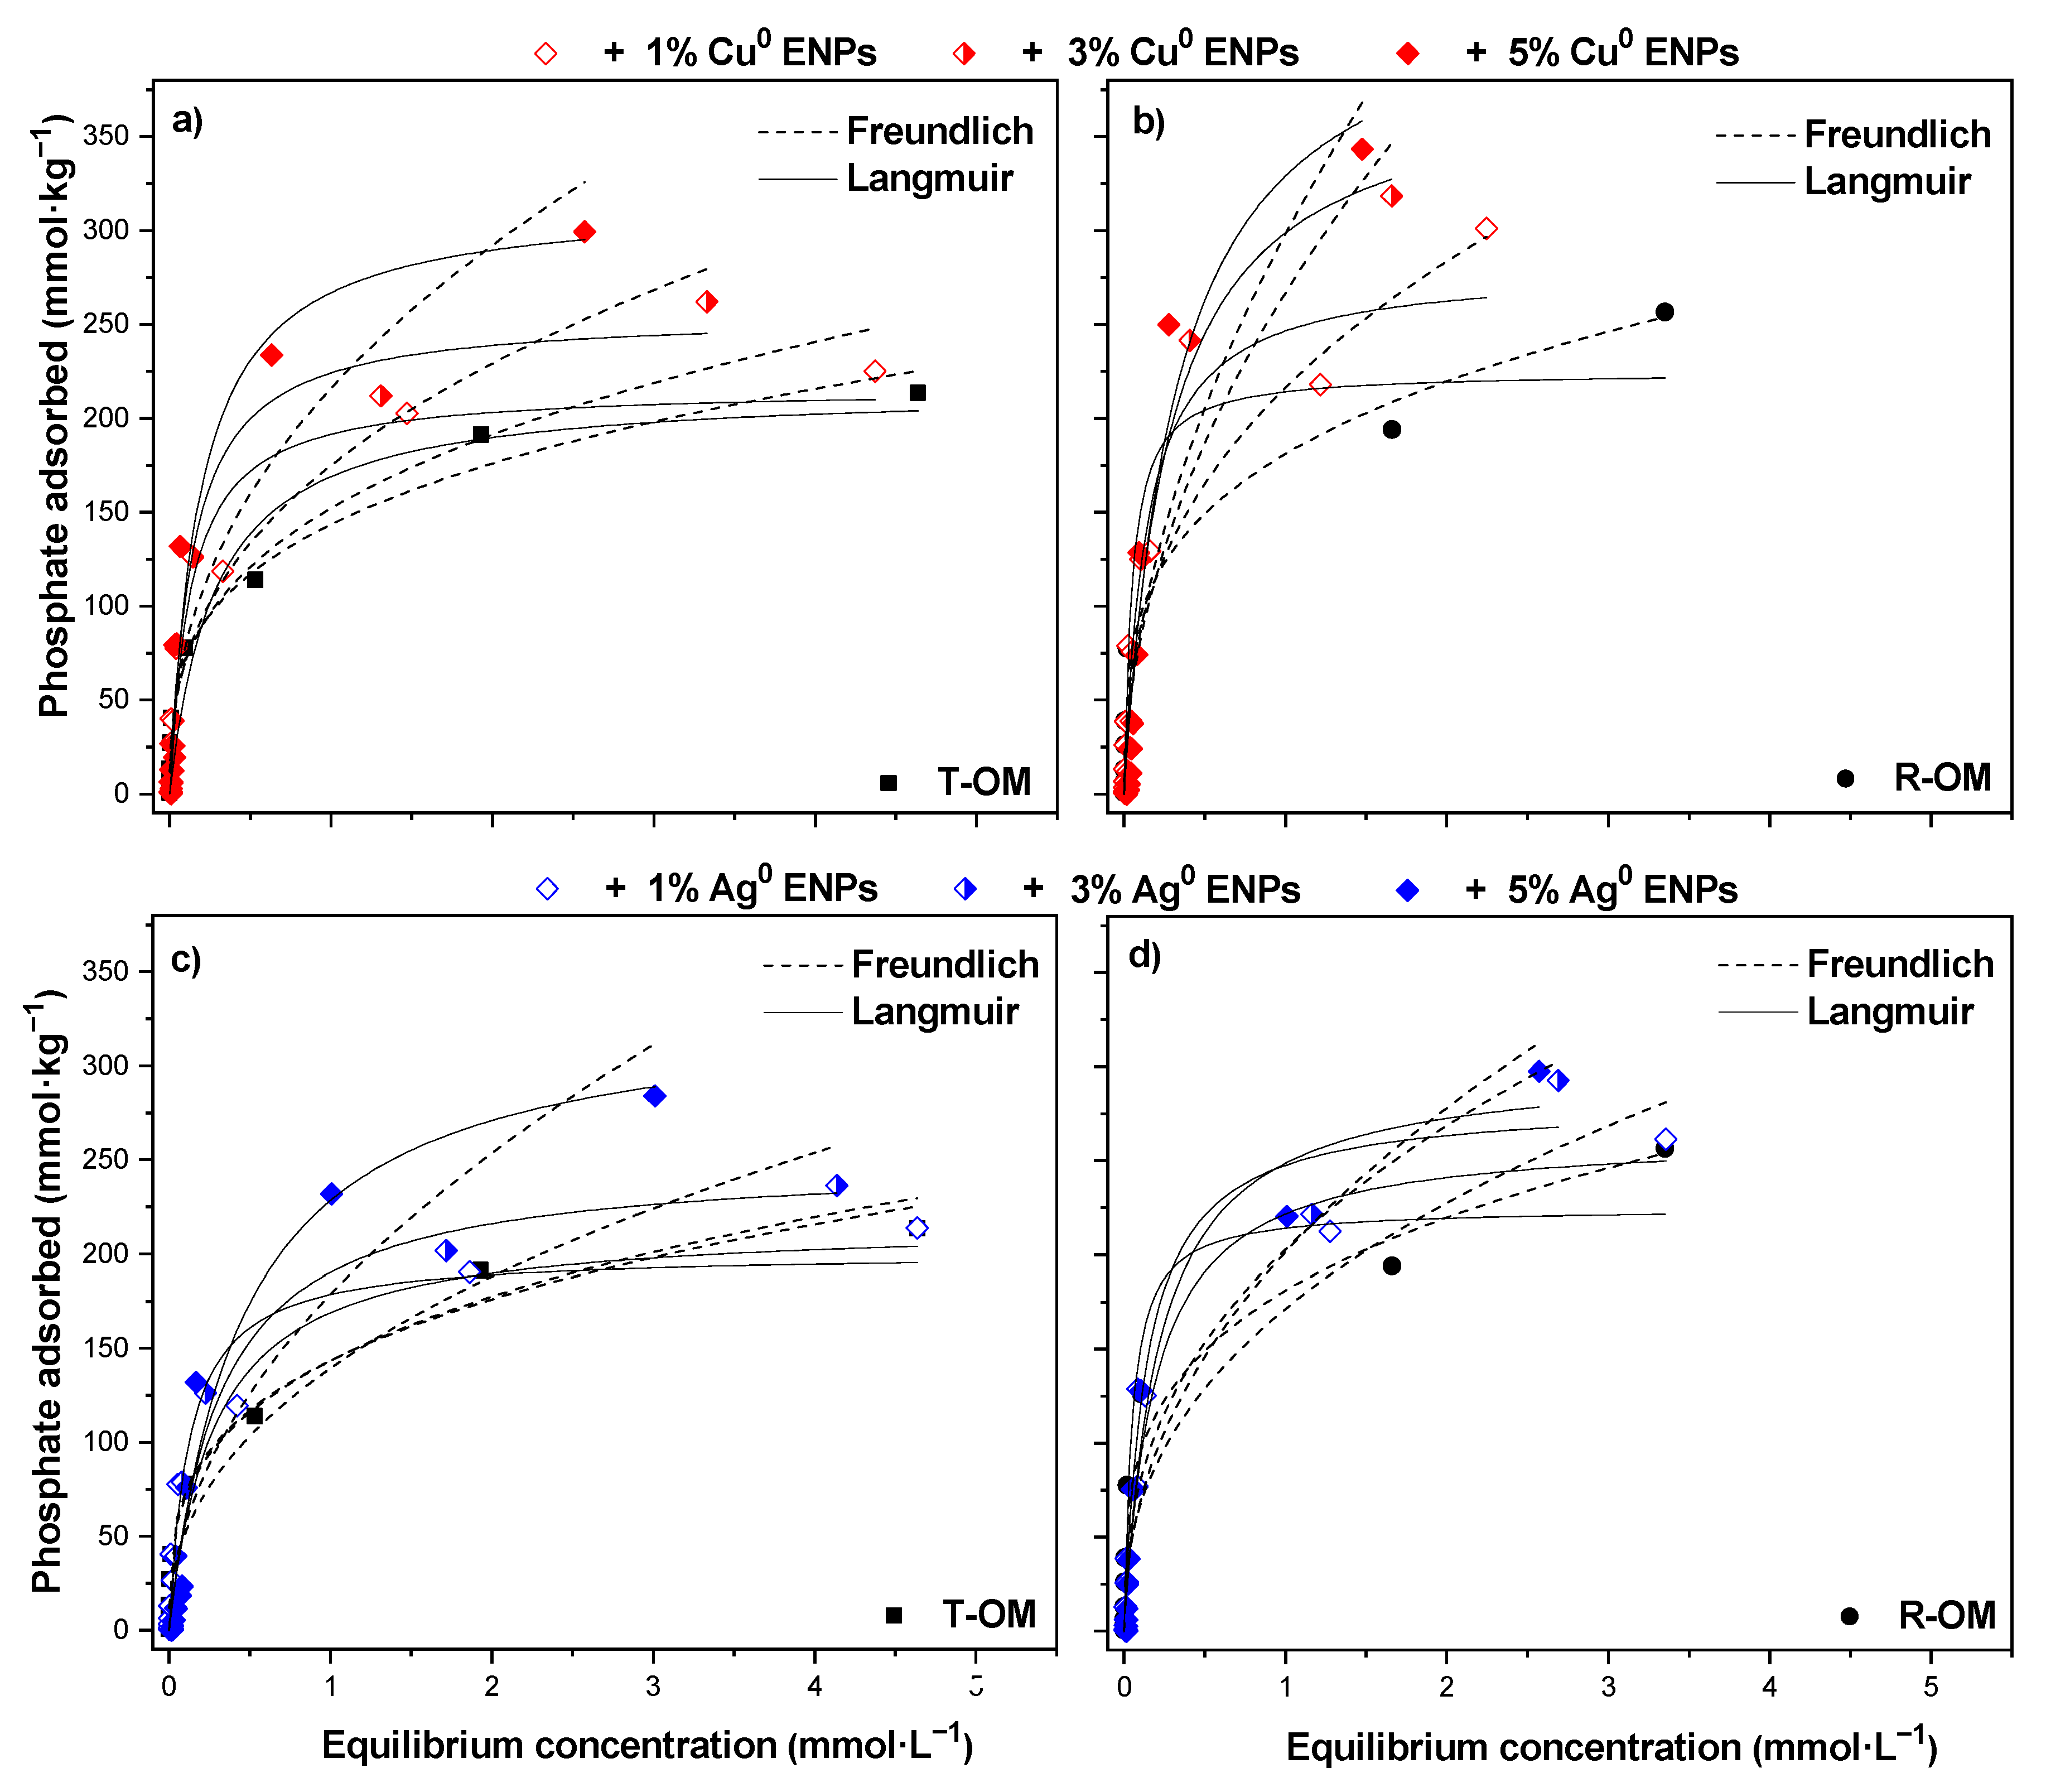
3.2.3. Adsorption Isotherms

The isotherm adsorptions at pH 5.5 (Figure 4) showed that the amount of H2PO4 adsorbed was slightly higher in R-OM than T-OM and H2PO4 adsorption increased with increasing ENPs contents. In general, all adsorption isotherm described curves type L [42]. This means that a high affinity of H2PO4 anions exist in both soils. In particular, in T-OM samples, the curve reached a strict asymptotic plateau, while in R-OM the curve did not reach it. This difference indicated that the number of adsorption sites in the T-OM sample for H2PO4 is limited; on the contrary, the R-OM sample had a greater number of adsorption sites for H2PO4. At the same time, by increasing the Cu0 or Ag0 ENPs content, the curves showed a much less strict plateau for both soil samples, suggesting that the number of available adsorption sites for H2PO4 increased [42,43].
The adsorption isotherm data were fitted by Langmuir and Freundlich models (Table 6), which have been frequently used to explain H2PO4 adsorption on different soils [44,45].
The Freundlich model fitted the experimental data of T-OM and R-OM soil samples better than the Langmuir model (Table 6). However, in the presence of ENPs in T-OM and R-OM soil samples, the Langmuir model, except for R-OM—1% Cu0 ENPs and T-OM—1% Ag0 ENPs systems, showed a better fit to the experimental data (r2 = 0.926 − 0.982 and χ2 = 151 − 1000). According to the Langmuir model, the maximum H2PO4 adsorption capacity (qmax) in R-OM and T-OM soils increased with ENPs contents, and it was higher on R-OM than T-OM, except for 5% Ag0 ENPs dose, in contrast to the affinity coefficient (KL).

3.2.4. Desorption

The desorption (%) depends on the chemical nature and energy of the bonds between soil components and phosphate [46]. In this sense, after the soil samples were treated with double-distilled water repeatedly (three times), H2PO4 desorption was about 3.2 times higher from T-OM than R-OM (Table 6). In the presence of ENPs, the desorption from R-OM and T-OM soils decreased with increasing Cu0 ENPs doses as well as from T-OM with 3 and 5% Ag0 ENPs. In contrast, with increasing Ag0 ENPs content, desorption from R-OM was greater than without ENPs.

4. Discussion

4.1. Characterization of Cu0 and Ag0 ENPs and Soil Samples Studied

The particle size average of Cu0 (19 nm) and Ag0 ENPs (17 nm) was low due to L-ascorbic acid coating, which provides colloidal stability to the nanoparticles by electrostatic repulsion. The stability effect of the L-ascorbic acid coating could be attributed to the presence of a polyhydroxyl structure on the surface of both nanoparticles [28]. This was supported by the high negative values of ZP, which is normally related to the negatively charged groups of the capping agents [28,47]. Similar results using organic molecules as reducing and capping agents for the preparation of ENPs have been reported previously [28,47,48,49,50].
The organic matter in volcanic soils is highly stabilized [51], whereby after repeated treatment with H2O2, only a part of the OM was removed from soil, accounting a 14.1% of OM (T-OM), obtaining a soil sample with 4.6% of OM (R-OM) (Table 3). The partial removal of OM significantly changed the aggregate structure of the soil because OM acts as a binding agent [52]. In addition, T-OM had more aggregates, a higher P concentration and an effective cation exchange capacity (ECEC) as compared to R-OM. In this sense, it is knowing that the functional groups of OM such as carboxyl, alcoholic hydroxyl, and phenolic hydroxyl contribute to the aggregation of soil particles, formation of humic (organic matter)-Al (Fe)-phosphate complexes and cations adsorption [52,53]. Likewise, R-OM samples had a higher IEP and BET-specific surface area than T-OM. This can be explained by the exposure of ≡Fe-OH and ≡Al-OH active sites from amorphous components of the soil, which decreased the negative charges of the surface and increased BET-specific surface area [34]. In general, allophane and ferrihydrite minerals can interact with negatively charged ENPs through attraction (Van der Waals) forces contributing to their retention in the soil [54].

4.2. Ad- and Desorption of Phosphate on Soils

The phosphate adsorption isotherms on T-OM and R-OM soil samples in the absence of ENPs were best fitted to the Freundlich model (Table 6), which reflected the heterogenic nature of soil components. The intensity of adsorption (n) and relative adsorption capacity (KF) for R-OM were higher than T-OM. The difference between KF and n for two soil samples may be due to the higher OM content of T-OM, since OM could block adsorption-specific sites leading to a lower availability of surface-reactive sites and weak interaction with H2PO4 [55]. The OM can act by preventing the irreversible retention of H2PO4 and increasing the nutrient recovery. We found that, after partial OM removal, the H2PO4 desorption from R-OM was lower than from T-OM (Table 6), indicating a strong interaction between the phosphate and mineral components of R-OM [15,16,23]. These results are supported by the higher BET-specific surface area and lower negative surface charge of R-OM as compared to T-OM. Similar results were obtained by Zeng et al. [56] for H2PO4 desorption in volcanic soils exhibiting contrasting OM contents. However, these findings were in contrast to the results reported by Debicka et al. [57] by removing the OM from sandy soil resulted in decreases of KF and n values. Contrasting results could be attributed to the particularly components in each soil. According to the FAO-WRB soil classification, sandy soils such as Brunic Arenosols are mainly characterized by minerals such as hematite, goethite, and maghemite [57,58]. On the contrary, Santa Barbara soil is formed by minerals such as allophane (>50%), followed by 1–5% halloysite and vermiculite [59]. In this context, Parfitt [60] found that phosphate was adsorbed in the order hematite ~ goethite < ferrihydrite < allophane. Moreover, H2PO4 can be rapidly and strongly adsorbed on the most reactive aluminol (≡Al-OH) groups of the allophane by ligand exchange forming monodentate or/and binuclear complexes.
According to the PSO model, the higher H2PO4 adsorption (qe,cal) was in the R-OM as compared to T-OM (Table 5), which could due to the destruction of OM in T-OM, leading to a larger pore volume and BET-surface area. In addition, R-OM improved the accessibility to active sites for H2PO4 according to the higher values of α and h obtained for R-OM (Table 5) [57]. The h parameter can be associated to the chemical and/or hydrogen bonding interaction between H2PO4 and surface hydroxyls in soil samples at the initial adsorption process [16]. Moreover, considering the Elovich model and increase in pHf values after H2PO4 adsorption with respect to pHi (Table 4), we might suggest that H2PO4 adsorption in T-OM and R-OM soil samples was performed mainly through ligand exchange (chemi-adsorption) onto Fe/Al (hydr)oxides forming monodentate or bidentate complexes. The pH changes were consistent with the studies carried out by Vistoso et al. [24], who reported that H2PO4 was adsorbed through ligand exchange mechanism in volcanic soils with contrasting properties.
The H2PO4 adsorption on T-OM was pH-dependent in contrast to R-OM (Figure 2). In this context, the IEP of T-OM was 3.2 whereas it was 5.7 for R-OM. Therefore, in acidic pH H2PO4 solution the surface hydroxyl (–OH) groups in R-OM were more protonated than in T-OM, causing a favorable effect on electrostatic interaction and ligand exchange [61]. However, at alkaline pH H2PO4 solution, mainly for T-OM, there was a decrease in the ligand exchange and an increase in electrostatic repulsion due to deprotonation from soil superficial groups. Likewise, at a higher pH, the competition between OH and H2PO4 on the T-OM surface would also reduce the H2PO4 adsorption [62].

4.3. Ad- and Desorption of Phosphate on Soils in the Presence of Cu0 or Ag0 ENPs

The increasing phosphate adsorption with increasing ENPs content in soils indicated that in the presence of ENPs, the number of adsorption sites increased. Although, there was a decrease in the initial adsorption rate (h) with 1% ENPs content, which implied that during the first few minutes ENPs compete with H2PO4 for the adsorption sites of the soil surface. Additionally, h strongly increased with 3 and 5% ENPs content, suggesting that ENPs also contributed to new adsorption sites for H2PO4 [63,64]. Accordingly, Duncan and Owens [63] indicated that CeO2 ENPs can be adsorbed on soil adsorption sites before Pb(II) and Sun et al. [64] determined a similar trend for h with increasing carbon nanotubes (CNTs) content after studying the effects of CNTs with outer diameter of 25 nm and inner diameter of 5 nm on Cd(II) adsorption in sediments.
The adsorption isotherms of H2PO4 on T-OM and R-OM following Cu0 or Ag0 ENPs addition fitted to the Langmuir model (Table 6). Similarly, Sun et al. [64] found that in the presence of CNTs the isotherms for Cd(II) on sediment showed a better fit to the Langmuir than the Freundlich model; however due to the adsorption sites of sediments with CNTs are heterogeneous, they used the Freundlich to describe their results. Therefore, the fit of adsorption data to the Langmuir model in the presence of ENPs should be more studied.
Adsorption enhancement was larger through Cu0 than Ag0 ENPs. According to Afshinnia and Baalousha [65], the decrease in the zeta potential after H2PO4 adsorption on T-OM and R-OM soil samples with ENPs could be associated with H2PO4 adsorption/complexation onto the ENPs surface (Figure S7). In this context, Niaura et al. [66] indicated that H2PO4 was adsorbed through monodentate surface coordination on Cu0 ENPs, while on Ag0 ENPs it was performed through hydrogen bonding [66,67]. Although both coated ENPs had a low rate of oxidation and dissolution [68], it was probable that these processes could be favored by an acidic soil pH as well as a consequence of the ionic exchange between H2PO4 and L-ascorbic acid on the surface of the ENPs, being similar to the mechanism observed for citric acid [50]. Under such conditions, Cu0 could be oxidized to Cu2+ (E°Cu2+/Cu0 = 0.337 V) and the amount of phosphate adsorbed in T-OM and R-OM soil samples increased (Figure S8) because Cu2+ could be linked to H2PO4 and hydroxyl groups of OM via a cation bridge [69]. Furthermore, this could be attributed to the formation of complexes between Cu2+ and H2PO4 and the precipitate of Cu3(PO4)2 (Ksp = 2.07 × 10⁻³³) [70]. Meanwhile, in the case that Ag+ ions were released from Ag0 ENPs into solution (E°Ag+/Ag0 = 0.799 V), the formation of AgCl precipitate was more favorable (Ksp = 1.77 × 10⁻¹⁰) than a Ag3PO4 formation (Ksp = 8.89 × 10⁻¹⁷) [71,72].
On the other hand, the presence of L-ascorbic acid free in soil solution slightly competes with H2PO4 for available adsorption sites, decreasing H2PO4 adsorption on T-OM and R-OM soil samples (Figure S8). However, as a consequence of the addition of Cu0 or Ag0 ENPs suspensions to soil samples, the pHi values decreased, being less acidic in T-OM as compared to R-OM (Table 4), which was consistent with the buffering capacity of OM [73]. An acid pH can be associated with a decrease in the electrostatic repulsion between H2PO4 and the negatively charged surface of the organic matter (-COOH, -OH) due to a decrease in the number of deprotonated surface groups [74]. Furthermore, the protonation of surface hydroxyl groups of Fe/Al (hydr)oxides might be favored by acid pH values, promoting the H2PO4 adsorption through a ligand exchange [24,75,76]. In the same way, it has been reported that below 4.5 of pH values the mineral dissolution is favored, promoting the precipitation reactions between H2PO4 and cations in solution (Al3+ and Fe3+) [77], and to form H2PO4-cation-organic matter complexes [53].
The increase of the H2PO4 adsorption at a low pH has been demonstrated on pillared bentonites [75], AgNPs-tea activated carbon [76], sediments [78] and in Andisol soils [24]. Future research should be addressed to corroborate whether, in the presence of both ENPs, one of these mechanisms was prevalent for H2PO4 adsorption on T-OM and R-OM soil samples, or whether several mechanisms acted together.
The H2PO4 adsorption in the presence of ENPs through chemical interactions onto a heterogeneous surface was indicated by the adequate fits of the kinetic data to the PSO and Elovich models (Table 5). In addition, the desorption behavior supported the adsorption mechanisms proposed in the presence of ENPs. With Cu0 ENPs, the desorption of H2PO4 from T-OM and R-OM soil samples was smaller than Ag0 ENPs. These results can be supported by a chemisorption-like interaction between H2PO4 and Cu0 ENPs. Similarly, desorption studies of U(VI) on the soil in the presence of nano-crystalline goethite showed that U(VI) was more resistant to released due to an increase in the inner-sphere complexes on the soil surface [79]. In addition, Elkhatib et al. [80] revealed that sorption of Hg(II) on arid soils in the presence of water treatment residual nanoparticles occurred mainly through inner-sphere complexes, which enhanced Hg immobilization in the arid soils. The high desorption of H2PO4 in R-OM following Ag0 ENPs addition needs further investigation. One possible explanation for this is that the Ag0 ENPs were attached to the potential H2PO4 adsorption sites, such as allophane and Fe oxides, leading to a blocking effect for H2PO4 on this soil with lower levels of OM. Then, the H2PO4 physi-adsorbed (through hydrogen bonding) on the surface of the attached Ag0 ENPs was more desorbable.

5. Conclusions

Our study demonstrated that the phosphate adsorption process in the presence of ENPs was dependent on the amount of ENPs and soil organic matter content. The addition of Cu0 caused a higher increase in phophate adsorpion on T-OM and R-OM as compared to the Ag0 ENPs. The Elovich and pseudo-second-order (PSO) models correctly described the kinetic adsorption of phosphate on T-OM and R-OM soil samples without and with ENPs.
The phosphate adsorption with both ENPs was better described by the Langmuir isotherm model than the Freundlich model. According to the Langmuir model, by increasing the ENPs content from 0 to 5%, the maximum adsorption capacity (qmax) of H2PO4 for T-OM ranged from 216.1 to 316.4 mmol·kg−1 following the Cu0 ENPs addition and to 332.8 mmol·kg−1 using Ag0 ENPs. Meanwhile, with the increase from 0 to 5% of ENPs, the qmax of H2PO4 for R-OM ranged from 224.7 to 440.2 mmol·kg−1 with Cu0 ENPs and to 301.4 mmol·kg−1 with Ag0 ENPs. Phosphate desorption in T-OM and R-OM soils following Cu0 ENPs addition was lower than Ag0 ENPs. In the future, more attention should be pointed globally to management agriculture practices based on nanotechnology, because the incorporation of ENPs into the soil have the potential to reduce the already limited crop phosphorus availability.

Supplementary Materials

The following are available online at https://www.mdpi.com/article/10.3390/min11040373/s1, Figure S1: TEM images L-ascorbic acid-stabilized (a) Cu0 and (b) Ag0 ENPs, Figure S2: Histograms with the corresponding particle size distribution for L-ascorbic acid-stabilized (a) Cu0 and (b) Ag0 ENPs, Figure S3: UV-Vis absorption spectra for L-ascorbic acid-stabilized Cu0 and Ag0 ENPs, Figure S4: FT-IR spectra of (a) Pure L-ascorbic acid, (b) L-ascorbic acid-stabilized Cu0 ENPs and (c) L-ascorbic acid-stabilized Ag0 ENPs, Figure S5: Zeta potential of L-ascorbic acid-stabilized Cu0 and Ag0 ENPs in 0.01 M KCl, Figure S6: FT-IR spectrum for soil samples with (a) total organic matter (T-OM) and (b) partial removal of organic matter (R-OM), Figure S7: Zeta potential curves in the presence of 9.71 mmol·L−1 H2PO4 and 5% Cu0 or 5% Ag0 ENPs at constant ionic strength (0.01 M KCl) for soil with (a) total organic matter (R-OM) and (b) partial removal of organic matter (R-OM), Figure S8: Adsorption isotherm curves of H2PO4 on (a) total organic matter (T-OM) and /9b) partial removal of organic matter (R-OM) in the presence of 3% L-ascorbic acid and Cu2+ and Ag+. Reaction conditions: Concentrations from 0.016 to 9.71 mmol·L−1 H2PO4 on 0.5 g soil in 0.01 M KCl at 20 ± 2 °C and pH 5.5, Table S1: Pseudo-first-order parameters (± standard error) obtained from H2PO4 adsorption kinetics in the absence and presence of different doses of Cu0 and Ag0 ENPs at pH 5.5 ± 0.2 for soil with total organic matter (T-OM) and with partial removal of organic matter (R-OM).

Author Contributions

Conceptualization, E.K., M.d.L.L.M. and A.J.; methodology, J.S.-H.; software, J.S.-H.; validation, M.d.L.L.M., E.K., N.A.-M. and R.B.; formal analysis, J.S.-H.; P.P.-G. and A.J.; investigation, J.S.-H. and P.P.-G.; resources, M.d.L.L.M.; data curation, J.S.-H.; writing—original draft preparation, J.S.-H., N.A.-M. and E.K.; writing—review and editing, E.K., R.B., N.A.-M. and A.J.; visualization, J.S.-H. and R.B.; supervision, M.d.L.L.M. and N.A.-M.; project administration, M.d.L.L.M.; funding acquisition, M.d.L.L.M. and J.S.-H. All authors have read and agreed to the published version of the manuscript.

Funding

This research was funded by the Fondo Nacional de Desarrollo Científico y Tecnológico (FONDECYT) projects Nº 1181050 and 1191018 and by the Agencia Nacional de Investigación y Desarrollo (ANID) Ph.D. scholarships Nº 21171685.

Data Availability Statement

Data are contained within this article.

Acknowledgments

Jonathan Suazo-Hernández acknowledges to Daniela Vergara, the FONDECYT project № 3210228, the Technological Bioresource Nucleus (BIOREN-UFRO) and the Soil and Plant Laboratory.

Conflicts of Interest

The authors declare no conflict of interests.

References

  1. Shah, V.; Luxton, T.P.; Walker, V.K.; Brumfield, T.; Yost, J.; Shah, S.; Wilkinson, J.E.; Kambhampati, M. Fate and impact of zero-valent copper nanoparticles on geographically-distinct soils. Sci. Total Environ. 2016, 573, 661–670. [Google Scholar] [CrossRef] [Green Version]
  2. Ramyadevi, J.; Jeyasubramanian, K.; Marikani, A.; Rajakumar, G.; Rahuman, A.A. Synthesis and antimicrobial activity of copper nanoparticles. Mater. Lett. 2012, 71, 114–116. [Google Scholar] [CrossRef]
  3. Roco, M.C.; Mirkin, C.A.; Hersam, M.C. Nanotechnology research directions for societal needs in 2020: Summary of international study. J. Nanoparticle Res. 2011, 13, 897–919. [Google Scholar] [CrossRef] [Green Version]
  4. Li, M.; Wang, P.; Dang, F.; Zhou, D.M. The transformation and fate of silver nanoparticles in paddy soil: Effects of soil organic matter and redox conditions. Environ. Sci. Nano 2017, 4, 919–928. [Google Scholar] [CrossRef]
  5. Baskar, V.; Venkatesh, J.; Park, S.W. Impact of biologically synthesized silver nanoparticles on the growth and physiological responses in Brassica rapa ssp. pekinensis. Environ. Sci. Pollut. Res. 2015, 22, 17672–17682. [Google Scholar] [CrossRef]
  6. Boxall, A.B.A.; Tiede, K.; Chaudhry, Q. Engineered nanomaterials in soils and water: How do they behave and could they pose a risk to human health? Nanomedicine 2007, 2, 919–927. [Google Scholar] [CrossRef] [PubMed]
  7. Conway, J.R.; Adeleye, A.S.; Gardea-Torresdey, J.; Keller, A.A. Aggregation, dissolution, and transformation of copper nanoparticles in natural waters. Environ. Sci. Technol. 2015, 49, 2749–2756. [Google Scholar] [CrossRef] [PubMed] [Green Version]
  8. Kent, R.D.; Vikesland, P.J. Dissolution and Persistence of Copper-Based Nanomaterials in Undersaturated Solutions with Respect to Cupric Solid Phases. Environ. Sci. Technol. 2016, 50, 6772–6781. [Google Scholar] [CrossRef]
  9. Liu, J.; Hurt, R.H. Ion release kinetics and particle persistence in aqueous nano-silver colloids. Environ. Sci. Technol. 2010, 44, 2169–2175. [Google Scholar] [CrossRef]
  10. Ben-Moshe, T.; Frenk, S.; Dror, I.; Minz, D.; Berkowitz, B. Effects of metal oxide nanoparticles on soil properties. Chemosphere 2013, 90, 640–646. [Google Scholar] [CrossRef] [PubMed]
  11. Bayat, H.; Kolahchi, Z.; Valaey, S.; Rastgou, M.; Mahdavi, S. Iron and magnesium nano-oxide effects on some physical and mechanical properties of a loamy Hypocalcic Cambisol. Geoderma 2019, 335, 57–68. [Google Scholar] [CrossRef]
  12. Torrent, L.; Marguí, E.; Queralt, I.; Hidalgo, M.; Iglesias, M. Interaction of silver nanoparticles with mediterranean agricultural soils: Lab-controlled adsorption and desorption studies. J. Environ. Sci. 2019, 83, 205–216. [Google Scholar] [CrossRef] [PubMed]
  13. Taghipour, M.; Jalali, M. Effect of nanoparticles on kinetics release and fractionation of phosphorus. J. Hazard. Mater. 2015, 283, 359–370. [Google Scholar] [CrossRef] [PubMed]
  14. Escudey, M.; Galindo, G.; Förster, J.E.; Briceño, M.; Diaz, P.; Chang, A. Chemical Forms of Phosphorus of Volcanic Ash-Derived Soils in Chile. Commun. Soil Sci. Plant Anal. 2001, 32, 601–616. [Google Scholar] [CrossRef]
  15. Mora, M.L.; Galindo, G.; Escudey, M. The role of iron oxides and organic matter on phosphate adsorption in model allophanic synthetic soils. Chil. J. Agric. Res. 1992, 52, 416–421. [Google Scholar]
  16. Wang, H.; Zhu, J.; Fu, Q.L.; Xiong, J.W.; Hong, C.; Hu, H.Q.; Violante, A. Adsorption of phosphate onto ferrihydrite and ferrihydrite-humic acid complexes. Pedosphere 2015, 25, 405–414. [Google Scholar] [CrossRef]
  17. Borie, F.; Aguilera, P.; Castillo, C.; Valentine, A.; Seguel, A.; Barea, J.M.; Cornejo, P. Revisiting the Nature of Phosphorus Pools in Chilean Volcanic Soils as a Basis for Arbuscular Mycorrhizal Management in Plant P Acquisition. J. Soil Sci. Plant Nutr. 2019, 19, 390–401. [Google Scholar] [CrossRef]
  18. Paredes, C.; Menezes-Blackburn, D.; Cartes, P.; Gianfreda, L.; Mora, M.L. Phosphorus and nitrogen fertilization effect on phosphorus uptake and phosphatase activity in ryegrass and tall fescue grown in a Chilean Andisol. Soil Sci. 2011, 176, 245–251. [Google Scholar] [CrossRef]
  19. Mora, M.L.; Cartes, P.; Demanet, R.; Cornforth, I.S. Effects of lime and gypsum on pasture growth and composition on an acid Andisol in Chile, South America. Commun. Soil Sci. Plant Anal. 2002, 33, 2069–2081. [Google Scholar] [CrossRef]
  20. Jorquera, M.A.; Hernández, M.T.; Rengel, Z.; Marschner, P.; Mora, M.L. Isolation of culturable phosphobacteria with both phytate-mineralization and phosphate-solubilization activity from the rhizosphere of plants grown in a volcanic soil. Biol. Fertil. Soils 2008, 44, 1025–1034. [Google Scholar] [CrossRef]
  21. Osorio, N.W.; Habte, M. Soil Phosphate Desorption Induced by a Phosphate-Solubilizing Fungus. Commun. Soil Sci. Plant Anal. 2014, 45, 451–460. [Google Scholar] [CrossRef]
  22. Calabi-Floody, M.; Velásquez, G.; Gianfreda, L.; Saggar, S.; Bolan, N.; Rumpel, C.; Mora, M.L. Improving bioavailability of phosphorous from cattle dung by using phosphatase immobilized on natural clay and nanoclay. Chemosphere 2012, 89, 648–655. [Google Scholar] [CrossRef] [PubMed]
  23. Jara, A.A.; Violante, A.; Pigna, M.; Mora, M.L. Mutual Interactions of Sulfate, Oxalate, Citrate, and Phosphate on Synthetic and Natural Allophanes. Soil Sci. Soc. Am. J. 2006, 70, 337–346. [Google Scholar] [CrossRef]
  24. Vistoso, E.; Theng, B.K.G.; Bolan, N.S.; Parfitt, R.L.; Mora, M.L. Competitive sorption of molybdate and phosphate in Andisols. J. Soil Sci. Plant Nutr. 2012, 12, 59–72. [Google Scholar] [CrossRef] [Green Version]
  25. Cartes, P.; Cea, M.; Violante, A.; Mora, M.L.; Jara, A. Description of mutual interactions between silicon and phosphorus in Andisols by mathematical and mechanistic models. Chemosphere 2015, 131, 117–164. [Google Scholar] [CrossRef] [PubMed]
  26. Vistoso, E.M.; Bolán, N.S.; Theng, B.K.G.; Mora, M.L. Kinetics of Molybdate and Phosphate Sorption by Some Chilean Andisols. Rev. Cienc. Suelo Nutr. Veg. 2009, 9, 55–68. [Google Scholar] [CrossRef] [Green Version]
  27. Pigna, M.; Jara, A.A.; Mora, M.L.; Violante, A. Effect Of pH, Phosphate and/or Malate on Sulfate Sorption on Andisols. Rev. Cienc. Suelo Nutr. Veg. 2007, 7, 62–73. [Google Scholar] [CrossRef] [Green Version]
  28. Xiong, J.; Wang, Y.; Xue, Q.; Wu, X. Synthesis of highly stable dispersions of nanosized copper particles using L-ascorbic acid. Green Chem. 2011, 13, 900–904. [Google Scholar] [CrossRef]
  29. Siéwé, J.M.; Djoufac Woumfo, E.; Djomgoue, P.; Njopwouo, D. Activation of clay surface sites of Bambouto′s Andosol (Cameroon) with phosphate ions: Application for copper fixation in aqueous solution. Appl. Clay Sci. 2015, 114, 31–39. [Google Scholar] [CrossRef]
  30. Khatoon, H.; Solanki, P.; Narayan, M.; Tewari, L. Role of microbes in organic carbon decomposition and maintenance of soil ecosystem. Int. J. Chem. Stud. 2017, 5, 1648–1656. [Google Scholar]
  31. Dick, W.A.; Tabatabai, M.A. An Alkaline Oxidation Method for Determination of Total Phosphorus in Soils. Am. Soc. Agron. 1976, 41, 501–514. [Google Scholar] [CrossRef]
  32. Murphy, J.; Riley, J.P. A modified single solution method for the determination of phosphate in natural waters. Anal. Chim. Acta 1962, 27, 31–36. [Google Scholar] [CrossRef]
  33. Sadzawka, R.A.; Carrasco, R.M.A.; Grez, Z.R.; Mora, M.L.; Flores, P.H.; Neaman, A. Métodos de Análisis Recomendados Para Suelos Chilenos; Comisión de Normalización y Acreditación (CNA), Sociedad Chilena de la Ciencia del Suelo: Santiago, Chile, 2006. [Google Scholar]
  34. Silva-Yumi, J.; Escudey, M.; Gacitua, M.; Pizarro, C. Kinetics, adsorption and desorption of Cd (II) and Cu (II) on natural allophane: Effect of iron oxide coating. Geoderma 2018, 319, 70–79. [Google Scholar] [CrossRef]
  35. Lin, J.; Wang, L. Comparison between linear and non-linear forms of pseudo-first-order and pseudo-second-order adsorption kinetic models for the removal of methylene blue by activated carbon. Front. Environ. Sci. Eng. China 2009, 3, 320–324. [Google Scholar] [CrossRef]
  36. Febrianto, J.; Kosasih, A.N.; Sunarso, J.; Ju, Y.H.; Indraswati, N.; Ismadji, S. Equilibrium and kinetic studies in adsorption of heavy metals using biosorbent: A summary of recent studies. J. Hazard. Mater. 2009, 162, 616–645. [Google Scholar] [CrossRef]
  37. Wang, J.; Guo, X. Adsorption isotherm models: Classification, physical meaning, application and solving method. Chemosphere 2020, 258, 127279. [Google Scholar] [CrossRef]
  38. Eduah, J.O.; Nartey, E.K.; Abekoe, M.K.; Weck Henriksen, S.; Neumann Andersen, M. Mechanism of orthophosphate (PO4-P) adsorption onto different biochars. Environ. Technol. Innov. 2019, 17, 100572–100583. [Google Scholar] [CrossRef]
  39. Rawajfih, Z.; Nsour, N. Adsorption of γ-picoline onto acid-activated bentonite from aqueous solution. Appl. Clay Sci. 2010, 47, 421–427. [Google Scholar] [CrossRef]
  40. Ghodszad, L.; Reyhanitabar, A.; Oustan, S. Biochar effects on phosphorus sorption-desorption kinetics in soils with dissimilar acidity. Arab. J. Geosci. 2021, 14, 366–383. [Google Scholar] [CrossRef]
  41. Zhang, B.; Chen, N.; Feng, C.; Zhang, Z. Adsorption for phosphate by crosslinked/non-crosslinked-chitosan-Fe (III) complex sorbents: Characteristic and mechanism. Chem. Eng. J. 2018, 353, 361–372. [Google Scholar] [CrossRef]
  42. Giles, C.H.; Macewan, T.H.; Nakhwa, S.N.; Smit, D. 786. Studies in adsorption. Part XI. A System of Classi$cation of Solution Adsorption Isotherms, and its Use in Diagnosis of Adsorption Mechanisms and in Measurement of Specific Surface Areas of Solids. J. Chem. Soc. 1960, 846, 3973–3993. [Google Scholar] [CrossRef]
  43. Limousin, G.; Gaudet, J.P.; Charlet, L.; Szenknect, S.; Barthès, V.; Krimissa, M. Sorption isotherms: A review on physical bases, modeling and measurement. Appl. Geochem. 2007, 22, 249–275. [Google Scholar] [CrossRef]
  44. Mermoz, S.J.; Emmanuel, D.W.; Dieudonne, B.; Francois, F.; Paul, D.; Daniel, N.; Tamfuh, A.P. Andosols of the Bambouto Mountains (West Cameroon): Characteristics, Superficial Properties—Study of the Phosphate Ions Adsorption. Open Inorg. Chem. J. 2008, 2, 106–115. [Google Scholar] [CrossRef]
  45. Yang, X.; Chen, X.; Yang, X. Effect of organic matter on phosphorus adsorption and desorption in a black soil from Northeast China. Soil Tillage Res. 2019, 187, 85–91. [Google Scholar] [CrossRef]
  46. Fink, J.R.; Inda, A.V.; Bavaresco, J.; Barrón, V.; Torrent, J.; Bayer, C. Adsorption and desorption of phosphorus in subtropical soils as affected by management system and mineralogy. Soil Tillage Res. 2016, 155, 62–68. [Google Scholar] [CrossRef]
  47. Zain, N.M.; Stapley, A.G.F.; Shama, G. Green synthesis of silver and copper nanoparticles using ascorbic acid and chitosan for antimicrobial applications. Carbohydr. Polym. 2014, 112, 195–202. [Google Scholar] [CrossRef] [Green Version]
  48. Kobayashi, Y.; Ishida, S.; Ihara, K.; Yasuda, Y.; Morita, T.; Yamada, S. Synthesis of metallic copper nanoparticles coated with polypyrrole. Colloid Polym. Sci. 2009, 287, 877–880. [Google Scholar] [CrossRef]
  49. Kobayashi, Y.; Sakuraba, T. Silica-coating of metallic copper nanoparticles in aqueous solution. Colloids Surfaces a Physicochem. Eng. Asp. 2008, 317, 756–759. [Google Scholar] [CrossRef]
  50. Njoki, P.N. Transformation of Silver Nanoparticles in Phosphate Anions: An Experiment for High School Students. J. Chem. Educ. 2019, 96, 546–552. [Google Scholar] [CrossRef]
  51. Calabi-Floody, M.; Bendall, J.S.; Jara, A.A.; Welland, M.E.; Theng, B.K.G.; Rumpel, C.; Mora, M.L. Nanoclays from an Andisol: Extraction, properties and carbon stabilization. Geoderma 2011, 161, 159–167. [Google Scholar] [CrossRef]
  52. Krause, L.; Rodionov, A.; Schweizer, S.A.; Siebers, N.; Lehndorff, E.; Klumpp, E.; Amelung, W. Microaggregate stability and storage of organic carbon is affected by clay content in arable Luvisols. Soil Tillage Res. 2018, 182, 123–129. [Google Scholar] [CrossRef]
  53. Gerke, J. Humic (organic matter)-Al (Fe)-phosphate complexes: An underestimated phosphate form in soils and source of plant-available phosphate. Soil Sci. 2010, 175, 417–425. [Google Scholar] [CrossRef]
  54. Hoppe, M.; Mikutta, R.; Kaufhold, S.; Utermann, J.; Duijnisveld, W.; Wargenau, E.; Fries, E.; Guggenberger, G. Retention of sterically and electrosterically stabilized silver nanoparticles by soil minerals. Eur. J. Soil Sci. 2016, 67, 573–582. [Google Scholar] [CrossRef]
  55. Nafiu, A. Effects of soil properties on the kinetics of desorption of phosphate from Alfisols by anion-exchange resins. J. Plant Nutr. Soil Sci. 2009, 172, 101–107. [Google Scholar] [CrossRef]
  56. Zeng, L.; Johnson, R.L.; Li, X.; Liu, J. Phosphorus removal from aqueous solutions by sorption on two volcanic soils. Can. J. Soil Sci. 2011, 83, 547–556. [Google Scholar] [CrossRef]
  57. Debicka, M.; Kocowicz, A.; Weber, J.; Jamroz, E. Organic matter effects on phosphorus sorption in sandy soils. Arch. Agron. Soil Sci. 2015, 62, 840–855. [Google Scholar] [CrossRef]
  58. Hirsch, F.; Bonhage, A.; Bauriegel, A.; Schneider, A.; Raab, T.; Raab, A.; Gypser, S. The occurrence, soil parameters and genesis of rubified soils (‘Fuchserden’) of northeastern Germany. Catena 2019, 175, 77–92. [Google Scholar] [CrossRef]
  59. Cáceres-Jensen, L.; Rodríguez-Becerra, J.; Parra-Rivero, J.; Escudey, M.; Barrientos, L.; Castro-Castillo, V. Sorption kinetics of diuron on volcanic ash derived soils. J. Hazard. Mater. 2013, 261, 602–613. [Google Scholar] [CrossRef]
  60. Parfitt, R.L. Phosphate reactions with natural allophane, ferrihydrite and goethite. J. Soil Sci. 1989, 40, 359–369. [Google Scholar] [CrossRef]
  61. Zhou, A.; Tang, H.; Wang, D. Phosphorus adsorption on natural sediments: Modeling and effects of pH and sediment composition. Water Res. 2005, 39, 1245–1254. [Google Scholar] [CrossRef]
  62. Li, R.; Wang, J.J.; Zhou, B.; Awasthi, M.K.; Ali, A.; Zhang, Z.; Gaston, L.A.; Lahori, A.H.; Mahar, A. Enhancing phosphate adsorption by Mg/Al layered double hydroxide functionalized biochar with different Mg/Al ratios. Sci. Total Environ. 2016, 559, 121–129. [Google Scholar] [CrossRef] [PubMed] [Green Version]
  63. Duncan, E.; Owens, G. Metal oxide nanomaterials used to remediate heavy metal contaminated soils have strong effects on nutrient and trace element phytoavailability. Sci. Total Environ. 2019, 678, 430–437. [Google Scholar] [CrossRef]
  64. Sun, W.; Jiang, B.; Wang, F.; Xu, N. Effect of carbon nanotubes on Cd (II) adsorption by sediments. Chem. Eng. J. 2015, 264, 645–653. [Google Scholar] [CrossRef]
  65. Afshinnia, K.; Baalousha, M. Effect of phosphate buffer on aggregation kinetics of citrate-coated silver nanoparticles induced by monovalent and divalent electrolytes. Sci. Total Environ. 2017, 581–582, 268–276. [Google Scholar] [CrossRef] [PubMed] [Green Version]
  66. Niaura, G.; Gaigalas, A.K.; Vilker, V.L. Surface-enhanced Raman spectroscopy of phosphate anions: Adsorption on silver, gold, and copper electrodes. J. Phys. Chem. B 1997, 101, 9250–9262. [Google Scholar] [CrossRef]
  67. White, P.; Hjortkjaer, J. Preparation and characterisation of a stable silver colloid for SER(R)S spectroscopy. J. Raman Spectrosc. 2014, 45, 32–40. [Google Scholar] [CrossRef]
  68. Cornelis, G.; Doolette Madeleine Thomas, C.; McLaughlin, M.J.; Kirby, J.K.; Beak, D.G.; Chittleborough, D. Retention and Dissolution of Engineered Silver Nanoparticles in Natural Soils. Soil Sci. Soc. Am. J. 2012, 76, 891–902. [Google Scholar] [CrossRef]
  69. Pérez-Novo, C.; Fernández-Calviño, D.; Bermúdez-Couso, A.; López-Periago, J.E.; Arias-Estévez, M. Influence of phosphorus on Cu sorption kinetics: Stirred flow chamber experiments. J. Hazard. Mater. 2011, 185, 220–226. [Google Scholar] [CrossRef]
  70. Liu, R.; Zhao, D. In situ immobilization of Cu (II) in soils using a new class of iron phosphate nanoparticles. Chemosphere 2007, 68, 1867–1876. [Google Scholar] [CrossRef]
  71. Zhang, H.; Wang, J.N.; Zhu, Y.G.; Zhang, X. Research and application of analytical technique on δ18Opof inorganic phosphate in soil. Chin. J. Anal. Chem. 2015, 43, 187–192. [Google Scholar] [CrossRef]
  72. Zhou, W.; Liu, Y.-L.; Stallworth, A.M.; Ye, C.; Lenhart, J.J. Effects of pH, Electrolyte, Humic Acid, and Light Exposure on the Long-Term Fate of Silver Nanoparticles. Environ. Sci. Technol. 2016, 50, 12214–12224. [Google Scholar] [CrossRef] [PubMed]
  73. Funakawa, S.; Hirooka, K.; Yonebayashi, K. Temporary storage of soil organic matter and acid neutralizing capacity during the process of pedogenetic acidification of forest soils in Kinki District, Japan. Soil Sci. Plant Nutr. 2008, 54, 434–448. [Google Scholar] [CrossRef]
  74. Poggere, G.C.; Melo, V.F.; Serrat, B.M.; Mangrich, A.S.; França, A.A.; Corrêa, R.S.; Barbosa, J.Z. Clay mineralogy affects the efficiency of sewage sludge in reducing lead retention of soils. J. Environ. Sci. 2019, 80, 45–57. [Google Scholar] [CrossRef] [PubMed]
  75. Yan, L.G.; Xu, Y.Y.; Yu, H.Q.; Xin, X.D.; Wei, Q.; Du, B. Adsorption of phosphate from aqueous solution by hydroxy-aluminum, hydroxy-iron and hydroxy-iron-aluminum pillared bentonites. J. Hazard. Mater. 2010, 179, 244–250. [Google Scholar] [CrossRef]
  76. Trinh, V.T.; Nguyen, T.M.P.; Van, H.T.; Hoang, L.P.; Nguyen, T.V.; Ha, L.T.; Vu, X.H.; Pham, T.T.; Nguyen, T.N.; Quang, N.V.; et al. Phosphate Adsorption by Silver Nanoparticles-Loaded Activated Carbon derived from Tea Residue. Sci. Rep. 2020, 10, 1–13. [Google Scholar] [CrossRef] [PubMed] [Green Version]
  77. Bulmer, D.; Hamilton, J.; Kar, G.; Dhillon, G.; Si, B.C.; Peak, D. Effects of Citrate on the Rates and Mechanisms of Phosphate Adsorption and Desorption on a Calcareous Soil. Soil Sci. Soc. Am. J. 2019, 83, 332–338. [Google Scholar] [CrossRef]
  78. Liu, Z.; Zhang, Y.; Han, F.; Yan, P.; Liu, B.; Zhou, Q.; Min, F.; He, F.; Wu, Z. Investigation on the adsorption of phosphorus in all fractions from sediment by modified maifanite. Sci. Rep. 2018, 8, 1–13. [Google Scholar] [CrossRef] [Green Version]
  79. Jung, H.B.; Xu, H.; Konishi, H.; Roden, E.E. Role of nano-goethite in controlling U(VI) sorption-desorption in subsurface soil. J. Geochem. Explor. 2016, 169, 80–88. [Google Scholar] [CrossRef] [Green Version]
  80. Elkhatib, E.; Moharem, M.; Mahdy, A.; Mesalem, M. Sorption, Release and Forms of Mercury in Contaminated Soils Stabilized with Water Treatment Residual Nanoparticles. Land Degrad. Dev. 2017, 28, 752–761. [Google Scholar] [CrossRef]
Figure 1. SEM analysis to soil with (a) total organic matter (T-OM) and (b) partial removal of organic matter (R-OM) and confocal images to soil with (c) T-OM and (d) R-OM.
Minerals 11 00373 g001
Figure 2. Initial pH effect of the solution on the adsorption of H2PO4 in the presence of Cu0 ENPs on soil with (a) total organic matter (T-OM) and (b) partial removal of organic matter (R-OM) and Ag0 ENPs on soil with (c) T-OM and (d) R-OM.
Minerals 11 00373 g002
Figure 3. Phosphate adsorption kinetics at pH 5.5 ± 0.2 of the solution in the presence of Cu0 ENPs on soil with (a) total organic matter (T-OM) and (b) partial removal of organic matter (R-OM) and Ag0 ENPs on soil with (c) T-OM and (d) R-OM modelled by the Elovich model.
Minerals 11 00373 g003
Figure 4. Phosphate adsorption isotherms at pH 5.5 ± 0.2 of the solutions in the presence of Cu0 ENPs on soil with (a) total organic matter (T-OM) and (b) partial removal of organic matter (R-OM) and Ag0 ENPs on soil with (c) T-OM and (d) R-OM modelled by the Langmuir and Freundlich models.
Minerals 11 00373 g004
Table 1. The kinetic models used for the description of phosphate adsorption.
Kinetic EquationsExpression FormulaParametersReferences
Pseudo-first-order (PFO) q t = q e ( 1 e k 1   t ) qt = amount of anion adsorbed at any time (mmol·kg−1).
qe = amount of anion adsorbed at equilibrium (mmol·kg−1).
k1 = PFO rate constant (min−1).
k2 = PSO rate constant (kg·mmol−1·min−1).
t = time (min)
[35,36]
Pseudo-second-order (PSO) * q t = k 2 q e 2 t 1 + k 2 q e t
Elovich q t = 1 β ln   ( 1 + α β t ) α = initial rate constant (mmol·kg·min−1).
β = number of sites available for the sorption and desorption constant (mmol·kg−1).
* From PSO initial adsorption rate (h), can be calculated by multiplying k2 q t 2 (mmol·kg−1·min−1).
Table 2. The isotherm models used for the description of phosphate adsorption.
Isotherm EquationsExpression FormulaParametersReferences
Langmuir q e = q m K L C e 1 + K L C e qe = amount of adsorbed anion per unit mass of the adsorbent at equilibrium (mmol·kg−1).
qmax = maximum adsorption capacity (mmol·kg−1).
Ce = concentration of anion at equilibrium in the solution (mmol·L−1).
KL = constant related to the affinity (L·mmol−1).
KF = freundlich adsorption coefficient ((mmol·kg−1) (L·kg−1)1/n).
n = adsorption intensity (1 < n < 10).
[34,37]
Freundlich q e = K F C e 1 n
Table 3. Physico-chemical properties of soil with total organic matter (T-OM) and with partial removal of matter (R-OM).
ParameterT-OMR-OM
pH (H2O)5.4 ± 0.06.2 ± 0.0
Total P (mg·kg−1)1766.4 ± 27.0996.6 ± 15.0
Si (%)15.9 ± 3.516.3 ± 2.9
Al (%)11.7 ± 1.114.1 ± 1.5
Fe (%)7.5 ± 0.610.5 ± 1.2
OM (%)14.1 ± 0.14.6 ± 0.1
ECEC (cmol(+) kg−1) *8.8 ± 0.57.8 ± 0.0
Isoelectric point3.25.7
BET- specific surface area (m2·g−1)17.424.4
Average pore volume (cm3·g−1)0.0020.023
Average pore diameter (A)10.710.4
* ECEC: Effective cation exchange capacity.
Table 4. pH changes associated to H2PO4 adsorption in the absence and presence of different doses of Cu0 or Ag0 ENPs and two levels of soil organic matter content (total organic matter, T-OM and partial removal of organic matter, R-OM). Experimental conditions: 6.47 mmol·L−1 H2PO4 solution at pH 5.5, 0.01 M KCl at 20 ± 2 °C. Initial pH (pHi) and final pH (pHf) were measured after H2PO4 solution added to soil samples (time 0 min) and after H2PO4 adsorption (1440 min), respectively.
Cu0 ENPsAg0 ENPs
0%1%3%5%1%3%5%
pHipHfpHipHfpHipHfpHipHfpHipHfpHipHfpHipHf
T-OM5.4 ± 0.15.7 ± 0.05.0 ± 0.15.4 ± 0.04.3 ± 0.14.7 ± 0.04.0 ± 0.04.2 ± 0.05.0 ± 0.15.6 ± 0.24.5 ± 0.14.9 ± 0.04.2 ± 0.14.7 ± 0.0
R-OM5.2 ± 0.05.6 ± 0.14.7 ± 0.15.3 ± 0.14.2 ± 0.04.4 ± 0.03.8 ± 0.03.9 ± 0.04.6 ± 0.15.0 ± 0.14.2 ± 0.04.4 ± 0.03.9 ± 0.04.0 ± 0.0
Table 5. Pseudo-second-order and Elovich parameters (± standard error) obtained from H2PO4 adsorption kinetics at pH 5.5 ± 0.2 for the soil with total organic matter (T-OM) and with partial removal of organic matter (R-OM) in the absence and presence of different doses of Cu0 or Ag0 ENPs.
Pseudo-Second-OrderElovich
ENPs
Doses (%)
qe,exp
(mmol·kg−1)
qe,cal
(mmol·kg−1)
k2
(×10−4 kg·mmol−1·
min−1)
h
(mmol·kg−1·min−1)
r2χ2α (×103 mmol·kg−1·min−1)β (×10−2 kg·mmol−1)r2χ2
T-OM0177.9 ± 2.4164.3 ± 5.116.6 ± 1.945.6 ± 0.00.9401571.9 ± 0.36.4 ± 0.40.98540
R-OM200.4 ± 4.2174.4 ± 6.116.9 ± 2.550.5 ± 0.00.9242262.0 ± 0.35.9 ± 0.30.99321
Cu0
T-OM1203.1 ± 5.1177.4 ± 6.814.0 ± 4.044.0 ± 0.00.9152711.0 ± 0.25.4 ± 0.30.98643
R-OM227.1 ± 2.8206.5 ± 4.510.9 ± 1.746.5 ± 0.00.9731141.3 ± 0.44.8 ± 0.40.972118
T-OM3234.2 ± 3.9202.4 ± 8.414.0 ± 4.457.4 ± 0.00.9004301.7 ± 0.44.9 ± 0.30.98945
R-OM234.5 ± 1.5221.4 ± 3.526.4 ± 4.0129.4 ± 0.00.98086590.5 ± 15.27.3 ± 0.50.970123
T-OM5251.1 ± 7.2214.9 ± 9.09.4 ± 2.843.4 ± 0.00.9104540.7 ± 0.14.2 ± 0.00.9989
R-OM244.0 ± 4.3232.9 ± 4.528.8 ± 5.6156.2 ± 0.00.9701391518.7 ± 101.67.4 ± 0.80.98091
Ag0
T-OM1220.9 ± 4.8183.4 ± 6.59.0 ± 3.530.1 ± 0.00.9412800.4 ± 0.14.6 ± 0.20.98843
R-OM215.9 ± 6.0185.8 ± 7.78.1 ± 2.328.1 ± 0.00.9333060.3 ± 0.24.6 ± 0.50.927279
T-OM3228.1 ± 4.1201.7 ± 7.913.6 ± 4.055.3 ± 0.00.9273731.7 ± 0.35.0. ± 0.20.99521
R-OM224.0 ± 5.2187.9 ± 8.77.9 ± 2.527.9 ± 0.00.9053860.2 ± 0.14.2 ± 0.30.968132
T-OM5239.6 ± 3.6213.2 ± 5.618.1 ± 3.982.3 ± 0.00.95218611.2 ± 1.06.6 ± 0.40.974112
R-OM232.0 ± 4.5194.2 ± 8.813.7 ± 4.751.7 ± 0.00.9422631.1 ± 0.24.9 ± 0.40.97984
Table 6. Langmuir and Freundlich parameters (± standard error) obtained from H2PO4 adsorption isotherms at pH 5.5 ± 0.2 and desorption (%) for the soil with total organic matter (T-OM) and with partial removal of organic matter (R-OM) in the absence and presence of different doses of Cu0 or Ag0 ENPs.
LangmuirFreundlichDesorption
ENPs Doses (%)qe,exp
(mmol·kg−1)
KL (L·mmol−1)qmax
(mmol·kg−1)
r2χ2KF ((mmol·kg−1) (L·kg−1)1/n)nr2χ2(%)
T-OM0213.6 ± 0.63.6 ± 1.5216.1 ± 20.00.934396143.5 ± 5.03.4 ± 0.30.98211131.6
R-OM 256.4 ± 1.420.1 ± 7.3224.7 ± 15.60.944437181.0 ± 9.03.6 ± 0.40.9612999.7
Cu0
T-OM1225.0 ± 1.17.8 ± 3.2216.2 ± 16.60.943388152.1 ± 10.63.0 ± 0.40.92848824.0
R-OM 301.0 ± 0.77.3 ± 2.8280.4 ± 23.20.942600216.3 ± 10.22.6 ± 0.20.9663529.5
T-OM3262.0 ± 0.27.2 ± 1.6255.4 ± 14.30.968274175.0 ± 13.62.6 ± 0.30.92373810.7
R-OM 318.4 ± 1.43.6 ± 0.8382.7 ± 31.50.963434266.8 ± 25.81.9 ± 0.30.87015506.4
T-OM5299.2 ± 0.55.4 ± 1.5316.4 ± 26.10.945604216.0 ± 22.02.3 ± 0.40.85415909.5
R-OM 343.3 ± 2.43.0 ± 0.9440.2 ± 55.30.9261000298.2 ± 33.51.9 ± 0.30.83622084.5
Ag0
T-OM1213.8 ± 3.08.1 ± 2.7200.5 ± 13.30.953290143.4 ± 7.03.3 ± 0.30.96421931.5
R-OM 261.3 ± 0.35.2 ± 0.8264.0 ± 11.40.982151171.3 ± 13.32.5 ± 0.30.92172416.8
T-OM3236.2 ± 1.93.2 ± 0.8249.9 ± 19.20.948361139.9 ± 14.22.3 ± 0.40.87094629.4
R-OM 292.7 ± 2.17.3 ± 1.5281.4 ± 15.50.970302202.9 ± 13.02.5 ± 0.30.94060421.0
T-OM5284.1 ± 2.82.2 ± 0.6332.8 ± 30.80.951500178.6 ± 18.12.0. ± 0.30.871132722.2
R-OM 297.5 ± 1.44.7 ± 1.2301.4 ± 21.40.958434201.5 ± 15.62.2 ± 0.30.92488122.1
Publisher’s Note: MDPI stays neutral with regard to jurisdictional claims in published maps and institutional affiliations.

