Article

Paleogeographic Characteristics of the Mengyejing Formation in the Simao Basin during Its Depositional Period and Its Indication of Potash Mineralization: A Case Study of MZK-3 Well

1
School of Earth Sciences and Resources, China University of Geosciences, Beijing 100083, China
2
MNR Key Laboratory of Saline Lake Resources and Environments, Institute of Mineral Resources, Chinese Academy of Geological Sciences, Beijing 100037, China
*
Author to whom correspondence should be addressed.
Minerals 2021, 11(4), 338; https://doi.org/10.3390/min11040338
Submission received: 15 February 2021 / Revised: 20 March 2021 / Accepted: 22 March 2021 / Published: 24 March 2021
(This article belongs to the Special Issue Mineralogy, Petrology and Geochemistry of Evaporites)

Abstract

:
In China, pre-Quaternary solid potash deposit has only been discovered in the Simao Basin, and the Lower Cretaceous Mengyejing (MYJ) Formation (Fm.) is the productive layer of potash deposit. In this study, we investigated the clay conglomerates which are distributed in upper and lower members of the potash-bearing salt rock layer. We analyzed the relative contents of major elements (Al2O3, Fe2 O 3 T , MgO, CaO, Na2O, K2O) and trace elements (B, Ba, Co, Cr, Cu, Ga, Mn, Ni, Rb, Sr, V, Zn, Zr) in the samples. The results show that MgO and CaO in the major elements are rich relative to Post Archean Australian Shale (PAAS), whose average enrichment factor values of the MgO (EFMgO) is 2.61 and CaO (EFCaO) is 4.57, and the others major elements are relatively minor; trace elements (B, Ga, Mn, Zr) are rich relative to PAAS, and the others trace elements are minor relative to PAAS. The study of paleogeographic conditions using various parameters shows that the paleoclimate is generally dry and hot during the period of clay conglomerate deposition, but it was warm and humid in certain periods; the main sedimentary environment is weak oxidation condition with strong oxidation conditions in individual periods; the average value of paleosalinity is ~21‰, and the highest is no more than ~92‰. The significance of the paleogeographic characteristics of MYJ Fm. to potash mineralization are as follows: (1) they indicates that the clay conglomerates of MYJ Fm. are not clastic sediments in brine formed by seawater, because the paleosalinity of clay conglomerates deposition period is obviously lower than that of seawater; (2) MYJ potassic salt ore is not formed by evaporation and concentration of seawater in clay conglomerates in the sedimentary basin, because there is no carbonate rock and sulfate rock of corresponding scale after the deposition of clay conglomerates in the basin; (3) clay conglomerates of MYJ Fm. were deposited in continental shallow water basin; (4) the matter source of potash minerals is deep marine strata; (5) in the MYJ Fm. sedimentation period, deep source salt moved to the surface under the background of extensional structure, and the subsequent sedimentary clastic rock formed a protective layer of potash-bearing rock, thus completing the “deep source and shallow mineralization” metallogenic process.

1. Introduction

There are a lot of evaporites in the Tethys domain. Potash deposits have been discovered in the Maha Sarakham Fm. in the Khorat Basin and the Mengyejing (MYJ) Formation (Fm.) in the Simao Basin, all in the east of Tethys. The surrounding rocks of the potash deposits in the Simao Basin are clay conglomerates, and the corresponding scale of carbonate and sulfate deposits are lacking. According to the difference in mineral composition, clay conglomerates can be further divided into silty clay conglomerates, lime clay conglomerates, gypsum clay conglomerates, and salt-soluble clay conglomerates. Previous studies on clay conglomerates have mainly focused on provenance and paleoclimate during deposition [1,2,3]. However, there are few reports on paleosalinity and redox conditions in the sedimentary environment, and there is still space for further discussion on paleoclimate. In this paper, emission spectra, X-ray fluorescence spectra, and plasma mass spectra in addition to chemical analysis and other data for this research were collected and used to thoroughly analyze the geochemical characteristics of main elements, trace elements, and clay minerals of the MYJ Fm. in MZK-3 and discuss paleogeographic characteristics such as paleoclimate, redox conditions, and paleosalinity of the clay conglomerates’ sedimentary period. It is hoped that it can provide useful reference for understanding the genesis of potash deposits.

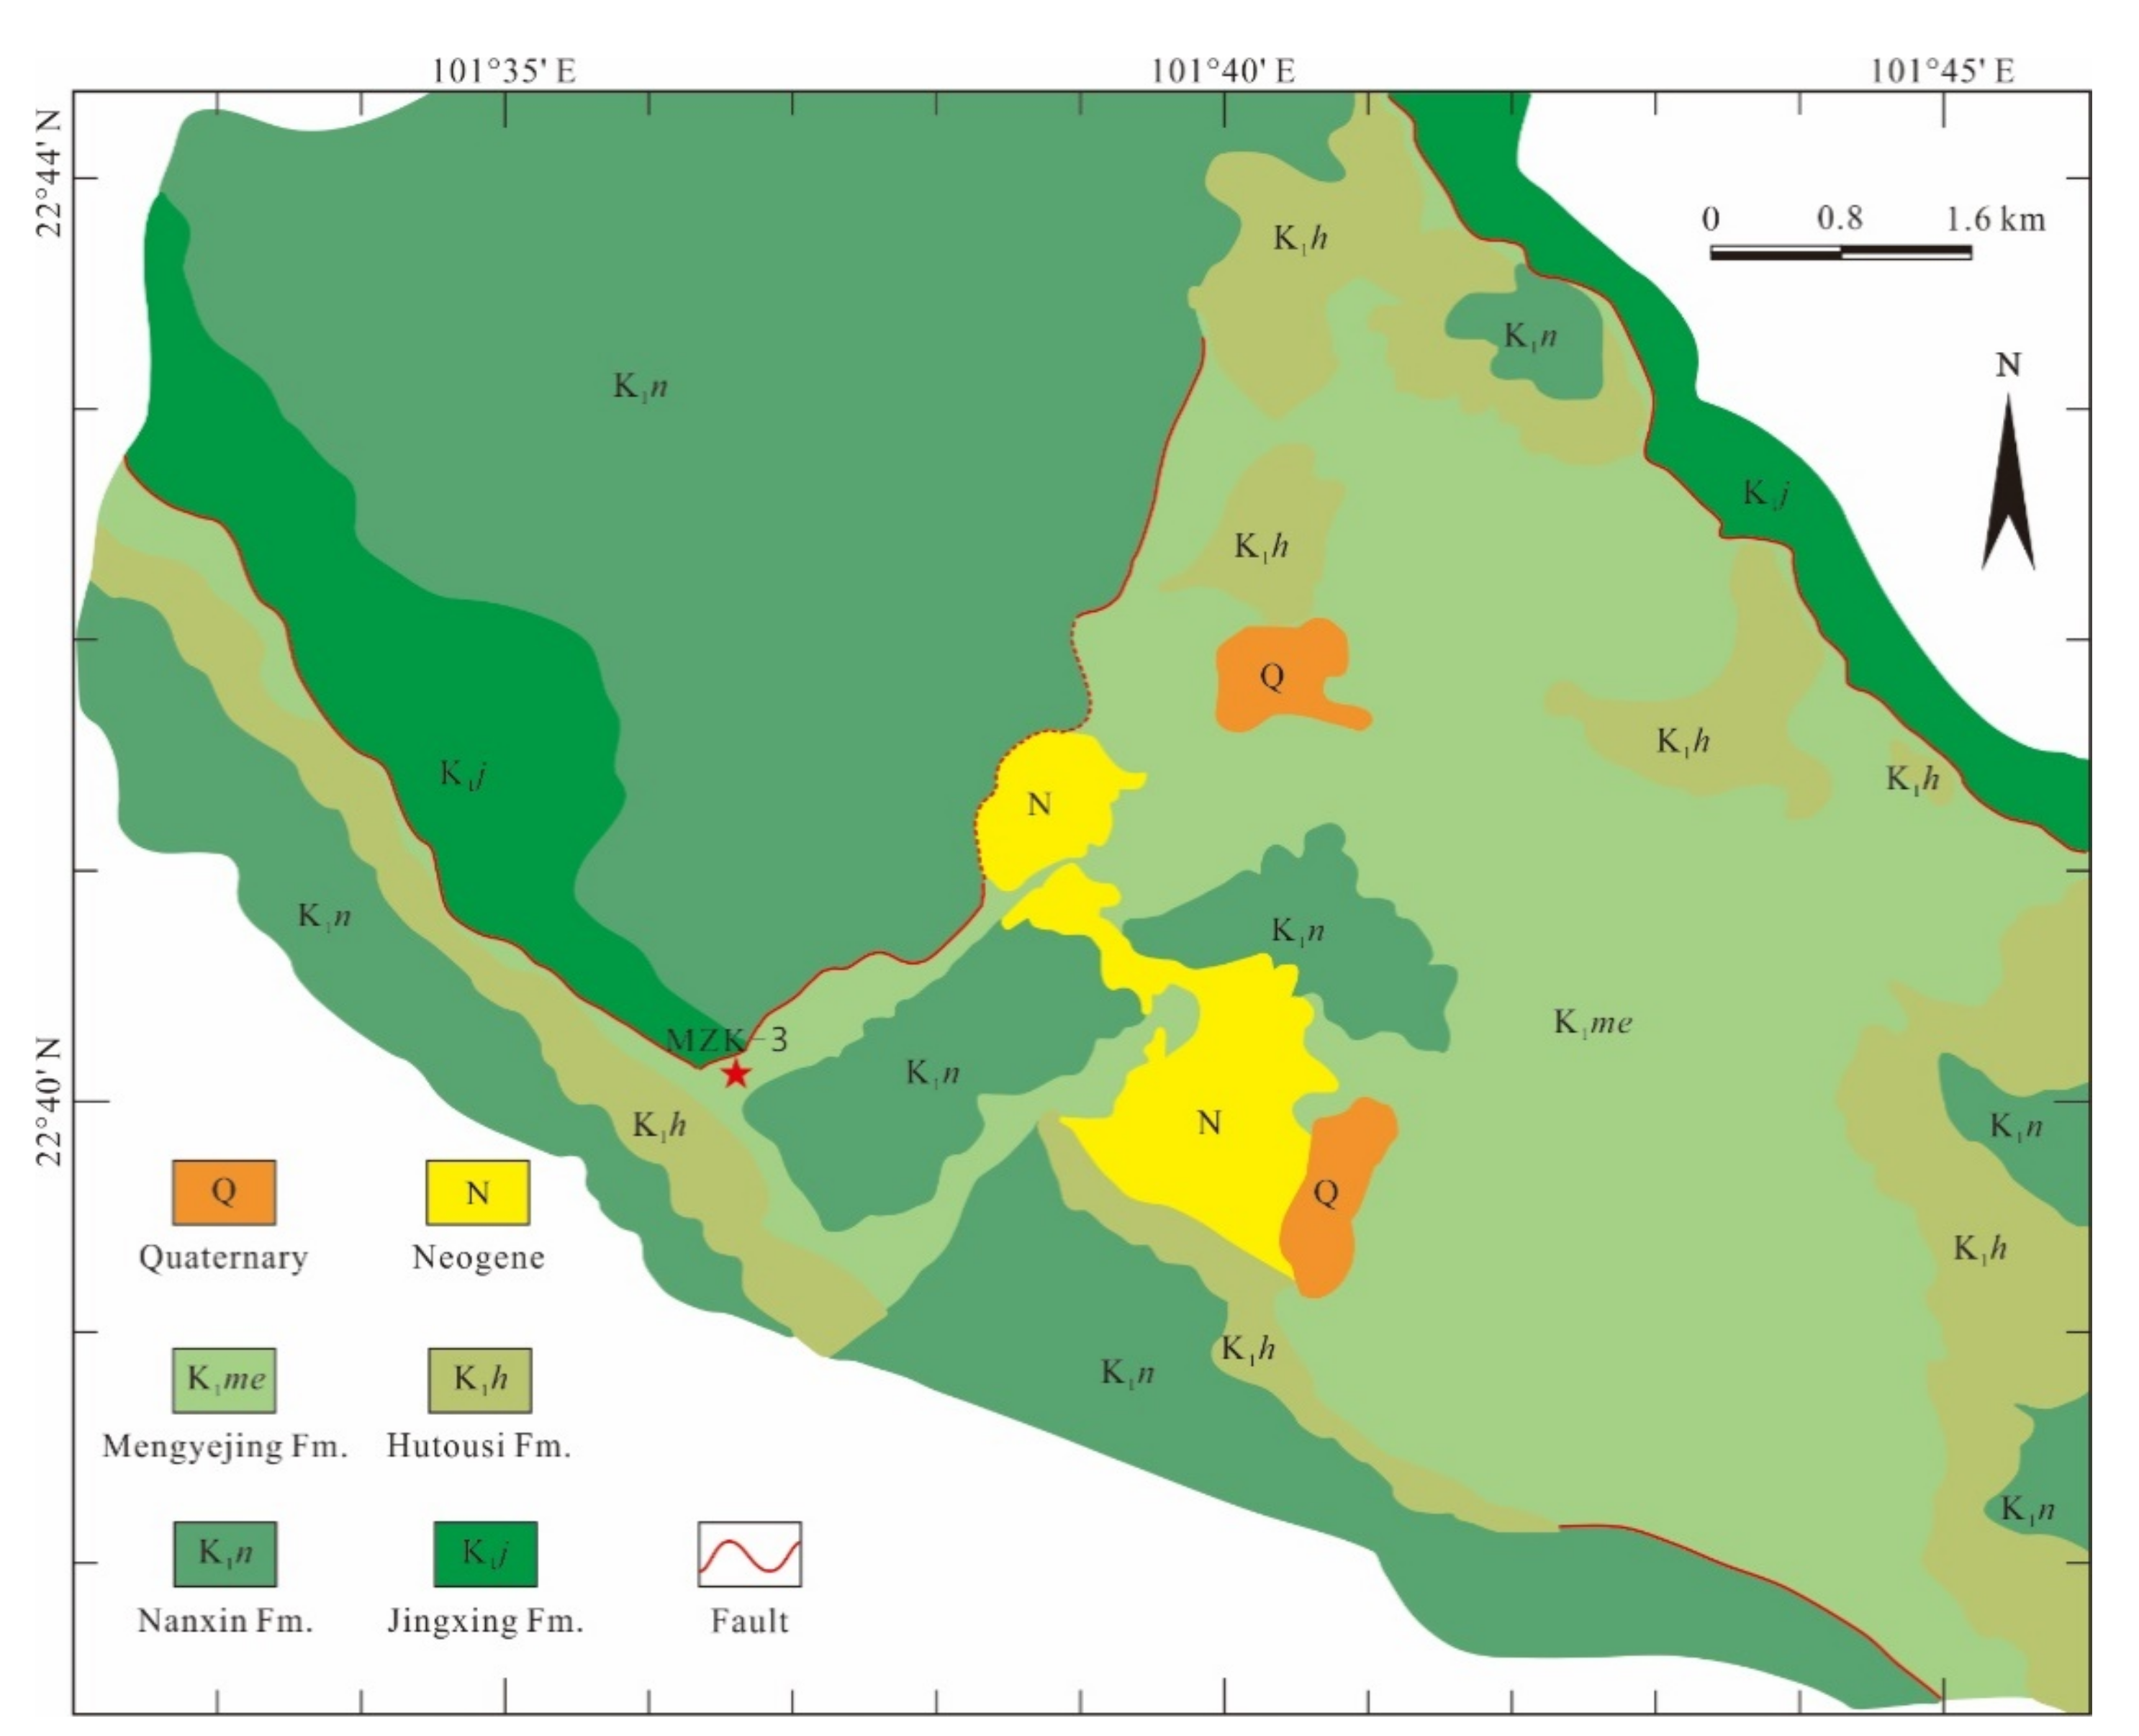
2. Geological Setting

The Simao block is located in the north of Indo-China block, bounded by the Jinshajiang-Ailaoshan suture to the east and the Jinghong suture zone to the west [4,5,6] (Figure 1). Paleomagnetic data show that Simao block was located in the southern hemisphere before the Carboniferous period and gradually migrated to the present position in the northern hemisphere with the evolution of Tethys [7,8].
Since the Cenozoic Era, due to the collision between India plate and Eurasia plate, strike-slip and thrust-nappe structures occurred in Simao block and Indo-China block together [9]. They also rotated clockwise relative to the modern magnetic field, and the strike rotated clockwise from nearly EW to NNW [8,10].
Simao Basin is the main geological unit in Simao block. The East and West boundaries of Simao Basin are Jinshajiang-Ailaoshan fault zone and Lancangjiang fault zone, respectively. The main direction of strata and faults are NW-SE [11,12,13]. Influenced by the closure of Paleo-Tethys, Simao Basin belongs to retro-arc foreland basin in Triassic [14]; due to collision between Indian plate and Eurasian plate, it belongs to strike-slip and pull-apart basin in Cenozoic [12,13]; Jurassic-Cretaceous belongs to active continental margin rift basin [12,15], and the dynamic mechanism is the strike-slip and pull-apart caused by land and land collision after the closure of the Paleo-Tethys.
The sedimentary basement of Simao Basin is Precambrian–Lower Paleozoic greenschist facies metamorphic complex [16], and the sedimentary caprock are mainly Mesozoic strike-slip and thrust-nappe structures Cenozoic [14,17]. Among them, the Triassic lacks the Lower Triassic, and the Middle-Upper Triassic mainly develops marine clastic rocks and carbonate rocks [11,17], the Lower Jurassic mainly develops tidal flat and lagoon facies fine-grained clastic rocks [11,18], and the Middle Jurassic is characterized by transgressive [13]. The main lithology of the Upper Jurassic is continental red fine clastic rock [11]. The Cretaceous is a set of typical fluvial lacustrine sandstone, shale, and conglomerates [12,17].
MYJ Fm. is developed in the uppermost member of Cretaceous. According to the analysis of sporopollen, the age of MYJ Fm. is Aptian–Albian [19], and the SHRIMP U-Pb ages of the upper interlayer tuff are between 100 and 110 Ma [20]. According to the International Chronostratigraphic Chart of 2020 [21] and the deposition rate of the stratigraphy [20], the ages of MYJ Fm. are in the upper members of Cretaceous, and the sedimentary age is likely to be Aptian–Cenomanian. The clastic rocks of MYJ Fm. were formed in the lake, delta, and alluvial plain environments [11,13]. The textural and composition maturity of clastic rocks are lower, and the bedding is not developed, which reflects the characteristics of high fluid density and viscosity in the sedimentary environment [11].
The studied area is located in the southeast of Simao Basin, near the border of China, Laos, and Vietnam (Figure 2). It is the only pre-Quaternary solid potash deposit in China. The outcrop strata in the mining area from old to new were Cretaceous, Neogenes and Quaternary. The Cretaceous outcropping strata include Jingxing Fm., Nanxin Fm., Houtousi Fm., and MYJ Fm. (Figure 3). The distribution direction of the strata and main faults is consistent with the tectonic setting of Simao Basin, which is all NW-SE direction.

3. Samples and Analytical Methods
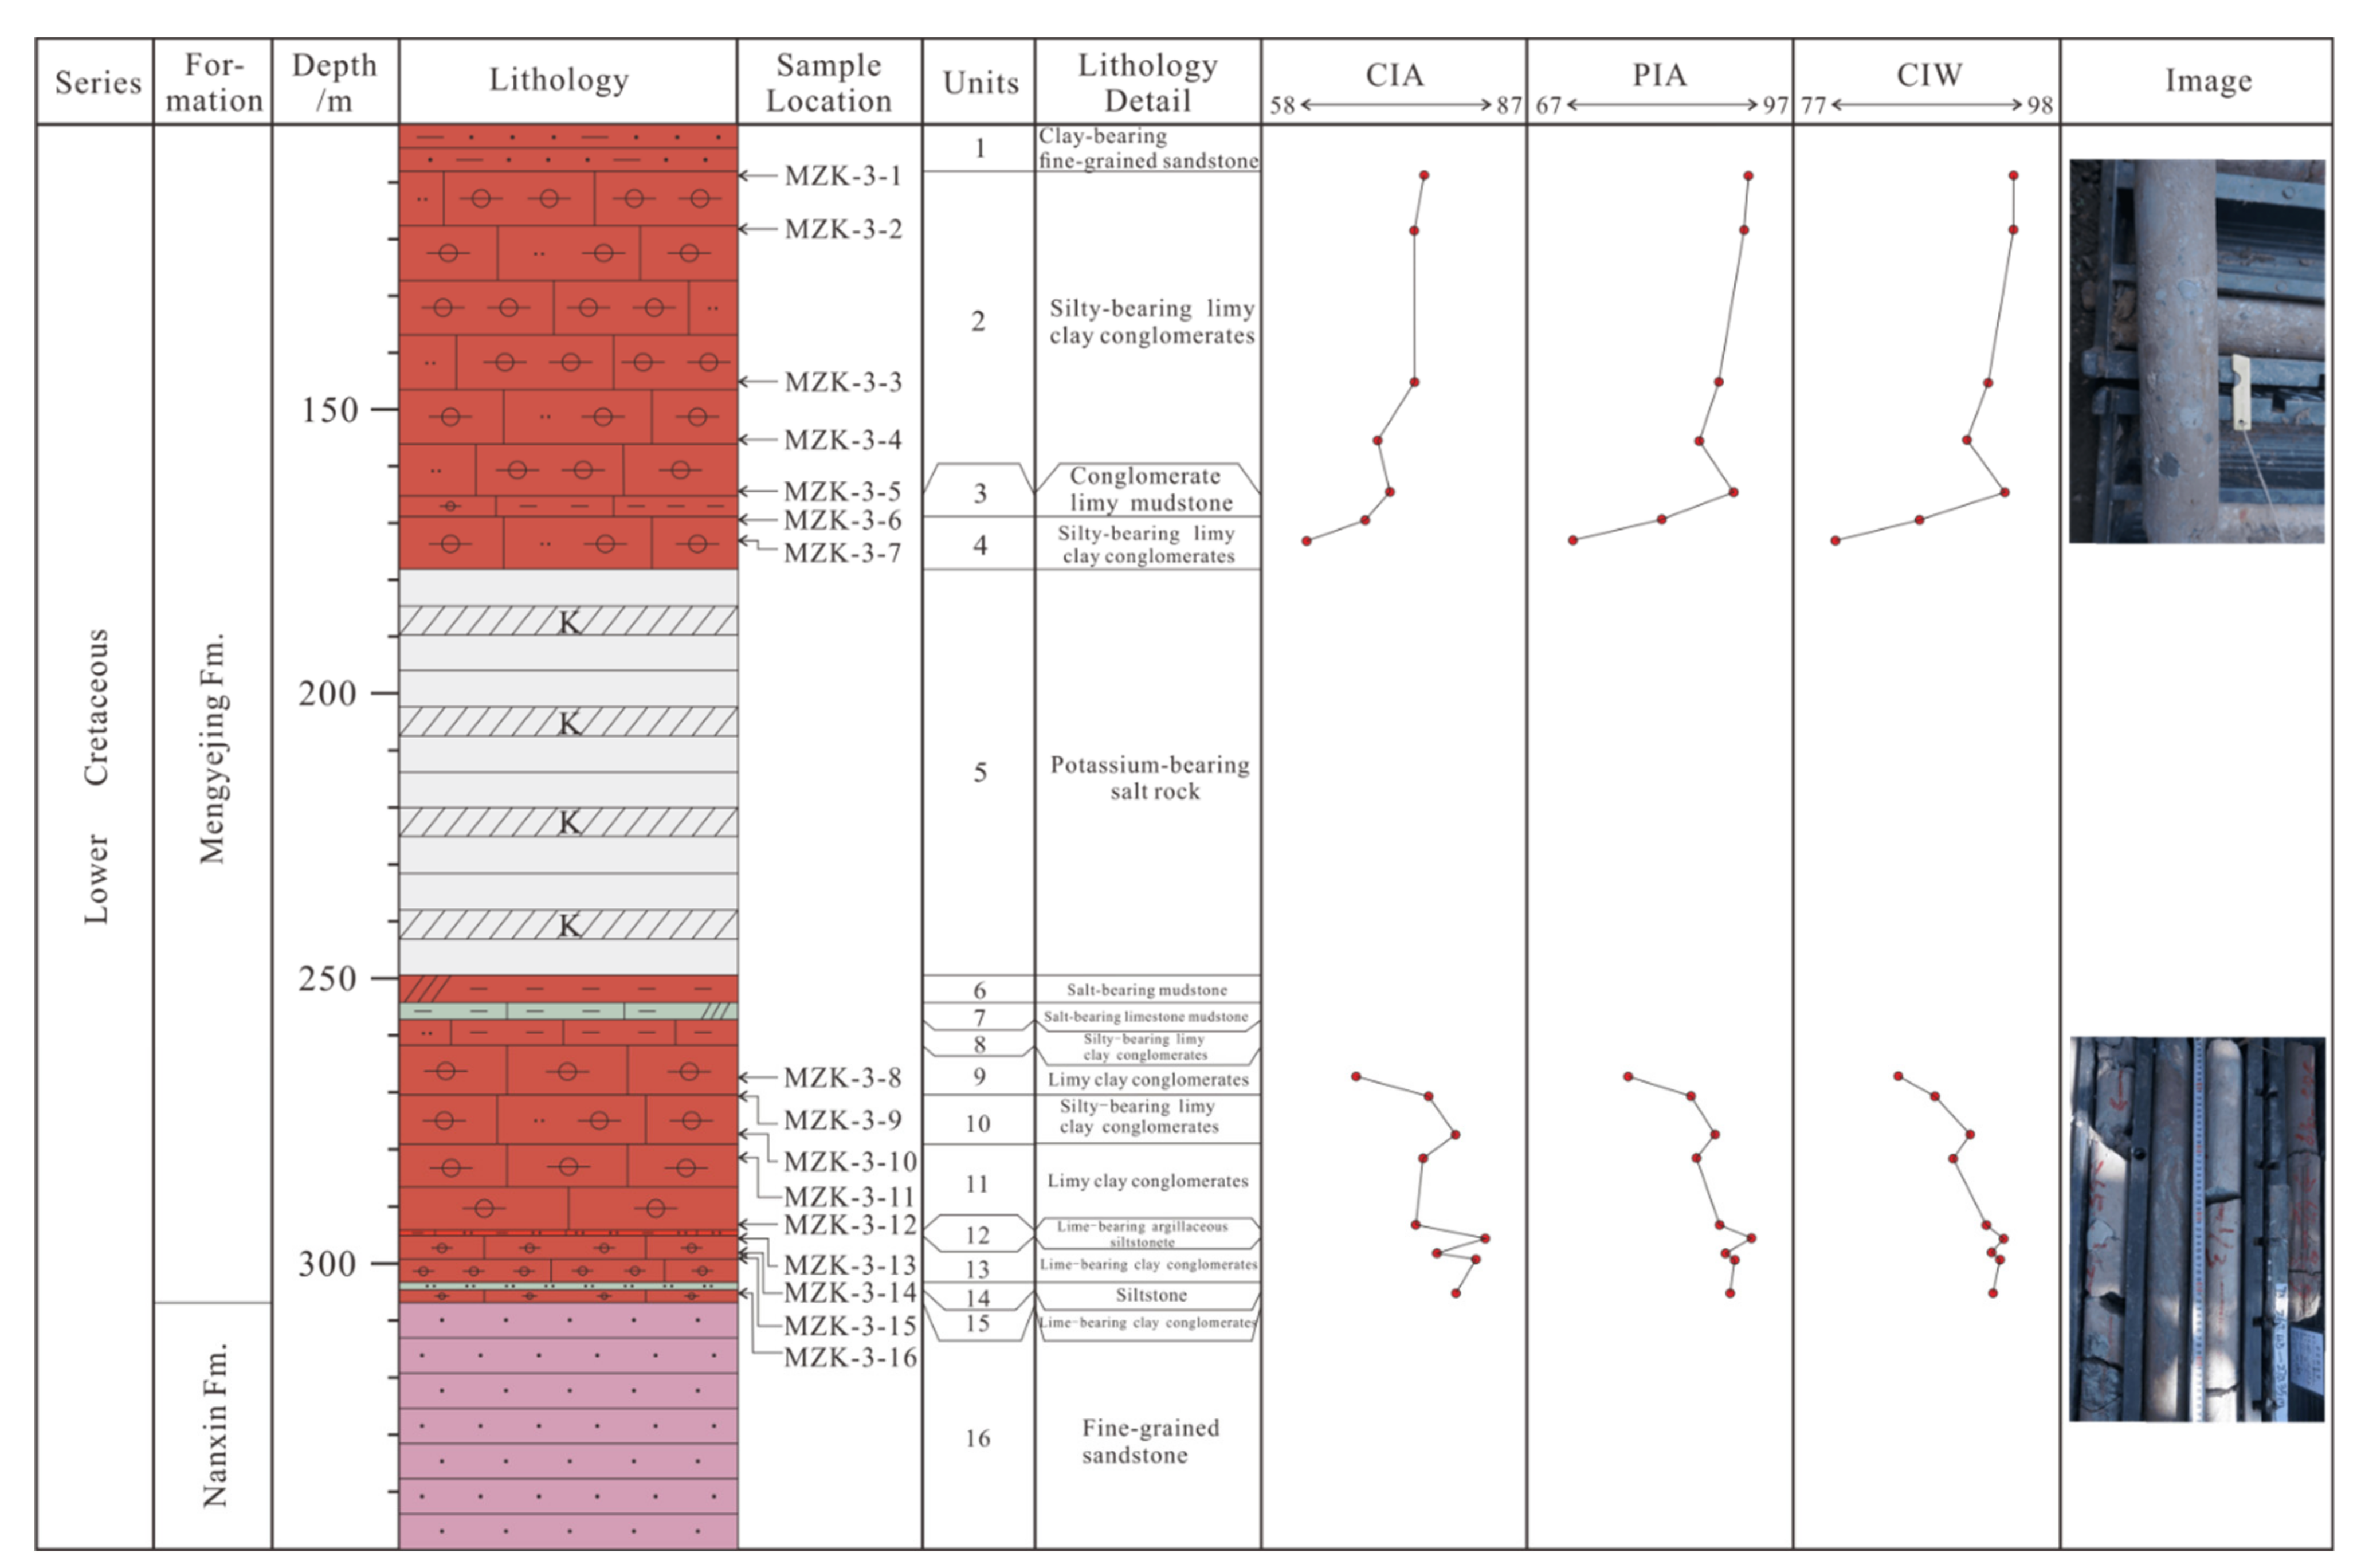
3.1. Samples

Samples are collected from the MZK-3 well (GPS: 22°40′12.00″ N, 101°37′23.80″ E; Figure 3), located in the west of the known potash ore body. MYJ Fm. is developed in the depth of 101.9 to 306.7 m. The main lithology can be divided into three parts: red-brown clay conglomerates (101.9 to 178.1 m); potash-bearing salt rock (178.1 to 249.3 m); and red-brown clay conglomerates (249.3 to 306.7 m) (Figure 4). The main research objects of this paper are the clay conglomerates that are distributed in the upper and lower member of the salt rock (Figure 4).
The gravels of clay conglomerates in the upper member of the salt and the lower member of the salt are poorly sorted, subangular, and subrounded, and the main components are calcareous, argillaceous, and silty. The overall characteristics of petrography show that there is less water supply to the sedimentary environment and evaporation is greater. The genetic type of clay conglomerates may be clastic in the basin. In addition, there are thin layers of grayish-green siltstone and red-brown calcareous argillaceous siltstone between the lower member of salt clay conglomerates, which reflects the sedimentology characteristics of large changes in water supply. Mudstone substrate generally contains a lot of calcareous matter, mainly in the form of fissure or pore filling and well-rounded medium coarse sand grade calcareous clastic particles, and a small amount of fine silty calcareous clastic particles exist in the mudstone matrix (Figure 5). This phenomenon may be caused by the co-deposition of primary carbonate rock with clastic particles after physical weathering and crushing, and the intrusion of carbonate rich hydrothermal solution into the cracks and pores of the clay conglomerates after diagenesis.

3.2. Methods

3.2.1. Boron

We used a planar grating spectrograph (model: WP-1, Beifen-Ruili Company, China) to determine the content of boron. A mixture of sodium fluoride, potassium pyrophosphate, aluminum oxide, carbon powder, and germanium dioxide was selected as buffer, Ge as the internal standard element, and alternating current arc (AC-ARC) as the excitation light source. Two parallel measurements were made by perpendicular electrode emission spectrometry. The average value of the to parallel analysis results was used as the content of B in the samples.

3.2.2. X-ray Fluorescent Spectrometry

The relative contents of Ba, Cr, Mn, Rb, Sr, V, Zr, Al2O3, Fe2 O 3 T , MgO, CaO, Na2O, and K2O in the samples were measured by powder tableting-X-ray fluorescence spectroscopy. The X-ray fluorescence spectrometer model was PW2440 (Philips Company, Netherlands) and empirical coefficients and the internal standard method was used for the correction of matrix effects.

3.2.3. Inductively Coupled Plasma Mass Spectrometry (ICP-MS)

Co, Cu, Ga, Ni, and Zn in the sample was analyzed by using inductively coupled plasma-mass spectrometry (ICP-MS, ThermoFisher Company, Germany) at the Institute of Geophysical and Geochemical Exploration, Chinese Academy of Geological Sciences.
Firstly, special care was taken to avoid sampling bias, several samples of 0.2500 g (accurate to 0.1 mg) of each powder (<74 μm) were taken in a Teflon vessel. Then, mixed acid of HF (~10 mL) at a concentration of 22.5 mol/L, HNO3 (~5 mL) at a concentration of 12 mol/L, and HClO4 (~2 mL) at a concentration of 16.1 mol/L were added and put on the 200 °C electric heating plate for decomposition and steam drying (if the sample is not completely decomposed, acid of HF and HNO3 can be added before drying). Waited for the samples to cooler slightly and then add aqua regia of 8 mL (mixed acid of 250 mL HNO3 and 750 mL HCl, shake well) and then heated it on the electric heating plate until 3 mL to 5 mL of the solution remains. Rinsed the cup with deionized water (~10 mL), and heated for 5 to 10 min until the solution was clear and bright. After cooling, transfered the solution to a polyethylene tube and dilute the solution with water until 25 mL. In the end, Used a pipettor to take 0.5 mL of solution, Rh was added as an internal standard and diluted with acid of HNO3 (3 + 97) to 5 mL, shaken well, and prepared for determination by ICP-MS.
We used model is I-cap-Qc (ThermoFisher Company, Germany). The linearity of trace elements measured in standard samples (GSR-1, GSS-22, GSS-25, GSS-26) and repeated experiments was good, the analysis error was basically less than 5% and rarely more than 10%. The test results of the same samples were consistent, and the test results were accurate and reliable. The final results of each test sample were averaged three times.

3.2.4. Clay Mineral Analysis

Clay minerals were analyzed using oriented sample of clay size fraction <2 μm, which were separated by sedimentation following Stokes’ law. Sample were studied using Panalytical X’Pert PRO X-ray diffractometer (Panalytical Company, The Netherlands). Cu was used as the target material with tube voltage/current at 40 kV and 40 mA. X-ray diffraction traces of oriented sample preparations were scanned between 3° and 30°2θ at a step size of 0.02°2θ. Samples were saturated by ethylene glycol, and heated at 450 °C for 2.5 h.

4. Results

The relative contents of major elements (Al2O3, Fe2 O 3 T , MgO, CaO, Na2O, K2O) and trace elements (B, Ba, Co, Cr, Cu, GA, Mn, Ni, Rb, Sr, V, Zn, Zr) in 16 samples were tested, with the results listed in Table 1 and Table 2, respectively. The relative content of clay minerals in 14 samples were tested, and the results are listed in Table 3.
Taking the content of corresponding elements in PAAS as a reference, if the content of a certain element in the samples is obviously higher than that of PAAS, it indicates that the element is relatively enriched; otherwise, it is relatively deficient. Opal or biogenic carbonate rocks can dilute the enrichment of trace elements. In order to eliminate this effect, enrichment factors (EF) can be used to express the enrichment degree of an element in the sample [23,24,25,26]. In this study, Al was used to standardize other 12 trace elements and 6 major elements except B element. The enrichment factors (EFX) of an element (X) can be expressed as: EFX = (X/Al)sample/(X/Al)PAAS If the enrichment factors EFX of an element X is greater than 1, it indicates that the element is enriched; otherwise, it is deficient.

4.1. Major Elements

The average contents of MgO (5.7 wt%, standard deviation = 3.6 wt%) and CaO (5.9 wt%, standard deviation = 2.5 wt%) in the major elements were higher than PAAS. The enrichment factor of MgO (EFMgO) ranged from 0.90 to 5.95 (average = 2.61, standard deviation = 1.62); EFCaO range from 0.49 to 7.90 (average = 4.57, standard deviation = 1.95).
The average contents of Al2O3 (13.8 wt%, standard deviation = 2.1 wt%), Fe2 O 3 T (5.2 wt%, standard deviation = 1.1 wt%), Na2O (0.4 wt%, standard deviation = 0.3 wt%), and K2O (3.1 wt%, standard deviation = 1.1 wt%) in the main elements are lower than PAAS. The values of EFAl range from 0.48 to 0.90 (average = 0.73, standard deviation = 0.11), EFFe range from 0.48 to 1.02 (average = 0.72, standard deviation = 0.15), EFNa range from 0.09 to 0.90 (average = 0.84, standard deviation = 0.30).
It is worth noting that the relative PAAS enrichment of K2O in the upper member of salt rock layer between 0.98 to 1.27 (average = 1.12, standard deviation = 0.09); the relative PAAS minor in the lower member of salt rock layer between 0.45 to 0.95 (average = 0.62, standard deviation = 0.20).

4.2. Trace Elements

The boron (B) content in the samples range from 43.2 to 253.3 μg/g (average = 115.5 μg/g, standard deviation = 62.4). The average B content in the crust is 35 μg/g for sandstone and the average B content in the crust is 100 μg/g for shale [27]. Compared with this value, the average B content of the sample is relatively higher.
The enrichment factors of the remaining 12 trace elements are shown in Table 4. It can be seen from Table 4 that the average enrichment factors of Ga, Mn, and Zr are higher than 1 and relatively enriched, except for some abnormal high values; the enrichment factors of other elements are less than 1 and are relatively minor. The reason for this phenomenon may be that the amount of quartz and calcite in the sample is higher than PAAS. In addition, except for Rb and Zn, the enrichment factors of the other 10 trace elements in the upper member of the salt rock member are lower than those of the samples under the salt rock member.
Table 1. The major element concentrations of the MYJ Formation (Fm.).
SamplesDepth [m]LithologyMajor Element Concentrations (wt%)CIAPIACIW
Al2O3Fe2 O 3 T MgOCaONa2OK2O
MZK-3-1109.2C. C.13.74.93.87.90.14.1749798
MZK-3-2118.3C. C.13.74.64.35.10.14.3739798
MZK-3-3146.9C. C.14.66.26.47.60.34.0739194
MZK-3-4156.1C. C.14.05.97.88.30.43.9728891
MZK-3-5164.9C. C.14.15.06.26.20.24.4729396
MZK-3-6169.0C. C.14.55.36.64.30.73.6708286
MZK-3-7173.1C. C.12.94.73.78.41.14.7606878
Salt/ /////////
MZK-3-8267.4C. C.12.64.813.10.60.93.5667783
MZK-3-9270.5C. C.14.44.311.74.00.61.9788688
MZK-3-10277.3C. C.13.83.511.27.30.41.8819091
MZK-3-11281.4C. C.9.03.82.77.30.31.9758890
MZK-3-12293.1C. C.13.57.43.67.20.33.4749193
MZK-3-13295.6C. C.16.35.92.02.80.21.7879696
MZK-3-14298.1C. C.10.24.03.710.30.22.0789294
MZK-3-15299.1C. C.17.06.52.43.00.32.0849495
MZK-3-16305.2C. C.16.56.12.54.70.32.3839394
Notes: C.C., clay conglomerates; Fe2 O 3 T , Total iron content; CIA = [Al2O3/(Al2O3 + CaO* + Na2O + K2O)] × 100 [28]; PIA = [(Al2O3 − K2O)/(Al2O3 + CaO* + Na2O − K2O)] × 100 [29]; CIW = [Al2O3/(Al2O3 + CaO* + Na2O)] × 100 [30] where CaO* is the amount of CaO incorporated in the silicate fraction of the rock. CaO* can be calculated according to the molar ratio of CaO/Na2O in the sediment sample. If the ratio is >1, the molar content of Na2O is used to replace the CaO* content. If the ratio is <1, CaO* is calculated directly by the molar content of CaO [31]. All these indices are molecular proportions.
Table 2. The trace element concentrations of the MYJ Fm.
NumbersDepth [m]LithologyTrace Element Concentrations [μg/g]
BBaCoCrCuGaMnNiRbSrVZnZr
MZK-3-1109.2C. C.86.7371.112.874.013.015.0765.529.3113.073.192.441.5189.1
MZK-3-2118.3C. C.140.8357.513.670.163.615.4680.028.0114.982.384.944.6189.2
MZK-3-3146.9C. C.69.0278.116.873.314.114.3609.734.6122.492.594.7102.3135.1
MZK-3-4156.1C. C.67.3239.119.167.020.916.5703.235.4121.699.893.378.1117.9
MZK-3-5164.9C. C.72.6248.59.565.37.516.8643.730.4117.445.490.957.7177.2
MZK-3-6169.0C. C.195.9224.911.269.44.716.2284.135.5106.9144.895.770.6193.5
MZK-3-7173.1C. C.72.9271.512.264.014.215.8513.430.8104.063.478.257.2158.2
Salt///////////////
MZK-3-8267.4C. C.105.3196.012.273.05.614.9410.733.392.730.985.941.2149.9
MZK-3-9270.5C. C.235.6200.49.171.213.216.4243.446.261.791.489.343.8184.0
MZK-3-10277.3C. C.253.3205.115.273.622.616.2378.036.560.01102.9105.245.9166.6
MZK-3-11281.4C. C.81.65216.68.268.612.310.6752.020.371.4131.291.536.4262.6
MZK-3-12293.1C. C.144.6256.228.873.67.414.3515.263.6101.176.997.586.1174.6
MZK-3-13295.6C. C.88.0340.115.395.838.618.4701.338.385.1284.0117.838.9229.1
MZK-3-14298.1C. C.43.2489.913.964.317.111.6858.622.771.861.778.746.2224.0
MZK-3-15299.1C. C.100.4334.417.499.851.919.6924.045.296.1254.8128.246.9172.9
MZK-3-16305.2C. C.90.3871.916.095.524.618.4933.939.4105.8240.3124.446.1189.3
Post Archean Australian Shale (PAAS)/6502311050208505516020015085210
Chondrite6.251300660025012740040,000520200130037
Chondrite data according to Brownlow [32].

4.3. Clay Mineral

Clay mineral analysis results show that 14 samples contain illite, most of them contain kaolinite and some contain a small amount of chlorite (Table 3). Among them, illite and chlorite are the main clay mineral assemblages in the upper member of the salt rock, while illite and kaolinite are the main clay mineral assemblages in the lower member of the salt rock. This combination of clay minerals is also reflected in the relative content of K2O (The enrichment coefficient of the samples in the upper member of the salt layer is greater than 1, and that of the sample in the lower member the salt rock layer is less than 1).
Table 3. The clay minerals content of the MYJ Fm.
SamplesDepth [m]Results/wt%RML/S%
IlliteKaoliniteChloriteI/SC/S
MZK-3-2118.31733816/
MZK-3-3146.8884358/
MZK-3-4156.08801613/
MZK-3-6168.95766126/
MZK-3-7173.05745912/
Salt//////
MZK-3-8267.356406273
MZK-3-9270.53215261116
MZK-3-10277.3560440/
MZK-3-11281.43781264/
MZK-3-12293.057612/12/
MZK-3-13298.055932/9/
MZK-3-14295.65341/6/
MZK-3-15299.054352/5/
MZK-3-16305.154440/16/
Note: I/S, illite and montmorillonite mixed-layer; C/S, chlorite and montmorillonite mixed-layer; RML, ratio of mixed-layer.
Table 4. The enrichment factors of trace element of the MYJ Fm.
SamplesDepth [m]EF (Enrichment Factors)
BaCoCrCuGaMnNiRbSrVZnZr
MZK-3-1109.20.80.80.90.41.01.20.71.00.50.90.71.2
MZK-3-2118.30.80.80.91.81.11.10.71.00.60.80.71.2
MZK-3-3146.90.60.90.90.40.90.90.81.00.60.81.60.8
MZK-3-4156.10.51.10.80.61.11.10.91.00.70.81.20.8
MZK-3-5164.90.50.50.80.21.11.00.71.00.30.80.91.1
MZK-3-6169.00.40.60.80.11.10.40.80.90.90.81.11.2
MZK-3-7173.10.60.80.90.41.20.90.81.00.50.81.01.1
Salt/////////////
MZK-3-8267.40.50.81.00.21.10.70.90.90.20.90.71.1
MZK-3-9270.50.40.50.90.31.10.41.10.50.60.80.71.2
MZK-3-10277.30.40.90.90.61.10.60.90.57.61.00.71.1
MZK-3-11281.416.80.71.30.51.11.90.80.91.41.30.92.6
MZK-3-12293.10.61.80.90.21.00.81.60.90.50.91.41.2
MZK-3-13295.60.60.81.00.91.11.00.80.61.60.90.51.3
MZK-3-14298.11.41.11.10.61.11.90.80.80.61.01.02.0
MZK-3-15299.10.60.81.01.21.11.20.90.71.40.90.60.9
MZK-3-16305.21.50.81.00.61.11.30.80.81.40.90.61.0
Average/1.70.90.90.61.11.030.90.81.20.90.91.2

5. Discussion

5.1. Paleoclimate of MYJ Fm. in Sedimentary Period

In the late Cretaceous, the Simao Basin was located between 21.2 and 28.8° [7]. The paleoclimate in this latitudinal zone was dominated by hot and dry [33], with development of evaporites and calcareous breccia (Figure 6). Under such climate, the weathering degree of parent rock is relatively moderate, and calcium oxide and sodium oxide are leached to a certain extent, which will lead to higher values of chemical index of alteration (CIA), plagioclase index of alteration (PIA), and chemical index of weathering (CIW) [28,30,34].
Generally, the CIA values for basaltic parent rock not affected by weathering range from 30 to 45, those of granitic parent rock range from 45 to 55, and those of strongly weathered samples are close to 100 [28]; the PIA value of parent rock not affected by weathering is generally 50, and that of strongly weathered sample is close to 100 [29]; the CIW values of parent rocks not affected by weathering are usually range from 32 to 76, and those of strongly weathered samples are close to 100 [30].
The CIA index of clay conglomerates in MYJ Fm. of MZK-3 well ranges from 60 to 87 (average = 75, standard deviation = 7); the PIA index ranges from 68 to 97 (average = 89, standard deviation = 8); and the CIW index ranges from 78 to 98 (average = 92, standard deviation = 5) (Table 1). The calculated results are in accordance with the weathering strength of MYJ Fm. sandstone obtained by Wang [35] and have reliable reference value. These parameters reflect that Na, K, and Ca in silicate minerals leach more from the parent rock, indicating slight to moderate chemical weathering at the source area and, consequently, may reflect the hot and dry paleoclimatic conditions.
The three indexes of upper member of salt and lower member of salt clay conglomerates are different. Among them, the average values of CIA, PIA, and CIW of upper member of salt clay conglomerates are 71 (standard deviation = 5), 88 (standard deviation = 10), and 92 (standard deviation = 7), respectively, while those of lower member of salt clay conglomerates are 79 (standard deviation = 6), 90 (standard deviation = 6), and 92 (standard deviation = 4), respectively, reflecting the feature that the weathering degree of upper member is weaker than that of lower member. It indirectly reflects that the drought degree of the upper paleoclimate is stronger than that of the lower member, and the leaching of Ca and Na is relatively weak.
Illite and illite/montmorillonite in clay minerals represent arid and semi-arid climatic conditions, while kaolinite represents humid climate with higher weathering degree [36,37].
The content of illite in MYJ Fm. ranges from 32.0% to 84.0% (average = 63.7%, standard deviation = 16.2), while the content of illite/montmorillonite mixed-layer ranges from 0.0% to 27.0% (average = 10.4%, standard deviation = 6.7) (Table 3). The content of illite and illite/montmorillonite is dominant, which reflects a kind of arid paleoclimatic condition. Among them, the content of illite and illite/montmorillonite in upper salt clay conglomerates is relatively high, ranging from 82.0% to 93.0% (average = 88.4%, standard deviation = 4.5); the content of illite and illite/montmorillonite in lower salt clay conglomerates vary greatly, but the content increases from deep to shallow, reflecting the gradual increase of drought degree of paleoclimatic conditions (Figure 7). The content of kaolinite in the samples decreased gradually with the increase in drought degree (Figure 7).
The relative contents of some trace elements can also be used to analyze paleoclimate. Generally, Ga/Rb ratio values are relatively lower in arid climate conditions [38,39]; Sr/Cu > 5.0 in dry and hot climate, and 1.3 to 5.0 in warm and humid climate [40,41,42].
The ratio values of Ga/Rb range from 0.12 to 0.27 (average = 0.17, standard deviation = 0.05), and ratio values of Sr/Cu range from 1.29 to 48.89 (average = 10.46, standard deviation = 12.15) (Table 5), reflecting a dry and hot paleoclimatic condition. Among them, the average ratio value of Ga/Rb of upper salt clay conglomerates is 0.14 (standard deviation = 0.01), lower than that of lower salt clay conglomerates (average = 0.19, standard deviation = 0.05); the Sr/Cu ratio value of upper part of salt clay conglomerates is relatively stable; and the Sr/Cu ratio value of lower member of salt clay conglomerates changes greatly, reflecting the fluctuation of paleoclimate, which is consistent with the change of lithology (the occurrence of a small value is related to the increase in sandy or silty content).
Through the study of weathering degree of samples, we can indirectly understand the paleoclimatic conditions of MYJ Fm. during the sedimentary period. The weathering degree of clay conglomerates in MYJ Fm. of MZK-3 well is weak, which reflects the arid paleoclimate conditions. The paleolatitude of the study area has a hot paleoclimate background. Therefore, the paleoclimatic conditions of MYJ Fm. in the deposition period are hot and dry. This understanding has been confirmed by other studies such as sporopollen assemblage [19], paleogeography [43], fluid inclusion thermometry [44].
The weathering degree of the lower part of salt clay conglomerates is stronger than that of the upper part of salt clay conglomerates, which may be caused by the warm and humid climatic conditions in individual periods. Those paleoclimatic conditions not only increased the content of detritus, but also increased the differentiation of major and trace elements.

5.2. Redox Conditions

It has been found by scholars that black shales cannot all be assigned to anoxic environments and red-brown shales cannot all be assigned to oxidation environment [45], which indicates that the oxidation–reduction conditions of sedimentary environment cannot be accurately identified only based on the color of sedimentary rocks. Therefore, the redox conditions of the red-brown clay conglomerates of MYJ Fm. were studied in this paper. V, Ni, Mo, Cu, Cr, and Mn can be used as sensitive elements for redox conditions to indicate a paleomarine environment [46,47,48,49]. In an oxidation environment, V, Ni, Cr appear in the form of soluble ions; in the reduction environment, V and Cr appear in the form of insoluble oxides or hydroxides [46,49]. Ni is still soluble under moderate reduction conditions, but at the sulfate reduction stage, it will appear in pyrite in the form of NiS, and the reduction sensitivity of Ni is weaker than that of V and Cr [49].
Based on the above geochemical properties of V, Ni, and Cr, V/(V + Ni) and V/Cr can be used to indicate the redox properties of sedimentary water bodies. Higher values indicate stronger reduction conditions [50,51,52]. Among them, a V/(V + Ni) value greater than 0.84 indicates a reduction environment, less than 0.60 indicates an oxidation environment, and between 0.60 to 0.84 indicates a weak oxidation and weak reduction environment; a value for V/Cr ratio greater than 4.25 indicates a reduction environment, less than 2.0 indicates an oxidation environment, and between 2.0 to 4.25 indicates a weak oxidation and weak reduction environment [50,53,54].
The values of the V/(V + Ni) ratio of clay conglomerates in the MYJ Fm. of the MZK-3 well range from 0.61 to 0.82 (average = 0.73, standard deviation = 0.05), which reflects that the sedimentary environment is in the condition of weak oxidation and weak reduction; the value of V/Cr range from 1.18 to 1.43 (average = 1.29, standard deviation = 0.08), which reflects the partial oxidation of sedimentary environment. Based on the V/(V + Ni) ratio value and V/Cr ratio value, it is considered that the clay conglomerates of MYJ Fm. were deposited in and oxidation environment but which had not reached the degree of strong oxidation. Among them, the V/(V + Ni) ratio values of upper salt clay conglomerates range from 0.72 to 0.76 (average = 0.74, standard deviation = 0.02); the V/Cr ratio values range from 1.21 to 1.39 (average = 1.31, standard deviation = 0.08); the V/(V + Ni) ratio values of lower salt clay conglomerates range from 0.61 to 0.82 (average = 0.73, standard deviation = 0.06); and the V/Cr ratio values range from 1.18 to 1.43 (average = 1.28, standard deviation = 0.07). The average ratio values of V/(V + Ni) and V/Cr of the lower clay conglomerates are slightly lower than those of the upper samples, indicating that the redox potential of the sedimentary environment may be relatively high.
Manganese (Mn) in sedimentary water is not easily adsorbed by organic matter or combined with other minerals, and its content increases with the increase in environmental oxidation [55]. Under oxidation conditions, Mn forms insoluble Mn3+ or Mn4+ hydroxides or oxides, which are co-deposited with detrital particles in the environment; under reduction conditions, Mn is reduced to soluble Mn2+, and Mn content in sediments is relatively lower [46,48,49]. In the samples, the average enrichment factor of Mn is slightly higher than 1.0 (Table 4), which is also a reflection of weak oxidation environment.
In combination with the relative contents of Fe and V in sediments, some scholars have proposed that [45] (1) under strong oxidation conditions, Mn and Fe appear in the form of oxides, and the relative contents are relatively high (Mnaverage = 1300 ppm, Feaverage = 56,000 ppm); (2) under the condition of neutral pH nitrate sulfate reduction, the content of Mn in sediments is lower (average = 310 ppm), and Fe is still in the form of oxides; and (3) under the conditions of strong reduction, the V content in the sediment is particularly high, while the content of Mn and Fe is relatively lower.
The content of Mn varies from 243.4 to 933.9 ppm (average = 619.8 ppm, standard deviation = 213.5 ppm); the content of Fe varies from 35,000 to 74,000 ppm (average = 52,000 ppm, standard deviation = 11,000 ppm). The content of V varies from 78.2 to 128.2 ppm (average = 96.8 ppm, standard deviation = 14.9 ppm). This reflects the overall partial oxidation of the sedimentary environment, but has not reached the degree of strong oxidation. This conclusion is consistent with that obtained from the relative contents of V, Ni, and Cr.
In order to identify the redox conditions of sedimentary environment by using the relative contents of Fe, Mn, and V, we firstly reduced the relative content of Fe by 100 times, and then constructed the ternary scatter plot (Figure 8). In Figure 8, area 1 represents strong oxidation environment, area 2 represents weak oxidation environment, and area 3 represents reduction environment. The data points of clay conglomerates in MYJ Fm. of MZK-3 well fall in areas 1 and 2, indicating that the sedimentary environment is partial oxidation, and some periods are still in strong oxidation environment. The understanding that MYJ Fm. is in a strong oxidation environment in some periods is also supported by the results of high and low frequency susceptibility tests [56].

5.3. Paleosalinity

B in sediments mainly exists in clay minerals, which may replace Si or Al atoms in the lattice of clay minerals, and its content is mainly controlled by the B content in sedimentary water besides the parent B content. The concentration of boron in sediment water is linearly related to salinity, so it can be used to restore the salinity of sedimentary water.
The relationship between B content in sediment and salinity of sediment water can be established as follows (Freundlich isotherm adsorption equation):
logBk = C1logSp + C2
Bk = B/(4Xi + 2Xm + Xk)
In the equation, Bk is the B content of kaolinite (ppm); B is the measured content (ppm); Xi, Xm, Xk are the relative contents of illite, montmorillonite, and kaolinite in clay minerals, respectively; SP is the paleosalinity (‰); and C1 and C2 are constants. According to the relationship between B content of kaolinite in modern sedimentary water and salinity, C1 and C2 are 1.28 and 0.11, respectively [57].
According to (1) and (2), the paleosalinity of the clay conglomerate sedimentary water body in MYJ Fm. of MZK-3 well vary from 10‰ to 92‰ (average = 30‰, standard deviation = 23‰), which is similar to the salinity of modern seawater (Table 6). Among them, the paleosalinity of upper salt clay conglomerate sedimentary water body ranges from 12‰ to 38‰ (average = 21‰, standard deviation = 12‰); The paleosalinity of lower salt clay conglomerate sedimentary water body ranges from 10‰ to 92‰ (average = 35‰, standard deviation = 27‰). The numerical characteristics show that (1) the paleosalinity of the upper part of the salt is lower than that of the lower part of the salt, which reflects the gradual desalination process of the water body in the clastic rock sedimentary environment; (2) in the lower part of salt clay conglomerates deposition period, the paleosalinity of the water body in the sedimentary environment is relatively high, but it fluctuates violently, and the lowest values of Sr/Cu appear, which is consistent with the occurrence of gray-green siltstone intercalation and is obviously affected by the warm and humid climate in individual periods; and (3) the salinity of sedimentary water does not reach the stage of salting out in both the upper member of salt and the lower member of salt clay conglomerates.
The main reason for the difference of salinity between upper member of salt and lower member of salt clay conglomerates may be paleoclimatic conditions. Under the background of arid and hot paleoclimate, the salinity of catchment basin mainly comes from recharge water body, and the salinity depends on the type and quantity of recharge water. If the supply of hydrothermal brine and salt spring water is not considered, only atmospheric precipitation can supply, then the strong rainfall can increase the debris flow into the basin, the size of debris at the same location, and the total amount of salt dissolved in the water body. The salinity of this kind of water body is lower in the initial formation period, but since the large amount of salt dissolved in the water, the salinity of the sedimentary environment after evaporation and concentration is higher than that in the period of less precipitation supply. The paleoclimate background of the above salt and lower part of salt clay conglomerate sedimentary period is exactly like this: in the upper part of the salt clay conglomerates’ sedimentary period, the paleoclimate was dry and hot, the salt supply in the catchment basin was relatively less, and the salinity of the sedimentary environment was relatively low; in the lower part of the salt clay conglomerates’ deposition period, the paleoclimate was dry and hot as a whole, and only a few periods of atmospheric precipitation supplied more salt, which led to the increase of salt supply in the catchment basin, and the water body sank after evaporation and concentration. The salinity of the sedimentary environment is relatively high.
The characteristics of paleosalinity in the sedimentary period of clay conglomerates in MYJ Fm. indicate that the contact relationship between the salt rock and the clay conglomerates is transilient, and the sequence of evaporation between them has not formed. It can be interpreted as the clay conglomerates not being clastic sediment in the critical brine (A critical state that before evaporate into halite.) based on the paleosalinity recovery and mineral combination characteristics, which show that the paleosalinity of the sedimentary environment of the clay conglomerates does not reach the stage of evaporate into halite. The critical brine were not concentrated in the original evaporation basin after the clay conglomerate deposition, because there is no carbonate rock and gypsum on the clay conglomerate, and they should be the salt that precipitates before the seawater concentrates to the critical brine.
A reasonable explanation for the genesis of the potash deposits in the clastic rocks of MYJ Fm. is the metallogenic model of “deep source and shallow mineralization” [18,58]. The core idea of this theory is that the potash deposit in Simao Basin was formed by the diapir of the Middle-Jurassic Hepingxiang Fm. source salt compressed by tectonic activity to MYJ Fm. This genetic model can not only reasonably explain the objective phenomena—such as the source of salt being seawater, the salt-related clastic rocks in continental environment, the lack of carbonate and sulfate rocks in the corresponding scale, and the special structural morphology of salt bodies—but also reasonably explain the abrupt contact between salt rock and clastic rock without the transition of the evaporation sequence and the salinity difference in the salt-related clastic rock sedimentary system. Another reasonable explanation is that the concentrated brine which has reached the stage of precipitating halite evaporates and concentrates in the basin, but the source of this brine is still difficult to trace.

6. Conclusions

During the clay conglomerate sedimentary period of MYJ Fm., the paleoclimate was dry and hot with slight to moderate chemical weathering, which led to the higher values of CIA, PIA, and CIW. Such paleoclimatic conditions make the value of trace elements Ga/Rb lower and Sr/Cu higher, and the clay conglomerates are mainly composed of illite and illite–montmorillonite mixed-layer. The geochemical characteristics of trace elements in the clay conglomerates reflect that the sedimentary environment is in weak oxidation condition as a whole, and strong oxidation conditions occur only in a few periods. The results of quantitative restoration of paleosalinity show that the salinity of the sedimentary water body is similar to that of modern seawater, and can reach ~92 ‰ in some periods. Under the overall arid and hot paleoclimate background, the salinity of sedimentary water body is related to the intensity of atmospheric precipitation. The stronger precipitation in a few periods can bring more salt into the catchment basin. Evaporation and concentration lead to relatively high salinity in the sedimentary environment, and relatively coarse-grained clastic rocks appear in the stratum. However, the paleosalinity of the sedimentary environment of both the clay conglomerates which are distributed in upper and lower members of the salt rock did not reach the boundary of salt evolution, which indicates that the clastic grains of MYJ Fm. and the potash-bearing rock salt are not in the same original sedimentary system. The “deep source and shallow mineralization” potash metallogenic model can better explain the MYJ Fm. mechanism of potash deposits.

Author Contributions

Conceptualization, P.L. and Z.M.; methodology, Z.M.; software, P.L. and Z.M.; validation, P.L. and Z.M.; formal analysis, Z.M.; investigation, P.L., Z.M. and X.Z.; resources, Z.M.; data curation, Z.M.; writing—original draft preparation, Z.M. and P.L.; writing—review and editing, Z.M., P.L., M.Z., X.Z., Z.R., Q.X.; visualization, P.L.; supervision, Z.M.; project administration, Z.M.; funding acquisition, Z.M. All authors have read and agreed to the published version of the manuscript.

Funding

This research was Supported by the project of China Geological Survey (DD20201115) and the National Key Research and Development Program (2017YFC0602801).

Data Availability Statement

Not applicable.

Acknowledgments

We thank two anonymous reviewers for their constructive comments, which helped us to improve the manuscript.

Conflicts of Interest

The authors declare no conflict of interest.

References

  1. Miao, W.; Ma, H.; Zhang, X.; Shi, H.; Li, Y.; Rong, Z. Mineralogical and geochemical characteristics of detrital rocks in the Mengyejing Formation and evolution of the sedimentary environment of paleolake in Simao Basin, Yunnan province. Acta Geol. Sin. 2015, 89, 2096–2107. [Google Scholar]
  2. Miao, W.; Ma, H.; Zhang, X.; Zhang, Y.; Li, Y. Clay mineral characteristics of salt sequence in drill hole SHK4 of the Mengyejing potassium deposit of Jiangcheng, Lanping-Simao Basin, Yunnan province, and their sylvite-forming significance. Acta Geosci. Sin. 2013, 34, 537–546. [Google Scholar]
  3. Shi, H.; Ma, H.; Miao, W.; Li, Y.; Zhang, X. Characteristics and geological significances of rare earth and trace elements from Upper Cretaceous Mengyejing Formation of Simao Basin in Jiangcheng County, Yunnan province. Geochimica 2014, 43, 415–427. [Google Scholar]
  4. Metcalfe, I. Permian tectonic framework and palaeogeography of SE Asia. J. Asian Earth Sci. 2002, 20, 551–566. [Google Scholar] [CrossRef]
  5. Sone, M.; Metcalfe, I. Parallel Tethyan sutures in mainland Southeast Asia: New insights for Palaeo-Tethys closure and implications for the Indosinian orogeny. C. R. Geosci. 2008, 340, 166–179. [Google Scholar] [CrossRef]
  6. Xu, Z.; Yang, J.; Li, W.; Li, H.; Cai, Z.; Yan, Z.; Ma, C. Pako-Tethys system and accretionary orogen in the Tibet Plateau. Acta Petrol. Sin. 2013, 29, 1847–1860. [Google Scholar]
  7. Huang, K.; Opdyke, N.D. Paleomagnetic results from cretaceous and Jurassic rocks of South and Southwest Yunnan—evidence for large clockwise rotations in the Indo-China and Shan Thai malay terranes. Earth Planet. Sci. Lett. 1993, 117, 507–524. [Google Scholar] [CrossRef]
  8. Yin, J.; Sun, Z.; Yang, Z.; Liang, Q. Cretaceous and Early Tertiary paleomagnetic results from the Langping Basin and its geological implications. Chin. J. Geophys. 1999, 42, 648. [Google Scholar]
  9. Cong, B.; Wu, G.; Zhang, Q.; Zhang, R.; Zhuo, M.; Zhao, D.; Zhang, W. Rocks of the Paleo Tethys tectonic belt in Western Yunnan, China tectonic evolution. Sci. China 1993, 23, 1201. [Google Scholar]
  10. Tong, Y.-B.; Yang, Z.; Zheng, L.-D.; Xu, Y.-L.; Wang, H.; Gao, L.; Hu, X.-Z. Internal crustal deformation in the northern part of Shan-Thai Block: New evidence from paleomagnetic results of Cretaceous and Paleogene redbeds. Tectonophysics 2013, 608, 1138–1158. [Google Scholar] [CrossRef]
  11. Qu, Y.H.; Yuan, P.Q.; Shuai, K.Y.; Zhang, Y.; Cai, K.Q.; Jia, S.Y.; Chen, C.D. Potashforming Rules and Prospect of the Lower Tertiary in the Lanping-Simao Basin, Yunnan; Geological Publishing House: Beijing, China, 1998; pp. 1–118. [Google Scholar]
  12. Chen, Y.; Liao, Z.; Wei, Z.; Li, M. Characteristics and tectonic evolution of the Lanping-Simao Mesozoic Basin. Pet. Geol. Exp. 2004, 26, 219–222, 228. [Google Scholar]
  13. Zongting, L.; Yuekun, C. Nature and evolution of Lanping-Simao Basin prototype. J. Tongji Univ. Nat. Sci. 2005, 33, 1527–1531. [Google Scholar]
  14. Tan, F. The Sedimentary Characteristics of Simao Triassic rear arc foreland basin, Yunnan province. Acta Sedimentol. Sin. 2002, 20, 560–567. [Google Scholar]
  15. Wu, N.P.; Jiang, S.Y.; Liao, Q.L.; Pan, J.Y.; Dai, B.Z. Lead and sulfur isotope geochemistry and the ore sources of the vein-type copper deposits in Lanping-Simao Basin, Yunnan province. Acta Petrol. Sin. 2003, 19, 799–807. [Google Scholar]
  16. Hongfu, Y.; Shunbao, W.; Yuansheng, D.; Yuanqiao, P. South China defined as part of Tethyan archipelagic ocean system. Earth Sci. J. China Univ. Geosci. 1999, 24, 1–12. [Google Scholar]
  17. Fuguang, Y.I.N.; Guitang, P.A.N.; Fang, W.A.N.; Xingzhen, L.I.; Fangguo, W. Tectonic facies along the Nujiang-Lancangjiang-Jinshajiang orogenic belt in Southwestern China. Sediment. Geol. Tethyan Geol. 2006, 26, 33–39. [Google Scholar]
  18. Zheng, M.; Zhang, Z.; Yin, H.; Tan, X.; Yu, C.; Shi, L.; Zhang, X.; Yang, J.; Jiao, J.; Wu, G. A new viewpoint concerning the Formation of the Mengyejing Potash Deposit in Jiangcheng, Yunnan. Acta Geosci. Sin. 2014, 35, 11–24. [Google Scholar]
  19. Yuan, Q.; Qin, Z.; Wei, H.; Sheng, S.; Shan, F. The ore-forming age and palaeoenvironment of the Mengyejing Formation in Jiangcheng, Yunnan province. Acta Geosci. Sin. 2013, 34, 631–637. [Google Scholar]
  20. Wang, L.; Liu, C.; Fei, M.; Shen, L.; Zhang, H.; Zhao, Y. First SHRIMP U–Pb zircon ages of the potash-bearing Mengyejing Formation, Simao Basin, southwestern Yunnan, China. Cretac. Res. 2015, 52, 238–250. [Google Scholar] [CrossRef]
  21. Cohen, K.M.; Finney, S.M.; Gibbard, P.L.; Episodes, F.J.J. The ICS International Chronostratigraphic Chart. Episodes 2013, 36, 199–204. [Google Scholar] [CrossRef]
  22. Zheng, Z.; Yin, H.; Zhang, Z.; Zheng, M.; Yang, J. Strontium isotope characteristics and the origin of salt deposits in Mengyejing, Yunnan province, SW China. J. Nanjing Univ. 2012, 48, 719–727. [Google Scholar]
  23. Brumsack, H.J. The inorganic geochemistry of Cretaceous black shales (DSDP Leg 41) in comparison to modern upwelling sediments from the Gulf of California. Geol. Soc. Lond. Spec. Publ. 1986, 21, 447–462. [Google Scholar] [CrossRef]
  24. Calvert, S.E.; Pedersen, T.F. Geochemistry of recent oxic and anoxic marine-sediments—implications for the geological record. Mar. Geol. 1993, 113, 67–88. [Google Scholar] [CrossRef]
  25. Morford, J.L.; Emerson, S. The geochemistry of redox sensitive trace metals in sediments. Geochim. Et Cosmochim. Acta 1999, 63, 1735–1750. [Google Scholar] [CrossRef]
  26. Piper, D.Z.; Perkins, R.B. A modern vs. Permian black shale—the hydrography, primary productivity, and water-column chemistry of deposition. Chem. Geol. 2004, 206, 177–197. [Google Scholar] [CrossRef]
  27. Turekian, K.K.; Wedepohl, K.H. Distribution of the elements in some major units of the Earth’s Crust. Geol. Soc. Am. Bull. 1961, 72, 175–192. [Google Scholar] [CrossRef]
  28. Nesbitt, H.W.; Young, G.M. Early Proterozoic climates and plate motions inferred from major element chemistry of lutites. Nature 1982, 299, 715–717. [Google Scholar] [CrossRef]
  29. Fedo, C.M.; Nesbitt, H.W.; Young, G.M. Unraveling the effects of potassium metasomatism in sedimentary-rocks and paleosols, with implications for paleoweathering conditions and provenance. Geology 1995, 23, 921–924. [Google Scholar] [CrossRef]
  30. Harnois, L. The CIW index—A new chemical index of weathering. Sediment. Geol. 1988, 55, 319–322. [Google Scholar] [CrossRef]
  31. Mclennan, S.M. Weathering and Global Denudation. J. Geol. 1993, 101, 295–303. [Google Scholar] [CrossRef]
  32. Brownlow, H. Geochemistry; Prentice-Hall, Inc.: Upper Saddle River, NJ, USA, 1979; p. 498. [Google Scholar]
  33. Wu, C.; Liu, C.; Yi, H.; Xia, G.; Zhang, H.; Wang, L.; Li, G.; Wagreich, M. Mid-Cretaceous desert system in the Simao Basin, southwestern China, and its implications for sea-level change during a greenhouse climate. Palaeogeogr. Palaeoclimatol. Palaeoecol. 2017, 468, 529–544. [Google Scholar] [CrossRef]
  34. Alexandrine, N.N.; Simon, N.; Gabriel, N. The late Pleistocene—Holocene paleoclimate reconstruction in the Adamawa plateau (Central Cameroon) inferred from the geochemistry and mineralogy of the Lake Fonjak sediments. J. Afr. Earth Sci. 2019, 150, 23–36. [Google Scholar] [CrossRef]
  35. Wang, L.; Liu, C.; Gao, X.; Zhang, H. Provenance and paleogeography of the Late Cretaceous Mengyejing Formation, Simao Basin, southeastern Tibetan Plateau: Whole-rock geochemistry, U-Pb geochronology, and Hf isotopic constraints. Sediment. Geol. 2014, 304, 44–58. [Google Scholar] [CrossRef]
  36. Gingele, F.X.; De Deckker, P.; Hillenbrand, C.D. Late Quaternary fluctuations of the Leeuwin Current and palaeoclimates on the adjacent land masses: Clay mineral evidence. Aust. J. Earth Sci. 2001, 48, 867–874. [Google Scholar] [CrossRef]
  37. Vanderaveroet, P. Miocene to Pleistocene clay mineral sedimentation on the New Jersey shelf. Oceanol. Acta 2000, 23, 25–36. [Google Scholar] [CrossRef] [Green Version]
  38. Roy, D.K.; Roser, B.P. Climatic control on the composition of Carboniferous–Permian Gondwana sediments, Khalaspir basin, Bangladesh. Gondwana Res. 2013, 23, 1163–1171. [Google Scholar] [CrossRef]
  39. Beckmann, B.; Flogel, S.; Hofmann, P.; Schulz, M.; Wagner, T. Orbital forcing of Cretaceous river discharge in tropical Africa and ocean response. Nature 2005, 437, 241–244. [Google Scholar] [CrossRef] [PubMed]
  40. Lerman, A. Lakes: Chemistry, Geology, Physics; Geological Press: Beijing, China, 1989; pp. 10–100. [Google Scholar]
  41. Cao, H.; Guo, W.; Shan, X.; Ma, L.; Sun, P. Paleolimnological environments and organic accumulation of the nenjiang formation in the Southeastern Songliao Basin, China. Oil Shale 2015, 32, 5–24. [Google Scholar] [CrossRef] [Green Version]
  42. Sarki Yandoka, B.M.; Abdullah, W.H.; Abubakar, M.B.; Hakimi, M.H.; Adegoke, A.K. Geochemical characterisation of Early Cretaceous lacustrine sediments of Bima Formation, Yola Sub-basin, Northern Benue Trough, NE Nigeria: Organic matter input, preservation, paleoenvironment and palaeoclimatic conditions. Mar. Pet. Geol. 2015, 61, 82–94. [Google Scholar] [CrossRef]
  43. Fang, X.; Song, C.; Yan, M.; Zan, J.; Liu, C.; Sha, J.; Zhang, W.; Zeng, Y.; Wu, S.; Zhang, D. Mesozoic litho- and magneto-stratigraphic evidence from the central Tibetan Plateau for megamonsoon evolution and potential evaporites. Gondwana Res. 2016, 37, 110–129. [Google Scholar] [CrossRef]
  44. Zhao, Y.; Liu, C.; Zhang, H.; Li, Z.; Ding, T.; Wang, M. The controls of paleotemperature on potassium salt precipitation in ancient salt lakes. Acta Petrol. Sin. 2015, 31, 2751–2756. [Google Scholar]
  45. Quinbyhunt, M.S.; Wilde, P. Thermodynamic zonation in the black shale facies based on iron-manganese vanadium content. Chem. Geol. 1994, 113, 297–317. [Google Scholar] [CrossRef]
  46. Algeo, T.J.; Maynard, J.B. Trace-element behavior and redox facies in core shales of Upper Pennsylvanian Kansas-type cyclothems. Chem. Geol. 2004, 206, 289–318. [Google Scholar] [CrossRef]
  47. Arthur, M.A.; Sageman, B.B. Marine black shales—Depositional mechanisms and environments of ancient-deposits. Annu. Rev. Earth Planet. Sci. 1994, 22, 499–551. [Google Scholar] [CrossRef]
  48. McManus, J.; Berelson, W.M.; Hammond, D.E.; Klinkhammer, G.P. Barium cycling in the North Pacific: Implications for the Utility of Ba as a paleoproductivity and paleoalkalinity proxy. Paleoceanography 1999, 14, 53–61. [Google Scholar] [CrossRef] [Green Version]
  49. Tribovillard, N.; Algeo, T.J.; Lyons, T.; Riboulleau, A. Trace metals as paleoredox and paleoproductivity proxies: An update. Chem. Geol. 2006, 232, 12–32. [Google Scholar] [CrossRef]
  50. Dill, H. Metallogenesis of Early Paleozoic graptolite shales from the Graefenthal Horst (Northern Bavaria-Federal-Republic-of-Germany). Econ. Geol. 1986, 81, 889–903. [Google Scholar] [CrossRef]
  51. Hatch, J.R.; Leventhal, J.S. Relationship between inferred redox potential of the depositional environment and geochemistry of the Upper Pennsylvanian (Missourian) Stark Shale Member of the Dennis Limestone, Wabaunsee County, Kansas, USA. Chem. Geol. 1992, 99, 65–82. [Google Scholar] [CrossRef]
  52. Jones, B.; Manning, D.A.C. Comparison of geochemical indexes used for the interpretation of palaeoredox conditions in ancient mudstones. Chem. Geol. 1994, 111, 111–129. [Google Scholar] [CrossRef]
  53. Dill, H.; Teschner, M.; Wehner, H. Petrography, inorganic and organic geochemistry of Lower Permian Carbonaceous fan sequences (brandschiefer series)—federal-republic-of-germany—constraints to their paleogeography and assessment of teir source rock potential. Chem. Geol. 1988, 67, 307–325. [Google Scholar] [CrossRef]
  54. Guangzhi, L.I.; Bin, H.U.; Tianlong, D.; Ziyan, Y. Petroleum geological significance of microelements V and Ni. Nat. Gas Geosci. 2008, 19, 13–17. [Google Scholar]
  55. Huerta-Diaz, A.M.; Morse, J.W. Pyritization of trace metals in anoxic marine sediments. Geochim. Et Cosmochim. Acta 1992, 56, 2681–2702. [Google Scholar] [CrossRef]
  56. Liu, C.; Wu, C.; Wang, L.; Fang, X.; Zhao, Y.; Yan, M.; Zhang, Y.; Cao, Y.; Zhang, H.; Lu, F. Advance in the study of forming condition and prediction of potash deposits of marine basins in China’s Small Blocks: Review. Acta Geosci. Sin. 2016, 37, 581–606. [Google Scholar]
  57. Couch, E.L. Calculation of paleosalinities from boron and clay mineral data. Aapg Bull. 1971, 55, 1829–1837. [Google Scholar]
  58. Zheng, M.; Zhang, Z.; Zhang, Y.; Liu, X.; Yin, H. Potash Exploration characteristics in China:New understanding and research progress. Acta Geosci. Sin. 2012, 33, 280–294. [Google Scholar]
Figure 1. Tectonic location of the study area.
Minerals 11 00338 g001
Figure 2. Geographical location, stratum, and fault distribution characteristics of the Simao Basin.
Minerals 11 00338 g002
Figure 3. Geologic map of the Mengyejing (MYJ) potash deposit (after [22]).
Minerals 11 00338 g003
Figure 4. Lithological column of the MZK-3 well, sampling locations, lithology description, and weathering parameters (1:1000).
Minerals 11 00338 g004
Figure 5. Shapes of carbonate rocks in mudstone substrate: (a) (MZK-3-8, 267.4 m), photomicrograph (crossed polarized light), carbonate rock exists in the fracture; (b) (MZK-3-15, 299.1 m), photomicrograph (crossed polarized light), and carbonate rock is broken with the shapes of crumb particles present in the intermediate.
Minerals 11 00338 g005
Figure 6. Late Cretaceous paleogeographic location and paleoclimatic types of Simao Basin.
Minerals 11 00338 g006
Figure 7. Clay mineral relative content of the MYJ Fm. in the lower member of rock salt layer.
Minerals 11 00338 g007
Figure 8. The relative content of Mn, Fe, and V and the discrimination of deposition environment. 1, strong oxidation zone; 2, weakly oxidized area, where nitrate and sulfate reduction reactions can occur; 3, reducing area.
Minerals 11 00338 g008
Table 5. Paleoclimatic parameters of trace elements in mudstone of the MYJ Fm. from MZK-3 well.
SamplesDepth [m]Ga/RbSr/CuNumbersDepth [m]Ga/RbSr/Cu
MZK-3-1109.20.135.63MZK-3-9270.50.276.94
MZK-3-3118.30.131.29MZK-3-10277.30.2748.89
MZK-3-3146.90.126.58MZK-3-11281.40.1510.68
MZK-3-4156.10.144.77MZK-3-12293.10.1410.40
MZK-3-5164.90.146.05MZK-3-13295.60.227.35
MZK-3-6169.00.1530.51MZK-3-14298.10.163.60
MZK-3-7173.10.154.47MZK-3-15299.10.204.91
MZK-3-8267.40.165.51MZK-3-16305.20.179.76
Table 6. Boron content and paleosalinity of clay conglomerates in the MYJ Fm. from MZK-3 well.
SamplesDepth [m]B [ppm]B Content of Kaolinite [ppm]Paleosalinity (‰)
MZK-3-2118.3140.847.529
MZK-3-3146.969.020.312
MZK-3-4156.167.320.913
MZK-3-6169.0195.963.138
MZK-3-7173.172.924.115
Salt////
MZK-3-8267.4105.340.525
MZK-3-9270.5235.6152.092
MZK-3-10277.3253.3113.169
MZK-3-11281.481.625.215
MZK-3-12293.1144.645.628
MZK-3-13295.688.032.720
MZK-3-14298.143.217.010
MZK-3-15299.1100.444.727
MZK-3-16305.290.341.525
Publisher’s Note: MDPI stays neutral with regard to jurisdictional claims in published maps and institutional affiliations.

