
Probing the Effect of Water Recycling on Flotation through Anion Spiking Using a Low-Grade Cu–Ni–PGM Ore: The Effect of NO3−, SO42− and S2O32−


Abstract
1. Introduction
2. Materials and Methods
2.1. Synthetic Plant Water Preparation
2.2. Ore Preparation
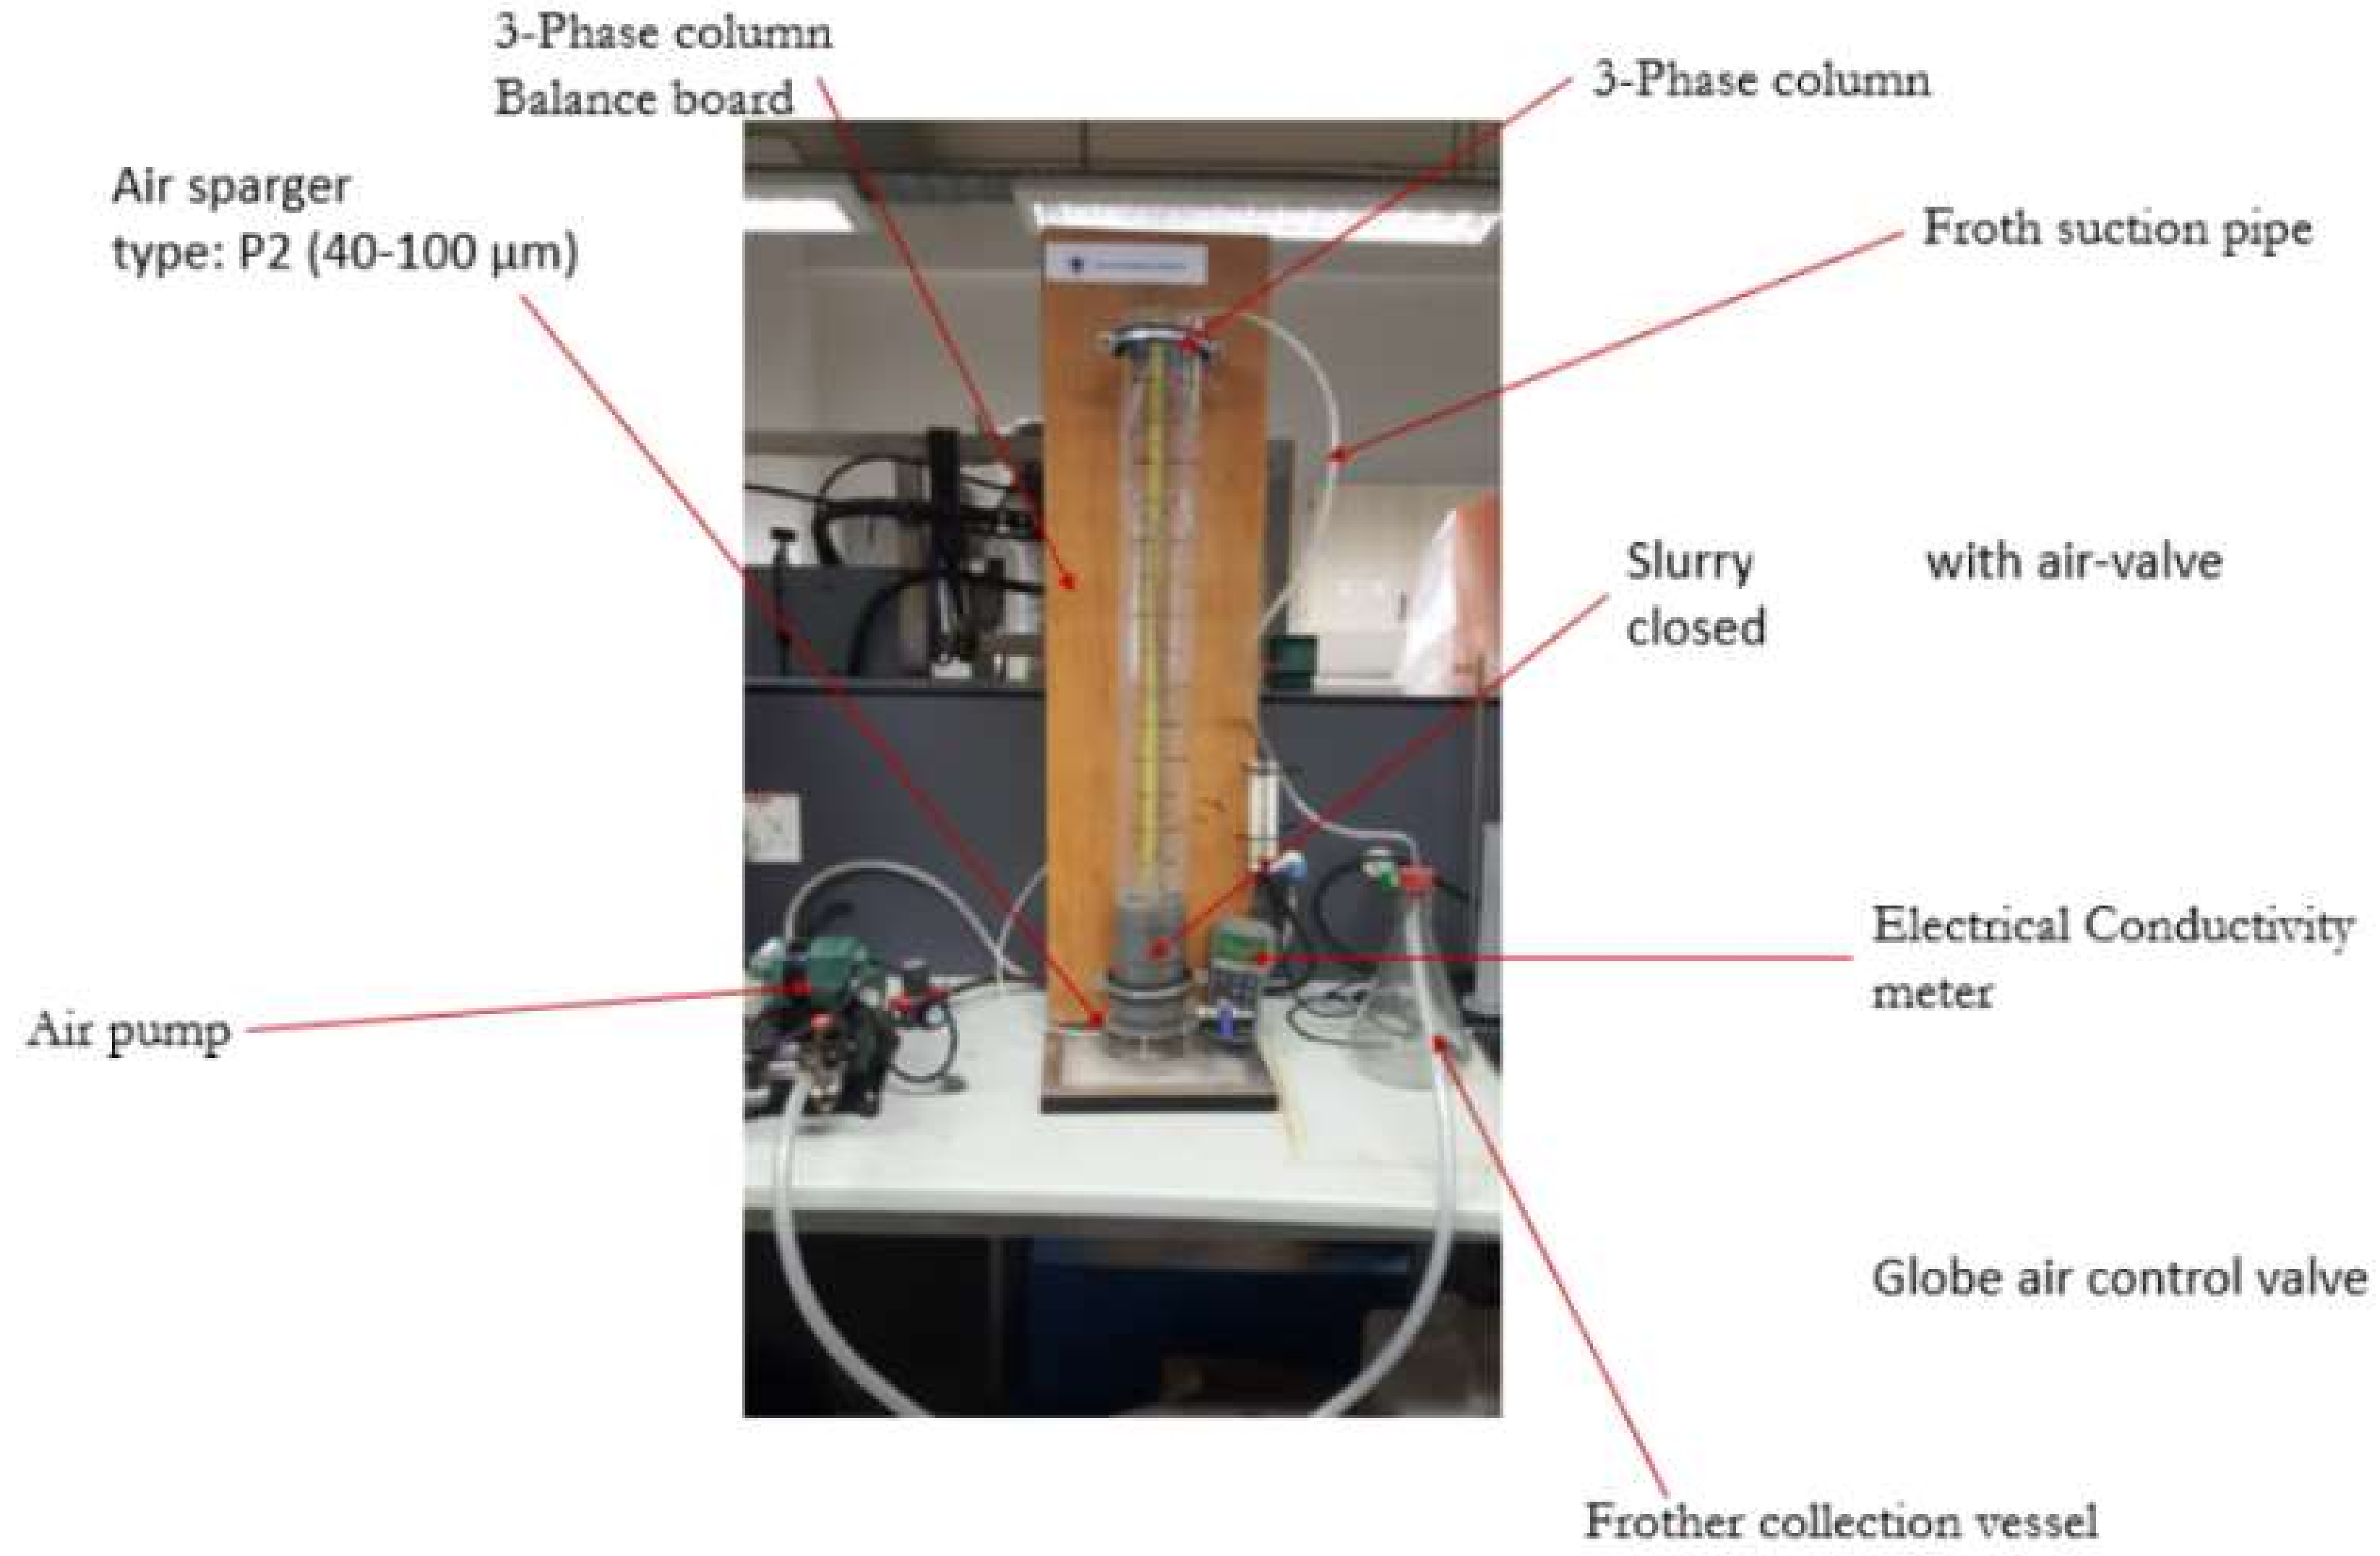
2.3. Batch Flotation
2.4. Electrical Conductivity Measurements
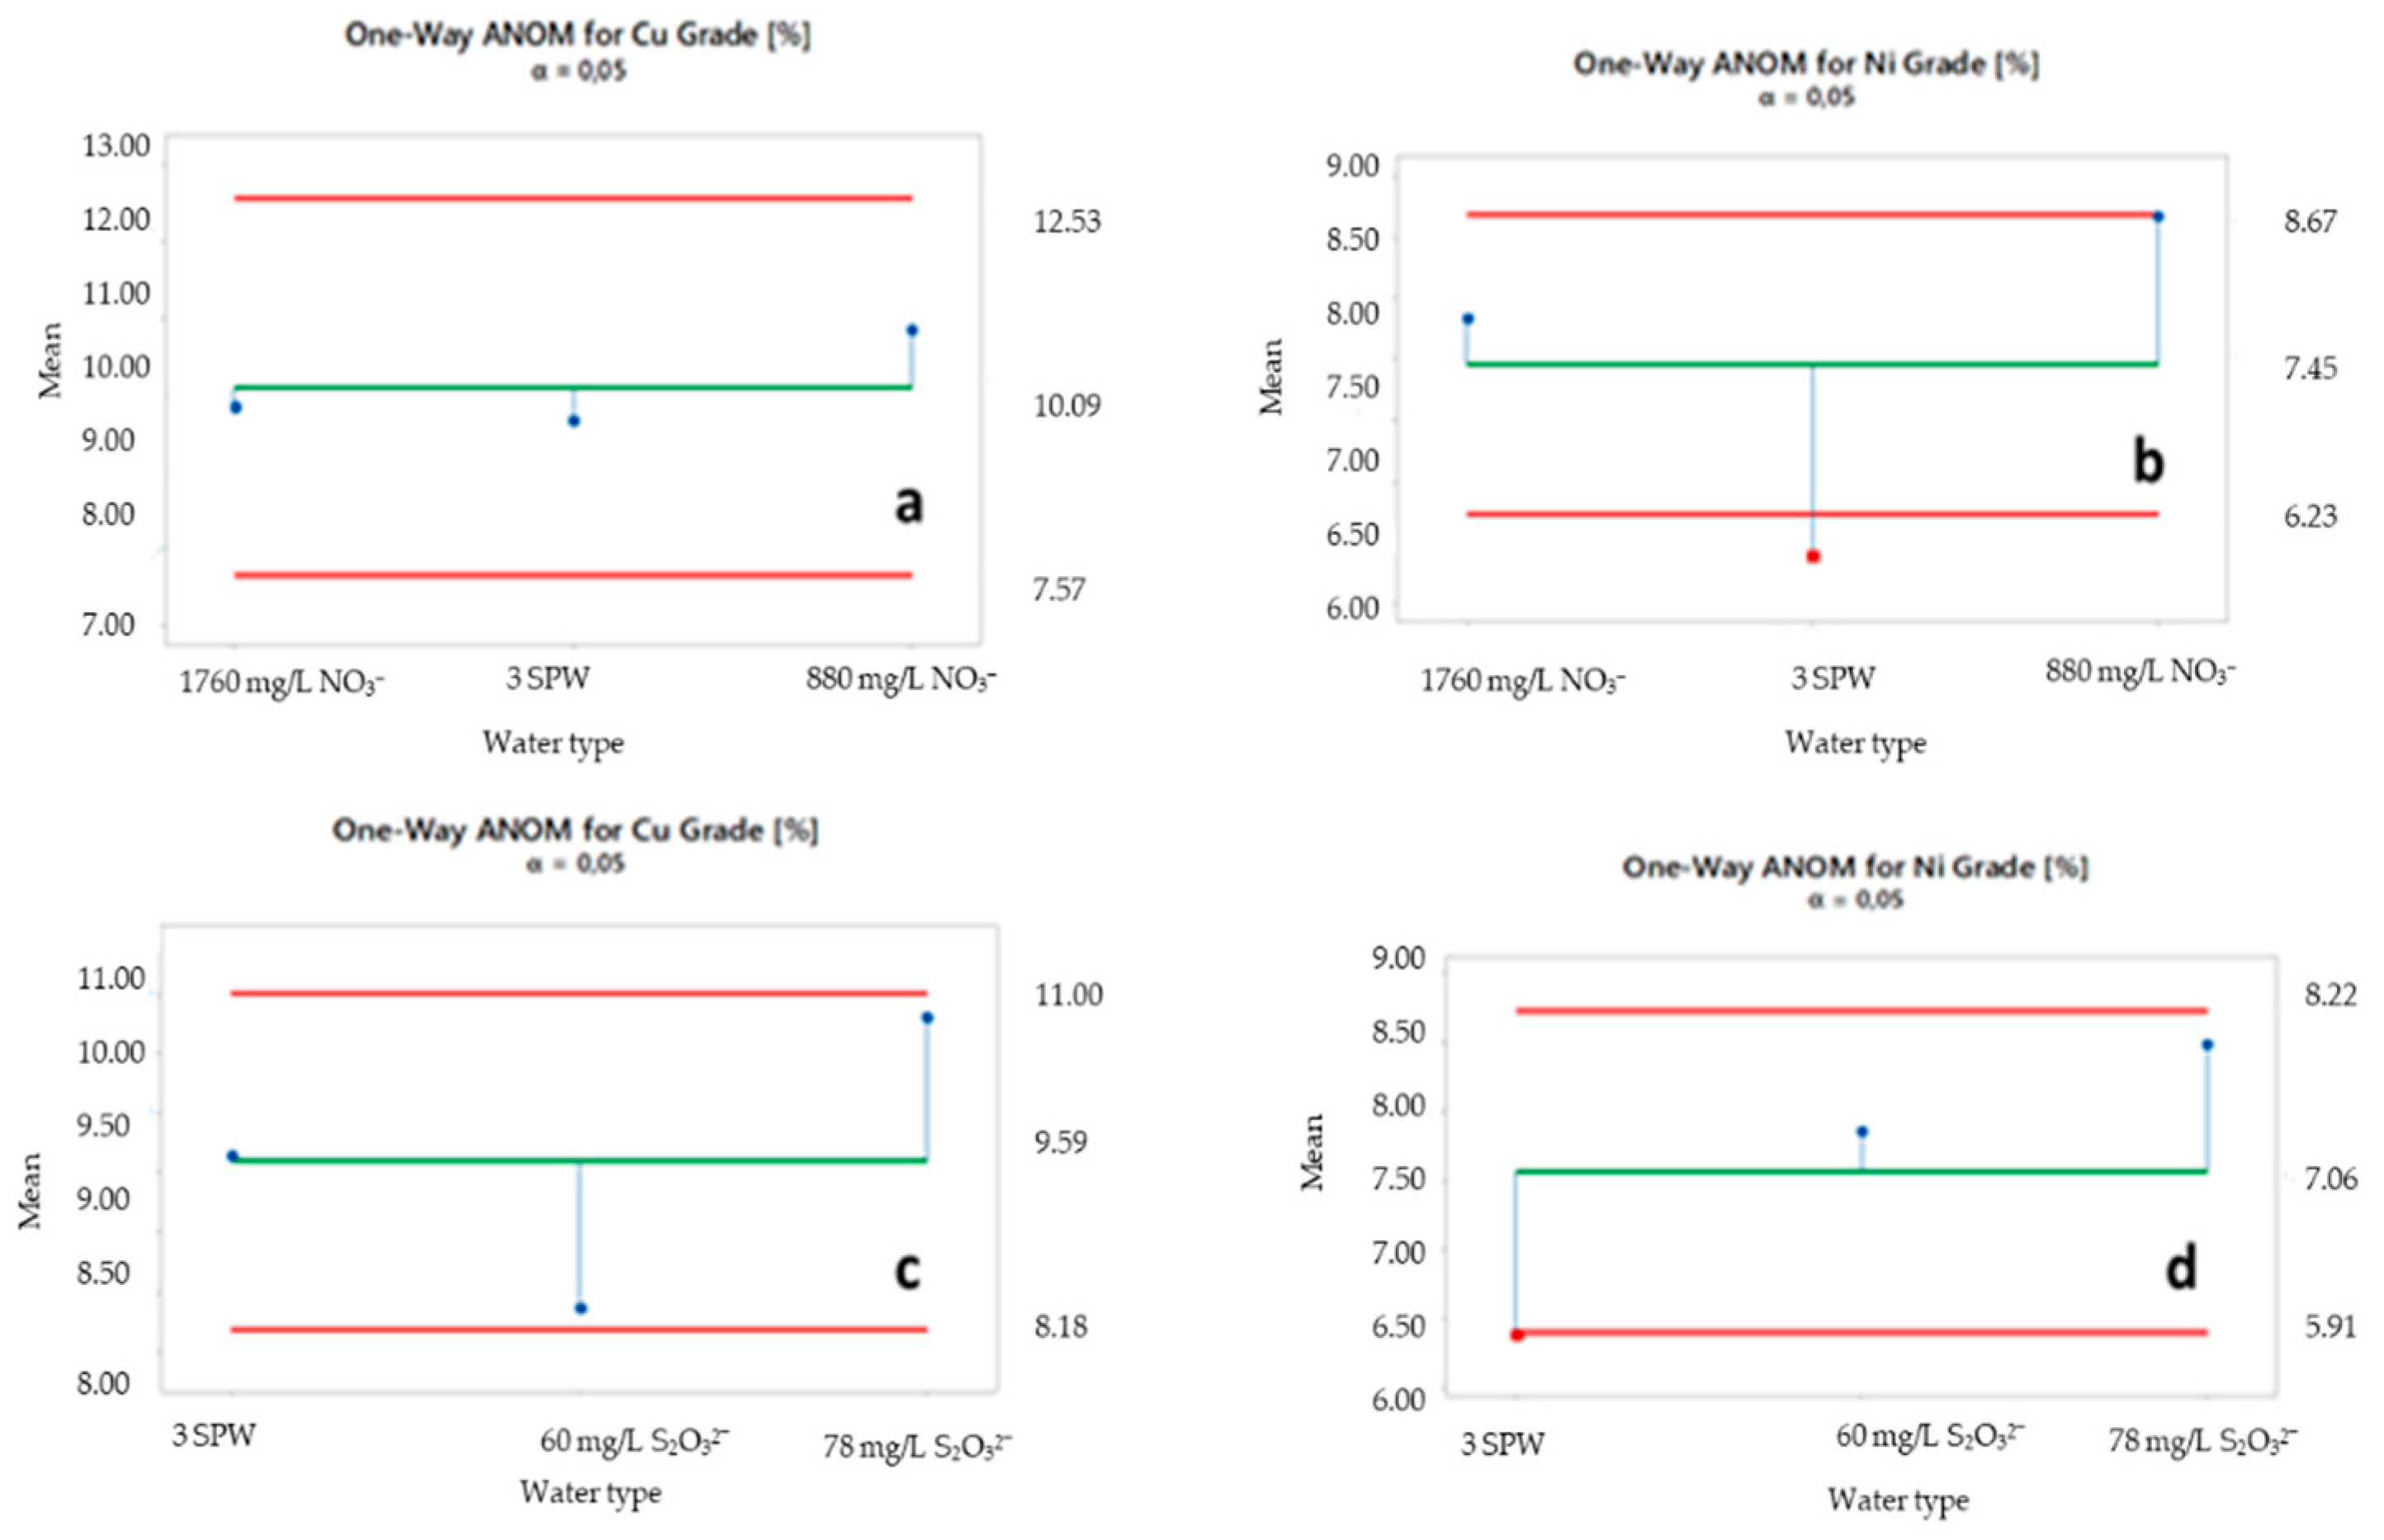
2.5. ANOM of Selected Ions
3. Results
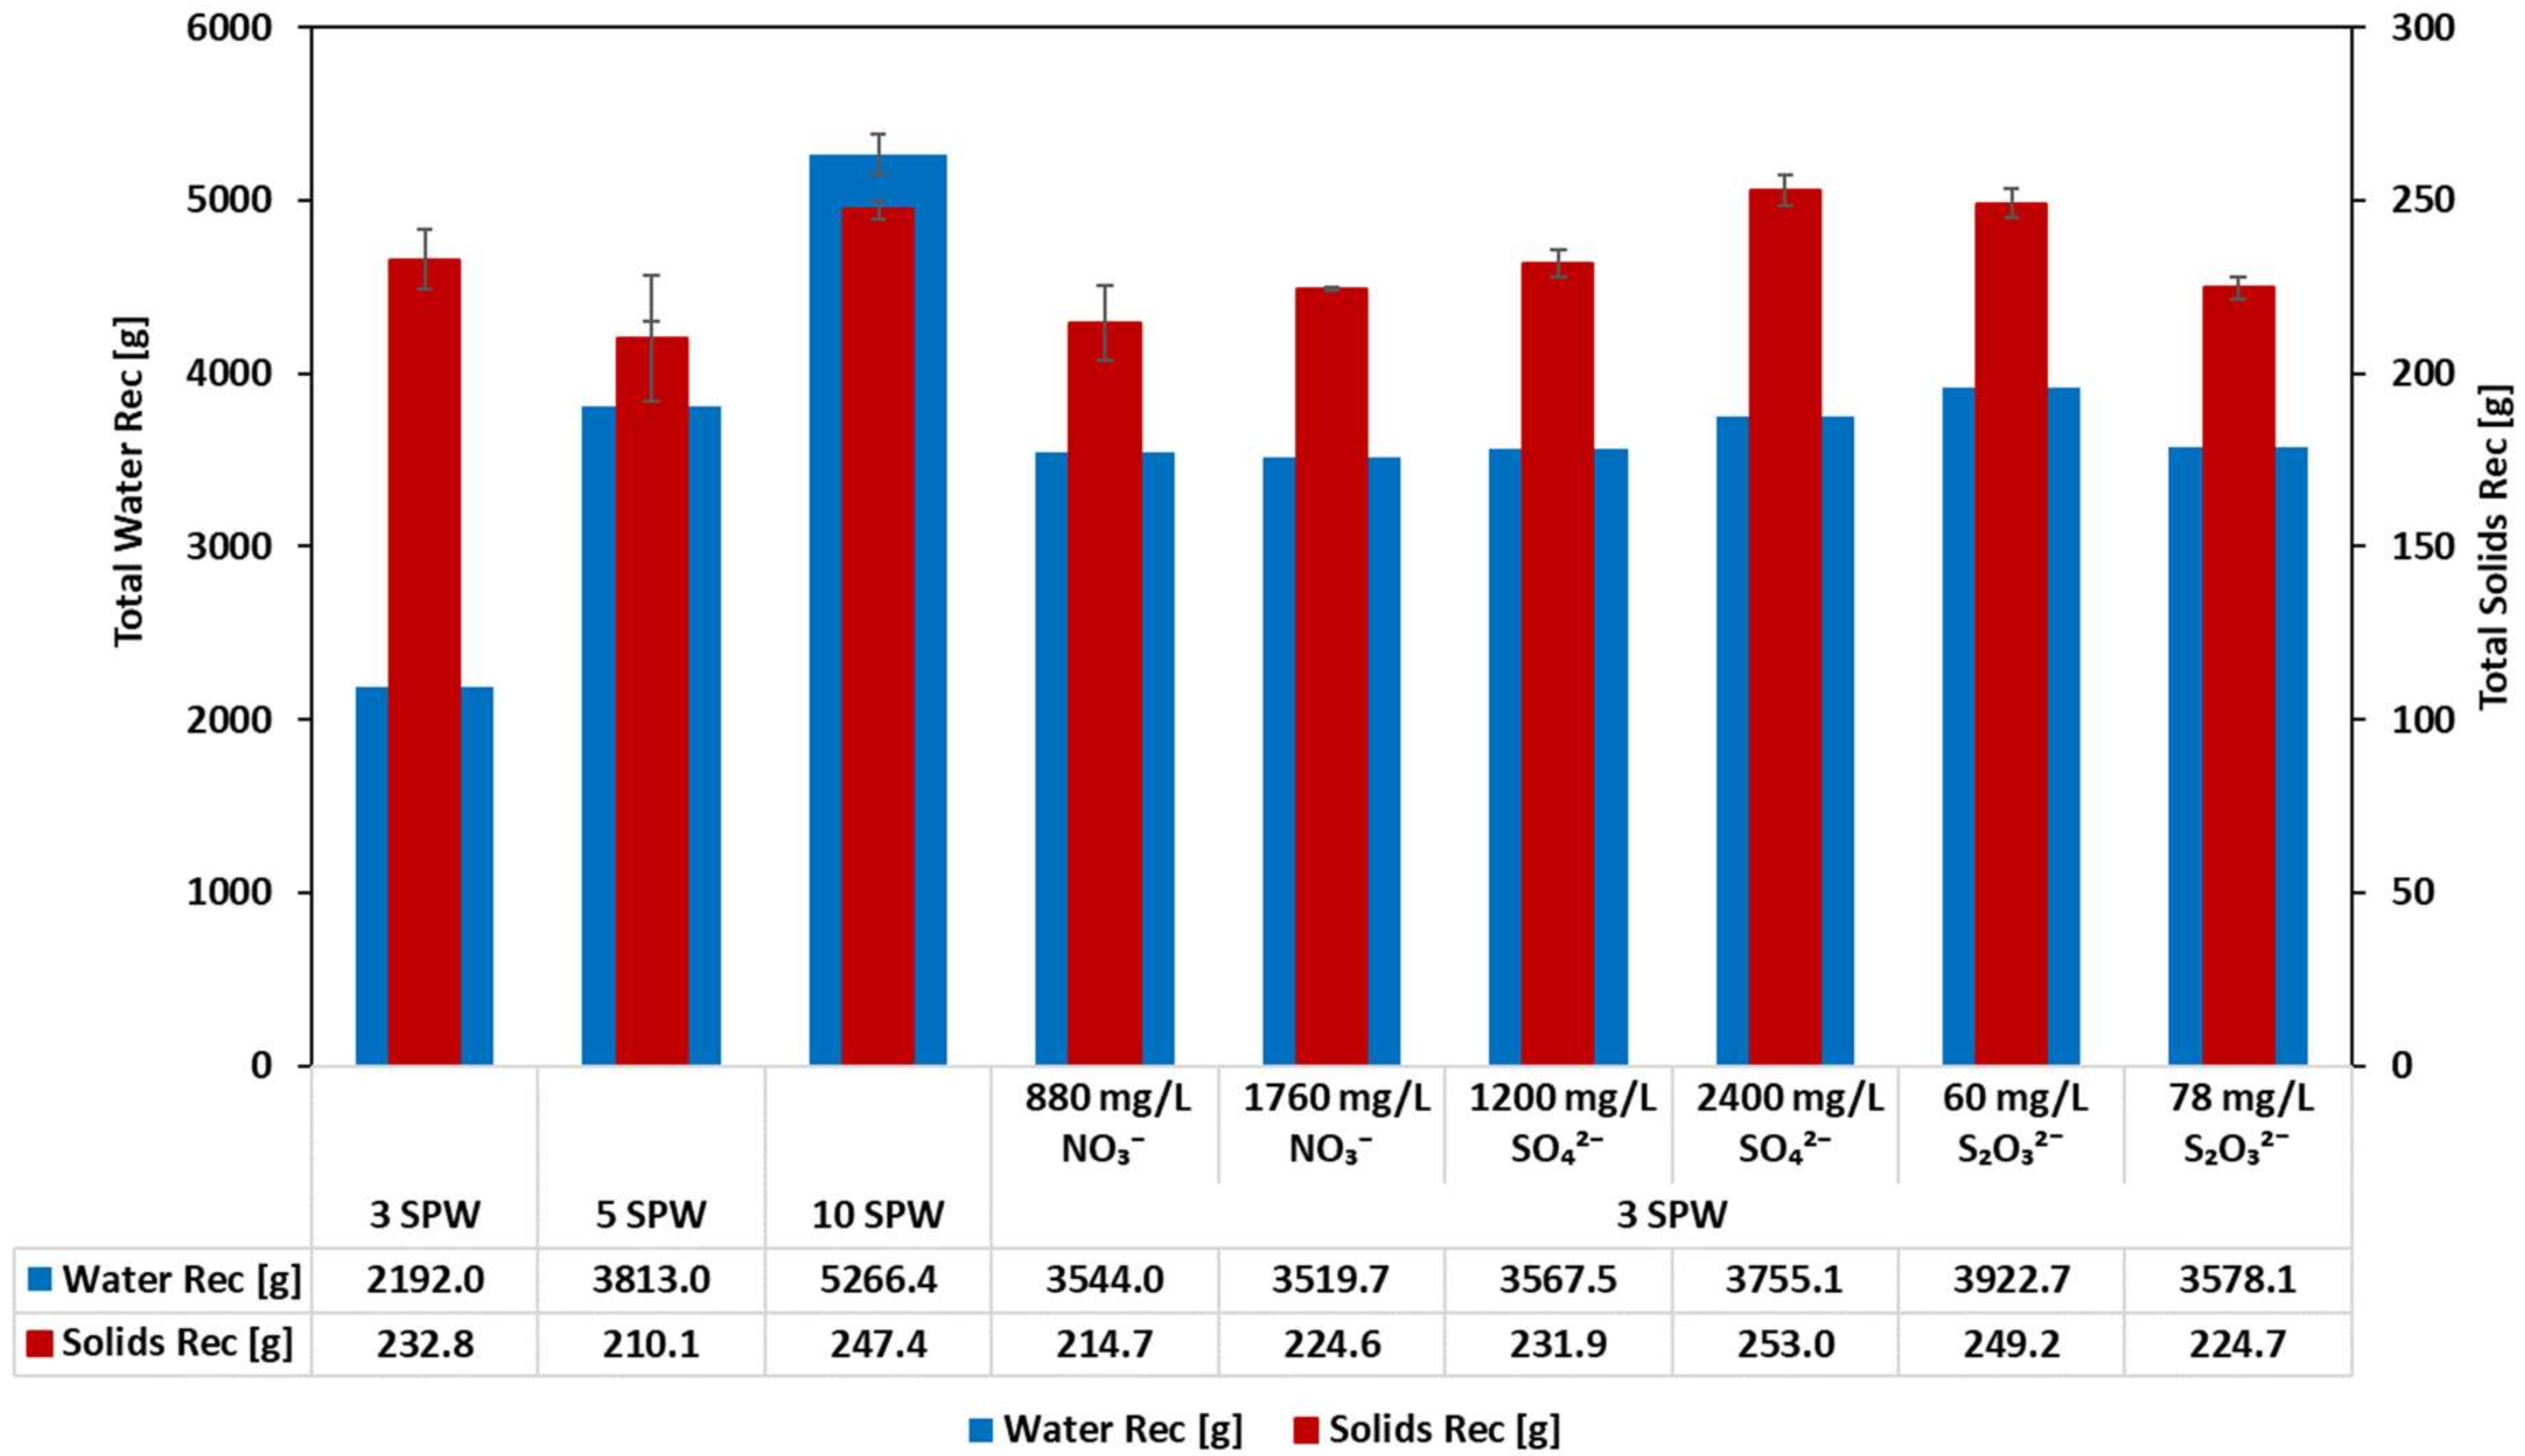
3.1. Effect of Increased NO3−, SO42− and S2O32− Concentration in Process Water on Solids and Water Recoveries: Implications on the Stability of the Froth
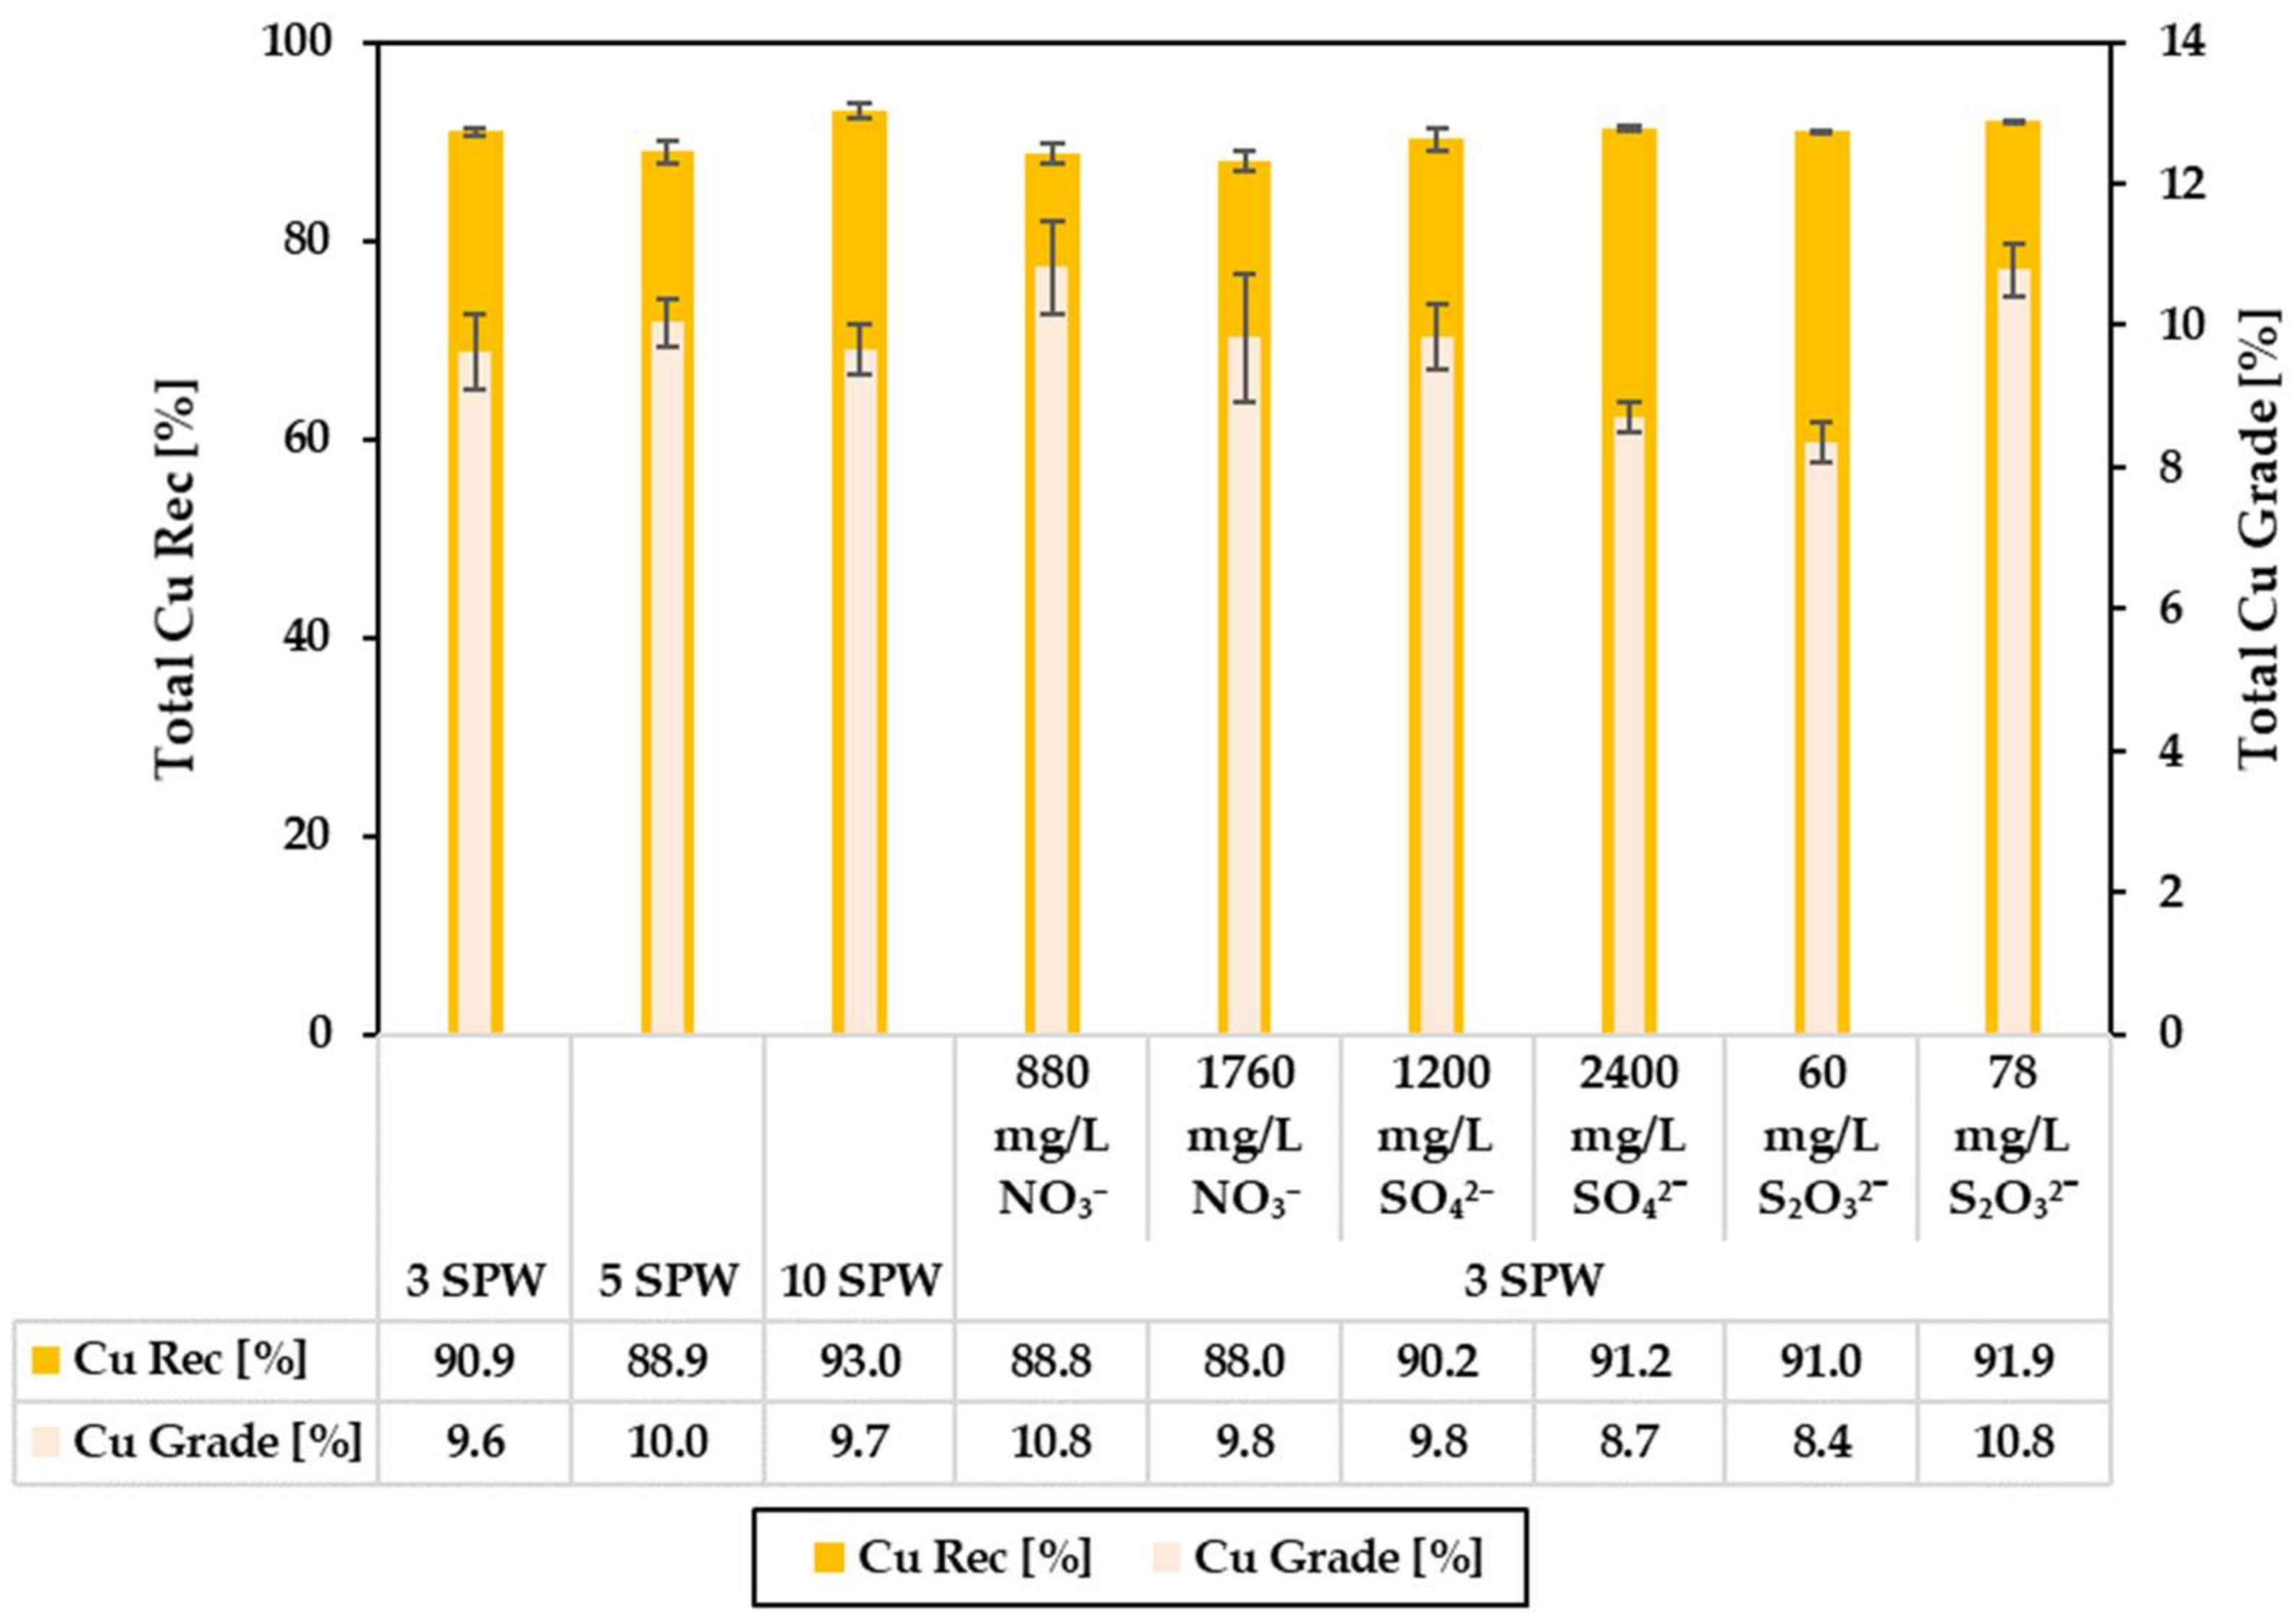
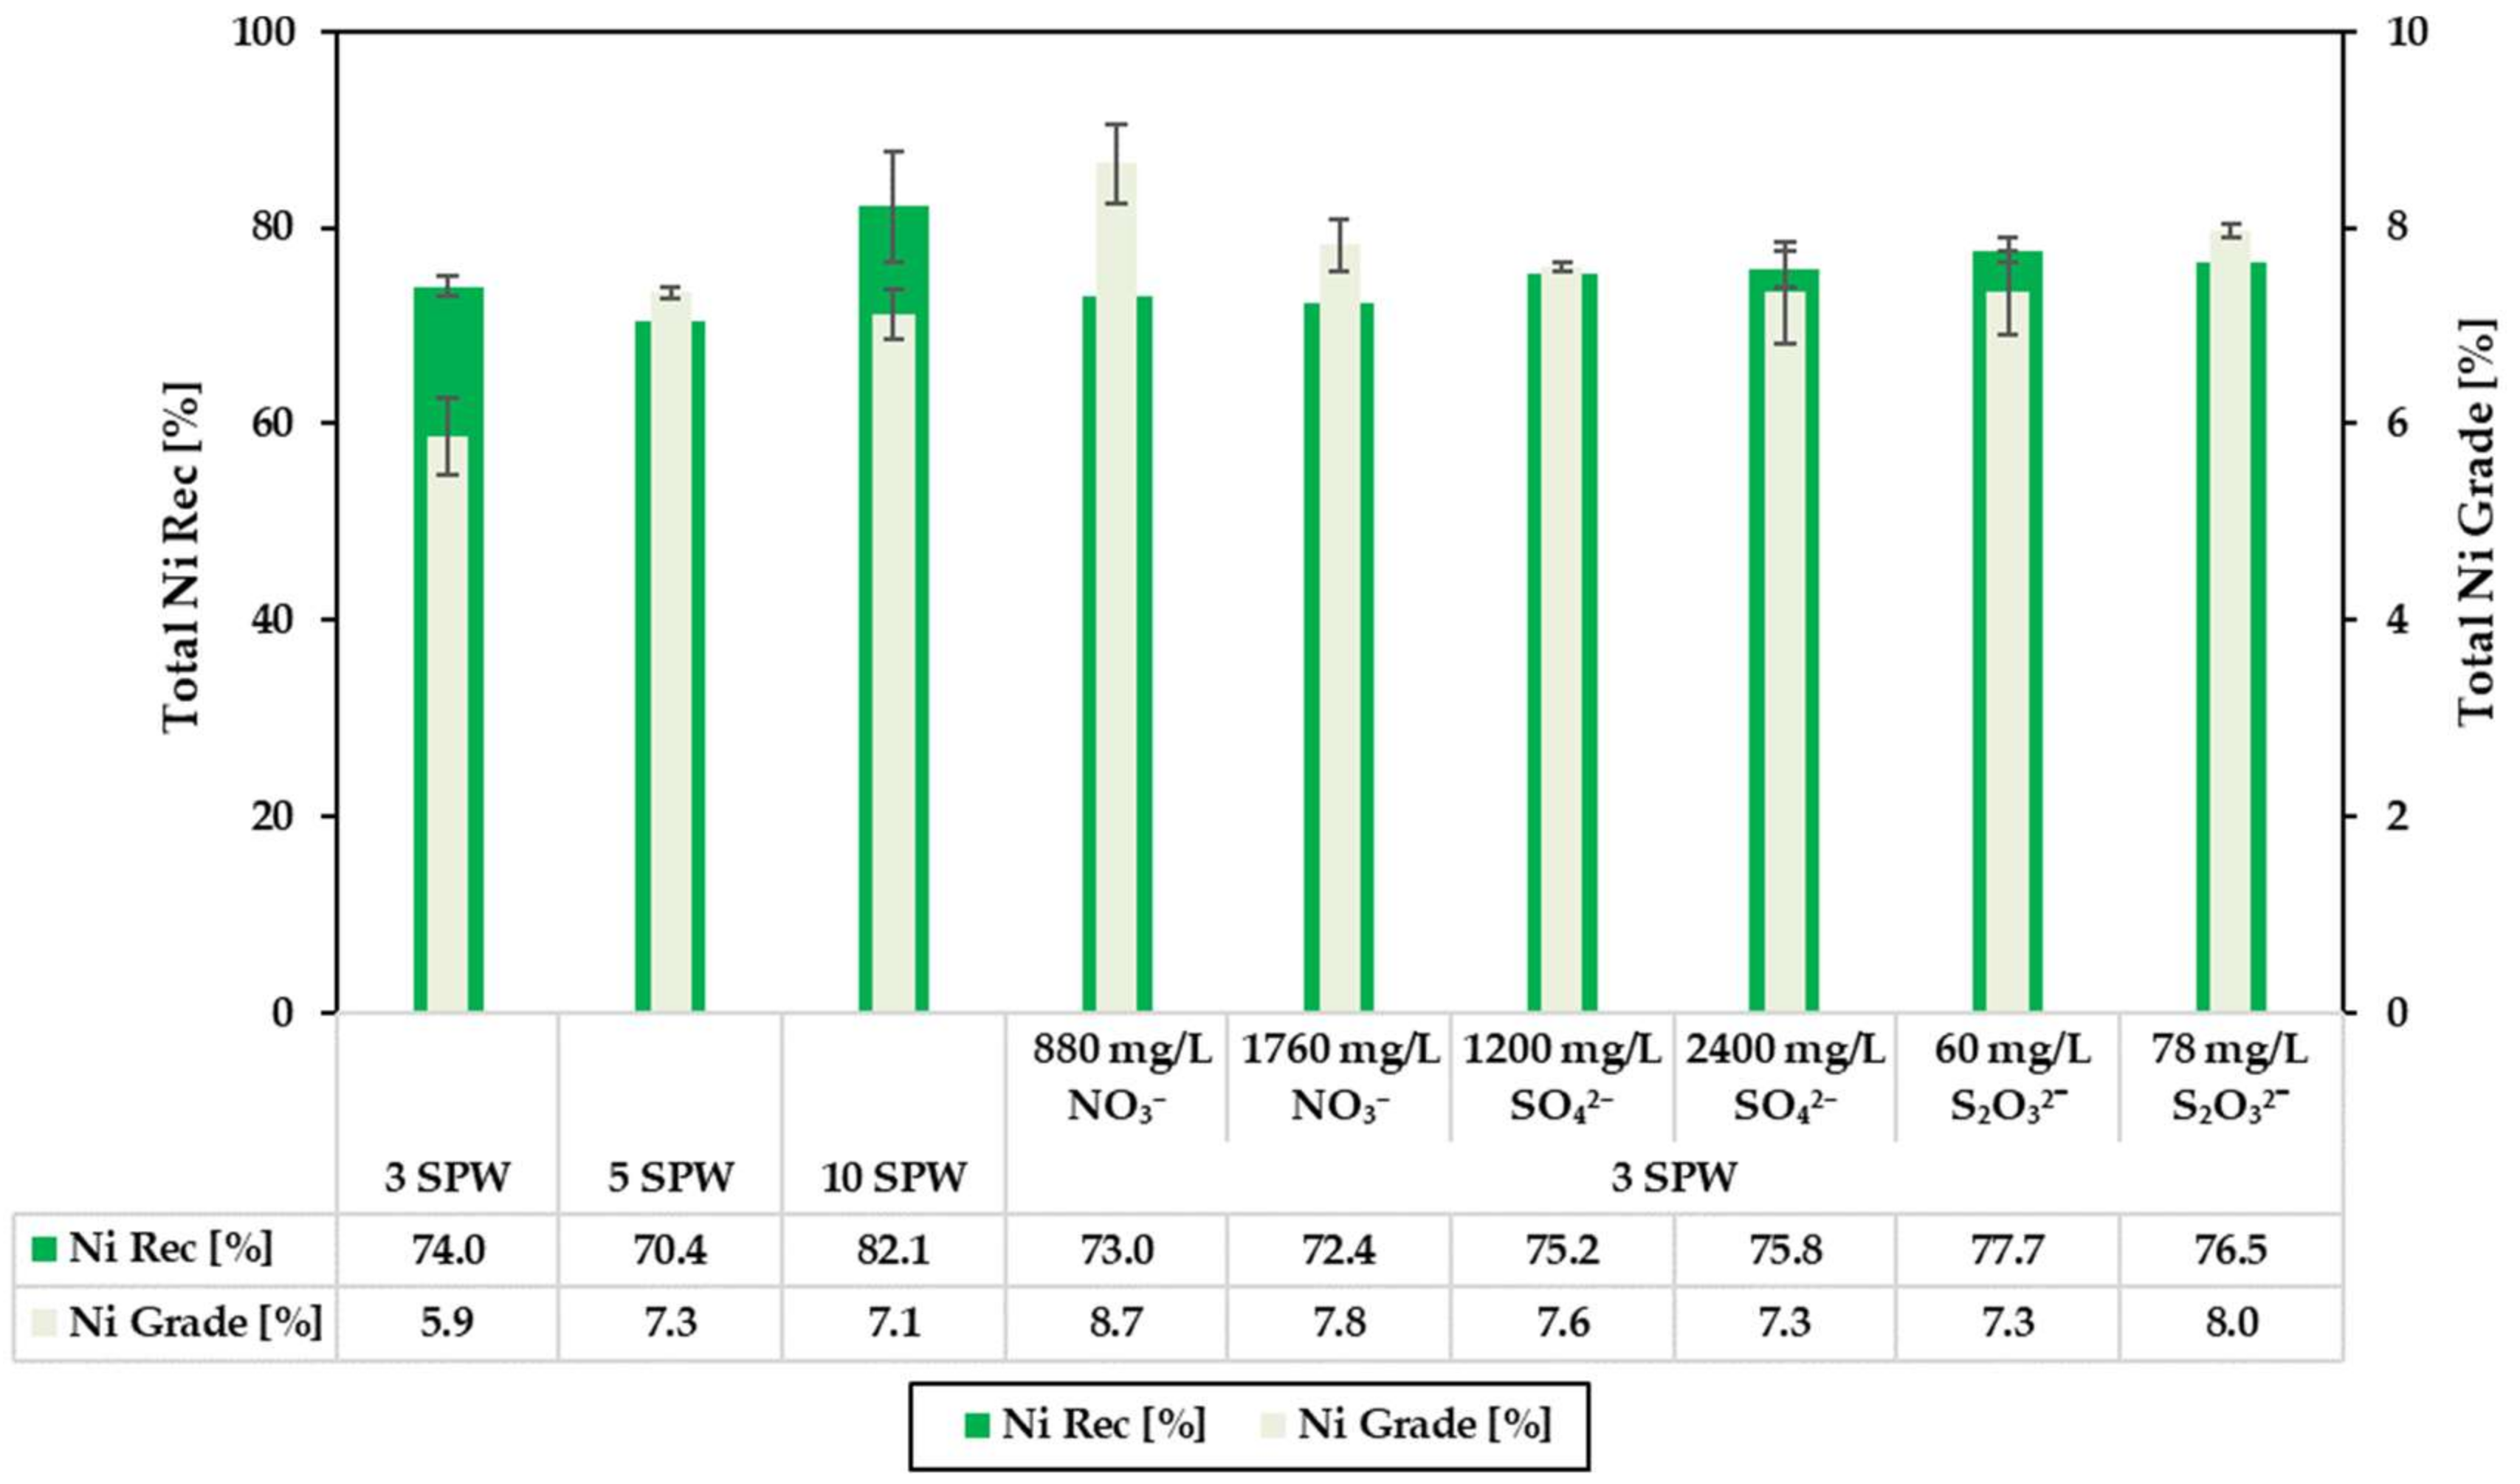
3.2. Effect of Increased NO3−, SO42− and S2O32− Concentration in Process Water on Recoveries and Grades
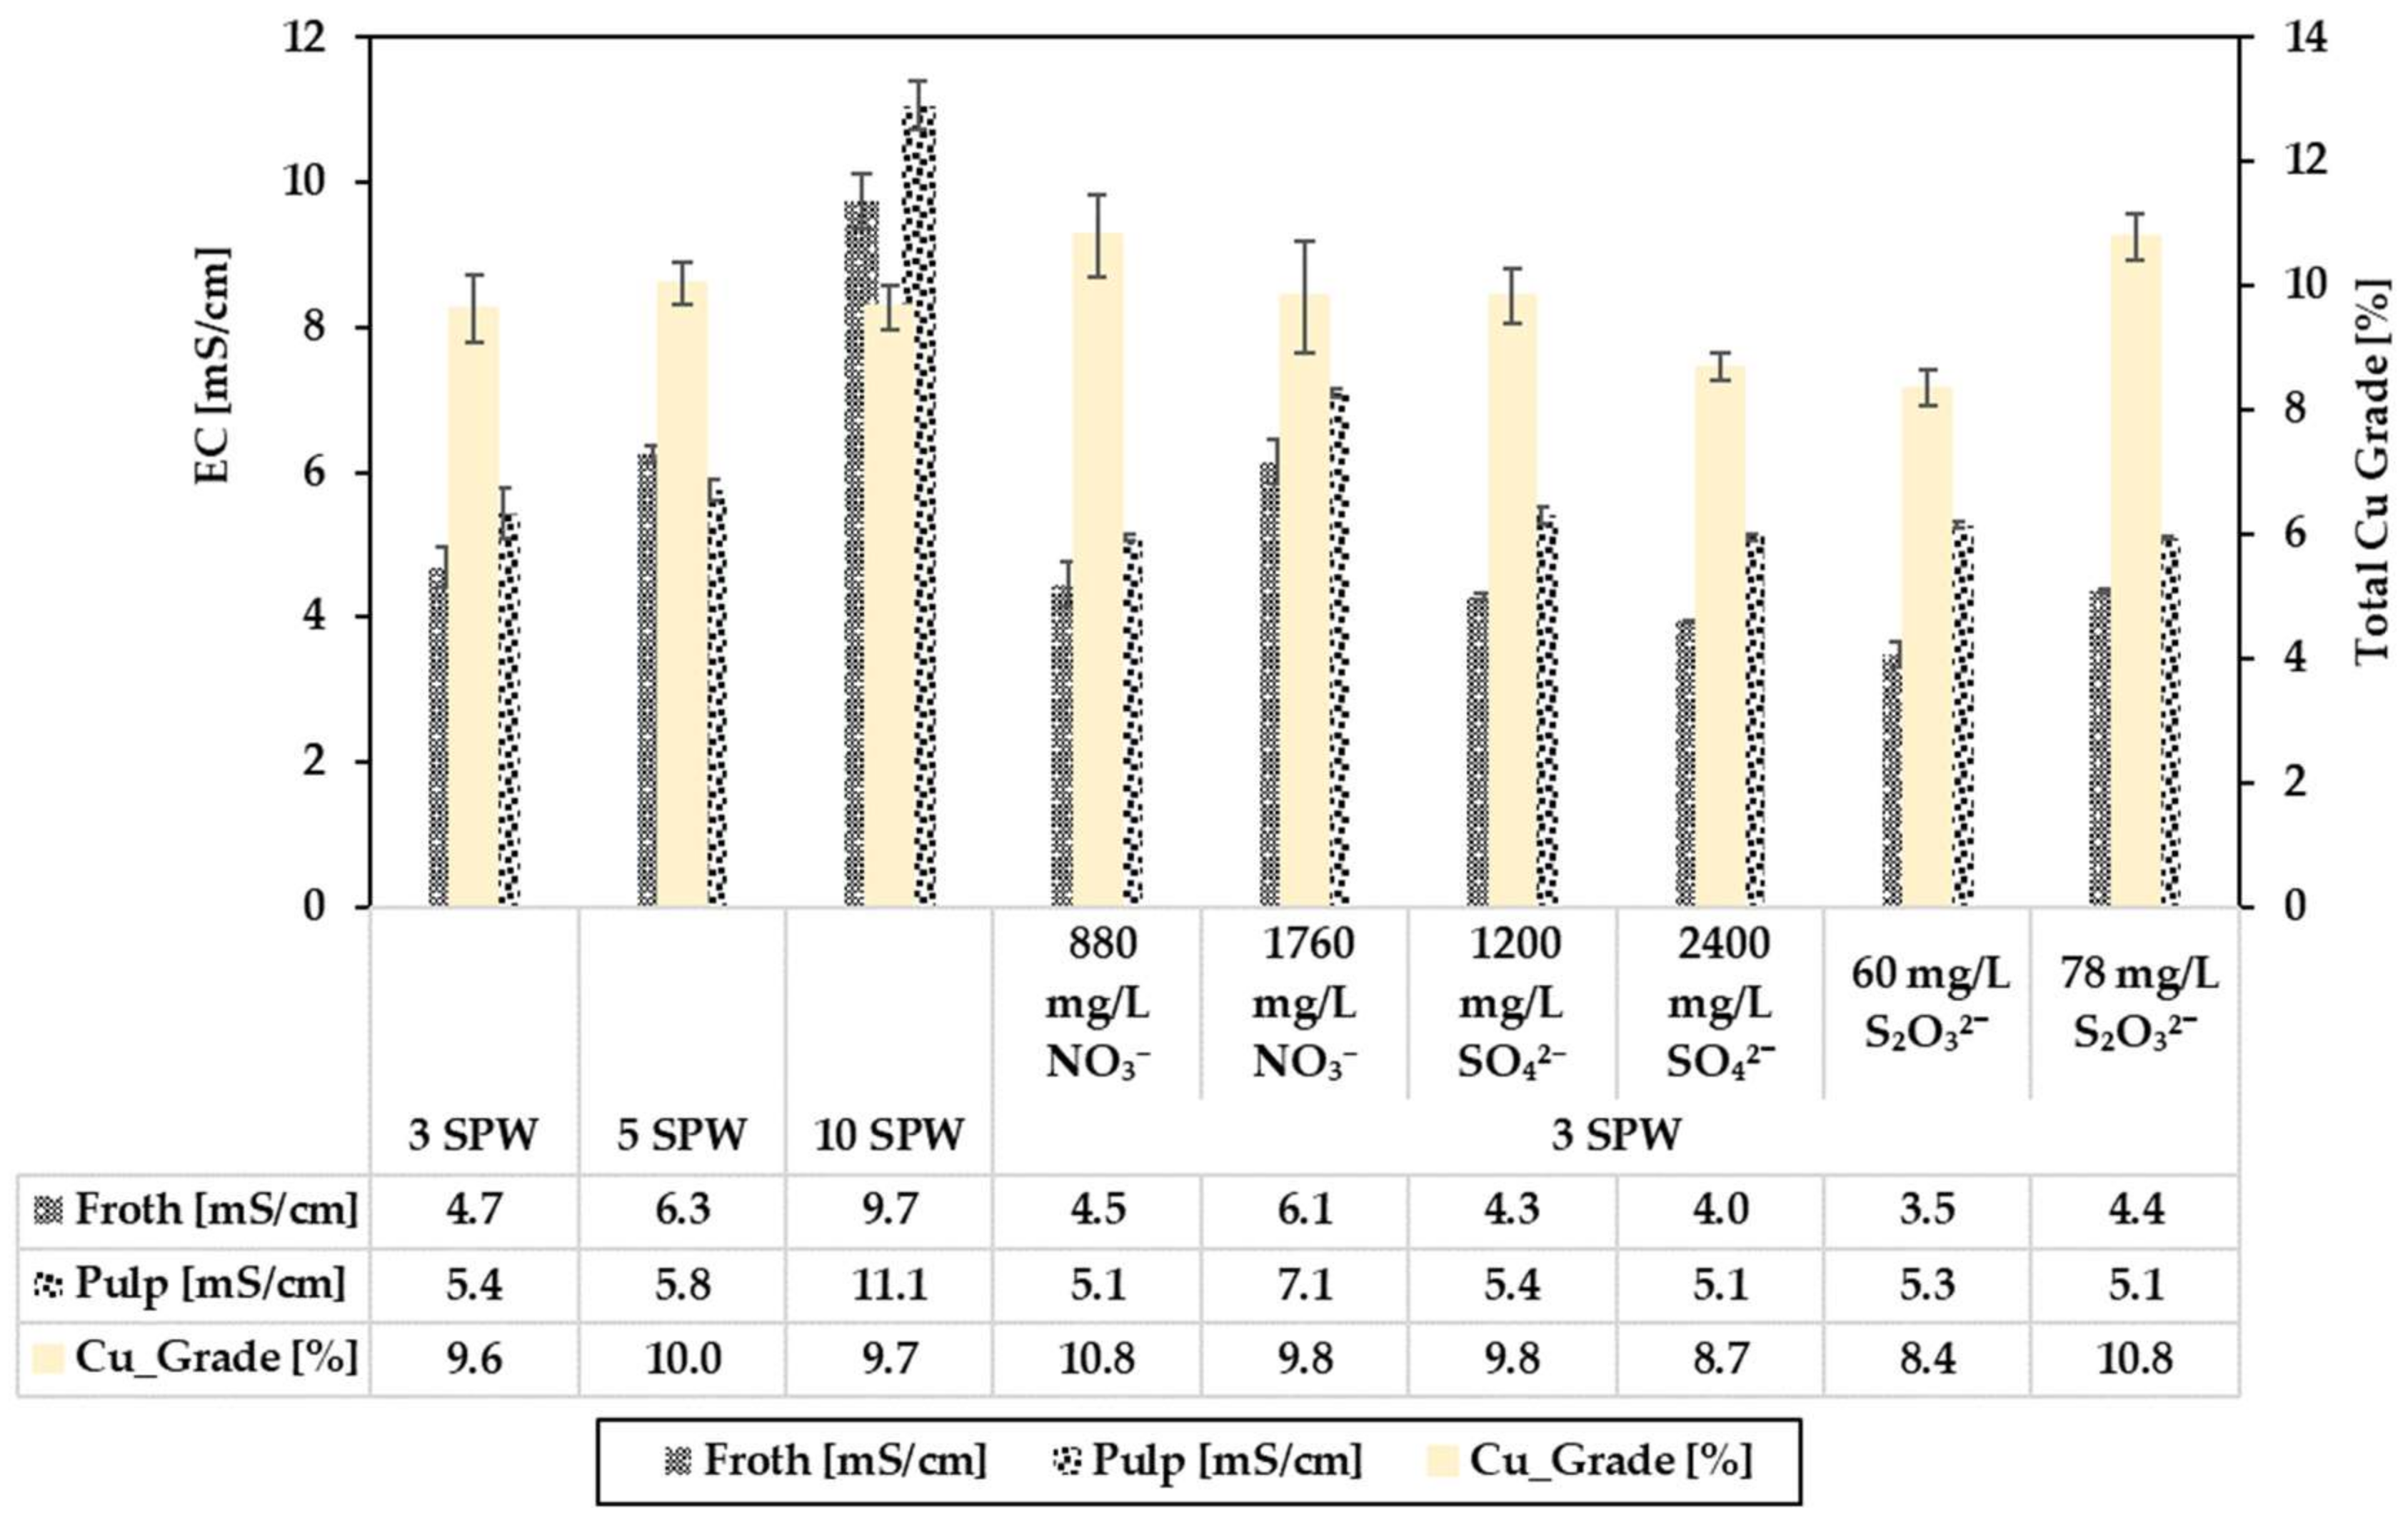
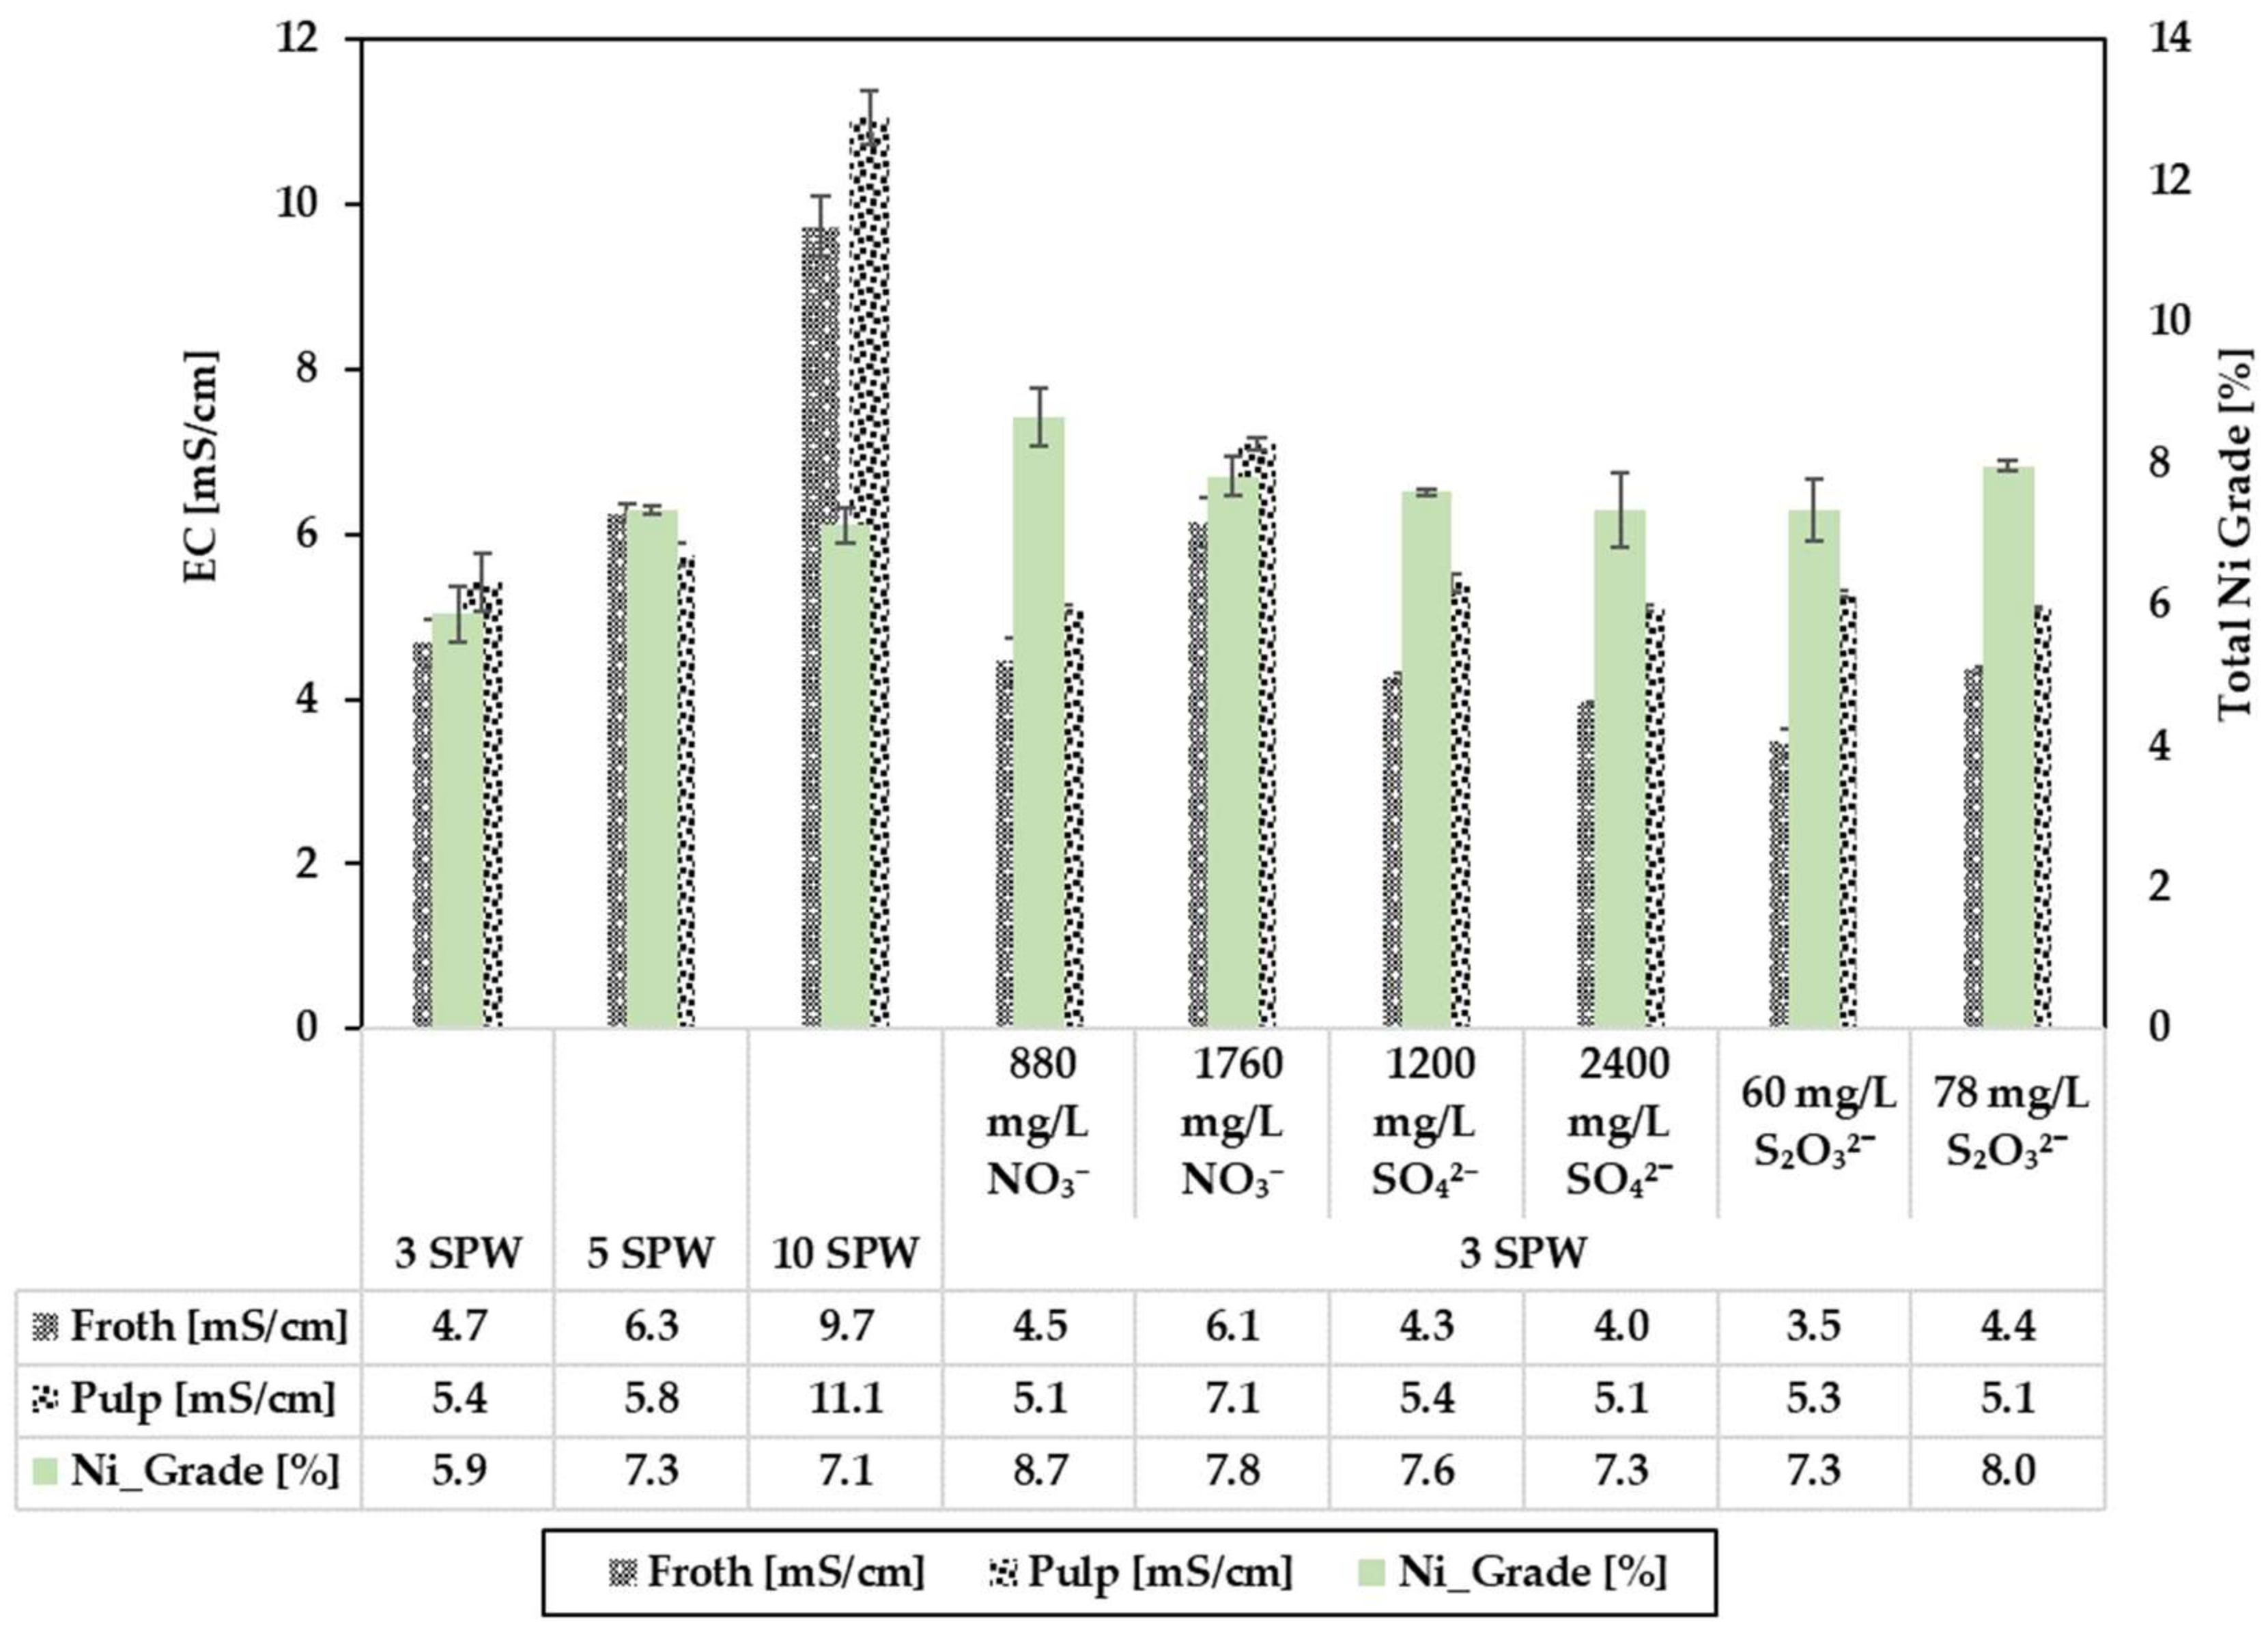
3.3. Relating the Effect of Spiking NO3−, SO42− and S2O32− on the Electrical Conductivity (EC) to Flotation Performance
4. Discussion
4.1. Effect of Spiking 3 SPW with NO3− on Flotation Performance
4.2. Effect of Spiking 3 SPW with SO42− on Flotation Performance
4.3. Effect of Spiking 3 SPW with S2O32− on Flotation Performance
5. Conclusions
Author Contributions
Funding
Acknowledgments
Conflicts of Interest
References
- Dzingai, M. The effect of ion accumulation owing to water recycling on flotation performance. Master’s Thesis, The University of Cape Town, Cape Town, South Africa, 2019. [Google Scholar]
- Muzenda, E. An Investigation into the Effect of Water Quality on Flotation Performance. World Acad. Sci. Eng. Technol. 2010, 70, 237–241. [Google Scholar]
- Haggard, E.L.; Sheridan, C.M.; Harding, K.G. Quantification of water usage at a South African platinum processing plant. Water SA 2015, 41, 279–286. [Google Scholar] [CrossRef]
- Slatter, K.A.; De Vaux, D.; Plint, N.D.; Cole, M.; Dilsook, V.; Palm, O.B. Water management in anglo platinum process operations: Effects of water quality on process operations. In Proceedings of the International Mine Water Conference, Pretoria, South Africa, 19–23 October 2009; pp. 46–55. [Google Scholar]
- Ikumapayi, F.; Hanumantha, R. Mineral Processing and Extractive Metallurgy Review: Recycling Process Water in Complex Sulphide Ore Flotation: Effect of Calcium and Sulphate on Sulphide. Miner. Process. Extr. Met. Rev. 2015, 36, 45–64. [Google Scholar] [CrossRef]
- Bradshaw, D.J.; Harris, P.J.; Connor, C.T.O. Synergistic interactions between reagents in sulphide flotation. J. S. Afr. Inst. Miner. Metall. 1998, 98, 187–192. [Google Scholar]
- Laskowski, J.S.; Castro, S. Hydrolysis of metallic ions in mineral processing circuits and its effect on flotation. In Proceedings of the COM Conference of Metallurgists, Vancouver, BC, Canada, 27–30 August 2017. [Google Scholar]
- Dzingai, M.; Manono, M.; Corin, K. Simulating the Effect of Water Recirculation on Flotation through Ion-Spiking: Effect of Ca2+ and Mg2+. Minerals 2020, 10, 1033. [Google Scholar] [CrossRef]
- Finkelstein, N.P.; Lovell, V.M. Fundamental studies of the flotation process: The work of the National Institute for Metallurgy. J. S. Afr. Inst. Miner. Metall. 1972, 72, 15. [Google Scholar]
- Davis, F.; Hyatt, D.; Cox, C. Environmental Problems of Flotation Reagents in Mineral Processing Plant Tailings Water Mineral Processing Plant Tailings Water; U.S. Department of the Interior: Washington, DC, USA, 1975. [Google Scholar]
- Klimpel, R.R. The effect of water chemistry, reagent type, and other environmental factors on the performance of industrial grinding and flotation processes involving sulfide minerals. In Proceedings of the XX International Mineral Processing Congress Proceedings, Aachen, Germany, 21–26 September 1997. [Google Scholar]
- Ikumapayi, F.; Makitalo, M.; Johansson, B.; Hanumantha, K. Recycling of process water in sulphide flotation. Effect of calcium and sulphate ions on flotation of galena. Miner. Eng. 2012, 39, 77–88. [Google Scholar] [CrossRef]
- Muzinda, I.; Schreithofer, N. Water quality effects on flotation: Impacts and control of residual xanthates. Miner. Eng. 2018, 125, 34–41. [Google Scholar] [CrossRef]
- Craig, V.; Ninham, B.; Pashley, R. The effect of electrolytes on bubble coalescence in water. J. Phys. Chem. 1993, 39, 10192–10197. [Google Scholar] [CrossRef]
- Levay, G.; Smart, R.; Skinner, W. The impact of water quality on flotation performance. J. S. Afr. Inst. Miner. Metall. 2001, 1, 69–76. [Google Scholar]
- Corin, K.C.; Corin, K.C.; Reddy, A.; Miyen, L.; Wiese, J.G.; Harris, P.J. The effect of ionic strength of plant water on valuable mineral and gangue recovery in a platinum bearing ore from the Merensky reef. Miner. Eng. 2011, 24, 131–137. [Google Scholar] [CrossRef]
- Manono, M.S.; Corin, K.C.; Wiese, J.G. An investigation into the effect of various ions and their ionic strength on the flotation performance of a platinum bearing ore from the Merensky reef. Miner. Eng. 2012, 38, 231–236. [Google Scholar] [CrossRef]
- Manono, M.; Corin, K.; Wiese, J. Perspectives from literature on the influence of inorganic electrolytes present in plant water on flotation performance. Physicochem. Probl. Miner. Process. 2018, 54, 1191–1214. [Google Scholar]
- Manono, M.S.; Corin, K.C.; Wiese, J.G. The influence of electrolytes present in process water on the flotation behaviour of a Cu-Ni containing ore. Miner. Eng. 2016, 96–97, 99–107. [Google Scholar] [CrossRef]
- Manono, M.S.; Corin, K.C.; Wiese, J.G. The Behavior of Gangue during the Flotation of a Sulfidic PGM-Bearing Ore in Response to Various Monovalent and Divalent Ions in Process Water. Front. Chem. 2020, 8, 1–12. [Google Scholar] [CrossRef]
- Wiese, J.; Harris, P.; Bradshaw, D. The influence of the reagent suite on the flotation of ores from the Merensky reef. Miner. Eng. 2005, 18, 189–198. [Google Scholar] [CrossRef]
- Schreithofer, N.; Muzinda, I. Boliden Kevitsa Mine Report; NI 43-101; New Boliden: Sodankylä, Finland, 2017. [Google Scholar]
- Musuku, B.; Muzinda, I.; Lumsden, B. Cu-Ni processing improvements at First Quantum’s Kevitsa mine. Miner. Eng. 2016, 88, 9–17. [Google Scholar] [CrossRef]
- Manono, M.S.; Corin, K.C.; Wiese, J.G. The effect of ionic strength of plant water on foam stability: A 2phase flotation study. Miner. Eng. 2013, 40, 42–47. [Google Scholar] [CrossRef]
- Corin, K.C.; Wiese, J.G. Investigating froth stability: A comparative study of ionic strength and frother dosage. Miner. Eng. 2014, 66–68, 130–134. [Google Scholar] [CrossRef]
- Becker, M.; Harris, P.J.; Wiese, J.G.; Bradshaw, D.J. International Journal of Mineral Processing Mineralogical characterisation of naturally fl oatable gangue in Merensky Reef ore flotation. Int. J. Miner. Process. 2009, 93, 246–255. [Google Scholar] [CrossRef]
- Bulut, G.; Yenial, Ü. Effects of major ions in recycled water on sulfide minerals flotation. Miner. Met. Process. 2016, 33, 137–143. [Google Scholar] [CrossRef]
- October, L.L.; Corin, K.C.; Manono, M.S.; Schreithofer, N.; Wiese, J.G. A fundamental study considering specific ion effects on the attachment of sulfide minerals to air bubbles A fundamental study considering specific ion effects on the attachment of sulfide minerals to air bubbles. Miner. Eng. 2020, 151, 106313. [Google Scholar] [CrossRef]
- Chau, T. A review of techniques for measurement of contact angles and their applicability on mineral surfaces. Miner. Eng. 2009, 22, 213–219. [Google Scholar] [CrossRef]
- Hodgson, M.; Agar, G.E. Eilectrochemical Investigations into the Flotation Chemistry of Pentlandite and Pyrrhotite: Process Water and Xanthate Interactions. Can. J. Metall. Mater. Sci. 1989, 28, 189–198. [Google Scholar] [CrossRef]
- Kirjavainen, V.; Schreithofer, N.; Heiskanen, K. Effect of calcium and thiosulfate ions on flotation selectivity of nickel-copper ores. Miner. Eng. 2002, 15, 1–5. [Google Scholar] [CrossRef]


| Water Type | Ca2+ (mg/L) | Mg2+ (mg/L) | Na+ (mg/L) | Cl− (mg/L) | NO3− (mg/L) | SO42− (mg/L) | S2O32− (mg/L) | CO32− (mg/L) | TDS (mg/L) | I.S. (M) |
|---|---|---|---|---|---|---|---|---|---|---|
| 1 SPW | 80 | 70 | 153 | 287 | 176 | 240 | - | 17 | 1023 | 0.024 |
| 3 SPW | 240 | 210 | 459 | 861 | 528 | 720 | - | 51 | 3069 | 0.073 |
| 5 SPW | 400 | 350 | 765 | 1435 | 880 | 1200 | - | 85 | 5115 | 0.121 |
| 10 SPW | 800 | 700 | 1530 | 2870 | 1760 | 2400 | - | 170 | 10230 | 0.242 |
| Spiked 3 SPW | ||||||||||
| 3 SPW + 352 mg/L NO3− | 240 | 210 | 772 | 861 | 880 | 720 | - | 51 | 3734 | 0.082 |
| 3 SPW + 1232 mg/L NO3− | 240 | 210 | 1555 | 861 | 1760 | 720 | - | 51 | 5397 | 0.106 |
| 3 SPW + 480 mg/L SO42− | 240 | 210 | 647 | 861 | 528 | 1200 | - | 51 | 3737 | 0.087 |
| 3 SPW + 1680 mg/L SO42− | 240 | 210 | 1118 | 861 | 528 | 2400 | - | 51 | 5408 | 0.122 |
| 3 SPW + 60 mg/L S2O32− | 240 | 210 | 479 | 861 | 528 | 720 | 60 | 51 | 3149 | 0.074 |
| 3 SPW + 78 mg/L S2O32− | 240 | 210 | 485 | 861 | 528 | 720 | 78 | 51 | 3173 | 0.075 |
Publisher’s Note: MDPI stays neutral with regard to jurisdictional claims in published maps and institutional affiliations. |
© 2021 by the authors. Licensee MDPI, Basel, Switzerland. This article is an open access article distributed under the terms and conditions of the Creative Commons Attribution (CC BY) license (http://creativecommons.org/licenses/by/4.0/).
Share and Cite
Dzingai, M.; Manono, M.S.; Corin, K.C. Probing the Effect of Water Recycling on Flotation through Anion Spiking Using a Low-Grade Cu–Ni–PGM Ore: The Effect of NO3−, SO42− and S2O32−. Minerals 2021, 11, 340. https://doi.org/10.3390/min11040340
Dzingai M, Manono MS, Corin KC. Probing the Effect of Water Recycling on Flotation through Anion Spiking Using a Low-Grade Cu–Ni–PGM Ore: The Effect of NO3−, SO42− and S2O32−. Minerals. 2021; 11(4):340. https://doi.org/10.3390/min11040340
Chicago/Turabian StyleDzingai, Mathew, Malibongwe S. Manono, and Kirsten C. Corin. 2021. "Probing the Effect of Water Recycling on Flotation through Anion Spiking Using a Low-Grade Cu–Ni–PGM Ore: The Effect of NO3−, SO42− and S2O32−" Minerals 11, no. 4: 340. https://doi.org/10.3390/min11040340
APA StyleDzingai, M., Manono, M. S., & Corin, K. C. (2021). Probing the Effect of Water Recycling on Flotation through Anion Spiking Using a Low-Grade Cu–Ni–PGM Ore: The Effect of NO3−, SO42− and S2O32−. Minerals, 11(4), 340. https://doi.org/10.3390/min11040340