
Effects of Fe(III) Oxide Mineralogy and Phosphate on Fe(II) Secondary Mineral Formation during Microbial Iron Reduction

 ,
,  ,
,
Abstract
1. Introduction
2. Materials and Methods
2.1. Fe(III) Oxides
2.2. Bioreduction Experiments
2.3. Analytical Methods
3. Results
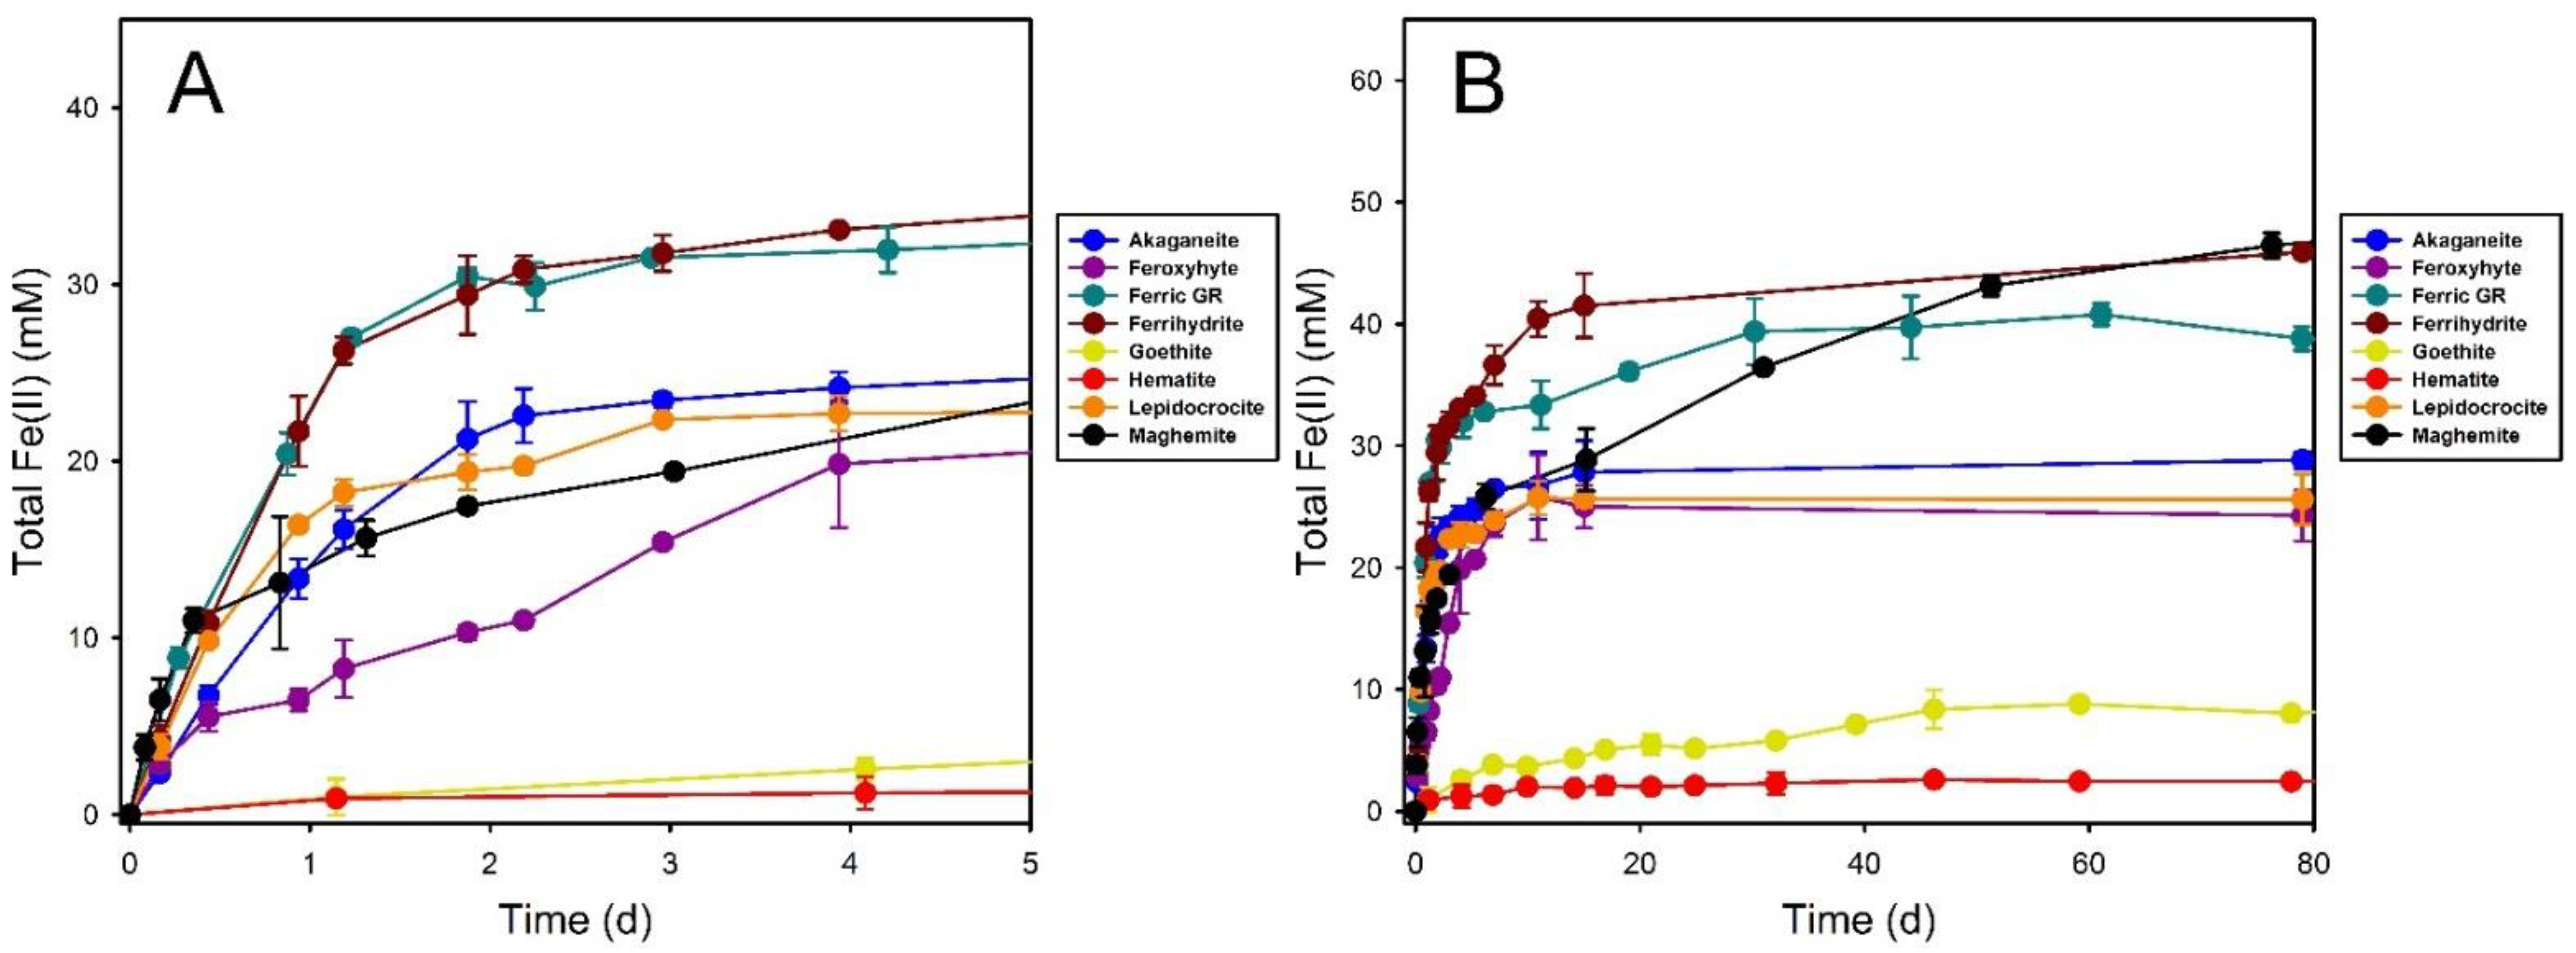
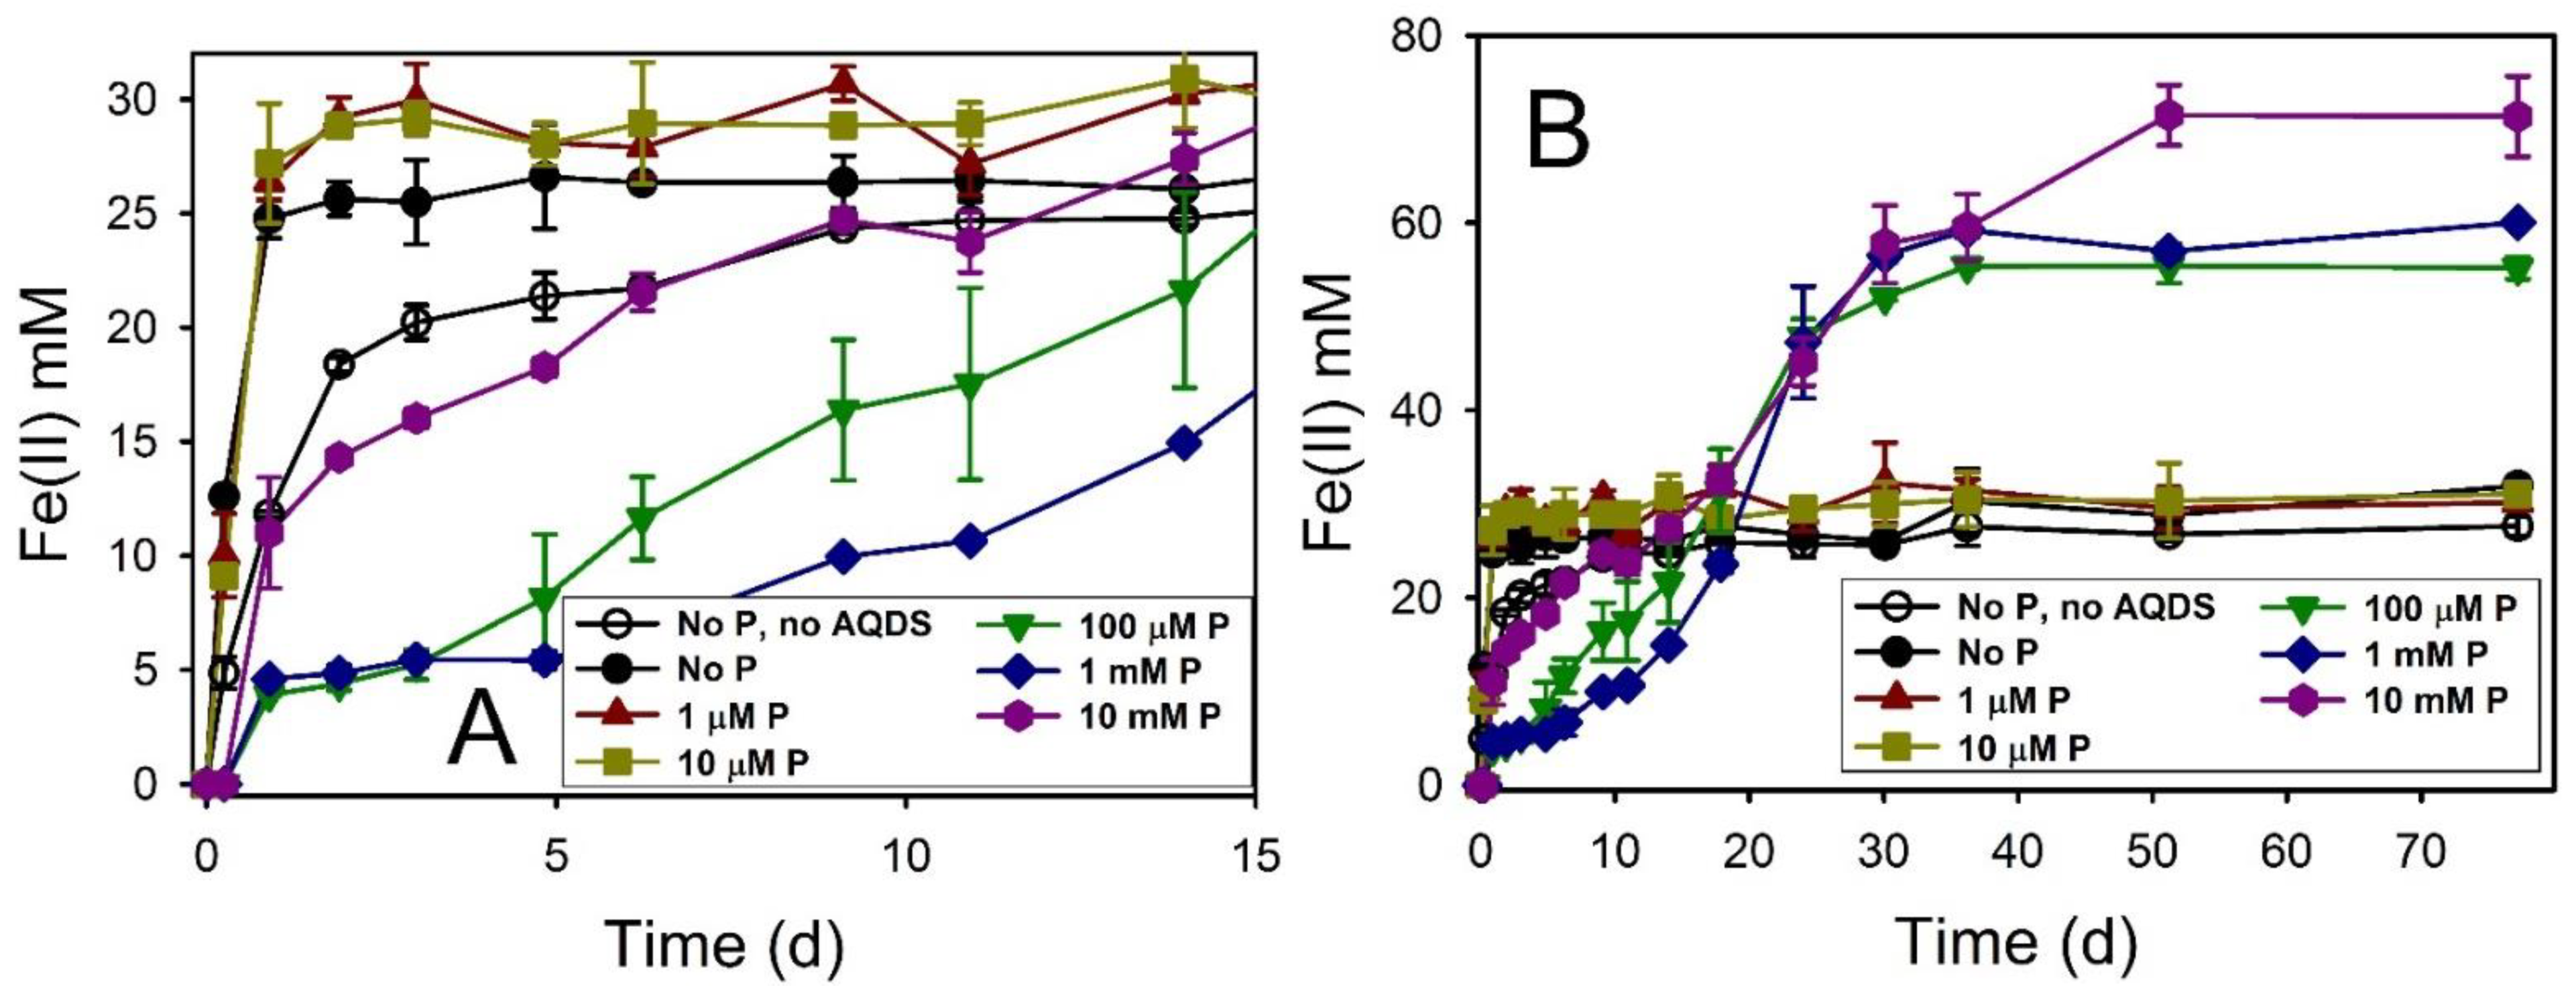
3.1. Fe(III) Oxide Bioreduction
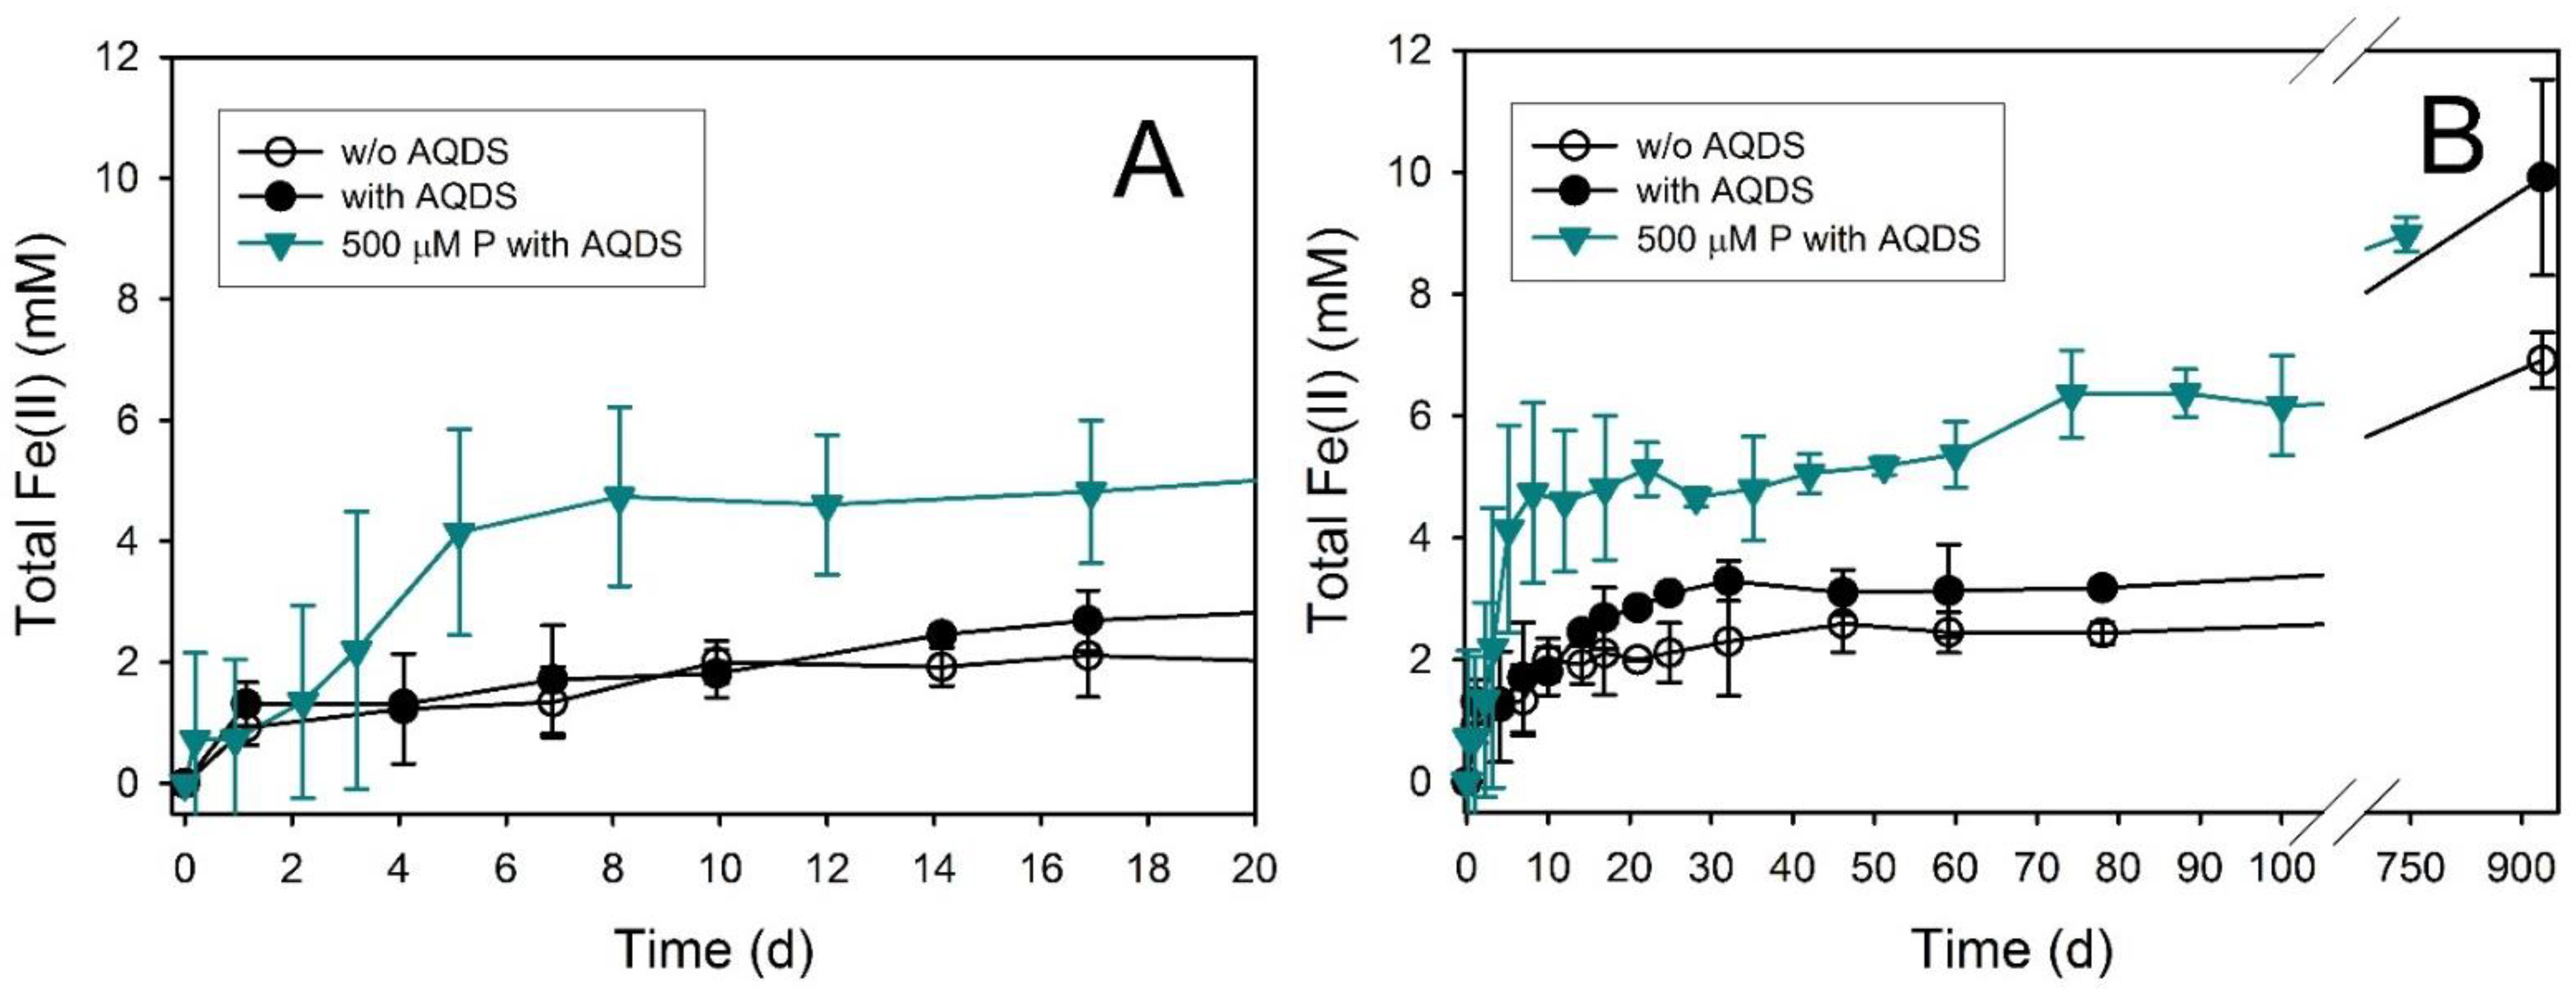
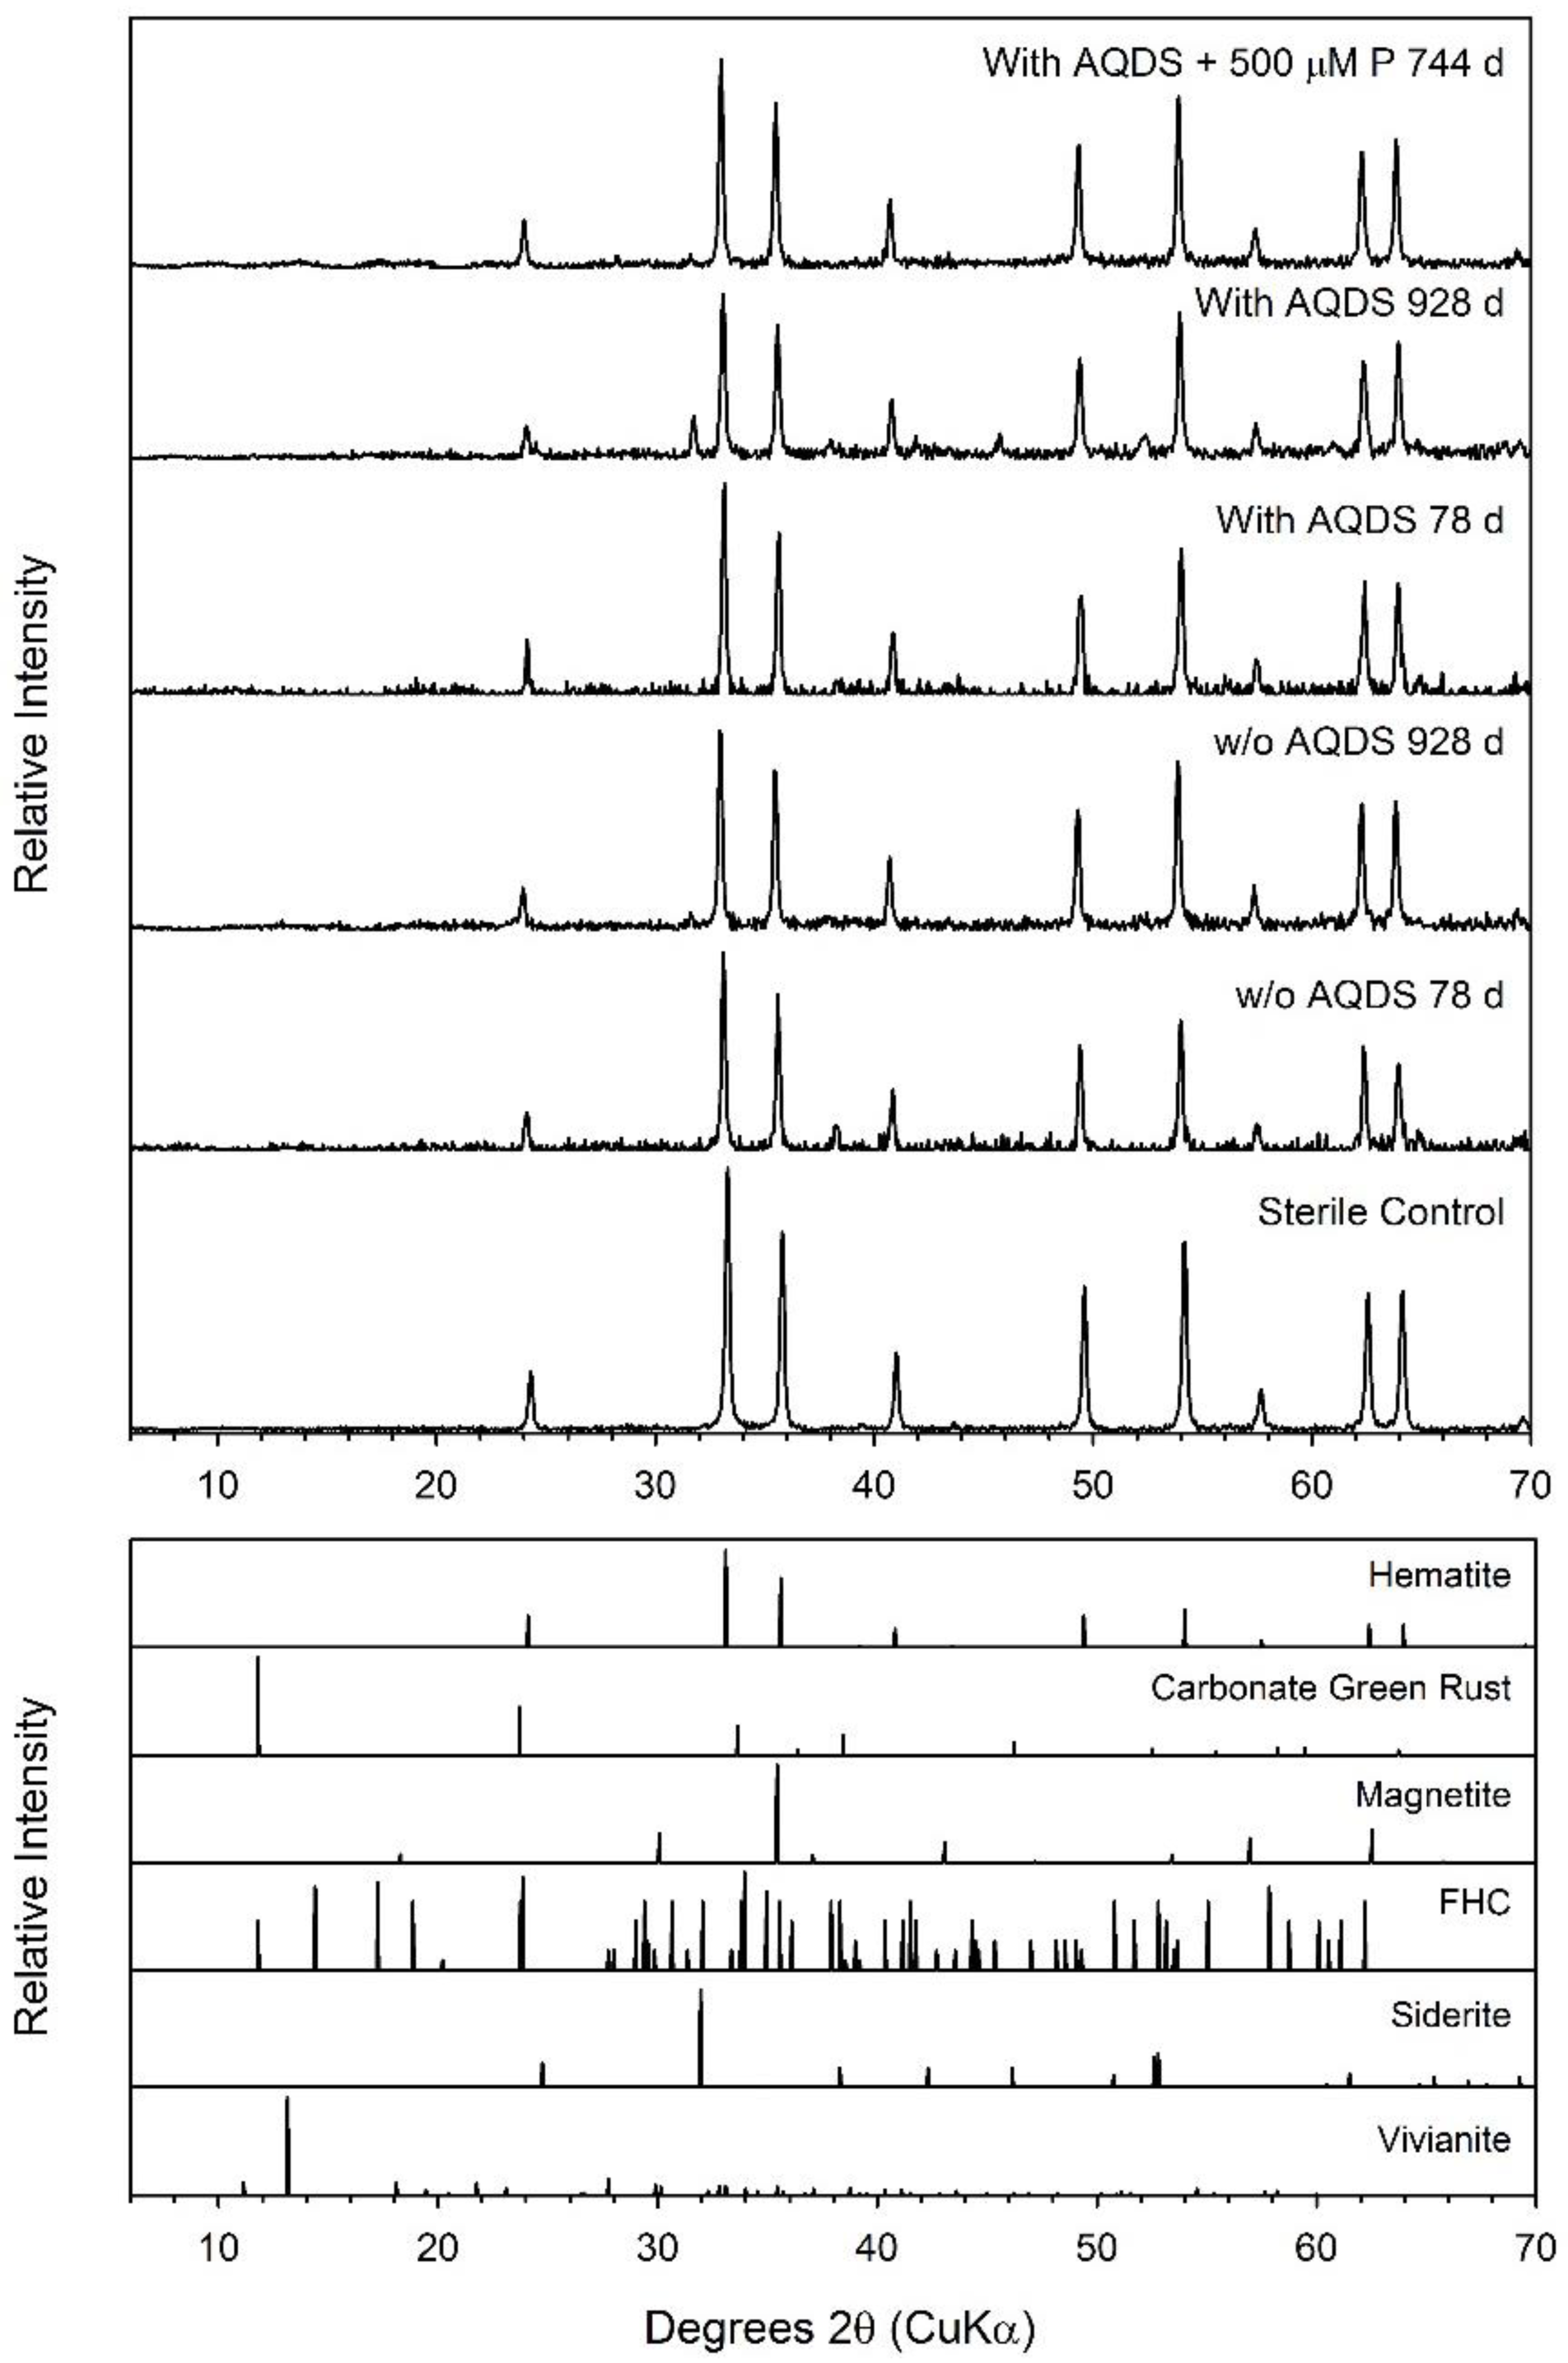
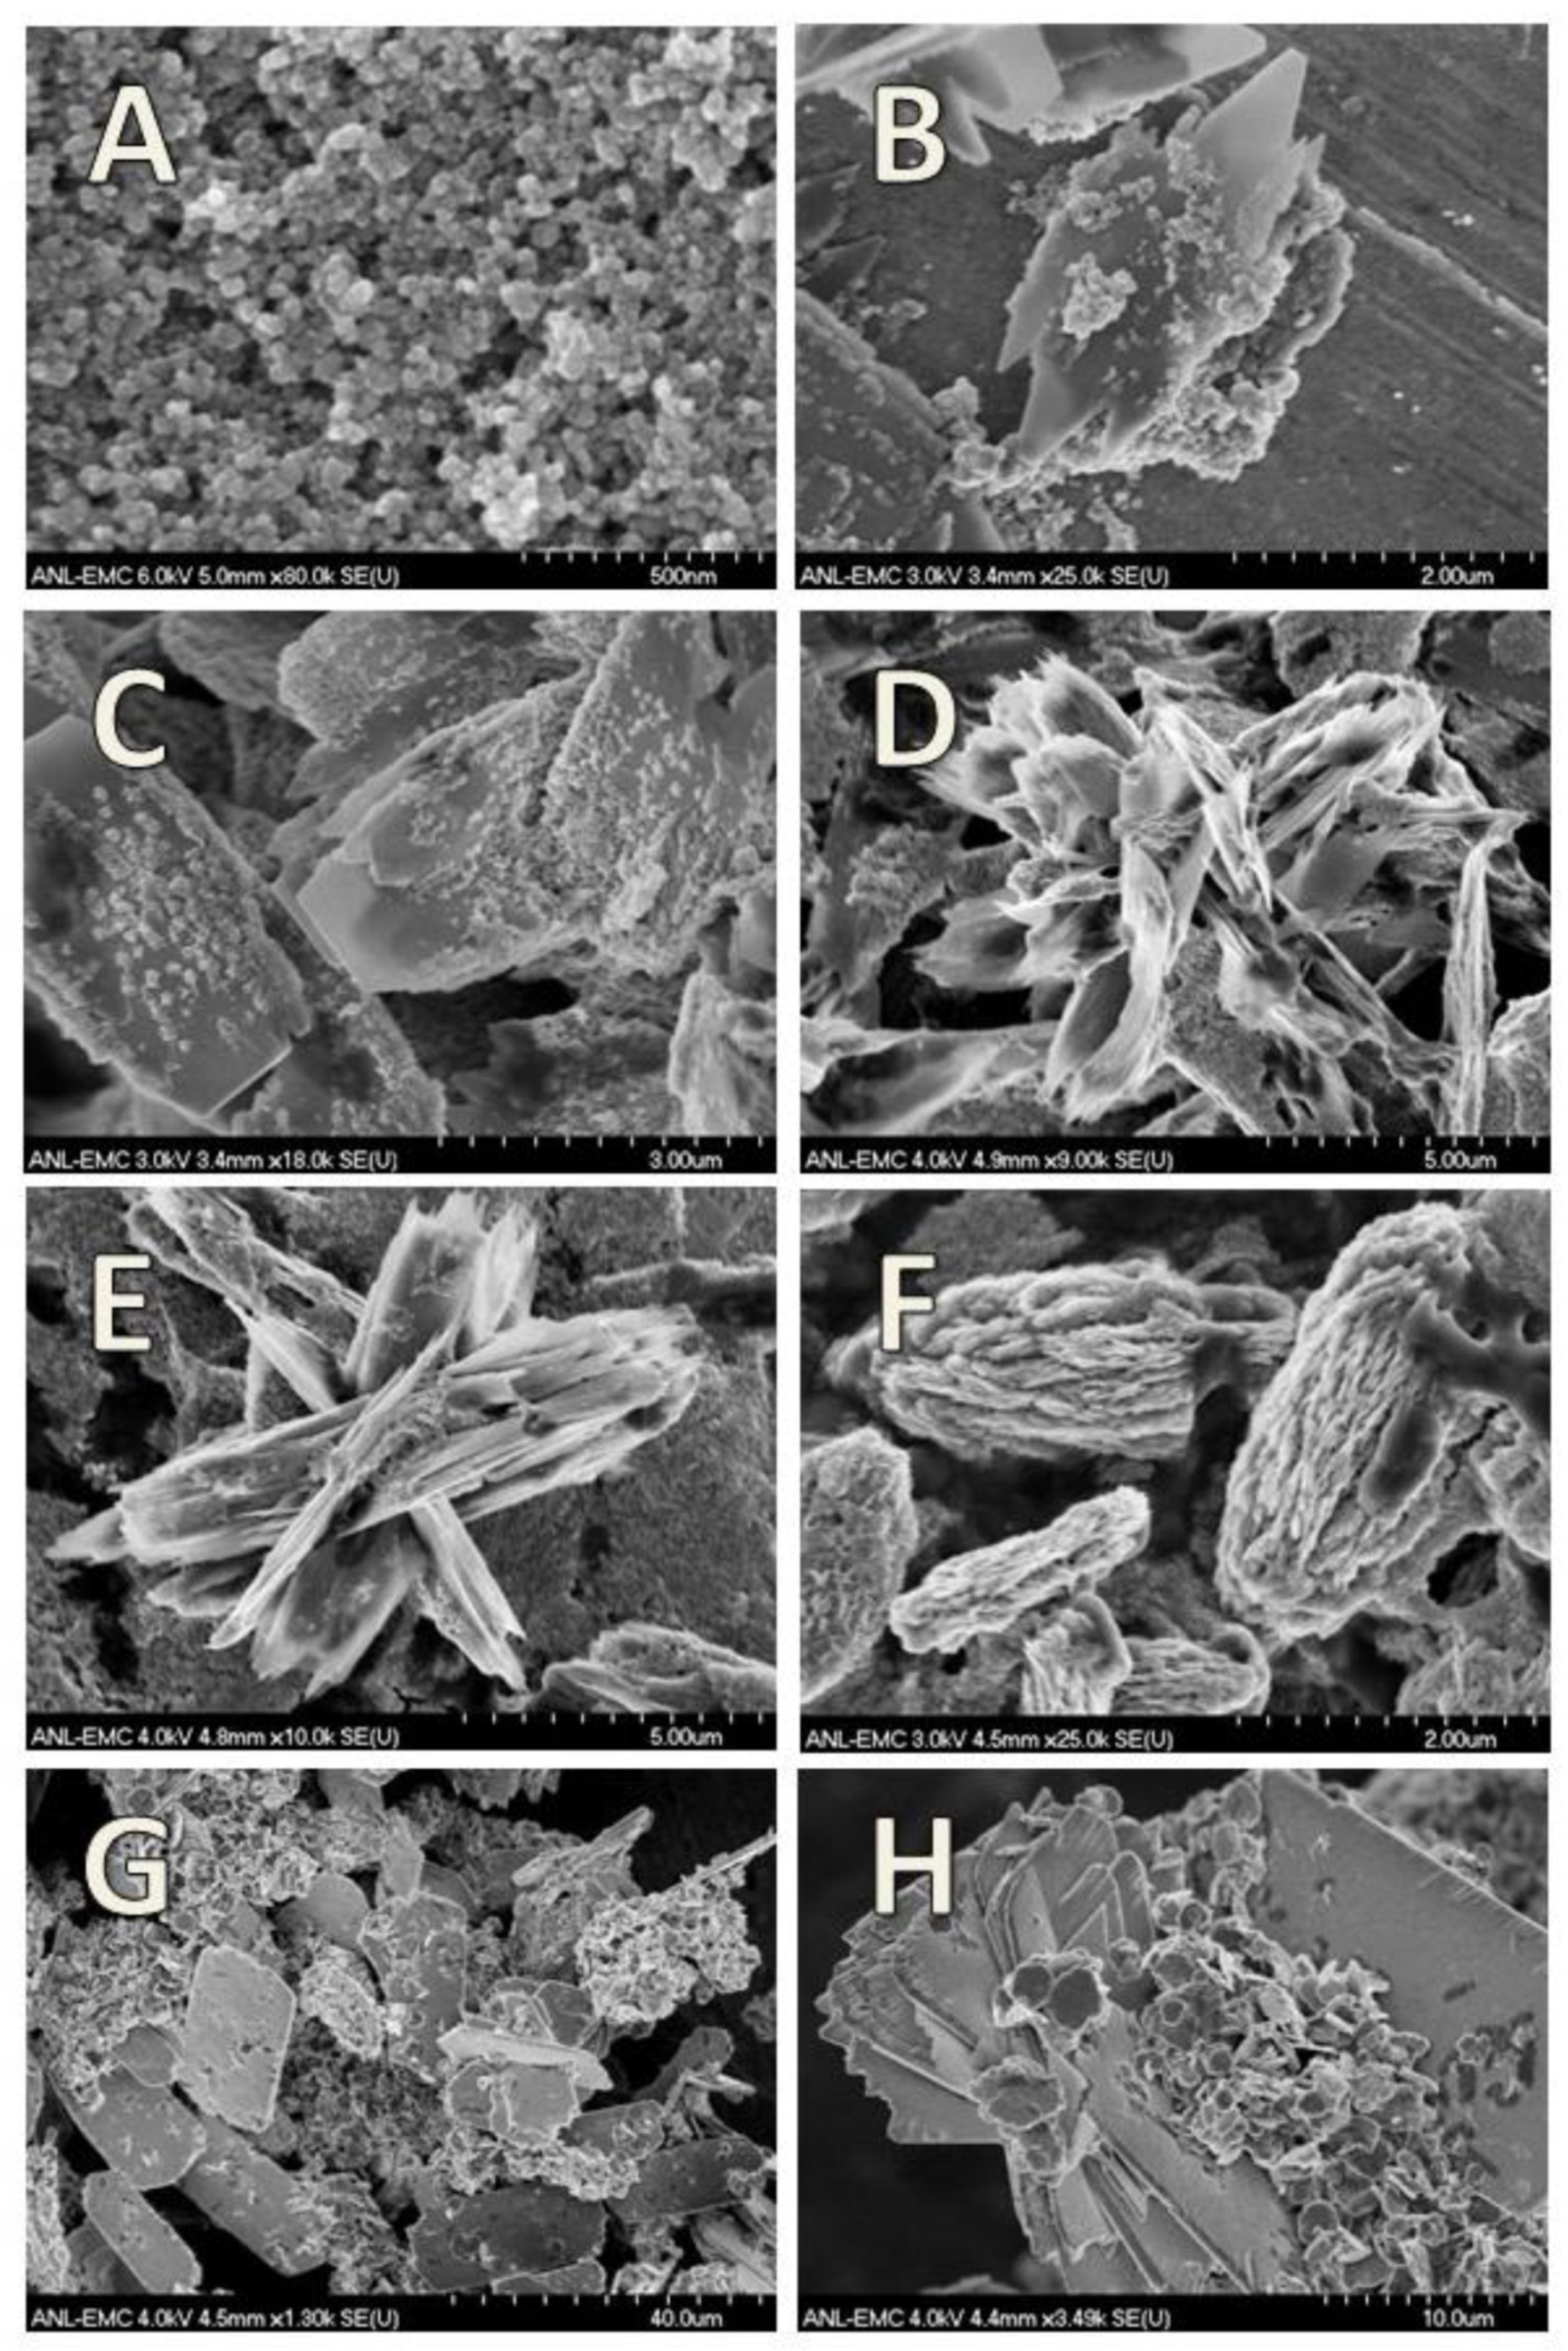
3.2. Hematite
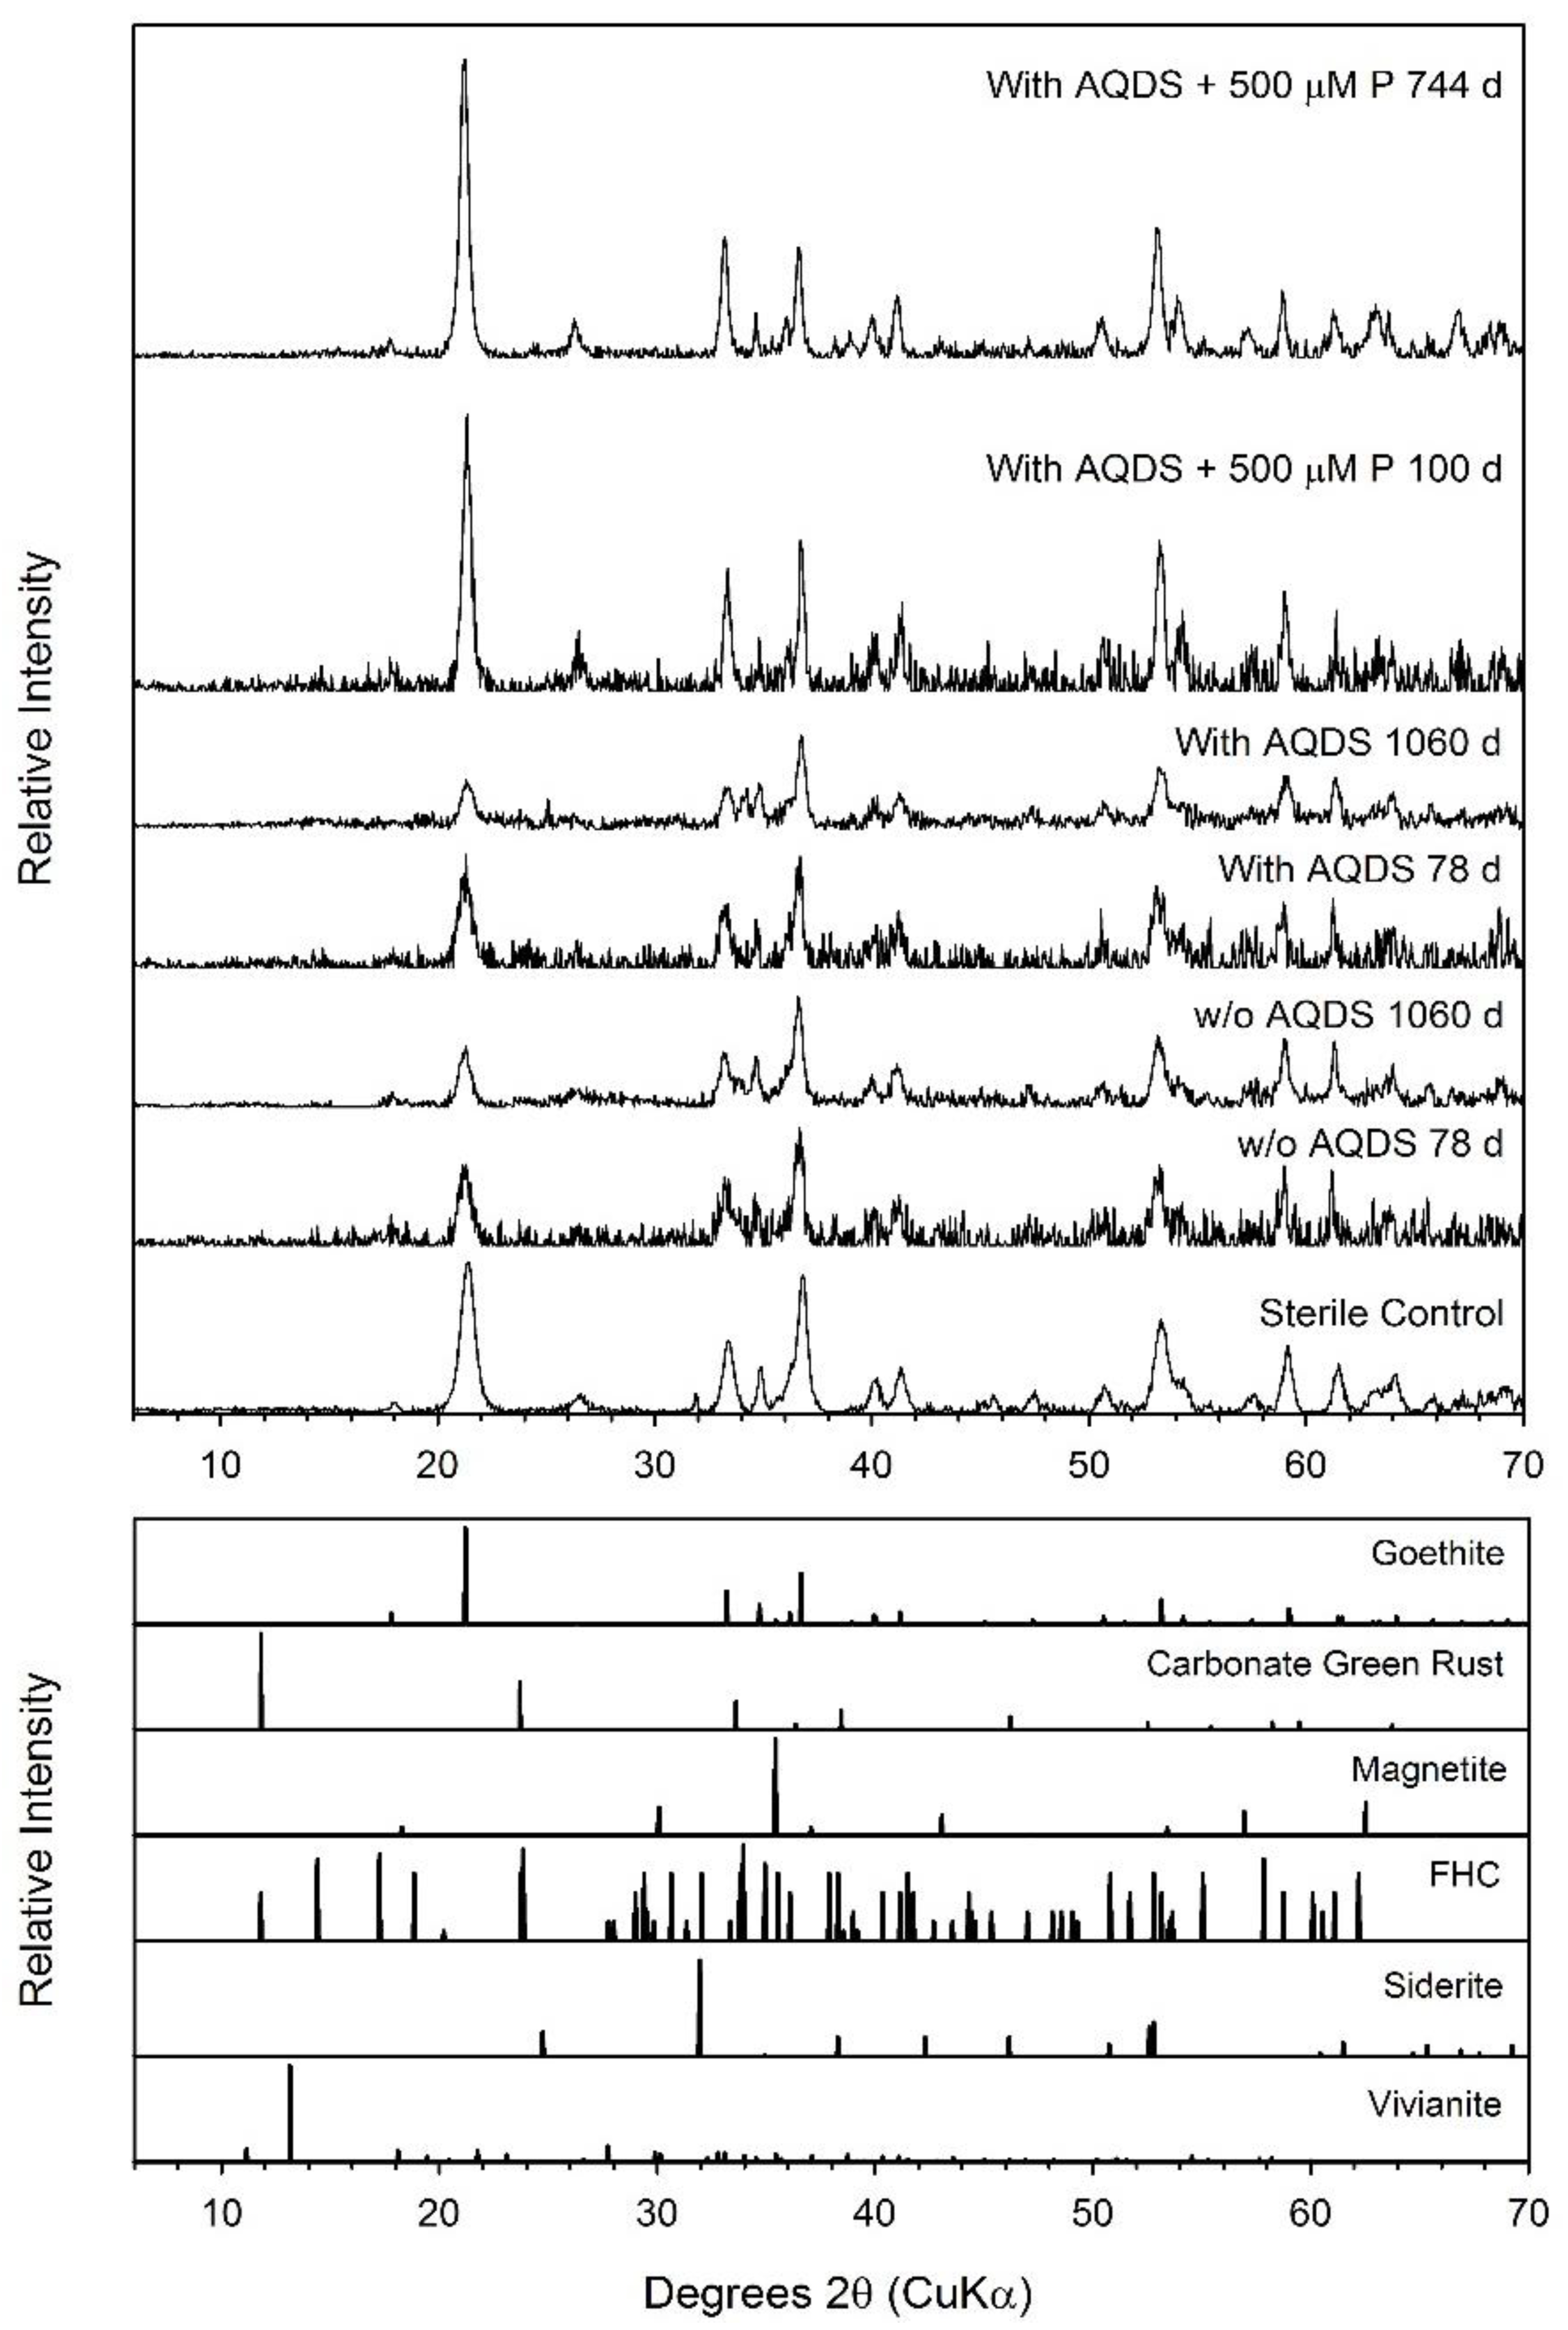
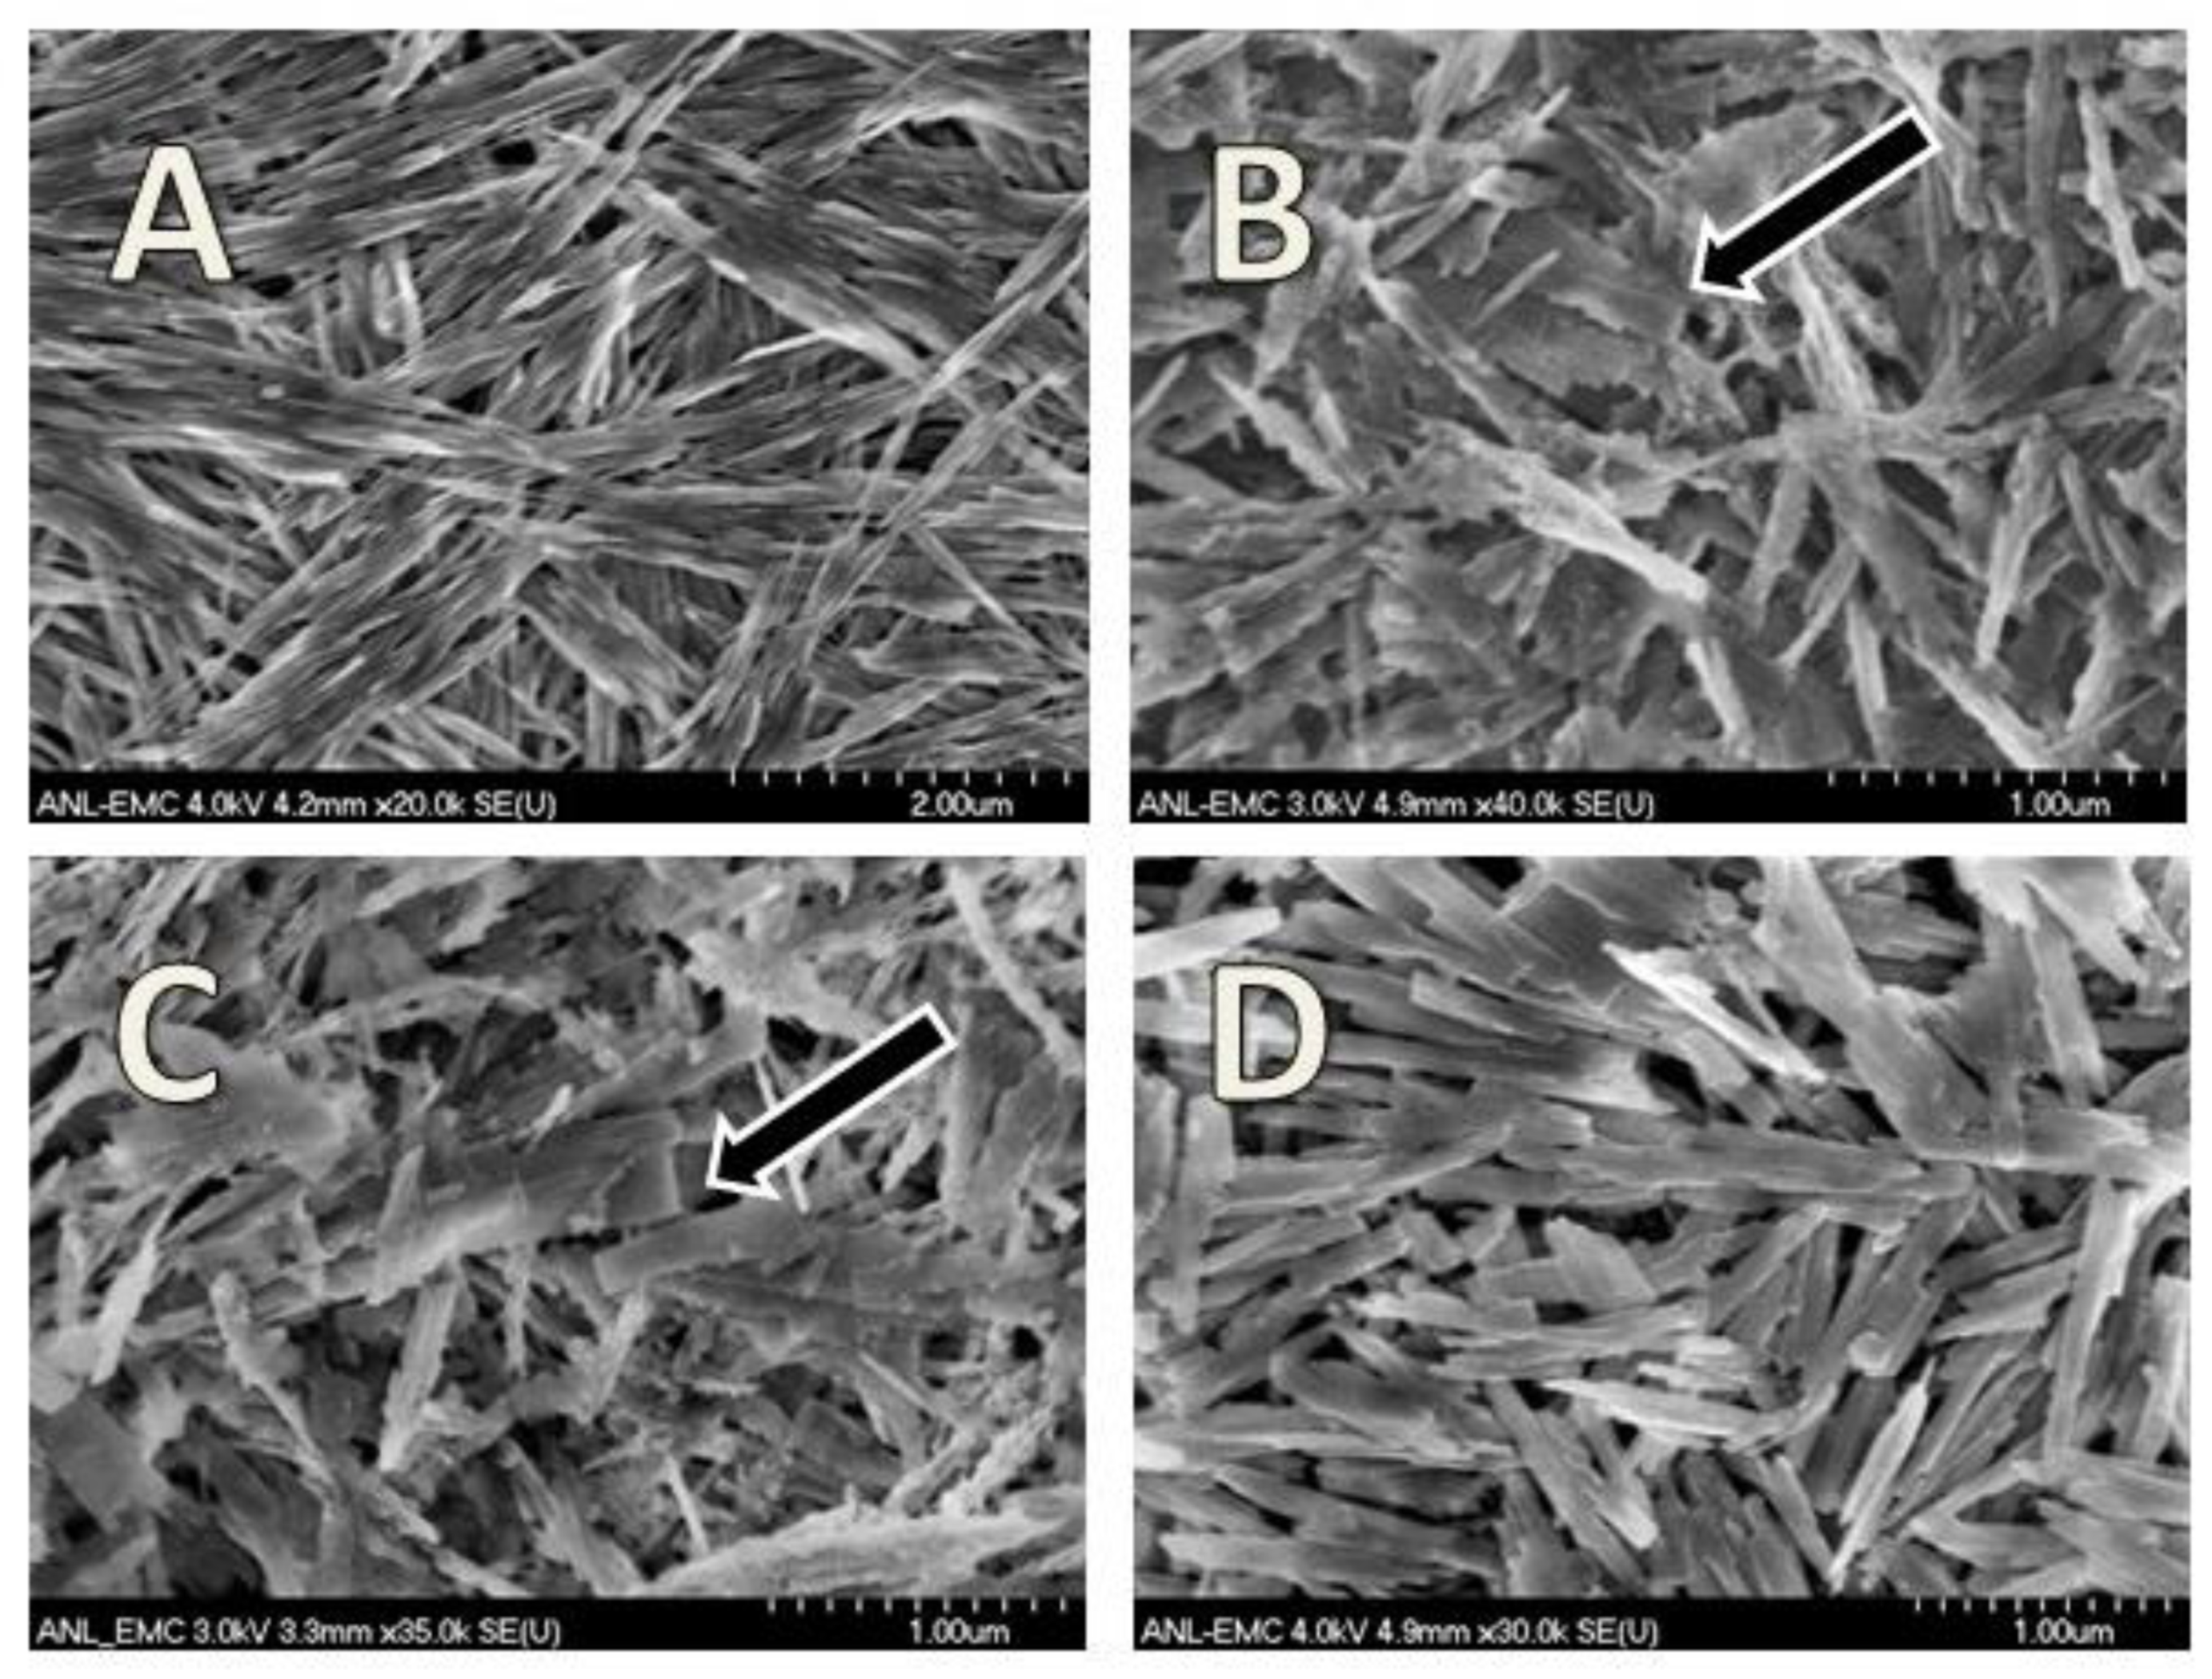
3.3. Goethite
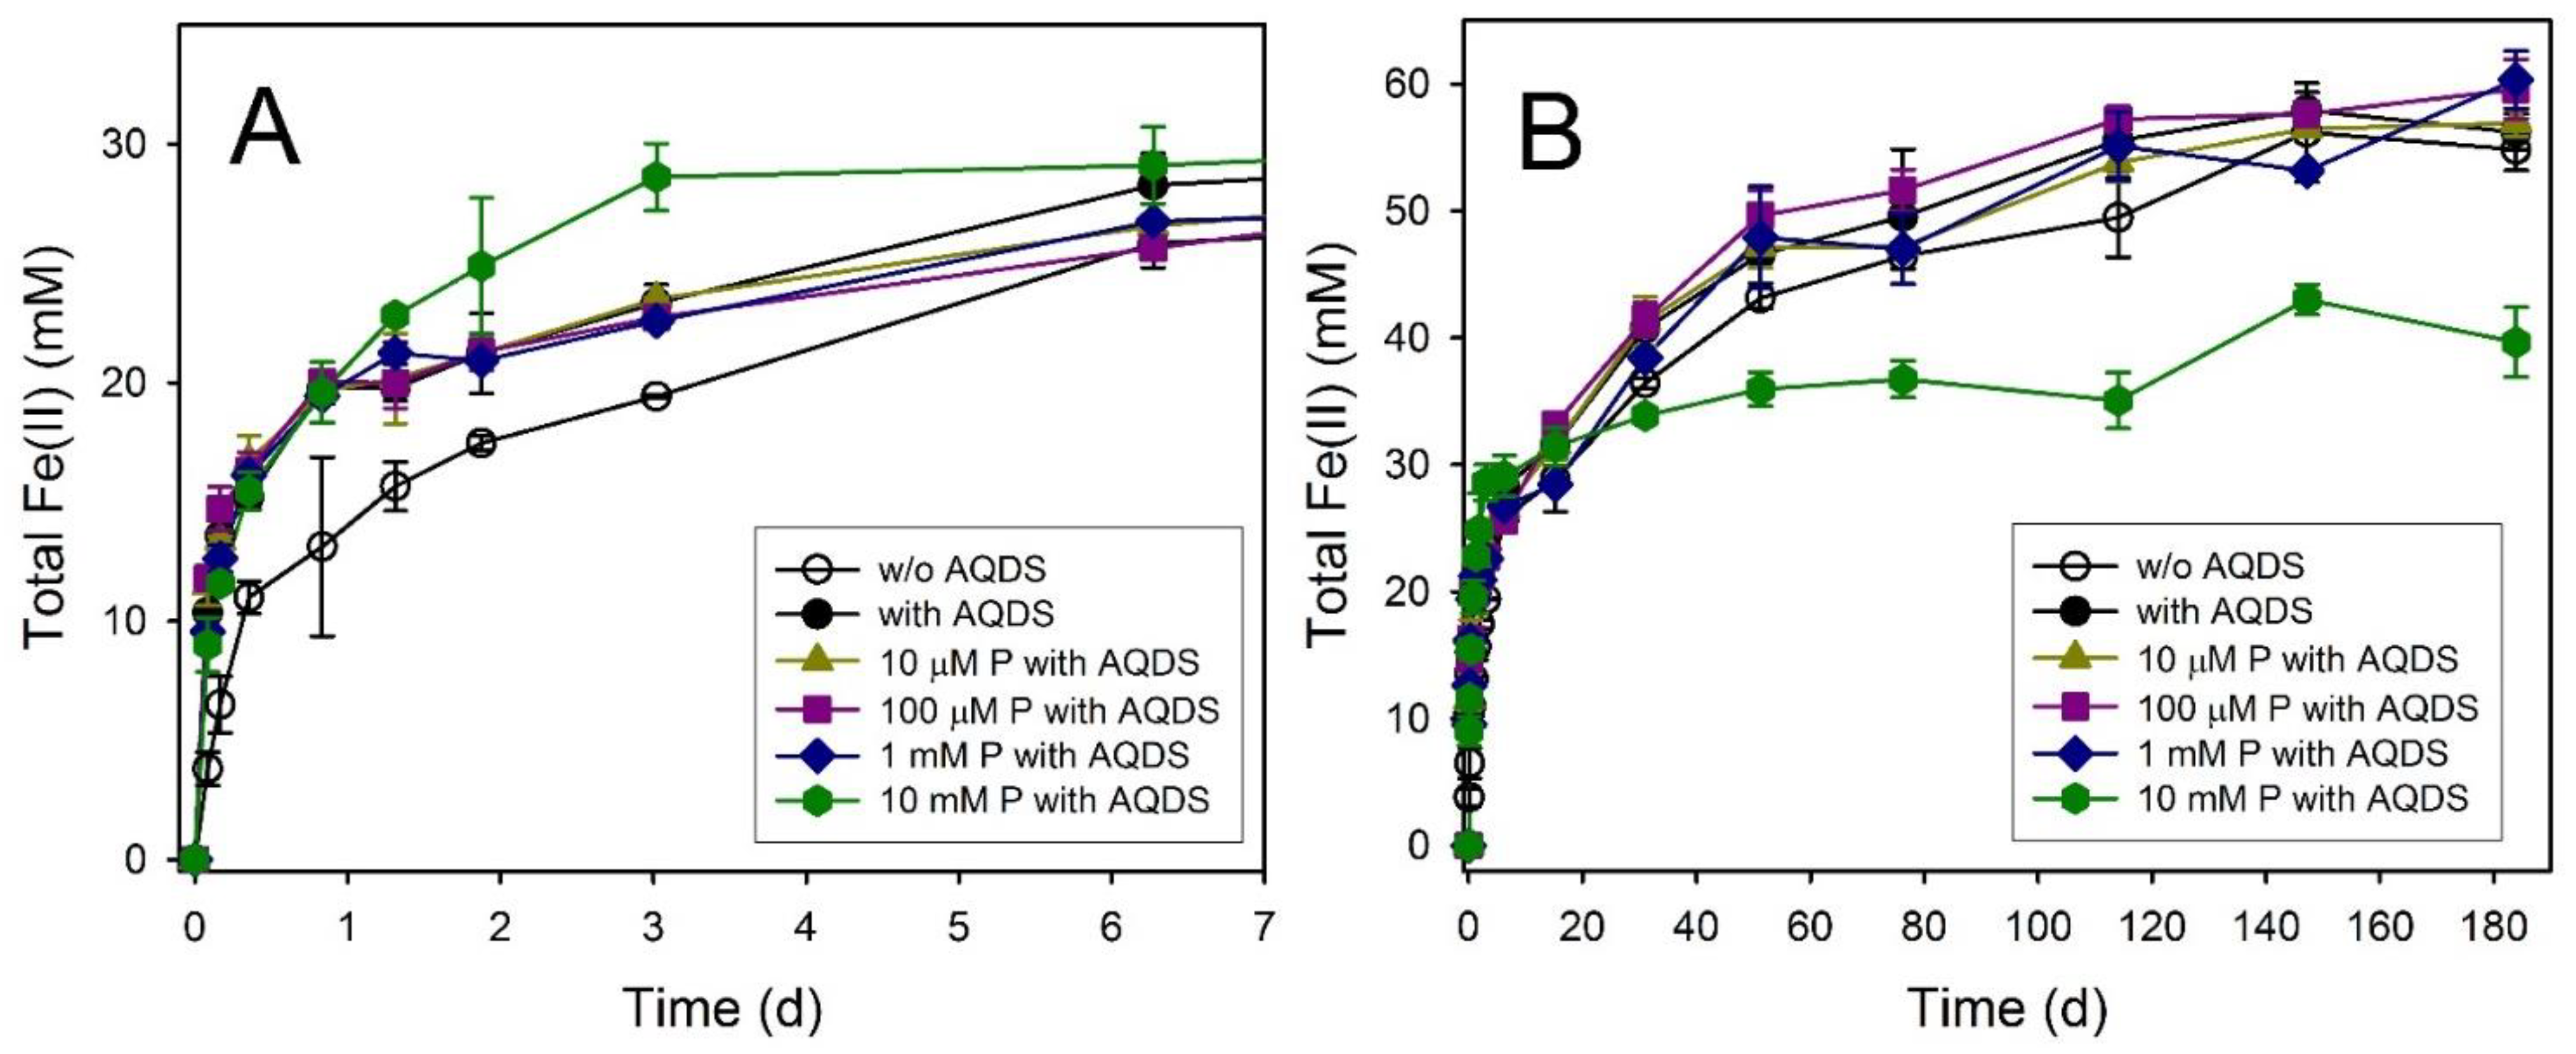
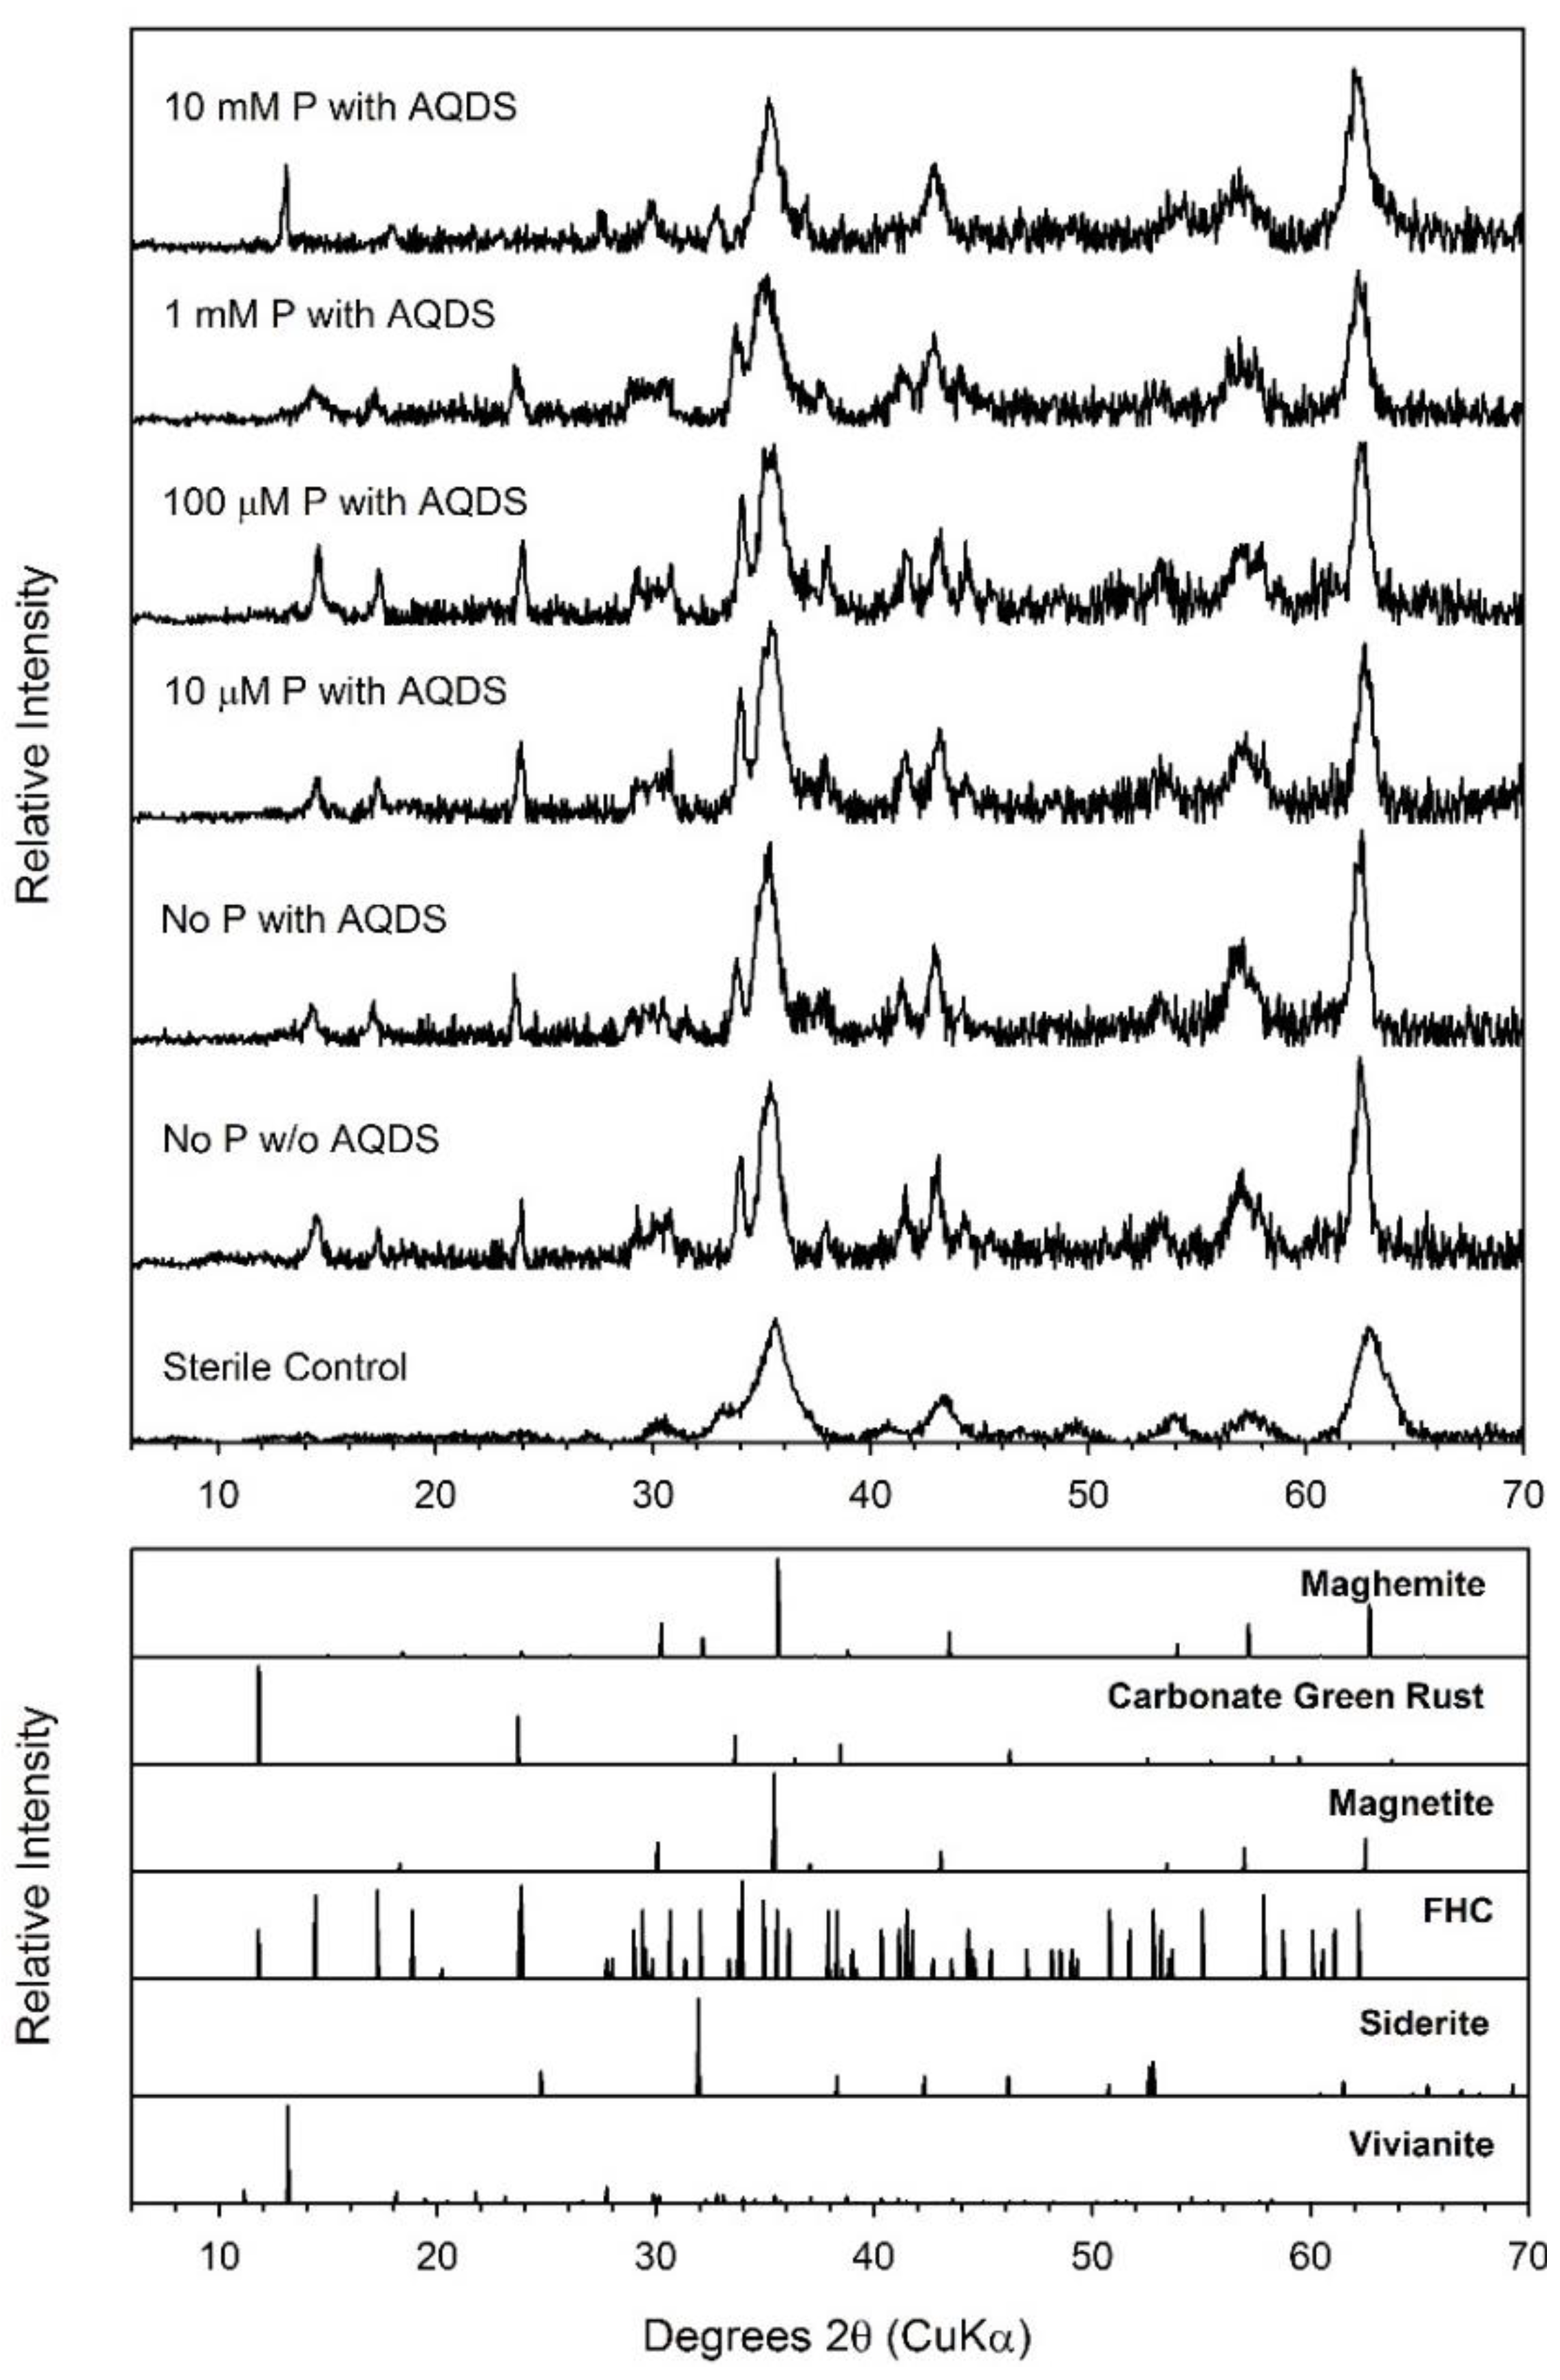
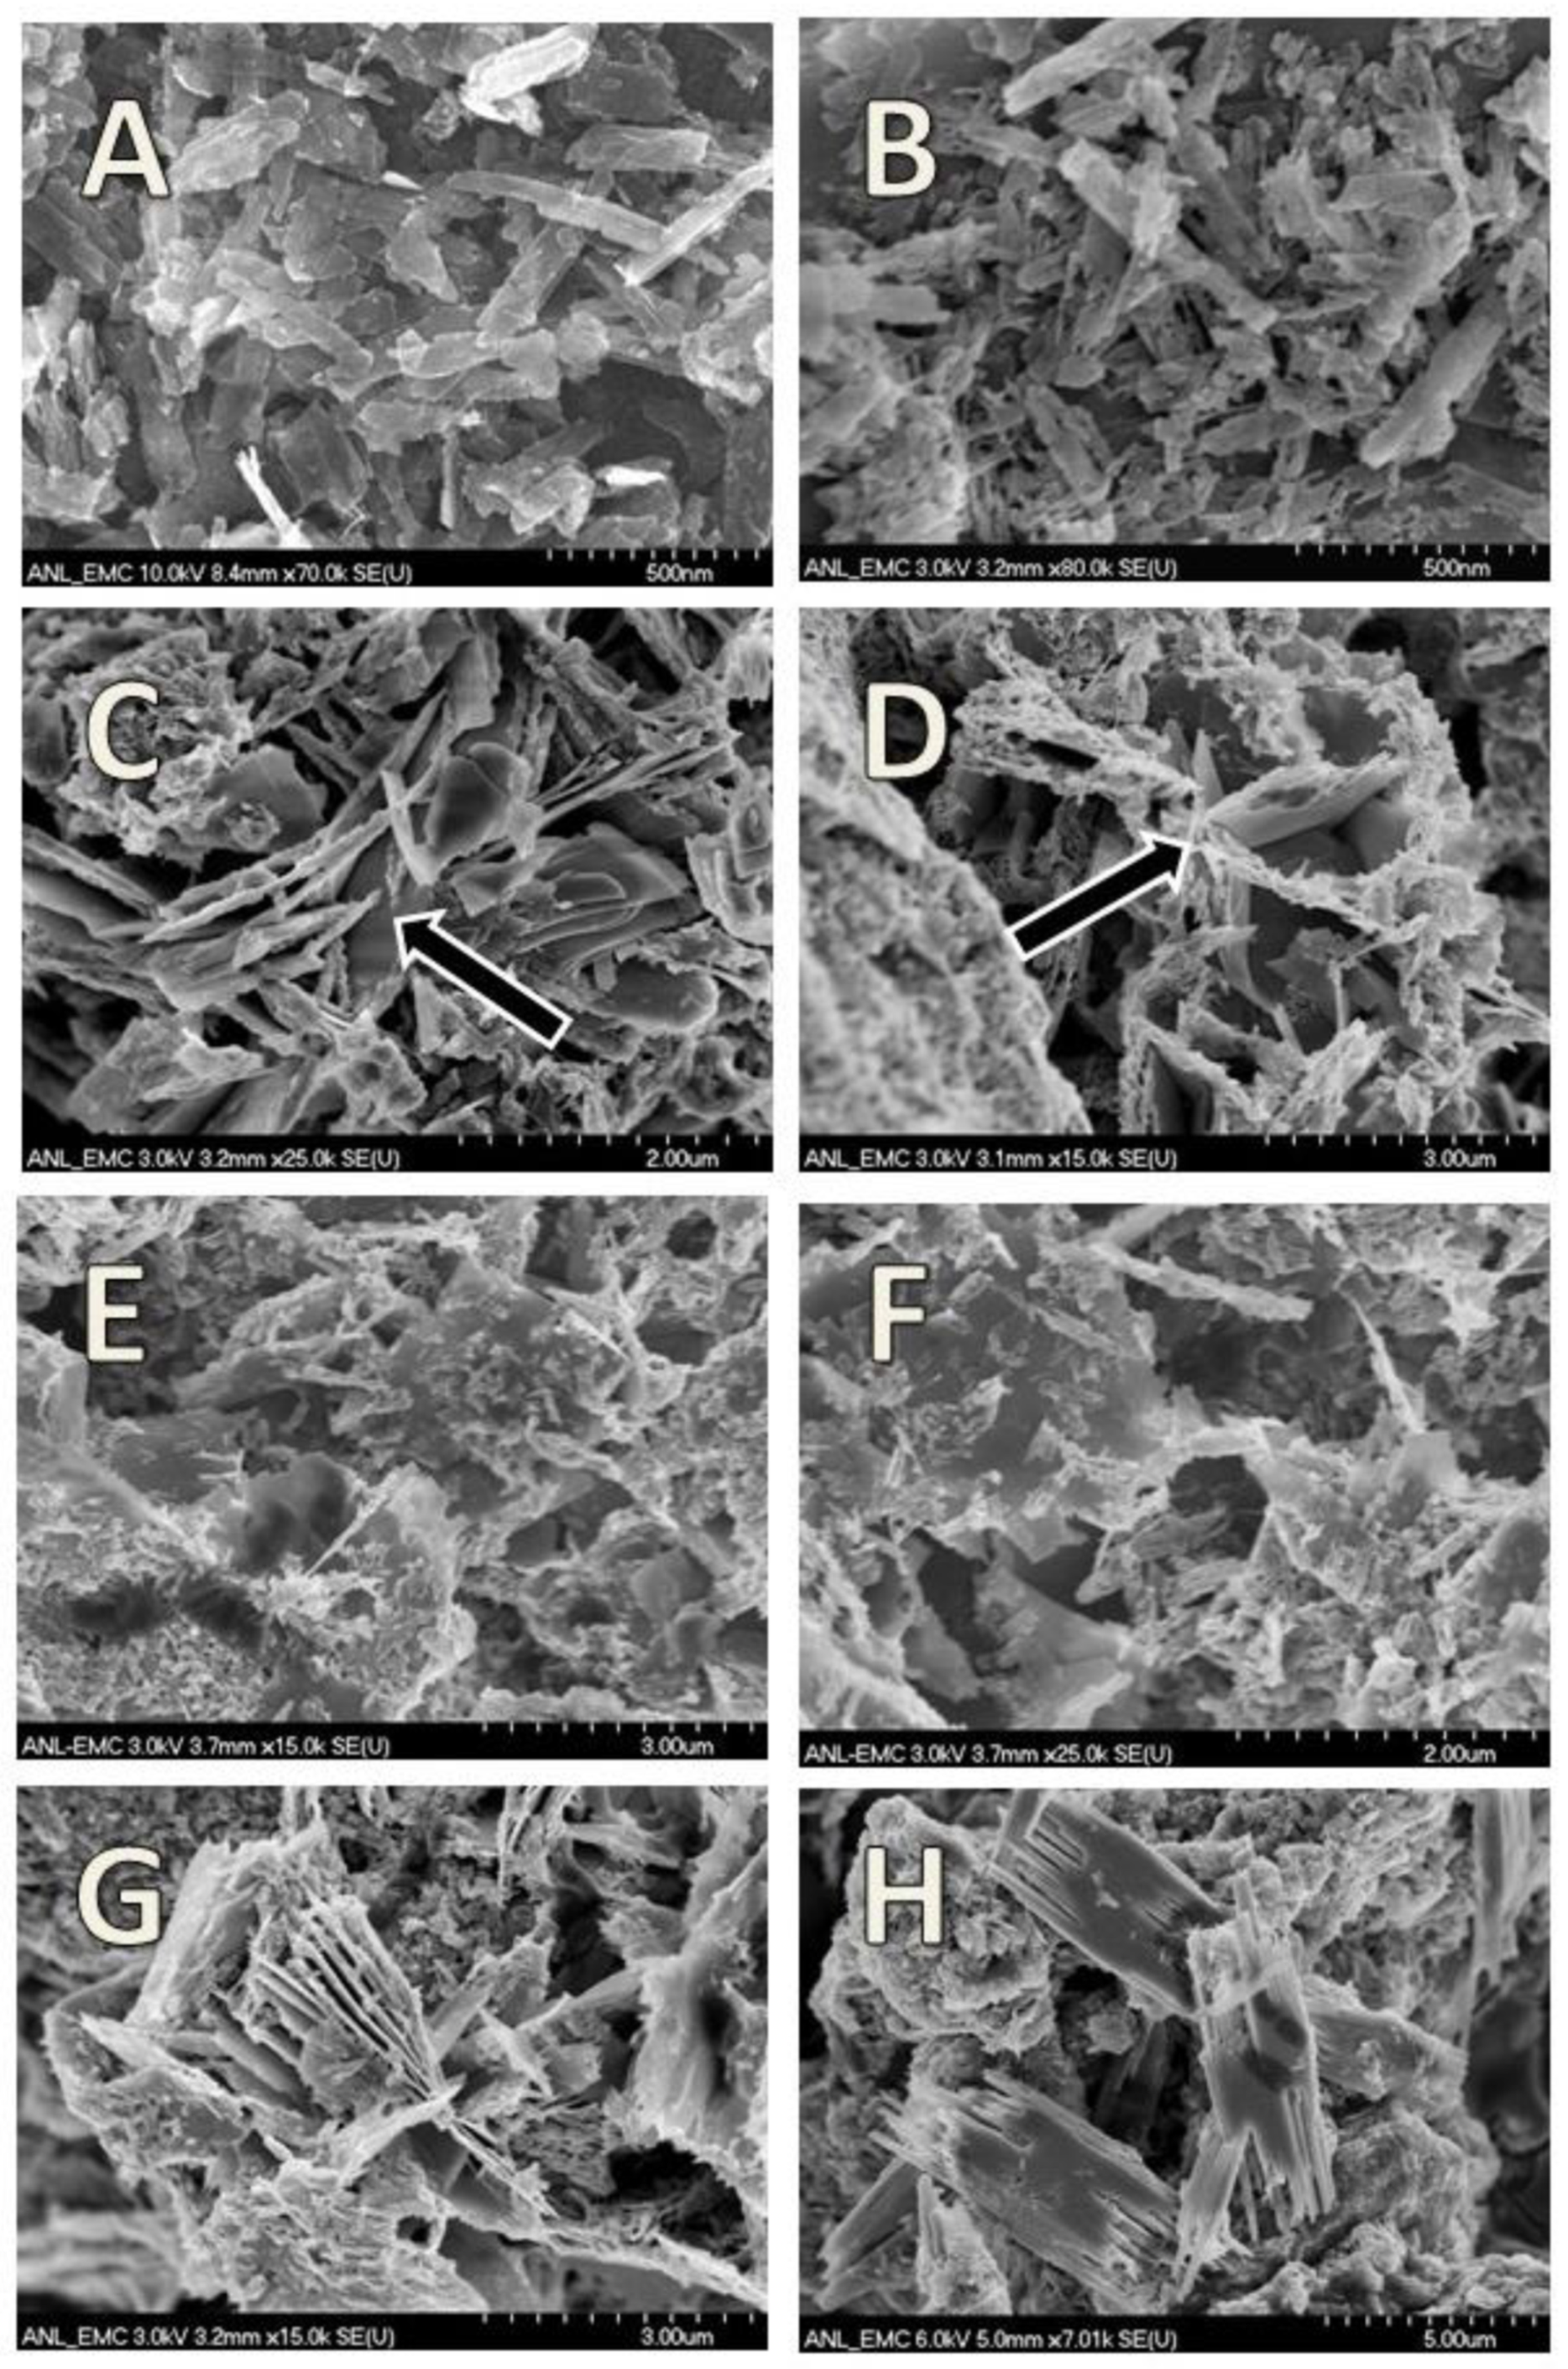
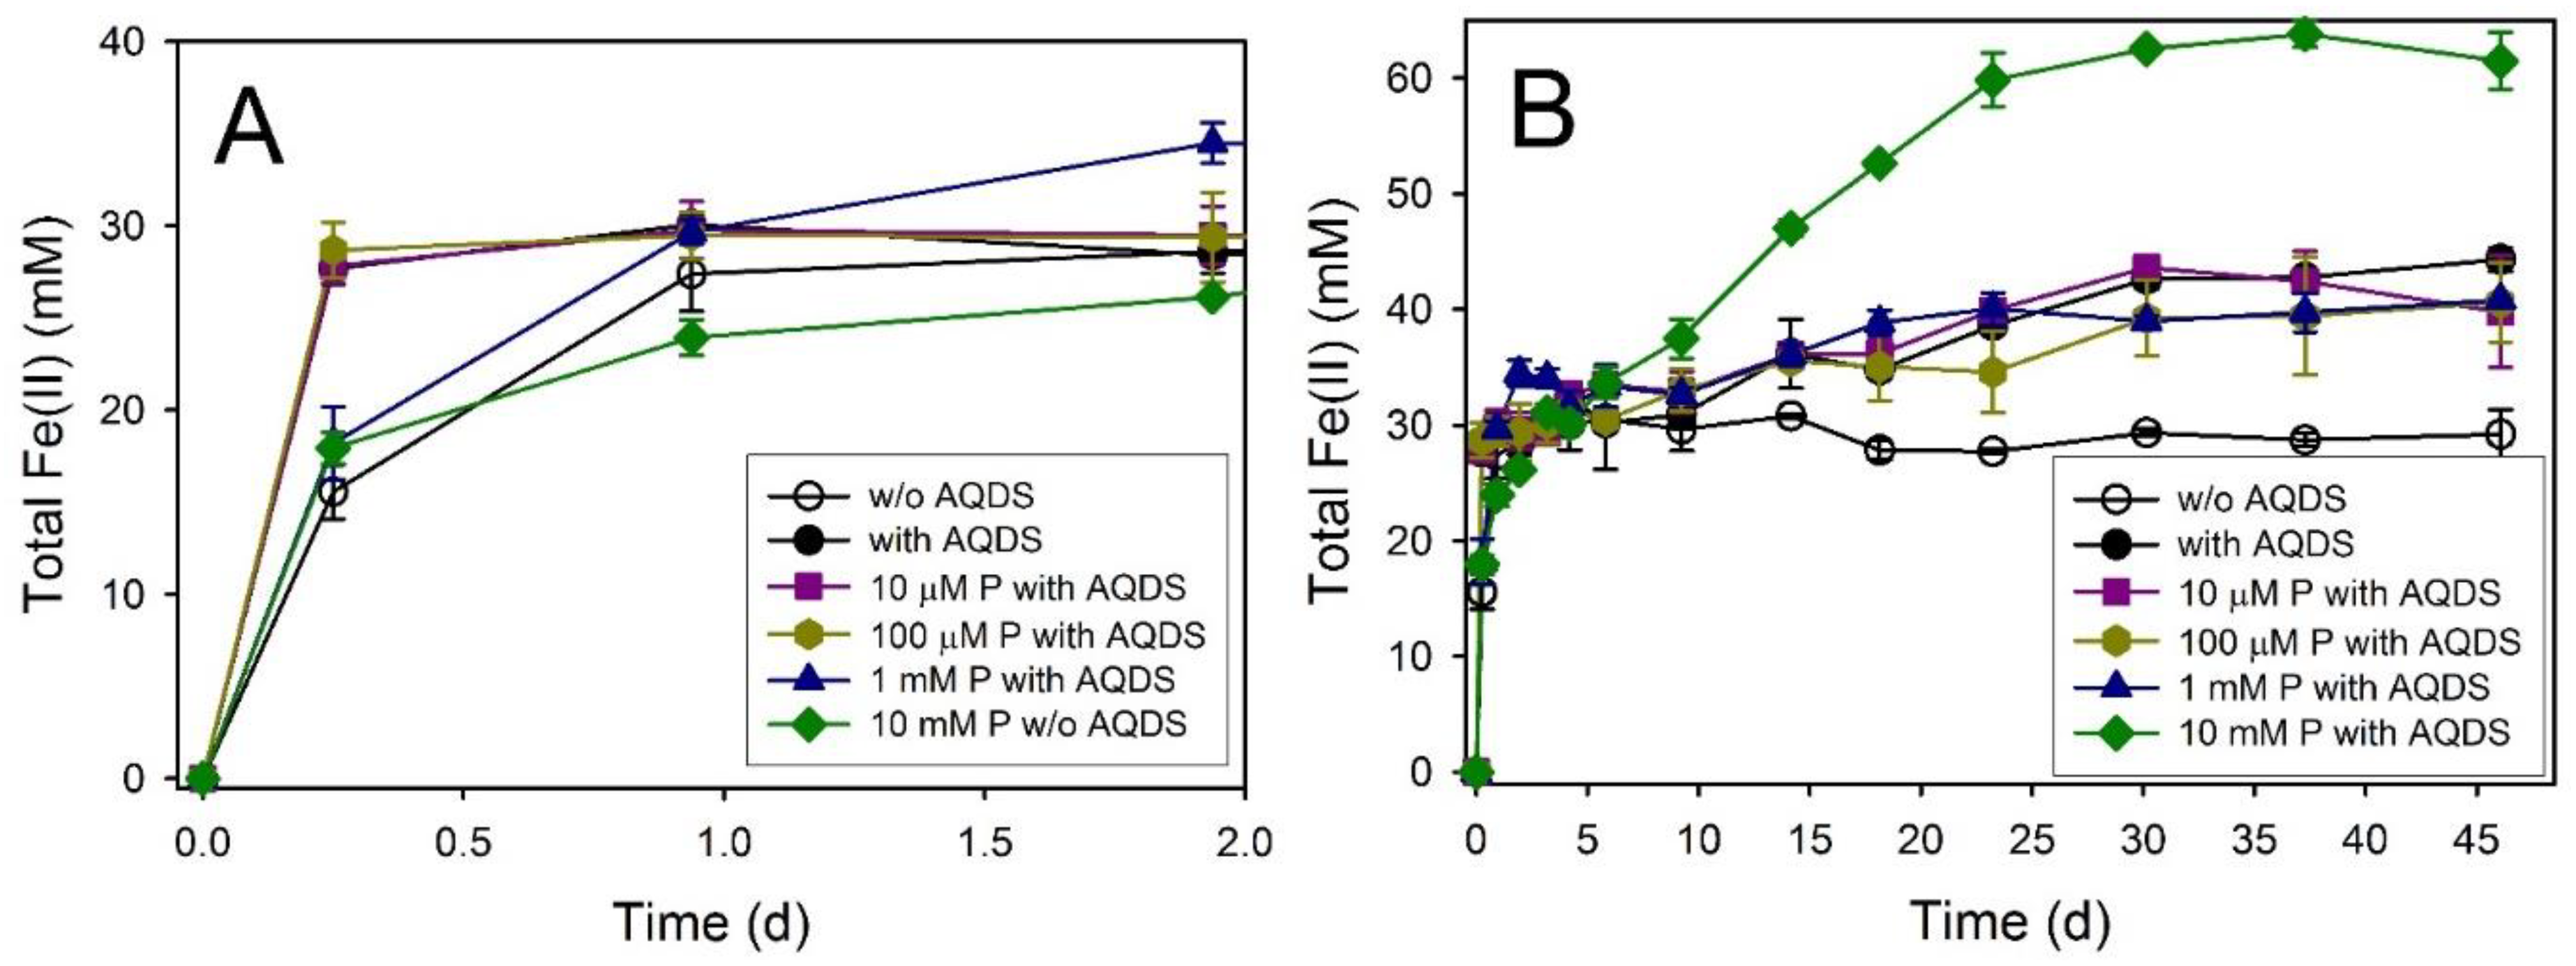
3.4. Maghemite
3.5. Ferrihydrite
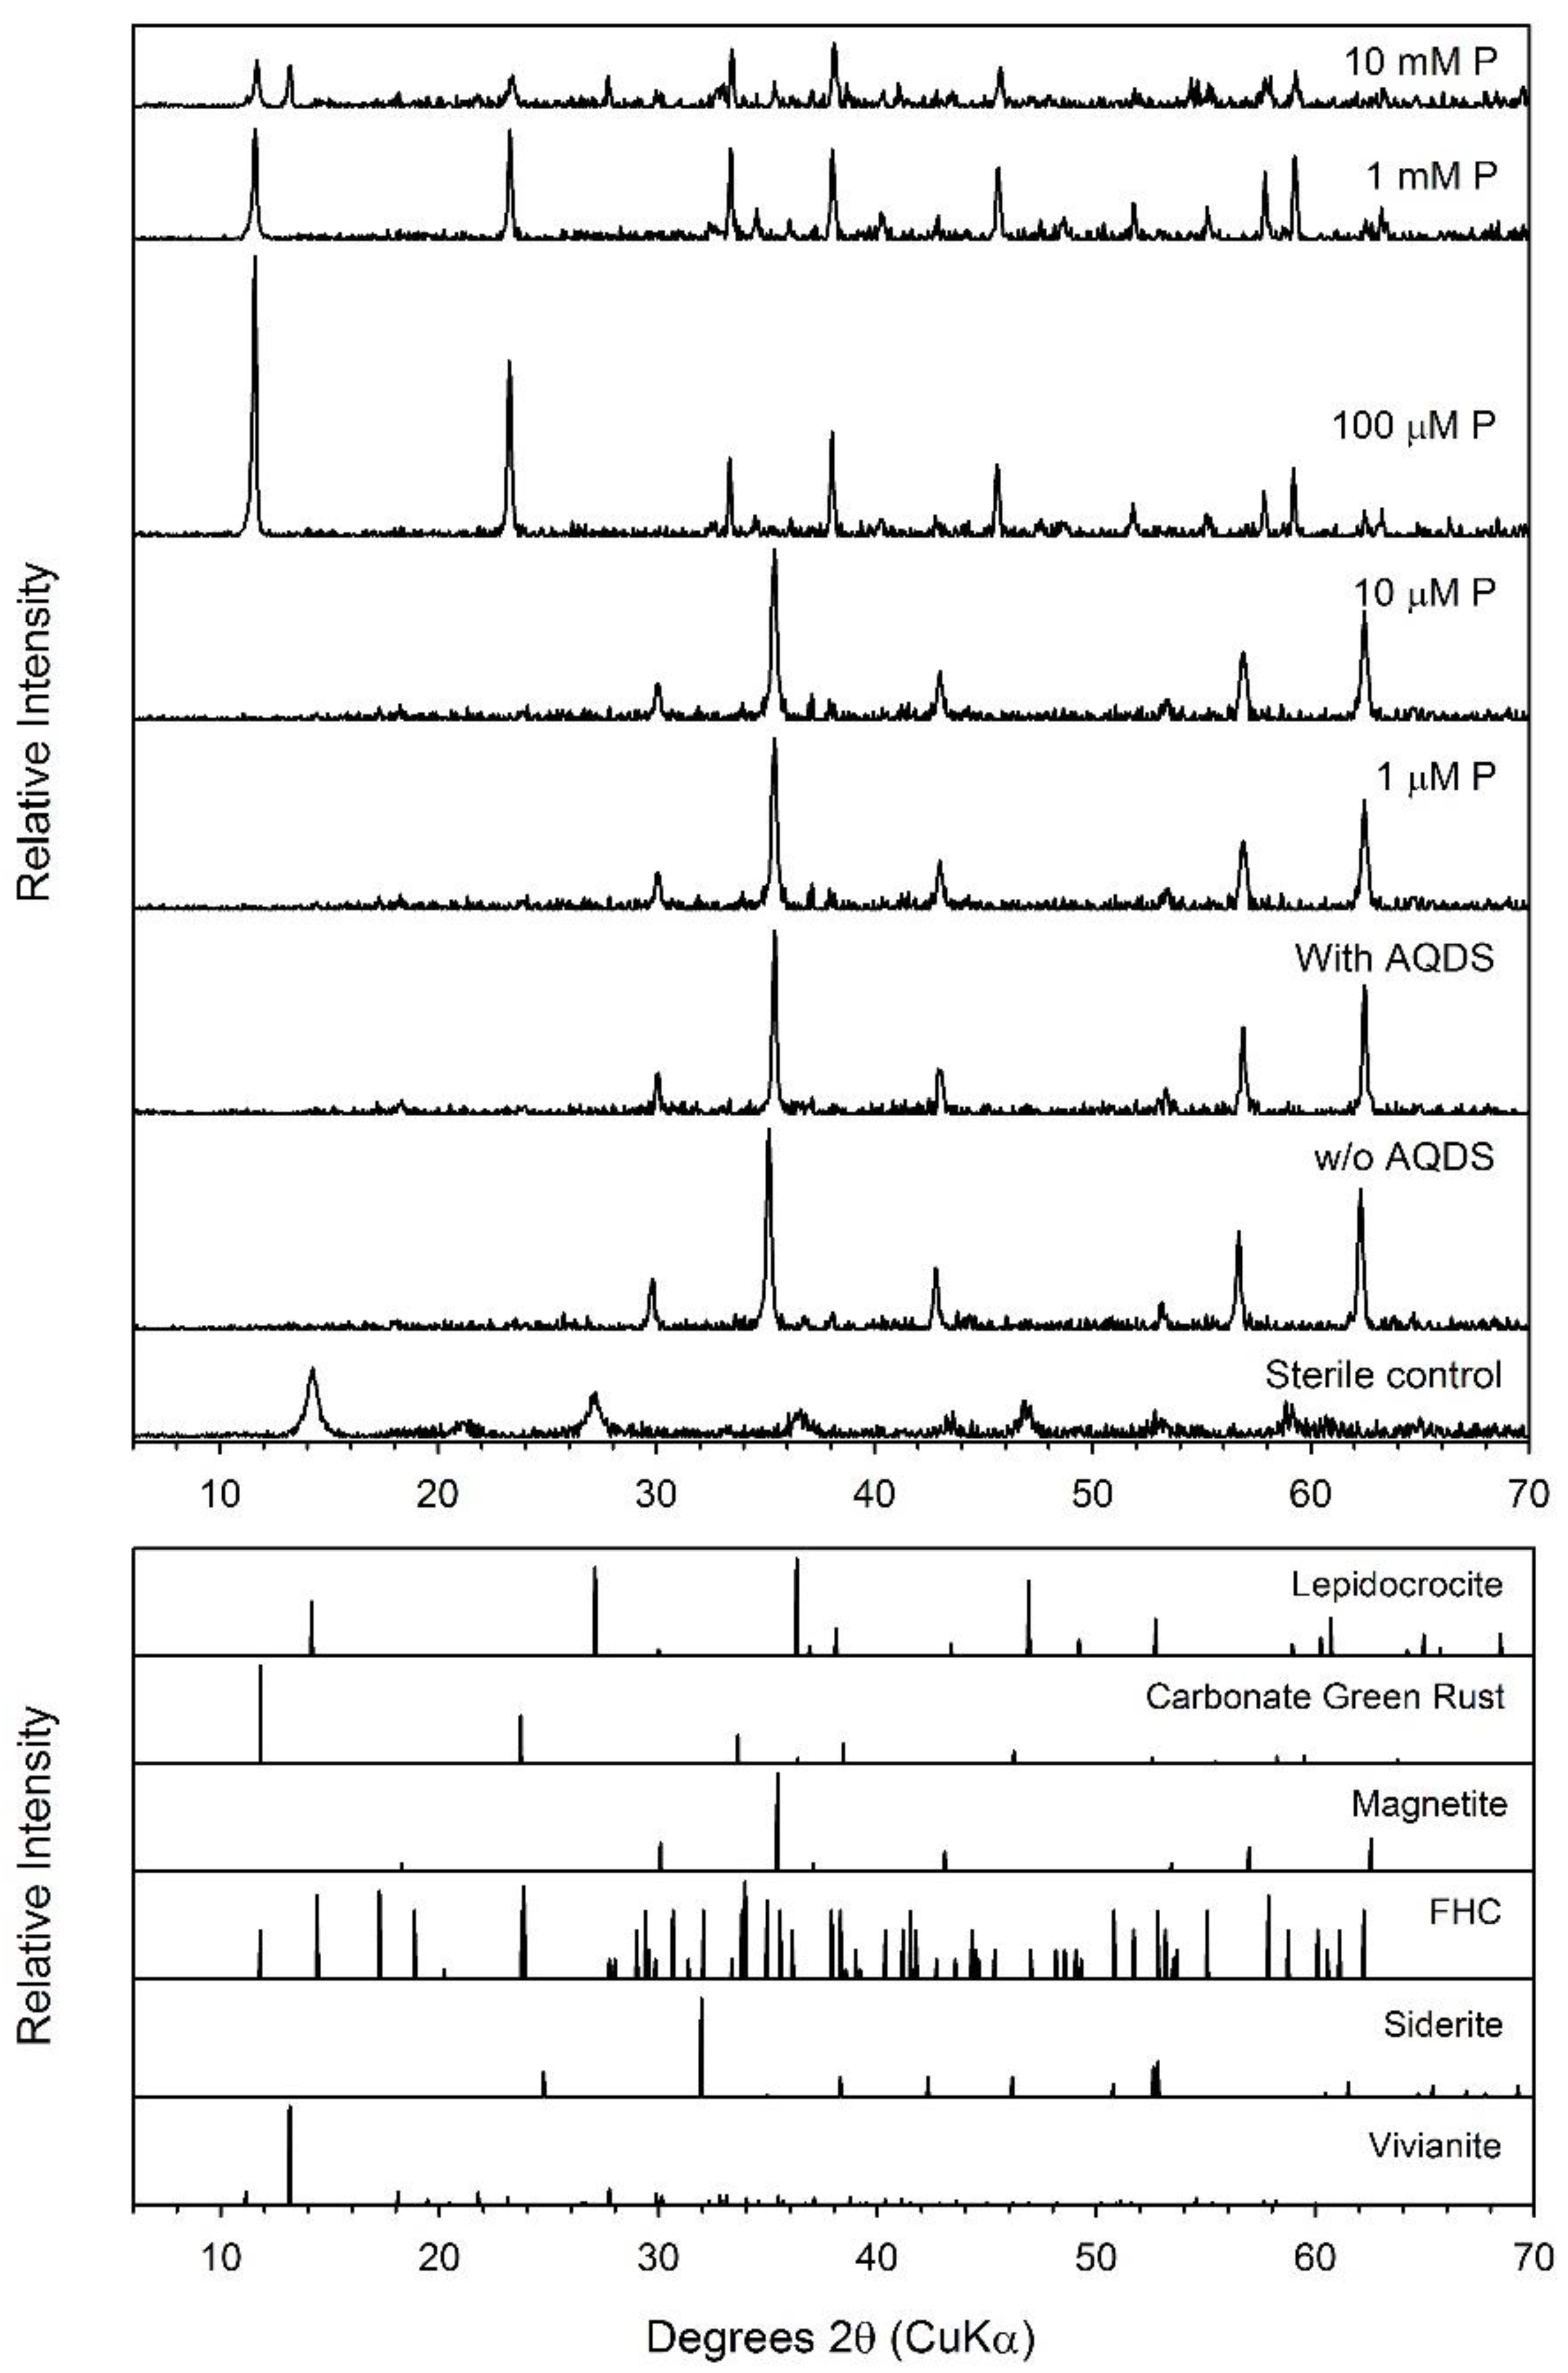
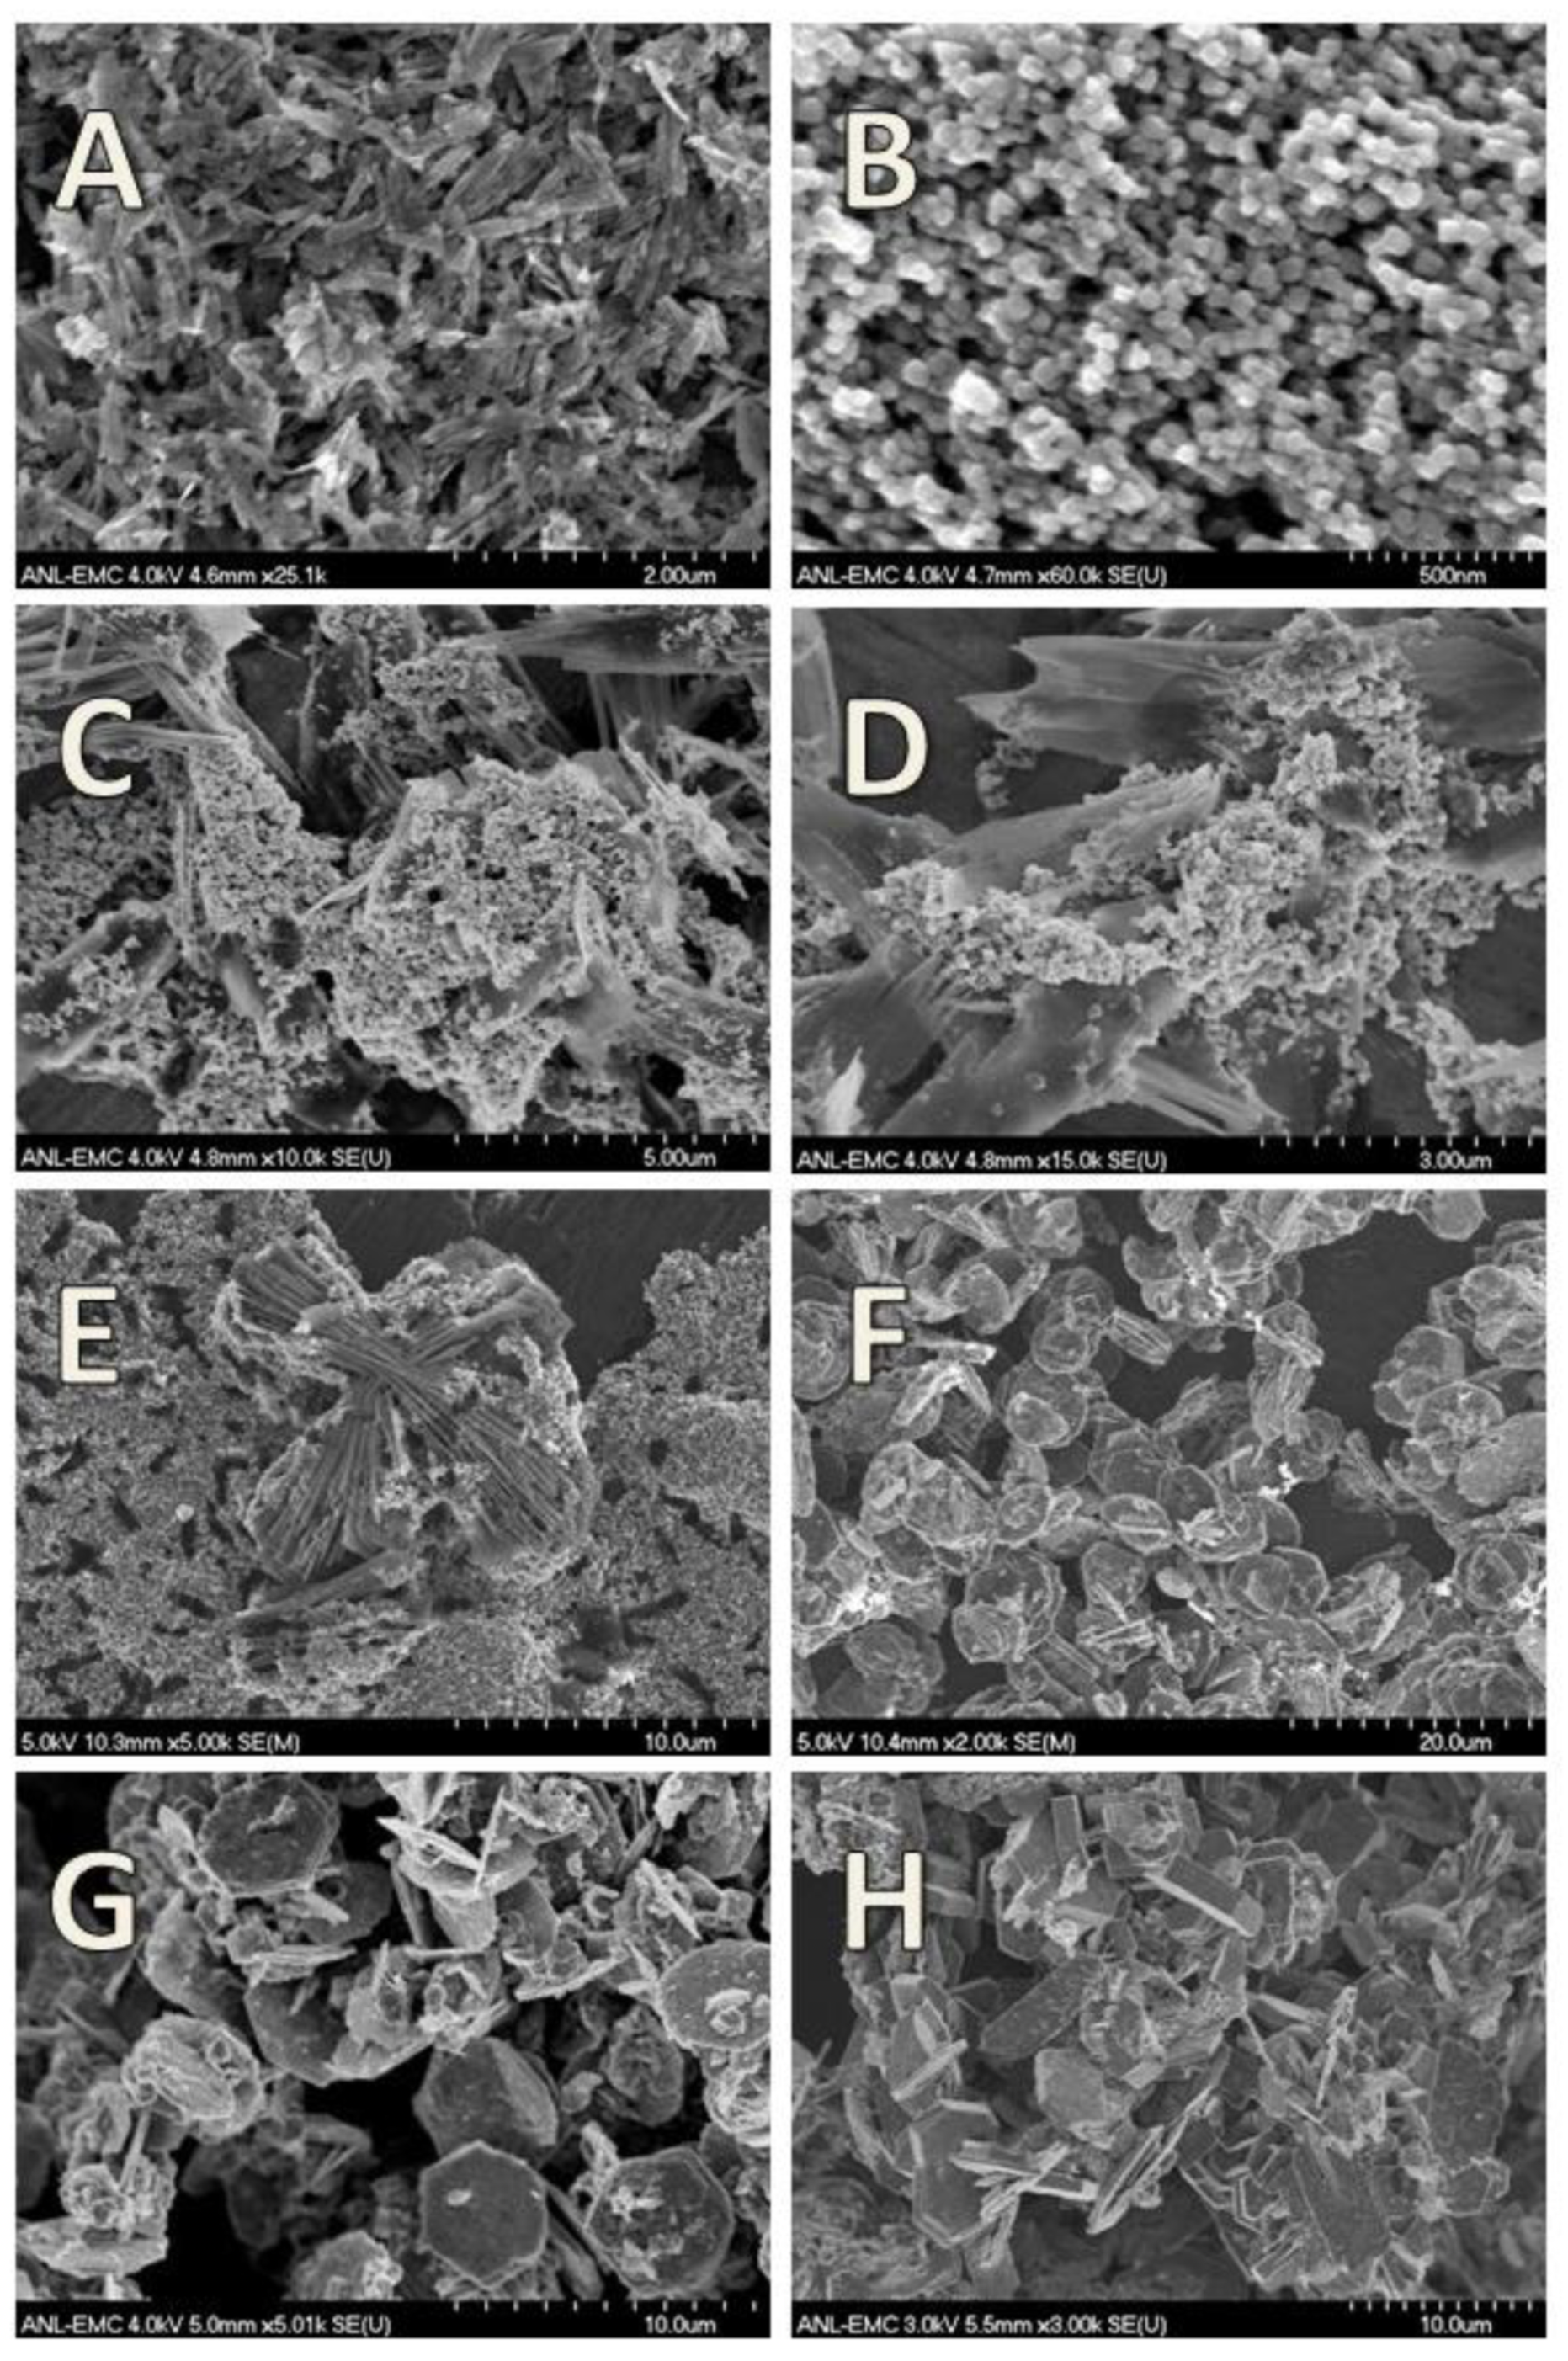
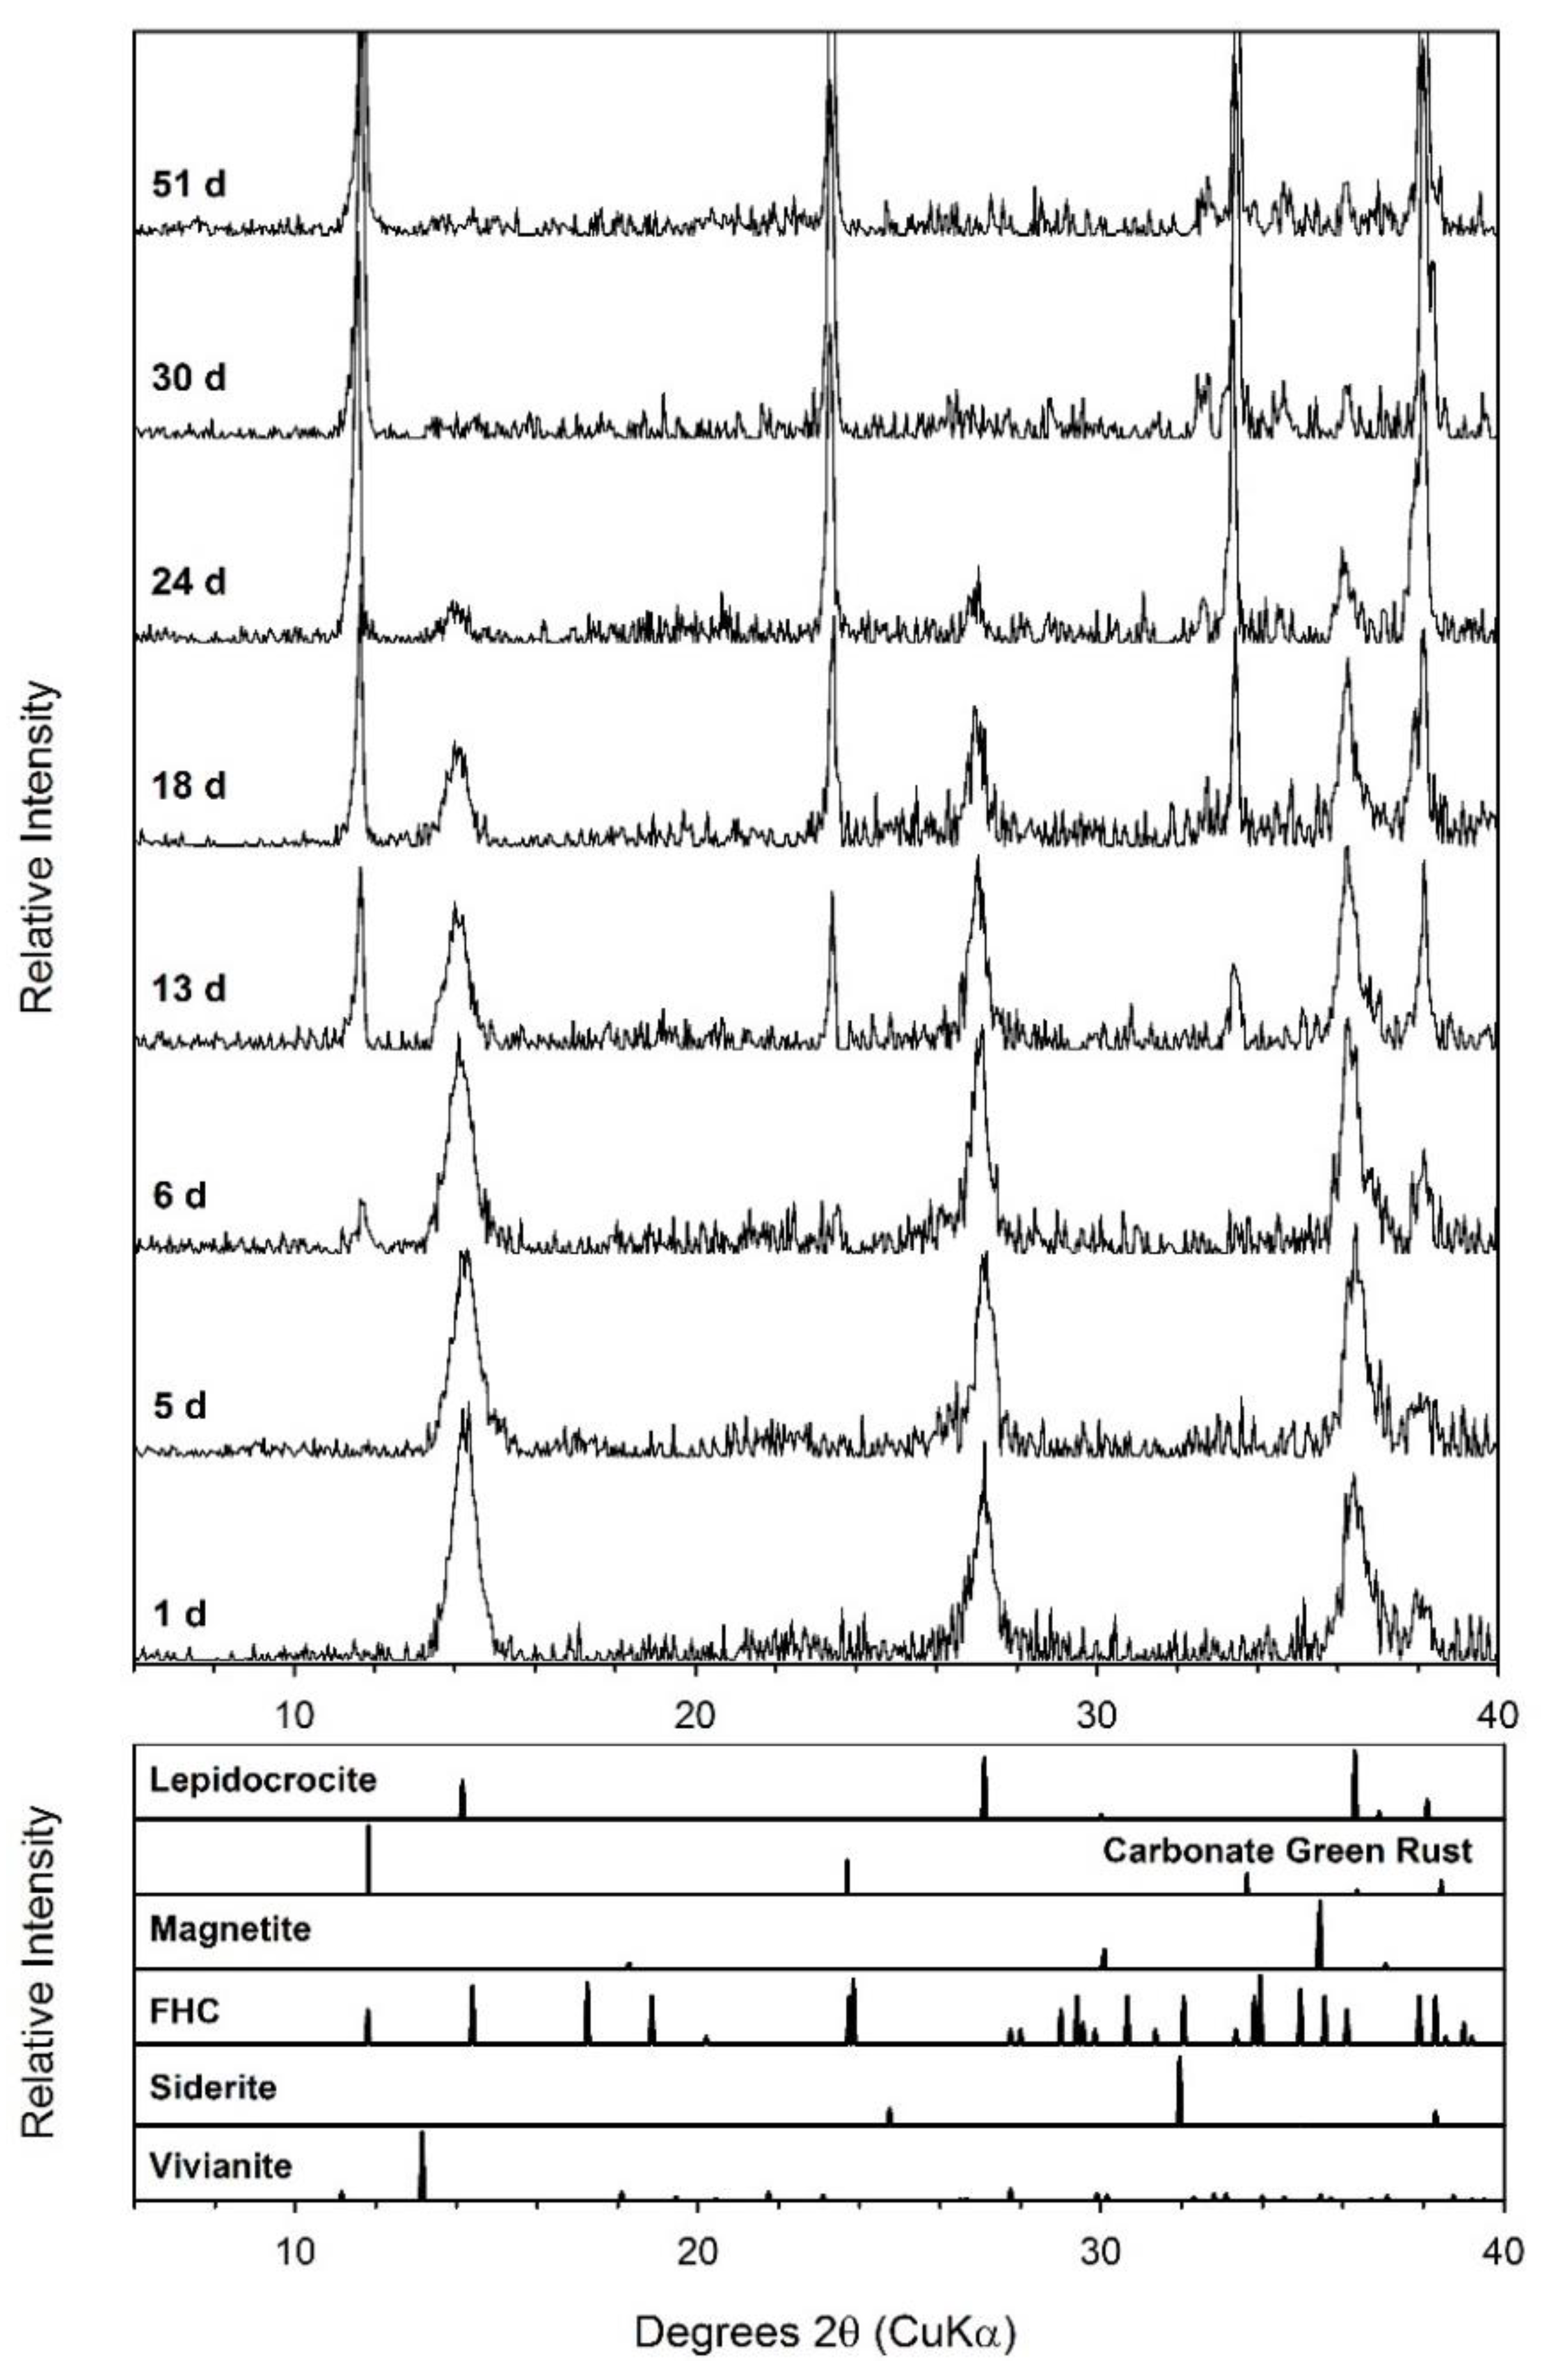
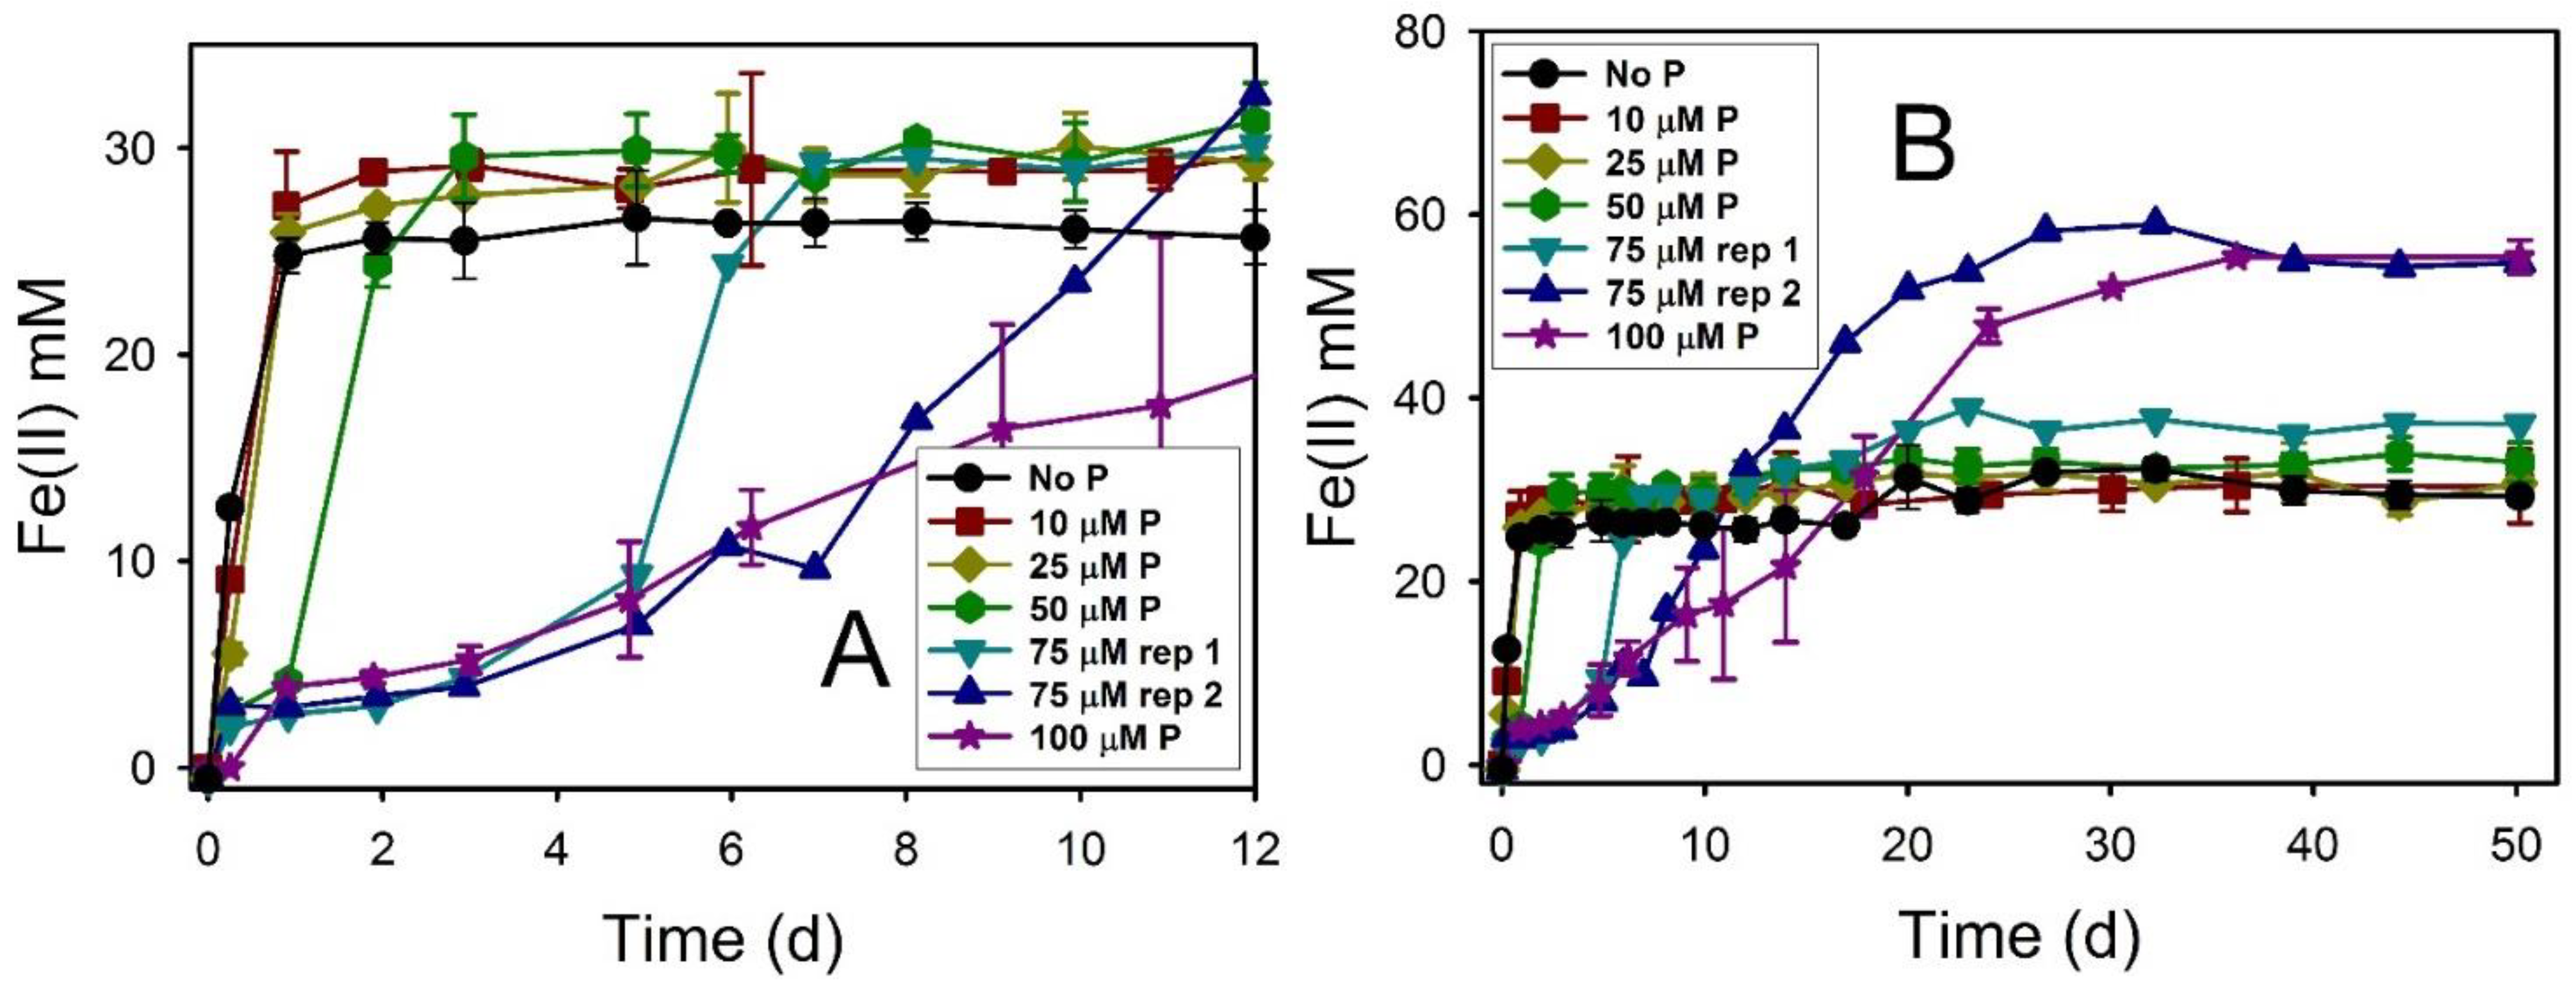
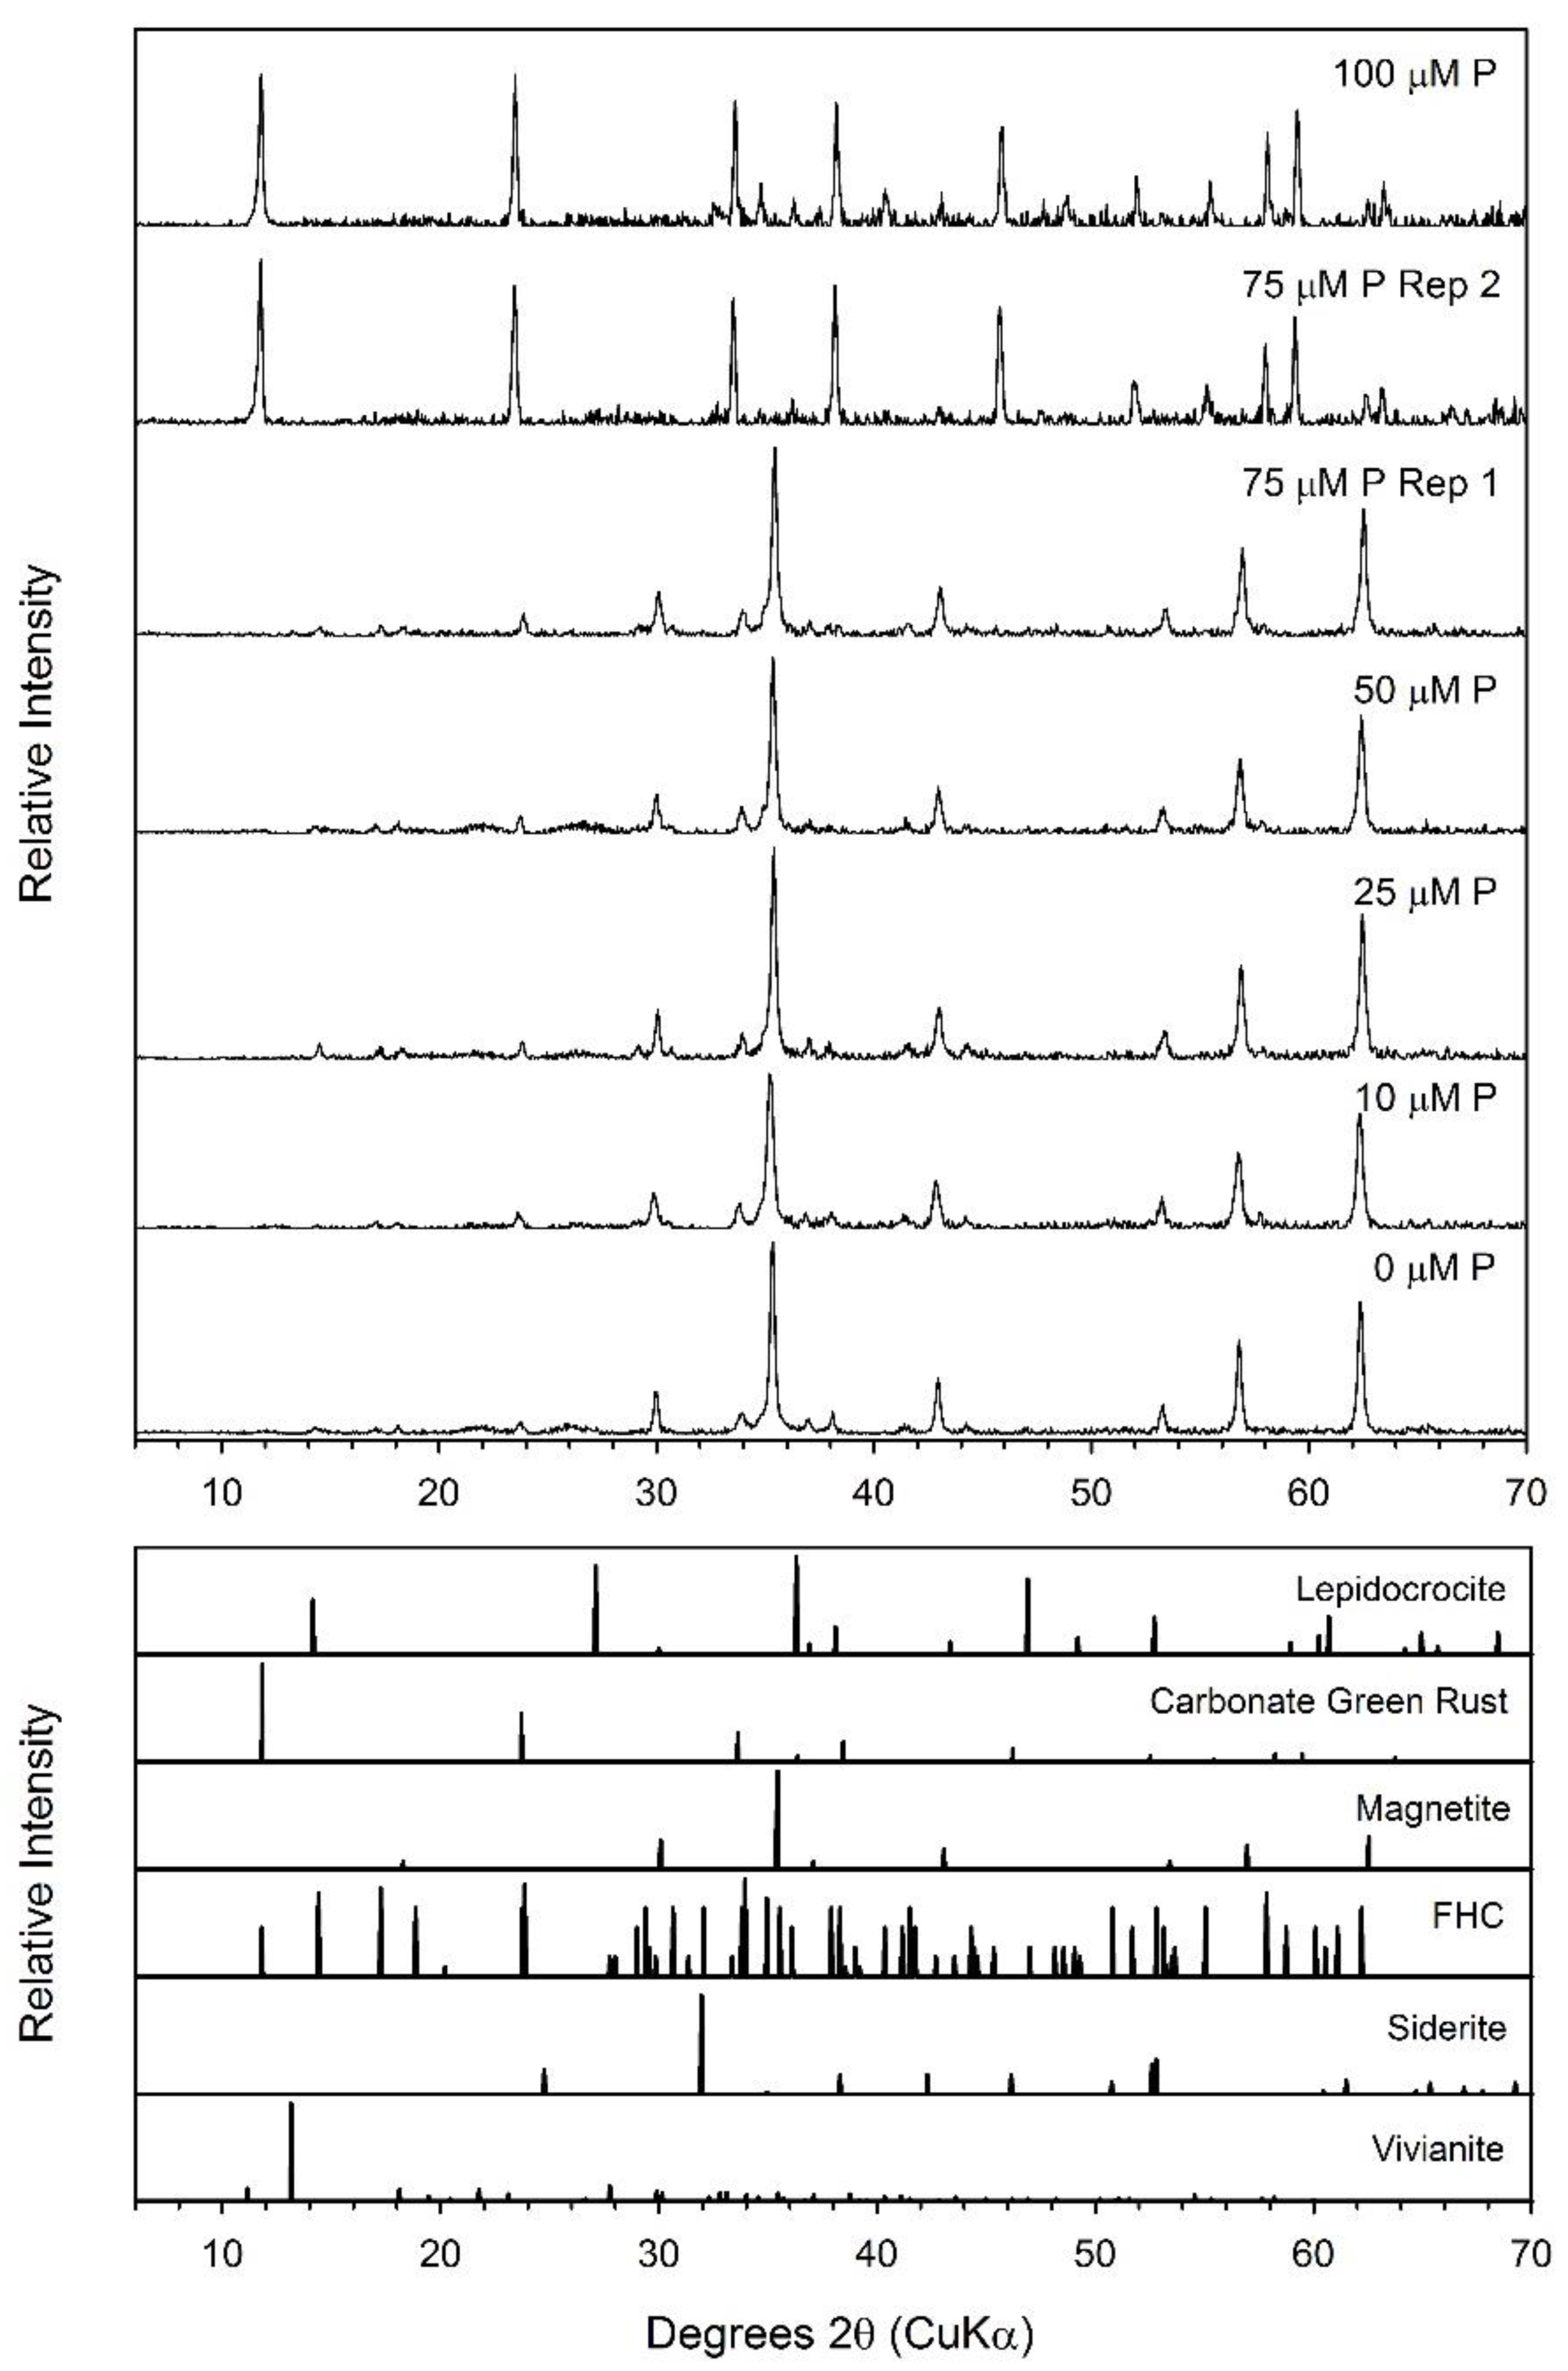
3.6. Lepidocrocite
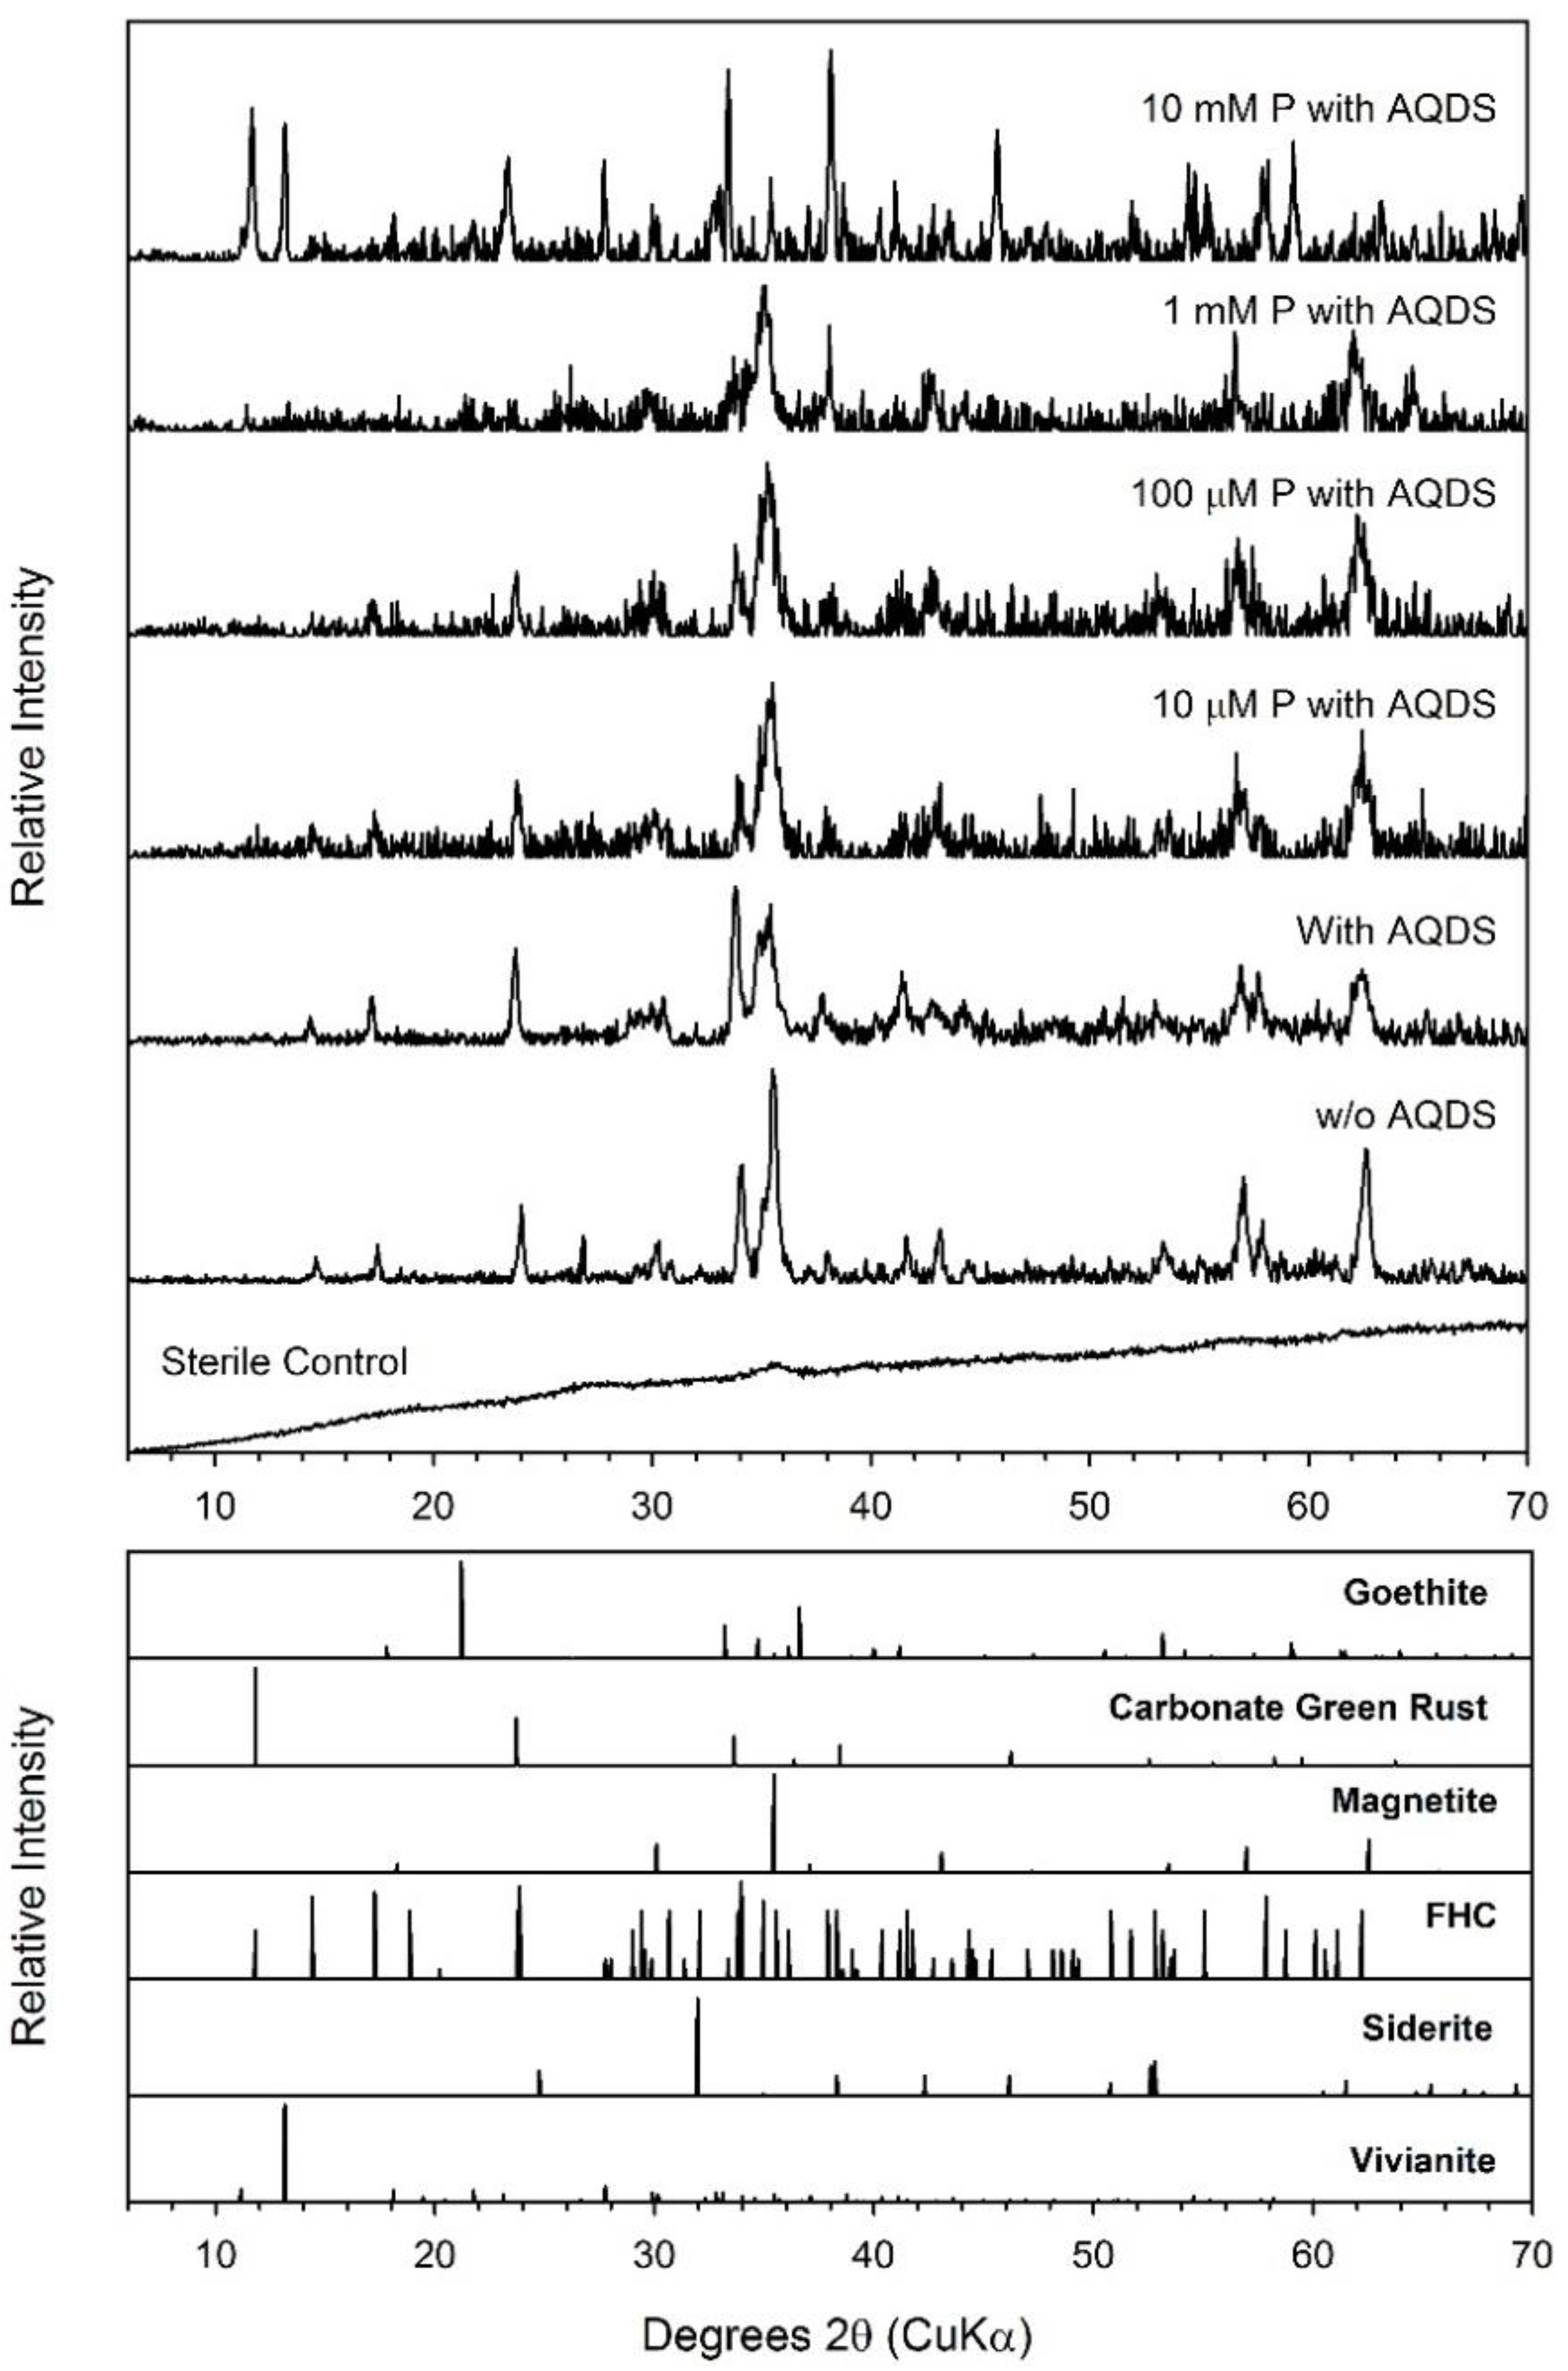
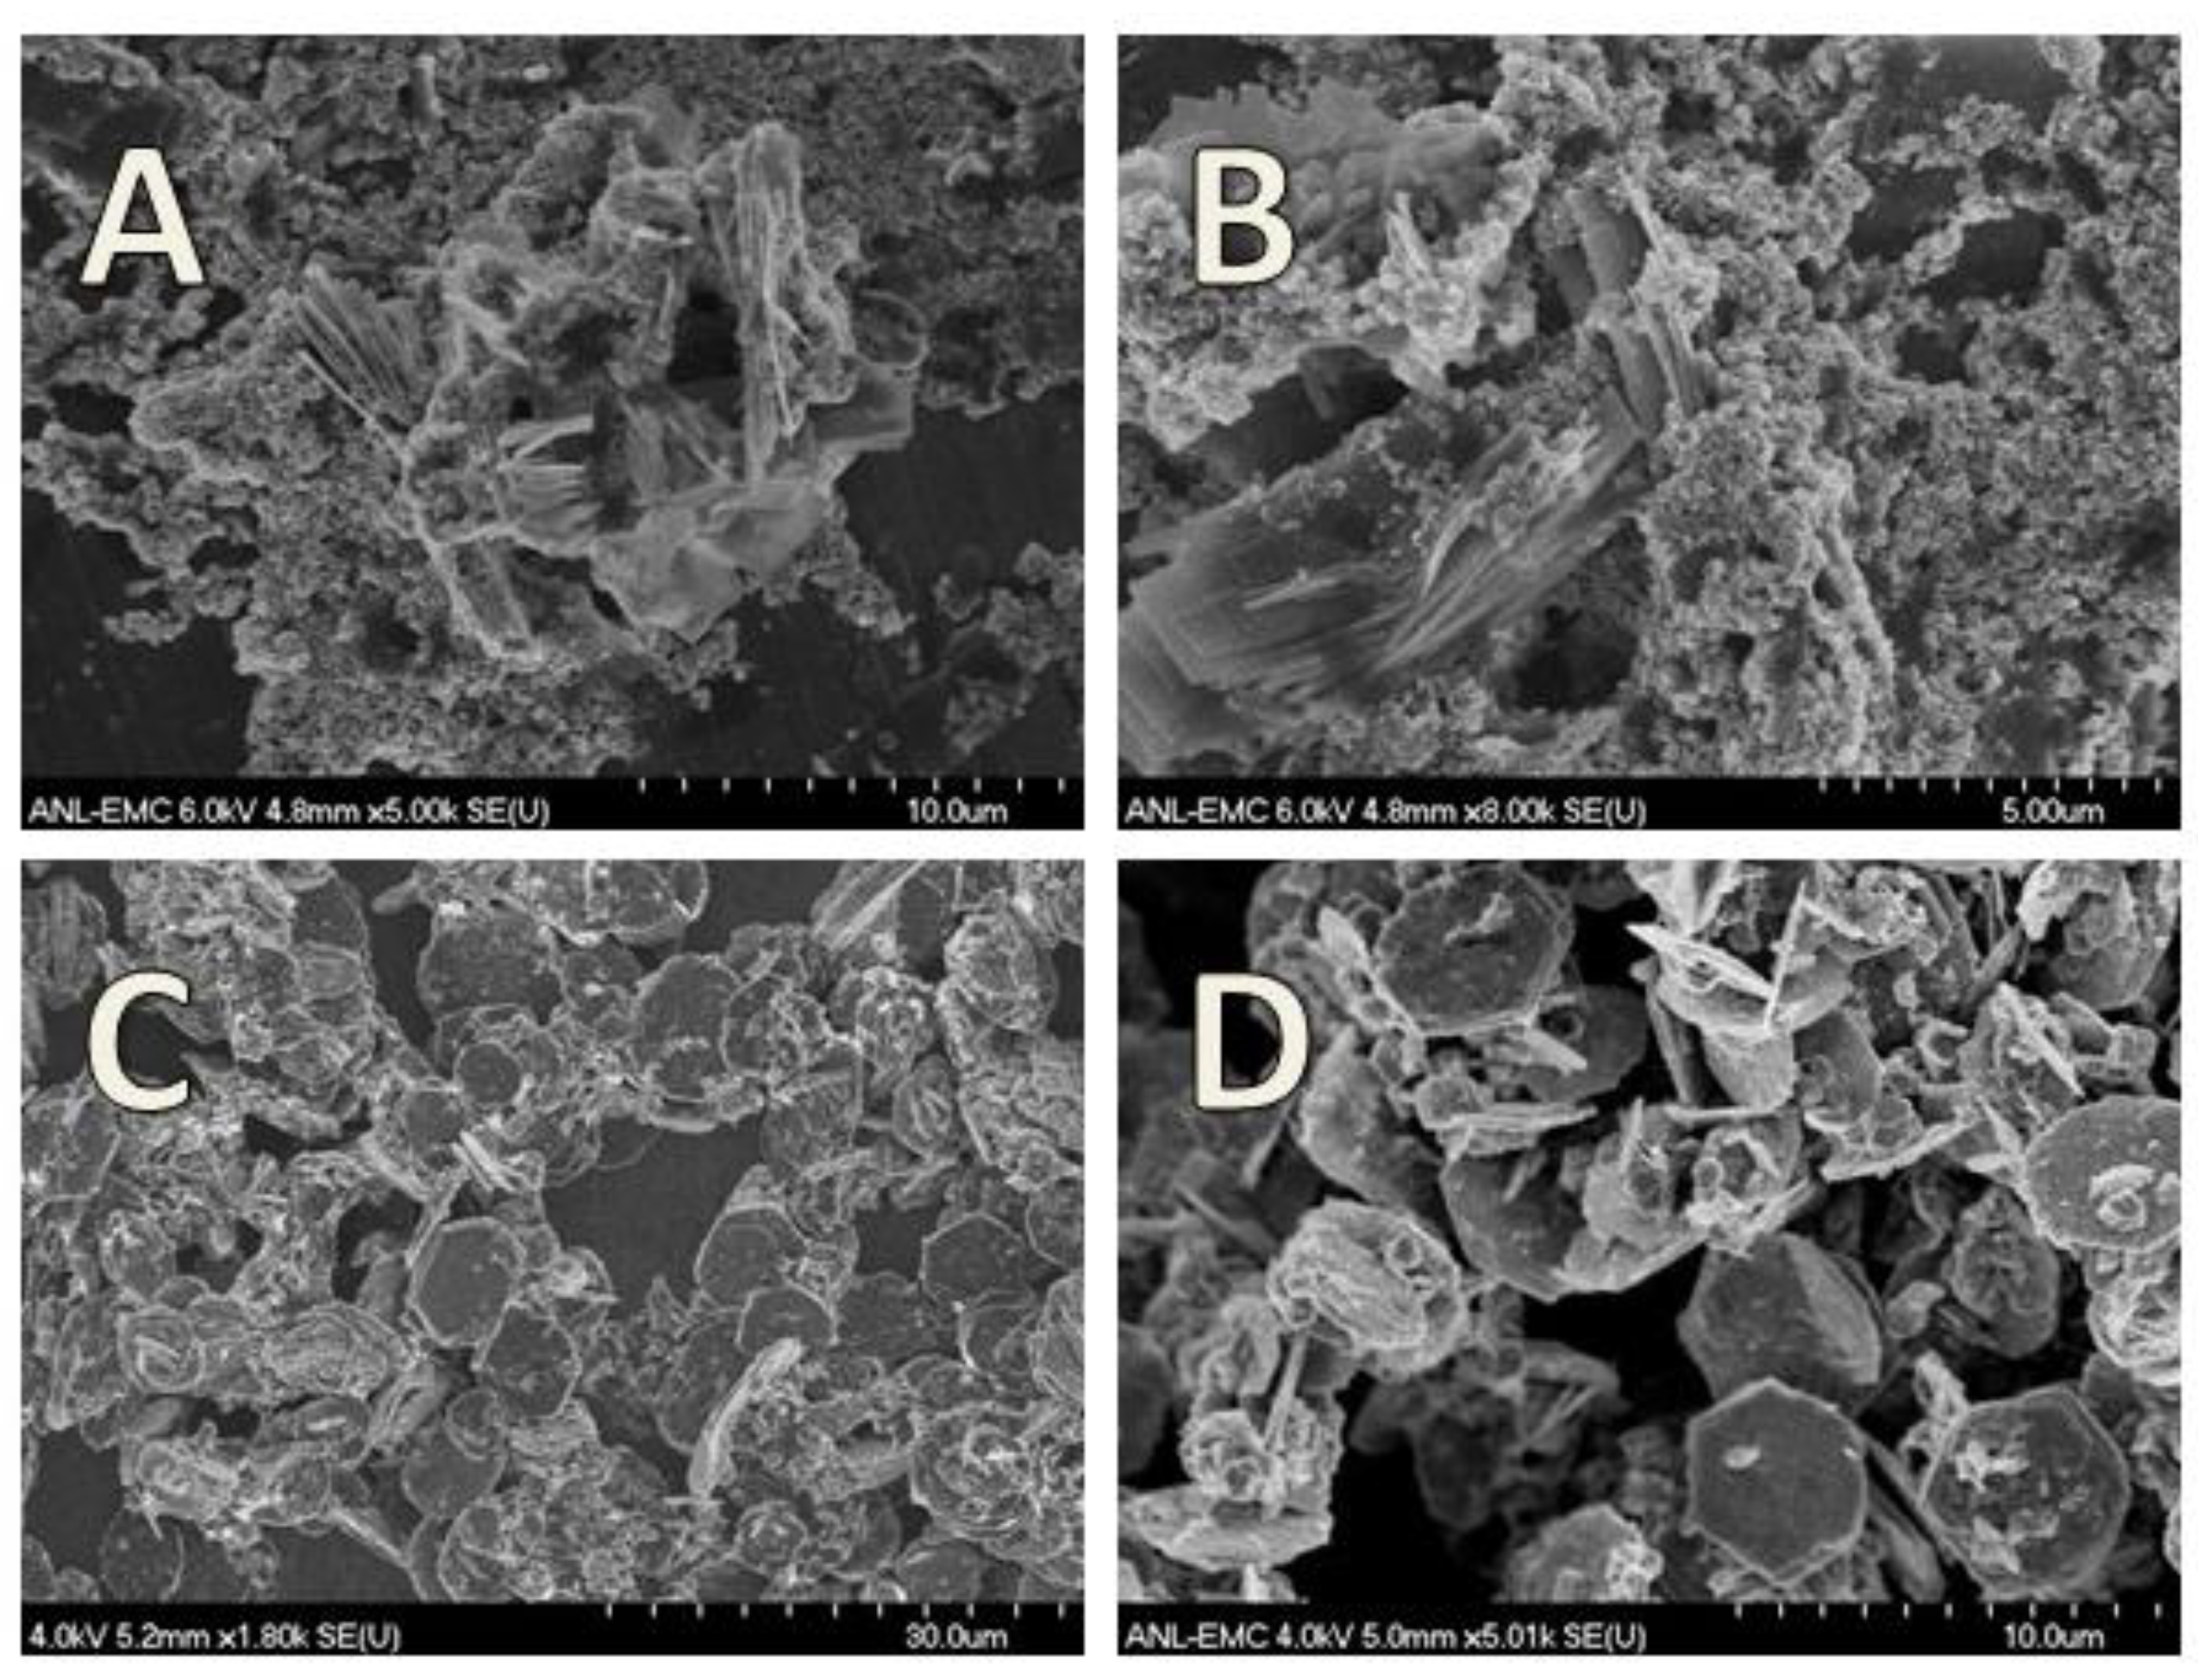
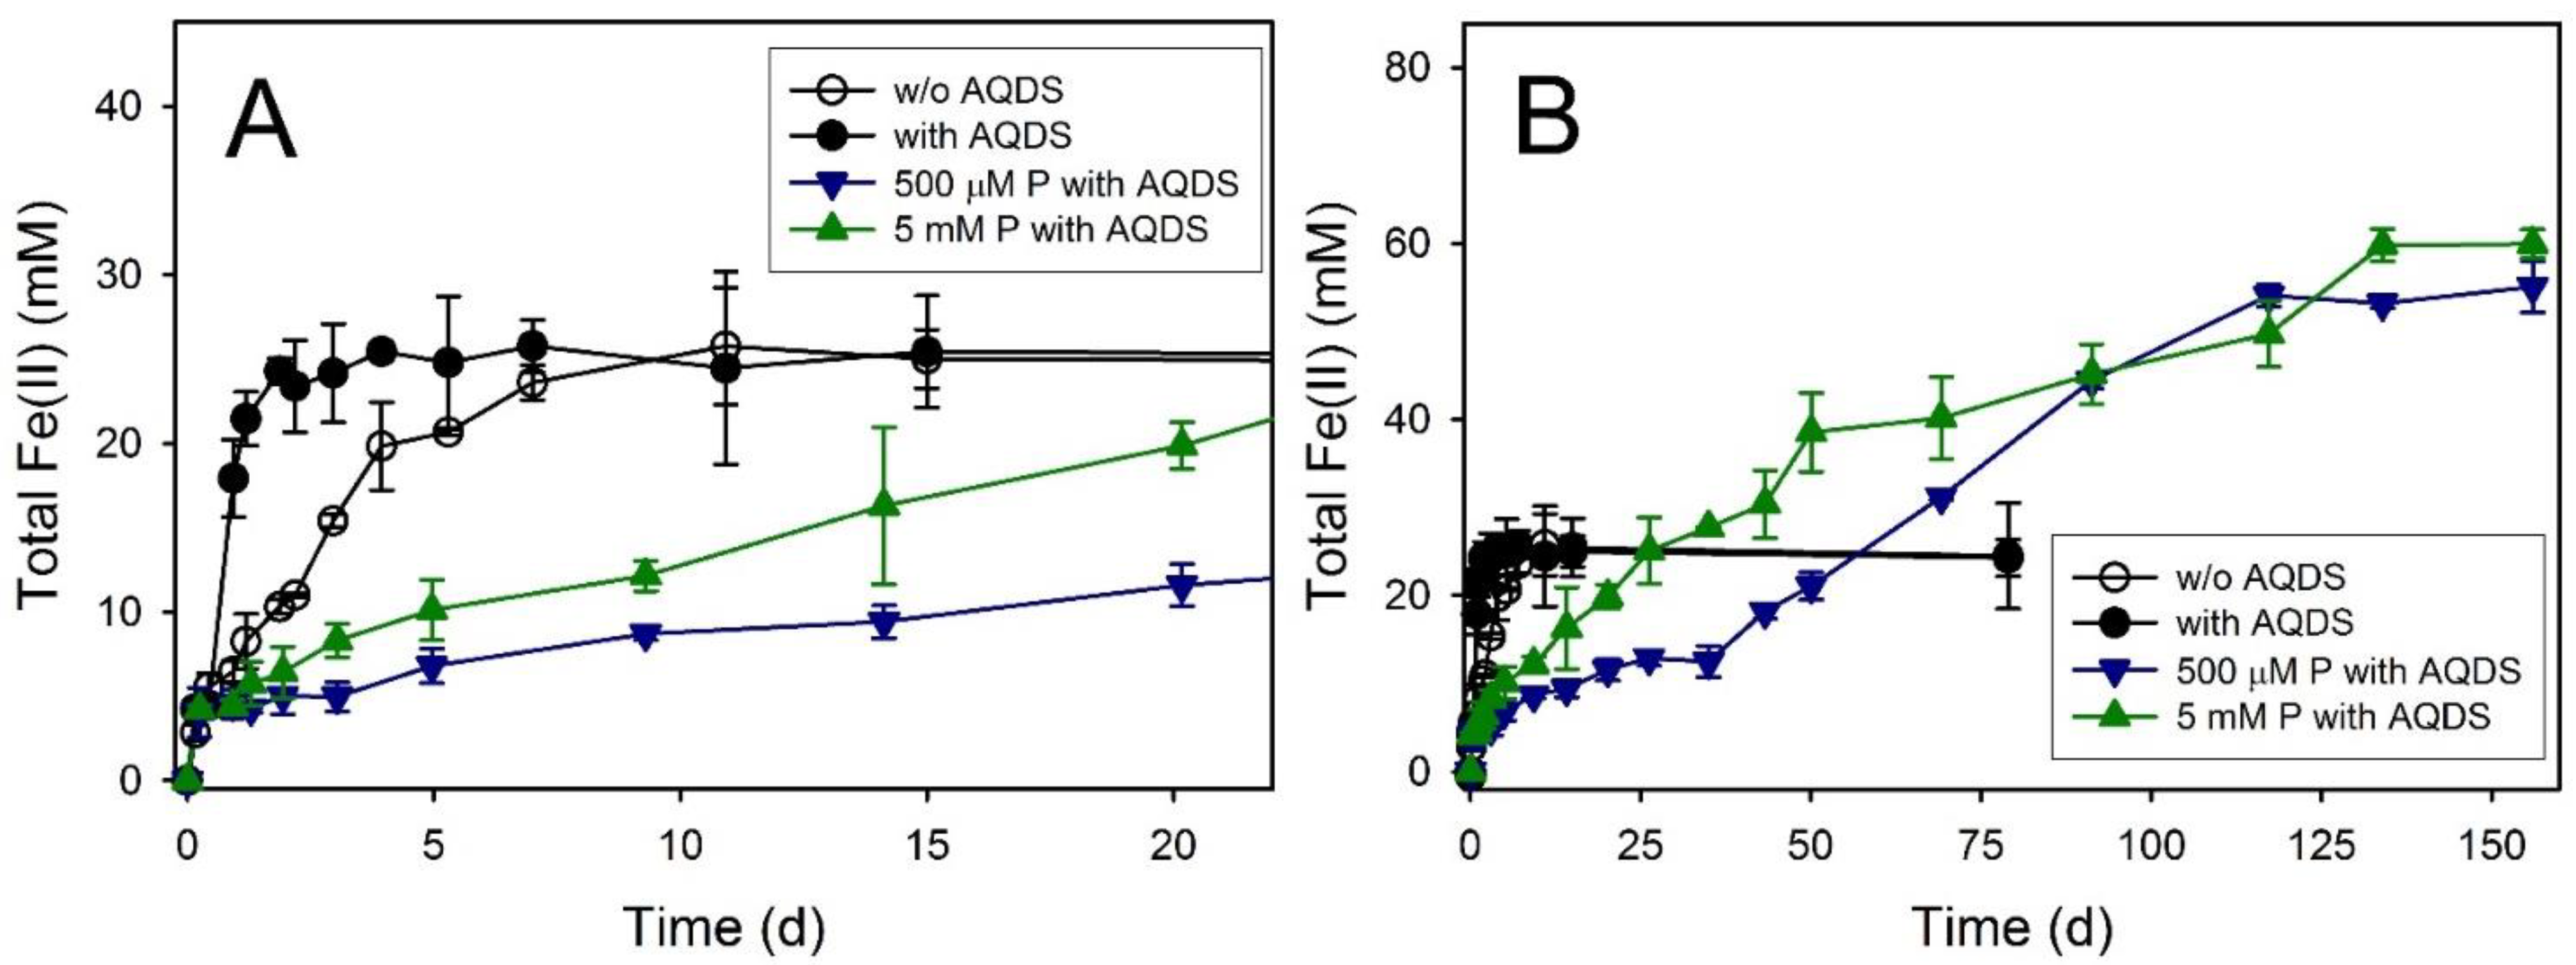
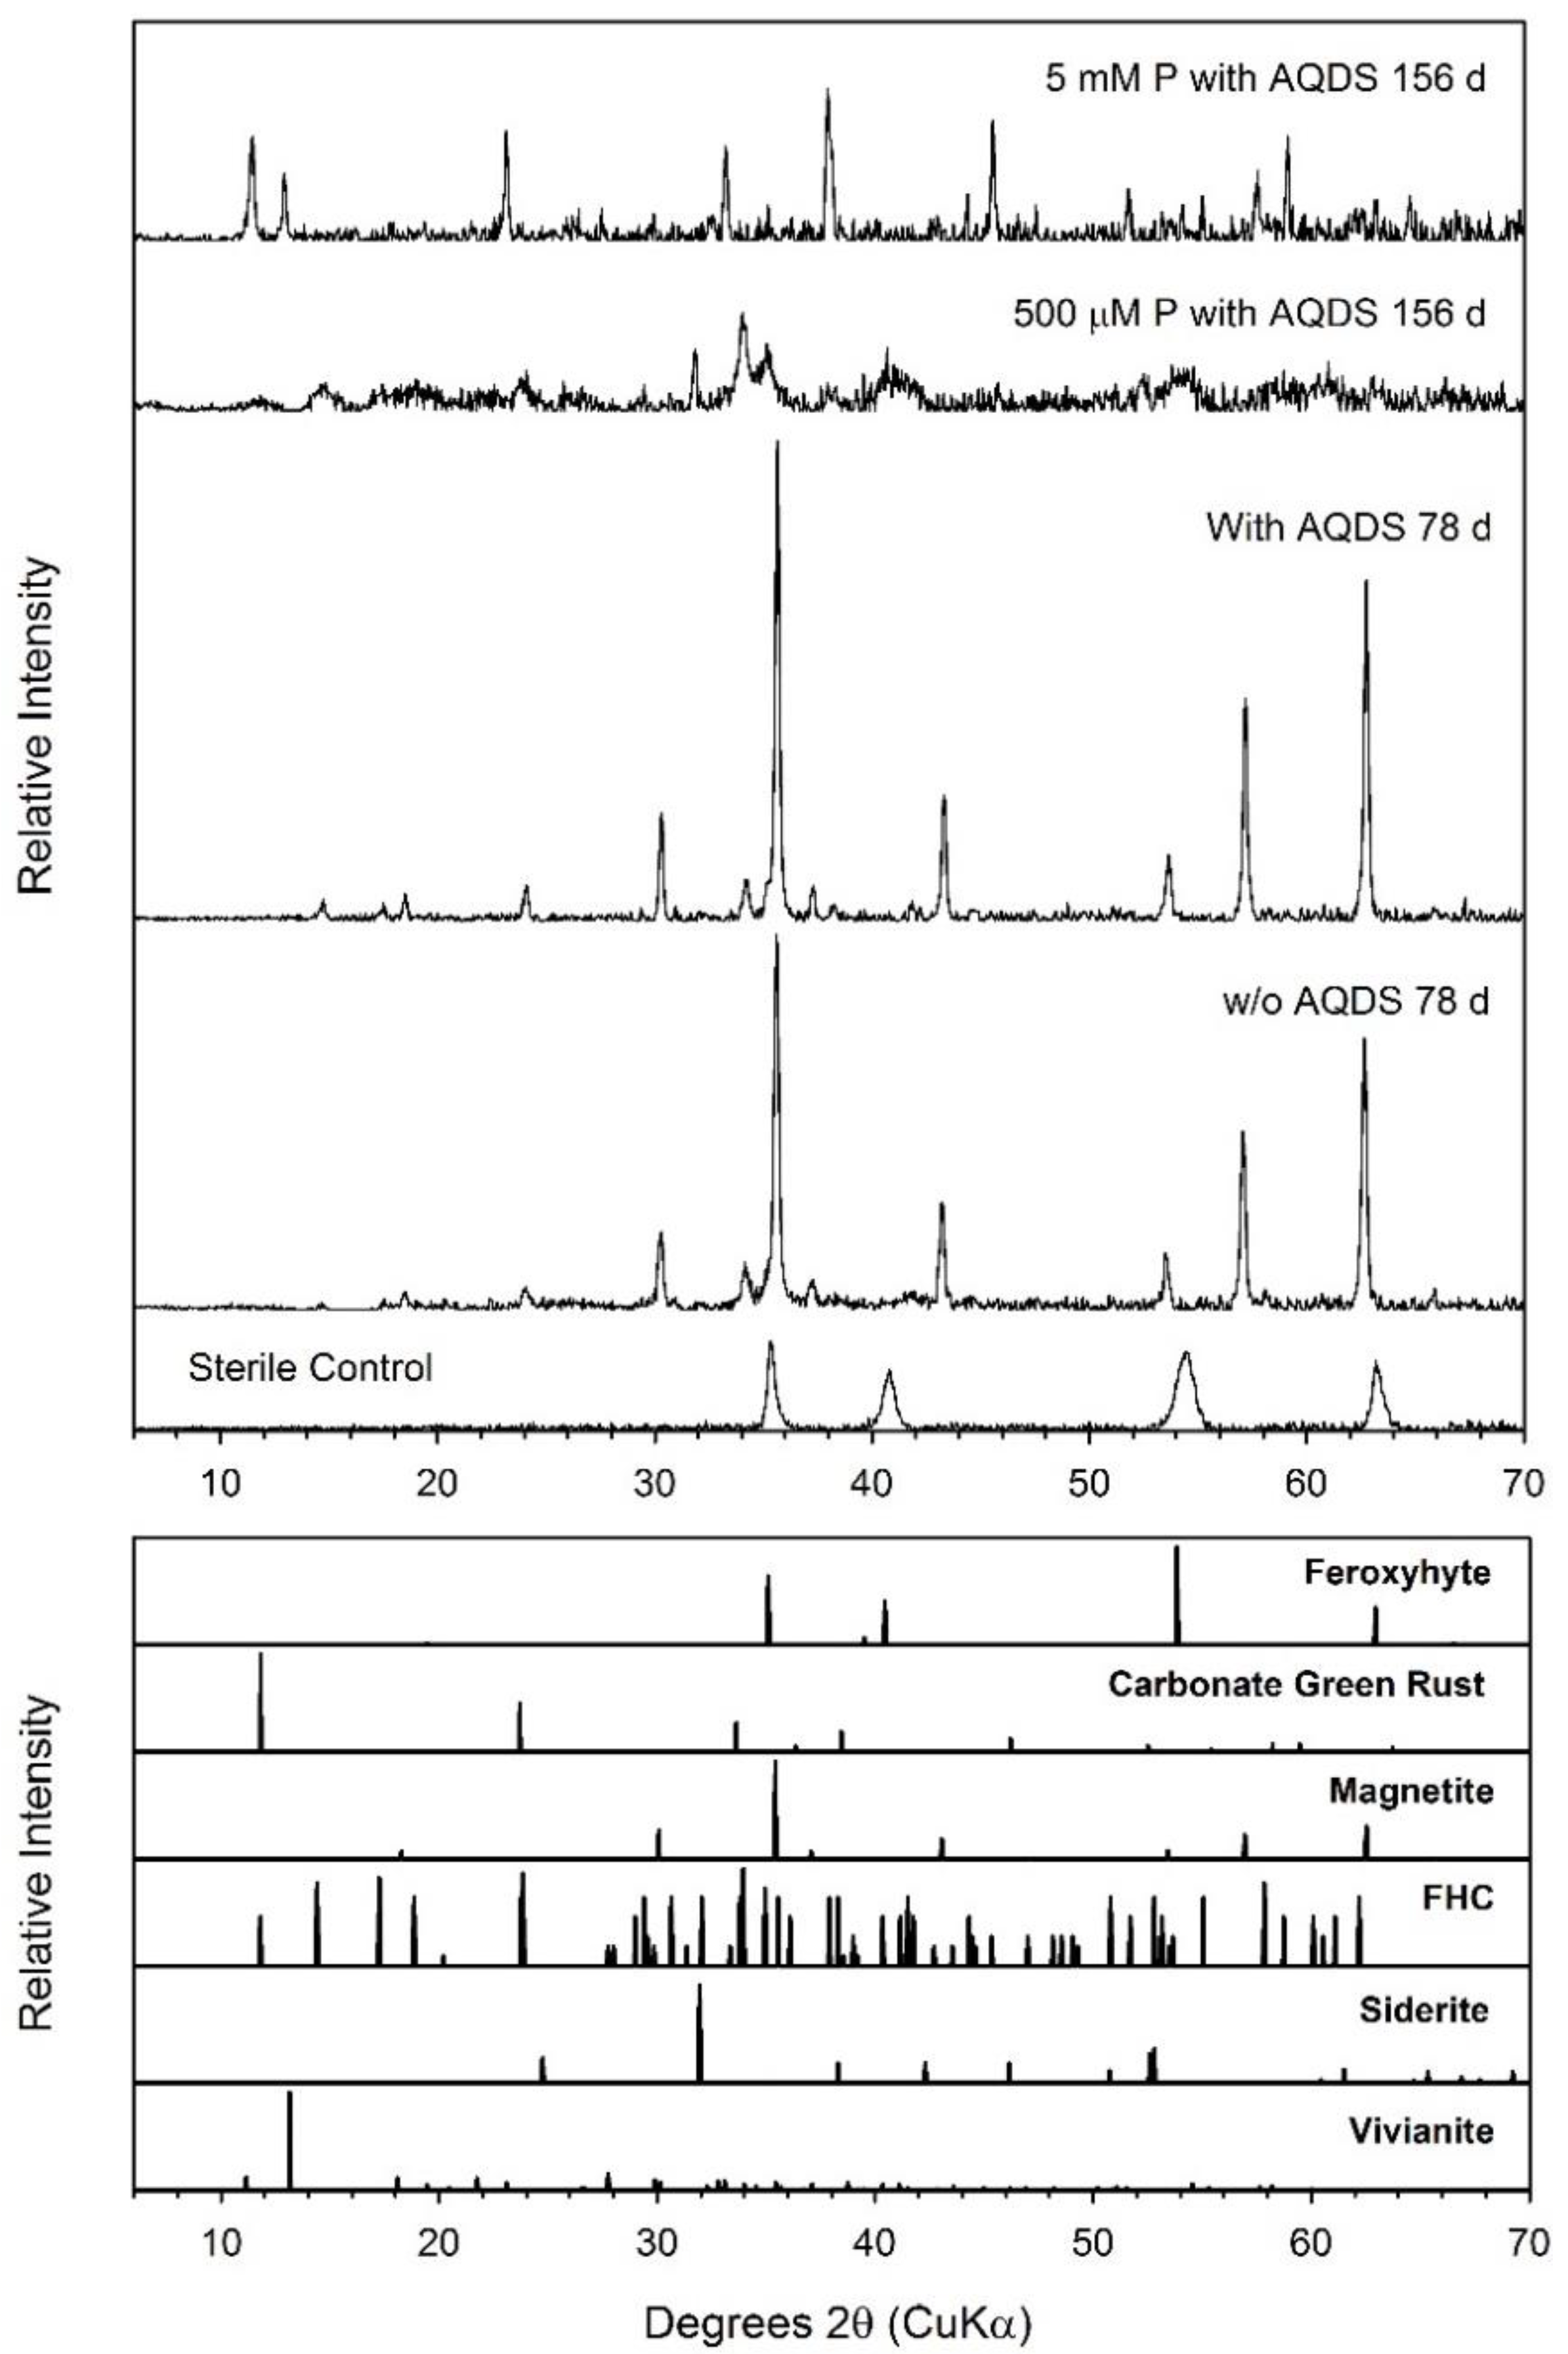
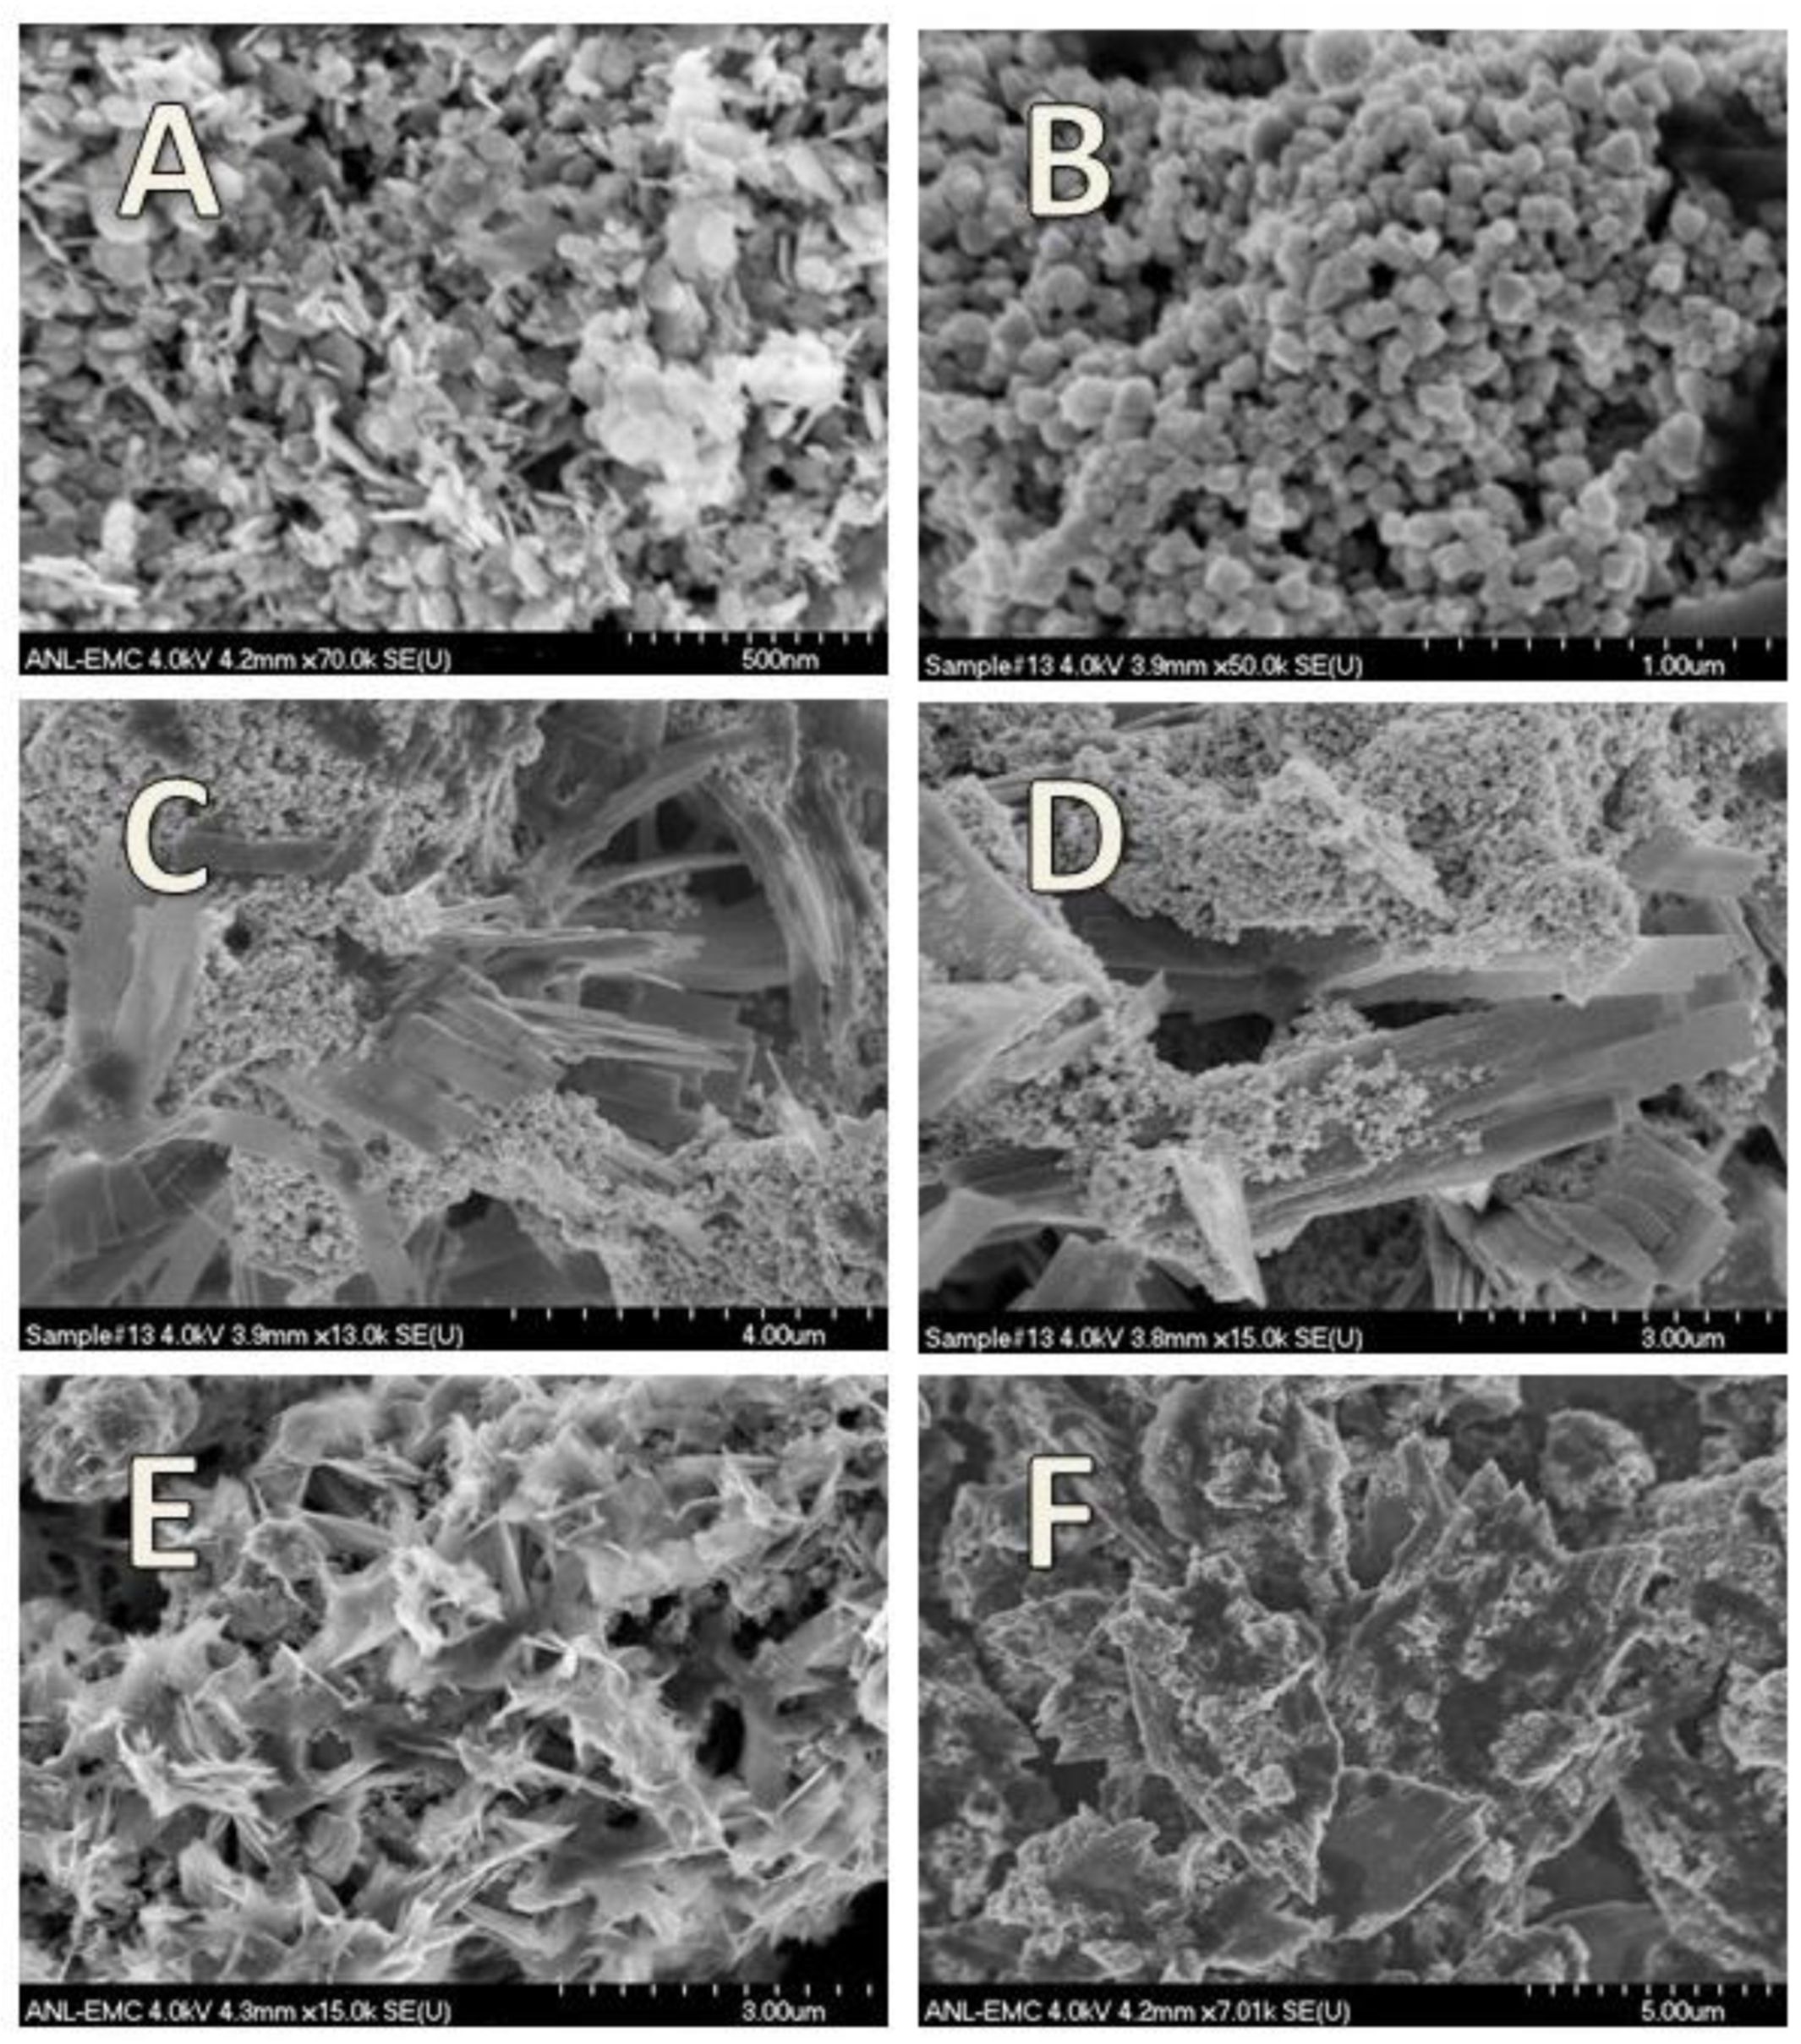
3.7. Feroxyhyte
3.8. Ferric Green Rust
4. Discussion
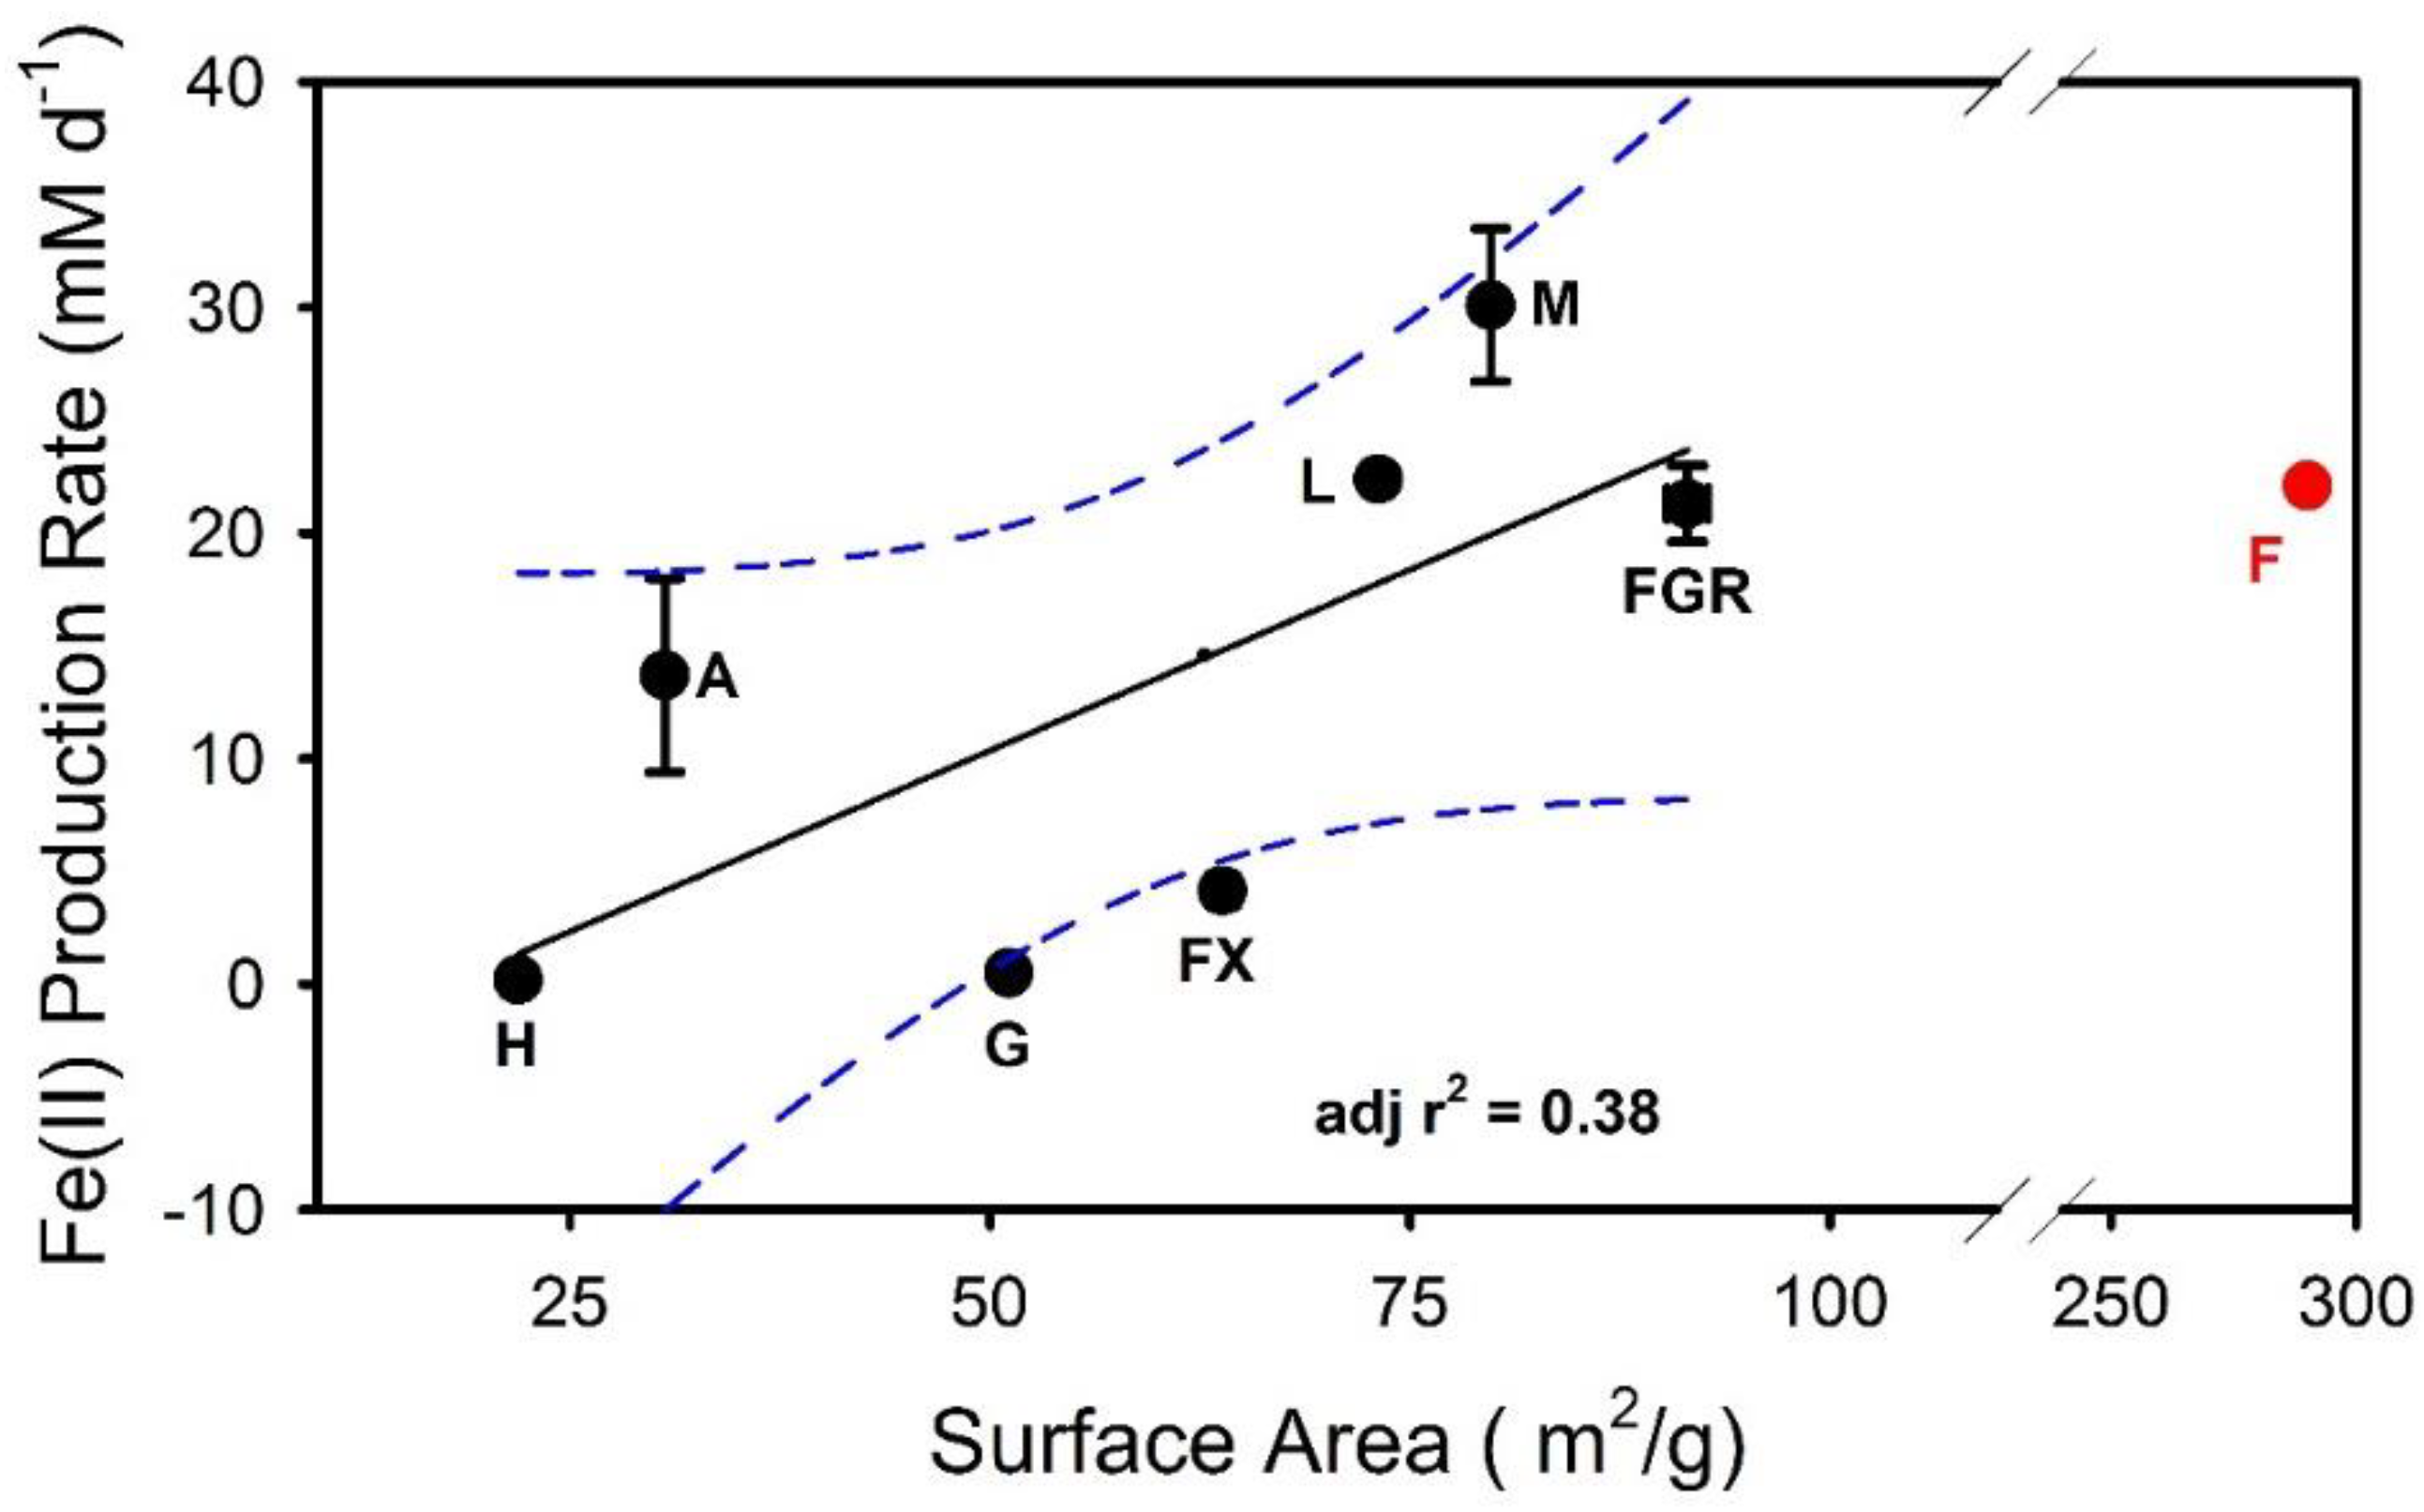
4.1. Fe(II)-Secondary Mineral Formation in Relation to Parent Fe(III) Oxide in Unamended Systems
4.2. Impact of AQDS on Fe(II) Secondary Mineral Formation
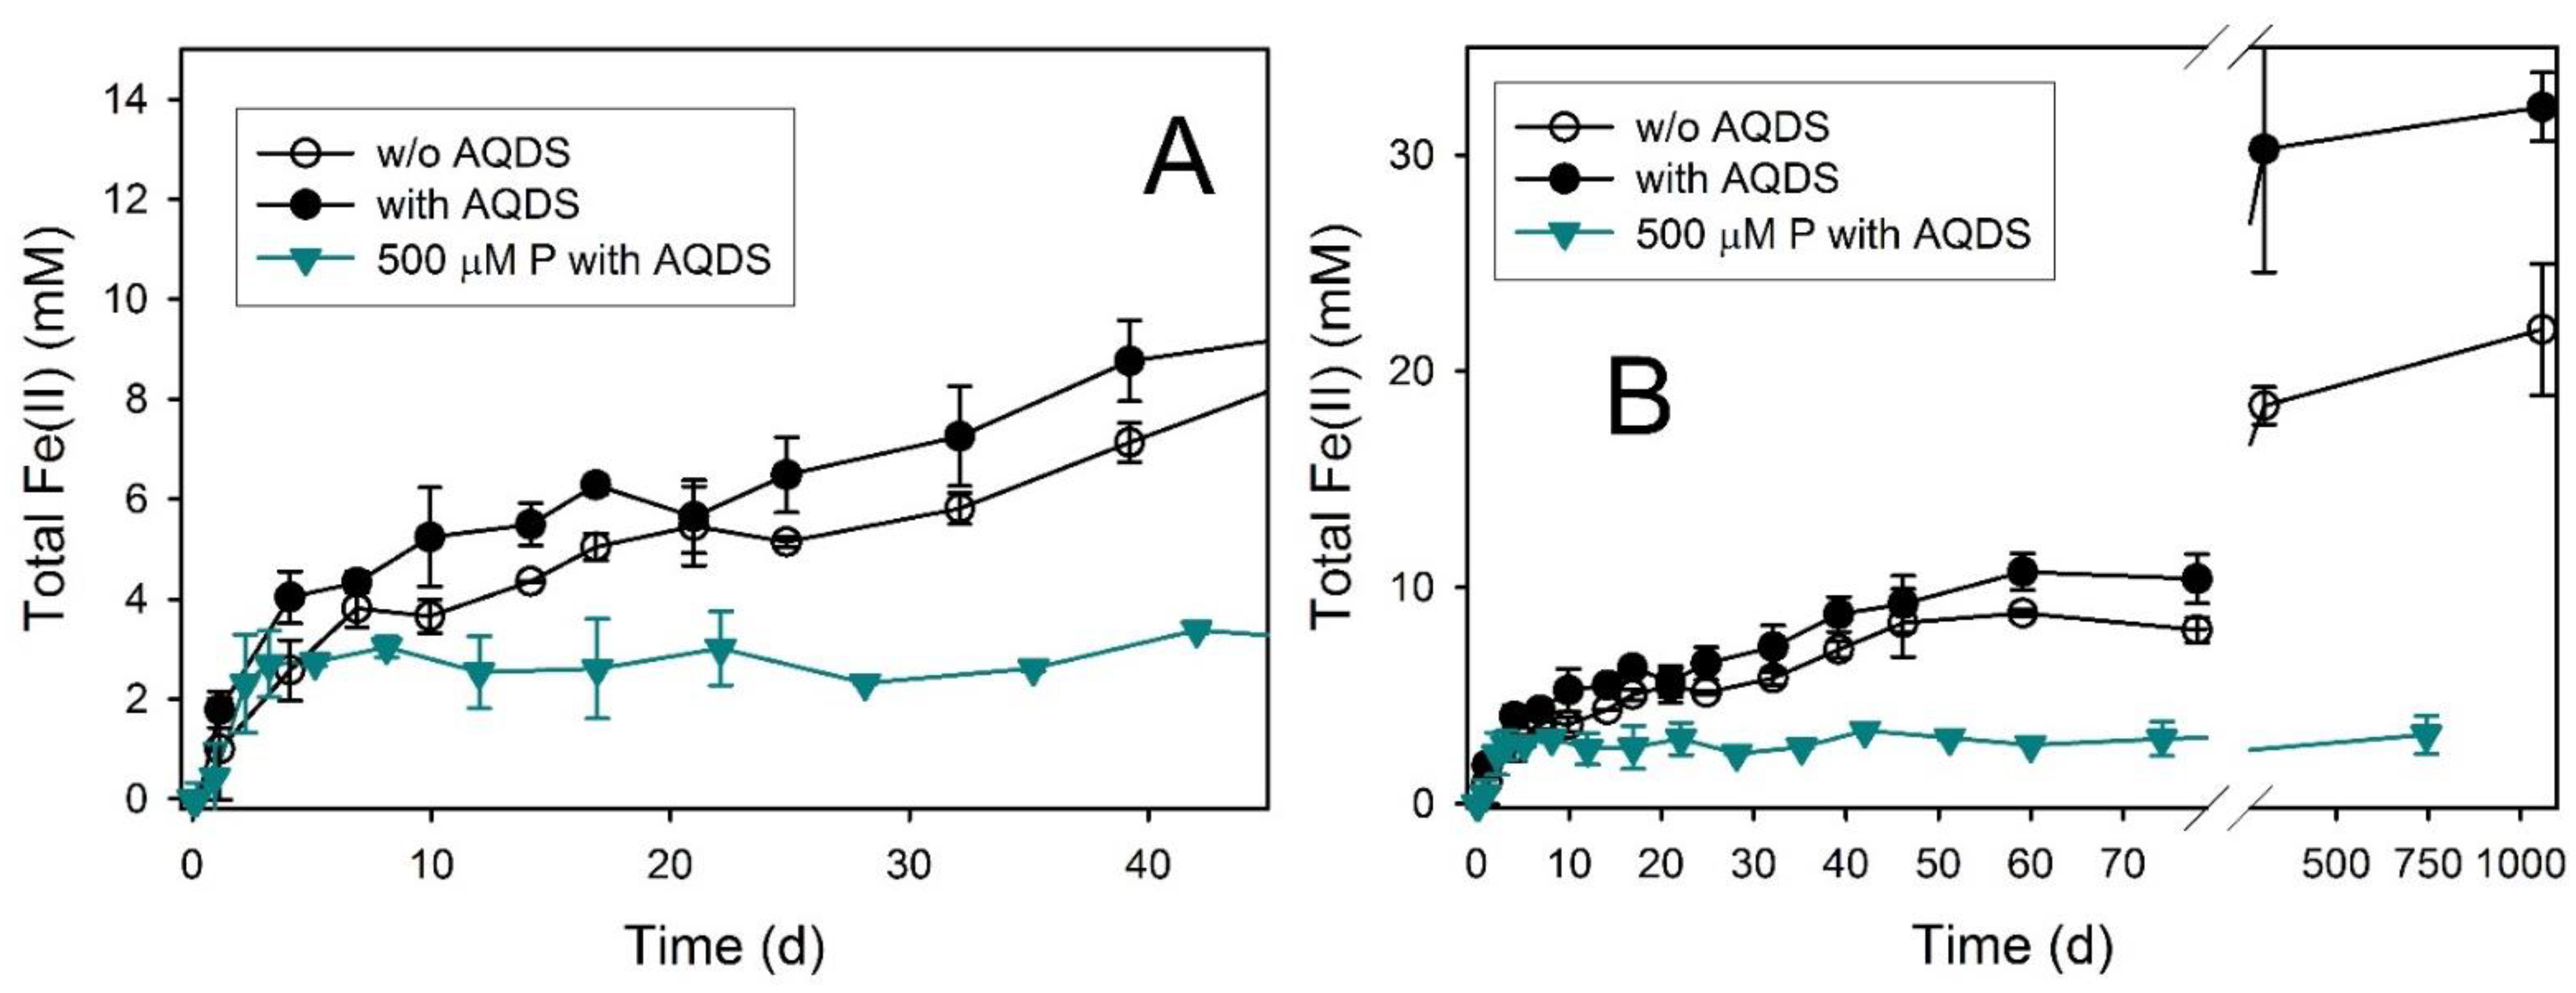
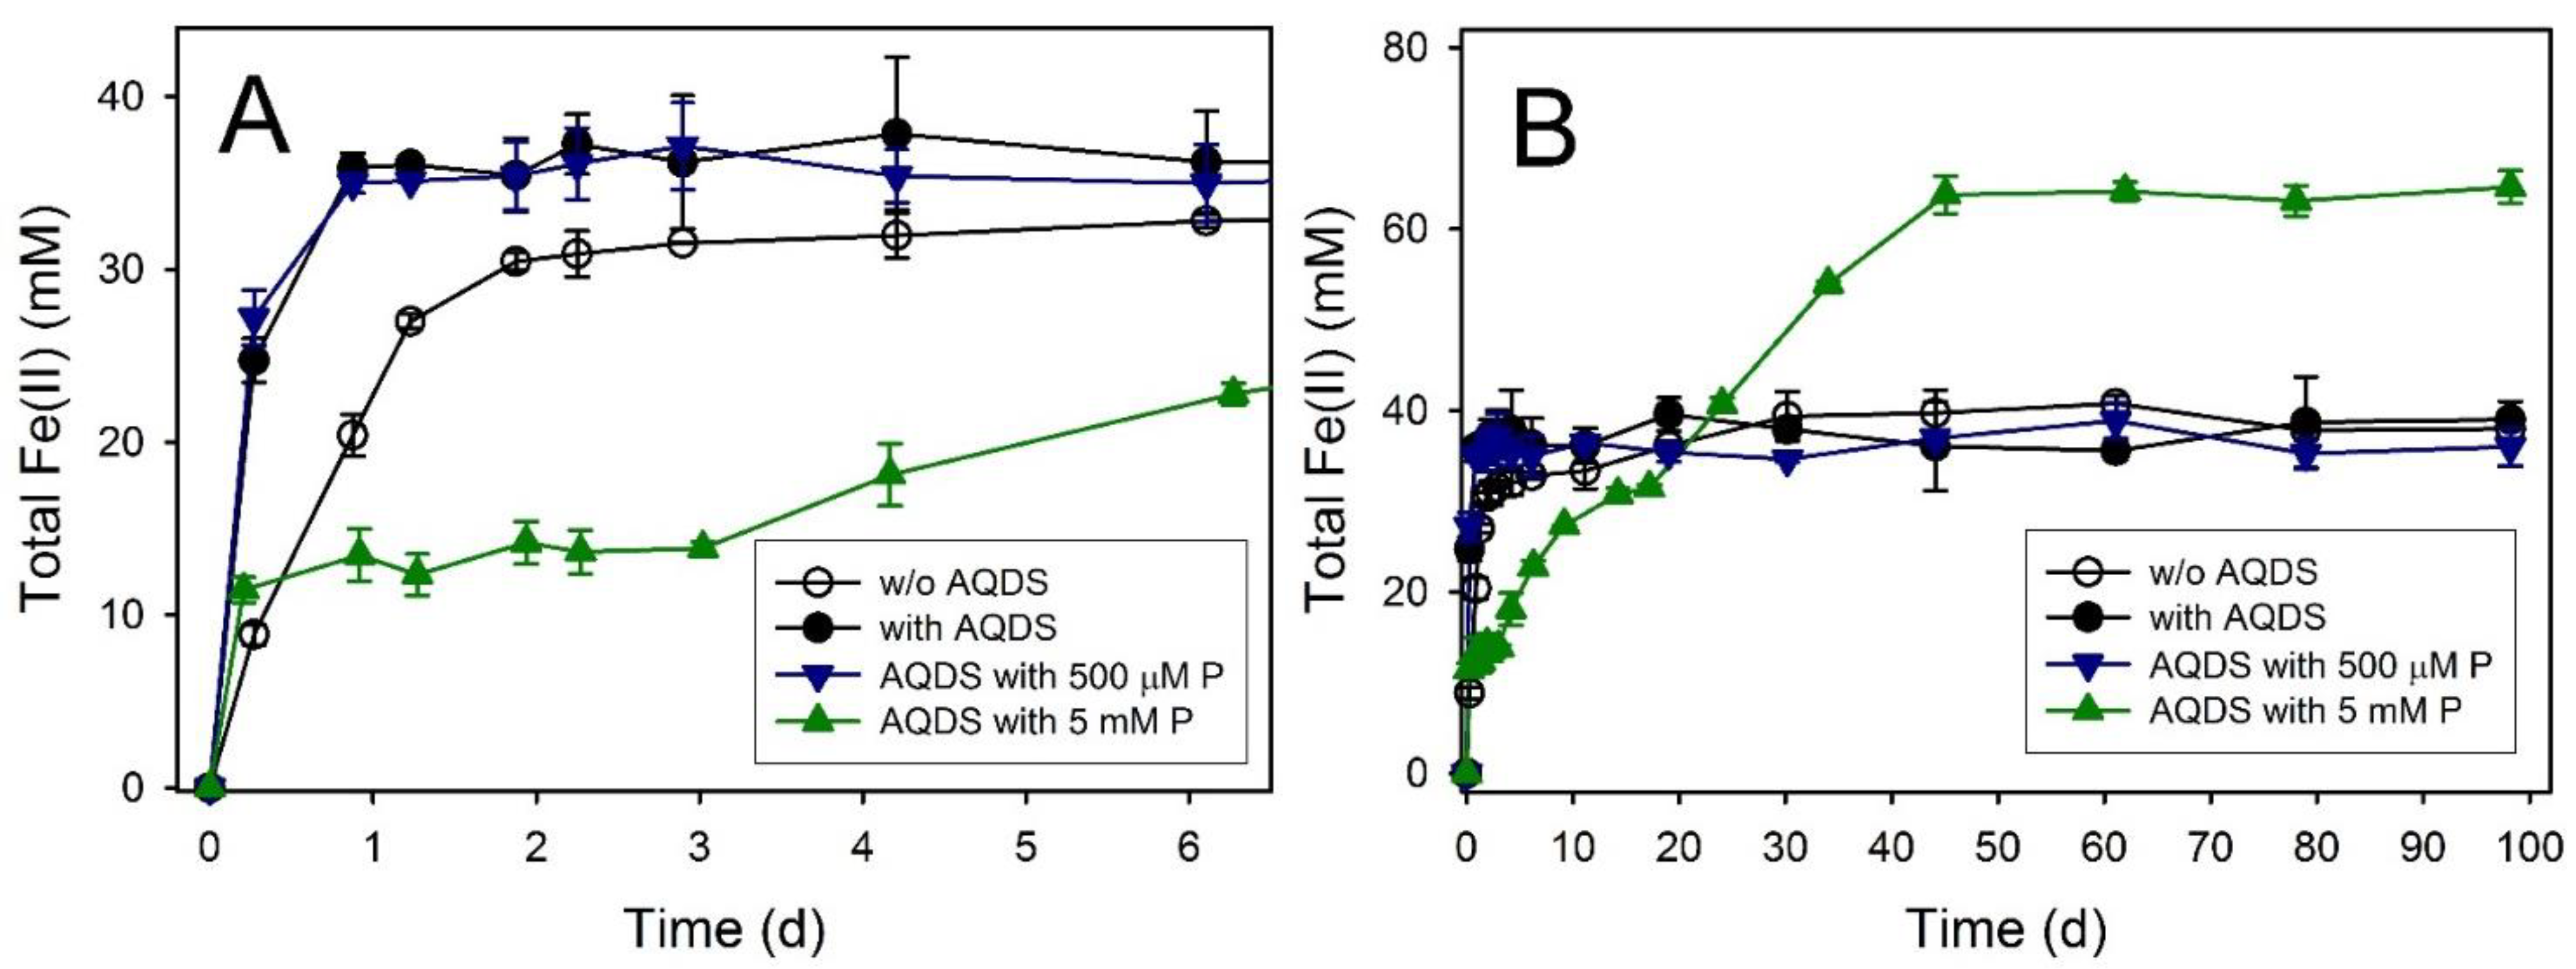
4.3. Phosphate Effects on Fe(II) Secondary Mineral Formation
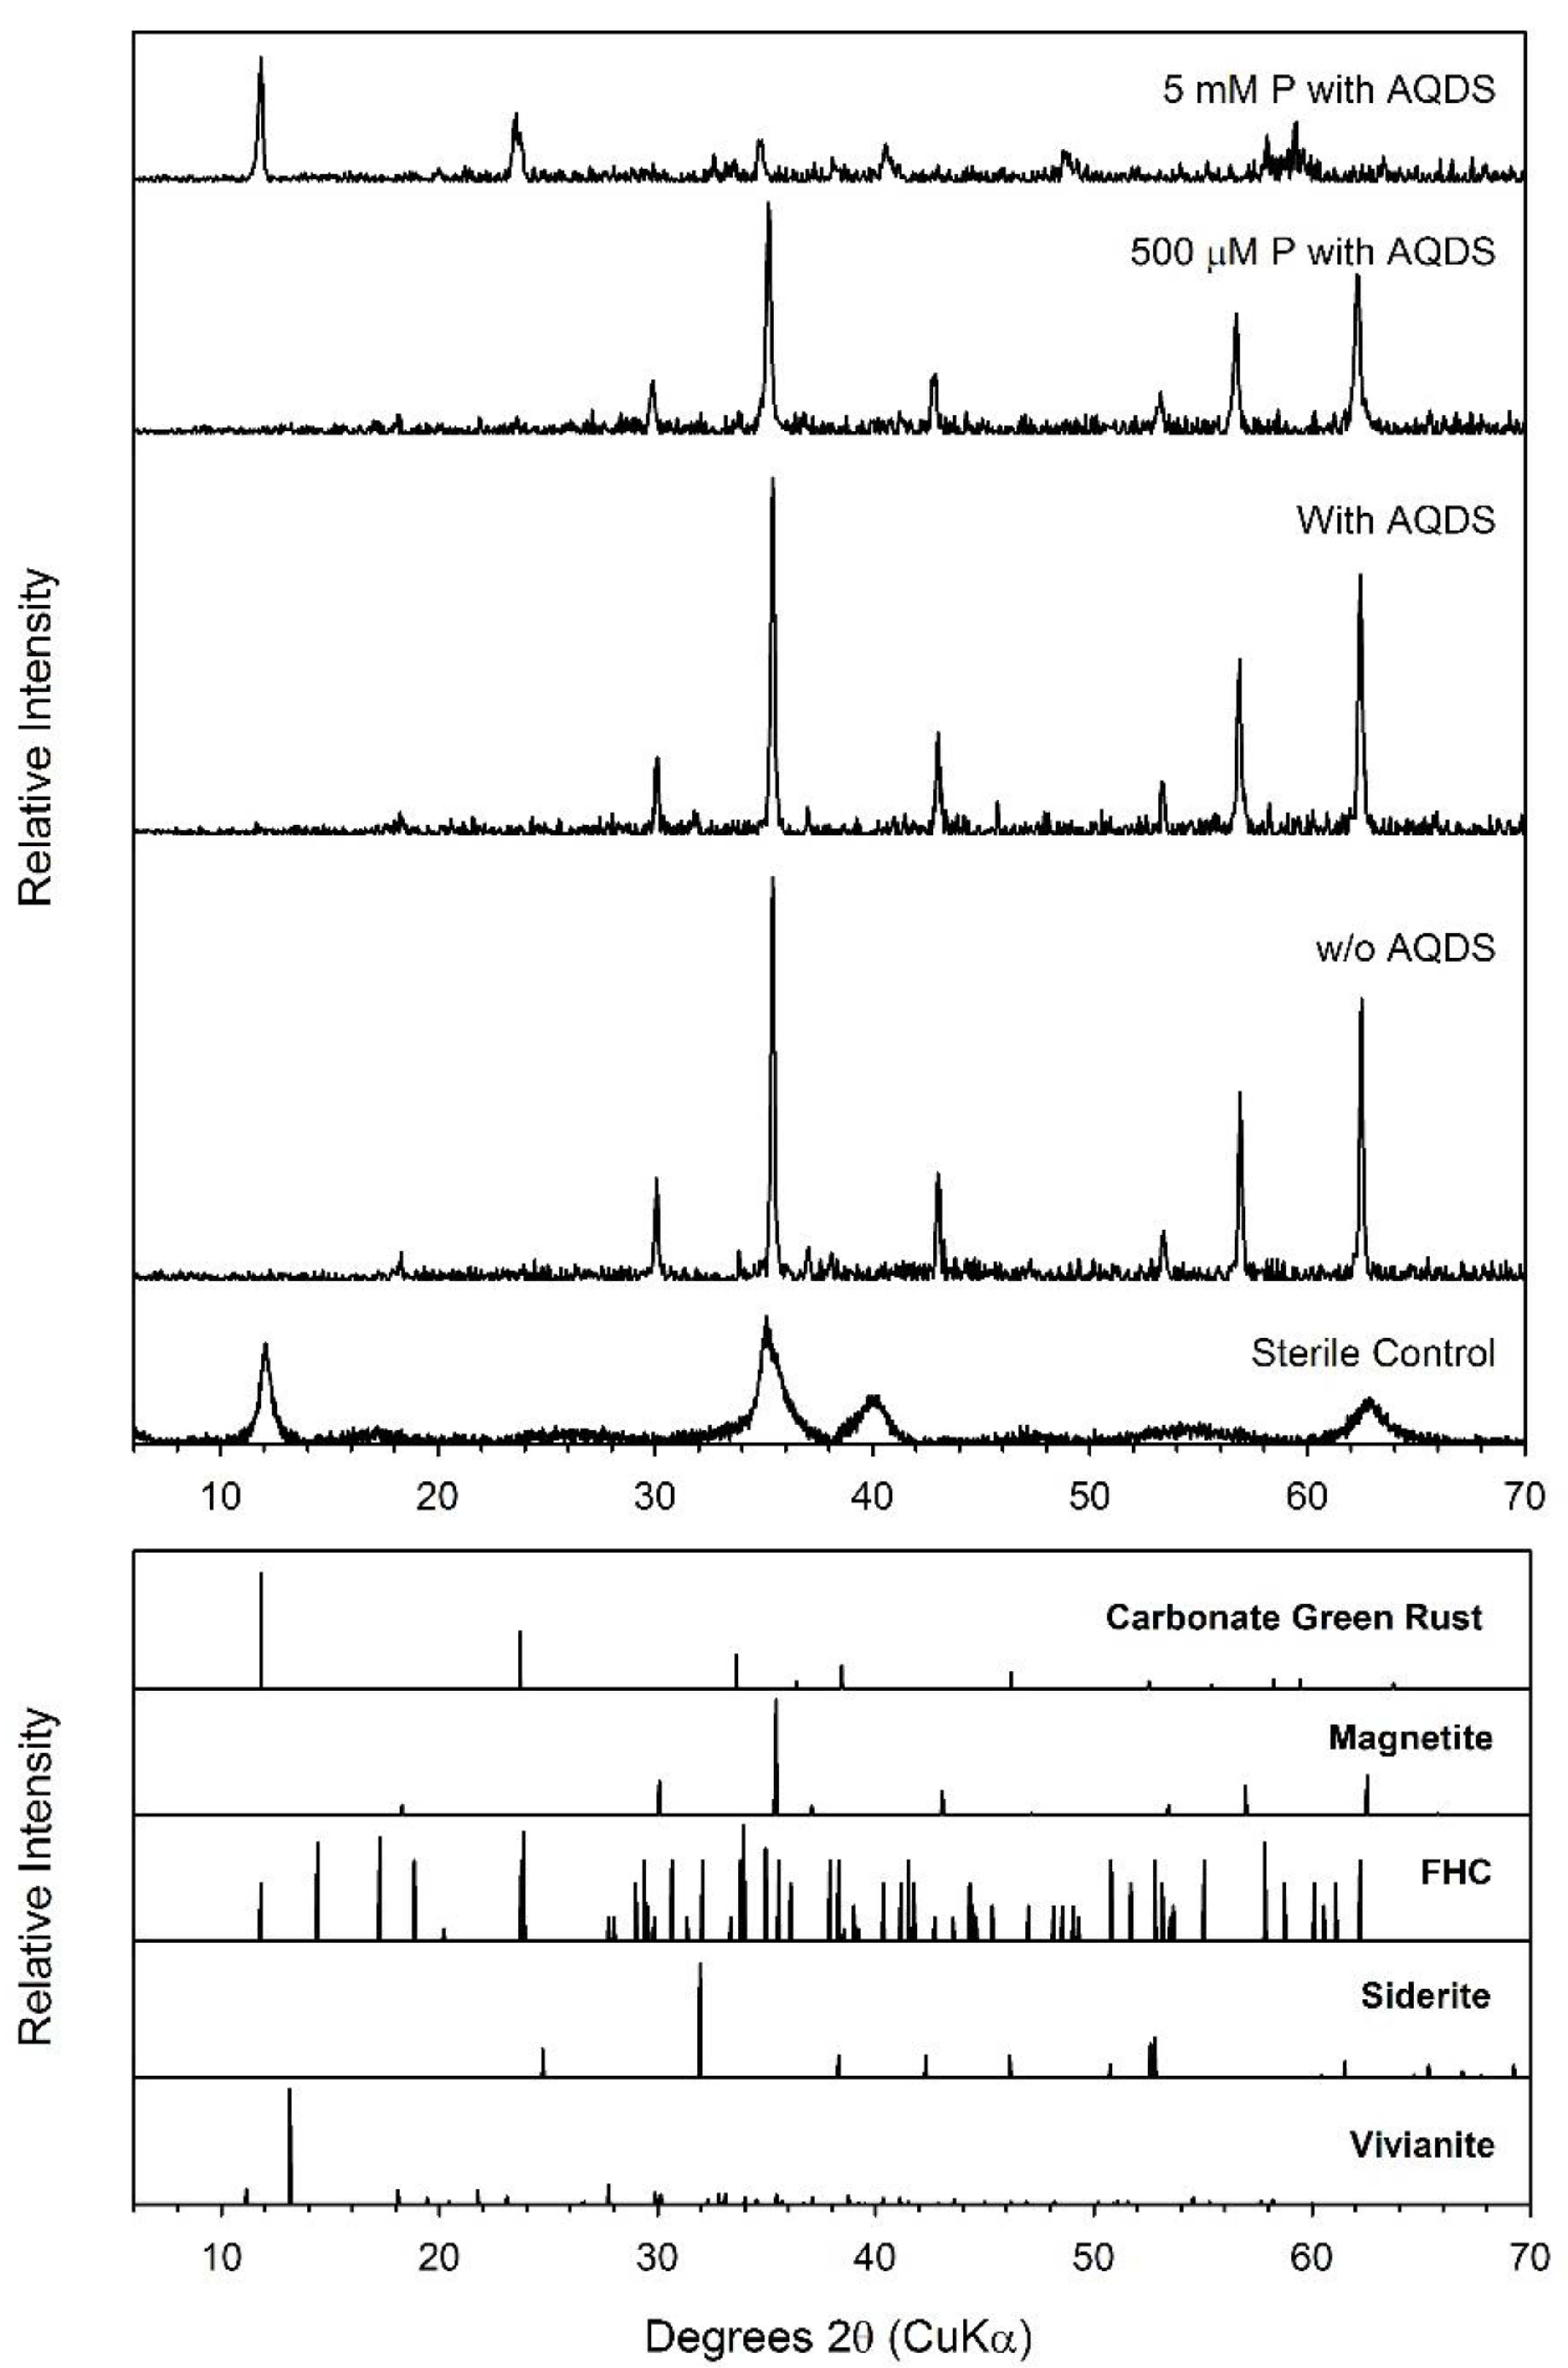
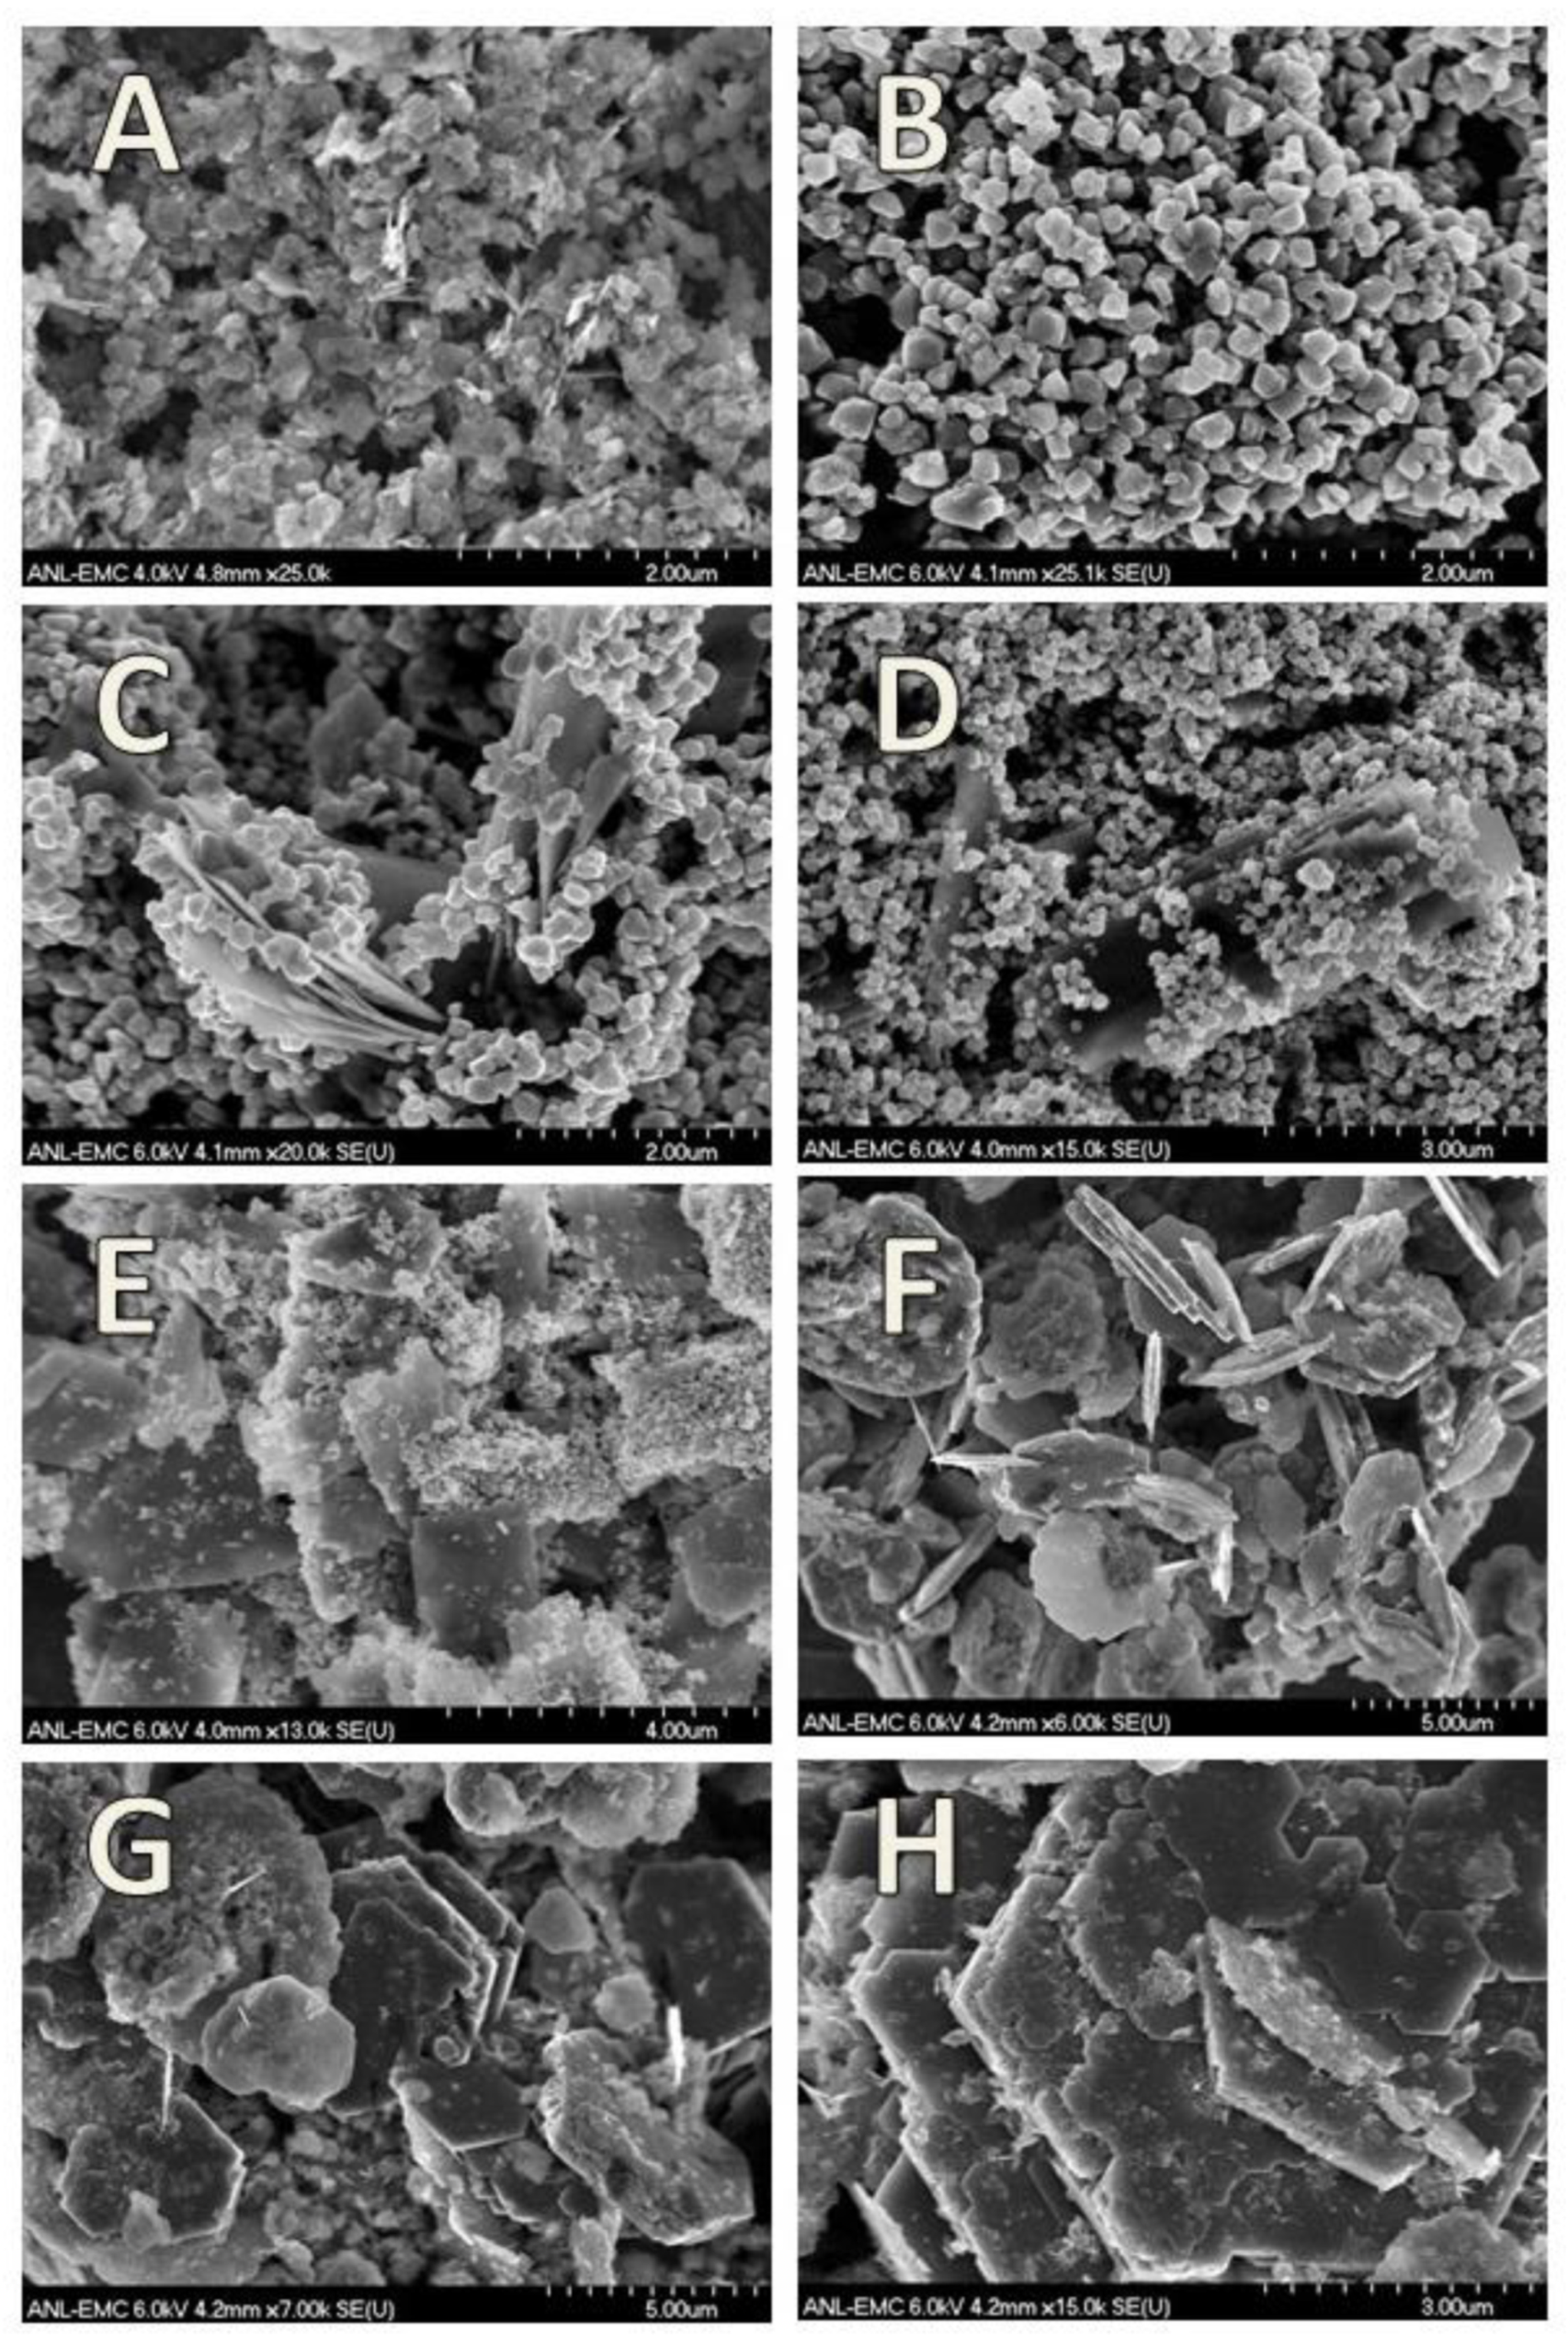
4.4. Formation of Green Rust as a Secondary Mineral during Fe(III) Oxide Bioreduction
4.5. Environmental Relevance
Author Contributions
Funding
Data Availability Statement
Acknowledgments
Conflicts of Interest
References
- Roden, E.E.; Lovley, D.R. Dissimilatory Fe(III) reduction by the marine microorganism Desulfuromonas acetoxidans. Appl. Environ. Microbiol. 1993, 59, 734–742. [Google Scholar] [CrossRef]
- Caccavo, F., Jr.; Coates, J.D.; Rossello-Mora, R.A.; Ludwig, W.; Schleifer, K.H.; Lovley, D.R.; McInerney, M.J. Geovibrio ferrireducens, a phylogenetically distinct dissimilatory Fe(III)-reducing bacterium. Arch. Microbiol. 1996, 165, 370–376. [Google Scholar] [CrossRef] [PubMed]
- Coates, J.D.; Bhupathiraju, V.K.; Achenbach, L.; McInerney, M.J.; Lovley, D.R. Geobacter hydrogenophilus, Geobacter chapelli and Geobacter grbiciae, three new, strictly anaerobic, dissimilatory Fe(III)-reducers. Int. J. Syst. Evolut. Microbiol. 2001, 51, 581–588. [Google Scholar] [CrossRef]
- Coates, J.D.; Ellis, D.J.; Gaw, C.V.; Lovley, D.R. Geothrix fermentans gen. nov., sp. nov., a novel Fe(III)-reducing bacterium from a hydrocarbon-contaminated aquifer. Int. J. Syst. Bacteriol. 1999, 49, 1615–1622. [Google Scholar] [CrossRef] [PubMed]
- Dong, Y.; Sanford, R.A.; Boyanov, M.I.; Kemner, K.M.; Flynn, T.M.; O’Loughlin, E.J.; Chang, Y.J.; Locke, R.A., Jr.; Weber, J.R.; Egan, S.M.; et al. Orenia metallireducens sp. nov. strain Z6, a novel metal-reducing member of the phylum firmicutes from the deep subsurface. Appl. Environ. Microbiol. 2016, 82, 6440–6453. [Google Scholar] [CrossRef] [PubMed]
- Dong, Y.; Sanford, R.A.; Boyanov, M.I.; Kemner, K.M.; Flynn, T.M.; O’Loughlin, E.J.; Locke Ii, R.A.; Weber, J.R.; Egan, S.M.; Fouke, B.W. Tepidibacillus decaturensis sp. nov.: A microaerophilic, moderately thermophilic iron-reducing bacterium isolated from a depth of 1.7 km in the Illinois Basin, USA. Int. J. Syst. Evol. Microbiol. 2016. [Google Scholar] [CrossRef]
- Ettwig, K.F.; Zhu, B.; Speth, D.; Keltjens, J.T.; Jetten, M.S.; Kartal, B. Archaea catalyze iron-dependent anaerobic oxidation of methane. Proc. Natl. Acad. Sci. USA 2016. [Google Scholar] [CrossRef]
- Kashefi, K.; Lovley, D.R. Reduction of Fe(III), Mn(IV), and toxic metals at 100 °C by Pyrobacterium islandicum. Appl. Environ. Microbiol. 2000, 66, 1050–1056. [Google Scholar] [CrossRef]
- Sanford, R.A.; Cole, J.R.; Tiedje, J.M. Characterization and description of Anaeromyxobacter dehalogens gen. nov., sp. nov., an Aryl-halorespiring facultative anaerobic myxobacterium. Appl. Environ. Microbiol. 2002, 68, 893–900. [Google Scholar] [CrossRef]
- Roh, Y.; Liu, S.V.; Li, G.; Huang, H.; Phelps, T.J.; Zhou, J. Isolation and characterization of metal-reducing Thermoanaerobacter strains from deep subsurface environments of the Piceance Basin, Colorado. Appl. Environ. Microbiol. 2002, 68, 6013–6020. [Google Scholar] [CrossRef]
- Lovley, D.R.; Giovanoli, S.J.; White, D.C.; Champine, J.E.; Phillips, E.J.P.; Gorby, Y.A.; Goodwin, S. Geobacter metallireducens gen. nov. sp. nov., a microorganism capable of coupling the complete oxidation of organic compounds to the reduction of iron and other metals. Arch. Microbiol. 1993, 159, 336–344. [Google Scholar] [CrossRef] [PubMed]
- O’Loughlin, E.J.; Larese-Casanova, P.; Scherer, M.M.; Cook, R.E. Green rust formation from the bioreduction of g-FeOOH (lepidocrocite): Comparison of several Shewanella species. Geomicrobiol. J. 2007, 24, 211–230. [Google Scholar]
- Slobodkin, A.; Reysenbach, A.L.; Strutz, N.; Dreier, M.; Wiegel, J. Thermoterrabacterium ferrireducens gen. nov., sp. nov., a thermophilic anaerobic dissimilatory Fe(III)-reducing bacterium from a continental hot spring. Int. J. Syst. Bacteriol. 1997, 47, 541–547. [Google Scholar] [CrossRef] [PubMed]
- Greene, A.C.; Patel, B.K.; Sheehy, A.J. Deferribacter thermophilus gen. nov., sp. nov., a novel thermophilic manganese- and iron-reducing bacterium isolated from a petroleum reservoir. Int. J. Syst. Bacteriol. 1997, 47, 505–509. [Google Scholar] [CrossRef]
- Roh, Y.; Chon, C.-M.; Moon, J.-W. Metal reduction and biomineralization by an alkaliphilic metal-reducing bacterium, Alkaliphilus metalliredigens (QYMF). Geosci. J. 2007, 11, 415–423. [Google Scholar] [CrossRef]
- Lovley, D.R.; Stolz, J.F.; Nord, G.L., Jr.; Phillips, E.J.P. Anaerobic production of magnetite by a dissimilatory iron-reducing microorganism. Nature 1987, 330, 252–254. [Google Scholar] [CrossRef]
- Fredrickson, J.K.; Zachara, J.M.; Kennedy, D.W.; Dong, H.; Onstott, T.C.; Hinman, N.W.; Li, S.-M. Biogenic iron mineralization accompanying the dissimilatory reduction of hydrous ferric oxide by a groundwater bacterium. Geochim. Cosmochim. Acta 1998, 62, 3239–3257. [Google Scholar] [CrossRef]
- Ona-Nguema, G.; Abdelmoula, M.; Jorand, F.; Benali, O.; Géhin, A.; Block, J.-C.; Génin, J.-M.R. Iron(II,III) hydroxycarbonate green rust formation and stabilization from lepidocrocite bioreduction. Environ. Sci. Technol. 2002, 36, 16–20. [Google Scholar] [CrossRef]
- Glasauer, S.; Weidler, P.G.; Langley, S.; Beveridge, T.J. Controls on Fe reduction and mineral formation by a subsurface bacterium. Geochim. Cosmochim. Acta 2003, 67, 1277–1288. [Google Scholar] [CrossRef]
- Roh, Y.; Zhang, C.-L.; Vali, H.; Lauf, R.J.; Zhou, J.; Phelps, T.J. Biogeochemical and environmental factors in Fe biomineralization: Magnetite and siderite formation. Clays Clay Miner. 2003, 51, 83–95. [Google Scholar] [CrossRef]
- Kukkadapu, R.K.; Zachara, J.M.; Fredrickson, J.K.; Kennedy, D.W.; Dohnalkova, A.C.; Mccready, D.E. Ferrous hydroxy carbonate is a stable transformation product of biogenic magnetite. Am. Mineral. 2005, 90, 510–515. [Google Scholar] [CrossRef][Green Version]
- Behrends, T.; Van Cappellen, P. Transformation of hematite into magnetite during dissimilatory iron reduction-conditions and mechanisms. Geomicrobiol. J. 2007, 24, 403–416. [Google Scholar] [CrossRef]
- Boyanov, M.I.; O’Loughlin, E.J.; Kemner, K.M. Iron phase transformations resulting from the respiration of Shewanella putrefaciens on a mixed mineral phase. J. Phys. Conf. Ser. 2009, 190, 1–4. [Google Scholar] [CrossRef]
- Shelobolina, E.; Konishi, H.; Xu, H.; Benzine, J.; Xiong, M.Y.; Wu, T.; Blothe, M.; Roden, E. Isolation of phyllosilicate-iron redox cycling microorganisms from an illite-smectite rich hydromorphic soil. Front. Microbiol. 2012, 3, 134. [Google Scholar] [CrossRef]
- Dong, Y.; Sanford, R.A.; Boyanov, M.I.; Flynn, T.M.; O’Loughlin, E.J.; Kemner, K.M.; George, S.; Fouke, K.E.; Li, S.; Huang, D.; et al. Controls on iron reduction and biomineralization over broad environmental conditions as suggested by the Firmicutes Orenia metallireducens strain Z6. Environ. Sci. Technol. 2020, 54, 10128–10140. [Google Scholar] [CrossRef] [PubMed]
- Cutting, R.S.; Coker, V.S.; Fellowes, J.W.; Lloyd, J.R.; Vaughan, D.J. Mineralogical and morphological constraints on the reduction of Fe(III) minerals by Geobacter sulfurreducens. Geochim. Cosmochim. Acta 2009, 73, 4004–4022. [Google Scholar] [CrossRef]
- Zegeye, A.; Mustin, C.; Jorand, F. Bacterial and iron oxide aggregates mediate secondary iron mineral formation: Green rust versus magnetite. Geobiology 2010, 8, 209–222. [Google Scholar] [CrossRef]
- Zachara, J.M.; Kukkadapu, R.K.; Frederickson, J.K.; Gorby, Y.A.; Smith, S.C. Biomineralization of poorly crystalline Fe(III) oxides by dissimilatory metal reducing bacteria (DMRB). Geomicrobiol. J. 2002, 19, 179–207. [Google Scholar] [CrossRef]
- Hansel, C.M.; Benner, S.G.; Neiss, J.; Dohnalkova, A.; Kukkadapu, R.K.; Fendorf, S. Secondary mineralization pathways induced by dissimilatory iron reduction of ferrihydrite under advective flow. Geochim. Cosmochim. Acta 2003, 67, 2977–2992. [Google Scholar] [CrossRef]
- Bae, S.; Lee, W. Biotransformation of lepidocrocite in the presence of quinones and flavins. Geochim. Cosmochim. Acta 2013, 114, 144–155. [Google Scholar] [CrossRef]
- O’Loughlin, E.J.; Gorski, C.; Scherer, M.M.; Boyanov, M.I.; Kemner, K.M. Effects of oxyanions, natural organic matter, and cell density on the bioreduction of lepidocrocite (g-FeOOH) and secondary mineral formation. Environ. Sci. Technol. 2010, 44, 4570–4576. [Google Scholar] [CrossRef] [PubMed]
- Zegeye, A.; Ruby, C.; Jorand, F. Kinetic and thermodynamic analysis during dissimilatory g-FeOOH reduction: Formation of green rust 1 and magnetite. Geomicrobiol. J. 2007, 24, 51–64. [Google Scholar] [CrossRef]
- Salas, E.C.; Berelson, W.M.; Hammond, D.E.; Kampf, A.R.; Nealson, K.H. The impact of bacterial strain on the products of dissimilatory iron reduction. Geochim. Cosmochim. Acta 2010, 74, 574–583. [Google Scholar] [CrossRef] [PubMed]
- Fredrickson, J.K.; Kota, S.; Kukkadapu, R.K.; Liu, C.; Zachara, J.M. Influence of electron donor/acceptor concentrations on hydrous ferric oxide (HFO) bioreduction. Biodegradation 2003, 14, 91–103. [Google Scholar] [CrossRef]
- Lee, J.-H.; Roh, Y.; Kim, K.-W.; Hur, H.-G. Organic acid-dependent iron mineral formation by a newly isolated iron-reducing bacterium, Shewanella sp. HN-41. Geomicrobiol. J. 2007, 24, 31–41. [Google Scholar] [CrossRef]
- Salas, E.C.; Berelson, W.M.; Hammond, D.E.; Kampf, A.R.; Nealson, K.H. The influence of carbon source on the products of dissimilatory iron reduction. Geomicrobiol. J. 2009, 26, 451–462. [Google Scholar] [CrossRef]
- O’Loughlin, E.J.; Gorski, C.A.; Flynn, T.M.; Scherer, M.M. Electron donor utilization and secondary mineral formation during the bioreduction of lepidocrocite by Shewanella putrefaciens CN32. Minerals 2019, 9, 434. [Google Scholar] [CrossRef]
- Jorand, F.; Zegeye, A.; Ghanbaja, J.; Abdelmoula, M. The formation of green rust induced by tropical river biofilm components. Sci. Total Environ. 2011, 409, 2586–2596. [Google Scholar] [CrossRef][Green Version]
- Borch, T.; Masue, Y.; Kukkadapu, R.K.; Fendorf, S. Phosphate imposed limitations on biological reduction and alteration of ferrihydrite. Environ. Sci. Technol. 2007, 41, 166–172. [Google Scholar] [CrossRef]
- Kukkadapu, R.K.; Zachara, J.M.; Fredrickson, J.K.; Kennedy, D.W. Biotransformation of two-line silica-ferrihydrite by a dissimilatory Fe(III)-reducing bacterium: Formation of carbonate green rust in the presence of phosphate. Geochim. Cosmochim. Acta 2004, 68, 2799–2814. [Google Scholar] [CrossRef]
- Sergent, A.-S.; Jorand, F.; Hanna, K. Effects of Si-bearing minerals on the nature of secondary iron mineral products from lepidocrocite bioreduction. Chem. Geol. 2011, 289, 86–97. [Google Scholar] [CrossRef]
- Shi, L.; Richardson, D.J.; Wang, Z.; Kerisit, S.N.; Rosso, K.M.; Zachara, J.M.; Fredrickson, J.K. The roles of outer membrane cytochromes of Shewanella and Geobacter in extracellular electron transfer. Environ. Microbiol. Rep. 2009, 1, 220–227. [Google Scholar] [CrossRef] [PubMed]
- Gorby, Y.A.; Yanina, S.; McLean, J.S.; Rosso, K.M.; Moyles, D.; Dohnalkova, A.; Beveridge, T.J.; Chang, I.S.; Kim, B.H.; Kim, K.S.; et al. Electrically conductive bacterial nanowires produced by Shewanella oneidensis strain MR-1 and other microorganisms. Proc. Natl. Acad. Sci. USA 2006, 103, 11358–11363. [Google Scholar] [CrossRef] [PubMed]
- Reguera, G.; McCarthy, K.D.; Metha, T.; Nicoll, J.S.; Tuominen, M.T.; Lovley, D.R. Extracellular electron transfer via microbial nanowires. Nature 2005, 435, 1098–1101. [Google Scholar] [CrossRef] [PubMed]
- Lovley, D.R.; Coates, J.D.; Blunt-Harris, E.L.; Phillips, E.J.P.; Woodward, J.C. Humic-substances as electron acceptors for microbial respiration. Nature 1996, 382, 445–448. [Google Scholar] [CrossRef]
- Nevin, K.P.; Lovley, D.R. Potential for nonenzymatic reduction of Fe(III) via electron shuttling in subsurface sediments. Environ. Sci. Technol. 2000, 34, 2472–2478. [Google Scholar] [CrossRef]
- Royer, R.A.; Burgos, W.D.; Fisher, A.S.; Jeon, B.-H.; Unz, R.F.; Dempsey, B.A. Enhancement of hematite bioreduction by natural organic matter. Environ. Sci. Technol. 2002, 36, 2897–2904. [Google Scholar] [CrossRef]
- Jiang, J.; Kappler, A. Kinetics of microbial and chemical reduction of humic substances: Implications for electron shuttling. Environ. Sci. Technol. 2008, 42, 3563–3569. [Google Scholar] [CrossRef]
- Wolf, M.; Kappler, A.; Jiang, J.; Meckenstock, R.U. Effects of humic substances at low concentrations on ferrihydrite reduction by Geobacter metallireducens. Environ. Sci. Technol. 2009, 43, 5679–5685. [Google Scholar] [CrossRef]
- Roden, E.E.; Kappler, A.; Bauer, I.; Jiang, J.; Paul, A.; Stoesser, R.; Konishi, H.; Xu, H. Extracellular electron transfer through microbial reduction of solid-phase humic substances. Nat. Geosci. 2010, 3, 417–421. [Google Scholar] [CrossRef]
- Scott, D.T.; McKnight, D.M.; Blunt-Harris, E.L.; Kolesar, S.E.; Lovley, D.R. Quinone moieties act as electron acceptors in the reduction of humic substances by humics-reducing microorganisms. Environ. Sci. Technol. 1998, 32, 2984–2989. [Google Scholar] [CrossRef]
- Klapper, L.; McKnight, D.M.; Fulton, J.R.; Blunt-Harris, E.L.; Nevin, K.P.; Lovley, D.R.; Hatcher, P.G. Fulvic acid oxidation state detection using fluorescence spectroscopy. Environ. Sci. Technol. 2002, 36, 3170–3175. [Google Scholar] [CrossRef] [PubMed]
- Nurmi, J.T.; Tratnyek, P.G. Electrochemical properties of natural organic matter (NOM), fractions of NOM, and model biogeochemical electron shuttles. Environ. Sci. Technol. 2002, 36, 617–624. [Google Scholar] [CrossRef] [PubMed]
- Tratnyek, P.G.; Macalady, D.L. Abiotic reductions of nitro aromatic pesticides in anaerobic laboratory systems. J. Agric. Food Chem. 1989, 37, 248–254. [Google Scholar] [CrossRef]
- O’Loughlin, E.J. Effects of electron transfer mediators on the biodegradation of lepidocrocite (g-FeOOH) by Shewanella putrefaciens CN32. Environ. Sci. Technol. 2008, 42, 6876–6882. [Google Scholar] [CrossRef]
- Smeck, N.E. Phosphorous dynamics in soils and landscapes. Geoderma 1985, 36, 185–199. [Google Scholar] [CrossRef]
- Torrent, J. Interactions between phosphate and iron oxide. Adv. GeoEcol. 1997, 30, 321–344. [Google Scholar]
- Benali, O.; Abdelmoula, M.; Refait, P.; Génin, J.-M.R. Effect of orthophosphate on the oxidation products of Fe(II)-Fe(III) hydroxycarbonate: The transformation of green rust to ferrihydrite. Geochim. Cosmochim. Acta 2001, 65, 1715–1726. [Google Scholar] [CrossRef]
- Bocher, F.; Géhin, A.; Ruby, C.; Ghanbaja, J.; Abdelmoula, M.; Génin, J.-M.R. Coprecipitation of Fe(II-III) hydroxycarbonate green rust stabilized by phosphate adsorption. Solid State Sci. 2004, 6, 117–124. [Google Scholar] [CrossRef]
- Cumplido, J.; Barrón, V.; Torrent, J. Effect of phosphate on the formation of nanophase lepidocrocite from Fe(II) sulfate. Clays Clay Miner. 2000, 48, 503–510. [Google Scholar] [CrossRef]
- Gálvez, N.; Barrón, V.; Torrent, J. Effect of phosphate on the crystallization of hematite, goethite, and lepidocrocite from ferrihydrite. Clays Clay Miner. 1999, 47, 304–311. [Google Scholar] [CrossRef]
- Mann, S.; Sparks, N.H.C.; Coouling, S.B.; Larcombe, M.C.; Frankel, R.B. Crystallochemical characterization of magnetic spinels prepared from aqueous solution. J. Chem. Soc. Faraday Trans. 1989, 85, 3033–3044. [Google Scholar] [CrossRef]
- Refait, P.; Reffass, M.; Landoulsi, J.; Sabot, R.; Jeannin, M. Role of phosphate species during the formation and transformation of Fe(II-III) hydroxycarbonate green rust. Colloids Surf. A 2007, 299, 29–37. [Google Scholar] [CrossRef]
- Zachara, J.M.; Kukkadapu, R.K.; Peretyazhko, T.; Bowden, M.; Wang, C.; Kennedy, D.W.; Moore, D.; Arey, B. The mineralogic transformation of ferrihydrite induced by heterogeneous reaction with bioreduced anthraquinone disulfonate (AQDS) and the role of phosphate. Geochim. Cosmochim. Acta 2011, 75, 6330–6349. [Google Scholar] [CrossRef]
- Borch, T.; Fendorf, S. Phosphate interactions with iron (hydr)oxides: Mineralization pathways and phosphorous retention upon bioreduction. In Adsorption of Metals by Geomedia II Variables, Mechanisms, and Model Applications; Barnett, M.O., Kent, D., Eds.; Elsevier: New York, NY, USA, 2008; Volume 7, pp. 321–348. [Google Scholar]
- O’Loughlin, E.J.; Boyanov, M.I.; Flynn, T.M.; Gorski, C.; Hofmann, S.M.; McCormick, M.L.; Scherer, M.M.; Kemner, K.M. Effects of bound phosphate on the bioreduction of lepidocrocite (g-FeOOH) and maghemite (g-Fe2O3) and formation of secondary minerals. Environ. Sci. Technol. 2013, 47, 9157–9166. [Google Scholar] [CrossRef] [PubMed]
- O’Loughlin, E.J.; Gorski, C.A.; Scherer, M.M. Effects of phosphate on secondary mineral formation during the bioreduction of akaganeite (b-FeOOH): Green rust versus framboidal magnetite. Curr. Inorg. Chem. 2015, 5, 214–224. [Google Scholar] [CrossRef]
- Christiansen, B.C.; Balic-Zunic, T.; Dideriksen, K.; Stipp, S.L.S. Identification of green rust in groundwater. Environ. Sci. Technol. 2009, 43, 3436–3441. [Google Scholar] [CrossRef]
- Johnson, C.A.; Freyer, G.; Fabisch, M.; Caraballo, M.A.; Küsel, K.; Hochella, M.F. Observations and assessment of iron oxide and green rust nanoparticles in metal-polluted mine drainage within a steep redox gradient. Environ. Chem. 2014, 11, 377. [Google Scholar] [CrossRef]
- Zegeye, A.; Bonneville, S.; Benning, L.G.; Sturm, A.; Fowle, D.A.; Jones, C.; Canfield, D.E.; Ruby, C.; MacLean, L.C.; Nomosatryo, S.; et al. Green rust formation controls nutrient availability in a ferruginous water column. Geology 2012, 40, 599–602. [Google Scholar] [CrossRef]
- Feder, F.; Trolard, F.; Klingelhöfer, G.; Bourrié, G. In situ Mössbauer spectroscopy: Evidence for green rust (fougerite) in a gleysol and its mineralogical transformations with time and depth. Geochim. Cosmochim. Acta 2005, 69, 4463–4483. [Google Scholar] [CrossRef]
- Génin, J.-M.R.; Bourrié, G.; Trolard, F.; Abdelmoula, M.; Jaffrezic, A.; Refait, P.; Maitre, V.; Humbert, B.; Herbillon, A. Thermodynamic equilibria in aqueous suspensions of synthetic and natural Fe(II)-Fe(III) green rusts: Occurrences of the mineral in hydromorphic soils. Environ. Sci. Technol. 1998, 32, 1058–1068. [Google Scholar] [CrossRef]
- Refait, P.; Abdelmoula, M.; Trolard, F.; Génin, J.-M.R.; Ehrhardt, J.J.; Bourrié, G. Mössbauer and XAS study of a green rust mineral: The partial substitution of Fe2+ by Mg2+. Am. Mineral. 2001, 86, 731–739. [Google Scholar] [CrossRef]
- Trolard, F.; Génin, J.-M.R.; Abdelmoula, M.; Bourrié, G.; Humbert, B.; Herbillon, A. Identification of a green rust mineral in a reductomorphic soil by Mössbauer and Raman spectroscopies. Geochim. Cosmochim. Acta 1997, 61, 1107–1111. [Google Scholar] [CrossRef]
- Weatherington-Rice, J.; Bigham, J.M. Buried pre-Illinoian-age lacustrine deposits with “green rust” colors in Clermont County, Ohio. Ohio J. Sci. 2006, 106, 35–44. [Google Scholar]
- Latta, D.E.; Boyanov, M.I.; Kemner, K.M.; O’Loughlin, E.J.; Scherer, M.M. Abiotic reduction of uranium by Fe(II) in soil. Appl. Geochem. 2012, 27, 1512–1524. [Google Scholar] [CrossRef]
- Bearcock, J.M.; Perkins, W.T.; Dinelli, E.; Wade, S.C. Fe(II)/Fe(III) ‘green rust’ developed within ocherous coal mine drainage sediment in South Wales, UK. Mineral. Mag. 2006, 70, 731–741. [Google Scholar] [CrossRef]
- Bender Koch, C.; Mørup, S. Identification of green rust in an ochre sludge. Clay Miner. 1991, 26, 577–582. [Google Scholar] [CrossRef]
- Root, R.A.; Dixit, S.; Campbell, K.M.; Jew, A.D.; Hering, J.G.; O’Day, P.A. Arsenic sequestration by sorption processes in high-iron sediments. Geochim. Cosmochim. Acta 2007, 71, 5782–5803. [Google Scholar] [CrossRef]
- Trolard, F.; Bourrié, G.; Abdelmoula, M.; Refait, P.; Feder, F. Fougerite, a new mineral of the pyroaurite-iowaite group: Description and crystal structure. Clays Clay Miner. 2007, 55, 323–334. [Google Scholar] [CrossRef]
- Mills, S.J.; Christy, A.G.; Génin, J.M.R.; Kameda, T.; Colombo, F. Nomenclature of the hydrotalcite supergroup: Natural layered double hydroxides. Mineral. Mag. 2012, 76, 1289–1336. [Google Scholar] [CrossRef]
- Génin, J.M.R.; Mills, S.J.; Christy, A.G.; Guérin, O.; Herbillon, A.J.; Kuzmann, E.; Ona-Nguema, G.; Ruby, C.; Upadhyay, C. Mössbauerite, Fe63+O4(OH)8[CO3]·3H2O, the fully oxidized ‘green rust’ mineral from Mont Saint-Michel Bay, France. Mineral. Mag. 2014, 78, 447–465. [Google Scholar] [CrossRef]
- Duval, S.; Baymann, F.; Schoepp-Cothenet, B.; Trolard, F.; Bourrié, G.; Grauby, O.; Branscomb, E.; Russell, M.J.; Nitschke, W. Fougerite: The not so simple progenitor of the first cells. Interface Focus 2019, 9. [Google Scholar] [CrossRef] [PubMed]
- Zachara, J.M.; Fredrickson, J.K.; Li, S.-M.; Kennedy, D.W.; Smith, S.C.; Gassman, P.L. Bacterial reduction of crystalline Fe3+ oxides in single phase suspension and subsurface materials. Am. Mineral. 1998, 83, 1426–1443. [Google Scholar] [CrossRef]
- Schwertmann, U.; Cornell, R.M. Iron Oxides in the Laboratory, 2nd ed.; Wiley-VCH: Weinheim, Germany, 2000; p. 188. [Google Scholar]
- Latta, D.E.; Boyanov, M.I.; Kemner, K.M.; O’Loughlin, E.J.; Scherer, M.M. Reaction of uranium(VI) with green rusts: Effect of interlayer anion. Curr. Inorg. Chem. 2015, 5, 156–168. [Google Scholar] [CrossRef]
- Stookey, L.L. Ferrozine-A new spectrophotometric reagent for iron. Anal. Chem. 1970, 42, 779–781. [Google Scholar] [CrossRef]
- Sørensen, J. Reduction of ferric iron in anaerobic, marine sediment and interaction with reduction of nitrate and sulfate. Appl. Environ. Microbiol. 1982, 43, 319–324. [Google Scholar] [CrossRef] [PubMed]
- Hansel, C.M.; Benner, S.G.; Nico, P.; Fendorf, S. Structural constraints of ferric (hydr)oxides on dissimilatory iron reduction. Geochim. Cosmochim. Acta 2004, 68, 3217–3229. [Google Scholar] [CrossRef]
- Roden, E.E. Geochemical and microbiological controls on dissimilatory iron reduction. Comptes Rendus Geosci. 2006, 338, 456–467. [Google Scholar] [CrossRef]
- Bonneville, S.; Behrends, T.; Van Cappellen, P. Solubility and dissimilatory reduction kinetics of iron(III) oxyhydroxides: A linear free energy relationship. Geochim. Cosmochim. Acta 2009, 73, 5273–5282. [Google Scholar] [CrossRef]
- Dong, H.; Fredrickson, J.K.; Kennedy, D.W.; Zachara, J.M.; Kukkadapu, R.K.; Onstott, T.C. Mineral transformation associated with the microbial reduction of magnetite. Chem. Geol. 2000, 169, 299–318. [Google Scholar] [CrossRef]
- Liu, C.; Kota, S.; Zachara, J.M.; Fredrickson, J.K.; Brinkman, C.K. Kinetic analysis of the bacterial reduction of goethite. Environ. Sci. Technol. 2001, 35, 2482–2490. [Google Scholar] [CrossRef] [PubMed]
- Zachara, J.M.; Fredrickson, J.K.; Smith, S.C.; Glassman, P.L. Solubilization of Fe(III) oxide-bound trace metals by a dissimilatory Fe(III) reducing bacterium. Geochim. Cosmochim. Acta 2001, 65, 75–93. [Google Scholar] [CrossRef]
- Yan, B.; Wrenn, B.A.; Basak, S.; Biswas, P.; Giammar, D.E. Microbial reduction of Fe(III) in hematite nanoparticles by Geobacter sulfurreducens. Environ. Sci. Technol. 2008, 42, 6526–6531. [Google Scholar] [CrossRef] [PubMed]
- Luo, H.-W.; Zhang, X.; Chen, J.-J.; Yu, H.-Q.; Sheng, G.-P. Probing the biotransformation of hematite nanoparticles and magnetite formation mediated by Shewanella oneidensis MR-1 at the molecular scale. Environ. Sci. Nano 2017, 4, 2395–2404. [Google Scholar] [CrossRef]
- Cooper, D.C.; Picardal, F.; Rivera, J.; Talbot, C. Zinc immobilization and magnetite formation via ferric oxide reduction by Shewanella putrefaciens 200. Environ. Sci. Technol. 2000, 34, 100–106. [Google Scholar] [CrossRef]
- Liu, D.; Wang, H.; Dong, H.; Qiu, X.; Dong, X.; Cravotta, C.A., III. Mineral transformations associated with goethite reduction by Methanosarcina barkeri. Chem. Geol. 2011, 288, 53–60. [Google Scholar] [CrossRef]
- Gorski, C.A.; Scherer, M.M. Determination of nanoparticulate magnetite stoichiometry by Mössbauer spectroscopy, acidic dissolution, and powder X-ray diffraction: A critical review. Am. Mineral. 2010, 95, 1017–1026. [Google Scholar] [CrossRef]
- Li, Y.L.; Pfiffner, S.M.; Dyar, M.D.; Vali, H.; Konhauser, K.; Cole, D.R.; Rondinone, A.J.; Phelps, T.J. Degeneration of biogenic superparamagnetic magnetite. Geobiology 2009, 7, 25–34. [Google Scholar] [CrossRef]
- Jorand, F.; Zegeye, A.; Landry, F.; Ruby, C. Reduction of ferric green rust by Shewanella putrefaciens. Lett. Appl. Microbiol. 2007, 45, 515–521. [Google Scholar] [CrossRef]
- Peretyazhko, T.S.; Zachara, J.M.; Kennedy, D.W.; Fredrickson, J.K.; Arey, B.W.; McKinley, J.P.; Wang, C.M.; Dohnalkova, A.C.; Xia, Y. Ferrous phosphate surface precipitates resulting from the reduction of intragrain 6-line ferrihydrite by Shewanella oneidensis MR-1. Geochim. Cosmochim. Acta 2010, 74, 3751–3767. [Google Scholar] [CrossRef]
- Zegeye, A.; Abdelmoula, M.; Usman, M.; Hanna, K.; Ruby, C. In situ monitoring of lepidocrocite bioreduction and magnetite formation by reflection Mössbauer spectroscopy. Am. Mineral. 2011, 96, 1410–1413. [Google Scholar] [CrossRef]
- Jorand, F.P.A.; Sergent, A.S.; Remy, P.P.; Bihannic, I.; Ghanbaja, J.; Lartiges, B.; Hanna, K.; Zegeye, A. Contribution of anionic vs. neutral polymers to the formation of green rust 1 from γ-FeOOH bioreduction. Geomicrobiol. J. 2013, 30, 600–615. [Google Scholar] [CrossRef]
- Roden, E.E. Fe(III) oxide reactivity toward biological versus chemical reduction. Environ. Sci. Technol. 2003, 37, 1319–1324. [Google Scholar] [CrossRef]
- Dominik, P.; Kaupenjohann, M. Reduction of Fe(III) (hydr)oxides with known thermodynamic stability by Geobacter metallireducens. Geomicrobiol. J. 2004, 21, 287–295. [Google Scholar] [CrossRef]
- Azoulay, I.; Rémazeilles, C.; Refait, P. Determination of standard Gibbs free energy of formation of chukanovite and Pourbaix diagrams of iron in carbonated media. Corros. Sci. 2012, 58, 229–236. [Google Scholar] [CrossRef]
- Ona-Nguema, G.; Morin, G.; Wang, Y.; Menguy, N.; Juillot, F.; Olovi, L.; Aquilanti, G.; Abdelmoula, M.; Ruby, C.; Bargar, J.R.; et al. Arsenite sequestration at the surface of nano-Fe(OH)2, ferrous-carbonate hydroxide, and green-rust after bioreduction of arsenic-sorbed lepidocrocite by Shewanella putrefaciens. Geochim. Cosmochim. Acta 2009, 73, 1359–1381. [Google Scholar] [CrossRef]
- Williams, A.G.B.; Gregory, K.B.; Parkin, G.F.; Scherer, M.M. Hexahydro-1,3,5-trinitro-1,3,5-triazine transformation by biologically reduced ferrihydrite: Evolution of Fe mineralogy, surface area, and reaction rates. Environ. Sci. Technol. 2005, 39, 5183–5189. [Google Scholar] [CrossRef]
- Wu, W.; Li, B.; Hu, J.; Li, J.; Wang, F.; Pan, Y. Iron reduction and magnetite biomineralization mediated by a deep-sea iron-reducing bacterium Shewanella piezotolerans WP3. J. Geophys. Res. 2011, 116. [Google Scholar] [CrossRef]
- Amstaetter, K.; Borch, T.; Kappler, A. Influence of humic acid imposed changes of ferrihydrite aggregation on microbial Fe(III) reduction. Geochim. Cosmochim. Acta 2012, 85, 326–341. [Google Scholar] [CrossRef]
- Han, R.; Liu, T.; Li, F.; Li, X.; Chen, D.; Wu, Y. Dependence of secondary mineral formation on Fe(II) production from ferrihydrite reduction by Shewanella oneidensis MR-1. ACS Earth Space Chem. 2018, 2, 399–409. [Google Scholar] [CrossRef]
- Perez-Gonzalez, T.; Jimenez-Lopez, C.; Neal, A.L.; Rull-Perez, F.; Rodriguez-Navarro, A.; Fernandez-Vivas, A.; Iañez-Pareja, E. Magnetite biomineralization induced by Shewanella oneidensis. Geochim. Cosmochim. Acta 2010, 74, 967–979. [Google Scholar] [CrossRef]
- Vali, H.; Weiss, B.; Li, Y.-L.; Sears, S.K.; Kim, S.S.; Kirschvink, J.L.; Zhang, C.L. Formation of tabular single-domain magnetite induced by Geobacter metallireducens GS-15. Proc. Natl. Acad. Sci. USA 2004, 101, 16121–16126. [Google Scholar] [CrossRef] [PubMed]
- Bond, D.R.; Lovley, D.R. Reduction of Fe(III) oxide by methanogens in the presence and absence of extracellular quinones. Environ. Microbiol. 2002, 4, 115–124. [Google Scholar] [CrossRef] [PubMed]
- Straub, K.L.; Schink, B. Evaluation of electron-shuttling compounds in microbial ferric iron reduction. FEMS Microbiol. Lett. 2003, 220, 229–233. [Google Scholar] [CrossRef]
- Coker, V.S.; Bell, A.M.T.; Pearce, C.I.; Pattrick, R.A.D.; van der Laan, G.; Lloyd, J.R. Time-resolved synchrotron powder x-ray diffraction study of magnetite formation by the Fe(III)-reducing bacterium Geobacter sulfurreducens. Am. Mineral. 2008, 93, 540–547. [Google Scholar] [CrossRef]
- Jung, J.; Bae, S.; Lee, W. Indirect contact of bio-transformation of lepidocrocite: Role of electron transfer mediator. Sustain. Environ. Res. 2012, 23, 193–198. [Google Scholar]
- Cornell, R.M.; Schwertmann, U. The Iron Oxides: Structure, Properties, Reactions, Occurrence and Uses, 2nd ed.; Wiley-VCH: New York, NY, USA, 2003; p. 664. [Google Scholar]
- Biber, M.; dos Santos Afonso, M.; Stumm, W. The coordination chemistry of weathering: IV. Inhibition of the dissolution of oxide minerals. Geochim. Cosmochim. Acta 1994, 58, 1999–2010. [Google Scholar] [CrossRef]
- Liu, C.; Zachara, J.M.; Foster, N.S.; Strickland, J. Kinetics of reductive dissolution of hematite by bioreduced anthraquinone-2,6-disulfonate. Environ. Sci. Technol. 2007, 41, 7730–7735. [Google Scholar] [CrossRef]
- Parmar, N.; Gorby, Y.A.; Beveridge, T.J.; Ferris, F.G. Formation of green rust and immobilization of nickel in response to bacterial reduction of hydrous ferric oxide. Geomicrobiol. J. 2001, 18, 375–385. [Google Scholar] [CrossRef]
- Zegeye, A.; Ona-Nguema, G.; Carteret, C.; Huguet, L.; Abdelmoula, M.; Jorand, F. Formation of hydroxysulfate green rust 2 as a single iron(II-III) mineral in microbial culture. Geomicrobiol. J. 2005, 22, 389–399. [Google Scholar] [CrossRef]
- Etique, M.; Jorand, F.P.; Ruby, C. Magnetite as a precursor for green rust through the hydrogenotrophic activity of the iron-reducing bacteria Shewanella putrefaciens. Geobiology 2016, 14, 237–254. [Google Scholar] [CrossRef] [PubMed]
- Ona-Nguema, G.; Jorand, F.; Benali, O.; Abdelmoula, M.; Génin, J.-M.R.; Block, J.-C. Key Role of the Kinetics of g-FeOOH Bioreduction on the Formation of Fe(II-III) Minerals, Proceedings of the Hyperfine Interactions (C): Proceedings of the International Conference on the Applications of the Mössbauer Effect (ICAME 2001), Oxford, UK, 2–7 September 2001; Thomas, M.F., Williams, J.M., Gibb, T.C., Eds.; Kluwer Academic Publishers: Dordrecht, The Netherlands, 2002; pp. 415–418. [Google Scholar]
- Shimizu, M.; Zhou, J.; Schroder, C.; Obst, M.; Kappler, A.; Borch, T. Dissimilatory reduction and transformation of ferrihydrite-humic acid coprecipitates. Environ. Sci. Technol. 2013, 47, 13375–13384. [Google Scholar] [CrossRef] [PubMed]
- Schoepfer, V.A.; Burton, E.D.; Johnston, S.G.; Kraal, P. Phosphate loading alters schwertmannite transformation rates and pathways during microbial reduction. Sci. Total Environ. 2019, 657, 770–780. [Google Scholar] [CrossRef] [PubMed]
- Usman, M.; Hanna, K.; Abdelmoula, M.; Zegeye, A.; Faure, P.; Ruby, C. Formation of green rust via mineralogical transformation of ferric oxides (ferrihydrite, goethite and hematite). Appl. Clay Sci. 2012, 64, 38–43. [Google Scholar] [CrossRef]
- Neal, A.L.; Bank, T.L.; Hochella, M.F., Jr.; Rosso, K.M. Cell adhesion of Shewanella oneidensis to iron oxide minerals: Effect of different crystal faces. Geochem. Trans. 2005, 6, 77–84. [Google Scholar] [CrossRef]
- Parikh, S.J.; Chorover, J. ATR-FTIR spectroscopy reveals bond formation during bacterial adhesion to iron oxide. Langmuir 2006, 22, 8492–8500. [Google Scholar] [CrossRef]
- Tamaura, Y.; Yoshida, T.; Katsura, T. The synthesis of green rust II(FeIII1-FeII2) and its spontaneous transformation into Fe3O4. Bull. Chem. Soc. Jpn. 1984, 57, 2411–2416. [Google Scholar] [CrossRef]
- Sumoondur, A.; Shaw, S.; Ahmed, I.; Benning, L.G. Green rust as a precursor for magnetite: An in situ synchrotron study. Mineral. Mag. 2008, 71, 201–204. [Google Scholar] [CrossRef]
- Li, Y.-L.; Zhu, S.-Y.; Deng, K. Mössbauer hyperfine parameters of iron species in the course of Geobacter-mediated magnetite mineralization. Phys. Chem. Miner. 2011, 38, 701–708. [Google Scholar] [CrossRef][Green Version]
- Wang, Y.; Morin, G.; Ona-Nguema, G.; Brown, G.E., Jr. Arsenic(III) and arsenic(V) speciation during transformation of lepidocrocite to magnetite. Environ. Sci. Technol. 2014, 48, 14282–14290. [Google Scholar] [CrossRef]
- Kwon, S.-K.; Kimijima, K.i.; Kanie, K.; Suzuki, S.; Muramatsu, A.; Saito, M.; Shinoda, K.; Waseda, Y. Influence of silicate ions on the formation of goethite from green rust in aqueous solution. Corros. Sci. 2007, 49, 2946–2961. [Google Scholar] [CrossRef]
- Ruby, C.; Géhin, A.; Aissa, R.; Ghanbaja, J.; Abdelmoula, M.; Génin, J.-M.R. Chemical stability of hydroxysulfate green rust synthesized in the presence of foreign anions: Carbonate, phosphate and silicate. Hyperfine Interact. 2006, 167, 803–807. [Google Scholar] [CrossRef]
- Sahoo, G.; Fujieda, S.; Shinoda, K.; Suzuki, S. Influence of phosphate species on green rust I transformation and local structure and morphology of g-FeOOH. Corros. Sci. 2011, 53, 2446–2452. [Google Scholar] [CrossRef]
- Zegeye, A.; Etique, M.; Carteret, C.; Ruby, C.; Schaaf, P.; Francius, G. Origin of the differential nanoscale reactivity of biologically and chemically formed green rust crystals investigated by chemical force spectroscopy. J. Phys. Chem. C 2014, 118, 5978–5987. [Google Scholar] [CrossRef]
- Hansen, H.C.B.; Borggaard, O.K.; Sorensen, J. Evaluation of the free energy of formation of Fe(II)-Fe(III) hydroxide-sulphate (green rust) and its reduction of nitrite. Geochim. Cosmochim. Acta 1994, 58, 2599–2608. [Google Scholar] [CrossRef]
- Hering, J.G.; Stumm, W. Oxidative and reductive dissolution of minerals. In Mineral-Water Interface Geochemistry; Hochella, M.F.J., White, A.F., Eds.; American Mineralogical Society: Washington, DC, USA, 1990; Volume 23, pp. 427–465. [Google Scholar]
- Heron, G.; Christensen, T.H. Impact of sediment-bound iron on redox buffering in a landfill leachate polluted aquifer (Vejen, Denmark). Environ. Sci. Technol. 1995, 29, 187–192. [Google Scholar] [CrossRef]
- Rügge, K.; Hofstetter, T.B.; Haderlein, S.B.; Bjerg, P.L.; Knudsen, S.; Zraunig, C.; Mosbæk, H.; Christensen, T.H. Characterization of predominant reductants in an anaerobic leachate-contaminated aquifer by nitroaromatic probe compounds. Environ. Sci. Technol. 1998, 32, 23–31. [Google Scholar] [CrossRef]
- Elsner, M.; Schwarzenbach, R.P.; Haderlein, S.B. Reactivity of Fe(II)-bearing minerals toward reductive transformation of organic contaminants. Environ. Sci. Technol. 2004, 38, 799–807. [Google Scholar] [CrossRef]
- Lee, W.; Batchelor, B. Reductive capacity of natural reductants. Environ. Sci. Technol. 2003, 37, 535–541. [Google Scholar] [CrossRef]
- Scheinost, A.C.; Charlet, L. Selenite reduction by mackinawite, magnetite and siderite: XAS characterization of nanosized redox products. Environ. Sci. Technol. 2008, 42, 1984–1989. [Google Scholar] [CrossRef]
- Scheinost, A.C.; Kirsch, R.; Banerjee, D.; Fernandez-Martinez, A.; Zaenker, H.; Funke, H.; Charlet, L. X-ray absorption and photoelectron spectroscopy investigation of selenite reduction by FeII-bearing minerals. J. Contam. Hydrol. 2008, 102, 228–245. [Google Scholar] [CrossRef] [PubMed]
- O’Loughlin, E.J.; Kelly, S.D.; Kemner, K.M. XAFS investigation of the interactions of UVI with secondary mineralization products from the bioreduction of FeIII oxides. Environ. Sci. Technol. 2010, 44, 1656–1661. [Google Scholar] [CrossRef]
- Bond, D.L.; Fendorf, S. Kinetics and structural constraints of chromate reduction by green rusts. Environ. Sci. Technol. 2003, 37, 2750–2757. [Google Scholar] [CrossRef] [PubMed]
- Christiansen, B.C.; Geckeis, H.; Marquardt, C.M.; Bauer, A.; Römer, J.; Wiss, T.; Schild, D.; Stipp, S.L.S. Neptunyl (NpO2+) interaction with green rust, GRNa,SO4. Geochim. Cosmochim. Acta 2011, 75, 1216–1226. [Google Scholar] [CrossRef]
- Erbs, M.; Hansen, H.C.B.; Olsen, C.E. Reductive dechlorination of carbon tetrachloride using iron(II) iron(III) hydroxide sulfate (green rust). Environ. Sci. Technol. 1999, 33, 307–311. [Google Scholar] [CrossRef]
- Hansen, H.C.B.; Bender Koch, C.; Nancke-Krogh, H.; Borggaard, O.K.; Sorensen, J. Abiotic nitrate reduction to ammonium: Key role of green rust. Environ. Sci. Technol. 1996, 30, 2053–2056. [Google Scholar] [CrossRef]
- Hansen, H.C.B.; Guldberg, S.; Erbs, M.; Bender Koch, C. Kinetics of nitrate reduction by green rusts—Effects of interlayer anion and Fe(II):Fe(III) ratio. Appl. Clay Sci. 2001, 18, 81–91. [Google Scholar] [CrossRef]
- Heasman, D.M.; Sherman, D.M.; Ragnarsdottir, K.V. The reduction of aqueous Au3+ by sulfide minerals and green rust phases. Am. Mineral. 2003, 88, 725–738. [Google Scholar] [CrossRef]
- Kone, T.; Hanna, K.; Abdelmoula, M.; Ruby, C.; Carteret, C. Reductive transformation and mineralization of an azo dye by hydroxysulphate green rust preceding oxidation using H2O2 at neutral pH. Chemosphere 2009, 75, 212–219. [Google Scholar] [CrossRef]
- Larese-Casanova, P.; Scherer, M.M. Abiotic transformation of hexahydro-1,3,5-trinitro-1,3,5-triazine (RDX) by green rusts. Environ. Sci. Technol. 2008, 42, 3975–3981. [Google Scholar] [CrossRef]
- Lee, W.; Batchelor, B. Abiotic reductive dechlorination of chlorinated ethylenes by iron-bearing soil minerals. 2. Green rust. Environ. Sci. Technol. 2002, 36, 5348–5354. [Google Scholar] [CrossRef] [PubMed]
- Legrand, L.; El Figuigui, A.; Mercier, F.; Chausse, A. Reduction of aqueous chromate by Fe(II)/Fe(III) carbonate green rust: Kinetic and mechanistic studies. Environ. Sci. Technol. 2004, 38, 4587–4595. [Google Scholar] [CrossRef]
- Loyaux-Lawniczak, S.; Refait, P.; Lecomte, P.; Ehrhardt, J.-J.; Génin, J.-M.R. The reduction of chromate ions by Fe(II) layered hydroxides. Hydrol. Earth Syst. Sci. 1999, 3, 593–599. [Google Scholar] [CrossRef]
- Mitsunobu, S.; Takahashi, Y.; Sakai, Y. Abiotic reduction of antimony(V) by green rust (Fe4(II)Fe2(III)(OH)12SO4 * 3H2O). Chemosphere 2008, 70, 942–947. [Google Scholar] [CrossRef] [PubMed]
- Myneni, S.C.B.; Tokunaga, T.K.; Brown, G.E., Jr. Abiotic selenium redox transformations in the presence of Fe(II,III) oxides. Science 1997, 278, 1106–1109. [Google Scholar] [CrossRef]
- O’Loughlin, E.J.; Burris, D.R. Reduction of halogenated ethanes by green rust. Environ. Toxicol. Chem. 2004, 23, 41–48. [Google Scholar] [CrossRef] [PubMed]
- O’Loughlin, E.J.; Kelly, S.D.; Kemner, K.M.; Csencsits, R.; Cook, R.E. Reduction of AgI, AuIII, CuII, and HgII by FeII/FeIII hydroxysulfate green rust. Chemosphere 2003, 53, 437–446. [Google Scholar] [CrossRef]
- Pepper, S.E.; Bunker, D.J.; Bryan, N.D.; Livens, F.R.; Charnock, J.M.; Pattrick, R.A.D.; Collison, D. Treatment of radioactive wastes: An x-ray adsorption spectroscopy study of the treatment of technetium with green rust. J. Colloid Interface Sci. 2003, 268, 408–412. [Google Scholar] [CrossRef]
- Refait, P.; Simon, L.; Génin, J.-M.R. Reduction of SeO42− anions and anoxic formation of iron(II)-iron(III) hydroxy-selenate green rust. Environ. Sci. Technol. 2000, 34, 819–825. [Google Scholar] [CrossRef]
- Skovbjerg, L.L.; Stipp, S.L.S.; Utsunomiya, S.; Ewing, R.C. The mechanisms of reduction of hexavalent chromium by green rust sodium sulphate: Formation of Cr-goethite. Geochim. Cosmochim. Acta 2006, 70, 3582–3592. [Google Scholar] [CrossRef]
- Williams, A.G.B.; Scherer, M.M. Kinetics of Cr(VI) reduction by carbonate green rust. Environ. Sci. Technol. 2001, 35, 3488–3494. [Google Scholar] [CrossRef] [PubMed]
- Yan, S.; Boyanov, M.I.; Mishra, B.; Kemner, K.M.; O’Loughlin, E.J. U(VI) reduction by biogenic and abiotic hydroxycarbonate green rusts: Impacts on U(IV) speciation and stability over time. Environ. Sci. Technol. 2018, 52, 4601–4609. [Google Scholar] [CrossRef] [PubMed]
- Etique, M.; Zegeye, A.; Gregoire, B.; Carteret, C.; Ruby, C. Nitrate reduction by mixed iron(II-III) hydroxycarbonate green rust in the presence of phosphate anions: The key parameters influencing the ammonium selectivity. Water Res. 2014, 62, 29–39. [Google Scholar] [CrossRef] [PubMed]


| System | Surface Area (SA) m2·g−1 | Fe(II)tot a mM | Fe(II)tot Production During Bioreduction b mM·day−1 |
|---|---|---|---|
| Akaganeite c | 30.66 ± 0.33 | 28.8 ± 0.7 | 13.7 ± 4.3 |
| Feroxyhyte | 63.85 ± 0.83 | 24.3 ± 2.0 | 4.15 ± 0.23 |
| Ferric Green Rust | 91.52 ± 1.2 | 38.8 ± 1.0 | 21.3 ± 1.7 |
| Ferrihydrite | 290 ± 0.0 d | 45.9 ± 0.6 | 22.1 ± 0.6 |
| Goethite | 51.13 ± 0.61 | 8.0 ± 0.6 | 0.60 ± 0.09 |
| Hematite | 21.93 ± 0.21 | 2.4 ± 0.2 | 0.17 ± 0.08 |
| Lepidocrocite | 73.13 ± 0.76 | 25.6 ± 0.7 | 22.4 ± 0.3 |
| Maghemite | 79.81 ± 0.68 | 46.4 ± 1.0 | 30.1 ± 3.4 |
| System | Fe(II)tot Production Rate a (mM·day−1) | Final Measurement (day) | Fe(II)tot b (mM) | Fe(III) Reduced b (%) | Identification of Secondary Minerals c | ||
|---|---|---|---|---|---|---|---|
| XRD | Mössbauer | SEM | |||||
| Hematite | 0.17 ± 0.08 | 928 | 6.91 ± 0.46 | 8.6 ± 0.6 | Sid (trace) | ND | Sid (minor) |
| Hematite + AQDS | 0.19 ± 0.10 | 928 | 9.91 ± 1.61 | 12.4 ± 2.0 | Sid (trace) | ND | Sid (minor) |
| Hematite + AQDS + 500 µM P | 0.73 ± 0.08 | 744 | 8.98 ± 0.28 | 11.2 ± 0.3 | Sid (trace) | ND | Sid (minor) |
| Goethite | 0.60 ± 0.09 | 1060 | 21.93 ± 3.04 | 27.4 ± 3.8 | inconclusive | Chuk | Chuk |
| Goethite + AQDS | 1.05 ± 0.28 | 1060 | 32.21 ± 1.60 | 40.3 ± 2.0 | inconclusive | Chuk | Chuk |
| Goethite + AQDS + 500 µM P | 1.07 ± 0.18 | 744 | 3.20 ± 0.89 | 4.0 ± 1.1 | inconclusive | ND | Chuk |
| Maghemite | 30.1 ± 3.4 | 184 | 58.84 ± 1.66 | 73.6 ± 2.1 | Mag, Chuk | Mag, Chuk | Mag, Chuk |
| Maghemite + AQDS | 124.3 ± 12.5 | 184 | 56.20 ± 1.43 | 70.3 ± 1.8 | Mag, Chuk | Mag, Chuk | Mag, Chuk |
| Maghemite + AQDS + 10 µM P | 137.8 ± 11.6 | 184 | 56.92 ± 1.03 | 71.2 ± 1.3 | Mag, Chuk | ND | Mag, Chuk |
| Maghemite + AQDS + 100 µM P | 141.8 ± 7.2 | 184 | 59.60 ± 2.34 | 74.5 ± 2.9 | Mag, Chuk | ND | Mag, Chuk |
| Maghemite + AQDS + 1 mM P | 114.6 ± 1.1 | 184 | 60.35 ± 2.26 | 75.4 ± 2.8 | Mag, Chuk | Mag, Chuk | Mag, Chuk |
| Maghemite + AQDS + 10 mM P | 108.1 ± 11.2 | 184 | 39.66 ± 2.73 | 49.6 ± 3.4 | Mag, Viv | Mag, Viv | Mag, Viv |
| Ferrihydrite | 62.2 ± 5.8 | 46 | 29.20 ± 2.10 | 36.5 ± 2.6 | Mag, Chuk | ND | Mag, Chuk |
| Ferrihydrite + AQDS | 110.6 ± 3.6 | 46 | 44.30 ± 1.02 | 55.4 ± 1.3 | Mag, Chuk | Mag, Chuk | Mag, Chuk |
| Ferrihydrite + AQDS + 10 µM P | 111.2 ± 3.8 | 46 | 39.78 ± 4.86 | 49.7 ± 6.1 | Mag, Chuk | ND | Mag, Chuk |
| Ferrihydrite + AQDS + 100 µM P | 114.8 ± 6.0 | 46 | 40.60 ± 3.42 | 50.8 ± 4.3 | Mag, Chuk | ND | Mag, Chuk |
| Ferrihydrite + AQDS + 1 mM P | 73.0 ± 7.8 | 46 | 40.80 ± 0.06 | 51.0 ± 0.1 | Mag, Chuk | Mag, Chuk | Mag, Chuk |
| Ferrihydrite + AQDS + 10 mM P | 71.8 ± 3.4 | 46 | 61.46 ± 2.46 | 76.8 ± 3.1 | GR, Viv | GR, Viv | GR, Viv |
| Sample | Temp | CS | QS | H | RA | |
|---|---|---|---|---|---|---|
| (K) | (mm·s−1) | (mm·s−1) | (T) | Mineral | (%) | |
| Goethite | 140 | 0.46 | −0.12 | 47.9 | Goethite | 80.0 |
| 1.25 | 2.28 | Chukanovite | 20.0 | |||
| Goethite + AQDS | 270 | 0.39 | −0.13 | 39.2 | Goethite | 78.4 |
| 1.16 | 2.03 | Chukanovite | 21.6 | |||
| 140 | 0.46 | −0.12 | 47.9 | Goethite | 72.6 | |
| 1.25 | 2.27 | Chukanovite | 27.4 | |||
| 77 | 0.48 | −0.12 | 49.8 | Goethite | 71.0 | |
| 1.27 | 2.37 | Chukanovite | 29.0 | |||
| Maghemite | 140 | 1.26 | 2.21 | Chukanovite | 45.7 | |
| 0.72 | −0.04 | 46.8 | Magnetite (oct 2.5) | 34.8 | ||
| 0.38 | 0.00 | 49.7 | Magnetite (tet 3) | 19.5 | ||
| Maghemite + AQDS | 140 | 1.26 | 2.21 | Chukanovite | 40.8 | |
| 0.72 | −0.04 | 46.4 | Magnetite (oct 2.5) | 38.9 | ||
| 0.38 | 0.00 | 49.6 | Magnetite (tet 3) | 20.4 | ||
| Maghemite + AQDS + 1 mM P | 140 | 1.26 | 2.26 | Chukanovite | 41.0 | |
| 0.73 | −0.05 | 46.0 | Magnetite (oct 2.5) | 37.0 | ||
| 0.38 | 0.00 | 49.3 | Magnetite (tet 3) | 22.1 | ||
| Maghemite + AQDS + 10 mM P | 140 | 1.28 | 3.00 | Vivianite | 18.2 | |
| 0.72 | 0.04 | 45.4 | Magnetite (oct 2.5) | 47.7 | ||
| 0.40 | −0.05 | 49.9 | Magnetite (tet 3) | 34.1 | ||
| Ferrihydrite | 77 | 1.28 | 2.29 | Chukanovite | 60.9 | |
| 0.39 | −0.01 | 49.9 | Magnetite 1 | 17.1 | ||
| 0.79 | −0.09 | 47.3 | Magnetite 2 | 22.0 | ||
| Ferrihydrite + AQDS + 1 mM P | 140 | 1.26 | 2.40 | Chukanovite | 56.0 | |
| 0.72 | −0.03 | 46.4 | Magnetite (oct 2.5) | 29.4 | ||
| 0.38 | −0.02 | 49.5 | Magnetite (tet 3) | 14.5 | ||
| 77 | 1.29 | 2.48 | Chukanovite | 47.7 | ||
| 0.38 | 0.02 | 50.0 | Magnetite 1 | 15.1 | ||
| 0.80 | −0.13 | 46.8 | Magnetite 2 | 37.2 | ||
| Ferrihydrite + AQDS + 10 mM P | 77 | 0.46 | 0.40 | Green Rust Fe(III) | 17.0 | |
| 1.19 | 2.87 | Green Rust Fe(II) | 40.8 | |||
| 1.39 | 2.98 | Vivianite | 42.2 | |||
| 13 | 0.48 | 0.38 | Green Rust Fe(III) | 19.2 | ||
| 1.26 | 2.84 | Green Rust Fe(II) | 65.5 | |||
| 1.47 | 3.04 | Vivianite | 15.3 |
| System | Fe(II)tot Production | Final | Fe(III) | ||||
|---|---|---|---|---|---|---|---|
| Rate a | Measurement | Fe(II)tot b | Reduced b | Identification of Secondary Minerals c | |||
| (mM·day−1) | (day) | (mM) | (%) | XRD | Mössbauer | SEM | |
| Lepidocrocite | 12.7 ± 1.9 | 77 | 27.63 ± 1.01 | 34.5 ± 1.3 | Mag, Chuk | ND | Mag, Chuk |
| Lepidocrocite + AQDS | 25.9 ± 6.9 | 77 | 31.95 ± 0.40 | 39.9 ± 0.5 | Mag, Chuk | ND | Mag, Chuk |
| Lepidocrocite + AQDS + 1 µM P | 28.6 ± 3.2 | 77 | 30.18 ± 0.86 | 37.7 ± 1.1 | Mag, Chuk | ND | Mag, Chuk |
| Lepidocrocite + AQDS + 10 µM P | 29.9 ± 1.8 | 77 | 31.06 ± 0.81 | 38.8 ± 1.0 | Mag, Chuk | ND | Mag, Chuk |
| Lepidocrocite + AQDS + 25 µM P | 29.2 ± 1.4 | 50 | 30.69 ± 2.05 | 38.4 ± 2.6 | Mag, Chuk | ND | Mag, Chuk |
| Lepidocrocite + AQDS + 50 µM P | 12.6 ± 4.2 | 50 | 33.00 ± 2.15 | 41.3 ± 2.7 | Mag, Chuk | ND | Mag, Chuk |
| Lepidocrocite + AQDS + 75 µM P Rep 1 | 9.8 ± 2.7 | 50 | 37.16 | 46.5 | Mag, Chuk | ND | Mag, Chuk |
| Lepidocrocite + AQDS + 75 µM P Rep 2 | 4.4 ± 1.3 | 50 | 54.75 | 68.4 | GR | ND | GR |
| Lepidocrocite + AQDS + 100 µM P | 2.0 ± 0.1 | 77 | 55.19 ± 1.19 | 69.0 ± 1.5 | GR | ND | GR |
| Lepidocrocite + AQDS + 1 mM P | 3.3 ± 0.4 | 77 | 60.04 ± 0.07 | 75.1 ± 0.1 | GR | ND | GR |
| Lepidocrocite + AQDS + 10 mM P | 1.9 ± 0.1 | 77 | 71.36 ± 4.30 | 89.2 ± 5.4 | GR, Viv | ND | GR, Viv |
| Feroxyhyte | 4.4 ± 0.2 | 78 | 24.28 ± 2.10 | 30.4 ± 2.6 | Mag, Chuk | ND | Mag, Chuk |
| Feroxyhyte + AQDS | 23.3 ± 3.2 | 78 | 24.51 ± 6.02 | 30.6 ± 7.5 | Mag, Chuk | Mag, Chuk | Mag, Chuk |
| Feroxyhyte + AQDS + 500 µM P | 0.6 ± 0.01 | 156 | 55.07 ± 2.92 | 68.8 ± 3.7 | Mag, Chuk | Mag, Chuk | Mag, Chuk |
| Feroxyhyte + AQDS + 5 mM P | 0.7 ± 0.03 | 156 | 59.93 ± 1.65 | 74.9 ± 2.1 | GR, Viv | ND | GR?, Viv |
| Ferric Green Rust | 18.9 ± 0.1 | 98 | 38.01 ± 1.00 | 47.5 ± 3.3 | Mag, Chuk | ND | Mag, Chuk |
| Ferric Green Rust + AQDS | 91.3 ± 5.3 | 98 | 39.12 ± 2.02 | 48.9 ± 1.6 | Mag | Mag, Chuk | Mag, Chuk |
| Ferric Green Rust + AQDS + 500 µM P | 100.4 ± 5.8 | 98 | 36.07 ± 2.10 | 45.1 ± 7.6 | Mag, Chuk | Mag, Chuk | Mag, Chuk |
| Ferric Green Rust + AQDS + 5 mM P | 1.1 ± 0.1 | 98 | 64.64 ± 1.78 | 80.8 ± 5.4 | GR | GR | GR |
| Sample | Temp (K) | CS (mm·s−1) | QS (mm·s−1) | H (T) | Mineral | RA (%) |
|---|---|---|---|---|---|---|
| Feroxyhyte + AQDS | 77 | 1.30 | 2.29 | Chukanovite | 21.3 | |
| 0.39 | −0.01 | 50.7 | Magnetite 1 | 36.6 | ||
| 0.83 | −0.05 | 47.9 | Magnetite 2 | 42.1 | ||
| Feroxyhyte + AQDS + 500 µM P | 77 | 1.29 | 2.34 | Chukanovite | 62.0 | |
| 0.58 | −0.07 | 50.6 | Magnetite (oct 2.5) | 19.2 | ||
| 0.38 | −0.08 | 50.0 | Magnetite (tet 3) | 18.8 | ||
| Ferric Green Rust + AQDS | 140 | 1.30 | 2.18 | Chukanovite | 15.0 | |
| 0.72 | −0.01 | 47.5 | Magnetite (oct 2.5) | 51.2 | ||
| 0.39 | 0.00 | 50.5 | Magnetite (tet 3) | 33.8 | ||
| 77 | 1.35 | 2.26 | Chukanovite | 14.6 | ||
| 0.39 | −0.01 | 50.7 | Magnetite 1 | 40.1 | ||
| 0.83 | −0.05 | 48.0 | Magnetite 2 | 45.3 | ||
| Ferric Green Rust + AQDS + 500 µM P | 140 | 1.26 | 2.20 | Chukanovite | 26.3 | |
| 0.77 | −0.02 | 45.6 | Magnetite (oct 2.5) | 46.5 | ||
| 0.37 | 0.00 | 50.2 | Magnetite (tet 3) | 27.3 | ||
| 77 | 1.30 | 2.30 | Chukanovite | 28.7 | ||
| 0.39 | −0.01 | 50.6 | Magnetite 1 | 33.3 | ||
| 0.82 | −0.07 | 47.9 | Magnetite 2 | 38.0 | ||
| Ferric Green Rust + AQDS + 5 mM P | 140 | 0.47 | 0.72 | Green Rust Fe(III) | 20.6 | |
| 1.27 | 2.78 | Green Rust Fe(II) | 79.4 | |||
| 77 | 0.47 | 0.39 | Green Rust Fe(III) | 20.7 | ||
| 1.27 | 2.81 | Green Rust Fe(II) | 79.3 |
| System | Total Added Phosphate (mM) | Phosphate in Solution after 48 h (mM) | Amount of Phosphate Sorbed (%) | Amount of Phosphate Sorbed Per Surface Area (µmol·m−2) | Phosphate Sorption Capacity a (µmol·m−2) | Fraction of Sorption Capacity Occupied | Secondary Minerals Observed |
|---|---|---|---|---|---|---|---|
| Hematite | 0.500 | 0.271 | 45.9 | 1.64 | 2.40 | 0.68 | Sid |
| Goethite | 0.500 | ND b | 100 | 1.38 | 2.10 | 0.66 | Chuk |
| Maghemite | 0.010 | ND | 100 | 0.02 | 1.80 | 0.01 | Mag/Chuk |
| 0.100 | ND | 100 | 0.20 | 0.11 | Mag/Chuk | ||
| 1.000 | 0.068 | 93.2 | 1.83 | 1.02 | Mag/Chuk | ||
| 10.000 | 8.997 | 10 | 1.97 | 1.09 | Mag/Viv | ||
| Ferrihydrite | 0.010 | ND | 100 | <0.01 | 3.10 | <0.01 | Mag/Chuk |
| 0.100 | ND | 100 | 0.04 | 0.01 | Mag/Chuk | ||
| 1.000 | ND | 100 | 0.44 | 0.14 | Mag/Chuk | ||
| 10.000 | 4.854 | 51.5 | 2.28 | 0.73 | GR/Viv | ||
| Lepidocrocite | 0.001 | ND | 100 | <0.01 | 2.60 | <0.01 | Mag/Chuk |
| 0.010 | ND | 100 | 0.02 | 0.01 | Mag/Chuk | ||
| 0.100 | ND | 100 | 0.19 | 0.07 | GR | ||
| 0.500 | ND | 100 | 0.96 | 0.37 | GR | ||
| 1.000 | 0.373 | 62.7 | 1.21 | 0.46 | GR | ||
| 10.000 | 9.126 | 8.7 | 1.68 | 0.73 | GR/Viv | ||
| Feroxyhyte | 0.500 | ND | 100 | 1.10 | 2.50 | 0.44 | Mag/Chuk |
| 5.000 | 4.207 | 15.9 | 1.72 | 0.70 | GR/Viv | ||
| Ferric Green Rust | 0.500 | ND | 100 | 0.63 | — | — | Mag/Chuk |
| 5.000 | 2.104 | 57.9 | 3.66 | — | GR/Viv | ||
| Akaganeite | 0.500 | ND | 100 | 2.30 | 6.20 | 0.37 | GR |
Publisher’s Note: MDPI stays neutral with regard to jurisdictional claims in published maps and institutional affiliations. |
© 2021 by the authors. Licensee MDPI, Basel, Switzerland. This article is an open access article distributed under the terms and conditions of the Creative Commons Attribution (CC BY) license (http://creativecommons.org/licenses/by/4.0/).
Share and Cite
O’Loughlin, E.J.; Boyanov, M.I.; Gorski, C.A.; Scherer, M.M.; Kemner, K.M. Effects of Fe(III) Oxide Mineralogy and Phosphate on Fe(II) Secondary Mineral Formation during Microbial Iron Reduction. Minerals 2021, 11, 149. https://doi.org/10.3390/min11020149
O’Loughlin EJ, Boyanov MI, Gorski CA, Scherer MM, Kemner KM. Effects of Fe(III) Oxide Mineralogy and Phosphate on Fe(II) Secondary Mineral Formation during Microbial Iron Reduction. Minerals. 2021; 11(2):149. https://doi.org/10.3390/min11020149
Chicago/Turabian StyleO’Loughlin, Edward J., Maxim I. Boyanov, Christopher A. Gorski, Michelle M. Scherer, and Kenneth M. Kemner. 2021. "Effects of Fe(III) Oxide Mineralogy and Phosphate on Fe(II) Secondary Mineral Formation during Microbial Iron Reduction" Minerals 11, no. 2: 149. https://doi.org/10.3390/min11020149
APA StyleO’Loughlin, E. J., Boyanov, M. I., Gorski, C. A., Scherer, M. M., & Kemner, K. M. (2021). Effects of Fe(III) Oxide Mineralogy and Phosphate on Fe(II) Secondary Mineral Formation during Microbial Iron Reduction. Minerals, 11(2), 149. https://doi.org/10.3390/min11020149