Article

Reduction of Vanadium(V) by Iron(II)-Bearing Minerals

by
Edward J. O’Loughlin
1,*,
Maxim I. Boyanov
1,2 and
Kenneth M. Kemner
1
1
Biosciences Division, Argonne National Laboratory, Lemont, IL 60439-4843, USA
2
Institute of Chemical Engineering, Bulgarian Academy of Sciences, 1113 Sofia, Bulgaria
*
Author to whom correspondence should be addressed.
Minerals 2021, 11(3), 316; https://doi.org/10.3390/min11030316
Submission received: 12 February 2021 / Revised: 12 March 2021 / Accepted: 15 March 2021 / Published: 18 March 2021
(This article belongs to the Special Issue Redox Reactivity of Iron Minerals in the Geosphere)

Abstract

:
Fe(II)-bearing minerals (magnetite, siderite, green rust, etc.) are common products of microbial Fe(III) reduction, and they provide a reservoir of reducing capacity in many subsurface environments that may contribute to the reduction of redox active elements such as vanadium; which can exist as V(V), V(IV), and V(III) under conditions typical of near-surface aquatic and terrestrial environments. To better understand the redox behavior of V under ferrugenic/sulfidogenic conditions, we examined the interactions of V(V) (1 mM) in aqueous suspensions containing 50 mM Fe(II) as magnetite, siderite, vivianite, green rust, or mackinawite, using X-ray absorption spectroscopy at the V K-edge to determine the valence state of V. Two additional systems of increased complexity were also examined, containing either 60 mM Fe(II) as biogenic green rust (BioGR) or 40 mM Fe(II) as a mixture of biogenic siderite, mackinawite, and magnetite (BioSMM). Within 48 h, total solution-phase V concentrations decreased to <20 µM in all but the vivianite and the biogenic BiSMM systems; however, >99.5% of V was removed from solution in the BioSMM and vivianite systems within 7 and 20 months, respectively. The most rapid reduction was observed in the mackinawite system, where V(V) was reduced to V(III) within 48 h. Complete reduction of V(V) to V(III) occurred within 4 months in the green rust system, 7 months in the siderite system, and 20 months in the BioGR system. Vanadium(V) was only partially reduced in the magnetite, vivianite, and BioSMM systems, where within 7 months the average V valence state stabilized at 3.7, 3.7, and 3.4, respectively. The reduction of V(V) in soils and sediments has been largely attributed to microbial activity, presumably involving direct enzymatic reduction of V(V); however the reduction of V(V) by Fe(II)-bearing minerals suggests that abiotic or coupled biotic–abiotic processes may also play a critical role in V redox chemistry, and thus need to be considered in modeling the global biogeochemical cycling of V.

1. Introduction

Vanadium (V) is a Group 5 transition metal found in a variety of aquatic and terrestrial environments [1,2,3,4,5] and is a relatively abundant trace metal (e.g., an average of 97 mg kg−1 within the Earth’s crust [6]; from <1 to 460 mg kg−1 in soils and sediments ([5] and references therein); and 0.04–220 µg L−1 in surface waters [7]). The biogeochemistry of V is highly complex [4]; V is essentially never present as a free element in nature, but it is a major constituent (>10 wt%) of over 150 minerals including vanadiferous magnetite and ilmenite, carnotite, mottramite, patronite, roscoelite, and vanadinite [8,9]. In addition to natural inputs of V into the environment via weathering of V-bearing minerals [10,11], human activities have discharged V into the air, land, and water by the burning of fossil fuels, releases associated with mining and ore processing, industrial uses and application of phosphate fertilizers [5]. V is used in the production of alloys (primarily for high-strength steel and alloys used in the aerospace industry), as industrial catalysts, in production of glasses, ceramics, and pigments, and in V redox-flow batteries [9]. Global consumption of V has been increasing in recent years with total global V production of 73 Gg tons in 2019 [12], and it has been characterized as a re-emerging environmental hazard [13].
Vanadium can exist in multiple valence states (−I, 0, II, III, IV, and V; however, only III, IV, and V are relevant under conditions typical of environments at the Earth’s surface), and the biogeochemistry of V—as for many other transition elements—is heavily influenced by redox conditions and pH [1,4,5,9]. Vanadium(III) is typically stable under highly anoxic conditions such as those in euxinic soils/sediments. Vanadium(IV) is stable in moderately reducing environments, particularly under acidic conditions, while V(V) is stable under oxic conditions and in suboxic alkaline environments. Both the mobility and toxicity of V are influenced by the valence state of V. Vanadium(III) and V(IV) tend to form relatively insoluble (oxy) hydroxides (e.g., V(OH)3 and VO(OH)2, respectively) and V(IV) also forms highly stable organic complexes, thus limiting their mobility in environmental systems; however, due to the formation of various oxyanions (e.g., VO43−, HVO42−, and H2VO4), V(V) is significantly more soluble and tends to be more mobile [9,14]. Vanadium can be toxic to aquatic and terrestrial organisms [4,7,15,16,17], with V(V) considered to be more toxic than V(IV) and V(III) given that it is a potent inhibitor of many phosphatase enzymes including adenosine triphosphatases (attributed to the structural similarity of the tetrahedral o-vanadate anion to o-phosphate) and given its comparatively higher mobility and bioavailability [4,7].
There has been a growing interest in understanding V redox transformations, particularly among the III, IV, and V oxidation states, to better determine V mobility and fate in natural systems. Microbes play a central role in the speciation and mobility of V in aquatic and terrestrial environments [1,4], particularly the reduction of V(V). Pure culture studies have identified over 14 V(V)-reducing bacteria and archaea spanning 9 genera isolated from soils and sediments from diverse environments [18,19,20,21,22,23,24,25,26,27,28,29]. Furthermore, microbial reduction of V(V) has been reported in laboratory and field systems by members of microbial communities present in soils, sediments, and sludges [30,31,32,33,34,35,36,37,38,39,40]. Microbial reduction of V(V) typically leads to the formation of V(IV) species (i.e., soluble complexes and various precipitates); however, reduction to V(III) has been reported [18,22,28]. In addition to direct microbial reduction of V(V), microbes can indirectly impact V speciation/mobility by altering the geochemical conditions of their environment, particularly microbes involved in the biogeochemical cycling of Fe and S. Microbial reduction of ferric iron (Fe(III)) can result in the formation of a broad range of Fe(II) species including mineral phases containing structural Fe(II) (e.g., magnetite (Fe3O4) , siderite (FeCO3), vivianite [Fe3(PO4)2•8H20], green rust (a mixed Fe(II)/Fe(III) layered double hydroxide), and chukanovite [Fe2(OH)2CO3]) [41,42,43,44,45,46,47,48,49,50,51]. Likewise, microbial reduction of oxidized S species such as sulfate, sulfite, and thiosulfate, and S(0), results in the production of sulfide, and its subsequent reaction with Fe(II) leads to the formation of insoluble ferrous sulfides such as mackinawite (FeS), greigite (Fe3S4), pyrite (FeS2), and pyrrhotite (Fe(1-x)S (x = 0 to 0.2)) [52,53,54,55,56,57,58]. In contrast to direct microbial reduction, little is known regarding the potential for reduction of V(V) by Fe(II)-bearing minerals. Structural Fe(II) in magnetite and ilmenite (Fe(II)Ti(IV)O3) can reduce V(V) to V(IV) over a pH range of 1–7, but the rate decreases markedly above pH 5 [59]. A recent study by Vessey and Lindsay [60] reported limited reduction of V(V) to V(IV) by magnetite, essentially complete reduction to V(IV) by siderite, and to V(IV), with possibly some V(III), by mackinawite. These results suggest that other Fe(II)-bearing minerals may also be effective reductants for V(V).
To better understand the redox behavior of V under ferrugenic/sulfidogenic conditions, we examined the interactions of V(V) (1 mM) in aqueous suspensions containing 50 mM Fe(II) as magnetite, siderite, vivianite, green rust, or mackinawite, and two additional systems containing either 60 mM Fe(II) as biogenic green rust or 40 mM Fe(II) as a mixture of biogenic siderite, mackinawite, and magnetite, using X-ray absorption spectroscopy to determine changes in the valence state of V.

2. Materials and Methods

2.1. Fe Minerals

Magnetite, siderite, vivianite, green rust, and mackinawite were prepared as described by Johnson et al. [61]. Biogenic green rust (BioGR) was produced by the bioreduction of lepidocrocite (γ-FeOOH) by Shewanella putrefaciens strain CN32 [62]. The BioGR was pasteurized (70 °C for 1 h) and the solids were collected by centrifugation and repeatedly washed with sterile, anoxic water. A mixed phase suspension containing biogenic siderite, mackinawite, and magnetite (BioSMM; each phase is 52, 26, and 22 mol% Fe, respectively, as determined by Fe X-ray absorption near edge spectra (XANES) analysis) was formed during the bioreduction of 50 mM Fe(III) as ferrihydrite in a system containing 10 mM sulfate that was inoculated with wetland sediment (details in [61]). Both the BioGR and BioSMM were pasteurized at 70 °C for 1 h prior to use. Ferrihydrite and goethite were prepared as described by Kwon et al. [58].

2.2. Experimental Setup

The interaction of V(V) with Fe(II) minerals was investigated in sterile 50-mL polypropylene centrifuge tubes containing 40 mL of 50 mM 3-morpholinopropane-1-sulfonic acid (MOPS) buffer at pH 7.0 amended with 1 mM NaVO3 and 50 mM Fe(II) as either magnetite, green rust, siderite, vivianite, or mackinawite. Two additional systems were prepared by adding 1 mM NaVO3 to 40 mL of either BioGR (60 mM Fe(II)) or BioSMM (40 mM Fe(II)). The experimental systems were prepared and maintained in a glove box containing an anoxic atmosphere (Coy Laboratory Products, Grass Lake, Michigan, 3–5% H2 in N2, Pd catalyst, O2 in the box < 1 ppm at all times) and continuously mixed on a rotating mixer (Rotamix RKVSD, Appropriate Technical Resources, Laurel, MD, USA). At selected times, subsamples of each suspension were filtered through 25 mm 0.2 µm pore-size nylon filters. The filtrate was acidified to pH 1 by the addition of concentrated HCl for determination of the concentration of aqueous V by inductively coupled plasma-optical emission spectroscopy (ICP-OES) using a PerkinElmer 4300DV instrument (PerkinElmer Inc., Waltham, MA, USA). Measurement of the V emission line at 290.880 nm in radial view mode provided a detection limit of 0.1 µM. The hydrated solids retained on the filter were sealed between two layers of Kapton film for V XANES analysis. Sample collection and processing were conducted in a glove box containing an anoxic atmosphere.

2.3. X-ray Absorption Spectroscopy Analysis

V K-edge (5465 eV) X-ray absorption spectroscopy measurements were carried out at the MR-CAT/EnviroCAT insertion device beamline (Sector 10, Advanced Photon Source, Lemont, IL, USA) [63]. XANES were collected from the standards and the reactor solids in the transmission mode using gas-filled ionization chambers and in fluorescence mode using a 4-element Vortex detector (Hitachi High-Tech America, Schaumburg, IL, USA). Spectra were collected at room temperature inside a N2-purged sample cell. The anoxic integrity of samples prepared and analyzed this way has been demonstrated in previous work [64]. Some of the wet paste samples (from the FeS and BioSMM systems) showed beam-induced oxidation after the first few scans and were remeasured frozen at −120 °C in a Linkam® stage cooled by liquid nitrogen to mitigate these effects. There were no significant differences between the low temperature measurements and the first few room temperature scans, which provided guidance on how many of the room temperature scans on fresh areas of these samples could be used without beam induced artifacts. Energy calibration was established by setting the inflection point in the spectrum of a V foil to 5465 eV. All scans that did not show radiation- or location-dependent differences were averaged to produce the final spectrum for each sample.
Analysis of the spectra was based on comparisons to V standards (preparation of the V standards is described in Section 2.4). The standards dataset included: V(III)-oxide (V2O3), V(III)-sulfate (V2(SO4)3), aqueous V(III) (VCl3 dissolved in H2O), V(IV)-sulfate (VOSO4), aqueous V(IV) (VOSO4 dissolved in H2O), V(V)-fervanite (FeVO4), aqueous V(V) (NaVO3 in 50 mM pH 7 MOPS), V(V) adsorbed on ferrihydrite, and V(V) adsorbed on goethite (α-FeOOH). The polycrystalline V powders were crushed with a mortar and pestle, sieved, and gently dispersed on the adhesive side of Kapton tape. This procedure selects the smallest particles and creates a visually uniform layer with minimal potential for pinholes on the scale of the beamsize (500 μm × 2000 μm). The tape mounts were folded 2–4 times as needed to achieve an optimal absorption edge step in transmission of 1, effectively eliminating the possibility for pinhole alignment in the folded samples. Spectra were taken from 3 fresh locations on the samples and averaged. Solution samples were mounted in 1.5 mm thick sample holders with Kapton film windows and the spectrum was measured in fluorescence. Adsorbed V standards were mounted as wet pastes in a 1.5 mm thick sample holder with Kapton windows and measured in the fluorescence mode. Potential self-absorption effects in fluorescence were estimated in the more concentrated standards where both transmission and fluorescence data could be collected. By comparing the suppression of the XANES white line in fluorescence relative to its amplitude in transmission and scaling the effect to the relative fluorescence edge steps between the standards (20–50% V content) and the reactor solids (<1% V content) we estimated that self-absorption amplitude suppression, if at all present, will have an effect that is less than the 10% uncertainty typical of linear combination XANES analysis. Furthermore, we only used the pre-edge peak and the edge position in the XANES analysis where the absorption and correspondingly the self-absorption were proportionally smaller (see Section 3.3). Normalization and background removal of the data was done using the program AUTOBK [65]. The combinatorial linear combination (LC) fits were performed using the program ATHENA [66].

2.4. V Standards

V(III) oxide (V2O3) (Alfa Aesar 95%) was used as received. V(III) sulfate [V2(SO4)3] was synthesized as described by Zatko and Kratochvil [67] with minor modification. Briefly, 1 g of V2O5 (Sigma-Aldrich 99.95%) and 1 g of elemental sulfur were added to 15 mL of concentrated (98%) H2SO4 in a 50 mL beaker containing a Teflon-coated magnetic stir bar. The beaker was covered with a watch glass, placed on a magnetic stir plate, and refluxed at 200 °C with continuous mixing for 24 h. The yellow solids were collected by centrifugation, resuspended in 20 mL of water, centrifuged, resuspended in 15 mL of absolute ethanol, centrifuged, and resuspended in acetone. A sample for XANES analysis was prepared by filtering a subsample of the acetone suspension on a 0.22 µm nylon membrane filter that was then sealed between two layers of Kapton film. A 10 mM aqueous V(III) standard was prepared by dissolving VCl3 (Sigma Aldrich 97%) in distilled water. A V(III) carbonate standard was prepared from the precipitate that formed on the addition of 1 mL of 100 mM VCl3 to 10 mL of 500 mM Na2CO3. A V(III) phosphate standard was prepared from the precipitate that formed on the addition of 0.5 mL of 100 mM VCl3 to 10 mL of 100 mM Na2HPO4.
V(IV) sulfate (VOSO4) (Alfa Aesar 99.9%) was mixed with boron nitride (4:1) BN:VOSO4 and the mixture was mounted in a 1.5 mm thick sample holder with Kapton windows. A 10 mM aqueous V(IV) standard was prepared by dissolving VOSO4 in distilled water.
The iron orthovanadate standard FeVO4•1.1 H2O, a synthetic phase similar to the mineral fervanite (Fe4(VO4)4•5H2O), was prepared as described by Poizot et al. [68]. Briefly: 33 mL of 260 mM Fe(NO3)3 was added with stirring to 2 L of 4.27 mM NH4VO3 (Sigma-Aldrich 99%) heated to 75 °C and maintained at 75 °C with continuous stirring for 6 days. The resulting precipitate was recovered by centrifugation, sequentially washed with deionized water and acetone, dried at 50 °C, and ground to pass a 200-mesh sieve. A 10 mM aqueous V(V) standard was prepared by dissolving NaVO3 (Sigma-Aldrich 99.9%) in 50 mM pH 7 MOPS. A standard of V(V) sorbed on ferrihydrite was prepared by adding ferrihydrite (2.0 g L−1) to 50 mM pH 7 MOPS containing 1 mM NaVO3 and equilibrating for 5 d with continuous mixing at 25 °C. A standard representing V(V) adsorbed on goethite was prepared based on an approach used by Peacock and Sherman [69]. Briefly, an aqueous suspension containing 3.3 g L−1 of goethite and 0.5 mM NaVO3 (Sigma-Aldrich 99.9%) in 0.1 M NaNO3 was adjusted to pH 6 and equilibrated with continuous mixing at 25 °C for 5 d.

3. Results and Discussion

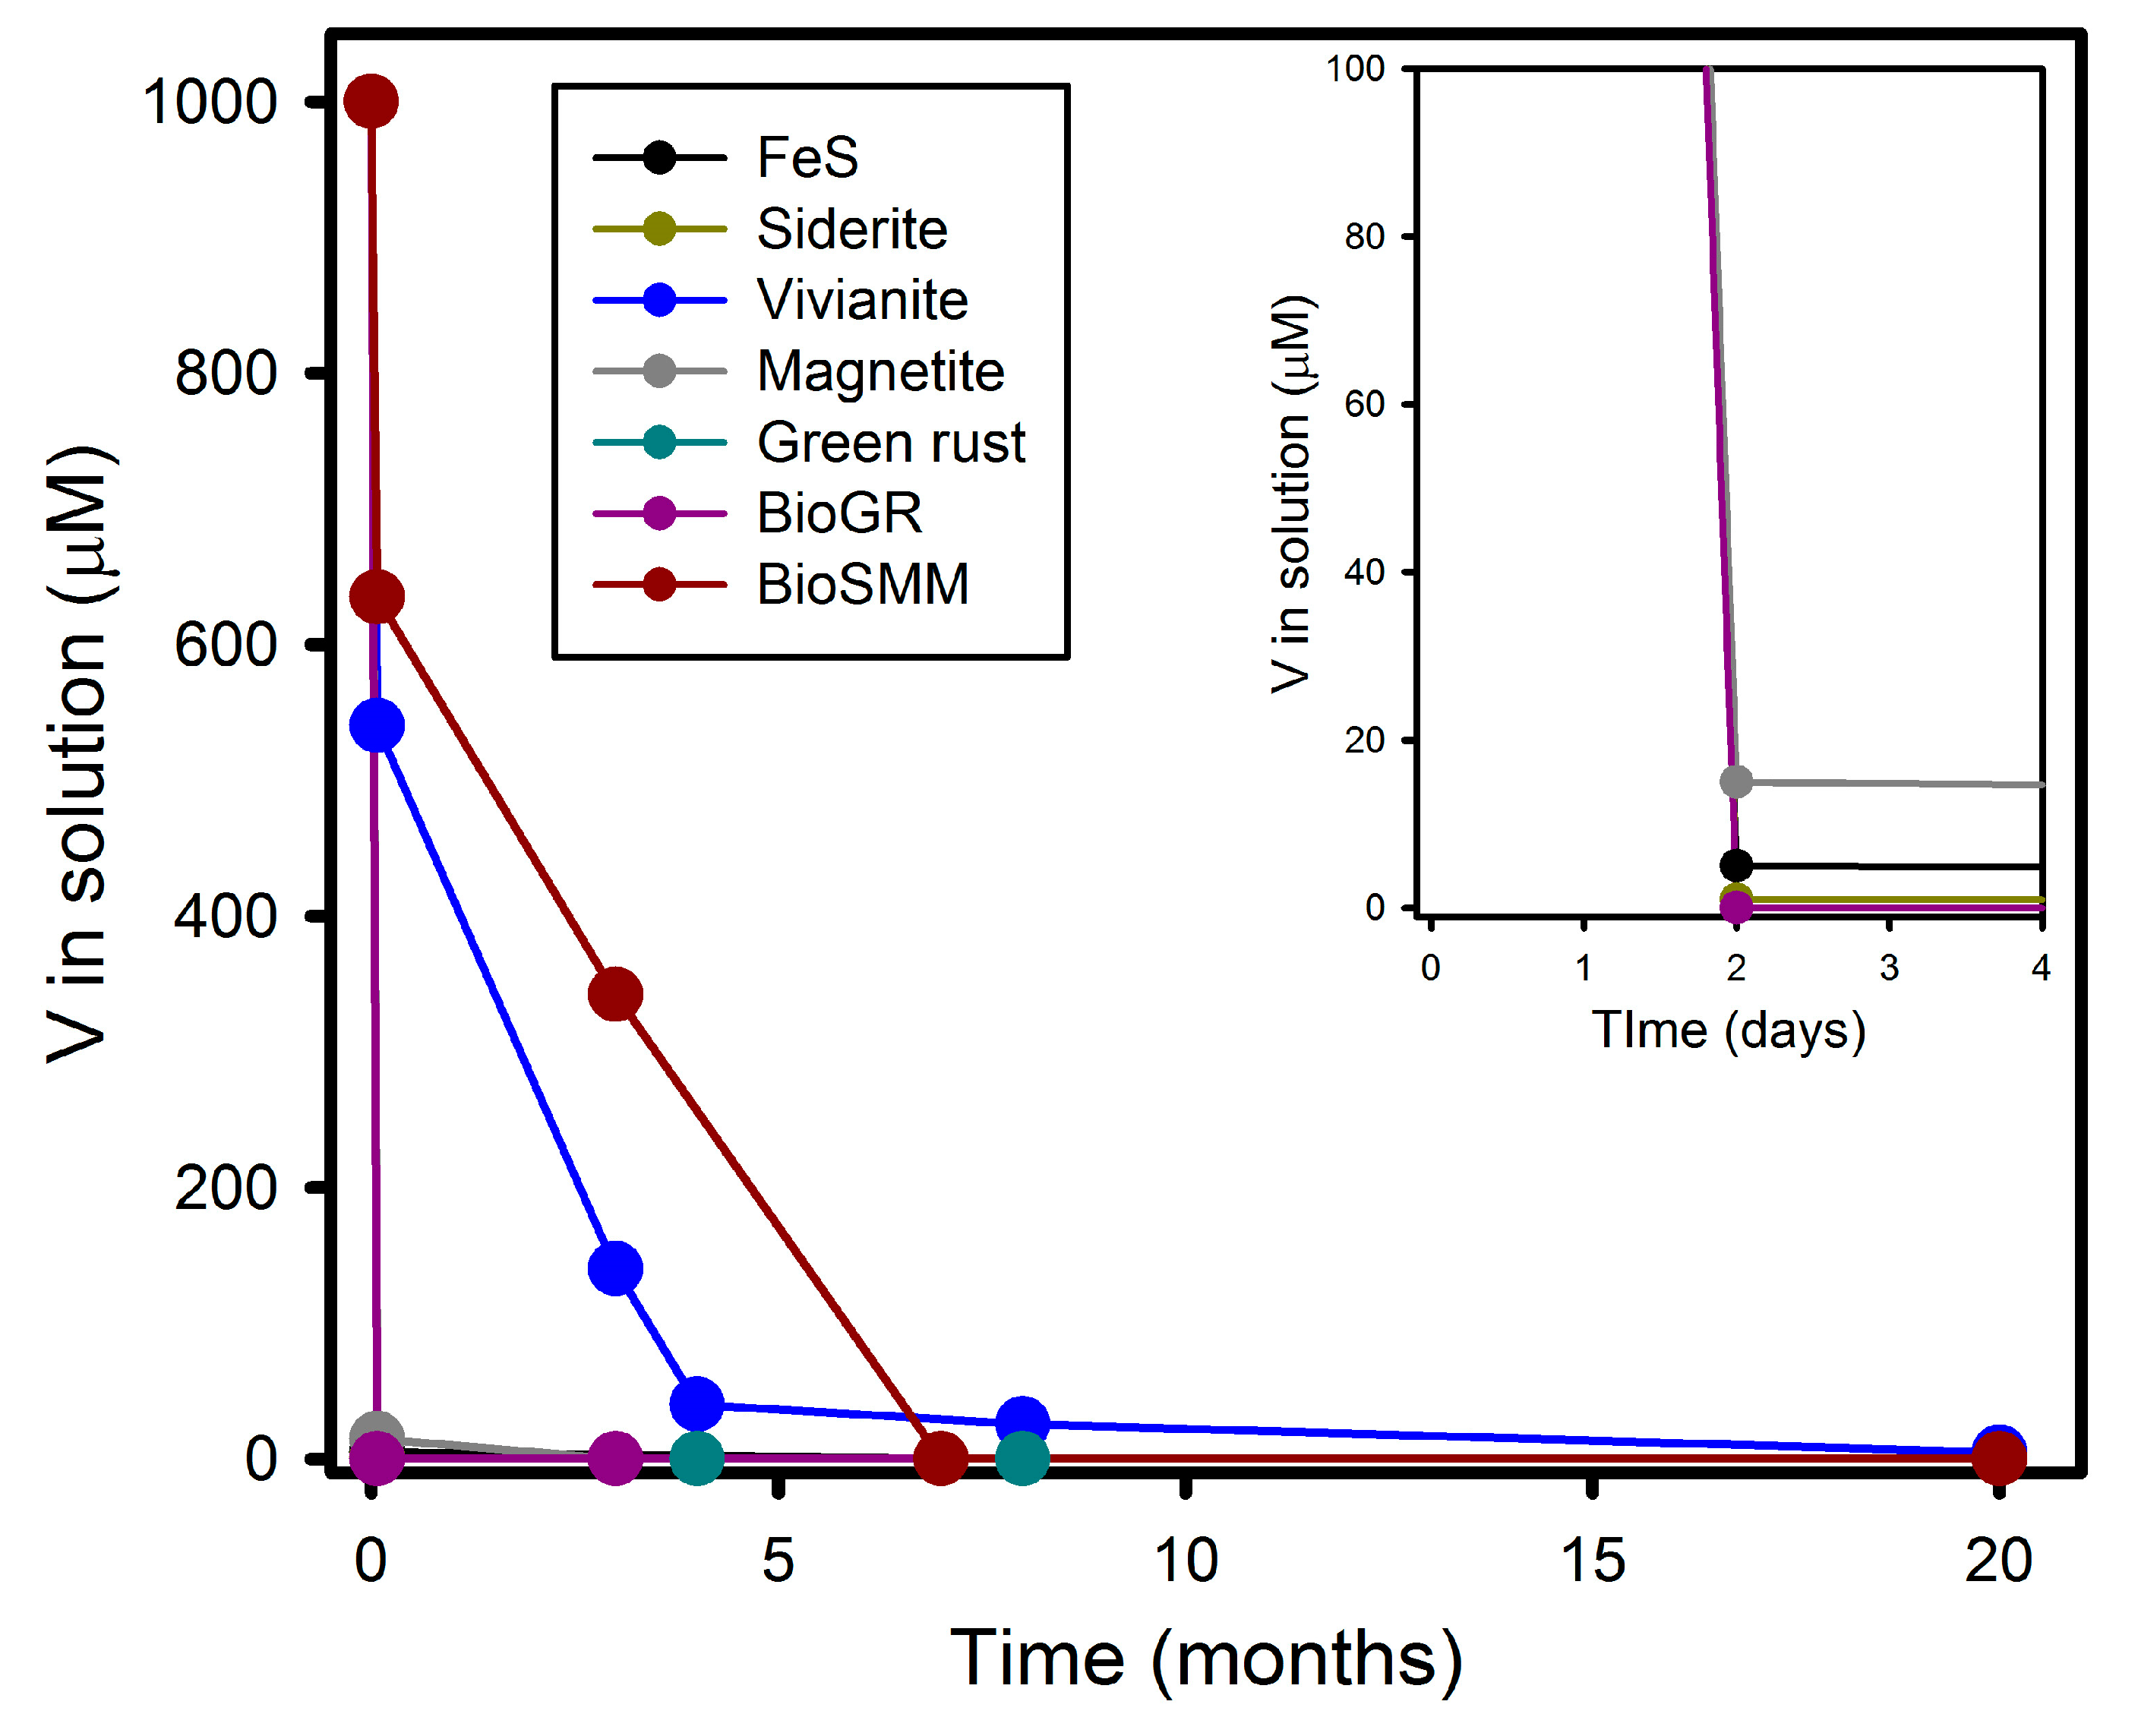
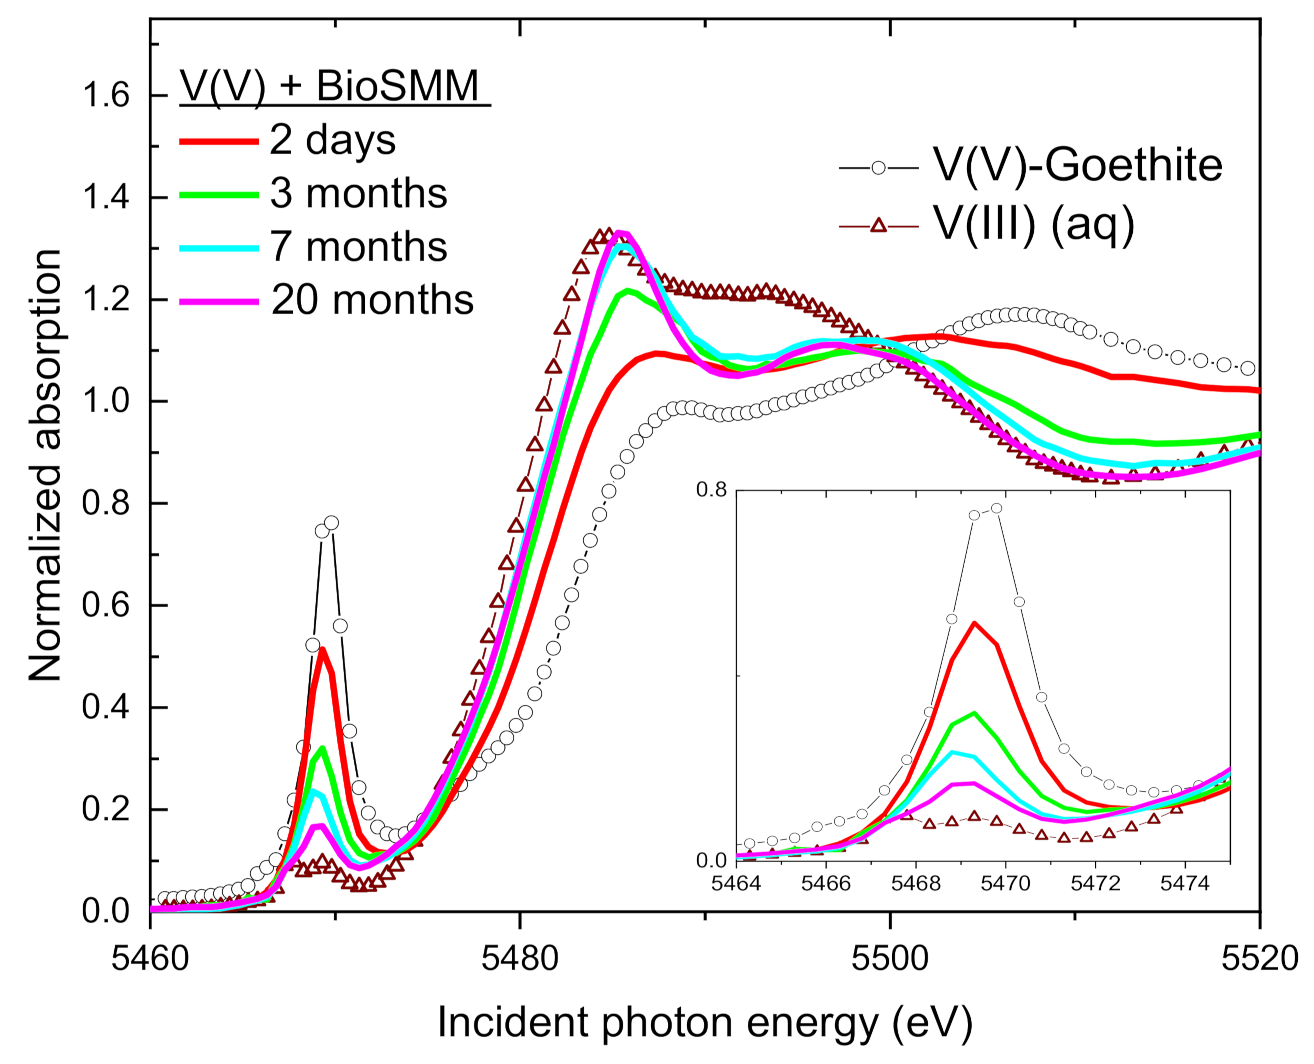
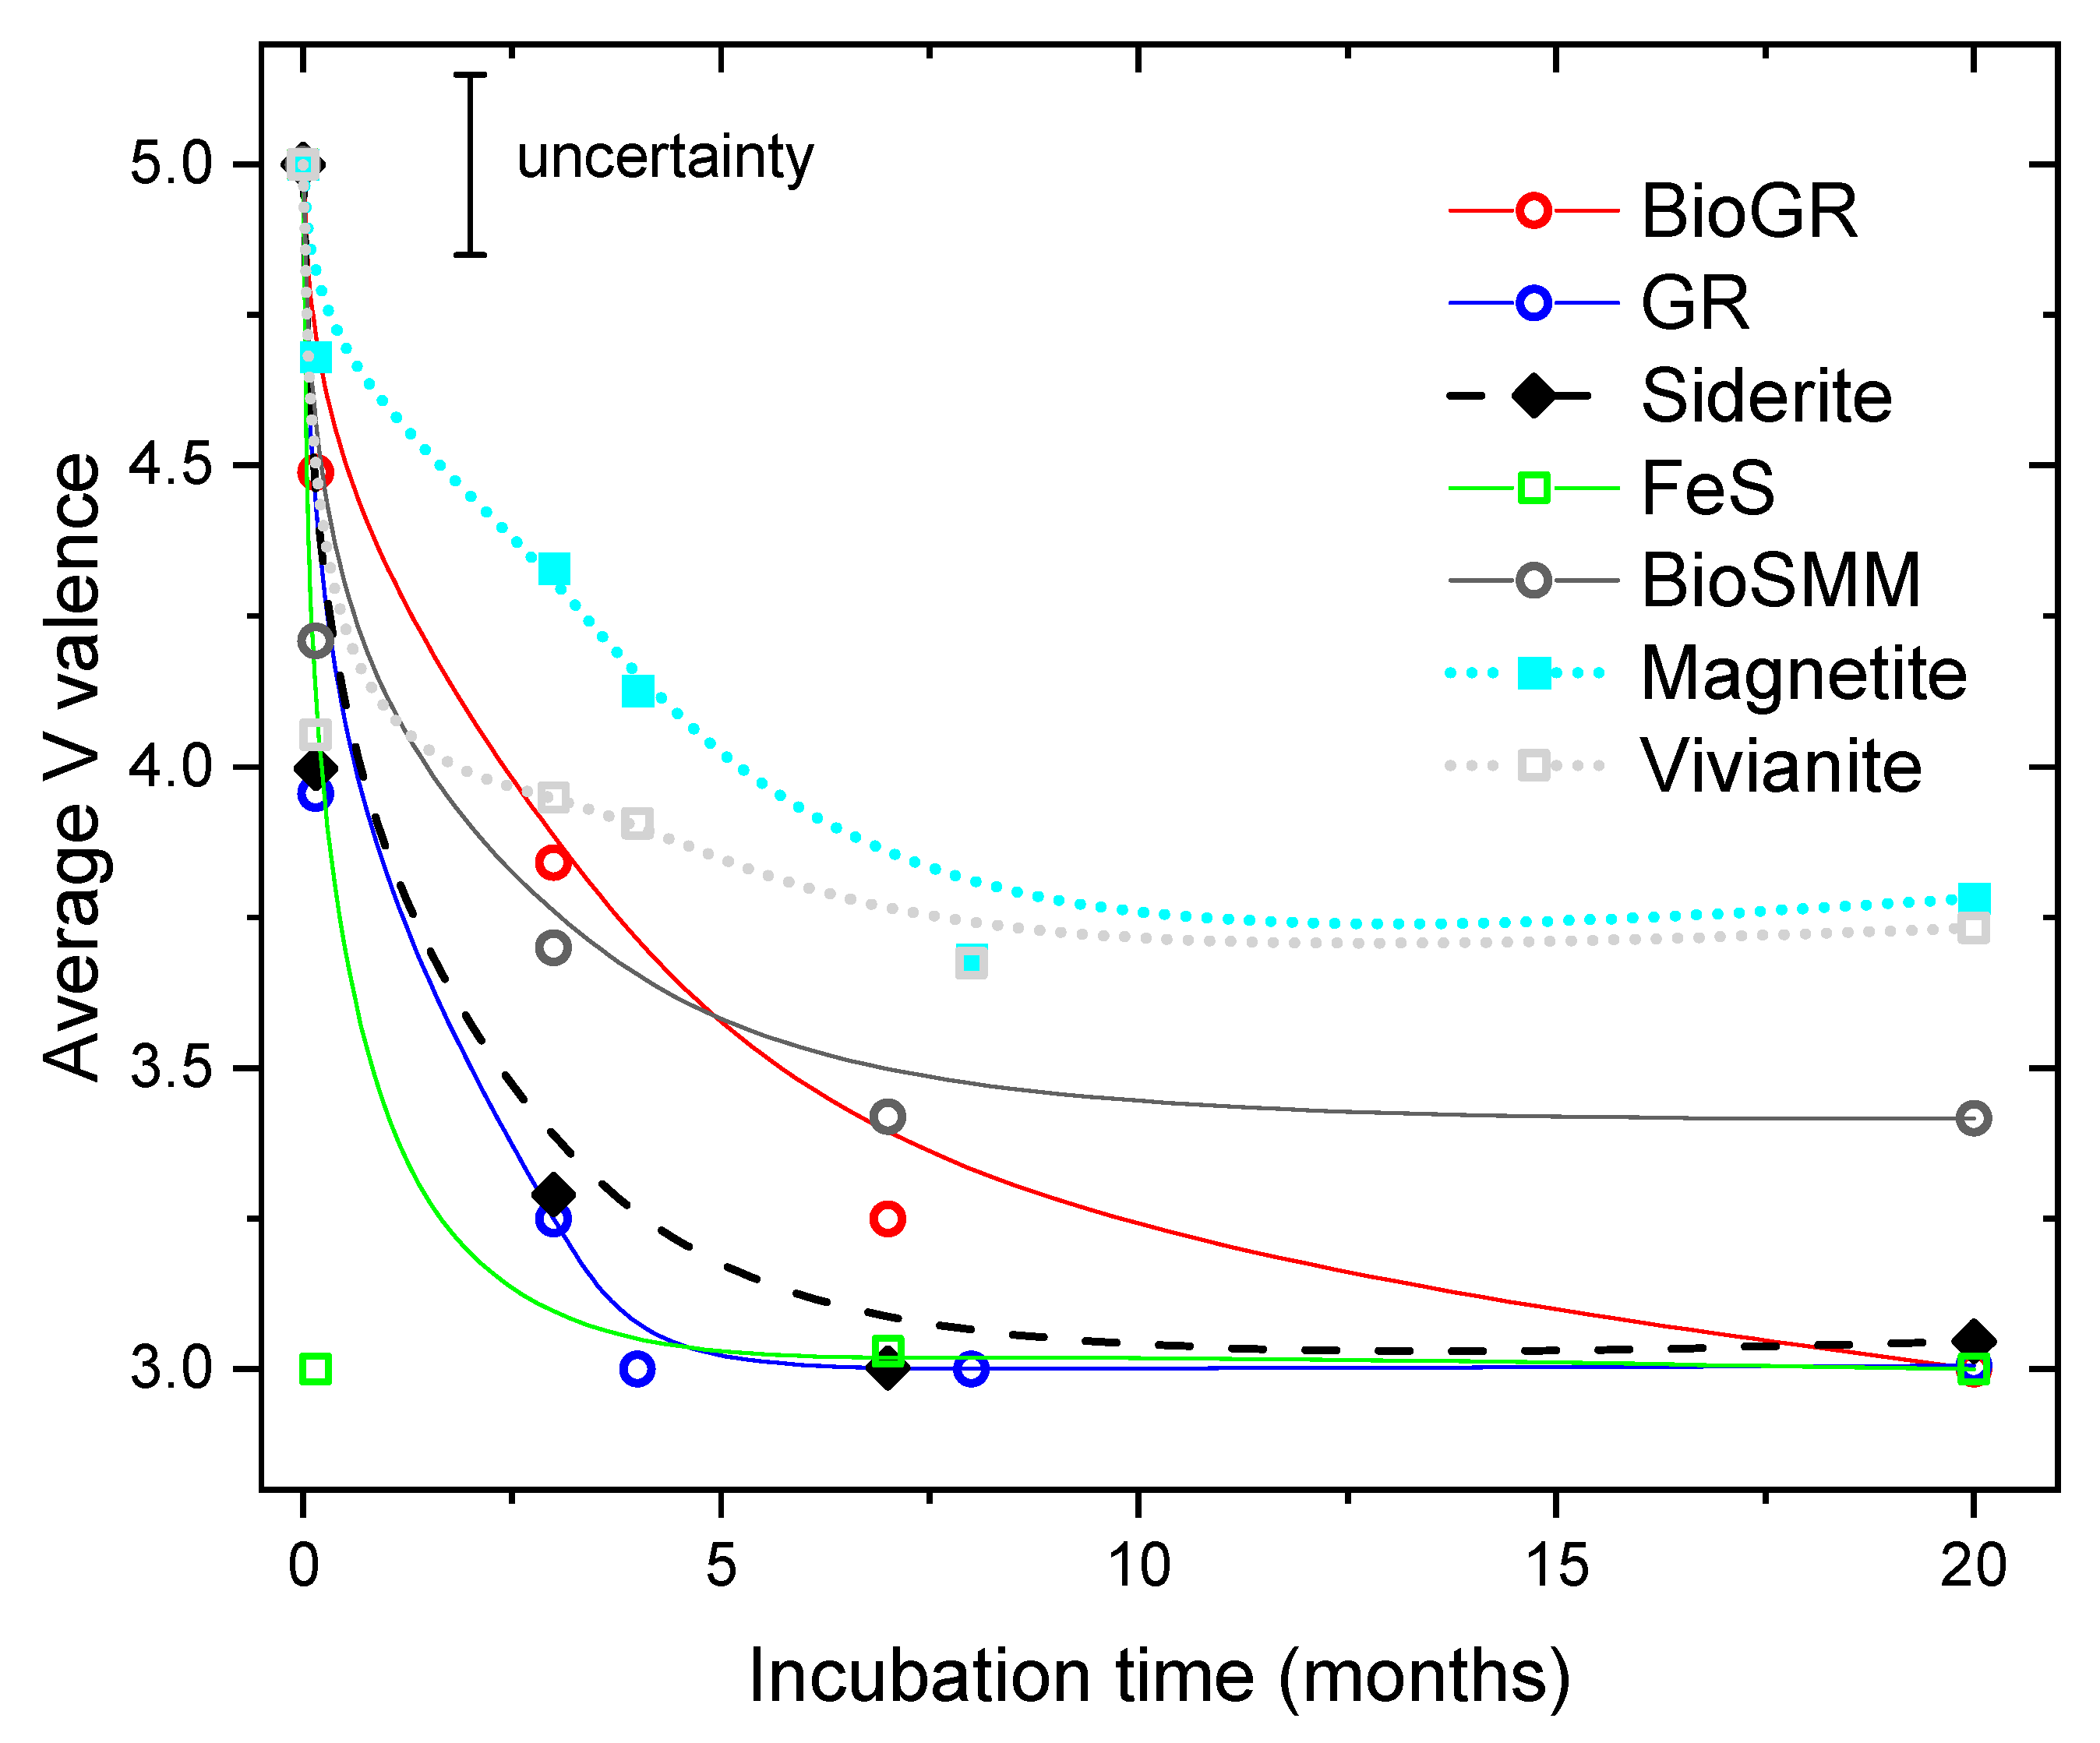
3.1. V(V) Uptake and Extent of Reduction

Within 48 h, total solution-phase V concentrations decreased to <20 µM in all but the vivianite and biogenic BioSMM systems (Figure 1); however, within 7 months and 20 months > 99.5% of V was removed from solution in the BioSMM and vivianite systems, respectively.

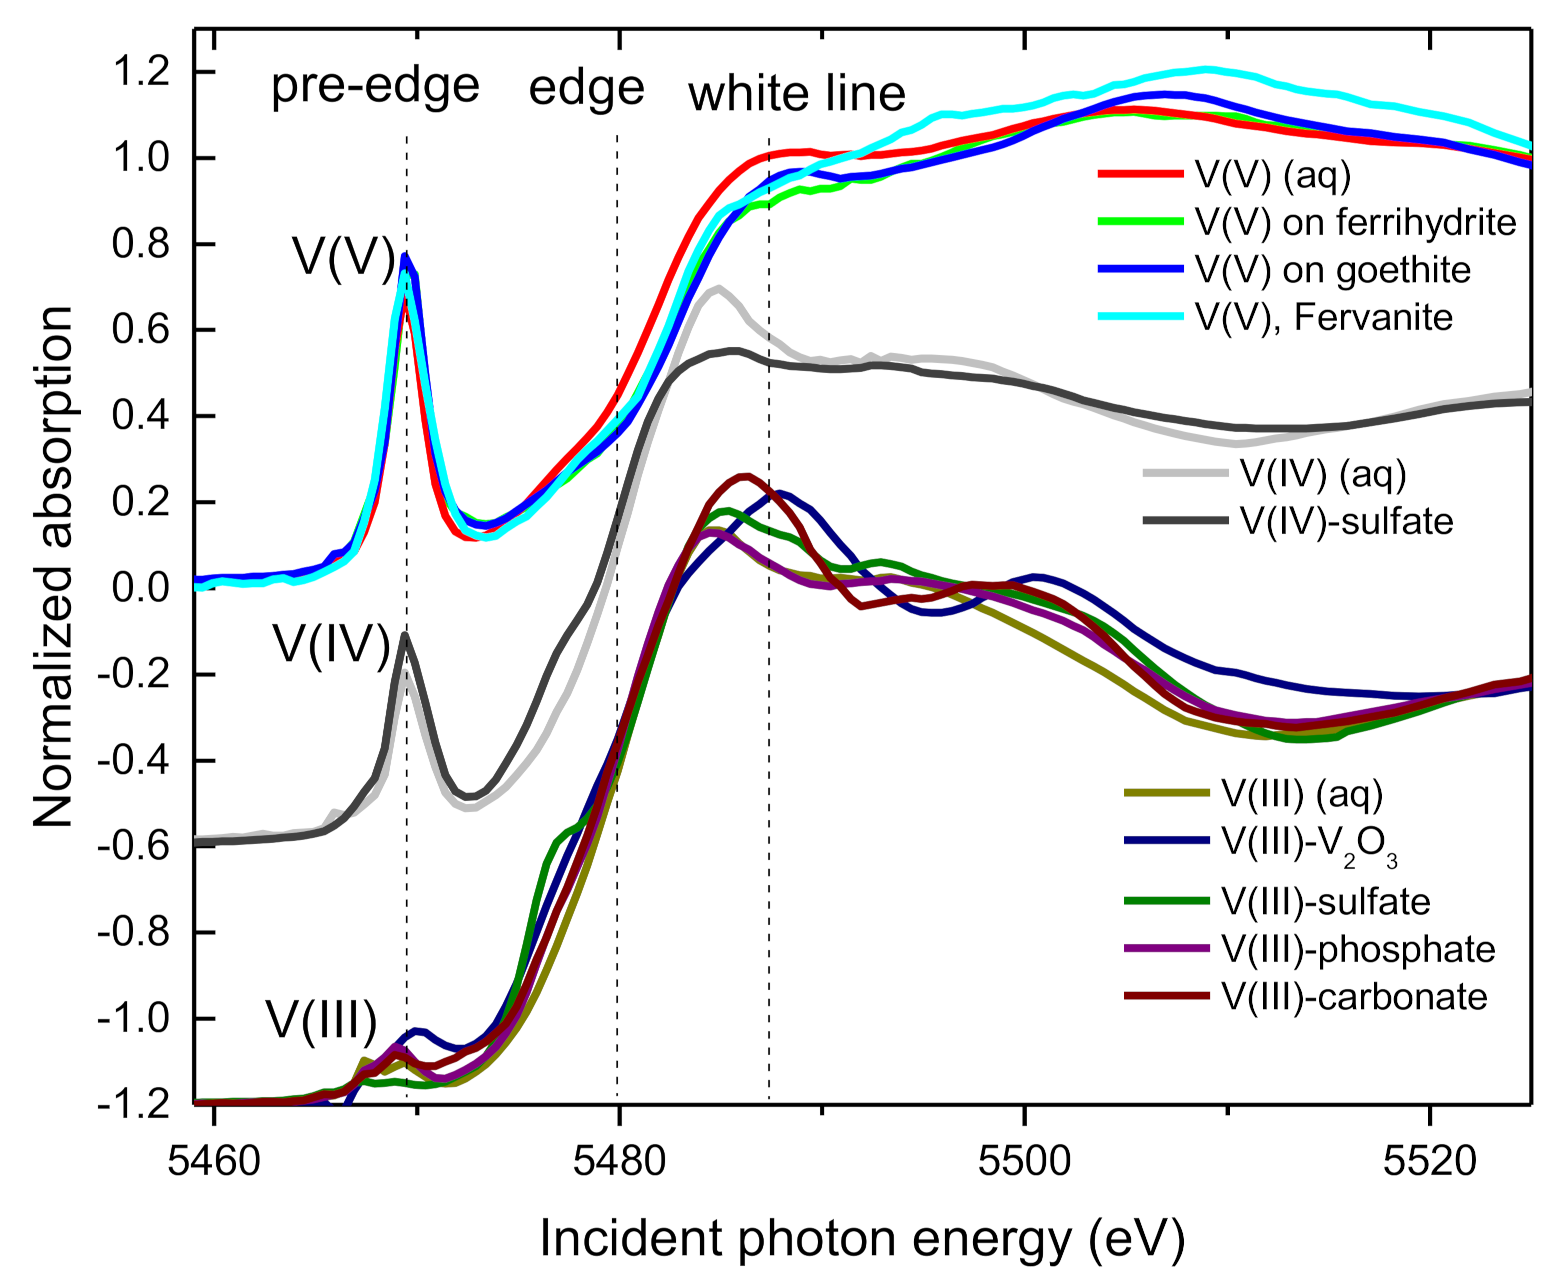
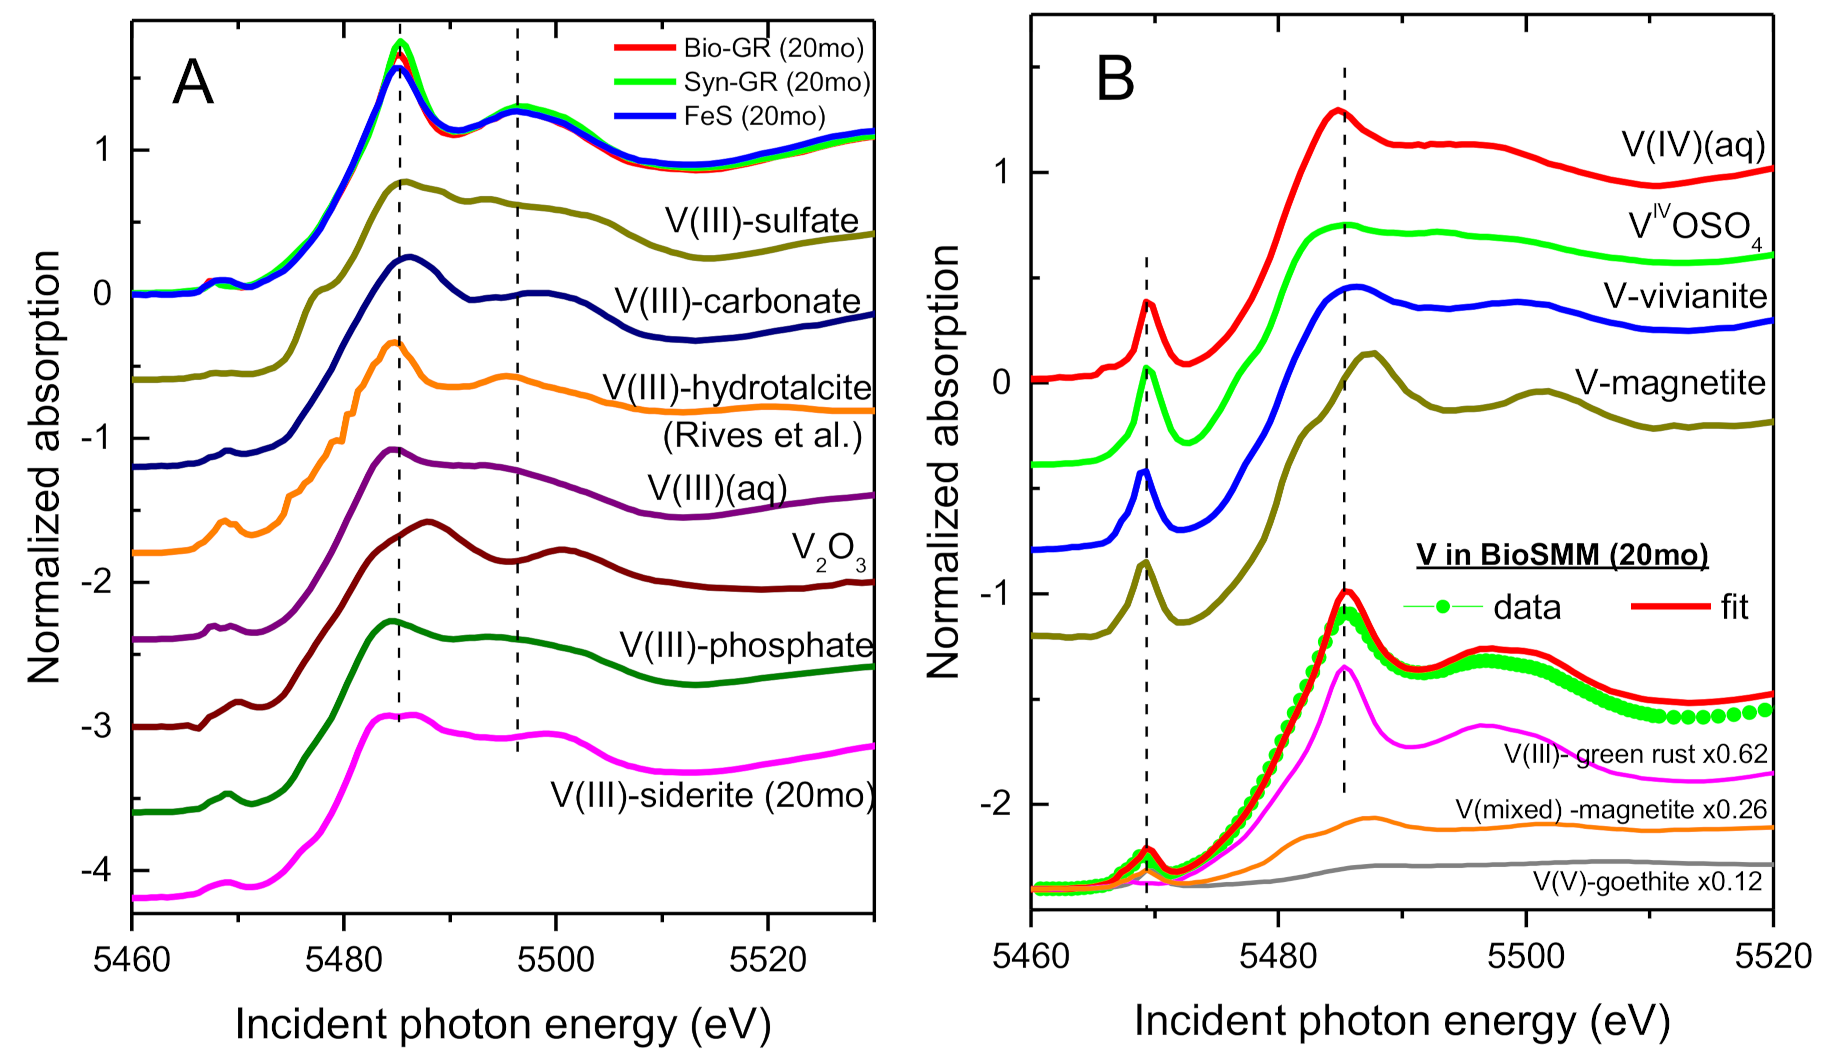
3.2. XANES Spectra of V Standards

The goal of this initial study was to compare the rates and extents of V(V) reduction among systems with various Fe(II) phases. Determining the coordination environment of the reduced V species requires further analysis and will be the subject of an upcoming report. The XANES spectra from several V(III), V(IV), and V(V) standards measured in this study are compared in Figure 2. The spectra group by the valence state of V in (a) the amplitude of the pre-edge peak near 5470 eV; (b) the overall edge position near 5480 eV; and (c) the amplitude and shape of the white line near 5487 eV. The V(V) standards exhibit the highest amplitude of the pre-edge peak, have the highest edge energy position, and the most suppressed white line. The V(IV) and V(III) standards have similar edge positions and white line intensities but differ in the amplitude of the pre-edge peak. The V(III) standards have the lowest pre-edge peak amplitude, which allows differentiation from the V(IV) valence.
Prior studies have discussed in detail the origin of these spectral features and their relationship to V valence or local coordination environment [70,71,72,73,74]. These works have typically established a functional relationship between the pre-edge peak amplitude (and/or the edge position) and the average V valence state. Other studies have used the linear combination fit (LCF) approach, whereby the experimental spectrum is modeled with weighed combinations of standards spectra [75,76,77,78,79,80,81]. Despite the different approaches in interpreting the data, the general consensus is that as long as the local atomic environment around V in the standards is representative of that in the studied samples, the use of such relationships or of LCFs produces similar results and is reliable in determining the V valence state [4].
We used the LCF approach to determine the evolution of V valence with incubation time in our systems. This approach uses both the pre-edge amplitude and the edge position for V valence determination in an averaged way over the spectral region 5465–5483 eV. In addition, by testing several standards for each valence in the combinatorial LC fits we attempted to average out potential structural interferences on valence determination. As representative standards for the V(V) species in our systems we used an aqueous V(V) sample, V(V) adsorbed to ferrihydrite, V(V) adsorbed to goethite, and V(V) in fervanite (Fe(III)V(V)O4). These standards have isolated V(V)O43− tetrahedra in different binding configurations [69,82,83] and their similar XANES spectra reflect the predominant contribution from the rigid tetrahedral O coordination in the V5+O43− entity. As representative V(IV) standards we used an aqueous sample obtained from the dissolution of the vanadyl sulfate hydrate VOSO4, and the VOSO4 powder itself. The structure of VOSO4 has a V(IV) atom surrounded by 4 nearly in-plane O atoms at 2.0 Å from monodentate bound sulfate groups and one out-of-plane short O bond at 1.6 Å [84]. As representative V(III) standards, we used aqueous V(III), V2O3, V(III)-sulfate, V(III)-phosphate, and V(III)-carbonate. V(III) is octahedrally and symmetrically coordinated to O near-neighbors in these compounds, resulting in the significantly lower pre-edge peak amplitude than in the V(IV) and V(V) standards. The spectra of the V(III) standards have nearly identical pre-edge amplitudes and edge positions; differences related to the placement of the V(III) octahedron in different coordination environments appear in the white line region and above. All samples and standards were measured at the same beamline using the same experimental setup, which results in the same instrumental effects on all spectra. Previous V XANES work has highlighted the importance of comparing spectra measured with the same beamline and setup [75].

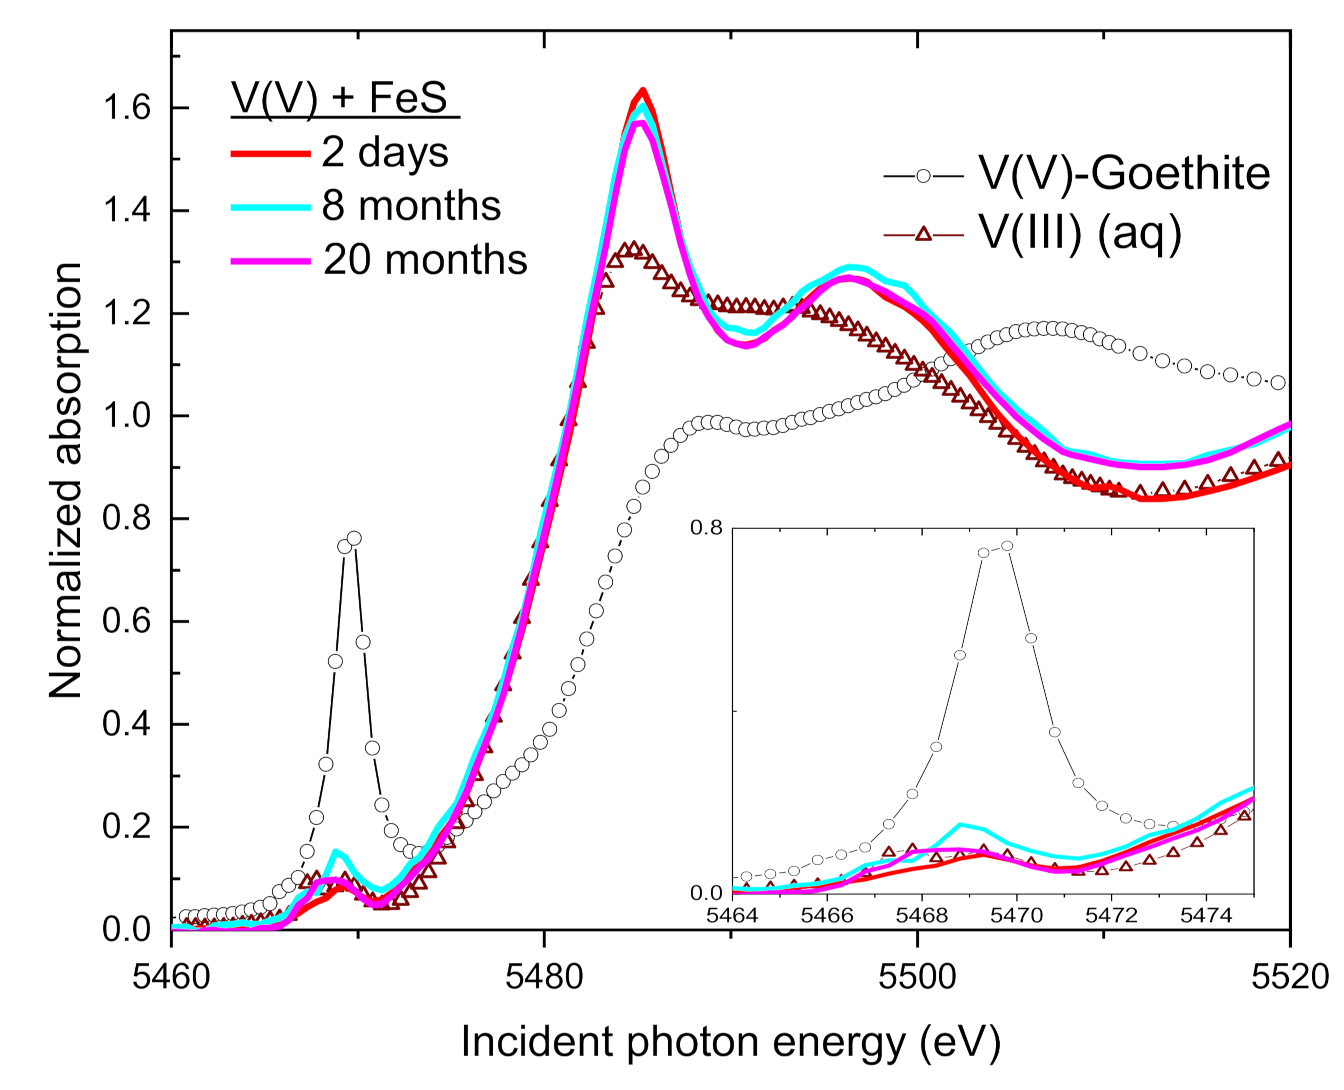
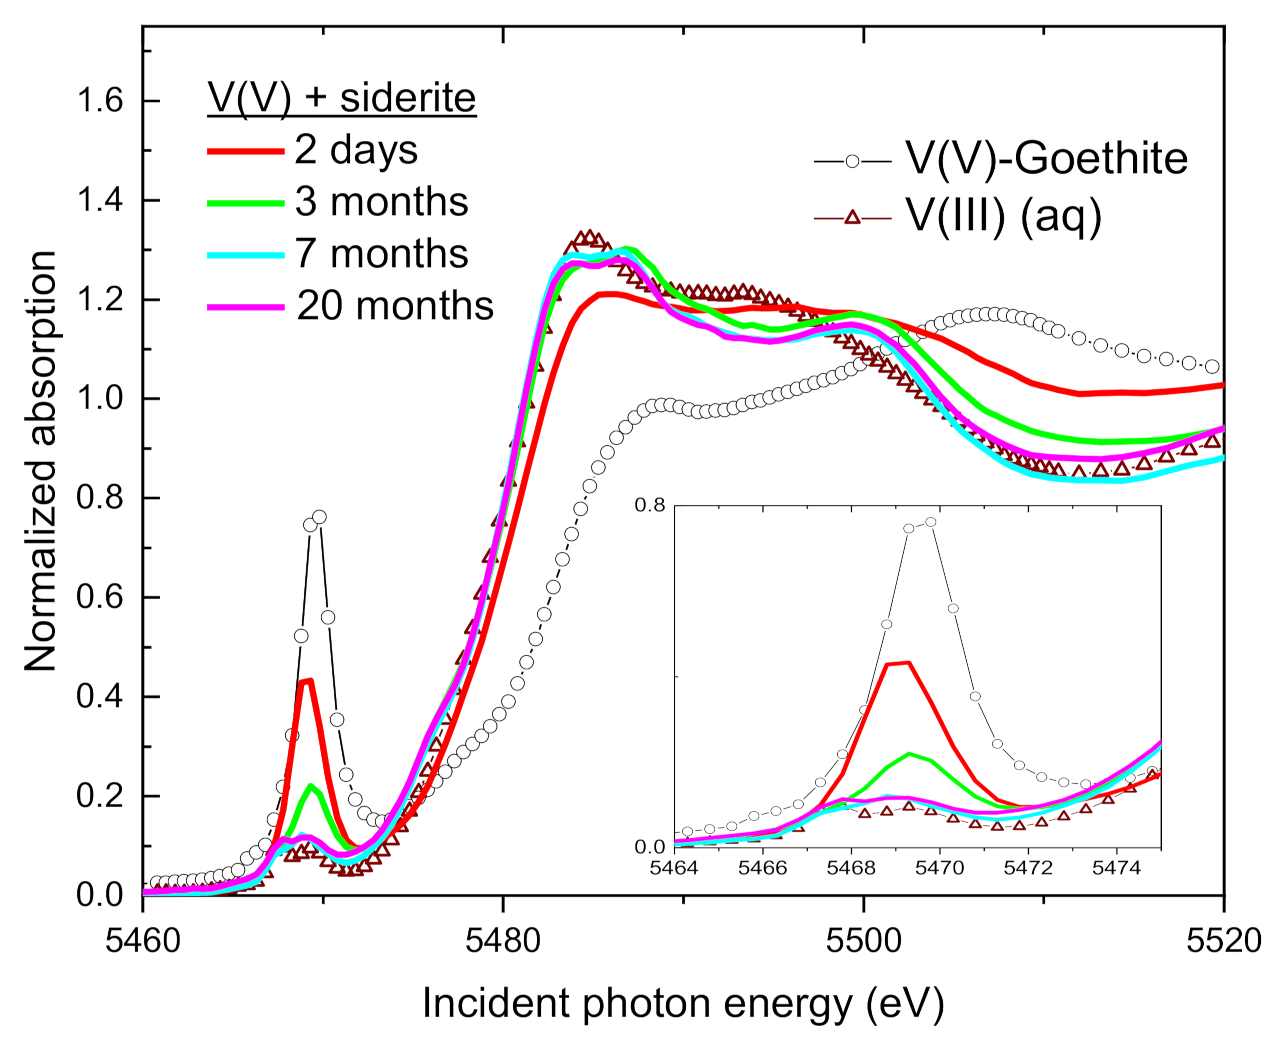
3.3. Change of V Valence with Incubation Time

Figure 3, Figure 4, Figure 5, Figure 6, Figure 7, Figure 8 and Figure 9 show comparisons of the V K-edge XANES spectra of the solids from the experimental systems to the spectrum of a V(V) and a V(III) standard. All systems show a shift in the edge position to lower energy and a decrease in the pre-edge peak over time, indicating reduction of the added V(V) to a lower valence state. This result confirms the ability of the examined Fe(II)-bearing minerals to serve as reductants for V(V) under our experimental conditions. The spectra from the FeS, siderite, green rust, and BioGR systems all show the decrease and disappearance of the pre-edge peak with time, indicating eventual reduction to V(III) (Figure 3, Figure 4, Figure 7 and Figure 8, respectively). In contrast, the spectra from the vivianite and magnetite systems show about one half of the pre-edge amplitude remaining even after 20 months incubation, and 15–20% of the pre-edge peak amplitude remains at 20 months in the BioSMM system (Figure 5, Figure 6 and Figure 9, respectively), suggesting that reduction to V(III) was suppressed in these systems.
The observed spectral changes were quantified in terms of V valence change by linear combination fit (LCF) analysis. To avoid the slight dependence of the XANES spectra on V coordination environment within each valence group (Figure 2), the region of the white line was excluded from the LCF. The chosen fit range between 5465 and 5483 eV captures the pre-edge peak intensity and the edge position, i.e., the features that have been used for V valence analysis in prior work due to their strongest and most consistent dependence on the valence state [4,70,73,75]. The combinatorial LCF option of the program ATHENA was employed [66], whereby all combinations of up to 3 of the standards in Figure 2 were tested against the data. It was found that combinations of the V(V) adsorbed on goethite, the aqueous V(IV), and the aqueous V(III) standards reproduced the data well in most cases, so for consistency between the different datasets the final fits were performed with these standards. The refined spectral weights are summarized in Table 1. Based on the proportions of V(III), V(IV), and V(V) components in each experimental spectrum, the average V valence was calculated using the formula V_valence = 3x3 + 4x4 + 5x5, where x3 + x4 + x5 = 1 are the weights of the corresponding valence components in the LCF of the XANES data (0 ≤ xi ≤ 1). The resulting average valence over time in each Fe(II)-containing system is plotted in Figure 10. Note that the precise distribution between V(V), V(IV), and V(III) species in systems having an average V valence 3 < x < 5 could not be constrained with the XANES data alone, as using just V(V) and V(III) components we obtained fits of similar quality and determined average valence states within the uncertainty. When interpreting these results it should be kept in mind that an average valence of 4.0, for example, could indicate the predominance of V(IV) species, but it could also be the result of a 50/50 proportion between V(V) and V(III) species in the sample, or, e.g., a 25/50/25 proportion of V(V)/V(IV)/V(III) species. Therefore, the XANES results were interpreted only in terms of average V valence.
The most rapid reduction was observed in the mackinawite system, where all V in the solids was reduced to V(III) by day 2 (Figure 10). These results are consistent with the rapid reduction of V(V) by mackinawite reported by Vessey and Lindsay [60]; however, they reported an average V valence state of only 3.65 within 2 days. The reason for the greater extent of reduction to V(III) in our study compared to that of Vessey and Lindsay is unclear. Both experimental systems were buffered at pH 7.0 with MOPS and both systems contained essentially equivalent amounts of FeS (50 mM in our study and 46 mM in Vessey and Lindsay). The major distinction between the two studies is the difference in initial V(V) concentration; 100 µM in Vessey and Lindsay and 1000 µM in our study. Electrons for the reduction of V(V) by FeS could have come from either the sulfide [85] or the ferrous iron (or both). In either case, there was a stoichiometric excess of reducing equivalents in both experimental systems (the FeS:V(V) (mol:mol) was 50:1 in our study and 460:1 in Vessey and Lindsay), so the lower extent of reduction in the study by Vessey and Lindsey was not due to a lack of reducing capacity. In aqueous systems V(V) can exist as monomeric and polymeric oxo-vanadate species depending on V(V) concentration, so differences in the extent of reduction to V(III) in our study and Vessey and Lindsey may have been due to differences in V(V) speciation [86].
A slower but also complete reduction of V(V) to V(III) was observed in the green rust system within 4 months (Figure 10). Green rust has been shown to reduce an array of toxic metals, metallolids, and radionuclides [87,88,89,90,91,92,93,94,95]; however, this is the first report of the reduction of V(V) by green rust. Vanadium(V) was also reduced to V(III) in the BioGR system, but at a much slower rate than with synthetic green rust; complete reduction to V(III) was not observed until 20 months reaction time. The difference in kinetics between the green rust and BioGR systems was not likely due to differences in the Fe(II) contents of the systems, for while the BioGR systems had only 35 mM Fe(II) (compared to 50 mM in the green rust system), there was still 17 times the number of reducing equivalents needed to reduce 1 mM V(V) to V(III). Green rusts are layered Fe(II)-Fe(III) hydroxides having a pyroaurite-type structure, i.e., alternating positively charged Fe(II)-Fe(III) hydroxide layers and hydrated anion layers having the general composition: [Fe(II)4 Fe(III)2 (OH)12]2+ [(A)2/n yH2O]2−, where A is an n-valent anion (e.g., Cl, SO42−, or CO32−) and y denotes varying amounts of interlayer water (y = 2–4). The synthetic green rust phase used in this study had sulfate as the interlayer anion, while the BioGR had carbonate. Differences in interlayer anion composition have been shown to affect the rate of reduction of nitrate, chromate (Cr(VI)), and U(VI) by green rust [96,97,98], so it is possible that the differences in V(V) reduction rates by green rust and BioGR are due to the different interlayer anions in each. Furthermore, synthetic green rust and BioGR have different surface properties, attributed largely to sorption of extracellular polymeric substances (EPSs) on BioGR that passivate their surface, thereby inhibiting their redox reactivity [99,100]. However, Remy et al. [100] and Yan et al. [101] found no substantial difference in reactivity between BioGR and synthetic green rust with respect to the reduction of Hg(II) and U(VI), respectively, so it is unclear if the presence of EPS on BioGR contributed to the slower kinetics of V(V) reduction in the BioGR system.
Vanadium(V) was reduced to V(III) in the siderite system (Figure 10). Reduction of V(V) by siderite has been reported by Vessey and Lindsay [60], where after 48 h of reaction, the average valence state of V was 4.14, which is similar to the average valence of 4.0 observed at 48 h in our siderite system. However, in our experiment the average V valence was 3.3 after 3 months with complete reduction to V(III) within 7 months. Although the reduction of V(V) by siderite was only monitored for 48 h in the study by Vessey and Lindsay, it is reasonable to expect that there would have been further reduction over time as their experimental system, like ours, has a large excess of reducing equivalents (the FeCO3:V(V) (mol:mol) was 50:1 in our study and 350:1 in Vessey and Lindsay).
In contrast with mackinawite, green rust, BioGR, and siderite, V(V) was only partially reduced in the magnetite system. Within 48 h, the average valence state of V in our magnetite system was 4.7 and comparable to the average valence of 4.83 reported by Vessey and Lindsay after 48 h of reaction between V(V) and magnetite [60], suggesting similar reactivity for magnetite in both experimental systems. However, in both studies, the average valence states were measured for V associated with the solids (i.e., since the average valence was calculated from XANES analysis of the solids, the valence of V in solution was not included in the determination). Based on a 48 h uptake of 0.21 µmol (uptake of 0.42 µM from 500 mL) in the study by Vessey and Lindsey and a 48 h uptake of 39.4 µmol (uptake of 985 µM from 40 mL) in our experimental system, 11.82 µmol of V(V) was reduced in our experiment compared with only 0.04 µmol in the study by Vessey and Lindsay (based on average valence states of 1.7 and 4.85, respectively and assuming reduction of V(V) to V(IV)). Since both experimental systems contain similar molar Fe3O4:V(V) ratios (60:1 and 50:1 in Vessey and Lindsay and this study, respectively), the differences in the reactivity of magnetite with respect to V(V) reduction in our work and that of Vessey and Lindsay may have been due to differences in surface area or in the Fe(II):Fe(III) ratio [102,103,104] of the magnetite used in each study. Since we do not know the surface area or Fe(II):Fe(III) ratio of the magnetite used in our study or the Fe(II):Fe(III) ratio of the magnetite used by Vessey and Lindsay, it is difficult to speculate; however it is reasonable to expect that the Fe(II):Fe(III) ratio in our magnetite was higher given that it was prepared and maintained under anoxic conditions compared to the magnetite used by Vessey and Lindsay, which was a commercial product that was exposed to ambient atmosphere and may thus have been partially oxidized, which is consistent with the greater apparent reactivity of the magnetite in our study. The reduction of V(V) by magnetite was only monitored for 48 h in the study by Vessey and Lindsay, but we observed continued reduction of V(V) over time, with the average valence of V decreasing to 4.3 after 3 months, 4.1 after 4 months, and 3.7 at 7 months, after which it appeared to be stable. Given the stoichiometric excess of Fe(II) in the system (Fe(II):V(V) 50:1 (mol:mol)), the incomplete reduction to V(III) was not due to insufficient reducing equivalents. In addition to synthetic magnetite, natural magnetite, and ilmenite (Fe(II)Ti(IV)O3) have been shown to reduce V(V) to V(IV) [59].
There was an initial rapid reduction of V(V) in the vivianite system, with an average valence state of solids-associated V of 4.1 within 48 h (Figure 10); however, the uptake of V from solution by vivianite was relatively slow, with 54% remaining in solution (Figure 1). Over the 20 month experimental run, V uptake slowly increased to >99% and the average V valence state decreased slowly to 3.7 by 8 months where it remained at 20 months; despite little change in the average V valence state, there was a progressive increase in the fraction of V(III) (Table 1). As in the other experimental systems, there was a large stoichiometric excess of electron equivalents, so the incomplete reduction to V(III) in the vivianite system was not likely due to limitations in available Fe(II). Compared to Fe(II)-bearing minerals like mackinawite, magnetite, green rust, and siderite, few studies have examined the ability of vivianite to act as a reductant for environmentally-relevant redox active elements; however, vivianite has been shown to reduce U(VI) to U(IV), Cr(VI) to Cr(III) and Hg(II) to Hg(0) [105,106,107] and our study is the first report of V(V) reduction by vivianite.
The BioSMM system contained biogenic siderite, mackinawite, and magnetite (52, 26, and 22 mol% Fe, respectively, as determined by Fe XAFS analysis). However, unlike the mackinawite and siderite systems, V(V) was not completely reduced to V(III). Within 2 days, 36.5% of the V in the system was associated with the solids and had an average valence state of 4.4. After 3 months V uptake by the solids increased to 65.8% and the average V valence decreased to 3.7, and within 7 months >99.5% of the V was associated with the solids and the average valence decreased further to 3.4, which remained unchanged at 20 months. In the systems with synthetic mackinawite (50 mM) and synthetic siderite (50 mM), V(V) was fully reduced to V(III) within 2 days and 7 months, respectively. Although the BioSMM system contained only 20.8 mM siderite and 10.4 mM mackinawite (based on the molar proportion of each and a total Fe(II) content of 40 mM), there was a stoichiometric excess of each phase required to reduce 1 mM V(V) to V(III) (i.e., 2 mM Fe(II)), thus full reduction to V(III) was not prevented due to a lack of reducing equivalents. The diminished reactivity of BioSMM compared to synthetic mackinawite and siderite is consistent with the results of other studies showing lower redox reactivity of biogenic phases compared to their synthetic counterparts [99,100,105,108], and may be due to the presence of other components that diminish their reactivity, e.g., microbial EPS [99].

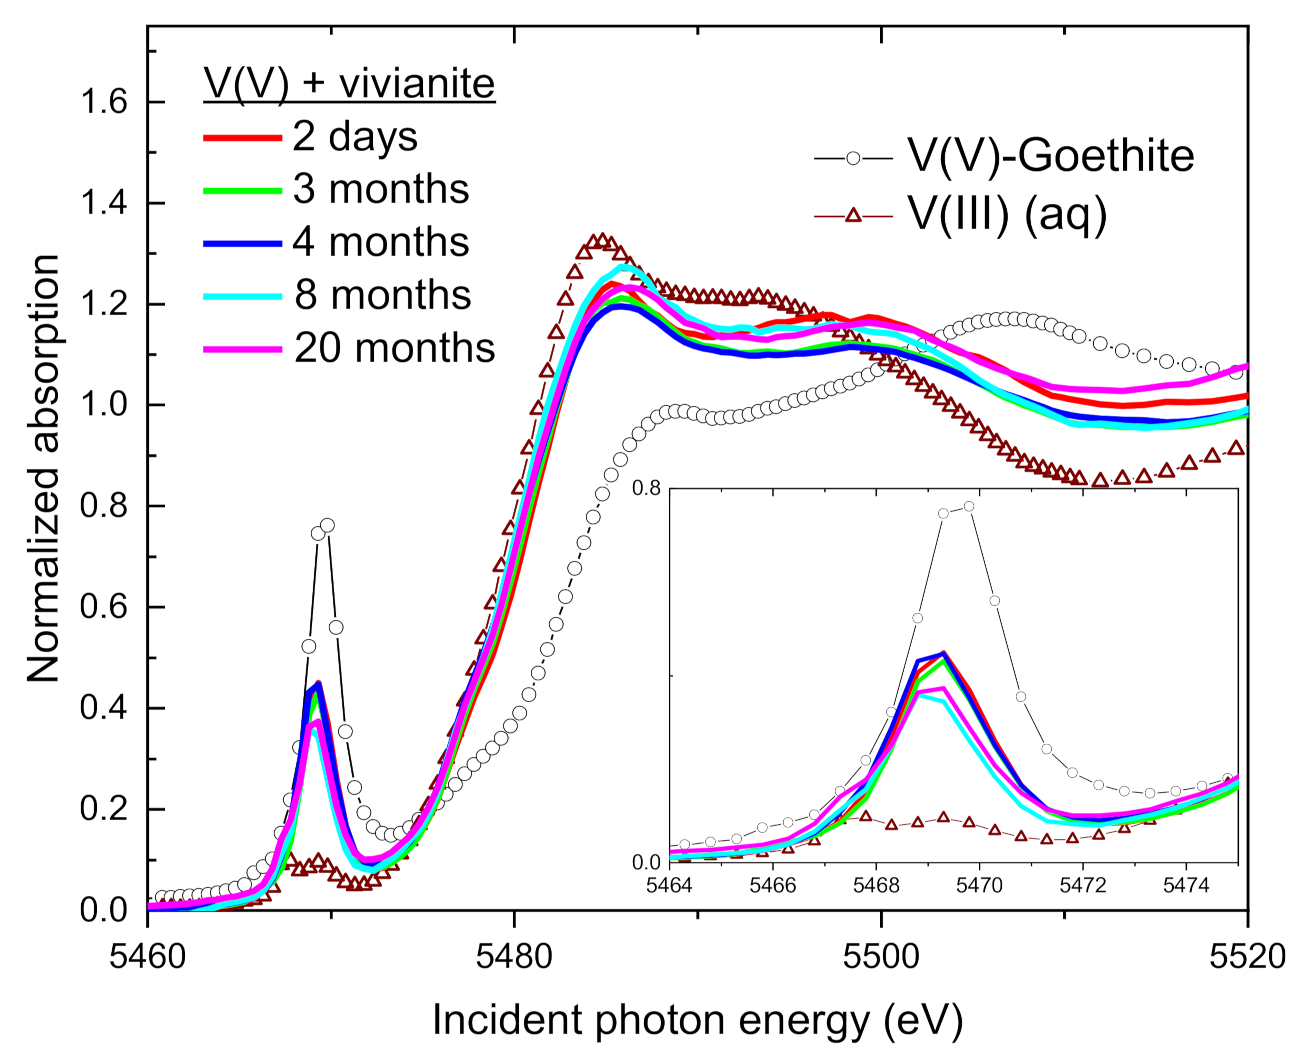
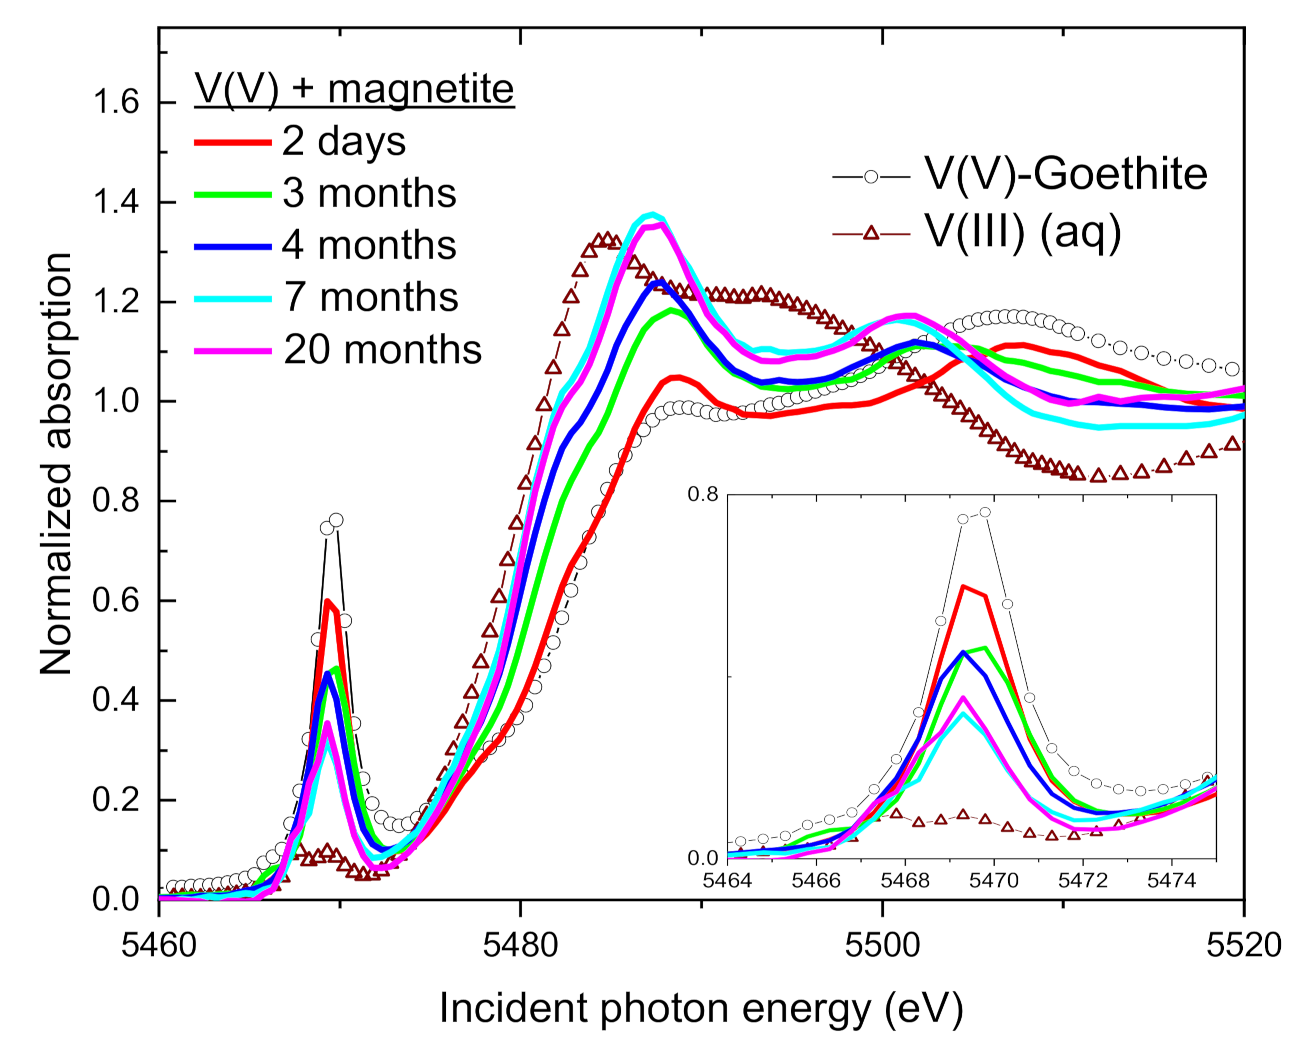
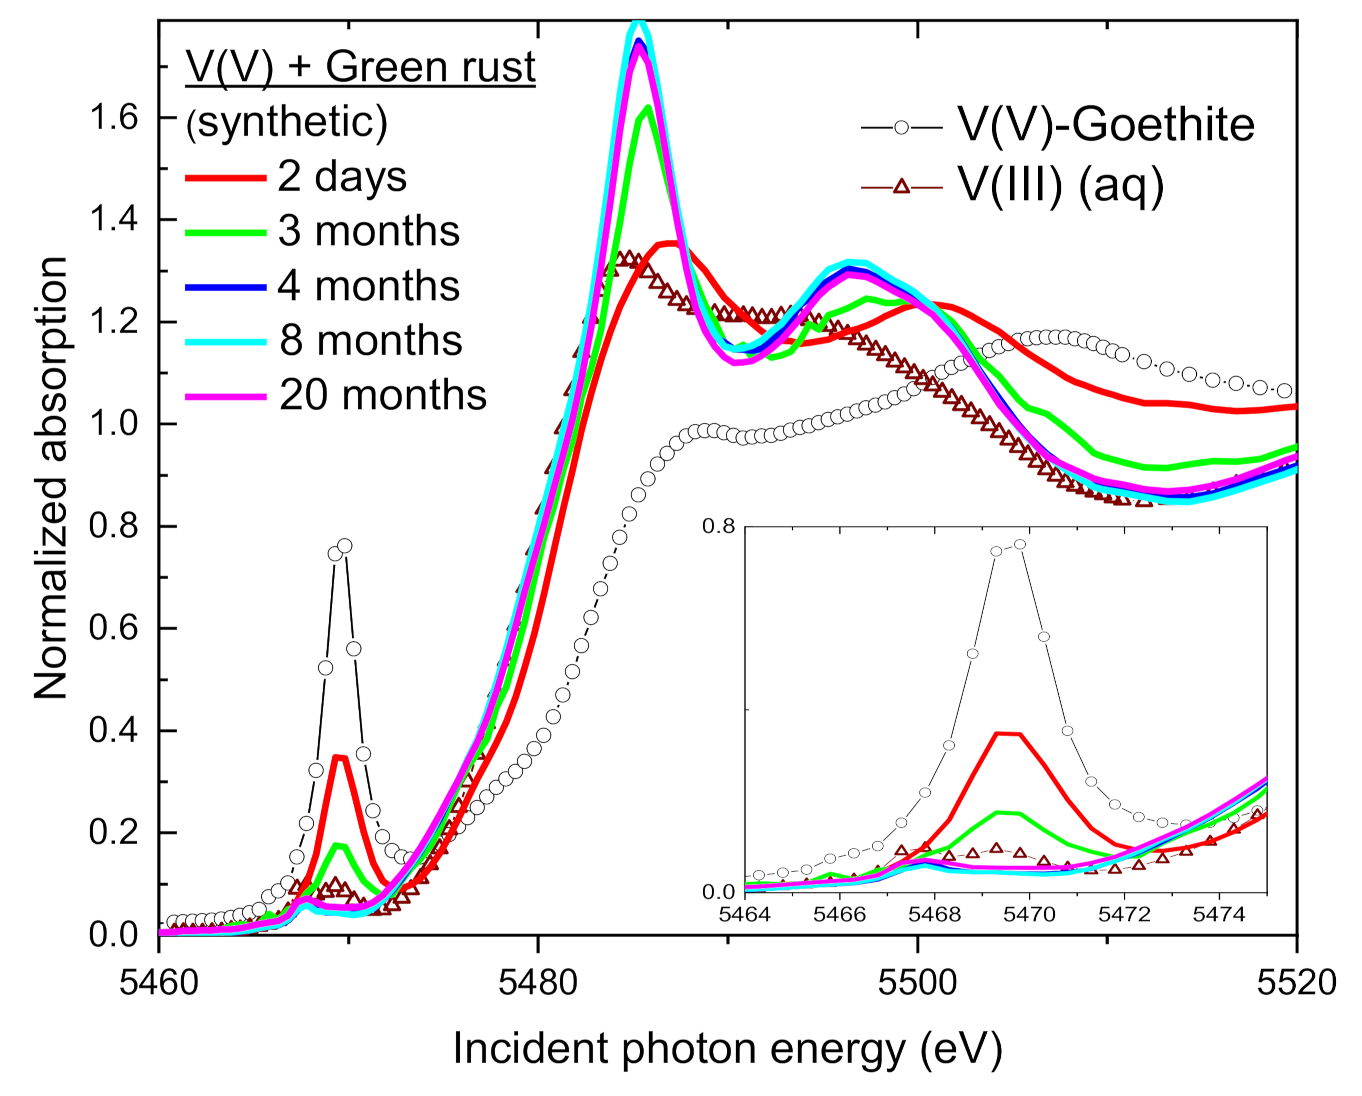
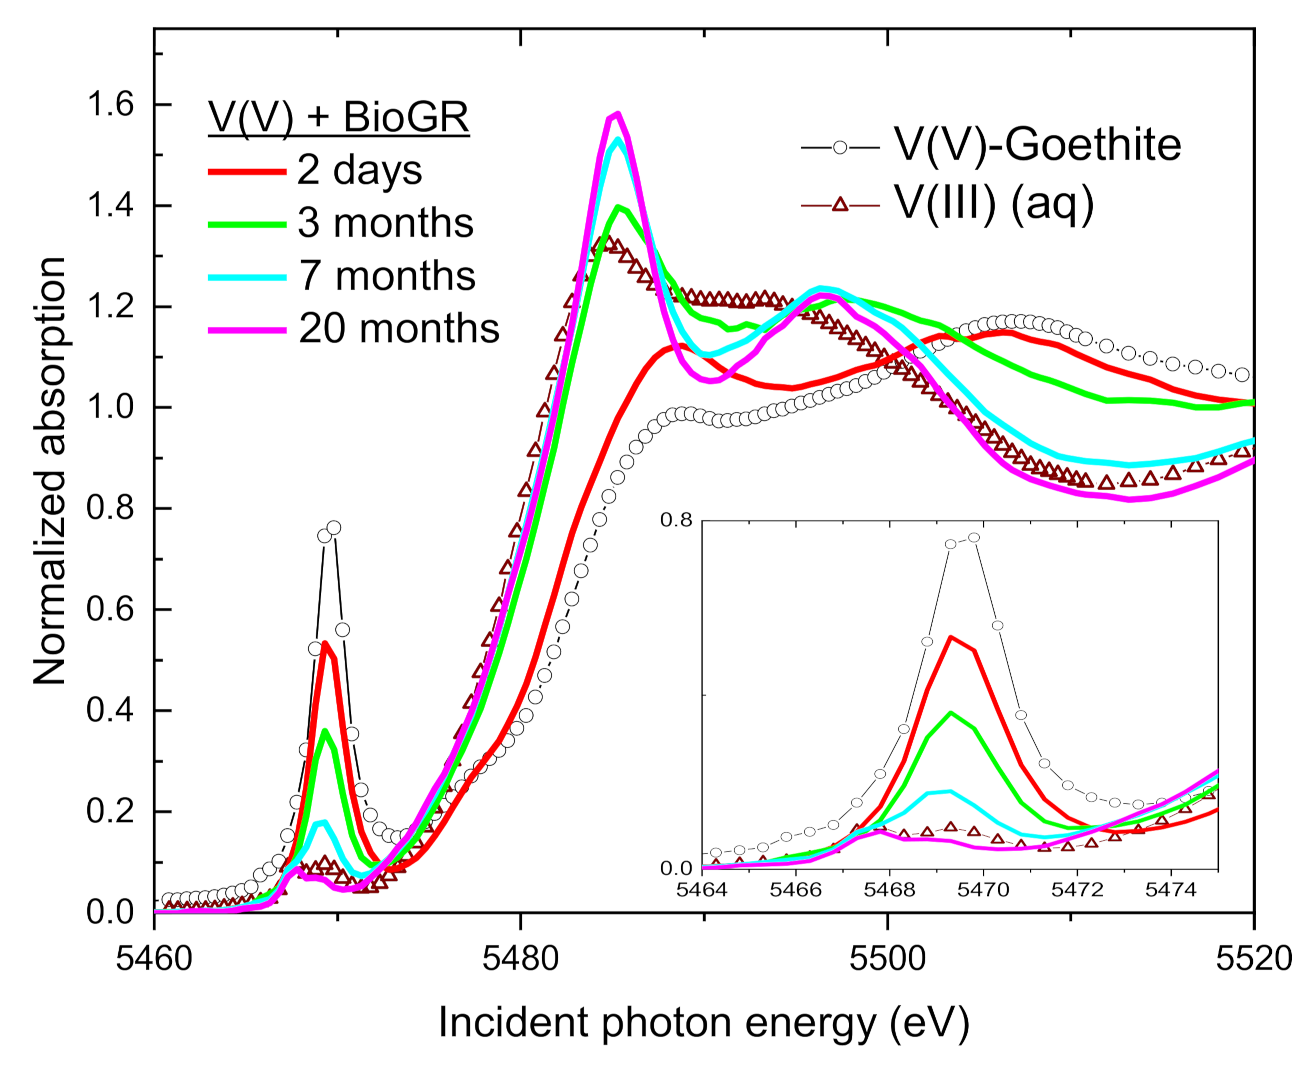
3.4. Speciation of the Reduced V (XANES)

In general, the XANES part of the absorption spectrum provides limited specificity in determining the speciation of an element, unless the data match a relatively unique reference. Figure 2 shows that the XANES spectra of the V standards are fairly similar within each valence, and in particular, the V(III) standards differ only moderately in the white line and post edge region depending on the local atomic environment of the V(III) center. In addition, our XANES comparisons are limited to standards of V(III) in precipitates, which does not allow us to comment on the possibility of V(III) surface sorption to the Fe oxide phases in our systems. Within this context we provide below a tentative assignment of the reduced V species based on a qualitative interpretation of the obtained XANES spectra.
Figure 11A compares the V XANES spectra from the reactors with FeS, green rust, and BioGR after 20 months of reaction. The three spectra are identical, indicating that the predominant V(III) species in these systems are the same. Since there is no sulfide in the green rust reactors, this result suggests that the V(III) in both the green rust and the FeS systems was O-coordinated, i.e., that V(III) did not bind directly to the S atoms present in the FeS system. Our results are in contrast with those of Vessey and Lindsay who observed V-S coordination by the V EXAFS analysis, consistent with incorporation of V(IV) (and possibly V(III)) into mackinawite [60]. Besides being O-coordinated, the speciation of V(III) in these systems could not be refined any further, as we did not observe a match with the XANES standards available to us. The V-GR and V-FeS spectra exhibited a strong white line and post-edge features of relatively large amplitude, which were different from the measured standards (Figure 11A). For instance, our V(III)-carbonate and V(III)-sulfate standards were shifted and mismatched in the edge position and post-edge features, suggesting that the sulfate and carbonate available in the synthetic and BioGR system did not complex V(III). The closest resemblance we could find to our experimental data was a spectrum measured by Rives et al. [109], who studied hydrotalcite synthesized in the presence of V(III) (the digitized spectrum from that work is shown in Figure 11A). With additional characterization the authors concluded that V(III) was incorporated in the metal hydroxide layer (hydrotalcite is a layered double hydroxide mineral similar to green rust) [110], so it is possible that V(III) was sequestered through a similar mechanism in our green rust and FeS systems. A detailed investigation on the speciation of V(III) in these systems will be the subject of an upcoming report, following additional experiments and characterization.
The V(III) spectrum from the solids of the siderite reactor was significantly different from that of the green rust system (Figure 11A), despite the similarity in reduction kinetics (Figure 10). This suggests that the presence of carbonate affects the resulting V(III) species. The spectrum shows similarity to our V(III)-carbonate standard in the shape and position of the edge and peaks, implying that V(III) may be coordinated to carbonate. However, there were also significant differences between the spectra, such as the split peak and the smaller amplitude of the white line in the siderite reactor. The smaller amplitudes may be indicative of a phase that is similar to that in the V-carbonate standard but is more disordered.
Although the V reduction kinetics and extents were similar between the magnetite and vivianite reactors (Figure 10), the V XANES spectra from these systems show significant differences (Figure 11B). Since the spectra after 7 and 20 months reaction were the same in each system and because the systems were set up with excess reducing capacity, it can be assumed that both reactors have reached the steady state and that the average V valence of 3.7–3.8 (Table 1 and Figure 10) was not the result of incomplete transformation between V(V), V(IV), and V(III) species. Rather, it appeared that the intermediate valence was maintained by the formation of specific minerals, having either V(IV) as the dominant species or having a specific ratio of V(V), V(IV), and V(III) species. The edge and the white line region of the V in the magnetite system show a significant structure, whereas the spectrum of V in the vivianite reactor was relatively featureless. These spectral differences indicate distinct speciation of V in the two systems. Comparison to the available XANES standards and literature references did not produce a match, so the identity of these intermediate valence V phases remain unclear at this point.
The BioSMM system at 20 months had an average V valence of 3.4 (Table 1), which was intermediate between the green rust/FeS and the magnetite/vivianite systems (3.0 and 3.8, respectively, Figure 10). This average valence could be the result of V being distributed between the endmember Fe phases. We performed combinatorial LC fits of the spectrum of the BioSMM solids at 20 months with the V XANES spectra from the magnetite, green rust, FeS, and siderite systems at 20 months, together with the V(V)-goethite and the V(IV)(aq) standards. The best spectral reproduction was obtained by linear combinations with a predominant (60%) component of the reduced V(III) species in the green rust/FeS systems, a smaller (20–30%) component of the partially reduced V in the magnetite system, and a minor (10–15%) component of remaining V(V) (Figure 11B). The identity of the V species resulting from this analysis was consistent with the speciation of V in the BioSMM system being controlled by the mineralization products of Fe reduction. However, the distribution of V between the endmember species is not expected to scale with the distribution of Fe between the secondary mineralization products because the proportion of V associated with each Fe phase will depend in a complex way on the relative surface area of the minerals, potential organic matter coating, and other factors that were not controlled in this experiment.

3.5. Environmental Implications

In identifying V as a re-emerging environmental hazard, Watt et al. highlighted the importance of understanding V speciation in predicting the behavior and fate of V in environmental systems [13]. Given that V is a redox active element, a robust understanding of its behavior in aquatic and terrestrial environments requires knowledge of the biotic and abiotic processes that control its redox state and attendant changes in solubility/mobility and bioavailability [4]; however, the biogeochemistry of V in suboxic and anoxic environments is poorly understood [5]. Largely through microbial reduction of Fe(III), Fe(II) is typically one of the most abundant reductants present in aquatic and terrestrial environments under suboxic and anoxic conditions [111,112,113]. Magnetite, siderite, vivianite, green rust, and mackinawite are common secondary minerals formed during microbial Fe(III) reduction in soils and sediments and our results show that these Fe(II)-bearing minerals can reduce V(V) to V(IV/III), and in the case of mackinawite, siderite, and green rust, complete reduction to V(III). The reduction of V(V) in soils and sediments has been largely attributed to microbial activity, presumably involving direct enzymatic reduction of V(V) [1,4]; however the potential for reduction by Fe(II)-bearing minerals suggests that abiotic or coupled biotic-abiotic processes may also play a critical role in V redox chemistry and thus need to be considered in modeling the global biogeochemical cycling of V.

Author Contributions

Conceptualization E.J.O.; Formal analysis M.I.B.; Funding acquisition M.I.B., K.M.K. and E.J.O.; Investigation M.I.B., K.M.K. and E.J.O.; Project administration E.J.O.; Visualization M.I.B.; Writing—original draft M.I.B. and E.J.O.; and Writing—review and editing M.I.B., K.M.K. and E.J.O. All authors have read and agreed to the published version of the manuscript.

Funding

Research under the Wetlands Hydrobiogeochemistry Scientific Focus Area (SFA) at Argonne National Laboratory was supported by the Subsurface Biogeochemical Research Program, Office of Biological and Environmental Research (BER), Office of Science, U.S. Department of Energy (DOE), under contract DE-AC02-06CH11357. MRCAT/EnviroCAT operations are supported by DOE and the member institutions. Use of the Advanced Photon Source, an Office of Science User Facility operated for the U.S. Department of Energy (DOE) Office of Science by Argonne National Laboratory, was supported by the U.S. DOE under Contract No. DE-AC02-06CH11357. Argonne National Laboratory is a U.S. Department of Energy laboratory managed by UChicago Argonne, LLC.

Institutional Review Board Statement

Not applicable.

Informed Consent Statement

Not applicable.

Data Availability Statement

Not applicable.

Acknowledgments

We thank the MRCAT/EnviroCAT beamline staff for assistance during data collection at the synchrotron.

Conflicts of Interest

The authors declare no conflict of interest. The funders had no role in the design of the study; in the collection, analyses, or interpretation of data; in the writing of the manuscript, or in the decision to publish the results.

References

  1. Huang, J.H.; Huang, F.; Evans, L.; Glasauer, S. Vanadium: Global (bio)geochemistry. Chem. Geol. 2015, 417, 68–89. [Google Scholar] [CrossRef]
  2. Imtiaz, M.; Rizwan, M.S.; Xiong, S.; Li, H.; Ashraf, M.; Shahzad, S.M.; Shahzad, M.; Rizwan, M.; Tu, S. Vanadium, recent advancements and research prospects: A review. Environ. Int. 2015, 80, 79–88. [Google Scholar] [CrossRef] [PubMed]
  3. Schlesinger, W.H.; Klein, E.M.; Vengosh, A. Global biogeochemical cycle of vanadium. Proc. Natl. Acad. Sci. USA 2017, 114, E11092–E11100. [Google Scholar] [CrossRef] [PubMed] [Green Version]
  4. Gustafsson, J.P. Vanadium geochemistry in the biogeosphere –speciation, solid-solution interactions, and ecotoxicity. Appl. Geochem. 2019, 102, 1–25. [Google Scholar] [CrossRef]
  5. Shaheen, S.M.; Alessi, D.S.; Tack, F.M.G.; Ok, Y.S.; Kim, K.H.; Gustafsson, J.P.; Sparks, D.L.; Rinklebe, J. Redox chemistry of vanadium in soils and sediments: Interactions with colloidal materials, mobilization, speciation, and relevant environmental implications—A review. Adv. Colloid Interface Sci. 2019, 265, 1–13. [Google Scholar] [CrossRef]
  6. Kabata-Pendias, A. Trace Elements in Soils and Plants, 4th ed.; CRC Press: Boca Raton, FL, USA, 2010; p. 548. [Google Scholar]
  7. ATSDR. Toxicological Profile for V.; U.S. Department of Health and Human Services: Atlanta, GA, USA, 2012. Available online: https://www.atsdr.cdc.gov/toxprofiles/tp58.pdf (accessed on 12 February 2021).
  8. Moskalyk, R.R.; Alfantazi, A.M. Processing of vanadium: A review. Miner. Eng. 2003, 16, 793–805. [Google Scholar] [CrossRef]
  9. Kelley, K.D.; Scott, C.T.; Polyak, D.E.; Kimball, B.E. Vanadium. In Crititcal Mineral Resources of the United States—Economic and Environmental Geology and Prospects for Future Supply: U.S. Geological Survey Professional Paper 1802; Schulz, K.J., DeYoung, J.H., Jr., Seal, R.R., Bradley, D.C., Eds.; United States Geological Survey: Reston, VA, USA, 2017; pp. U1–U36. [Google Scholar] [CrossRef]
  10. Gardner, C.B.; Carey, A.E.; Lyons, W.B.; Goldsmith, S.T.; McAdams, B.C.; Trierweiler, A.M. Molybdenum, vanadium, and uranium weathering in small mountainous rivers and rivers draining high-standing islands. Geochim. Cosmochim. Acta 2017, 219, 22–43. [Google Scholar] [CrossRef]
  11. Shiller, A.M.; Mao, L. Dissolved vanadium in rivers: Effects of silicate weathering. Chem. Geol. 2000, 165, 13–22. [Google Scholar] [CrossRef]
  12. U.S.G.S. Vanadium Mineral Commodity Summary 2020. Available online: https://pubs.usgs.gov/periodicals/mcs2020/mcs2020-vanadium.pdf (accessed on 8 January 2021).
  13. Watt, J.A.J.; Burke, I.T.; Edwards, R.A.; Malcolm, H.M.; Mayes, W.M.; Olszewska, J.P.; Pan, G.; Graham, M.C.; Heal, K.V.; Rose, N.L.; et al. Vanadium: A re-emerging environmental hazard. Environ. Sci. Technol 2018, 52, 11973–11974. [Google Scholar] [CrossRef] [Green Version]
  14. Tracey, A.S.; Willsky, G.R.; Takeuchi, E.S. Vanadium: Chemistry, Biochemistry, Pharmacology and Practical Applications; CRC Press: Boca Raton, FL, USA, 2007; p. 250. [Google Scholar] [CrossRef]
  15. Puttaswamy, N.; Liber, K. Identifying the causes of oil sands coke leachate toxicity to aquatic invertebrates. Environ. Toxicol. Chem. 2011, 30, 2576–2585. [Google Scholar] [CrossRef]
  16. Larsson, M.A.; Baken, S.; Gustafsson, J.P.; Hadialhejazi, G.; Smolders, E. Vanadium bioavailability and toxicity to soil microorganisms and plants. Environ. Toxicol. Chem. 2013, 32, 2266–2273. [Google Scholar] [CrossRef] [PubMed] [Green Version]
  17. Schiffer, S.; Liber, K. Toxicity of aqueous vanadium to zooplankton and phytoplankton species of relevance to the athabasca oil sands region. Ecotoxicol. Environ. Saf. 2017, 137, 1–11. [Google Scholar] [CrossRef]
  18. Lyalkova, N.N.; Yurkova, N.A. Role of microorganisms in vanadium concentration and dispersion. Geomicrobiol. J. 1992, 10, 15–26. [Google Scholar] [CrossRef]
  19. Carpentier, W.; Sandra, K.; De Smet, I.; Brigé, A.; De Smet, L.; Van Beeumen, J. Microbial reduction and precipitation of vanadium by Shewanella oneidensis. Appl. Environ. Microbiol. 2003, 69, 3636–3639. [Google Scholar] [CrossRef] [PubMed] [Green Version]
  20. Bredberg, K.; Karlsson, H.T.; Holst, O. Reduction of vanadium(V) with Acidithiobacillus ferrooxidans and Acidithiobacillus thiooxidans. Bioresour. Technol. 2004, 92, 93–96. [Google Scholar] [CrossRef] [PubMed]
  21. Ortiz-Bernad, I.; Anderson, R.T.; Vrionis, H.A.; Lovley, D.R. Vanadium respiration by Geobacter metallireducens: Novel strategy for in situ removal of vanadium from groundwater. Appl. Environ. Microbiol. 2004, 70, 3091–3095. [Google Scholar] [CrossRef] [PubMed] [Green Version]
  22. Li, X.S.; Le, X.C. Speciation of vanadium in oilsand coke and bacterial culture by high performance liquid chromatography inductively coupled plasma mass spectrometry. Anal. Chim. Acta 2007, 602, 17–22. [Google Scholar] [CrossRef] [PubMed]
  23. Li, H.; Feng, Y.; Zou, X.; Luo, X. Study on microbial reduction of vanadium metallurgical waste water. Hydrometallurgy 2009, 99, 13–17. [Google Scholar] [CrossRef]
  24. van Marwijk, J.; Opperman, D.J.; Piater, L.A.; van Heerden, E. Reduction of vanadium(V) by Enterobacter cloacae EV-SA01 isolated from a South African deep gold mine. Biotechnol. Lett. 2009, 31, 845–849. [Google Scholar] [CrossRef]
  25. Ogg, C.D.; Patel, B.K. Caloramator mitchellensis sp. nov., a thermoanaerobe isolated from the geothermal waters of the Great Artesian Basin of Australia, and emended description of the genus Caloramator. Int. J. Syst. Evol. Microbiol. 2011, 61, 644–653. [Google Scholar] [CrossRef] [Green Version]
  26. Zhang, J.; Dong, H.; Zhao, L.; McCarrick, R.; Agrawal, A. Microbial reduction and precipitation of vanadium by mesophilic and thermophilic methanogens. Chem. Geol. 2014, 370, 29–39. [Google Scholar] [CrossRef]
  27. Wang, G.; Zhang, B.; Li, S.; Yang, M.; Yin, C. Simultaneous microbial reduction of vanadium (V) and chromium (VI) by Shewanella loihica PV-4. Bioresour. Technol. 2017, 227, 353–358. [Google Scholar] [CrossRef] [PubMed]
  28. Coker, V.S.; van der Laan, G.; Telling, N.D.; Lloyd, J.R.; Byrne, J.M.; Arenholz, E.; Pattrick, R.A.D. Bacterial production of vanadium ferrite spinel (Fe,V)3O4 nanoparticles. Mineral. Mag. 2020, 84, 554–562. [Google Scholar] [CrossRef]
  29. Sun, X.; Qiu, L.; Kolton, M.; Haggblom, M.; Xu, R.; Kong, T.; Gao, P.; Li, B.; Jiang, C.; Sun, W. V(V) reduction by Polaromonas spp. in vanadium mine tailings. Environ. Sci. Technol. 2020, 54, 14442–14454. [Google Scholar] [CrossRef]
  30. Yelton, A.P.; Williams, K.H.; Fournelle, J.; Wrighton, K.C.; Handley, K.M.; Banfield, J.F. Vanadate and acetate biostimulation of contaminated sediments decreases diversity, selects for specific taxa, and decreases aqueous V5+ concentration. Environ. Sci. Technol. 2013, 47, 6500–6509. [Google Scholar] [CrossRef] [PubMed]
  31. Xu, X.; Xia, S.; Zhou, L.; Zhang, Z.; Rittmann, B.E. Bioreduction of vanadium (V) in groundwater by autohydrogentrophic bacteria: Mechanisms and microorganisms. J. Environ. Sci. 2015, 30, 122–128. [Google Scholar] [CrossRef] [PubMed]
  32. Zhang, B.; Hao, L.; Tian, C.; Yuan, S.; Feng, C.; Ni, J.; Borthwick, A.G. Microbial reduction and precipitation of vanadium (V) in groundwater by immobilized mixed anaerobic culture. Bioresour. Technol. 2015, 192, 410–417. [Google Scholar] [CrossRef]
  33. Liu, H.; Zhang, B.; Yuan, H.; Cheng, Y.; Wang, S.; He, Z. Microbial reduction of vanadium (V) in groundwater: Interactions with coexisting common electron acceptors and analysis of microbial community. Environ. Pollut. 2017, 231, 1362–1369. [Google Scholar] [CrossRef] [PubMed]
  34. Qiu, R.; Zhang, B.; Li, J.; Lv, Q.; Wang, S.; Gu, Q. Enhanced vanadium (V) reduction and bioelectricity generation in microbial fuel cells with biocathode. J. Power Sources 2017, 359, 379–383. [Google Scholar] [CrossRef]
  35. Lai, C.Y.; Dong, Q.Y.; Chen, J.X.; Zhu, Q.S.; Yang, X.; Chen, W.D.; Zhao, H.P.; Zhu, L. Role of extracellular polymeric substances in a methane based membrane biofilm reactor reducing vanadate. Environ. Sci. Technol. 2018, 52, 10680–10688. [Google Scholar] [CrossRef]
  36. Wang, S.; Zhang, B.; Diao, M.; Shi, J.; Jiang, Y.; Cheng, Y.; Liu, H. Enhancement of synchronous bio-reductions of vanadium (V) and chromium (VI) by mixed anaerobic culture. Environ. Pollut. 2018, 242, 249–256. [Google Scholar] [CrossRef] [PubMed]
  37. Zhang, B.; Qiu, R.; Lu, L.; Chen, X.; He, C.; Lu, J.; Ren, Z.J. Autotrophic vanadium(V) bioreduction in groundwater by elemental sulfur and zerovalent iron. Environ. Sci. Technol. 2018, 52, 7434–7442. [Google Scholar] [CrossRef]
  38. Zhang, B.; Wang, S.; Diao, M.; Fu, J.; Xie, M.; Shi, J.; Liu, Z.; Jiang, Y.; Cao, X.; Borthwick, A.G.L. Microbial community responses to vanadium distributions in mining geological environments and bioremediation assessment. J. Geophys. Res. Biogeosci. 2019, 124, 601–615. [Google Scholar] [CrossRef] [Green Version]
  39. Zhang, B.; Jiang, Y.; Zuo, K.; He, C.; Dai, Y.; Ren, Z.J. Microbial vanadate and nitrate reductions coupled with anaerobic methane oxidation in groundwater. J. Hazard. Mater. 2020, 382, 121228. [Google Scholar] [CrossRef] [PubMed]
  40. He, C.; Zhang, B.; Lu, J.; Qiu, R. A newly discovered function of nitrate reductase in chemoautotrophic vanadate transformation by natural mackinawite in aquifer. Water Res. 2021, 189, 116664. [Google Scholar] [CrossRef]
  41. Lovley, D.R.; Stolz, J.F.; Nord, G.L., Jr.; Phillips, E.J.P. Anaerobic production of magnetite by a dissimilatory iron-reducing microorganism. Nature 1987, 330, 252–254. [Google Scholar] [CrossRef]
  42. Fredrickson, J.K.; Zachara, J.M.; Kennedy, D.W.; Dong, H.; Onstott, T.C.; Hinman, N.W.; Li, S.-M. Biogenic iron mineralization accompanying the dissimilatory reduction of hydrous ferric oxide by a groundwater bacterium. Geochim. Cosmochim. Acta 1998, 62, 3239–3257. [Google Scholar] [CrossRef] [Green Version]
  43. Ona-Nguema, G.; Abdelmoula, M.; Jorand, F.; Benali, O.; Géhin, A.; Block, J.-C.; Génin, J.-M.R. Iron(II,III) hydroxycarbonate green rust formation and stabilization from lepidocrocite bioreduction. Environ. Sci. Technol. 2002, 36, 16–20. [Google Scholar] [CrossRef]
  44. Glasauer, S.; Weidler, P.G.; Langley, S.; Beveridge, T.J. Controls on Fe reduction and mineral formation by a subsurface bacterium. Geochim. Cosmochim. Acta 2003, 67, 1277–1288. [Google Scholar] [CrossRef]
  45. Roh, Y.; Zhang, C.-L.; Vali, H.; Lauf, R.J.; Zhou, J.; Phelps, T.J. Biogeochemical and environmental factors in Fe biomineralization: Magnetite and siderite formation. Clays Clay Miner. 2003, 51, 83–95. [Google Scholar] [CrossRef]
  46. Kukkadapu, R.K.; Zachara, J.M.; Fredrickson, J.K.; Kennedy, D.W.; Dohnalkova, A.C.; Mccready, D.E. Ferrous hydroxy carbonate is a stable transformation product of biogenic magnetite. Am. Mineral. 2005, 90, 510–515. [Google Scholar] [CrossRef] [Green Version]
  47. Behrends, T.; Van Cappellen, P. Transformation of hematite into magnetite during dissimilatory iron reduction-conditions and mechanisms. Geomicrobiol. J. 2007, 24, 403–416. [Google Scholar] [CrossRef]
  48. Boyanov, M.I.; O’Loughlin, E.J.; Kemner, K.M. Iron phase transformations resulting from the respiration of Shewanella putrefaciens on a mixed mineral phase. J. Phys. Conf. Ser. 2009, 190, 1–4. [Google Scholar] [CrossRef]
  49. O’Loughlin, E.J.; Gorski, C.A.; Flynn, T.M.; Scherer, M.M. Electron donor utilization and secondary mineral formation during the bioreduction of lepidocrocite by Shewanella putrefaciens CN32. Minerals 2019, 9, 434. [Google Scholar] [CrossRef] [Green Version]
  50. Dong, Y.; Sanford, R.A.; Boyanov, M.I.; Flynn, T.M.; O’Loughlin, E.J.; Kemner, K.M.; George, S.; Fouke, K.E.; Li, S.; Huang, D.; et al. Controls on iron reduction and biomineralization over broad environmental conditions as suggested by the Firmicutes Orenia metallireducens strain Z6. Environ. Sci. Technol. 2020, 54, 10128–10140. [Google Scholar] [CrossRef]
  51. O’Loughlin, E.J.; Boyanov, M.I.; Gorski, C.A.; Scherer, M.M.; Kemner, K.M. Effects of Fe(III) oxide mineralogy and phosphate on Fe(II) secondary mineral formation during microbial iron reduction. Minerals 2021, 11, 149. [Google Scholar] [CrossRef]
  52. Neal, A.L.; Techkarnjanaruk, S.; Dohnalkova, A.; Mccready, D.E.; Peyton, B.M.; Geesey, G.G. Iron sulfides and sulfur species produced at hematite surfaces in the presence of sulfate-reducing bacteria. Geochim. Cosmochim. Acta 2001, 65, 223–235. [Google Scholar] [CrossRef]
  53. Vaughan, D.J.; Lennie, A.R. The iron sulfide minerals: Their chemistry and role in nature. Sci. Prog. 1991, 75, 371–388. [Google Scholar]
  54. Herbert, R.B., Jr.; Benner, S.G.; Pratt, A.R.; Blowes, D.W. Surface chemistry and morphology of poorly crystalline iron sulfides precipitated in media containing sulfate-reducing bacteria. Chem. Geol. 1998, 144, 87–97. [Google Scholar] [CrossRef]
  55. Benning, L.G.; Wilkin, R.T.; Konhauser, K.O. Iron monosulfide stability: Experiments with sulfate reducing bacteria. In Geochemistry of the Earth’s Surface; Ármannsson, H., Ed.; Brookfield A. A. Balkema: Rotterdam, The Netherlands, 1999; pp. 429–432. [Google Scholar]
  56. Donald, R.; Southam, G. Low temperature anaerobic bacterial diagenesis of ferrous monosulfide to pyrite. Geochim. Cosmochim. Acta 1999, 63, 2019–2023. [Google Scholar] [CrossRef]
  57. Flynn, T.M.; O’Loughlin, E.J.; Mishra, B.; DiChristina, T.J.; Kemner, K.M. Sulfur-mediated electron shuttling during bacterial iron reduction. Science 2014, 344, 1039–1042. [Google Scholar] [CrossRef] [PubMed]
  58. Kwon, M.J.; Boyanov, M.I.; Antonopoulos, D.A.; Brulc, J.M.; Johnston, E.R.; Skinner, K.A.; Kemner, K.M.; O’Loughlin, E.J. Effects of dissimilatory sulfate reduction on FeIII (hydr)oxide reduction and microbial community development. Geochim. Cosmochim. Acta 2014, 129, 4570–4576. [Google Scholar] [CrossRef]
  59. White, A.F.; Peterson, M.L. Reduction of aqueous transition metal species on the surfaces of Fe(II)-containing oxides. Geochim. Cosmochim. Acta 1996, 60, 3799–3814. [Google Scholar] [CrossRef]
  60. Vessey, C.J.; Lindsay, M.B.J. Aqueous vanadate removal by iron(II)-bearing phases under anoxic conditions. Environ. Sci. Technol. 2020, 54, 4006–4015. [Google Scholar] [CrossRef]
  61. Johnson, C.R.; Antonopoulos, D.A.; Boyanov, M.I.; Flynn, T.M.; Koval, J.C.; Kemner, K.M.; O’Loughlin, E.J. Reduction of Sb(V) by coupled biotic-abiotic processes under sulfidogenic conditions. Heliyon 2021, 7. [Google Scholar] [CrossRef]
  62. O’Loughlin, E.J.; Boyanov, M.I.; Flynn, T.M.; Gorski, C.; Hofmann, S.M.; McCormick, M.L.; Scherer, M.M.; Kemner, K.M. Effects of bound phosphate on the bioreduction of lepidocrocite (γ-FeOOH) and maghemite (γ-Fe2O3) and formation of secondary minerals. Environ. Sci. Technol. 2013, 47, 9157–9166. [Google Scholar] [CrossRef]
  63. Segre, C.U.; Leyarovska, N.E.; Chapman, L.D.; Lavender, W.M.; Plag, P.W.; King, A.S.; Kropf, A.J.; Bunker, B.A.; Kemner, K.M.; Dutta, P.; et al. The MRCAT insertion device beamline at the Advanced Photon Source. In Synchrotron Radiation Instrumentation: Eleventh U.S. National Conference. Stanford, CA, USA, 13–15 October 1999; Pianetta, P.A., Arthur, J.R., Brennan, S., Eds.; American Institute of Physics: New York, NY, USA, 2000; Volume CP5321, pp. 419–422. [Google Scholar]
  64. O’Loughlin, E.J.; Kelly, S.D.; Csencsits, R.; Cook, R.E.; Kemner, K.M. Reduction of uranium(VI) by mixed iron(II)/iron(III) hydroxide (green rust): Formation of UO2 nanoparticles. Environ. Sci. Technol. 2003, 37, 721–727. [Google Scholar] [CrossRef]
  65. Newville, M.; Livinš, P.; Yacoby, Y.; Rehr, J.J.; Stern, E.A. Near-edge x-ray absorption fine structure of Pb: A comparison of theory and experiment. Phys. Rev. B 1993, 47, 14126–14131. [Google Scholar] [CrossRef]
  66. Ravel, B.; Newville, M. ATHENA, ARTEMIS, HEPHAESTUS: Data analysis for X-ray absorption. J. Synchrotron Radiat. 2005, 12, 537–541. [Google Scholar] [CrossRef] [Green Version]
  67. Zatko, D.A.; Kratochvil, B. Vanadium(III) sulfate as a reducing agent for determination of perchlorate. Anal. Chem. 1965, 37, 1560–1562. [Google Scholar] [CrossRef]
  68. Poizot, P.; Baudrin, E.; Laruelle, S.; Dupont, L.; Touboul, M.; Tarascon, J.M. Low temperature synthesis and electrochemical performance of crystallized FeVO4·1.1H2O. Solid State Ion. 2000, 138, 31–40. [Google Scholar] [CrossRef]
  69. Peacock, C.L.; Sherman, D.M. Vanadium(V) adsorption onto goethite (α-FeOOH) at pH 1.5 to 12: A surface complexation model based on ab initio molecular geometries and EXAFS spectroscopy. Geochim. Cosmochim. Acta 2004, 68, 1723–1733. [Google Scholar] [CrossRef]
  70. Chaurand, P.; Rose, J.; Briois, V.; Salome, M.; Proux, O.; Nassif, V.; Olivi, L.; Susini, J.; Hazemann, J.L.; Bottero, J.Y. New methodological approach for the vanadium K-edge X-ray absorption near-edge structure interpretation: Application to the speciation of vanadium in oxide phases from steel slag. J. Phys. Chem. B 2007, 111, 5101–5110. [Google Scholar] [CrossRef]
  71. Duchesne, M.A.; Nakano, J.; Hu, Y.; MacLennan, A.; Bennett, J.; Nakano, A.; Hughes, R.W. Synchrotron-based X-ray absorption spectroscopy study of vanadium redox speciation during petroleum coke combustion and gasification. Fuel 2018, 227, 279–288. [Google Scholar] [CrossRef]
  72. Haskel, D.; Islam, Z.; Lang, J.; Kmety, C.; Srajer, G.; Pokhodnya, K.I.; Epstein, A.J.; Miller, J.S. Local structural order in the disordered vanadium tetracyanoethylene room-temperature molecule-based magnet. Phys. Rev. B 2004, 70. [Google Scholar] [CrossRef] [Green Version]
  73. Levina, A.; McLeod, A.I.; Lay, P.A. Vanadium speciation by XANES spectroscopy: A three-dimensional approach. Chemistry 2014, 20, 12056–12060. [Google Scholar] [CrossRef]
  74. Wong, J.; Lytle, F.W.; Messmer, R.P.; Maylotte, D.H. K-edge absorption spectra of selected vanadium compounds. Phys. Rev. B 1984, 30, 5596–5610. [Google Scholar] [CrossRef]
  75. Bennett, W.W.; Lombi, E.; Burton, E.D.; Johnston, S.G.; Kappen, P.; Howard, D.L.; Canfield, D.E. Synchrotron X-ray spectroscopy for investigating vanadium speciation in marine sediment: Limitations and opportunities. J. Anal. At. Spectrom. 2018, 33, 1689–1699. [Google Scholar] [CrossRef]
  76. Frank, P.; Carlson, R.M.K.; Carlson, E.J.; Hodgson, K.O. The vanadium environment in blood cells of Ascidia ceratodes is divergent at all organismal levels: An XAS and EPR spectroscopic study. J. Inorg. Biochem. 2003, 94, 59–71. [Google Scholar] [CrossRef]
  77. Larsson, M.A.; D’Amato, M.; Cubadda, F.; Raggi, A.; Öborn, I.; Kleja, D.B.; Gustafsson, J.P. Long-term fate and transformations of vanadium in a pine forest soil with added converter lime. Geoderma 2015, 259–260, 271–278. [Google Scholar] [CrossRef] [Green Version]
  78. Wisawapipat, W.; Kretzschmar, R. Solid phase speciation and solubility of vanadium in highly weathered soils. Environ. Sci. Technol. 2017, 51, 8254–8262. [Google Scholar] [CrossRef] [PubMed]
  79. Nedrich, S.M.; Chappaz, A.; Hudson, M.L.; Brown, S.S.; Burton, G.A., Jr. Biogeochemical controls on the speciation and aquatic toxicity of vanadium and other metals in sediments from a river reservoir. Sci. Total Environ. 2018, 612, 313–320. [Google Scholar] [CrossRef]
  80. Gerke, T.L.; Scheckel, K.G.; Schock, M.R. Identification and distribution of vanadinite (Pb5(V5+O4)3Cl) in lead pipe corrosion by-products. Environ. Sci. Technol. 2009, 43, 4412–4418. [Google Scholar] [CrossRef] [PubMed]
  81. Nesbitt, J.A.; Lindsay, M.B.J. Vanadium geochemistry of oil sands fluid petroleum coke. Environ. Sci. Technol. 2017, 51, 3102–3109. [Google Scholar] [CrossRef]
  82. Larsson, M.A.; Persson, I.; Sjöstedt, C.; Gustafsson, J.P. Vanadate complexation to ferrihydrite: X-ray absorption spectroscopy and CD-MUSIC modelling. Environ. Chem. 2017, 14. [Google Scholar] [CrossRef]
  83. Schindler, M.; Hawthorne, F.C. Schubnelite, [Fe3+(V5+O4)(H2O)], a novel heteropolyhedral framework mineral. Am. Mineral. 1999, 84, 665–668. [Google Scholar] [CrossRef]
  84. Hawthorne, F.C.; Schindler, M.; Grice, J.D.; Haynes, P. Orthominasragrite, V4+O (SO4) (H2O)5, a new mineral species from Temple Mountain, Emery County, Utah, U.S.A. Can. Mineral. 2001, 39, 1325–1331. [Google Scholar] [CrossRef]
  85. Wanty, R.B.; Goldhaber, M.B. Thermodynamics and kinetics of reactions involving vanadium in natural systems: Accumulation of vanadium in sedimentary rocks. Geochim. Cosmochim. Acta 1992, 56, 1471–1483. [Google Scholar] [CrossRef]
  86. Chen, G.; Liu, H. Understanding the reduction kinetics of aqueous vanadium(V) and transformation products using rotating ring-disk electrodes. Environ. Sci. Technol. 2017, 51, 11643–11651. [Google Scholar] [CrossRef]
  87. Lee, W.; Batchelor, B. Reductive capacity of natural reductants. Environ. Sci. Technol. 2003, 37, 535–541. [Google Scholar] [CrossRef]
  88. Christiansen, B.C.; Geckeis, H.; Marquardt, C.M.; Bauer, A.; Römer, J.; Wiss, T.; Schild, D.; Stipp, S.L.S. Neptunyl (NpO2+) interaction with green rust, GRNa,SO4. Geochim. Cosmochim. Acta 2011, 75, 1216–1226. [Google Scholar] [CrossRef]
  89. Heasman, D.M.; Sherman, D.M.; Ragnarsdottir, K.V. The reduction of aqueous Au3+ by sulfide minerals and green rust phases. Am. Mineral. 2003, 88, 725–738. [Google Scholar] [CrossRef]
  90. Myneni, S.C.B.; Tokunaga, T.K.; Brown, G.E., Jr. Abiotic selenium redox transformations in the presence of Fe(II,III) oxides. Science 1997, 278, 1106–1109. [Google Scholar] [CrossRef] [Green Version]
  91. O’Loughlin, E.J.; Kelly, S.D.; Kemner, K.M.; Csencsits, R.; Cook, R.E. Reduction of AgI, AuIII, CuII, and HgII by FeII/FeIII hydroxysulfate green rust. Chemosphere 2003, 53, 437–446. [Google Scholar] [CrossRef]
  92. Pepper, S.E.; Bunker, D.J.; Bryan, N.D.; Livens, F.R.; Charnock, J.M.; Pattrick, R.A.D.; Collison, D. Treatment of radioactive wastes: An X-ray adsorption spectroscopy study of the treatment of technetium with green rust. J. Colloid Interface Sci. 2003, 268, 408–412. [Google Scholar] [CrossRef]
  93. Refait, P.; Simon, L.; Génin, J.-M.R. Reduction of SeO42- anions and anoxic formation of iron(II)-iron(III) hydroxy-selenate green rust. Environ. Sci. Technol. 2000, 34, 819–825. [Google Scholar] [CrossRef]
  94. Williams, A.G.B.; Scherer, M.M. Kinetics of Cr(VI) reduction by carbonate green rust. Environ. Sci. Technol. 2001, 35, 3488–3494. [Google Scholar] [CrossRef] [PubMed]
  95. O’Loughlin, E.J.; Kelly, S.D.; Kemner, K.M. XAFS investigation of the interactions of UVI with secondary mineralization products from the bioreduction of FeIII oxides. Environ. Sci. Technol. 2010, 44, 1656–1661. [Google Scholar] [CrossRef]
  96. Hansen, H.C.B.; Guldberg, S.; Erbs, M.; Bender Koch, C. Kinetics of nitrate reduction by green rusts—Effects of interlayer anion and Fe(II):Fe(III) ratio. Appl. Clay Sci. 2001, 18, 81–91. [Google Scholar] [CrossRef]
  97. Bond, D.L.; Fendorf, S. Kinetics and structural constraints of chromate reduction by green rusts. Environ. Sci. Technol. 2003, 37, 2750–2757. [Google Scholar] [CrossRef] [PubMed]
  98. Latta, D.E.; Boyanov, M.I.; Kemner, K.M.; O’Loughlin, E.J.; Scherer, M.M. Reaction of uranium(VI) with green rusts: Effect of interlayer anion. Curr. Inorg. Chem. 2015, 5, 156–168. [Google Scholar] [CrossRef]
  99. Zegeye, A.; Etique, M.; Carteret, C.; Ruby, C.; Schaaf, P.; Francius, G. Origin of the differential nanoscale reactivity of biologically and chemically formed green rust crystals investigated by chemical force spectroscopy. J. Phys. Chem. C 2014, 118, 5978–5987. [Google Scholar] [CrossRef]
  100. Remy, P.P.; Etique, M.; Hazotte, A.A.; Sergent, A.S.; Estrade, N.; Cloquet, C.; Hanna, K.; Jorand, F.P. Pseudo-first-order reaction of chemically and biologically formed green rusts with Hg and CHNO: Effects of pH and stabilizing agents (phosphate, silicate, polyacrylic acid, and bacterial cells). Water Res. 2015, 70C, 266–278. [Google Scholar] [CrossRef]
  101. Yan, S.; Boyanov, M.I.; Mishra, B.; Kemner, K.M.; O’Loughlin, E.J. U(VI) reduction by biogenic and abiotic hydroxycarbonate green rusts: Impacts on U(IV) speciation and stability over time. Environ. Sci. Technol. 2018, 52, 4601–4609. [Google Scholar] [CrossRef] [PubMed]
  102. Gorski, C.A.; Nurmi, J.T.; Tratnyek, P.G.; Hofstetter, T.B.; Scherer, M.M. Redox behavior of magnetite: Implications for contaminant reduction. Environ. Sci. Technol. 2010, 44, 55–60. [Google Scholar] [CrossRef]
  103. Latta, D.E.; Gorski, C.A.; Boyanov, M.I.; O’Loughlin, E.J.; Kemner, K.M.; Scherer, M.M. Influence of magnetite stoichiometry on UVI reduction. Environ. Sci. Technol. 2012, 46, 778–786. [Google Scholar] [CrossRef]
  104. Pasakarnis, T.S.; Boyanov, M.I.; Kemner, K.M.; Mishra, B.; O’Loughlin, E.J.; Parkin, G.; Scherer, M.M. Influence of chloride and Fe(II) content on the reduction of Hg(II) by magnetite. Environ. Sci. Technol. 2013, 47, 6987–6994. [Google Scholar] [CrossRef]
  105. Veeramani, H.; Alessi, D.S.; Suvorova, E.I.; Lezama-Pacheco, J.S.; Stubbs, J.E.; Sharp, J.O.; Dippon, U.; Kappler, A.; Bargar, J.R.; Bernier-Latmani, R. Products of abiotic U(VI) reduction by biogenic magnetite and vivianite. Geochim. Cosmochim. Acta 2011, 75, 2512–2528. [Google Scholar] [CrossRef]
  106. Bae, S.; Sihn, Y.; Kyung, D.; Yoon, S.; Eom, T.; Kaplan, U.; Kim, H.; Schafer, T.; Han, S.; Lee, W. Molecular identification of Cr(VI) removal mechanism on vivianite surface. Environ. Sci. Technol. 2018, 52, 10647–10656. [Google Scholar] [CrossRef]
  107. Etique, M.; Bouchet, S.; Byrne, J.M.; ThomasArrigo, L.K.; Kaegi, R.; Kretzschmar, R. Mercury reduction by nanoparticulate vivianite. Environ. Sci. Technol. 2021. [Google Scholar] [CrossRef] [PubMed]
  108. McCormick, M.L.; Kim, H.S.; Bouwer, E.J.; Adriaens, P. Abiotic transformation of chlorinated solvents as a consequence of microbial iron reduction: An investigation of the role of biogenic magnetite in mediating reductive dechlorination. In Proceedings of Thirtieth Mid-Atlantic Industrial and Hazardous Waste Conference—Hazardous and Industrial Wastes; Suri, R.P.S., Christensen, G.L., Eds.; CRC Press: Boca Raton, FL, USA, 2014; pp. 339–348. [Google Scholar]
  109. Rives, V.; Labajos, F.M.; Ulibarri, M.A.; Malet, P. A new hydrotalcite-like compound containing V3+ ions in the layers. Inorg. Chem. 1993, 32, 5000–5001. [Google Scholar] [CrossRef]
  110. Labajos, F.M.; Rives, V.; Malet, P.; Centeno, M.A.; Ulibarri, M.A. Synthesis and characterization of hydrotalcite-like compounds containing V(3+) in the layers and of their calcination products. Inorg Chem. 1996, 35, 1154–1160. [Google Scholar] [CrossRef] [PubMed]
  111. Hering, J.G.; Stumm, W. Oxidative and reductive dissolution of minerals. In Mineral-Water Interface Geochemistry; Hochella, M.F.J., White, A.F., Eds.; American Mineralogical Society: Washington, DC, USA, 1990; Volume 23, pp. 427–465. [Google Scholar]
  112. Heron, G.; Christensen, T.H. Impact of sediment-bound iron on redox buffering in a landfill leachate polluted aquifer (Vejen, Denmark). Environ. Sci. Technol. 1995, 29, 187–192. [Google Scholar] [CrossRef]
  113. Rügge, K.; Hofstetter, T.B.; Haderlein, S.B.; Bjerg, P.L.; Knudsen, S.; Zraunig, C.; Mosbæk, H.; Christensen, T.H. Characterization of predominant reductants in an anaerobic leachate-contaminated aquifer by nitroaromatic probe compounds. Environ. Sci. Technol. 1998, 32, 23–31. [Google Scholar] [CrossRef]
Figure 1. Solution phase V concentrations in the experimental systems over time. The lines are a visual aid only.
Minerals 11 00316 g001
Figure 2. Comparisons of the V K-edge X-ray absorption near edge spectra (XANES) from the V standards. The spectra are grouped by V valence state and offset vertically. The vertical dashed lines indicate the approximate pre-edge, edge, and white line positions.
Minerals 11 00316 g002
Figure 3. The V K-edge XANES spectra of the solids in the mackinawite system over time compared to representative standards V(V) sorbed to goethite and aqueous V(III). Inset shows details in the pre-edge region.
Minerals 11 00316 g003
Figure 4. The V K-edge XANES spectra of the solids in the siderite system over time compared to representative standards V(V) sorbed to goethite and aqueous V(III). Inset shows details in the pre-edge region.
Minerals 11 00316 g004
Figure 5. The V K-edge XANES spectra of the solids in the vivianite system over time compared to representative standards V(V) sorbed to goethite and aqueous V(III). Inset shows details in the pre-edge region.
Minerals 11 00316 g005
Figure 6. The V K-edge XANES spectra of the solids in the magnetite system over time compared to representative standards V(V) sorbed to goethite and aqueous V(III). Inset shows details in the pre-edge region.
Minerals 11 00316 g006
Figure 7. The V K-edge XANES spectra of the solids in the green rust system over time compared to representative standards V(V) sorbed to goethite and aqueous V(III). Inset shows details in the pre-edge region.
Minerals 11 00316 g007
Figure 8. The V K-edge XANES spectra of the solids in the biogenic green rust (BioGR) system over time compared to representative standards V(V) sorbed to goethite and aqueous V(III). Inset shows details in the pre-edge region.
Minerals 11 00316 g008
Figure 9. The V K-edge XANES spectra of the solids in the biogenic siderite/mackinawite/magnetite (BioSMM) system over time compared to representative standards V(V) sorbed to goethite and aqueous V(III). Inset shows details in the pre-edge region.
Minerals 11 00316 g009
Figure 10. Average V valence over time in each of the Fe(II)-containing systems, calculated using the refined component weights in the LC fits of the XANES data (V_valence = 3x3 + 4x4 + 5x5, where x3 + x4 + x5 = 1 are the weights of the corresponding valence components). The uncertainty in average V valence determination is estimated at ±0.15 by propagating the ±7% uncertainty in xi reported in Table 1, and is illustrated above as a single error bar for all points. The lines are B-spline interpolations to the data points, intended as a guide to the eye.
Minerals 11 00316 g010
Figure 11. (A) Comparison of the spectra from the final V(III) species in the green rust and FeS reactors to the available V(III) standards. The vertical dashed lines indicate features discussed in the text. The data for the V(III)-hydrotalcite spectrum was digitized from Figure 2 of Rives et al. [108]. The V(III) species in the siderite system after 20 months are shown at the bottom. (B) The spectra of the intermediate V valence species in the vivianite and magnetite systems are compared to the V(IV) standards at the top. The bottom spectra present the linear combination analysis of the V species in the BioSMM system after 20 months. The scaled best fit components that combine to produce the fit line are also shown.
Minerals 11 00316 g011
Table 1. Refined spectral components (%) from the linear combination analysis of the XANES data a.
SampleTimeV(V)V(IV)V(III)Average
V Valence b
R-Factor c
FeS (mackinawite)2 days001003.00.008
8 months03973.00.013
20 months001003.00.014
Siderite2 days1472144.00.019
3 months029713.30.010
7 months001003.00.005
20 months201003.00.004
Vivianite2 days138084.10.014
3 months1270183.90.014
4 months1365223.90.028
8 months460363.70.019
20 months1836453.70.011
Magnetite2 days840164.70.005
3 months5326214.30.005
4 months3543224.10.013
7 months1734493.70.006
20 months2078223.80.012
Green Rust2 days1467194.00.004
3 months130873.30.005
4 months001003.00.011
8 months001003.00.014
20 months10993.00.010
Biogenic Green Rust2 days708224.50.005
(BioGR)3 months3647174.20.010
7 months515803.20.006
20 months001003.00.012
Biogenic2 days5232164.40.008
Sid/mack/mag3 months345613.70.004
(BioSMM)7 months210793.40.004
20 months220783.40.005
a The standards used in the LC fits are V(V)adsorbed on goethite, aqueous V(IV), and aqueous V(III). The refined spectral weight for each standard is shown as a percentage of the experimental spectrum. The uncertainty in spectral weight determination is ±7%, as reported by the fitting program ATHENA; b The average V valence is calculated as V_valence = 3x3 + 4x4 + 5x5, where x3 + x4 + x5 = 1 are the weights of the corresponding valence components; c The R-factor is a goodness of fit indicator quantifying the misfit between data and fit relative to the amplitude of the data. More information on this parameter can be found in the documentation of ATHENA [66].
Publisher’s Note: MDPI stays neutral with regard to jurisdictional claims in published maps and institutional affiliations.

