
Experimental Investigation of Porous and Mechanical Characteristics of Single-Crack Rock-like Material under Freeze-Thaw Weathering


Abstract
:1. Introduction
2. Materials and Methods
2.1. Specimen Preparation
2.1.1. Materials
2.1.2. Specimen Production
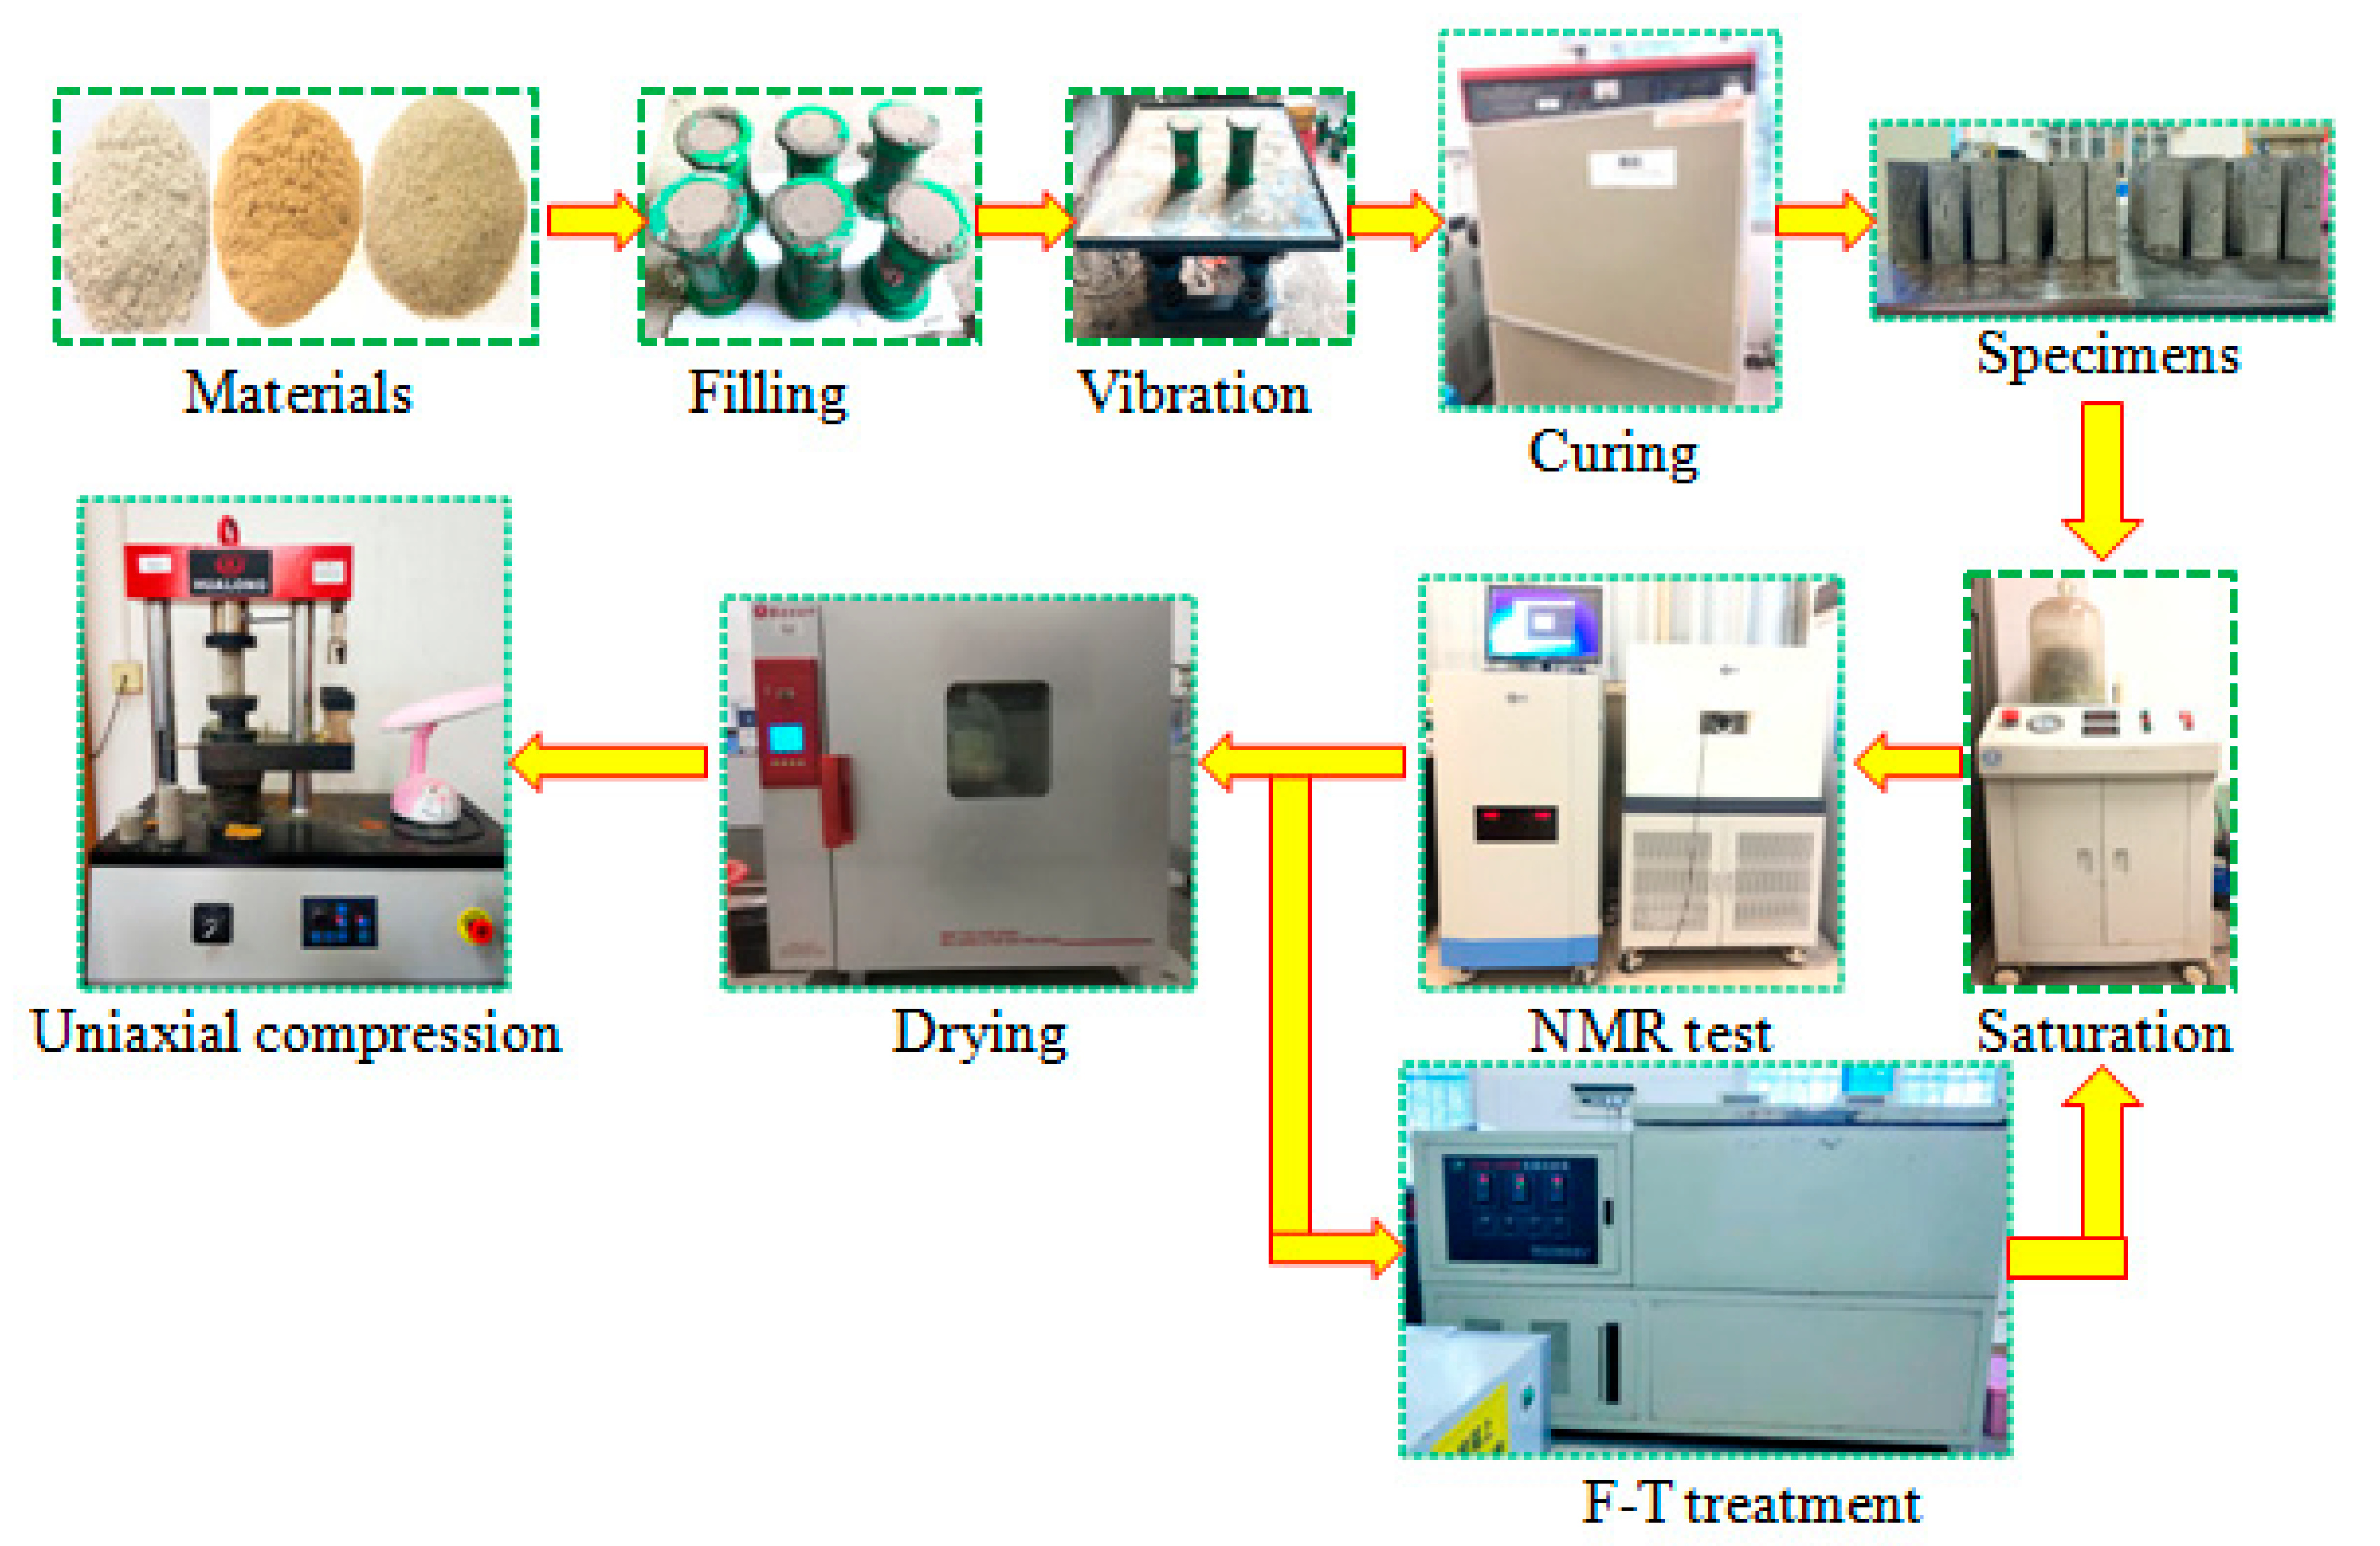
- Material weighting. Cement, water, sand, silicon powder, and naphthalene water reducer were weighted according to the above mass ratio.
- Material filling. Materials were mixed sufficiently, and then models were prepared. The steel bar was set in the middle of the plastic model for crack making. To prevent materials from sticking to the model and steel bar, the steel bar and inner wall of the model were coated with oil. After that, mixed materials were filled into fabricated plastic models.
- Vibrating. Models filled with materials were put on the vibrating device. Then, the specimens were vibrated until bubbles longer occurred.
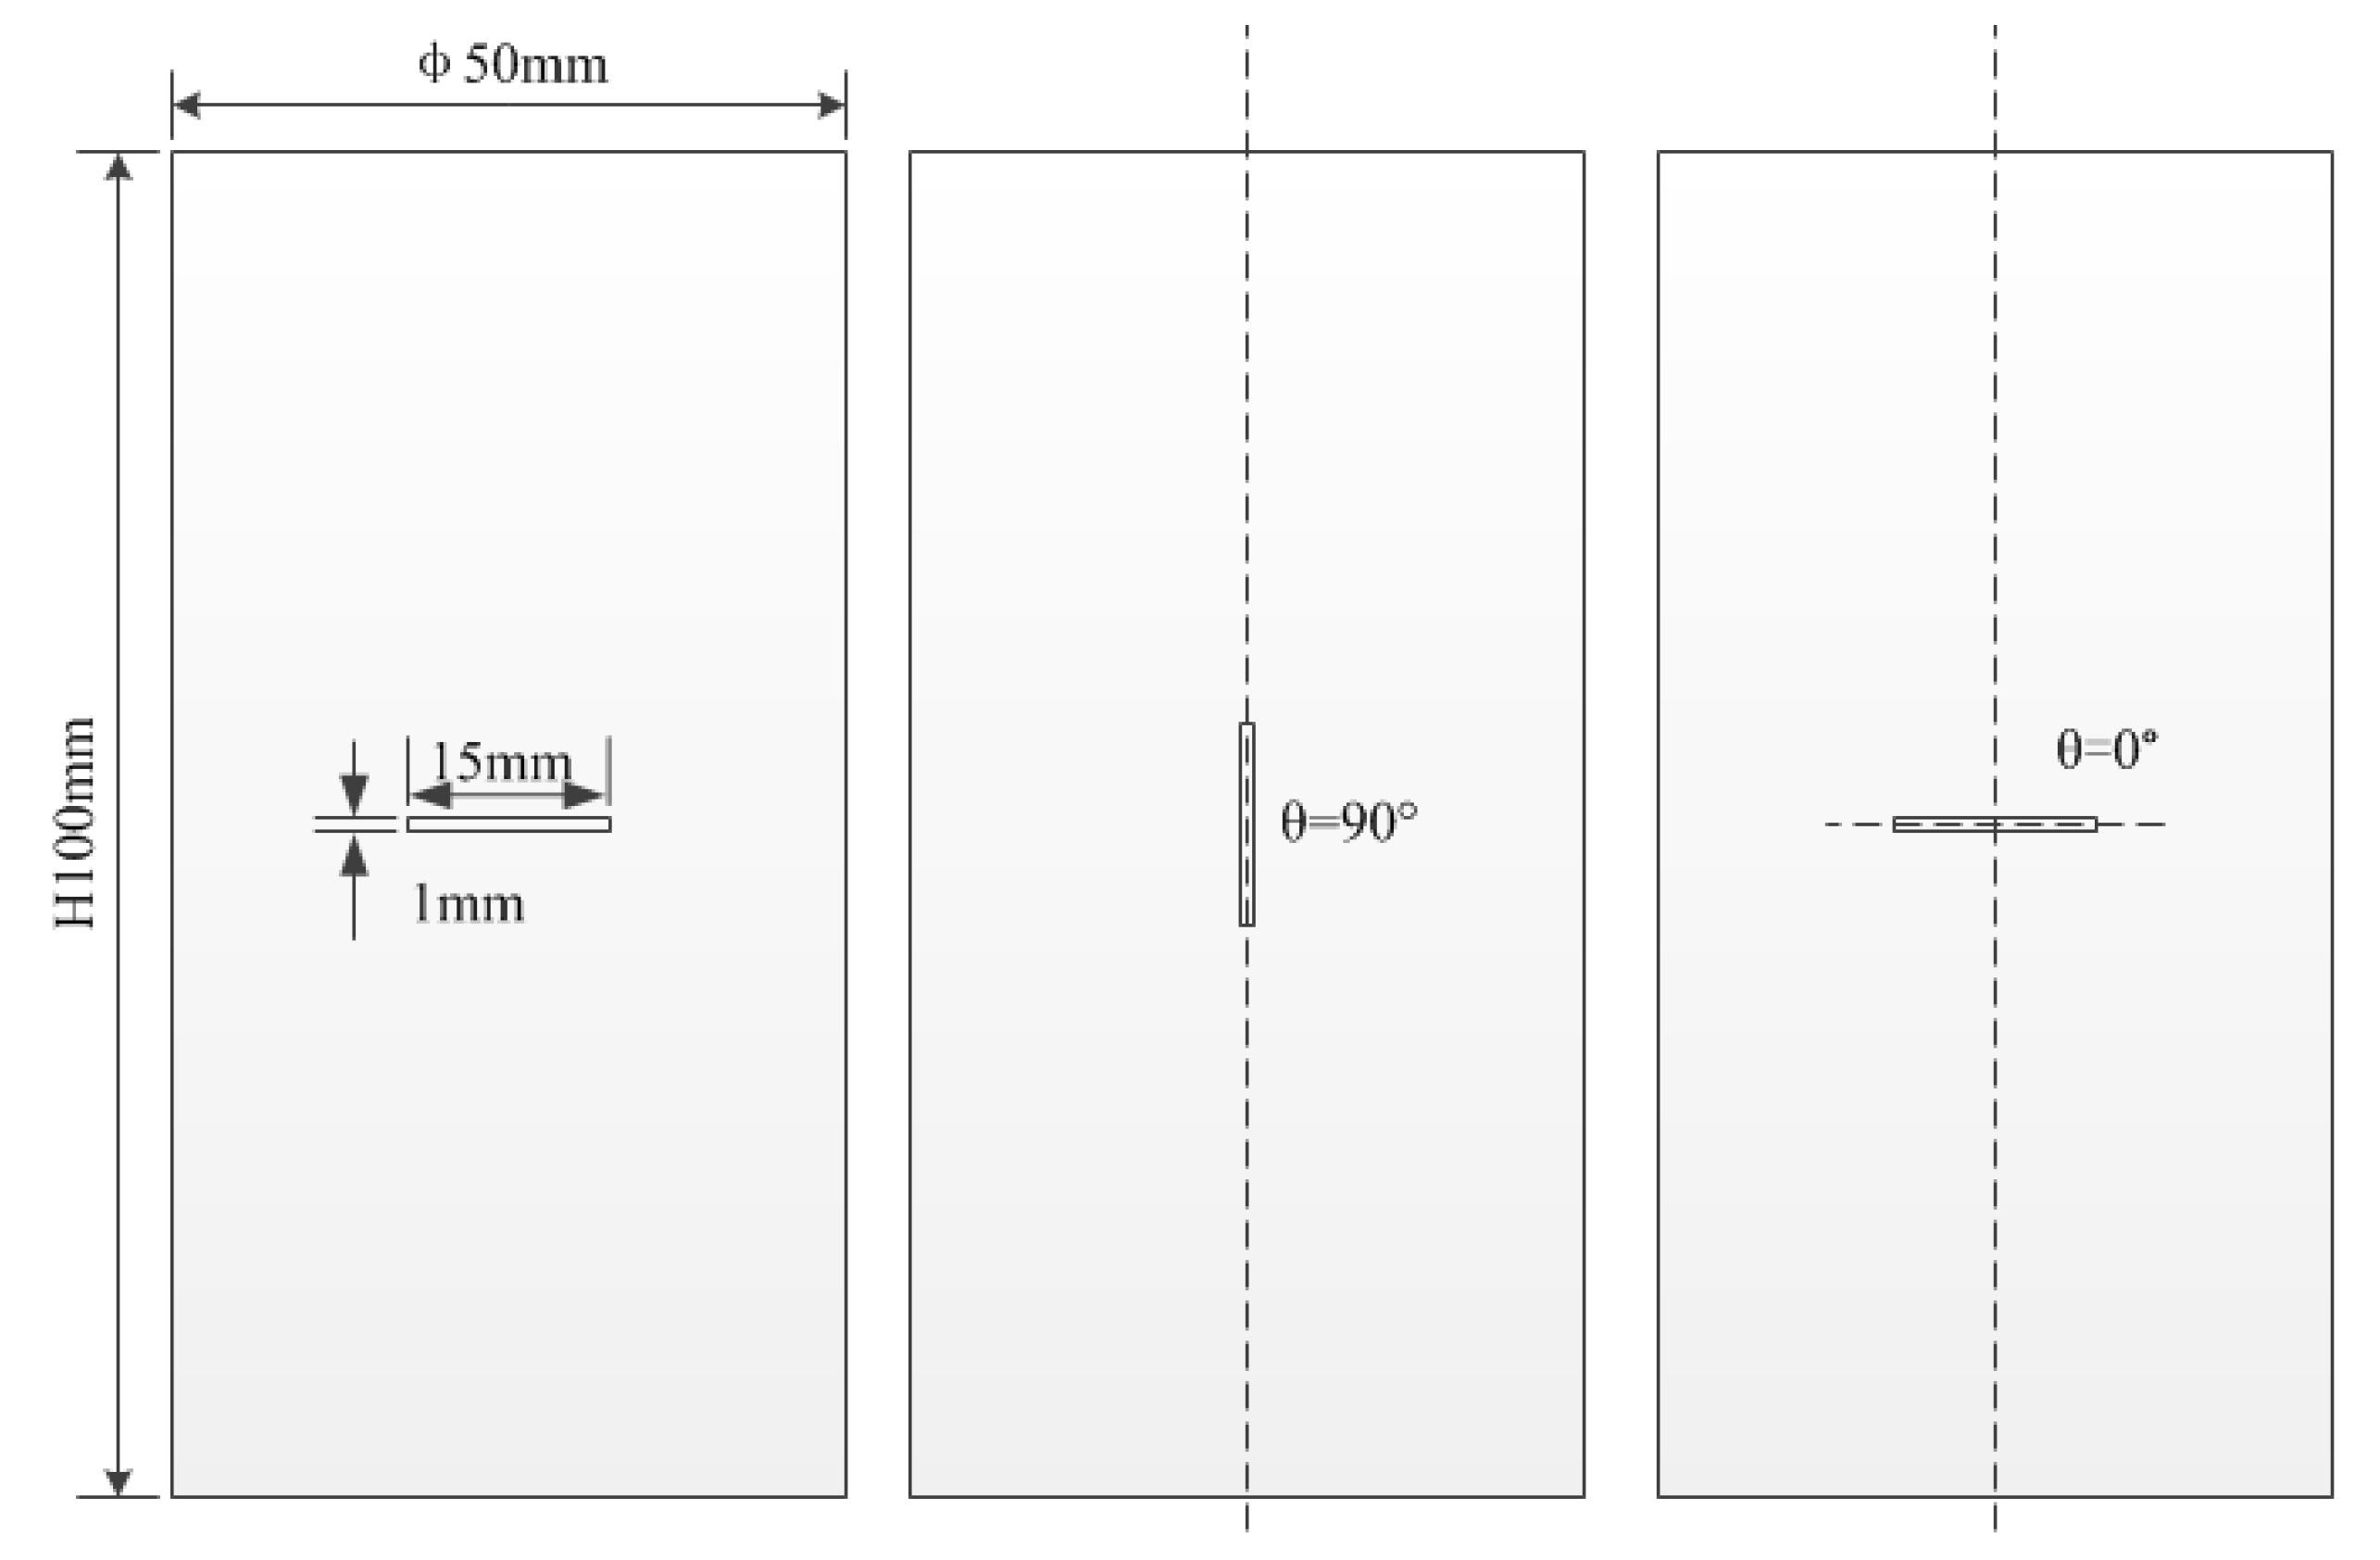
- Demolding and curing. After 24 h of specimen vibration, solid specimens were demolded. Then, specimens were numbered and placed into a standard curing box. The curing temperature, humidity, and curing time were set to 22 °C, 98%, and 28 days, respectively. Schematic diagrams of specimens are shown in Figure 1.
2.2. Pivotal Facilities
2.2.1. Freeze-Thaw Test Machine
2.2.2. NMR System
2.2.3. Uniaxial Compression Device
2.2.4. Other Facilities
2.3. Experiment Design
2.3.1. Freeze-Thaw Test
2.3.2. NMR Test
2.3.3. Uniaxial Compression Test
3. Results
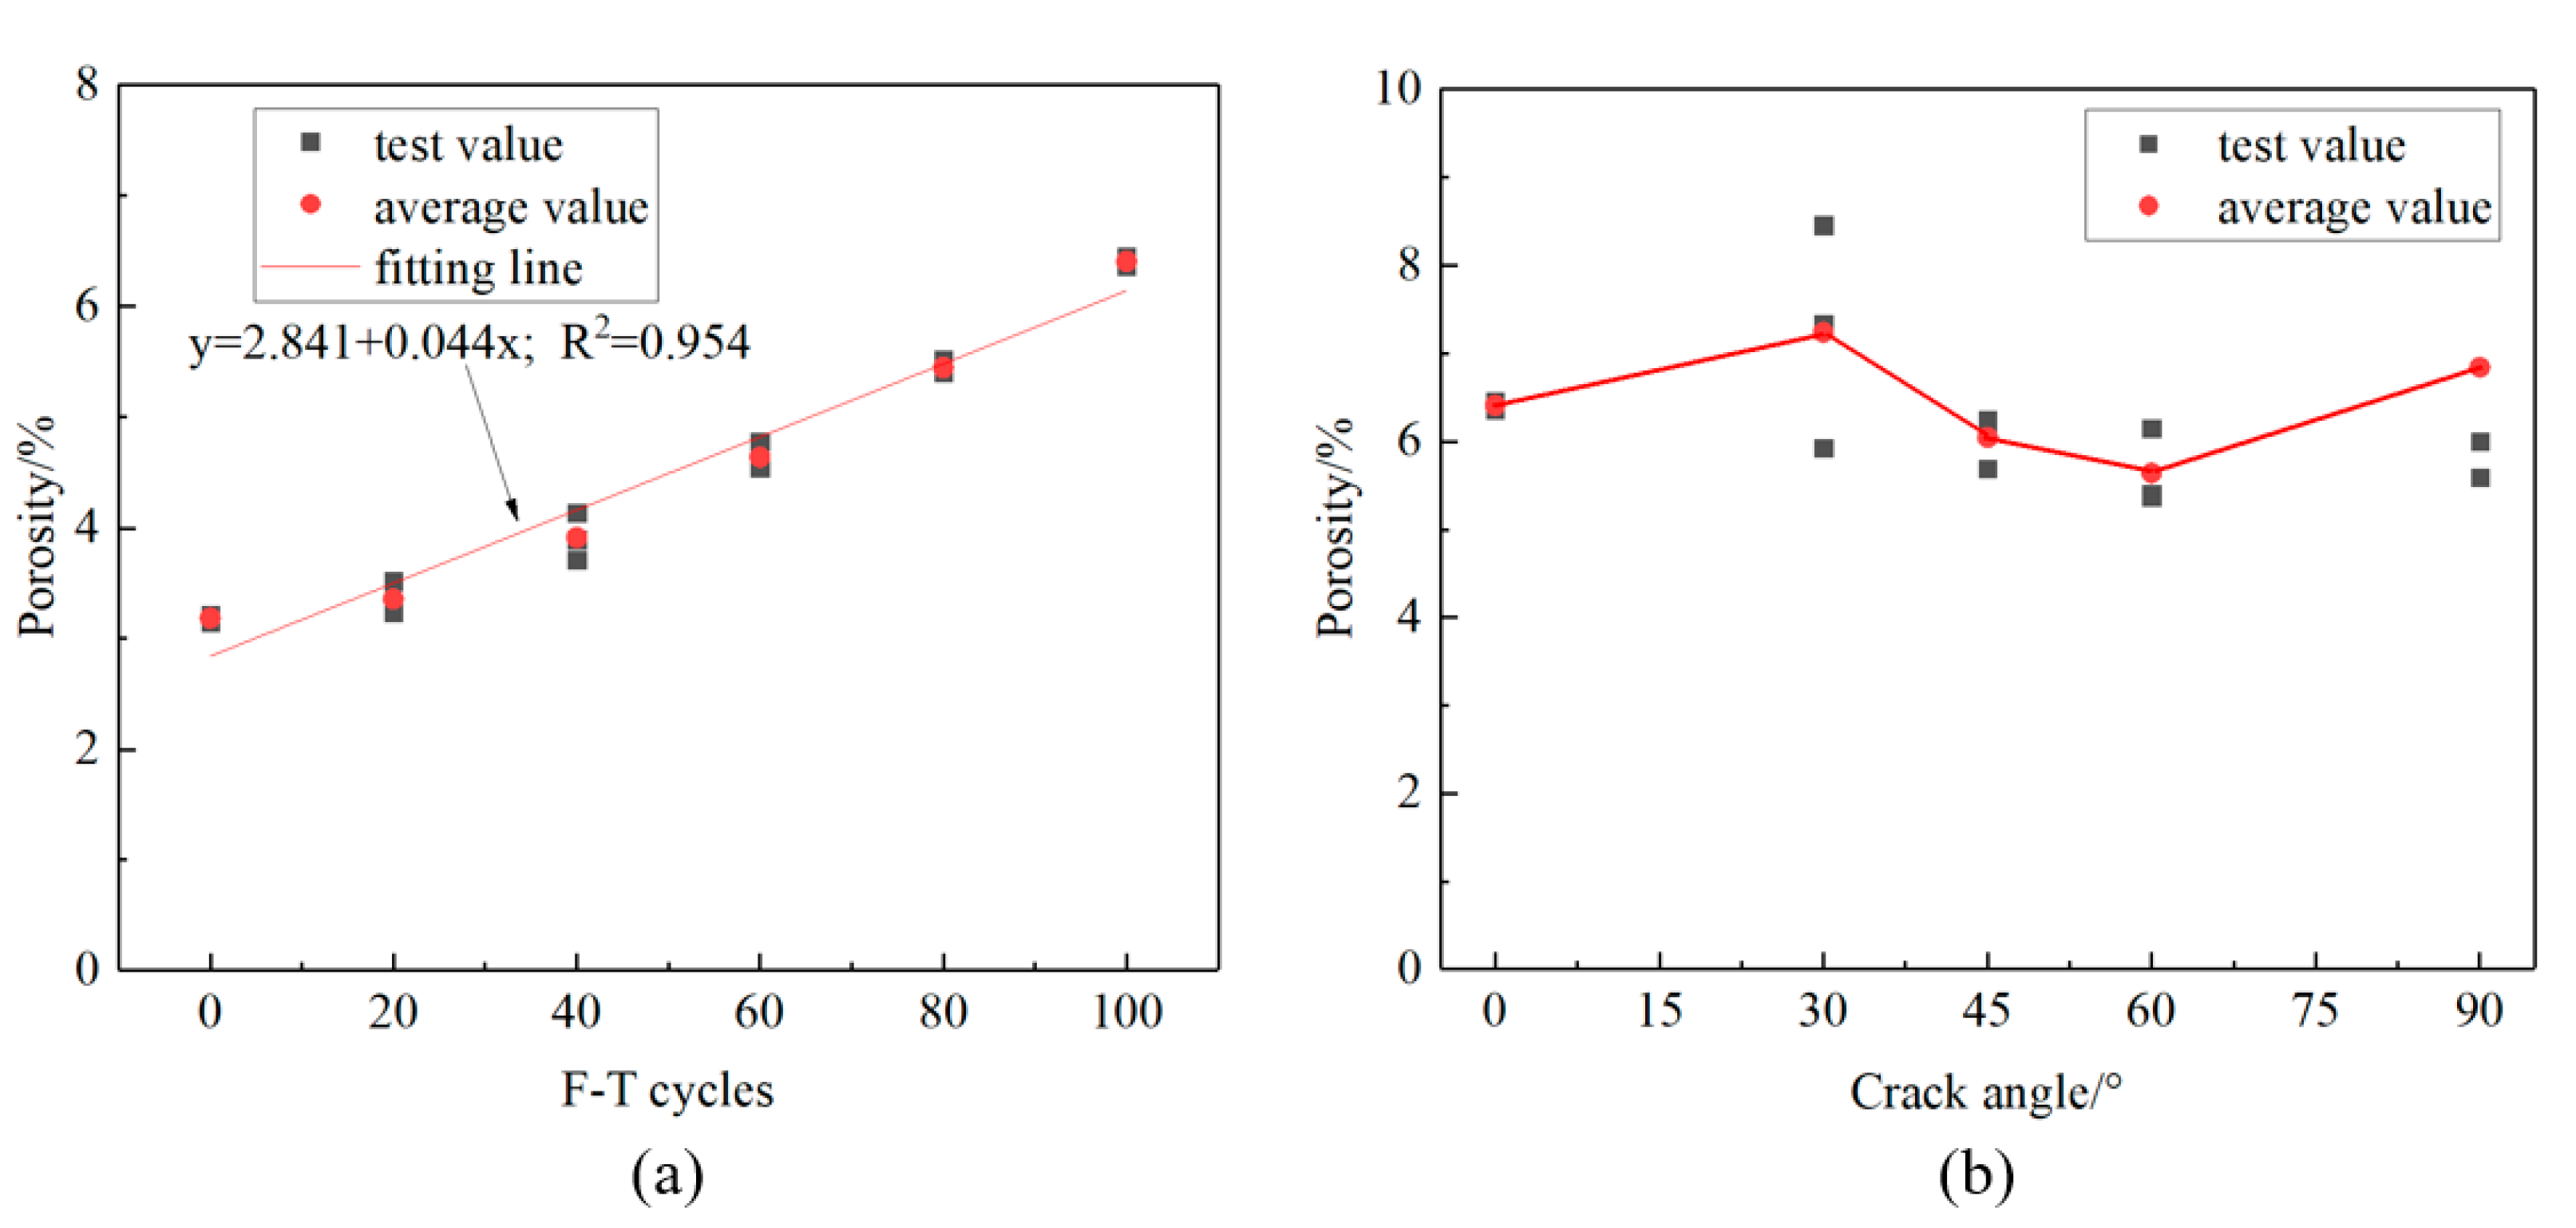
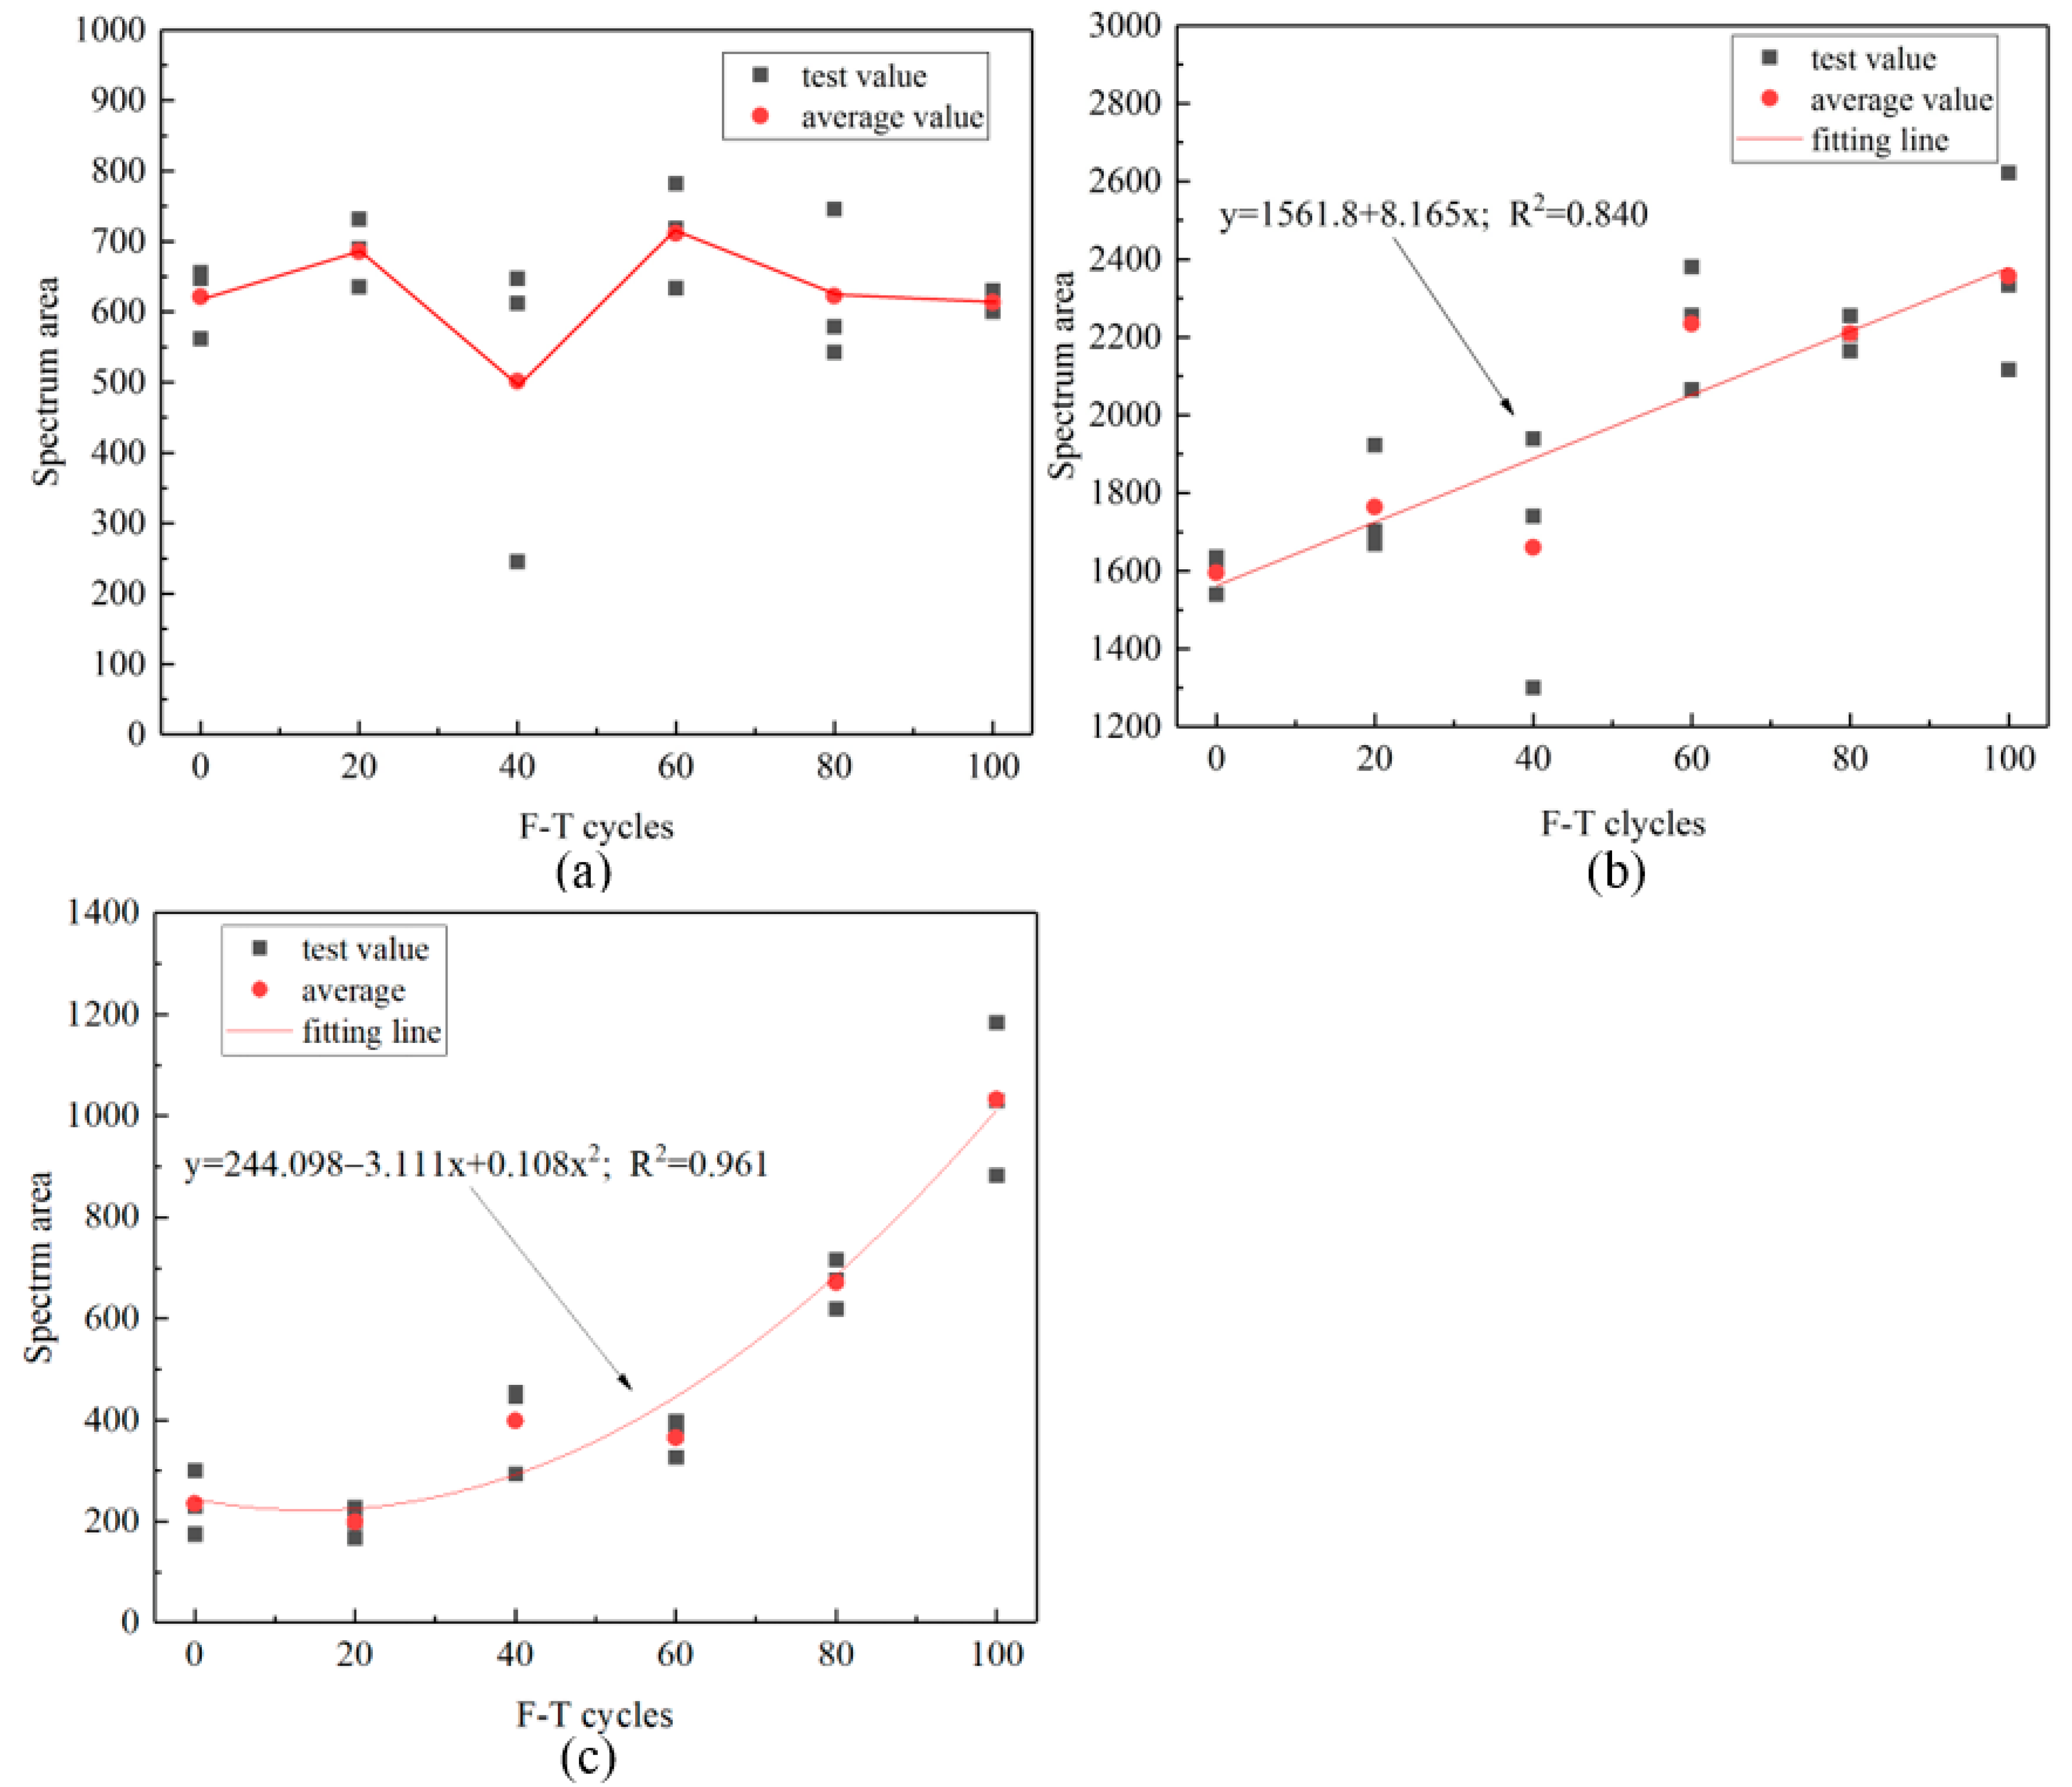
3.1. Pore Structure
3.2. Compressive Mechanical Properties
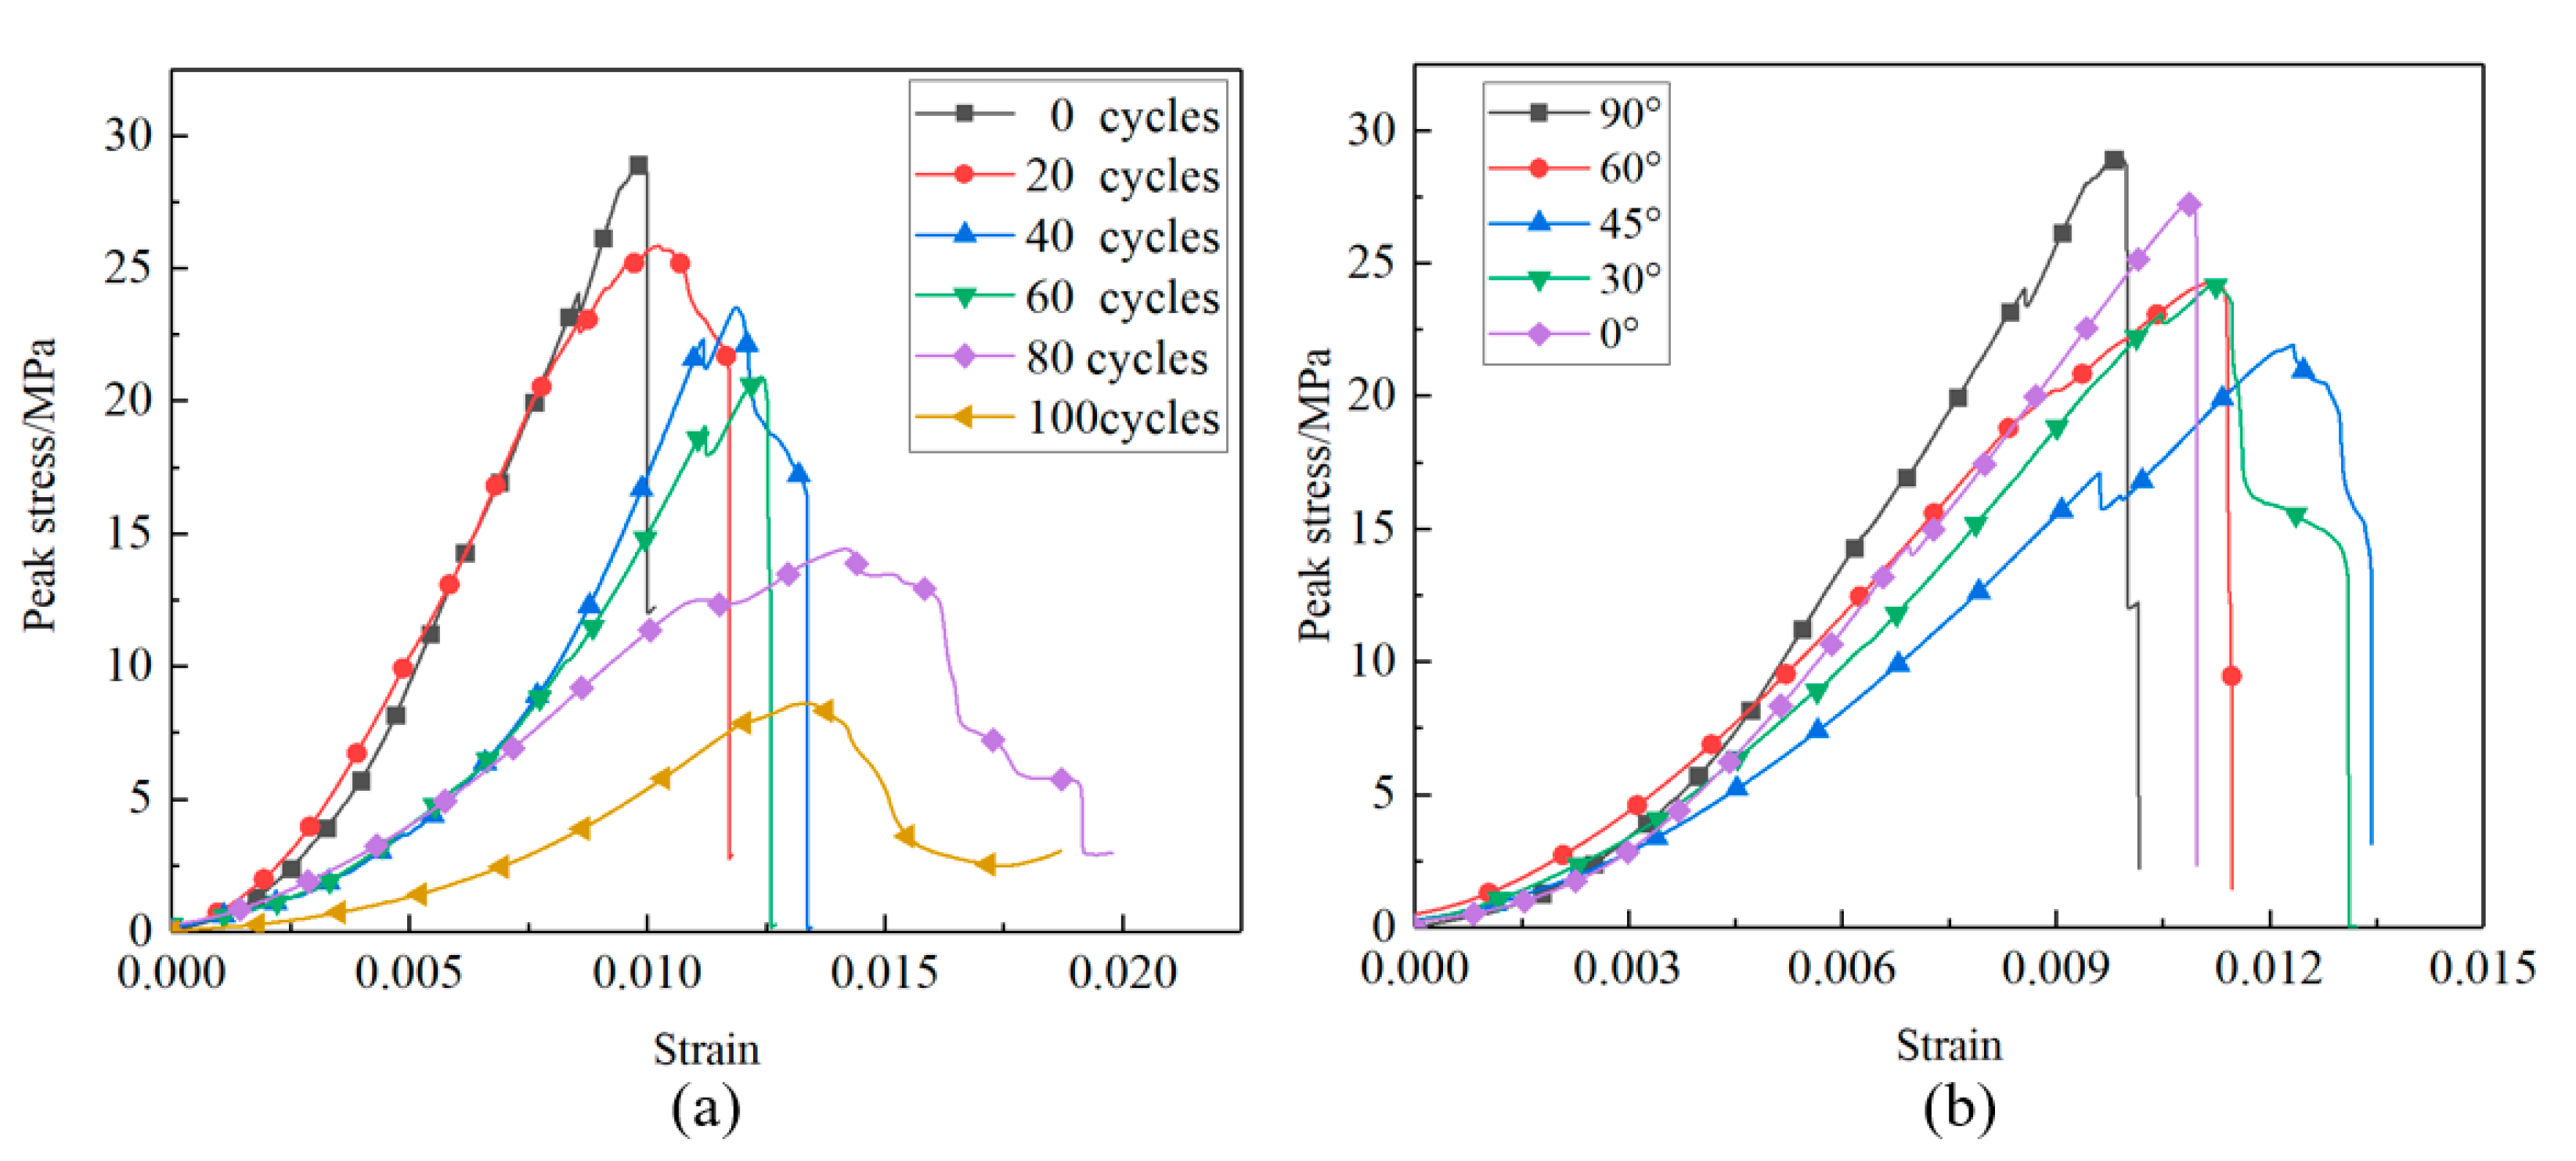
3.2.1. Stress-Strain Curves
3.2.2. Peak Stress
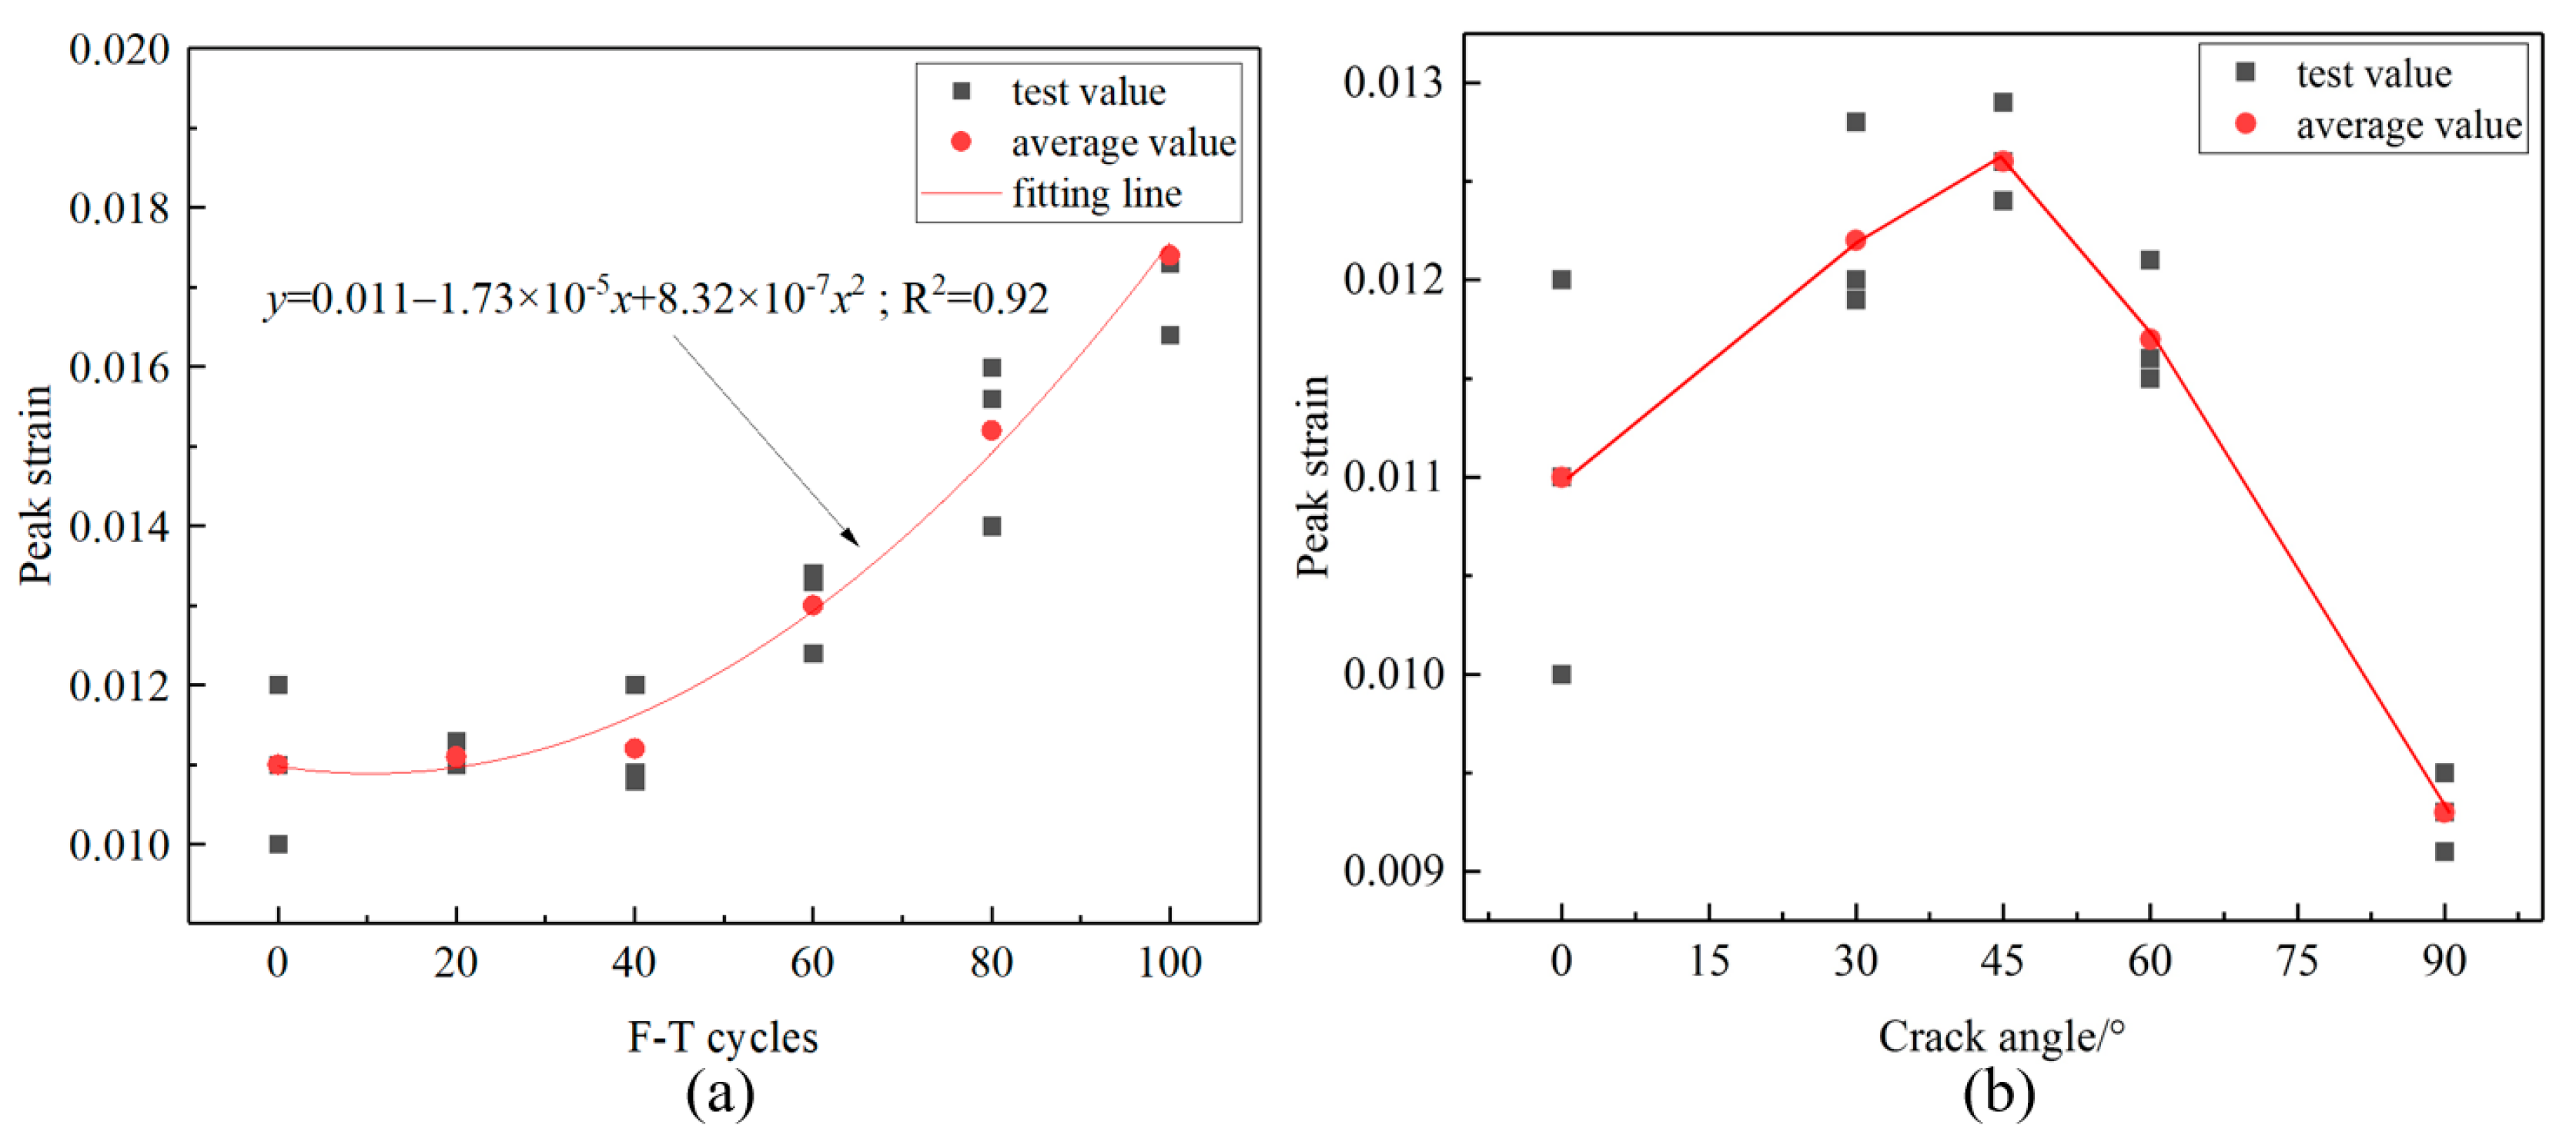
3.2.3. Peak Strain
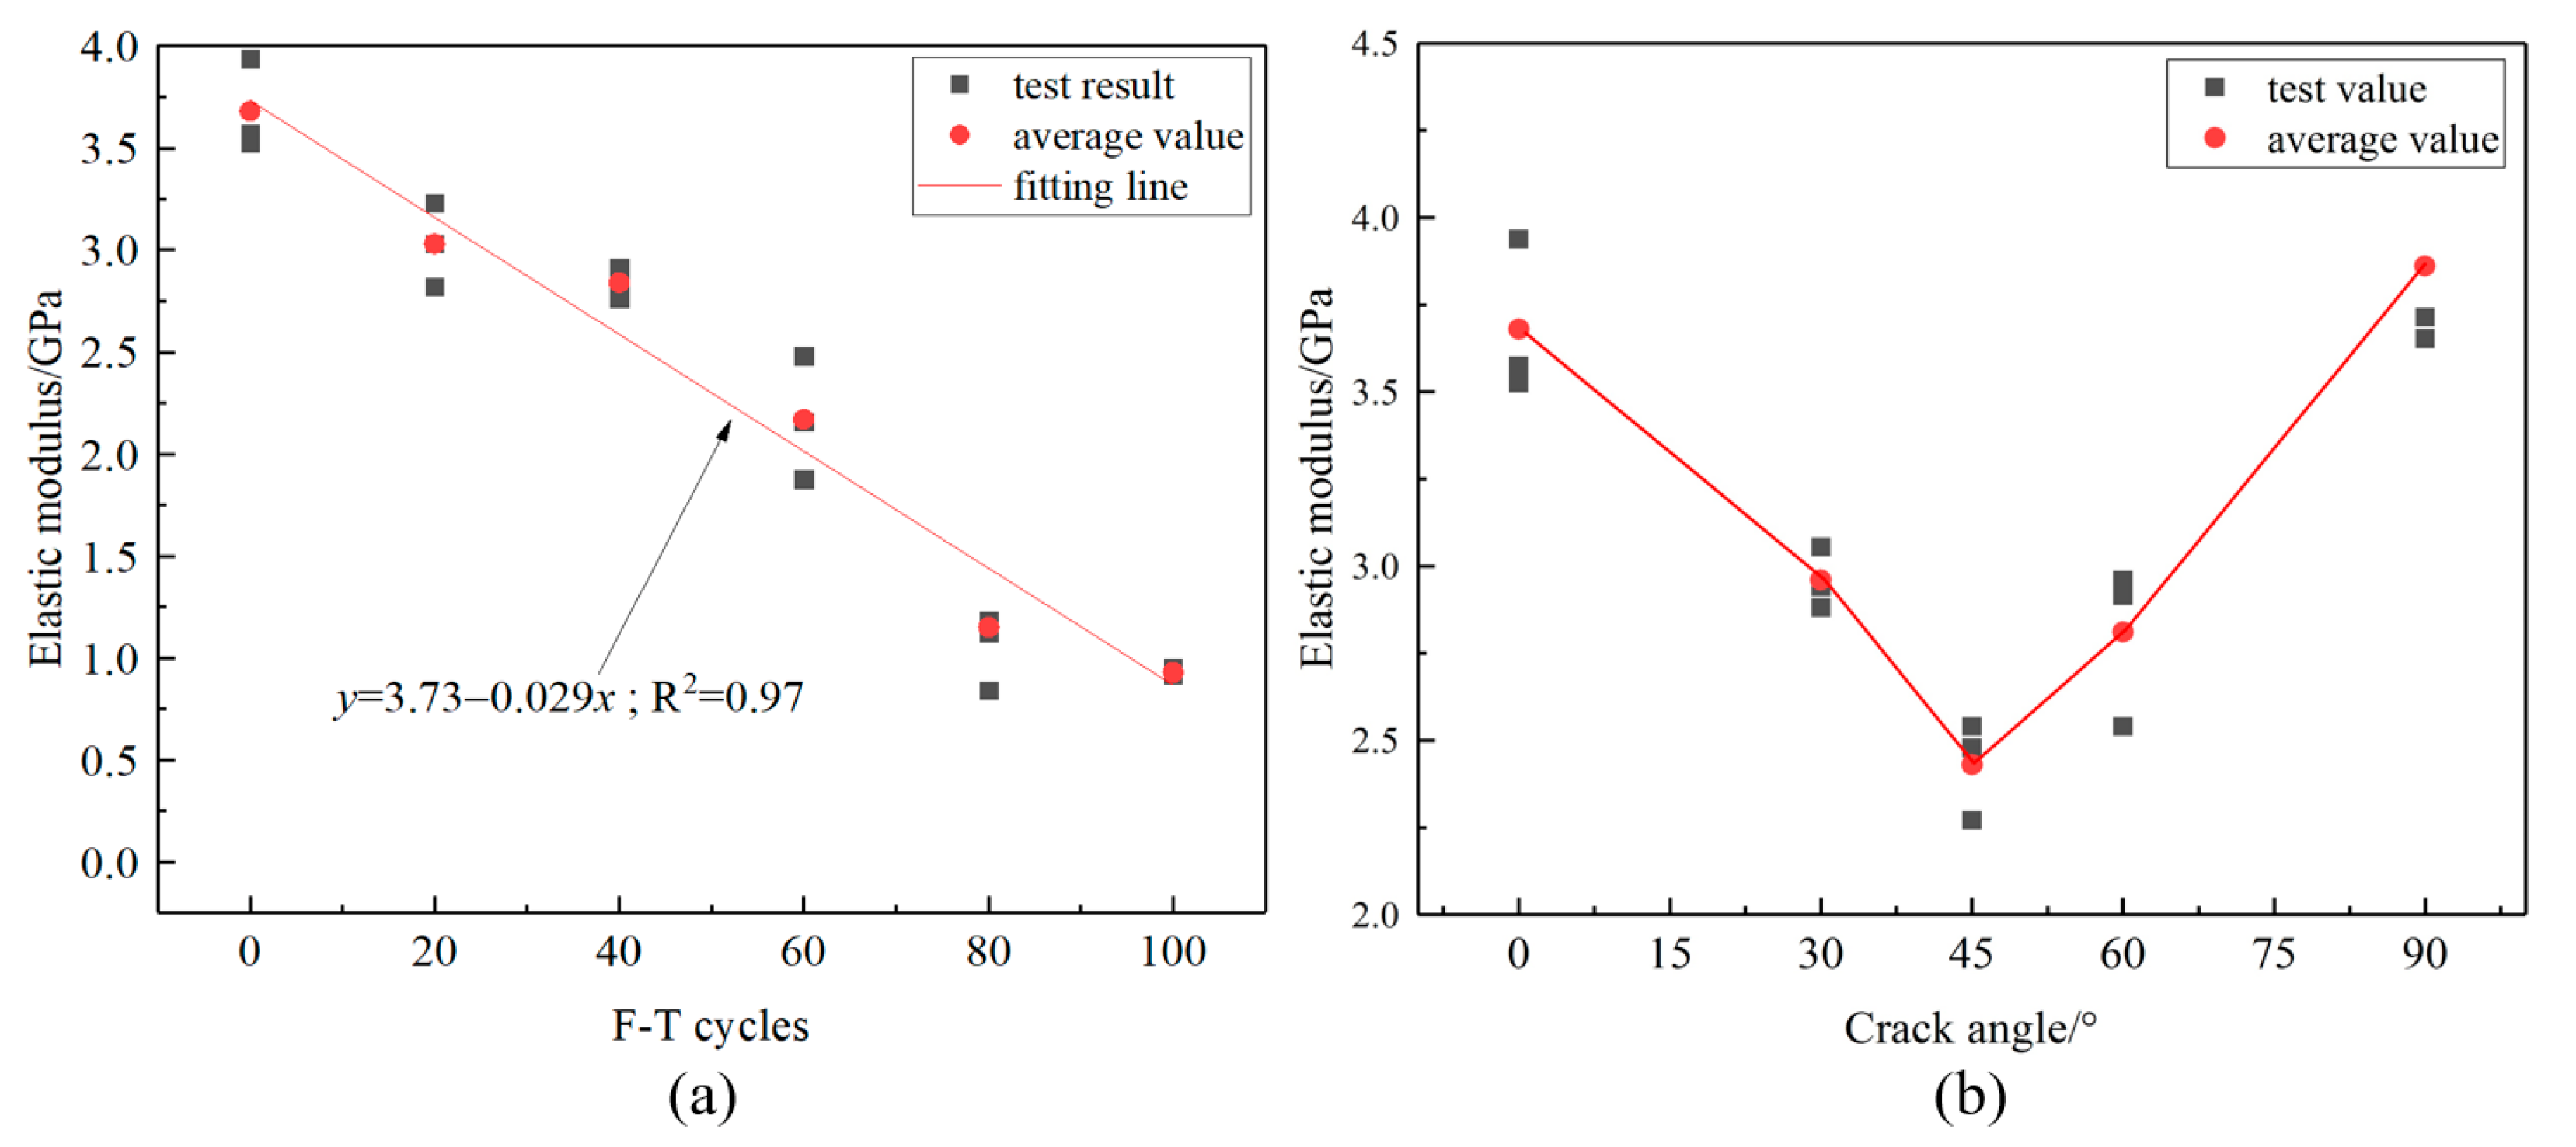
3.2.4. Elastic Modulus
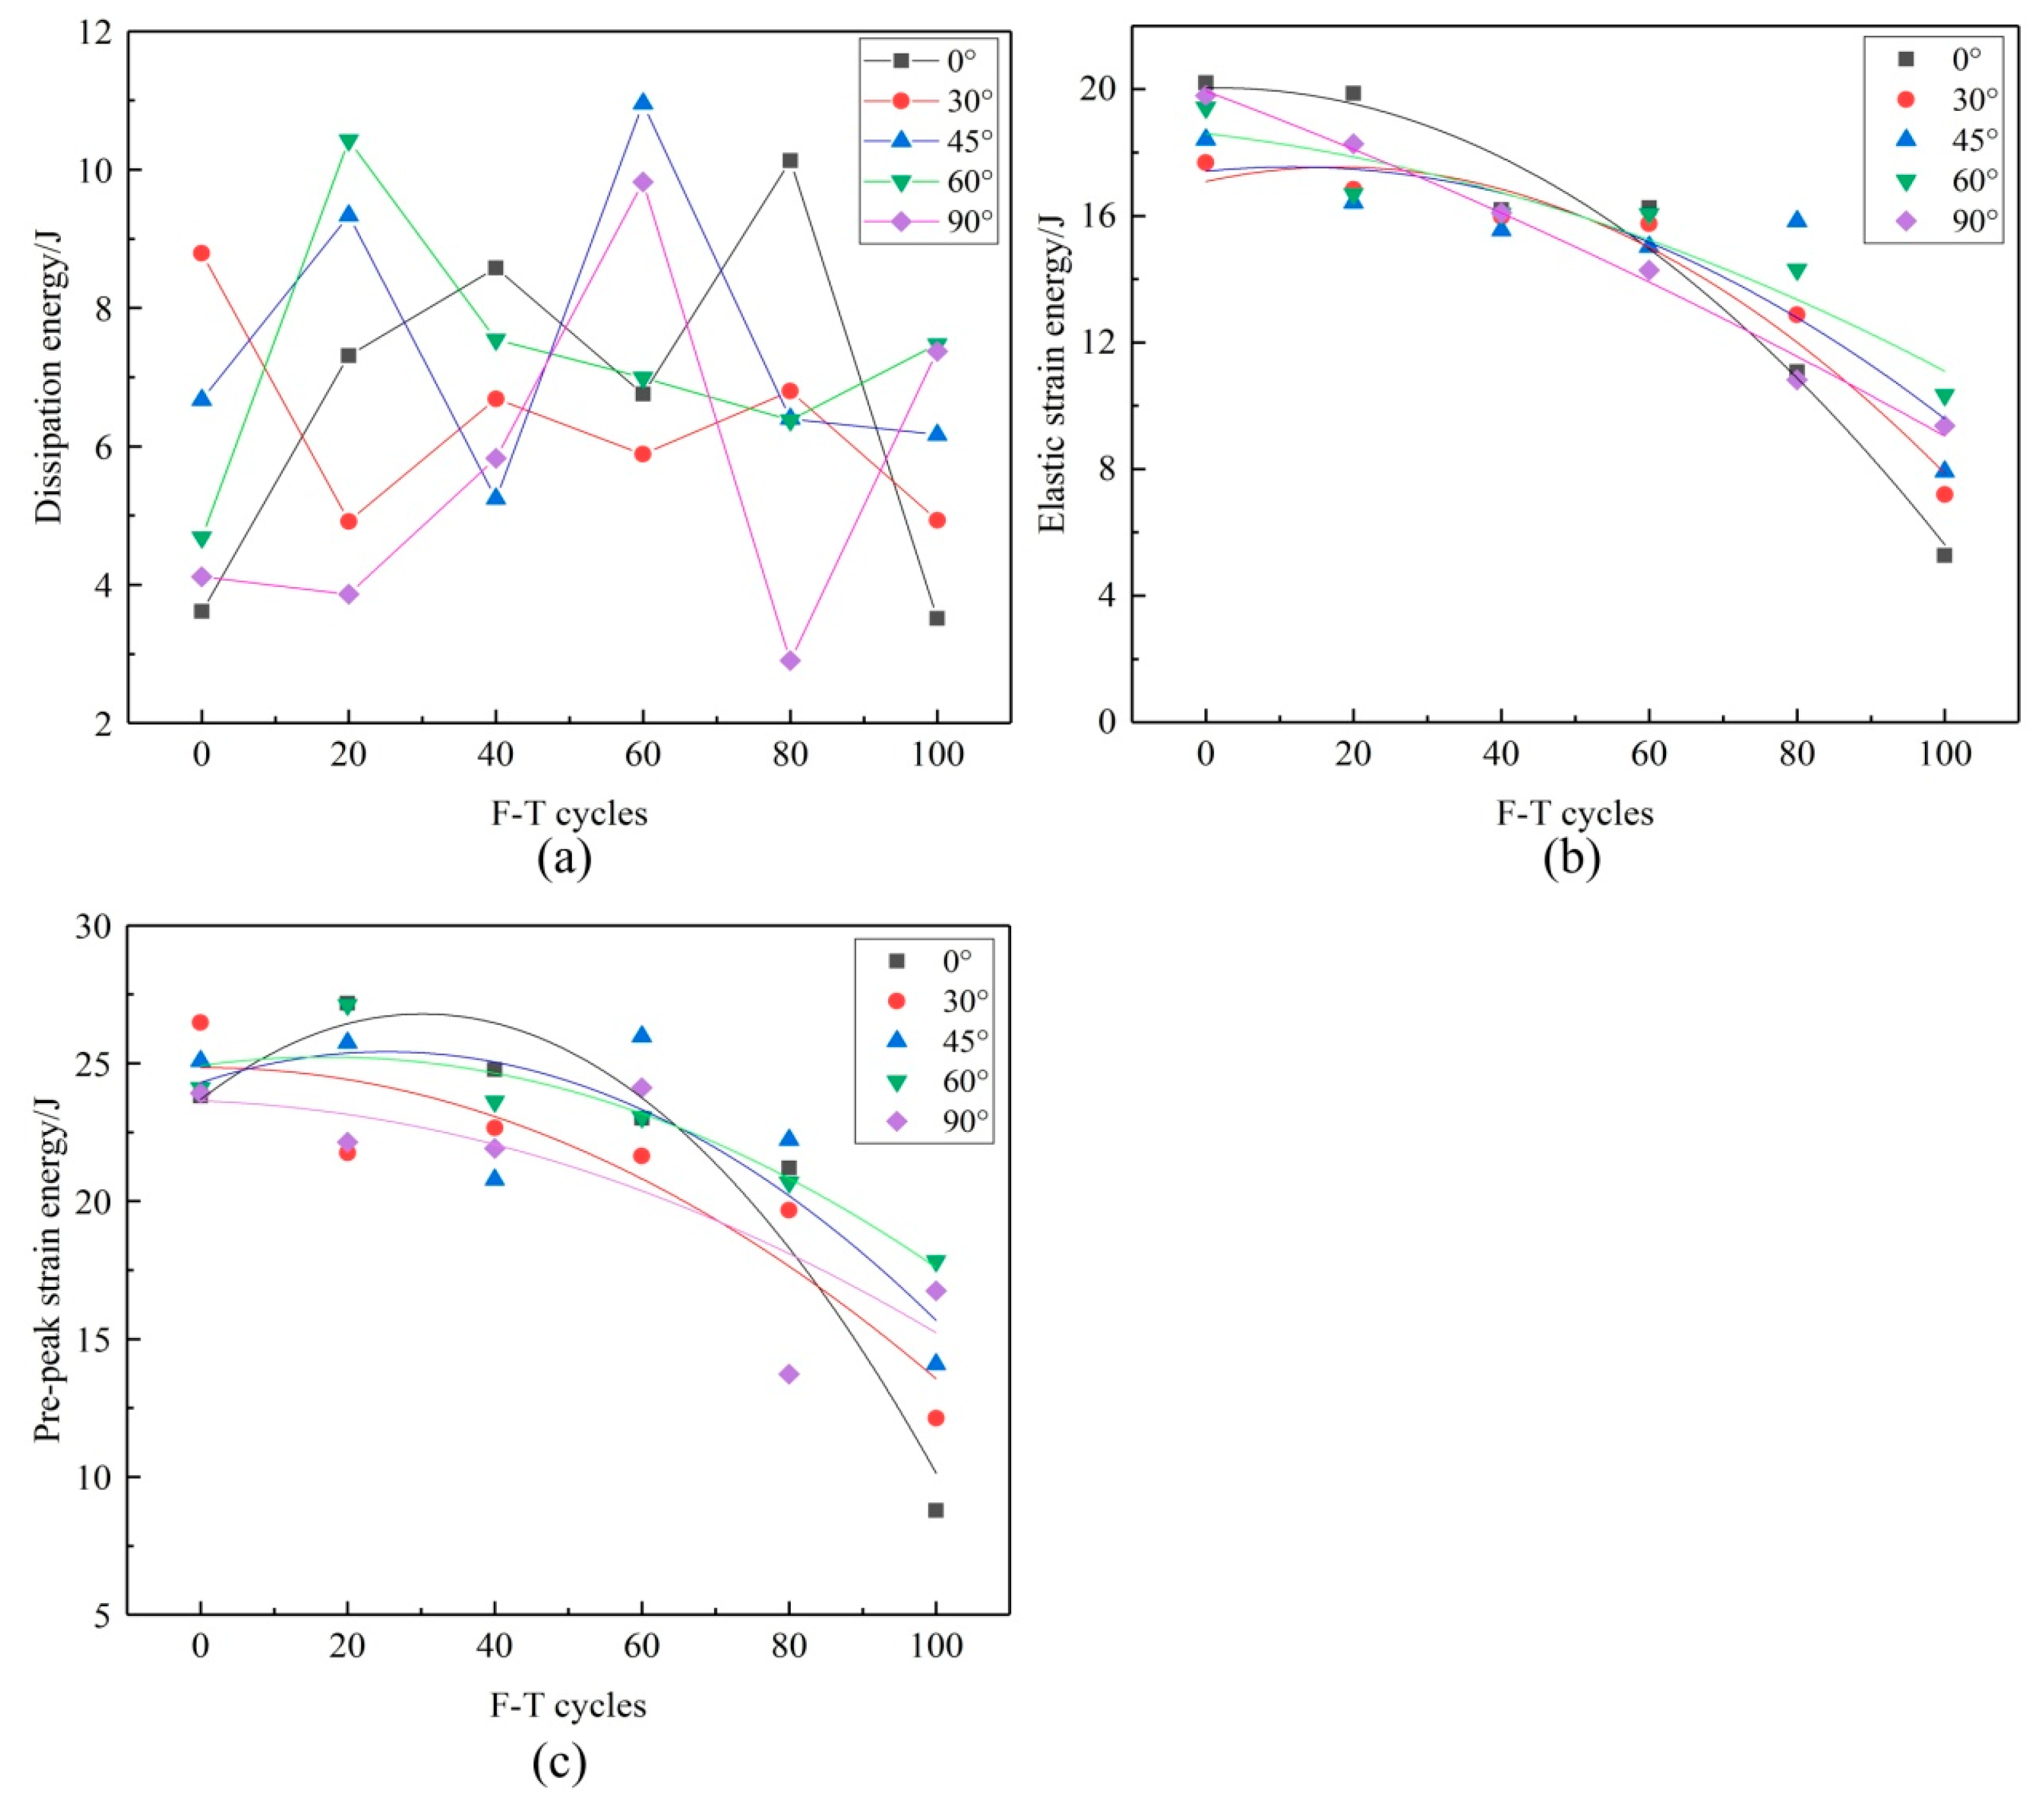
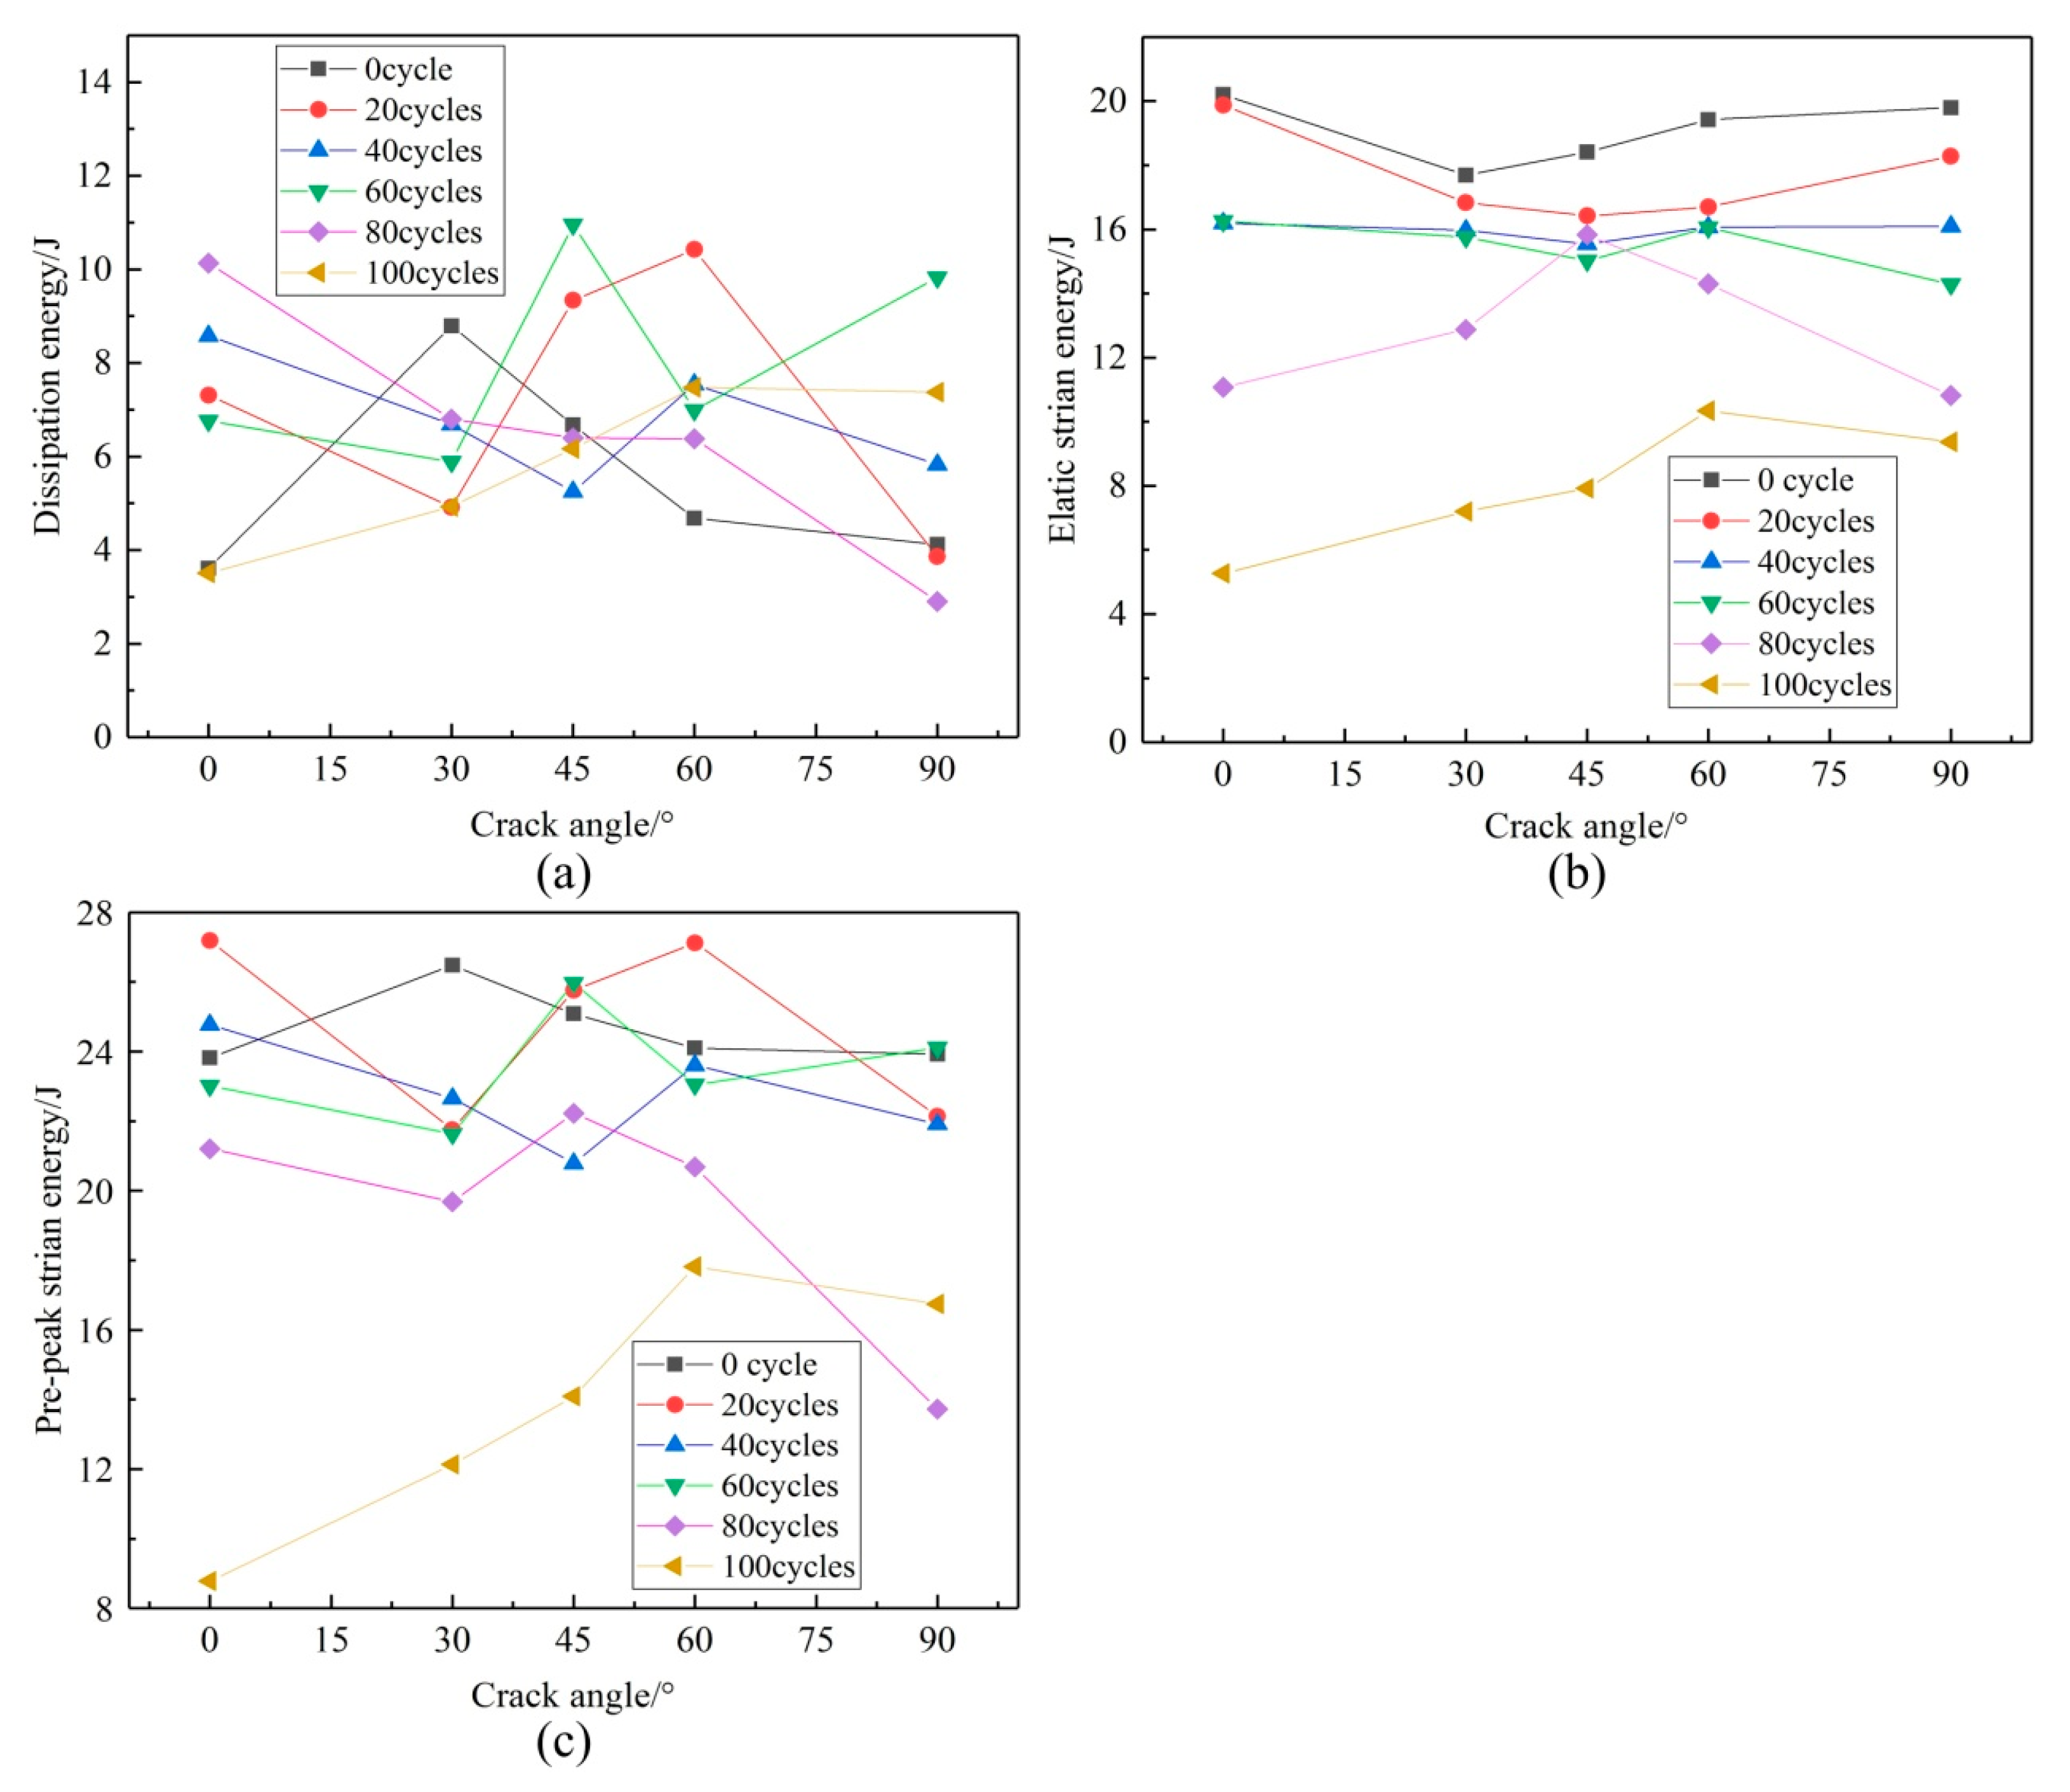
3.3. Strain Energy
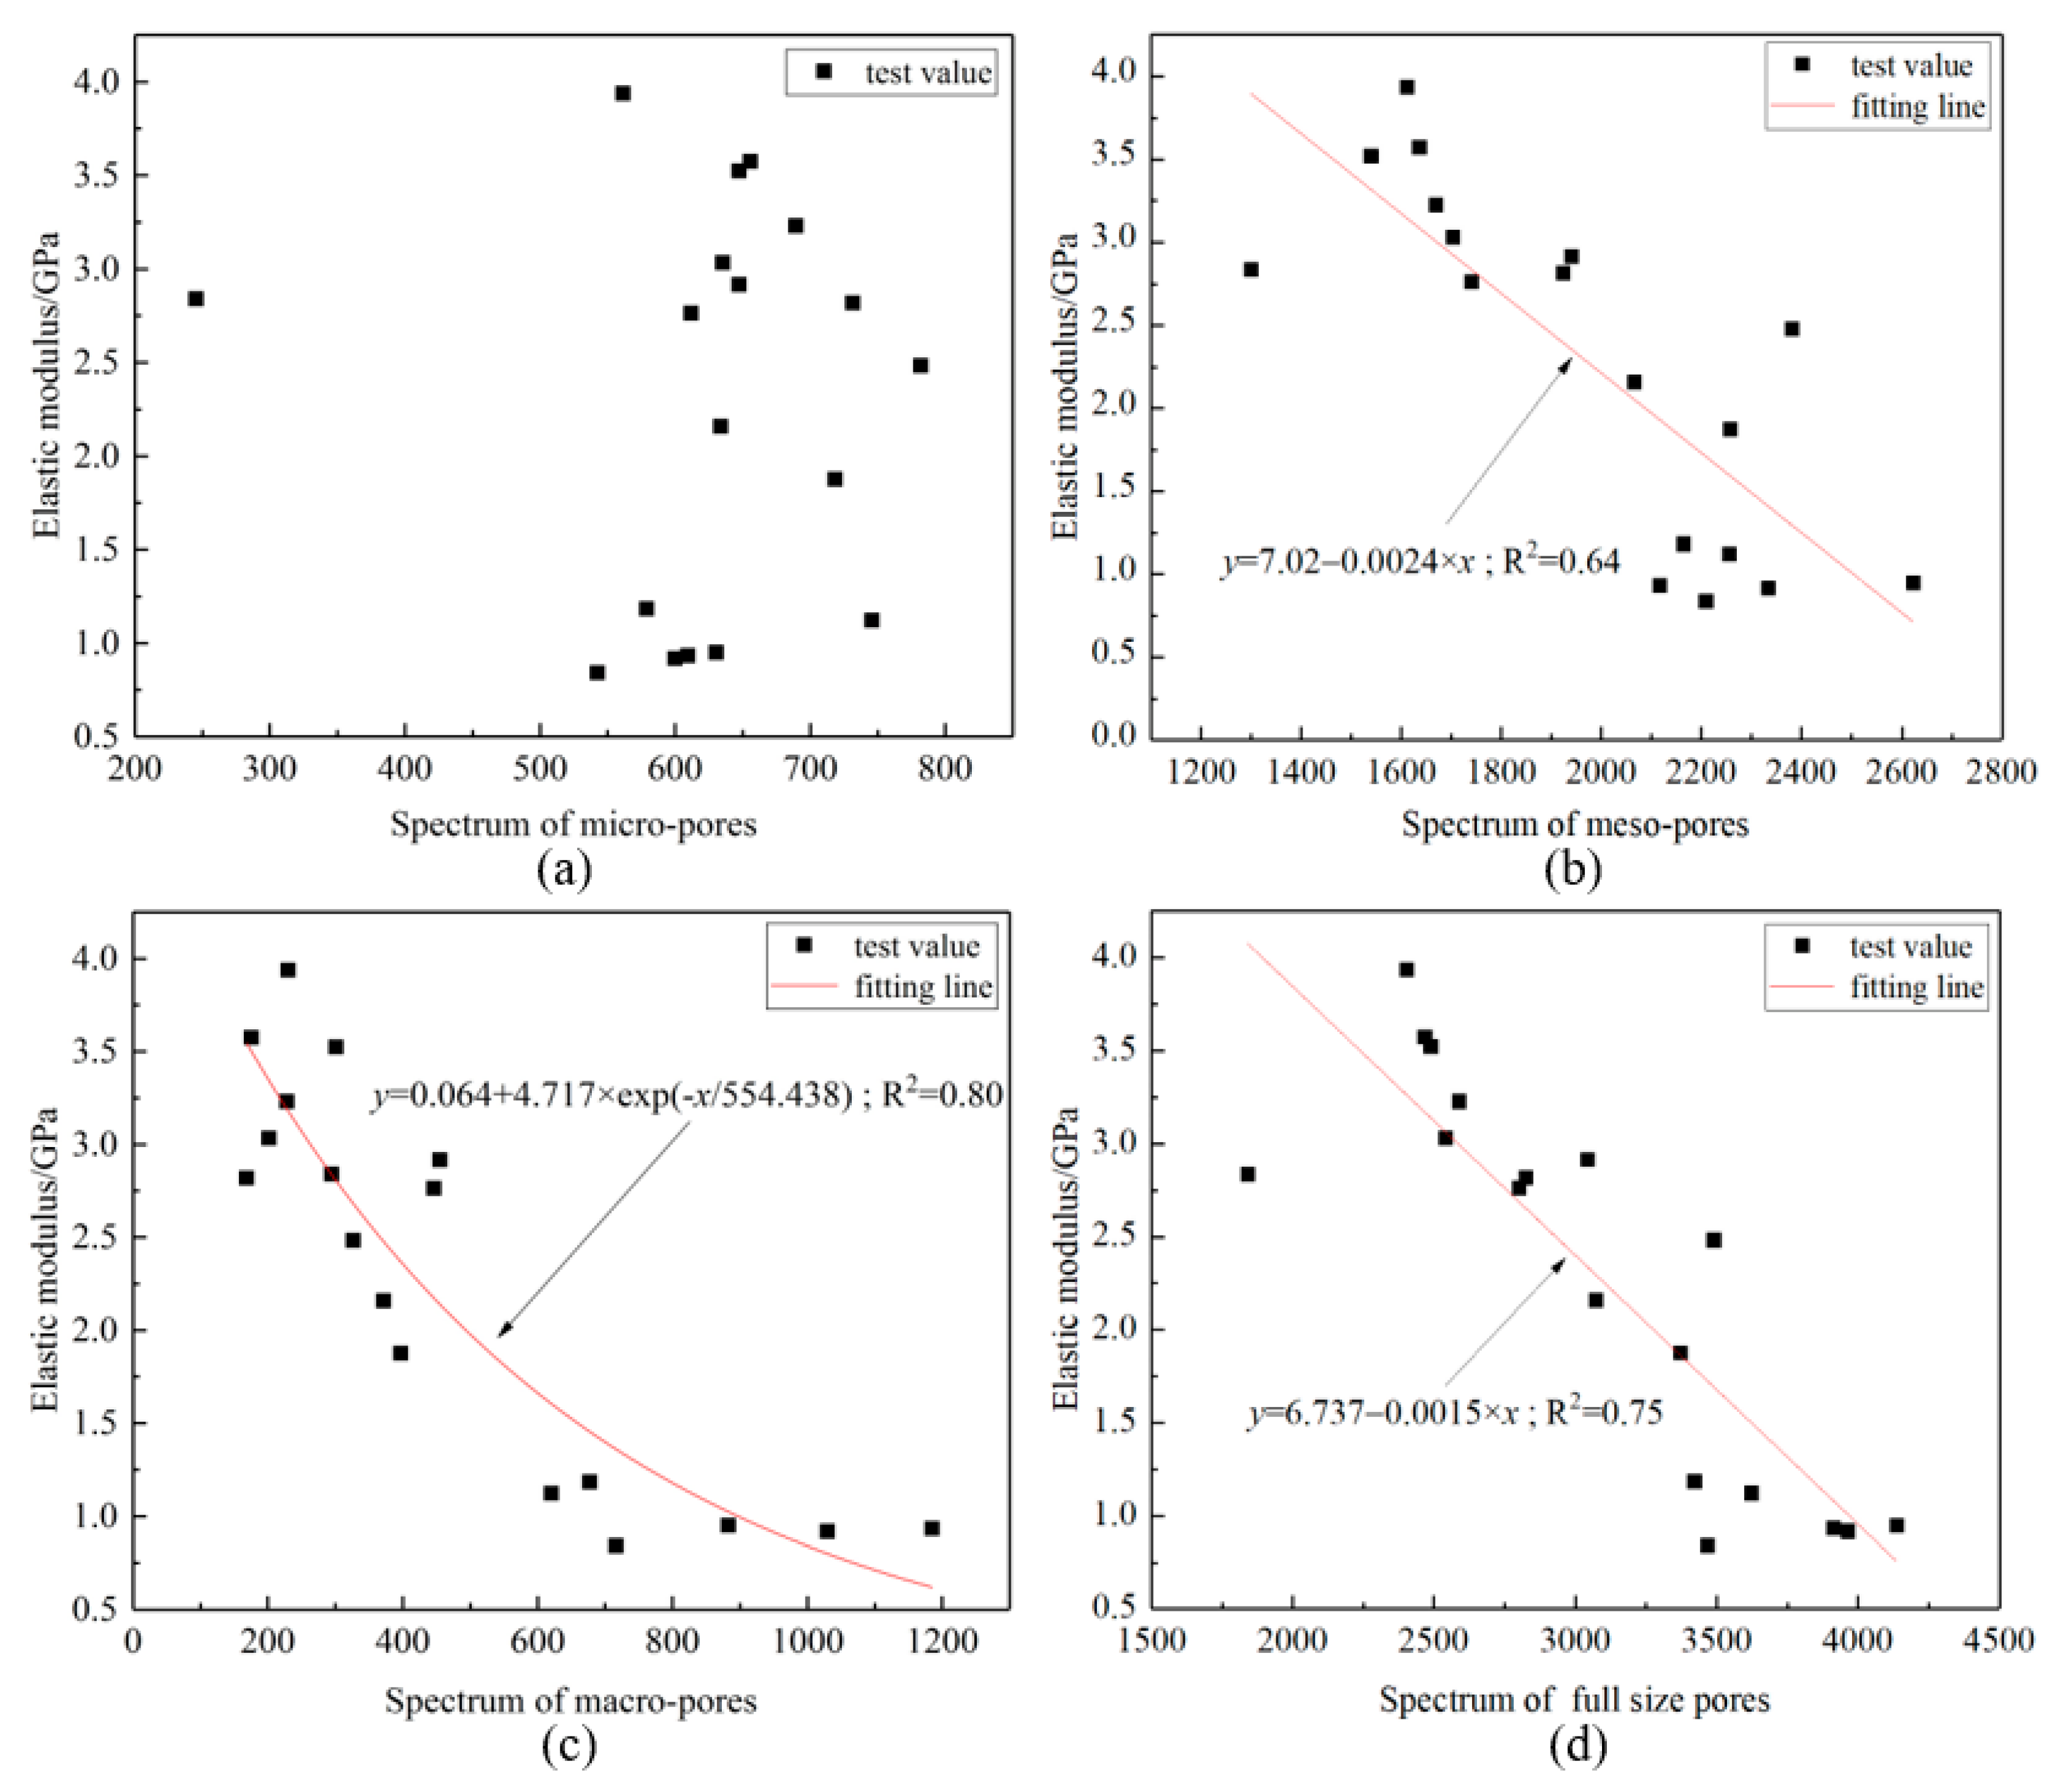
3.4. Connection between Pore Structure and Mechanical Properties
4. Discussion
4.1. Variation of Mechanical Properties
4.1.1. Peak Stress
4.1.2. Peak Strain
4.1.3. Elastic Modulus
4.2. Strain Energy
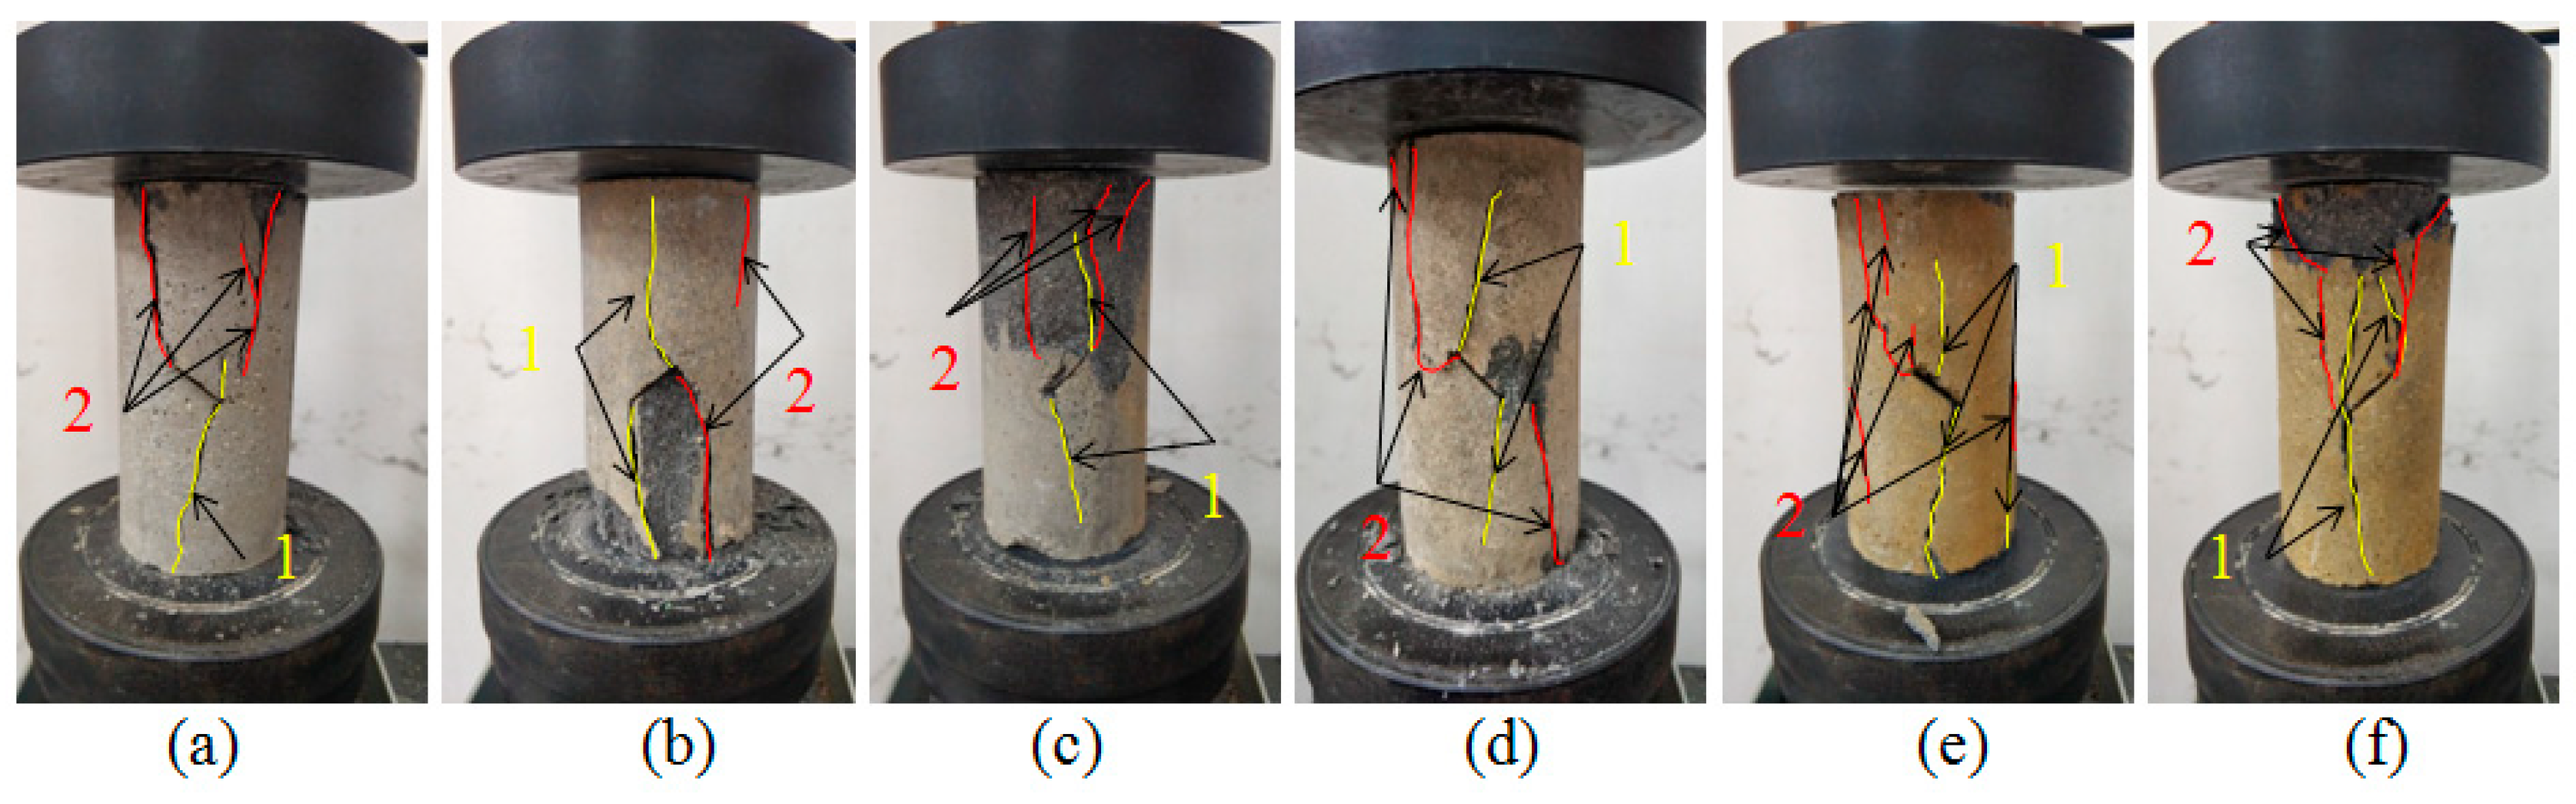
4.3. Failure Characteristics
5. Conclusions
- (1)
- Porosity increases linearly with an increase in F-T cycles, while porosity shows no previous variation trend with change in crack angle. The spectrum area of mesopores shows a linear growth trend with an increase in F-T cycles, and the spectrum area of macropores increases quadratically with an increase in F-T cycles.
- (2)
- Peak stress and elastic modulus drop linearly with an increase in F-T cycles, and peak strain increases nonlinearly with an increase in F-T cycles. Peak stress and elastic modulus decrease in the beginning, and then they increase with an increase in crack angle, while peak strain first increases and then decreases with an increase in crack angle.
- (3)
- Fissipation energy fluctuates with an increase in F-T cycles, and elastic strain energy and pre-peak strain energy drop nonlinearly with F-T cycles. Dissipation energy and pre-peak strain energy fluctuate with an increase in crack angle, and elastic strain energy first decreases and then increases with and increase crack in angle when the number of F-T cycles is less than 60.
- (4)
- The correlation between spectrum area of macropores and elastic modulus is the most significant among the different types of pores. Elastic modulus and peak stress decrease exponentially with an increase in macropore spectrum area, and peak strain increases linearly with an increase in macropore spectrum area.
Author Contributions
Funding
Data Availability Statement
Conflicts of Interest
References
- Park, J.; Hyun, C.U.; Park, H.D. Changes in microstructure and physical properties of rocks caused by artificial freeze-thaw action. Bull. Eng. Geol. Environ. 2015, 74, 555–565. [Google Scholar] [CrossRef]
- Ke, B.; Zhang, J.; Deng, H.; Yang, X. Dynamic Characteristics of Sandstone under Coupled Static-Dynamic Loads after Freeze-Thaw Cycles. Appl. Sci. 2020, 10, 3351. [Google Scholar] [CrossRef]
- Song, Z.; Wang, Y.; Konietzky, H.; Cai, X. Mechanical behavior of marble exposed to freeze-thaw-fatigue loading. Int. J. Rock Mech. Min. Sci. 2021, 138, 104648. [Google Scholar] [CrossRef]
- Mu, J.; Pei, X.; Huang, R.; Rengers, N.; Zou, X. Degradation characteristics of shear strength of joints in three rock types due to cyclic freezing and thawing. Cold Reg. Sci. Technol. 2017, 138, 91–97. [Google Scholar] [CrossRef]
- Liu, T.; Zhang, C.; Li, J.; Zhou, K.; Cao, P. Detecting freeze–thaw damage degradation of sandstone with initial damage using NMR technology. Bull. Eng. Geol. Environ. 2021, 80, 4529–4545. [Google Scholar] [CrossRef]
- Cai, X.; Cheng, Q.; Zhou, Z.; Konietzky, H. Rock mass watering for rock-burst prevention: Some thoughts on the mechanisms deduced from laboratory results. Bull. Eng. Geol. Environ. 2021, 80, 8725–8743. [Google Scholar] [CrossRef]
- Meng, F.; Zhai, Y.; Li, Y.; Zhao, R.; Li, Y.; Gao, H. Research on the effect of pore characteristics on the compressive properties of sandstone after freezing and thawing. Eng. Geol. 2021, 286, 106088. [Google Scholar] [CrossRef]
- Wang, D.; Chen, G.; Jian, D.; Zhu, J.; Lin, Z. Shear creep behavior of red sandstone after freeze-thaw cycles considering different temperature ranges. Bull. Eng. Geol. Environ. 2021, 80, 2349–2366. [Google Scholar] [CrossRef]
- Zhang, Q.; Li, Y.; Chen, Q. Effects of temperatures and pH values on rheological properties of cemented paste backfill. J. Cent. South Univ. 2021, 28, 1707–1723. [Google Scholar] [CrossRef]
- Xu, J.; Pu, H.; Sha, Z. Mechanical behavior and decay model of the sandstone in Urumqi under coupling of freeze–thaw and dynamic loading. Bull. Eng. Geol. Environ. 2021, 80, 2963–2978. [Google Scholar] [CrossRef]
- Qiao, C.; Li, C.; Wang, Y.; Yang, H.; Song, Z. Research on macro and meso damage model of pre-flawed granites subjected to coupling action of freeze-thaw and loading. Arab J. Geosci. 2021, 14, 1083. [Google Scholar] [CrossRef]
- Song, Z.; Frühwirt, H.; Konietzky, H. Inhomogeneous mechanical behaviour of concrete subjected to monotonic and cyclic loading. Int. J. Fatigue 2019, 132, 105383. [Google Scholar] [CrossRef]
- Weng, L.; Wu, Z.; Taheri, A.; Liu, Q. Deterioration of dynamic mechanical properties of granite due to freeze-thaw weathering: Considering the effects of moisture conditions. Cold Reg. Sci. Technol. 2020, 176, 103092. [Google Scholar] [CrossRef]
- Weng, L.; Wu, Z.; Liu, Q.; Chu, Z.; Zhang, S. Evolutions of the unfrozen water content of saturated sandstones during freezing process and the freeze-induced damage characteristics. Int. J. Rock Mech. Min. Sci. 2021, 142, 104757. [Google Scholar] [CrossRef]
- Lu, Y.; Li, X.; Wu, X. Fracture coalescence mechanism of single flaw rock specimen due to freeze-thaw under triaxial compression. Rock Soil Mech. 2014, 35, 1579–1584. [Google Scholar]
- Liu, H.; Liu, Y.; Xing, C.; Zhang, L.; Ma, M. Test study of damage failure of jointed rock mass under freezing-thawing cycles. Rock Soil Mech. 2014, 35, 1547–1554. [Google Scholar]
- Si, K.; Cui, Z.; Peng, R.; Zhao, L.; Zhao, Y. Crack Propagation Process and Seismogenic Mechanisms of Rock Due to the Influence of Freezing and Thawing. Appl. Sci. 2021, 11, 9601. [Google Scholar] [CrossRef]
- Jia, H. Theoretical Damage Model of Porous Rock and Hard Joint Rocks Subjected to Forest Action and Further Experimental Verification. Ph.D. Thesis, China University of Geoscience, Wuhan, China, 2016. [Google Scholar]
- Zhai, J.; Zhang, Z.; Melnikov, A.; Zhang, M.; Yang, L.; Jin, D. Experimental Study on the Effect of Freeze—Thaw Cycles on theMineral Particle Fragmentation and Aggregation with Different Soil Types. Minerals 2021, 11, 913. [Google Scholar] [CrossRef]
- Xu, P.; Wu, Y.; Huang, L.; Zhang, K. Study on the Progressive Deterioration of Tunnel Lining Structures in Cold Regions Experiencing Freeze–Thaw Cycles. Appl. Sci. 2021, 11, 5903. [Google Scholar] [CrossRef]
- Jia, H.; Zi, F.; Yang, G.; Li, G.; Shen, Y. Influence of Pore Water (Ice) Content on the Strength and Deformability of Frozen Argillaceous Siltstone. Rock Mech. Rock Eng. 2020, 53, 967–974. [Google Scholar] [CrossRef]
- Roy, D.; Singh, T.; Kodikara, J. Effect of water saturation on the fracture and mechanical properties of sedimentary rocks. Rock Mech. Rock Eng. 2017, 50, 2585–2600. [Google Scholar]
- Chen, Q.; Sun, S.; Liu, Y.; Qi, C.; Zhou, H. Immobilization and leaching characteristics of fluoride from phosphogypsum-based cemented paste backfill. Int. J. Miner. Metall. Mater. 2021, 28, 1440–1452. [Google Scholar] [CrossRef]
- Mousavi, S.; Tavakoli, H.; Moarefvand, P.; Rezaei, M. Micro-structural, petro-graphical and mechanical studies of schist rocks under the freezing-thawing cycles. Cold Reg. Sci. Technol. 2020, 174, 103039. [Google Scholar] [CrossRef]
- Javier, M.; Benavente, D.; Gomez-Heras, M. Marco-Castañoa, L.; García-del-Curaac, Á. Non-linear decay of building stones during freeze–thaw weathering processes. Constr. Build. Mater. 2013, 38, 443–454. [Google Scholar]
- Ruiz, V.G.; Rey, R.; Celorio, C.; Suárezdel, L.M.; Calleja, L. Characterization by Computed X-ray tomography of the evolution of the pore structure of a dolomite rock during freeze-thaw cyclic tests. Phys. Chem. Earth Part A Solid Earth Geod. 1999, 24, 633–637. [Google Scholar]
- Raynaud, D.; Mazerolle, F. Analysis of the internal structure of rocks and characterization of mechanical deformation by a non-destructive method: X-ray tomodensitometry. Teetonophysics 1989, 159, 149–159. [Google Scholar] [CrossRef]
- Kucharczyková, B.; Šimonová, H.; Kocáb, D.; Topolář, L. Advanced Evaluation of the Freeze–Thaw Damage of Concrete Based on the Fracture Tests. Materials 2021, 14, 6378. [Google Scholar] [CrossRef]
- Li, J.; Zhou, K.; Liu, W.; Deng, H. NMR research on deterioration characteristics of microscopic structure of sandstones in freeze–thaw cycles. Transac. Nonferrous Metals Soc. China 2016, 26, 2997–3003. [Google Scholar] [CrossRef]
- Gao, F.; Wang, Q.; Deng, H.; Zhang, J.; Tian, W.; Ke, B. Coupled effects of chemical environments and freeze–thaw cycles on damage characteristics of red sandstonE. Bull. Eng. Geol. Environ. 2016, 76, 1481–1490. [Google Scholar] [CrossRef]
- Deng, H.; Dong, C.; Li, J.; Zhou, K.; Tian, W.; Zhang, J. Experimental Study on Sandstone Freezing-Thawing Damage Properties under Condition of Water Chemistry. Appl. Mech. Mater. 2014, 608–609, 726–731. [Google Scholar] [CrossRef]
- Deng, H.; Yu, S.; Deng, J. Damage Characteristics of Sandstone Subjected to Coupled Effect of Freezing-Thawing Cycles and Acid Environment. Adv. Civil Eng. 2018, 1–10. [Google Scholar] [CrossRef] [Green Version]
- Liu, C.; Deng, H.; Chen, X.; Xiao, D.; Li, B. Impact of Rock Samples Size on the Microstructural Changes Induced by Freeze–Thaw Cycles. Rock Mech. Rock Eng. 2020, 1, 1–8. [Google Scholar] [CrossRef]
- Li, J.; Liu, H.; Ai, K.; Zhu, L. An NMR-Based Experimental Study on the Pore Structure of the Hydration Process of Mine Filling Slurry. Adv. Civil Eng. 2018, 1–12. [Google Scholar] [CrossRef] [Green Version]
- Jia, H.; Ding, S.; Zi, F.; Dong, Y.; Shen, Y. Evolution in sandstone pore structures with freeze-thaw cycling and interpretation of damage mechanisms in saturated porous rocks. Catena 2020, 195, 104915. [Google Scholar] [CrossRef]
- Qin, L.; Zhai, C.; Liu, S.; Xu, J.; Yu, G.; Sun, Y. Changes in the petrophysical properties of coal subjected to liquid nitrogen freeze-thaw–A nuclear magnetic resonance investigation. Fuel 2017, 194, 102–114. [Google Scholar] [CrossRef]
- Song, Z.; Frühwirt, T.; Konietzky, H. Characteristics of dissipated energy of concrete subjected to cyclic loading. Constr. Build. Mater. 2018, 168, 47–60. [Google Scholar] [CrossRef]
- Weng, L.; Huang, L.; Taheri, A.; Li, X. Rockburst characteristics and numerical simulation based on a strain energy density index: A case study of a roadway in Linglong gold mine, China. Tunnell. Undergr. Space Technol. 2017, 69, 223–232. [Google Scholar] [CrossRef]
- Ma, Q.; Ma, D.; Yao, Z. Influence of freeze-thaw cycles on dynamic compressive strength and energy distribution of soft rock specimen. Cold Reg. Sci. Technol. 2018, 153, 10–17. [Google Scholar] [CrossRef]
- Deng, H.; Yu, S.; Deng, J.; Ke, B.; Bin, F. Experimental Investigation on Energy Mechanism of Freezing-Thawing Treated Sandstone under Uniaxial Static Compression. KSCE J. Civil Eng. 2019, 23, 2074–2082. [Google Scholar] [CrossRef]
- Zhang, J.; Deng, H.; Taheri, A.; Ke, B.; Liu, C. Deterioration and strain energy development of sandstones under quasi-static and dynamic loading after freeze-thaw cycles. Cold Reg. Sci. Technol. 2019, 160, 252–264. [Google Scholar] [CrossRef]
- Liu, C.; Zhang, J.; Deng, H.; Lin, Y.; Li, P.; Ke, B. Energy Dissipation Characteristics and Failure Patterns of Freeze-Thawed Granite in Dynamic Flexural Tension. IEEE Access 2019, 7, 97793–97802. [Google Scholar] [CrossRef]
- Cai, X.; Zhou, Z.; Zang, H. Water saturation effects on dynamic behavior and microstructure damage of sandstone: Phenomena and mechanisms. Eng. Geol. 2020, 276, 105760. [Google Scholar] [CrossRef]
- Ke, B.; Zhou, K.; Xu, C.; Deng, H.; Li, J.; Bin, F. Dynamic Mechanical Property Deterioration Model of Sandstone Caused by Freeze–Thaw Weathering. Rock Mech. Rock Eng. 2018, 51, 2791–2804. [Google Scholar] [CrossRef]
- Yu, S.; Deng, H.; Tian, G.; Deng, J. Microscopic Characteristic Analysis on Sandstone under Coupling Effect of Freeze–Thaw and Acidic Treatment: From Nuclear Magnetic Resonance Perspective. Appl. Sci. 2020, 10, 5699. [Google Scholar] [CrossRef]
- Deng, H.; Tian, G.; Yu, S.; Zhang, J.; Zhong, Z.; Zhang, Y. Research on Strength Prediction Model of Sand-Like Material Based on Nuclear Magnetic Resonance and Fractal Theory. Appl. Sci. 2020, 10, 6601. [Google Scholar] [CrossRef]
- Jian, K.; Zhao, M.; Zhao, Y. Random Non-homogeneous thermal elastic mechanics model and numerical tests on thermal cracking threshold of rock. Chin. J. Rock Mech. Eng. 2004, 23, 2331–2335. [Google Scholar]
- Zhang, J.; Deng, H.; Liu, T.; Tian, G.; Tang, L. Study on Microstructural Evolution of Marble Under Cyclic Dynamic Impact Based on NMR. IEEE Access 2019, 7, 138043–138055. [Google Scholar]
- Zhang, J.; Deng, J.; Deng, H.; Gao, R. Fractal Analysis of Pore Structure Development of Sandstone: A Nuclear Magnetic Resonance Investigation. IEEE Access 2019, 7, 47282–47293. [Google Scholar] [CrossRef]
- Yan, J.; Wen, D.; Li, Z.; Geng, B.; Cai, J.; Liang, Q.; Yan, Y. The quantitative evaluation method of low permeable sandstone pore structure based on nuclear magnetic resonance (NMR) logging. Chin. J. Geophys. 2016, 59, 1543–1552. [Google Scholar]
- Liang, Z.; Rao, J.; Huang, P.; Chen, J.; Liu, D.; Xie, C. Experimental Study on the Effect of Fracture Inclination on the Strength of Argillaceous Dolomite. Sci. Technol. Eng. 2019, 19, 305–312. [Google Scholar]


| Components | 3Ca.SiO2 | 2Ca.SiO2 | 3Cao.Al2O3 | 4Cao.Al2O3.MgO |
|---|---|---|---|---|
| Content | 52.8% | 20.7% | 11.5% | 8.8% |
| Material Type | Appearance | Main Ingredient | Particle Size | Density |
|---|---|---|---|---|
| River sand | Light yellow particle | 98.5% Quatz, 1.5% Mud | 0.5–1.0 mm | 1.83 g/cm3 |
| Silicon powder | White powder | 99.9% SiO2 | 1 μm | 2.4 g/cm3 |
| Naphthalene water reducer | Yellow powder | β-Naphthal-enesulfonate sodium formaldehyde condensate |
| Material | Density (g/cm3) | UCS (MPa) | UTS (MPa) | P Wave Speed (m/s) | Porosity (%) |
|---|---|---|---|---|---|
| Rock-like material | 2.23 | 32.01 | 3.26 | 4078.35 | 3.186 |
| Prototype sandstone | 2.31 | 33.64 | 2.99 | 4116.27 | 3.431 |
Publisher’s Note: MDPI stays neutral with regard to jurisdictional claims in published maps and institutional affiliations. |
© 2021 by the authors. Licensee MDPI, Basel, Switzerland. This article is an open access article distributed under the terms and conditions of the Creative Commons Attribution (CC BY) license (https://creativecommons.org/licenses/by/4.0/).
Share and Cite
Yu, S.; Ke, Y.; Deng, H.; Tian, G.; Deng, J. Experimental Investigation of Porous and Mechanical Characteristics of Single-Crack Rock-like Material under Freeze-Thaw Weathering. Minerals 2021, 11, 1318. https://doi.org/10.3390/min11121318
Yu S, Ke Y, Deng H, Tian G, Deng J. Experimental Investigation of Porous and Mechanical Characteristics of Single-Crack Rock-like Material under Freeze-Thaw Weathering. Minerals. 2021; 11(12):1318. https://doi.org/10.3390/min11121318
Chicago/Turabian StyleYu, Songtao, Yuxian Ke, Hongwei Deng, Guanglin Tian, and Junren Deng. 2021. "Experimental Investigation of Porous and Mechanical Characteristics of Single-Crack Rock-like Material under Freeze-Thaw Weathering" Minerals 11, no. 12: 1318. https://doi.org/10.3390/min11121318
APA StyleYu, S., Ke, Y., Deng, H., Tian, G., & Deng, J. (2021). Experimental Investigation of Porous and Mechanical Characteristics of Single-Crack Rock-like Material under Freeze-Thaw Weathering. Minerals, 11(12), 1318. https://doi.org/10.3390/min11121318