Abstract
Environmentally friendly pretreatment of double refractory gold ores (DRGO) to improve gold recovery without emitting pollutant gas is challenging. Sequential biotreatment, including iron-oxidizing microorganisms to decompose sulfides, followed by the enzymatic decomposition of carbonaceous matter, was recently developed. The effect of acid washing by 1 M HCl for 24 h between two bioprocesses was evaluated using a real double refractory gold ore from the Syama mines, Mali, which includes 24 g/t of Au and 5.27 wt% of carbon with a relatively higher graphitic degree. The addition of the acid washing process significantly improved gold recovery by cyanidation to yield to 84.9 ± 0.7% from 64.4 ± 9.2% (n = 2). The positive effects of acid washing can be explained by chemical alteration of carbonaceous matter to facilitate the accessibility for lignin peroxidase (LiP) and manganese peroxidase (MnP) in cell-free spent medium (CFSM), although the agglomeration was enhanced by an acid attack to structural Fe(III) in clay minerals. Sequential treatment of DRGO basically consists of the oxidative dissolution of sulfides and the degradation of carbonaceous matter prior to the extraction of gold; however, the details should be modified depending on the elemental and mineralogical compositions and the graphitic degree of carbonaceous matter.
1. Introduction
Double refractory gold ores are distributed all over the world, for example, the Prestea and Bogoso goldfield in Ghana, the Syama mine in Mali, the Sao Bento Mineracao in Brazil, the Carlin Gold Mine of Nevada, the California motherlode, and the Pogo mine of Alaska in the USA, the Kerr Addison Mines in Canada, the Bakyrchik mine in Kazakhstan, the Natalkinsk in Russia, and the Ratatotok district, North Sulawesi in Indonesia [1,2,3,4,5,6], which include relatively high contents of gold. However, they are not commercially developed to recover gold due to the presence of very fine carbonaceous matter particles (5–8 wt%) that can adsorb Au(CN)2− during cyanidation, causing a significant gold recovery loss. This detrimental phenomenon is well known as preg-robbing and generally leads to financial losses in the mining industry. The sulfide minerals, specifically pyrite and arsenopyrite, tend to occur in ores that have a significant amount of gold enclosed in them compared to other minerals and the gold confined in sulfides. Therefore, they are classified to double refractory gold ores (DRGO), as they contain sulfide minerals as a matrix of gold grains as well as carbonaceous matter. Such a type of refractory gold ore occupies one-third of all types of gold ores [7]. DRGO is generally subjected to flotation to recover a sulfide concentrate, which is then sent for pretreatment prior to cyanidation. However, carbonaceous matter is not well separated from sulfide minerals, so carbonaceous matter generally remains in the flotation concentrate [8]. It is no exaggeration to say that there is a global need for technological development to improve the gold recovery from DRGO [9].
The pretreatment of carbonaceous matter and sulfides in DRGO to minimize preg-robbing and liberate gold has changed over time to become more environmentally friendly. In the past, thermal oxidation of DRGO was applied to decompose carbonaceous matter and convert sulfide minerals to iron oxides at the same time. However, the control of the roasting temperature is very important, but difficult, because there is incomplete sulfide oxidation at ≤500 °C and the removal of volatile matter and the decarboxylation in the carbonaceous matter occur at 100–300 °C and 400–500 °C, respectively [10]. In such a case, there is an incomplete liberation of gold from sulfides, and the carbonaceous matter becomes a more activate adsorbent, resulting in a higher preg-robbing ability during cyanidation. Furthermore, the generation of harmful gases such as SOx and As2O3 is currently not acceptable, making this process no longer attractive. Nonetheless, there are recent advances in using gas-scrubbing techniques so that the environmental concerns have been reduced [11].
To replace thermal oxidation, biological (BIOX) and pressure oxidation have been applied to remove sulfides from DRGO, but these processes have a minimal effect on the carbonaceous matter [12]. After the sulfide oxidation, the carbonaceous matter-containing residue can either undergo a treatment such as roasting or blinding to minimize preg-robbing before gold recovery [13]. However, the roasting of the BIOX or pressure oxidation residue come with the same problems as alluded to before. The blinding of the carbonaceous matter leads to the transfer of blinding reagents such as kerosene and diesel oil on to the activated carbon used for Au(CN)2− recovery from the carbon-in-leach (CIL) or carbon-in-pulp (CIP) process.
A newly alternative carbonaceous matter treatment has been proposed to use lignin-degrading enzymes released by fungi and/or bacteria [14,15,16,17,18]. They are more prevalent in white-rot and brown-rot fungi, and have been isolated from some of the fungi responsible for the oxidation of lignin and a very complex polyaromatic polymer [19]. These lignin-degrading enzymes include lignin peroxidase (LiP), manganese peroxidase (MnP), laccase (Lcc), and versatile peroxidase (VP) [20]. These enzymes accelerate the oxidative degradation of C=C and C=O bonds. These enzymes were selected because lignin is a precursor for the carbonaceous matter in DRGO, and it was expected that the lignin-degrading enzymes could successfully attack and oxidize this substance. The lignin-degrading enzyme treatment proceeds under very mild temperature and pH conditions, and therefore, it has a low environmental impact [21]. Several studies have shown that using lignin-degrading enzymes produced by fungi such as Phanerochaete chrysosporium can increase gold recovery by 10–20% [22,23].
To this end, previous research [23] used cell-free spent medium (CFSM) of P. chrysosporium for carbonaceous matter degradation in DRGO. During enzymatic reaction, the agglomerates electrostatically bound clay minerals and degraded organic products such as humic substances were formed through Fe3+ ions, where agglomeration might re-encapsulate tiny gold grains, leading to the recovery loss. To improve the gold recovery from DRGO, the modification of the sequential biotreatment was investigated by adding acid washing after biooxidation of sulfides in the present work.
2. Materials and Methods
2.1. DRGO Characterization and Preparation
The double refractory gold ore (DRGO) used in this work was a part of the flotation concentrate obtained from the Syama mine in Mali, West Africa. Elemental compositions of DRGO were determined by X-ray fluorescence (XRF) spectroscopy (Rigaku, ZSX Primus II, Akishima, Japan) and CHN analysis (Yanaco CHN MT-5, Kyoto, Japan). The XRF analysis showed that the major elemental compositions of the DRGO are 6.1 wt% S, 15.7 wt% Si, 2.0 wt% K, and 13.4 wt% Fe, 1.0 wt% Na, 1.7 wt% Mg, 3.1 wt% Ca, 0.6 wt% Ti, and 56.5 wt%, whereby K is the potential for the formation of jarosite which may hinder gold recovery through cyanide consumption [24] and gold grains re-encapsulation [25]. CHN analysis revealed carbon content of 5.27 wt%, which may include both organic and inorganic forms. Gold content was determined by the fire assay to be 24 g/t. Mineral liberation analysis (MLA) was carried out by FEI MLA 650 FEG (FEI, Hillsboro, OR, USA) to observe the location of gold grains. Detailed characterization of Au in DRGO from the Syama mine was explored by MLA observation (Figure S1a). Localization of Au is classified into three categories of Au and Au-bearing grains: (a) liberated Au, (b) exposed Au, and (c) enclosed Au. Liberated Au is the most accessible grain for cyanide to extract, while the other two types of Au-bearing grains are primarily associated with pyrite, silicate, and arsenopyrite. The distribution of Au liberation and association with other minerals can be depicted (Figure S1b); that is, Au grains are often associated with sulfides. Concerning MLA observation, this finding can infer that the present sample belongs to refractory gold ores due to its association with gangue and partial interlocking in sulfides.
Mineralogical compositions were determined by XRD (Rigaku Ultima IV, Akishima, Japan), using Cu Kα radiation, 40 kV, 40 mA, and a scanning speed of 2° min−1. The original DRGO includes pyrite, quartz, muscovite, albite, magnesite, and dolomite as crystal phases, confirmed by XRD (Figure S2).
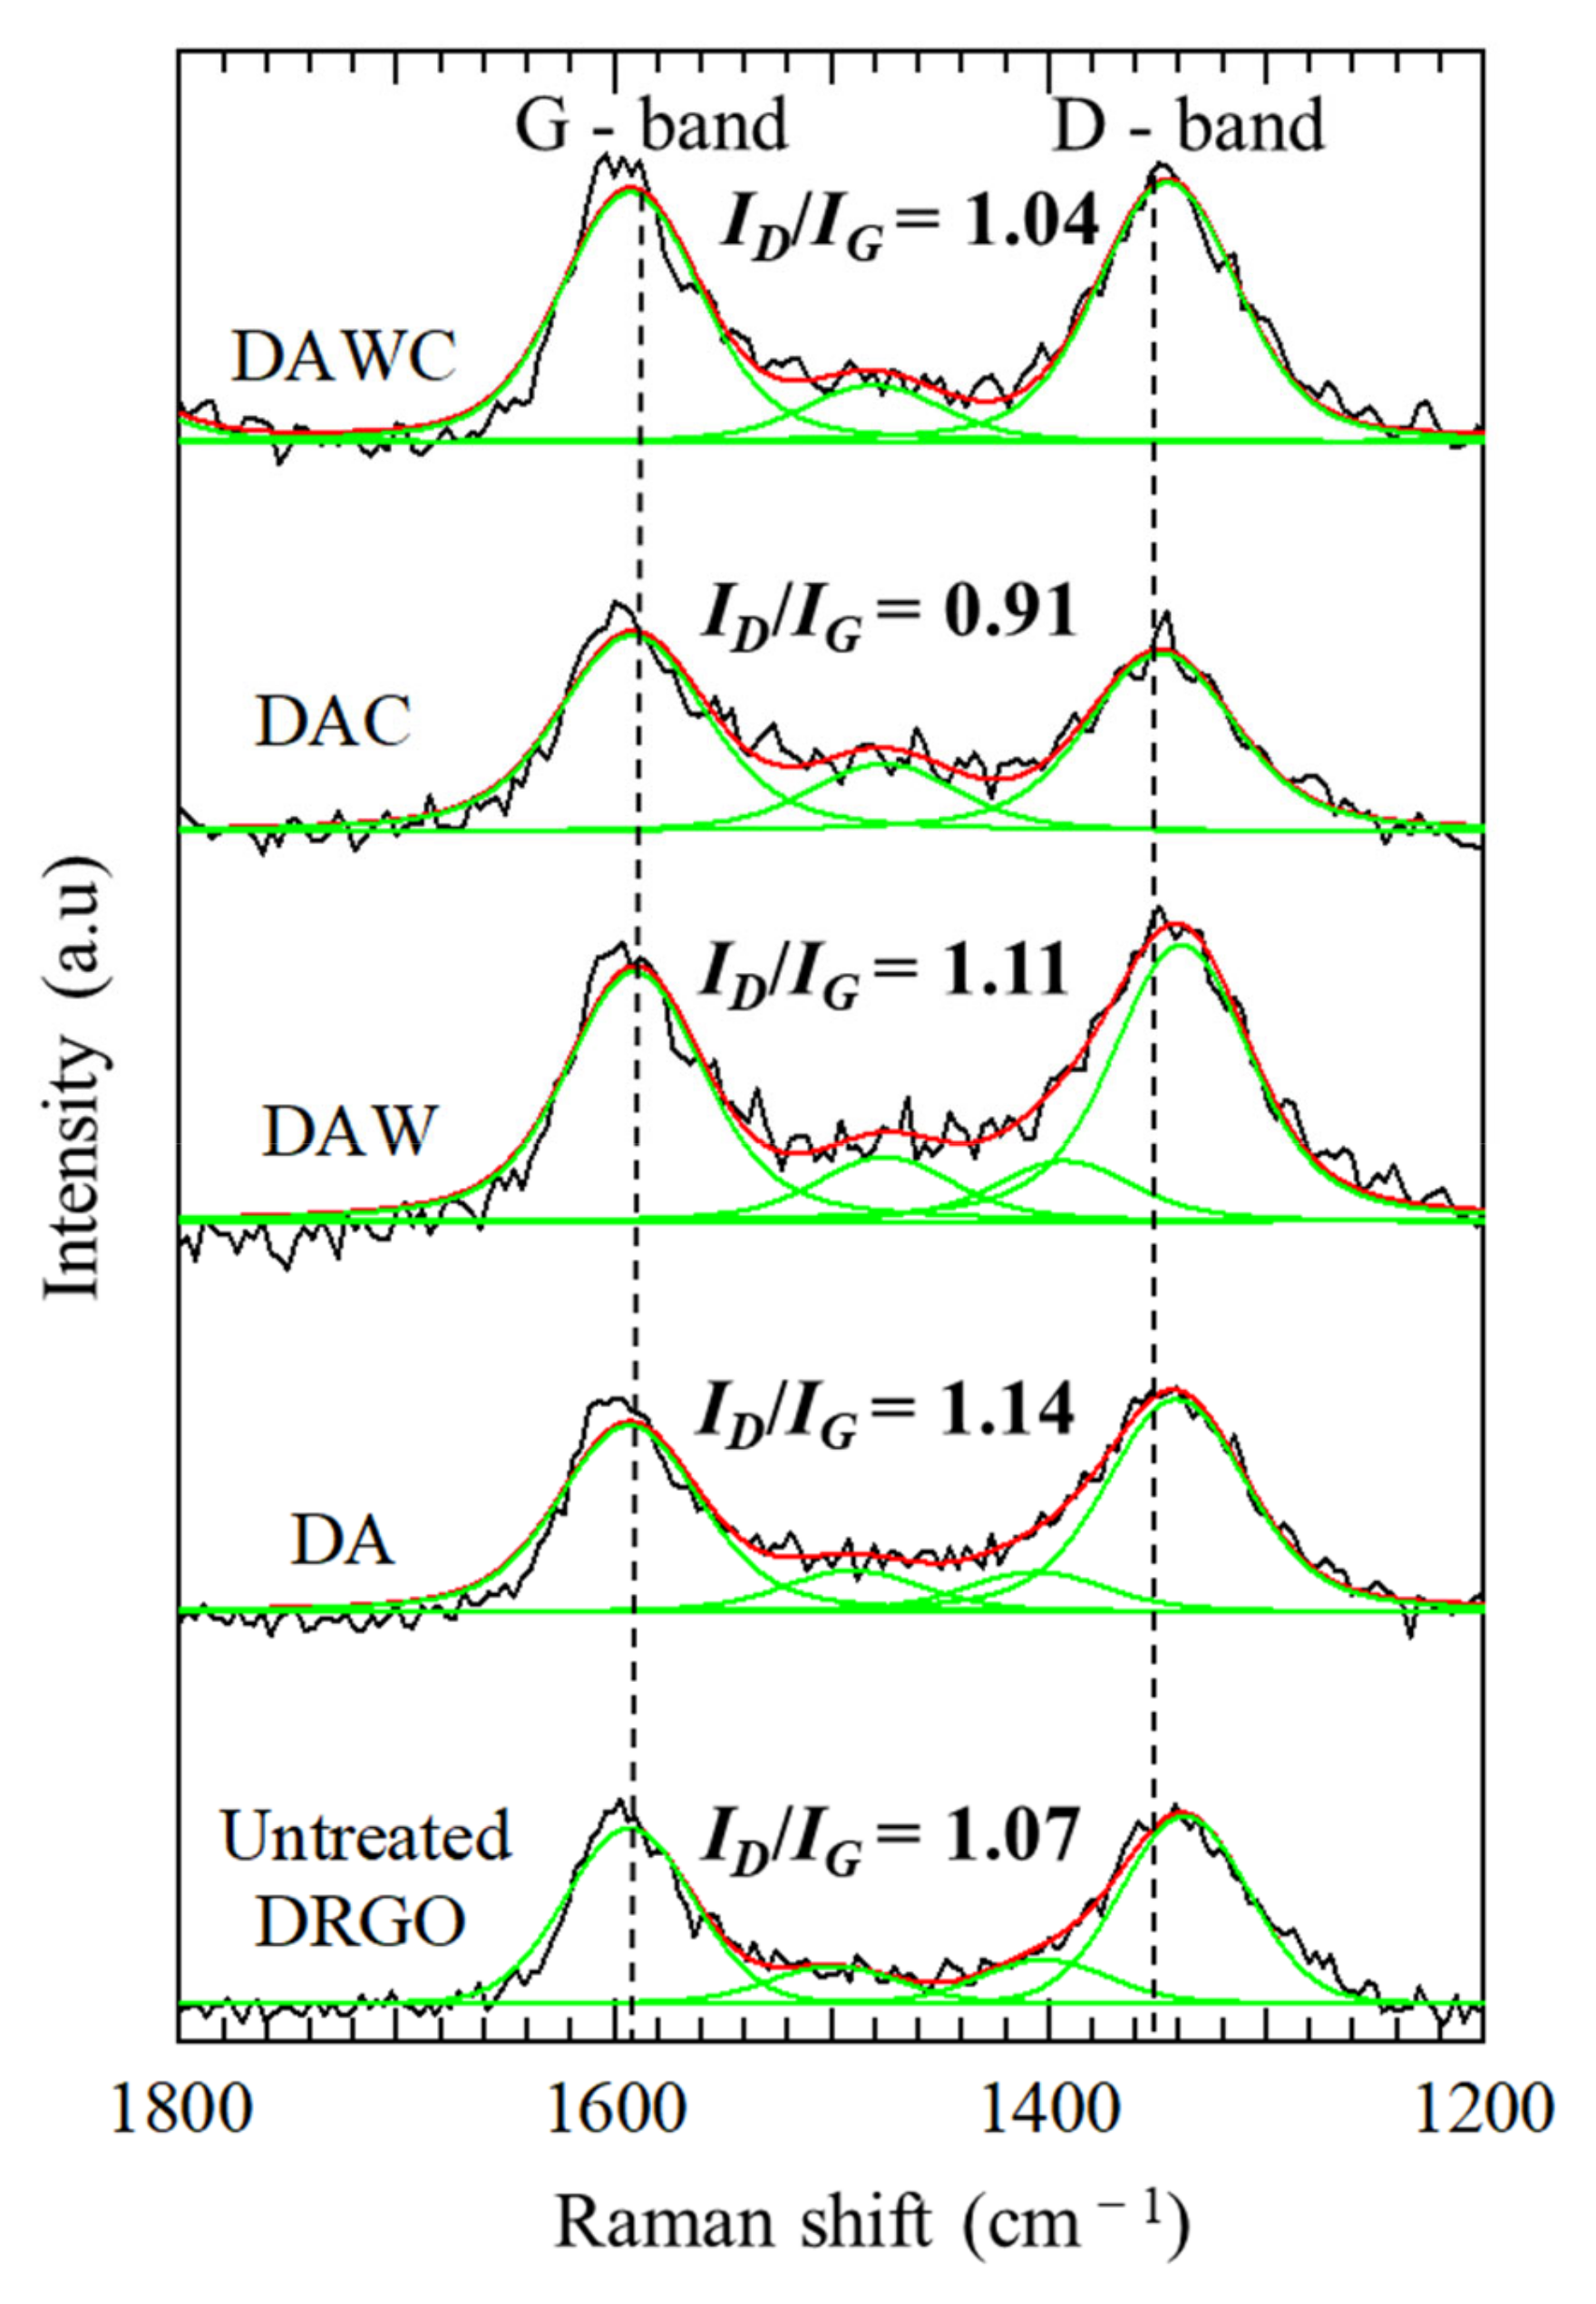
The index of the graphitic degree of carbonaceous matter in DRGO can be evaluated by Raman spectroscopy, using the relative intensities of defective carbon (D) with graphitic carbon (G), ID/IG. Raman spectrum in a region from 1800 to 1200 cm−1 is frequently used to interpret the completeness of sp2 orbital of aromatic carbon in graphite [26]. Raman spectra for the DRGO samples were collected by Thermo Fischer Scientific (Waltham, MA, USA) DXR Smart Raman (532 nm, 10 mW). Figure 1 shows comparison of Raman spectra of DRGO used in the present study (Syama mine, Mali) with those used in the previous studies, which are the DRGO from Pogo, USA [27], and Bogoso, Ghana [23]. All of the samples showed two distinguishable bands at 1350 cm−1 and 1585 cm−1, as well as one small band around 1500 cm−1. The band around 1350 cm−1 is assigned to the defected carbon (D-band), while the band at 1585 cm−1 is assigned to the graphitic carbon (G-band) [28,29]. The relative intensity of the D-band and G-band (ID/IG) was calculated after peak separation for each spectrum to observe the characteristic of each sample. Compared with DRGO from Bogoso and Pogo, the DRGO from the Syama mine had the lowest ID/IG, indicating that the DRGO from the Syama mine has the highest graphitic degree among the three DRGOs. Graphitic carbon is more difficult to decompose and tends to adsorb the gold cyanide complex during the extraction of gold than defective carbon, and thus, it decreases the gold recovery [8].
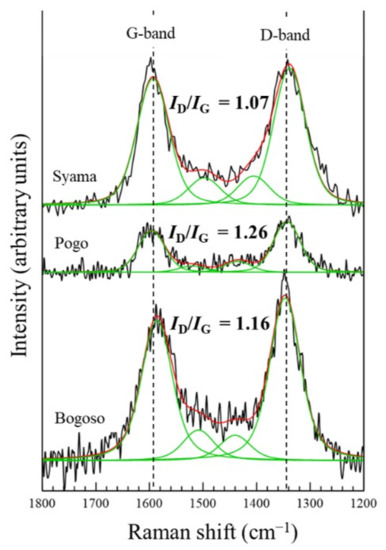
Figure 1.
Raman spectra for the DRGOs from the Syama (Mali), Pogo (USA), and Bogoso (Ghana) mines, showing the different relative intensities of ID/IG. Original Raman spectra (−), peak fitting (−), and envelop from peak fitting (−).
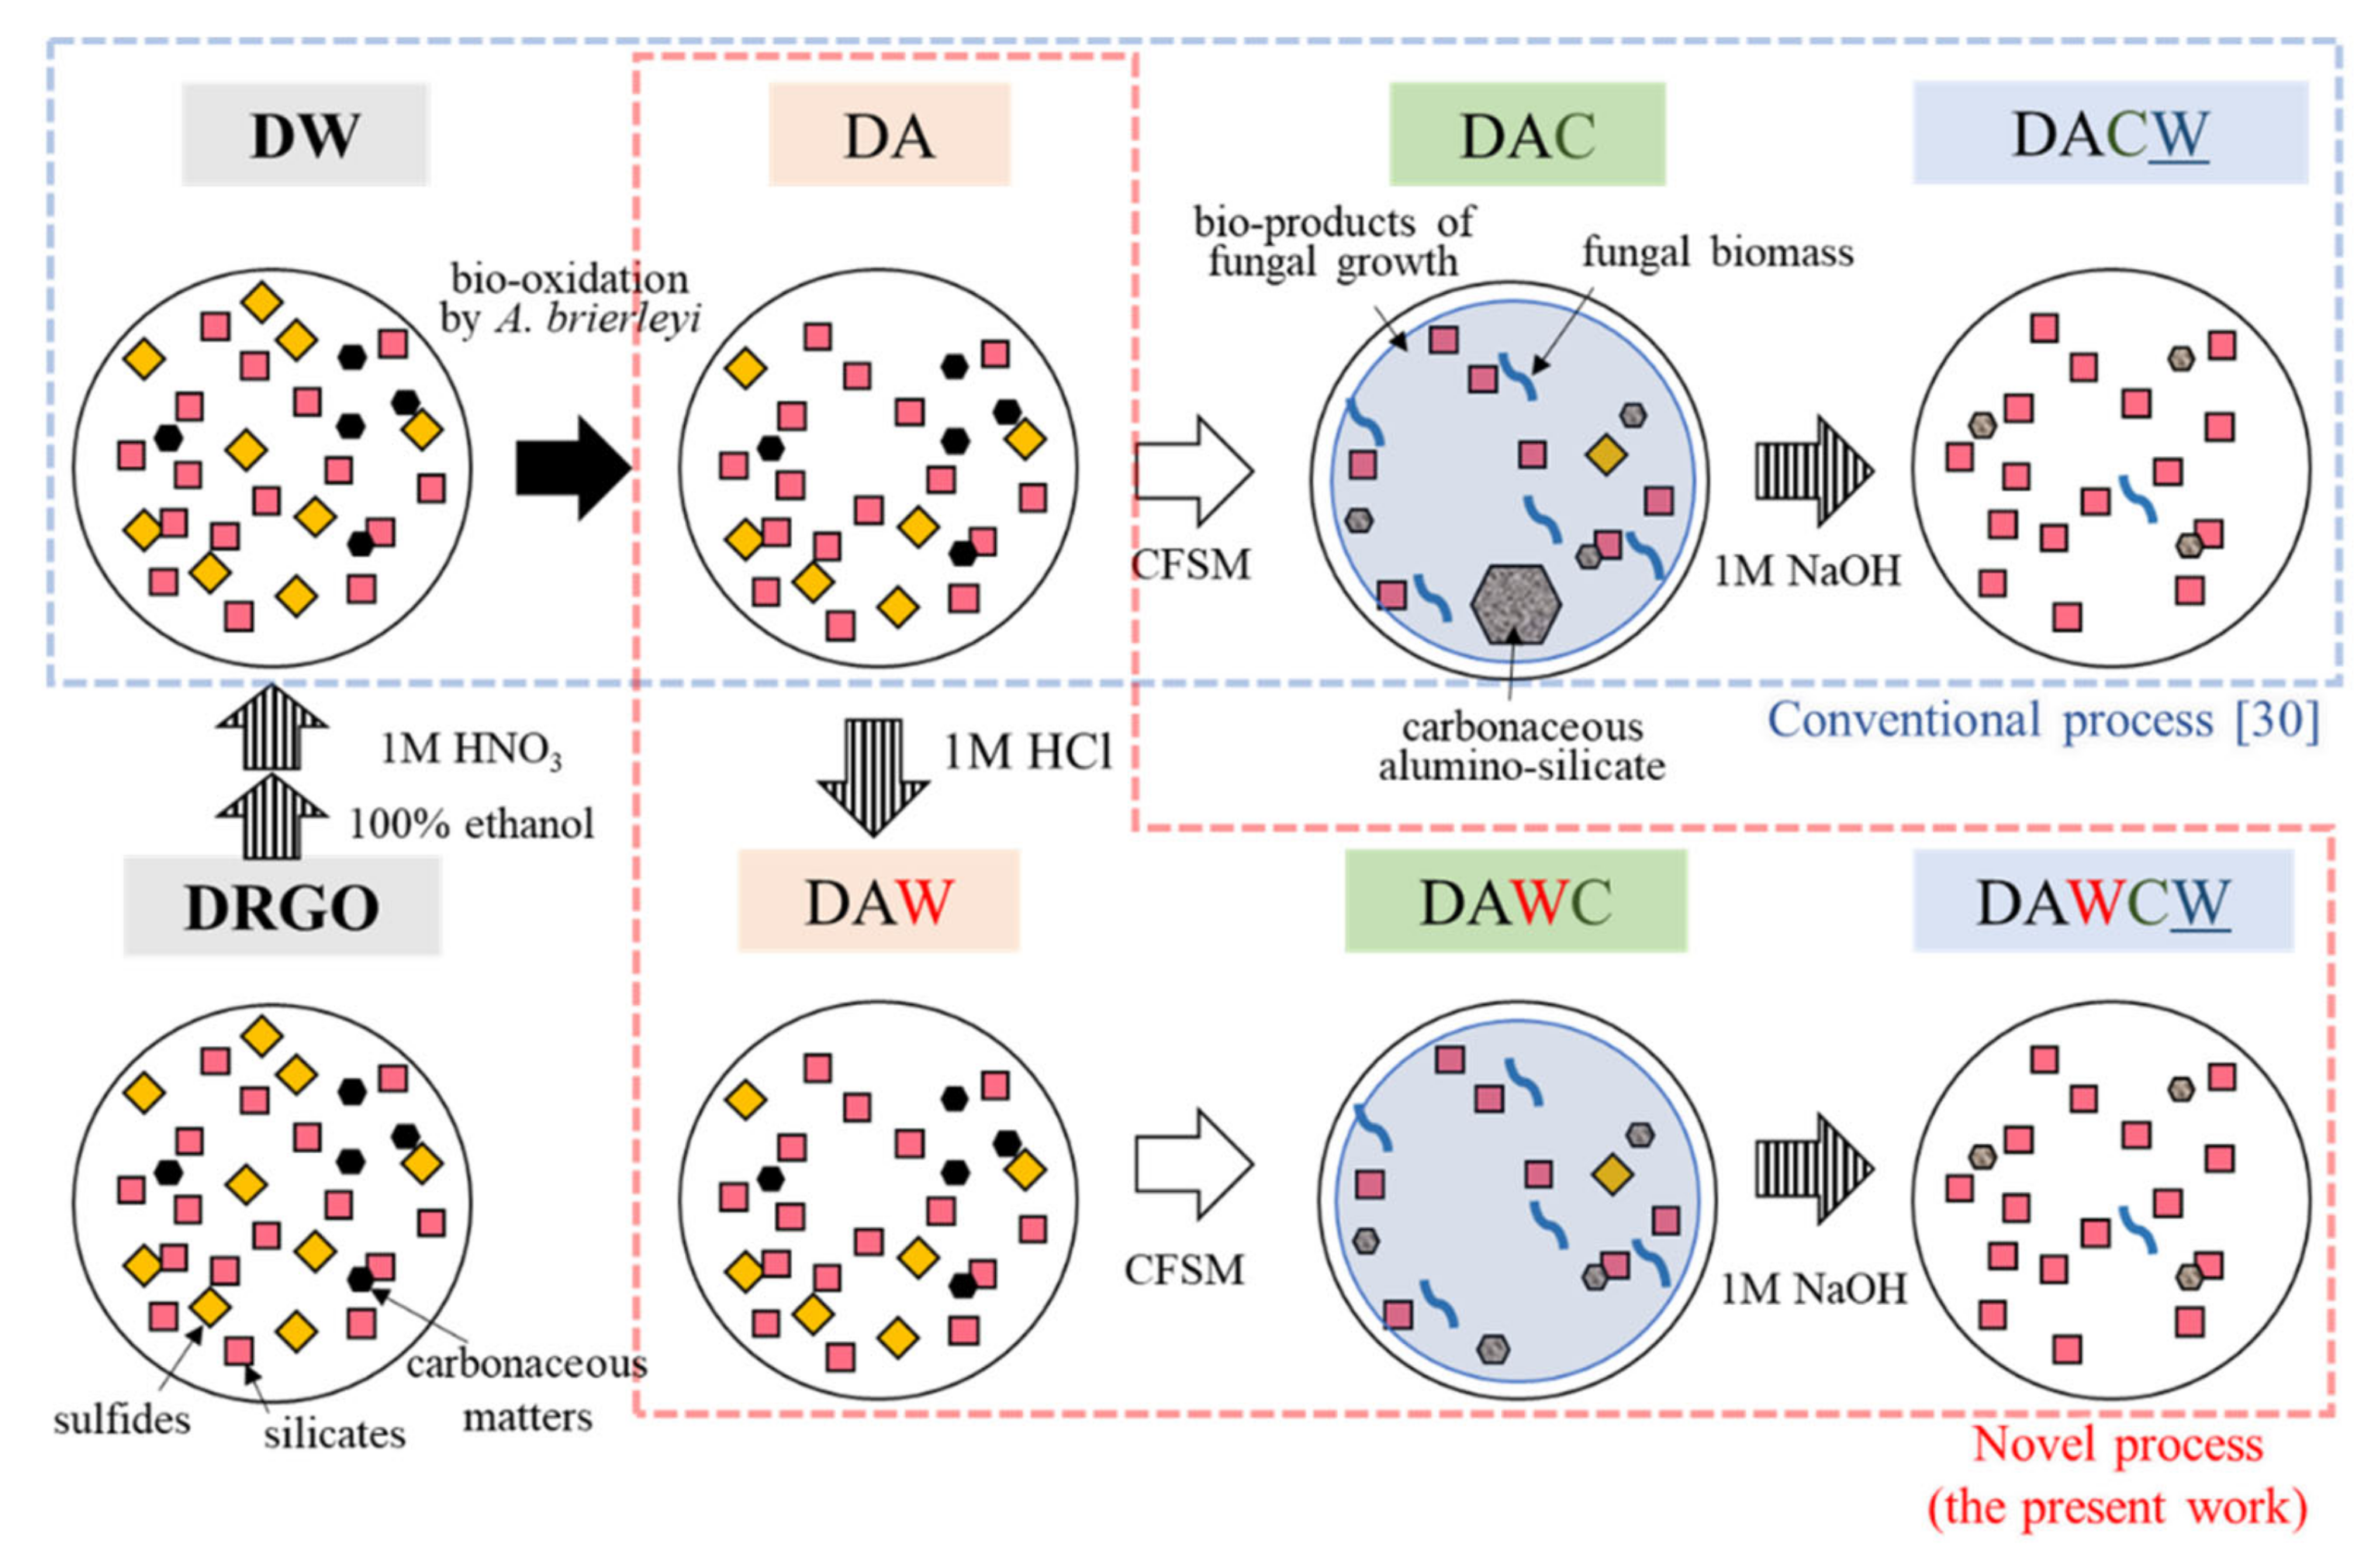
The original DRGO is the flotation concentrate. The initial sample preparation was performed prior to the sequential biotreatments to remove the flotation surfactant which remained on the surface of the ore. First, 100 g of the original DRGO was sequentially washed using 400 mL of pure ethanol, 400 mL of 1 M HNO3, and 500 mL of ultrapure water three times. After washing, the solid was collected by filtration (0.45 µmφ) and dried in a freeze dryer (EYELA, FDU-1200, Tokyo, Japan). This solid residue was named DW and regarded as the starting material for all processes (Figure 2).

Figure 2.
Procedure of a sequential pretreatment for DRGO including acid washing. D, DRGO; A, biooxidation by A. brierleyi; W, washing by 1 M HCl; W, washing by 1 M NaOH; C, CFSM treatment (cell-free spent medium with P. chrysosporium).
2.2. Microbiologically Oxidative Dissolution of Sulfides
Based on the MLA observation (Figure S1b), around 15% of gold grains is enclosed in sulfides. To liberate the gold grains, sulfides were oxidatively dissolved by an iron-oxidizing archaeon. Acidianus brierleyi (DSMZ 1651) was cultivated in a 500 mL-flask containing 200 mL culture medium consisting of 4 mL of ABS medium (25 g MgSO4⋅7H2O; 22.5 g (NH4)2SO4; 7.5 g Na2SO4⋅10H2O; 2.5 g KCl; 2.5 g KH2PO4; and 0.7 g Ca(NO3)2⋅4H2O per Liter at pH 1.5 with 1 M H2SO4) and 0.2 mL of trace elements (10 g ZnSO4⋅7H2O; 1.09 g MnSO4⋅5H2O; 1 g CuSO4⋅5H2O; 1 g CoSO4⋅7H2O; 1 g NiSO4⋅6H2O; 0.6 g H3BO3; 0.51 g Na2SeO4; 0.5 g Na2MoO4⋅2H2O; 0.39 g Cr2(SO4)3⋅7H2O; 0.1 g NaVO3; 0.1 g Na2WO4⋅2H2O), as well as 0.04% yeast extract as the source of energy, then added with pure water to 200 mL. The medium, flasks, and DW were sterilized using an autoclave at 120 °C for 20 min. The pH was adjusted to 1.5 using 1 M H2SO4, and then the A. brierleyi was inoculated. The culture was incubated at 70 °C and 150 rpm in a shaker. These conditions were maintained throughout the A. brierleyi treatment. Initially, the A. brierleyi culture was adapted to the 2.00 g DW and 10 mM FeSO4⋅7H2O in a 200 mL of above solution. This inoculation took place for 5 days. The cells were separated by two times of centrifugation at 4 °C and 2000 rpm for 5 min, followed by at 4 °C and 10,000 rpm for 15 min. The cells were re-suspended in sterilized acidic water at pH 1.5 for further inoculation for biooxidation.
The biooxidation was performed as follows. A total of 16.00 g DW (pulp density 2 w/v) was added to solution consisted of 16 mL of ABS medium, 0.8 mL of trace elements, and pure water was added to reach a volume of 760 mL at pH 1.4. The FeSO4⋅7H2O solution was sterilized by filtration using a 0.20 µmφ membrane filter, and then mixed with the sterilized above medium, resulting in the final Fe2+ concentration of 5 mM, which is the energy source for A. brierleyi. The precultured A. brierleyi was inoculated to the Fe2+ containing medium to achieve the initial cell density of 107 cell/mL. The culture condition was maintained at 70 °C and 150 rpm in a shaker. The supernatant was taken at time intervals to monitor pH, Eh vs. the standard hydrogen electrode (SHE), total Fe and As concentrations, and cell density. The pH and Eh were determined by electrodes. The dissolved Fe and As concentrations were measured by induced coupled plasma-optical emission spectrometry (ICP-OES, Perkin Elmer Optima 8300, Waltham, MA, USA).
Cell density was counted using microscopic observation. On the day 6, the biooxidation was terminated to prevent the crystal growth of jarosite. The mixture was filtered, and the solid residue was collected, dried overnight, and named DA to provide for XRD and Raman spectroscopy. The sterilized experiment was conducted as a control.
2.3. Acid Washing of the Residues
As a new step to reduce the physically adsorbed Fe3+ ions and jarosite, 1 M HCl washing for DA was introduced into the remodeled sequential treatment (Figure 2). The Fe3+ ions are produced by biooxidation of sulfides. Large amounts of Fe3+ ions may cause an agglomeration with silicate and/or carbonaceous matter, trapping liberated gold particles. The DA was washed with 1 M HCl with the pulp density of 10% for 24 h at 25 ℃ and 500 rpm with a stirrer.
Furthermore, the solid residue after acid washing was also washed with ultrapure water to remove excess acid, then the supernatant was separated to remove by centrifugation at 25 °C and 10,000 rpm for 5 min. The water-washing step was repeated until the pH of the supernatant reached 4.0 that was required for the subsequent enzyme treatment by lignin-degrading enzymes released from a white-rot fungus, Phanerochaete chrysosporium (Section 2.4). The solid residue was collected by filtration and dried in a freeze dryer, then proceeded to fungal treatment and Raman spectroscopy analysis. The solid residue after acid washing was named DAW. As a control, a part of the DA sample went directly through to the next step, which is fungal treatment without acid washing.
2.4. Phanerochaete chrysosporium Cultivation and Enzyme Assay
Following the previous study [30], cultivation of P. chrysosporium was done regularly in a 2 L-flask consisting of 500 mL liquid medium, which contained 10 g glucose, 2 g KH2PO4, 1.18 g succinic acid, 0.5 g MgSO4⋅7H2O, 0.2 g ammonium tartrate, 0.1 g CaCl2⋅2H2O, 25.6 mg 2,6-dimethoxyphenol, 10 mg thiamine hydrochloride per liter, added by 10 mL trace element solution (21 g MgSO4⋅7H2O, 7 g NaCl, 3.5 g MnSO4⋅5H2O, 1.28 g CoCl2⋅6H2O, 1.1 g CuSO4⋅5H2O, 0.7 g ZnSO4⋅7H2O, 70 mg FeSO4⋅7H2O, and 70 mg boric acid per Liter), then adjusted to pH 4 with 1 M NaOH. Both flask and medium were sterilized using an autoclave at 120 °C for 20 min.
A small colony of P. chrysosporium was inoculated to the sterilized medium in the flask, then incubated at 37 °C and 80 rpm in a shaker. After 3 days, the cell-free spent medium (CFSM) was collected by filtration through 0.22 µmφ Stericup® (C3240 Merck, New Jersey, NJ, USA). The enzyme activity of LiP and MnP in CFSM, under the same harvesting conditions like Konadu et al. [30], were 20.6 ± 1.2 and 1.1 ± 0.2 U/L, respectively.
2.5. Degradation of Carbonaceous Matter by Cell-Free Spent Medium (CFSM) of Phanerochaete chrysosporium
The degradation of carbonaceous matter in DA and DAW was carried out to compare the efficiency by applying the supernatant of the CFSM that included lignin-degrading enzymes released from P. chrysosporium. The solid residues after CFSM treatment of DA and DAW were named DAC and DAWC, respectively. First, 25.00 g DA and DAW were sterilized in 2 L flasks using an autoclave at 120 °C and 20 min, then suspended in 500 mL CFSM with the pulp density of 5% in sterilized flasks at pH 4, 30 °C and 125 rpm in a shaker. After 3 days of treatment, the solids were separated by centrifugation at 25 °C and 10,000 rpm for 5 min, then re-suspended by fresh CFSM obtained from separated cultivation. Fresh CFSM was continuously prepared by exchanging the medium of the P. chrysosporium cultivation every 3 days. This process was repeated six times to keep the high enzymatic activities. During CFSM treatment, the pH was maintained around 4, which is optimal for MnP and LiP released by P. chrysosporium [31]. On day 18, the solid residue was collected by filtration and dried overnight in a freeze dryer. Both solid residues after carbonaceous matter degradation processes (DAC and DAWC) were provided for Raman spectroscopy to observe the chemical changes of C-C bonds in carbonaceous matter before and after enzyme treatments.
2.6. Alkaline Washing of the Residues
Alkaline washing after CFSM treatment was aimed to dissolve the partially degraded carbonaceous matter (humic-like substances) and decompose C-Si-Al agglomerates composed of Fe3+, humic substances, and clay minerals, which may encapsulate gold grains, to maximize the gold recovery. A total of 22 g of both solid residues after carbonaceous matter degradation (DAC, DAWC) was alkaline-washed with 467.5 mL of 1 M NaOH for 24 h at 25 °C and 150 rpm with the pulp density of 4.7%. After 24 h, the solid-liquid separation was conducted by filtration (0.45 µmφ) and solid residues were dried in a freeze dryer, then named DACW and DAWCW for DAC and DAWC, respectively. Both liquid residues were collected to supply for 3D fluorescence spectrometry (JASCO, FP-6600DS, Hachioji, Japan) to detect the characteristic peaks of soluble polyaromatic carbonaceous matter depending on molecular weights under the alkaline condition.
2.7. Gold Recovery
Gold recovery was evaluated by cyanidation for all solid samples in the above sequential biotreatment (Figure 2). In the cyanidation process, 0.200 g of each sample was suspended in 4 mL of 2.5 mM KCN to extract gold at pH 12, room temperature, and 134 rpm in a shaker. After 24 h, both the solid and liquid residue were separated by filtration (0.20 µmφ). The extractant was provided to determine the dissolved gold concentration (A) by induced coupled plasma-mass spectrometry (ICP-MS, Agilent 7500c, Santa Clara, CA, USA).
Total gold content for each solid residue was quantified after acid digestion. A total of 0.100 g of the solid residues of the cyanidation were roasted for 4 h at 800 °C in a furnace, and then digested by adding the mixed acid containing 3 mL concentrated HF (48%), 3 mL HNO3 (60%), and 9 mL HCl (36%). The digestion was conducted in autoclave vessels overnight, followed by heating at 150 °C for 2 h in an oven. After cooling down, the liquid was evaporated on a hotplate at 120 °C for 12 h to remove HF. A total of 10 mL of 0.1 M HNO3 was added to dissolve the residual salts completely. The solutions were supplied to determine the remaining Au concentrations in the solid residue after cyanidation using ICP-MS. The gold recovery of each solid residue was calculated by Equation (1) using the extracted gold concentration by cyanidation (A) and remaining gold concentration on the solid by acid digestion (B):
Au recovery (%) = (A)/((A) + (B)) × 100
2.8. Characterization of the Solid Residues in Sequential Biotreatment
All solid residues were characterized by XRD, Thermogravimetry differential thermal analysis (TG-DTA, Bruker 2000SA, Billerica, MA, USA), XRF, CHN, and particle size distribution (HORIBA, Partica LA-950, Kyoto, Japan) for the evaluation of each treatment. For the data analysis of XRF results, the content of each element was normalized for Si content to observe the compositional change in each step, assuming that silicate minerals are non-reactive in the sequential biotreatments.
3. Results and Discussion
3.1. DW Preparation
The XRD patterns (Figure S2) showed that the washed DRGO (DW) no longer contained magnesite (MgCO3) and dolomite (CaMg(CO3)2), suggesting that these gangue minerals were dissolved by 1 M HNO3 washing [32]. This is meaningful to adjust the pH for the following bioprocess, when the ore sample includes carbonates. Thus, carbonaceous matter that remained in DW was most likely elemental and/or organic carbon, which has high preg-robbing capacity [33]. This was also confirmed by XRF (Table 1), where the relative intensities of C, O, Mg, and Ca to Si (wt%) decreased. CHN analysis provided more accurate C contents than XRF that DW still contained high C (4.16%), confirming the necessity of the carbonaceous matter degradation process (Table 2).

Table 1.
Elemental compositions of DRGO and the subsequent solid residues determined by XRF in mass% and relative intensity (RI) normalized for Si.
Table 2.
CHN analysis for the original DRGO and the solid residues after each pretreatment shown in Figure 2.
3.2. Biooxidation of Sulfides and HCl Washing
The biooxidation of pyrite under acidic condition was proceeded by the following chain reactions [34]:
2Fe2+ + O2 + 4H+ → 2Fe3+ + 2H2O (biological)
FeS2 + 14Fe3+ + 8H2O → 15Fe2+ + 2SO42− + 16H+ (chemical)
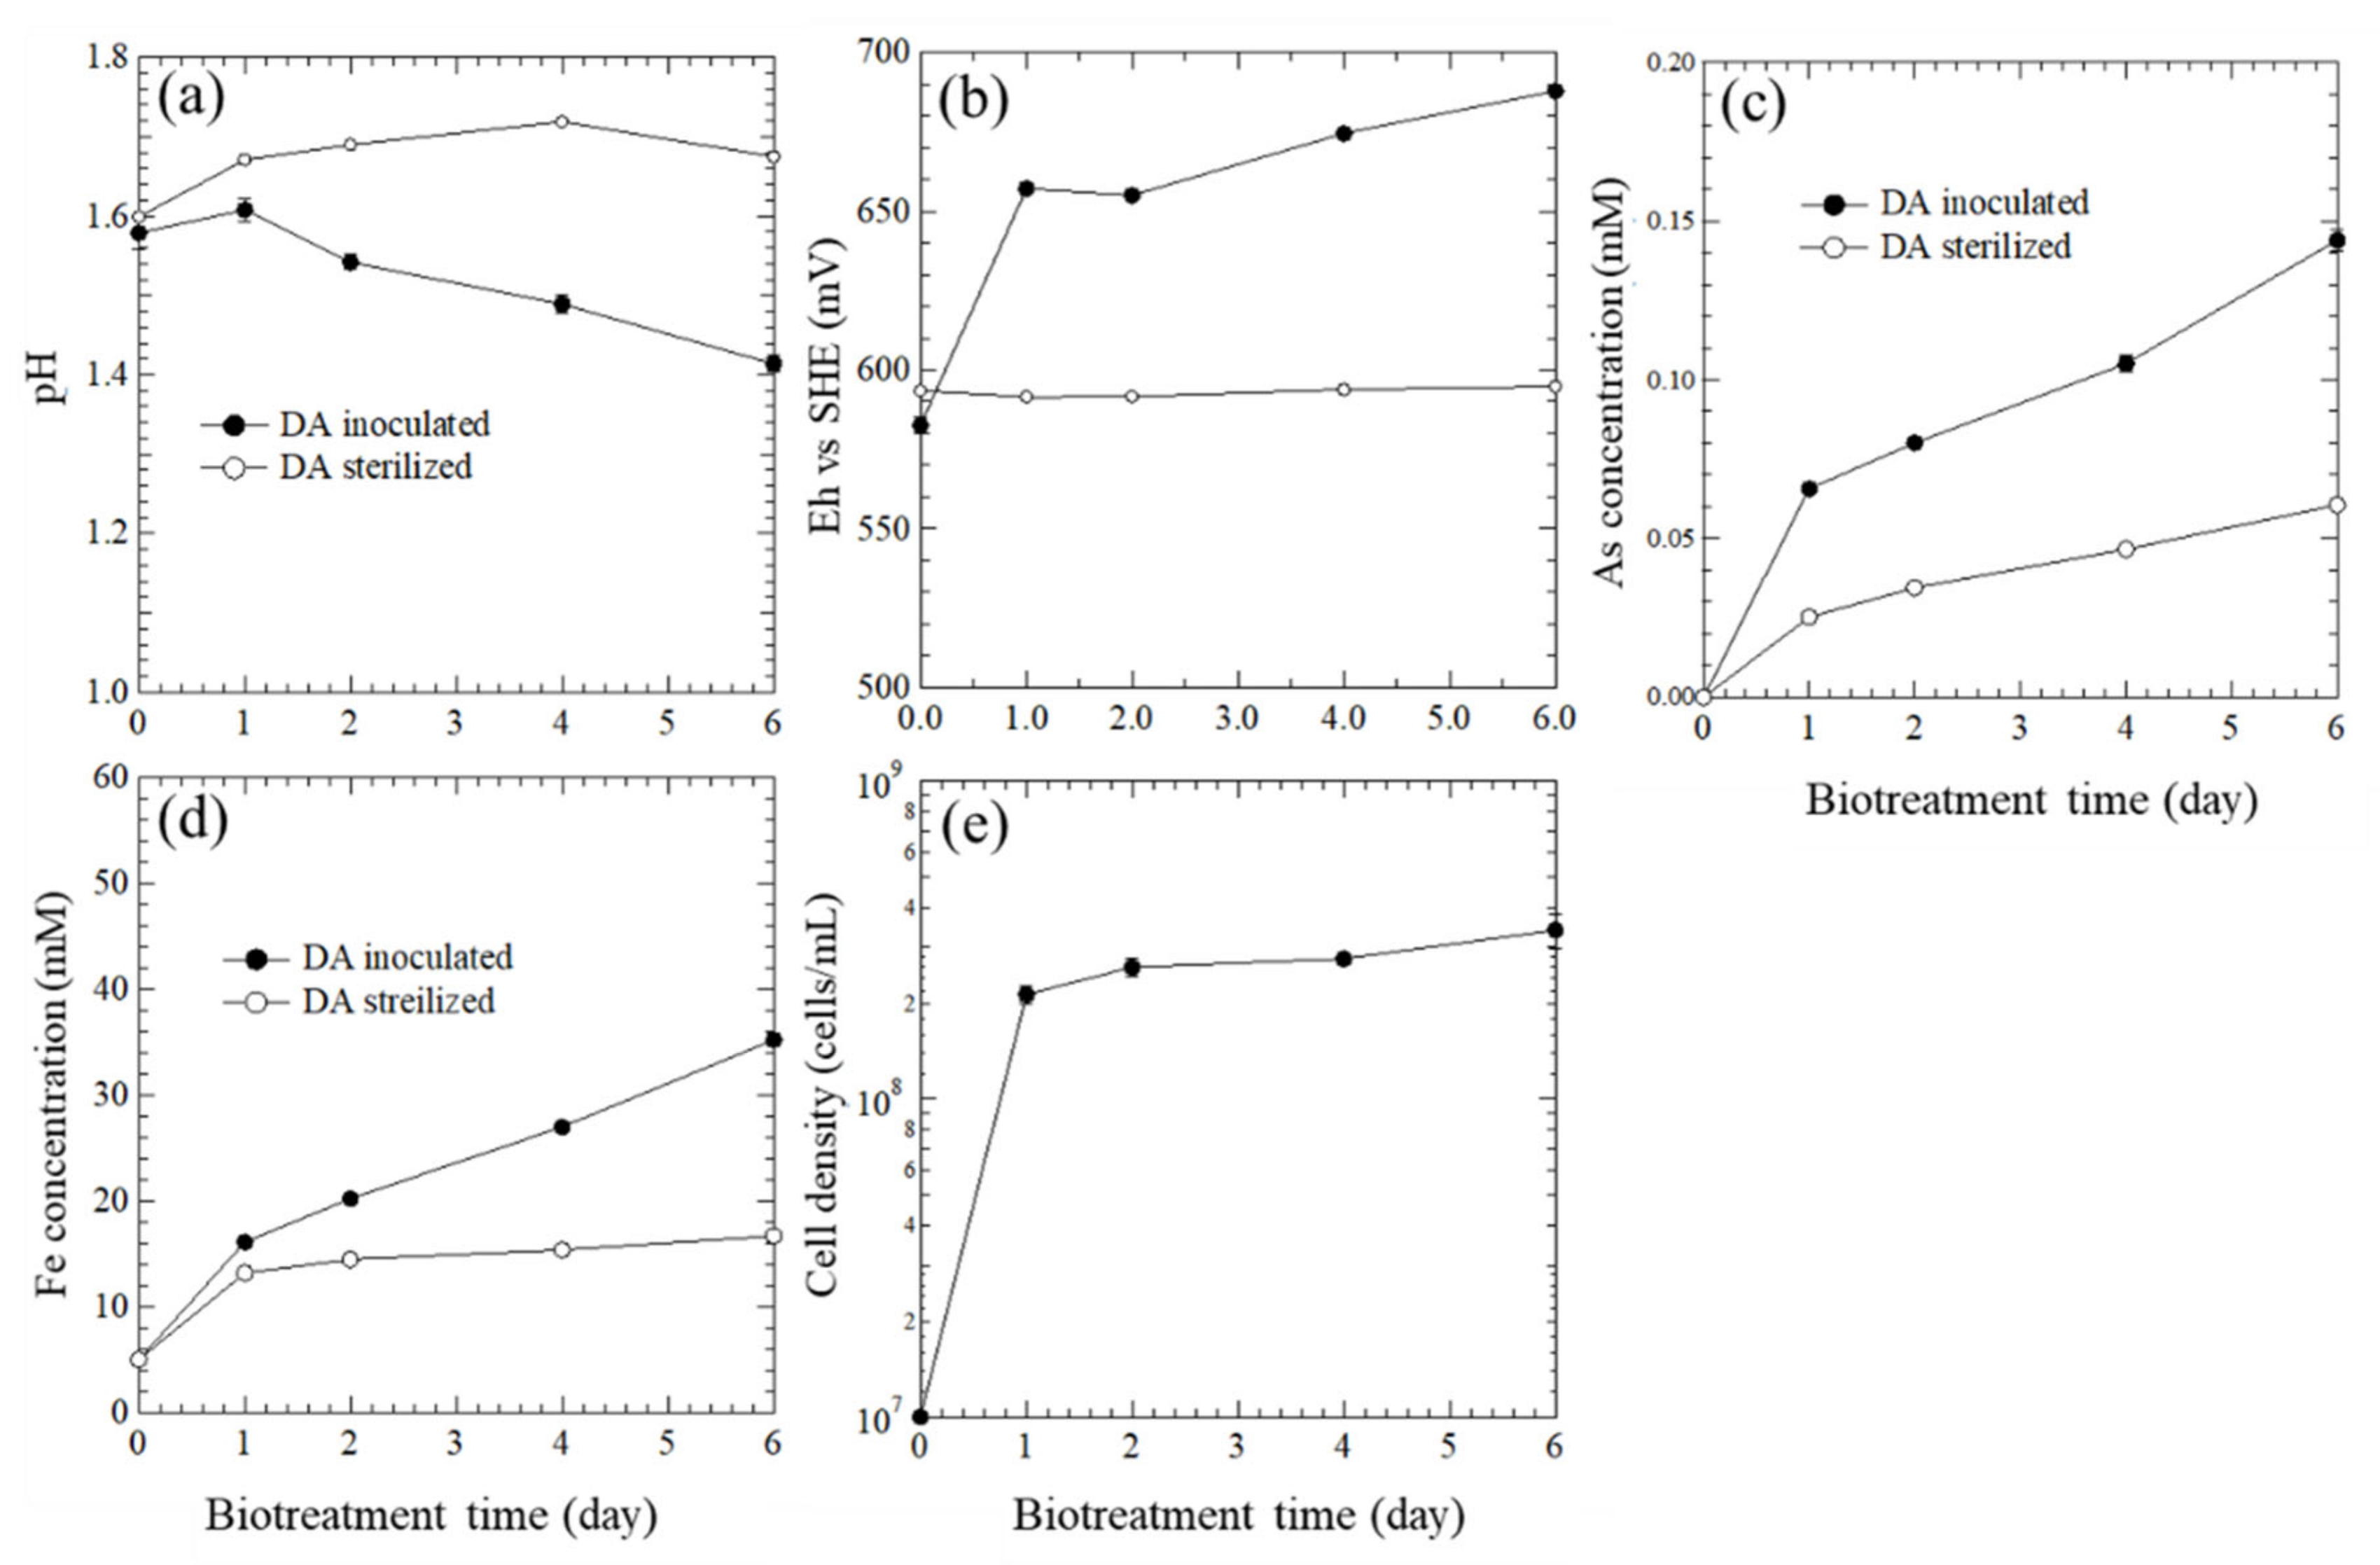
During the oxidation, the pH decreased within 6 days (Figure 3a), confirming the above reaction. The Eh increased significantly within 1 day, then slightly increased until 6 days (Figure 3b). These changes indicate the continuous biological oxidation of Fe2+ to Fe3+ by A. brierleyi (Equation (2)), and the chemical oxidation of pyrite by Fe3+ ions simultaneously (Equation (3)). The total arsenic concentration (Figure 3c) was quite low because of the undetectable XRD peak of arsenopyrite for DW (Figure S2), and the effect of arsenate on the subsequent enzymatic treatment was considered to be negligible.
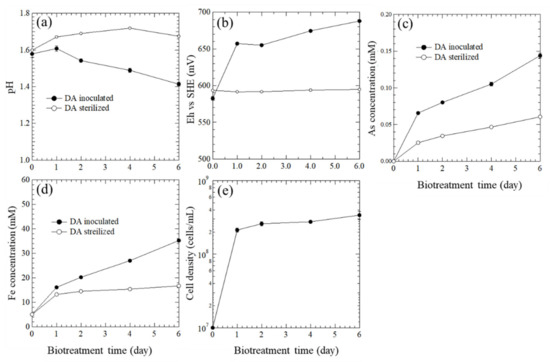
Figure 3.
Changes in (a) pH, (b) Eh (vs SHE), (c) As concentration, (d) Fe concentration, and (e) cell density over time during biooxidation.
The concentration of total Fe (Figure 3d) in the sterile system was increased from 5 mM to 35 mM within 6 days, indicating the dissolution of pyrite was in progress and the gold particles were being liberated. High redox potential in the inoculated system is correlated with cell growth (Figure 3b,e). Although the Fe concentration has not yet reached equilibrium after 6 days, that is, the oxidative decomposition of pyrite has not been sufficiently proceeded, the biooxidation process has been stopped on day 6 to avoid the crystal growth of jarosite. In addition, the complete decomposition of pyrite is not always necessary, since the enclosed type of Au is 15% (Figure S1).
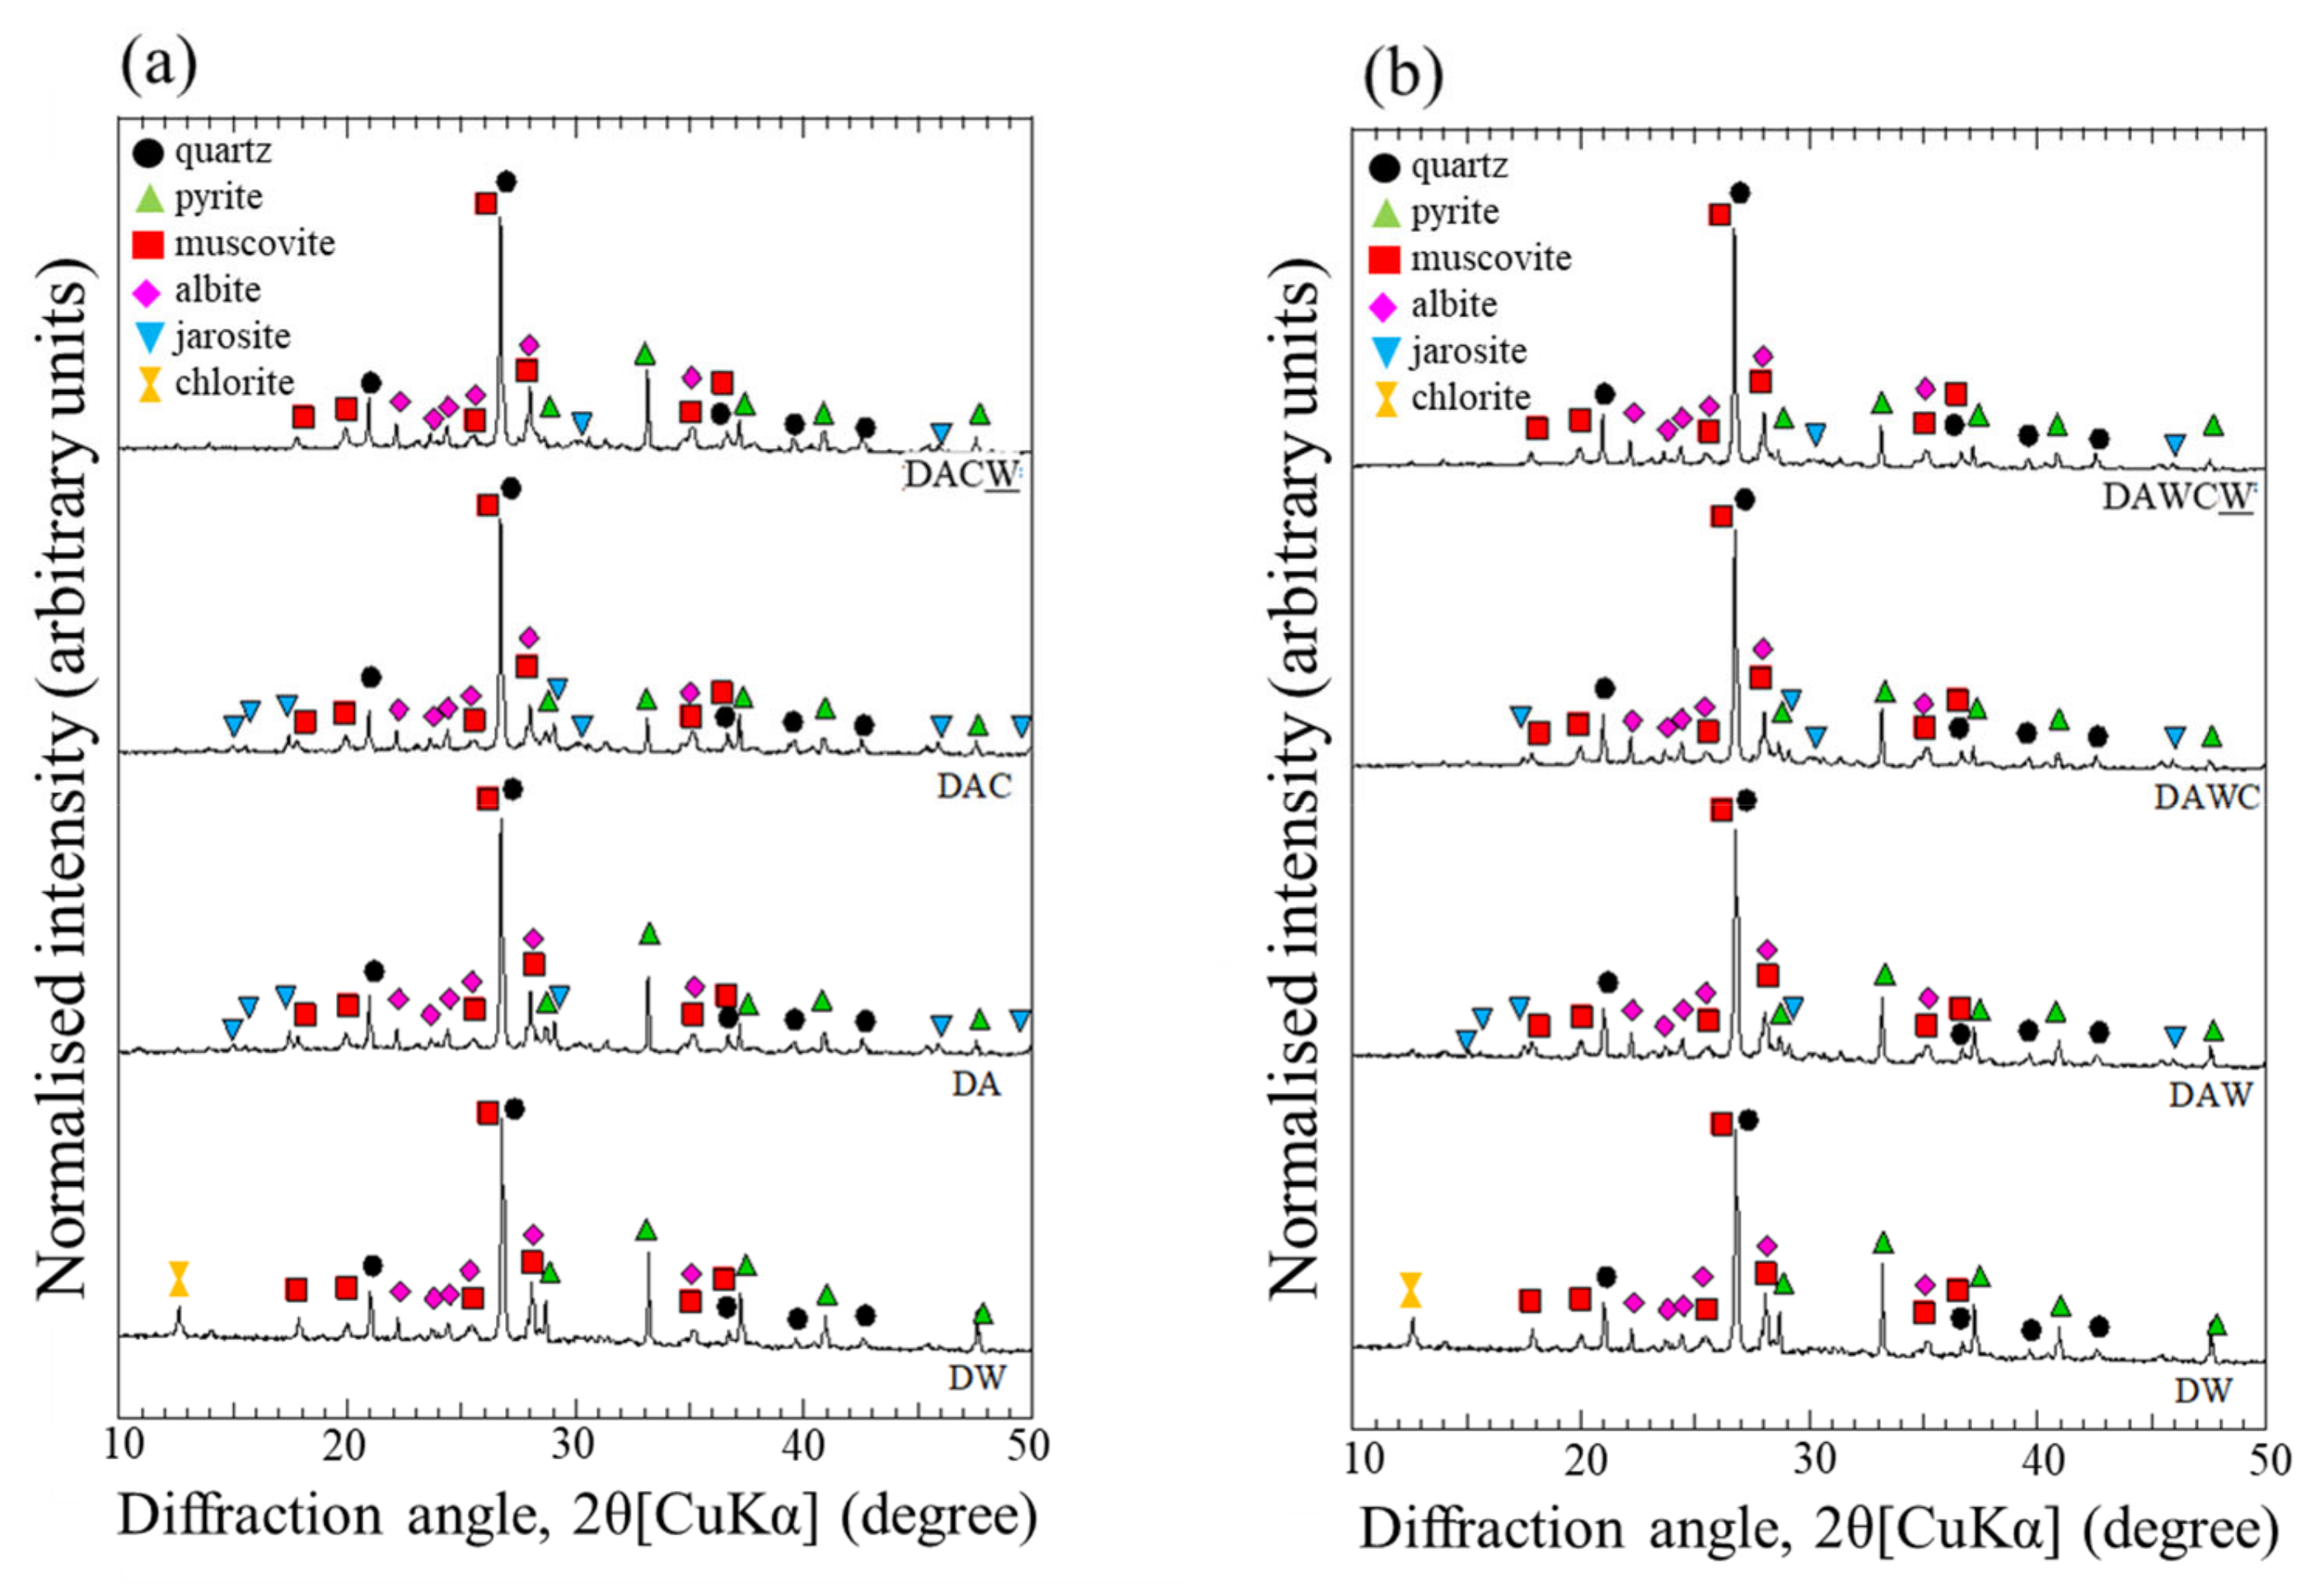
Changes in the XRD patterns of the solid residue (from DW to DA) showed a slight decrease in the relative intensities (RI) of the peaks for pyrite and complete disappearance of chlorite (JCPDS 01-072-1234) (Figure 4). Dissolution of pyrite was also supported by the decreases of RI of Fe and S determined by XRF (Table 1). On the other hand, the small peaks of jarosite were detected in the XRD result for DA, indicating that the gold recovery might be detriment, suggesting the necessity of the additional treatment to dissolve jarosite. The structure of chlorite (Mg4.29Al1.48Fe0.10)(Al1.22Si2.78)O10(OH)8) can be decomposed under strongly acidic conditions because the brucite-like layers can be easily damaged under acidic conditions to decrease in the layer spacing [35].
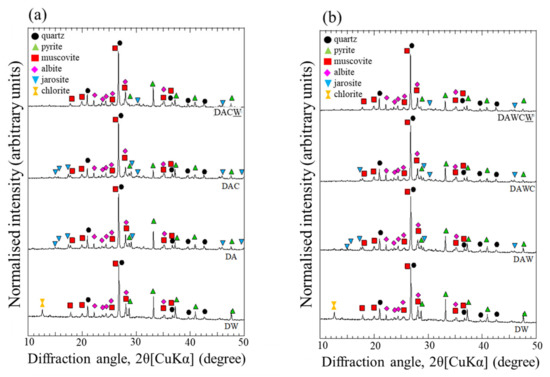
Figure 4.
Changes in the XRD patterns for solid residues in two sequential biotreatments of DRGO. (a) DW → DA → DAC → DACW, (b) DW → DAW → DAWC → DAWCW.
The ultrapure water washing was aimed to remove excess amount of H+ until reaching the appropriate pH around 4 in the supernatant for the next step, which was enzymatic degradation of carbonaceous matter. After washing with HCl and ultrapure water, the XRD peaks of pyrite and jarosite slightly decreased (Figure 4). The slight decrease in RI of K and Fe supported the further dissolution of pyrite and removal of Fe3+ and jarosite by 1 M HCl from DA to DAW in XRF (Table 1).
3.3. Degradation of Carbonaceous Matter and NaOH Washing
The XRD patterns for all solid residues are depicted in Figure 4. The RI of pyrite decreased with each step of the process. This may be due to that the H2O2 produced by CFSM acted as an oxidant and further decomposed pyrite during enzymatic reaction [36]. It is not clear in XRD how much acid washing affected the mineralogy in solid residues in sequential biotreatment.
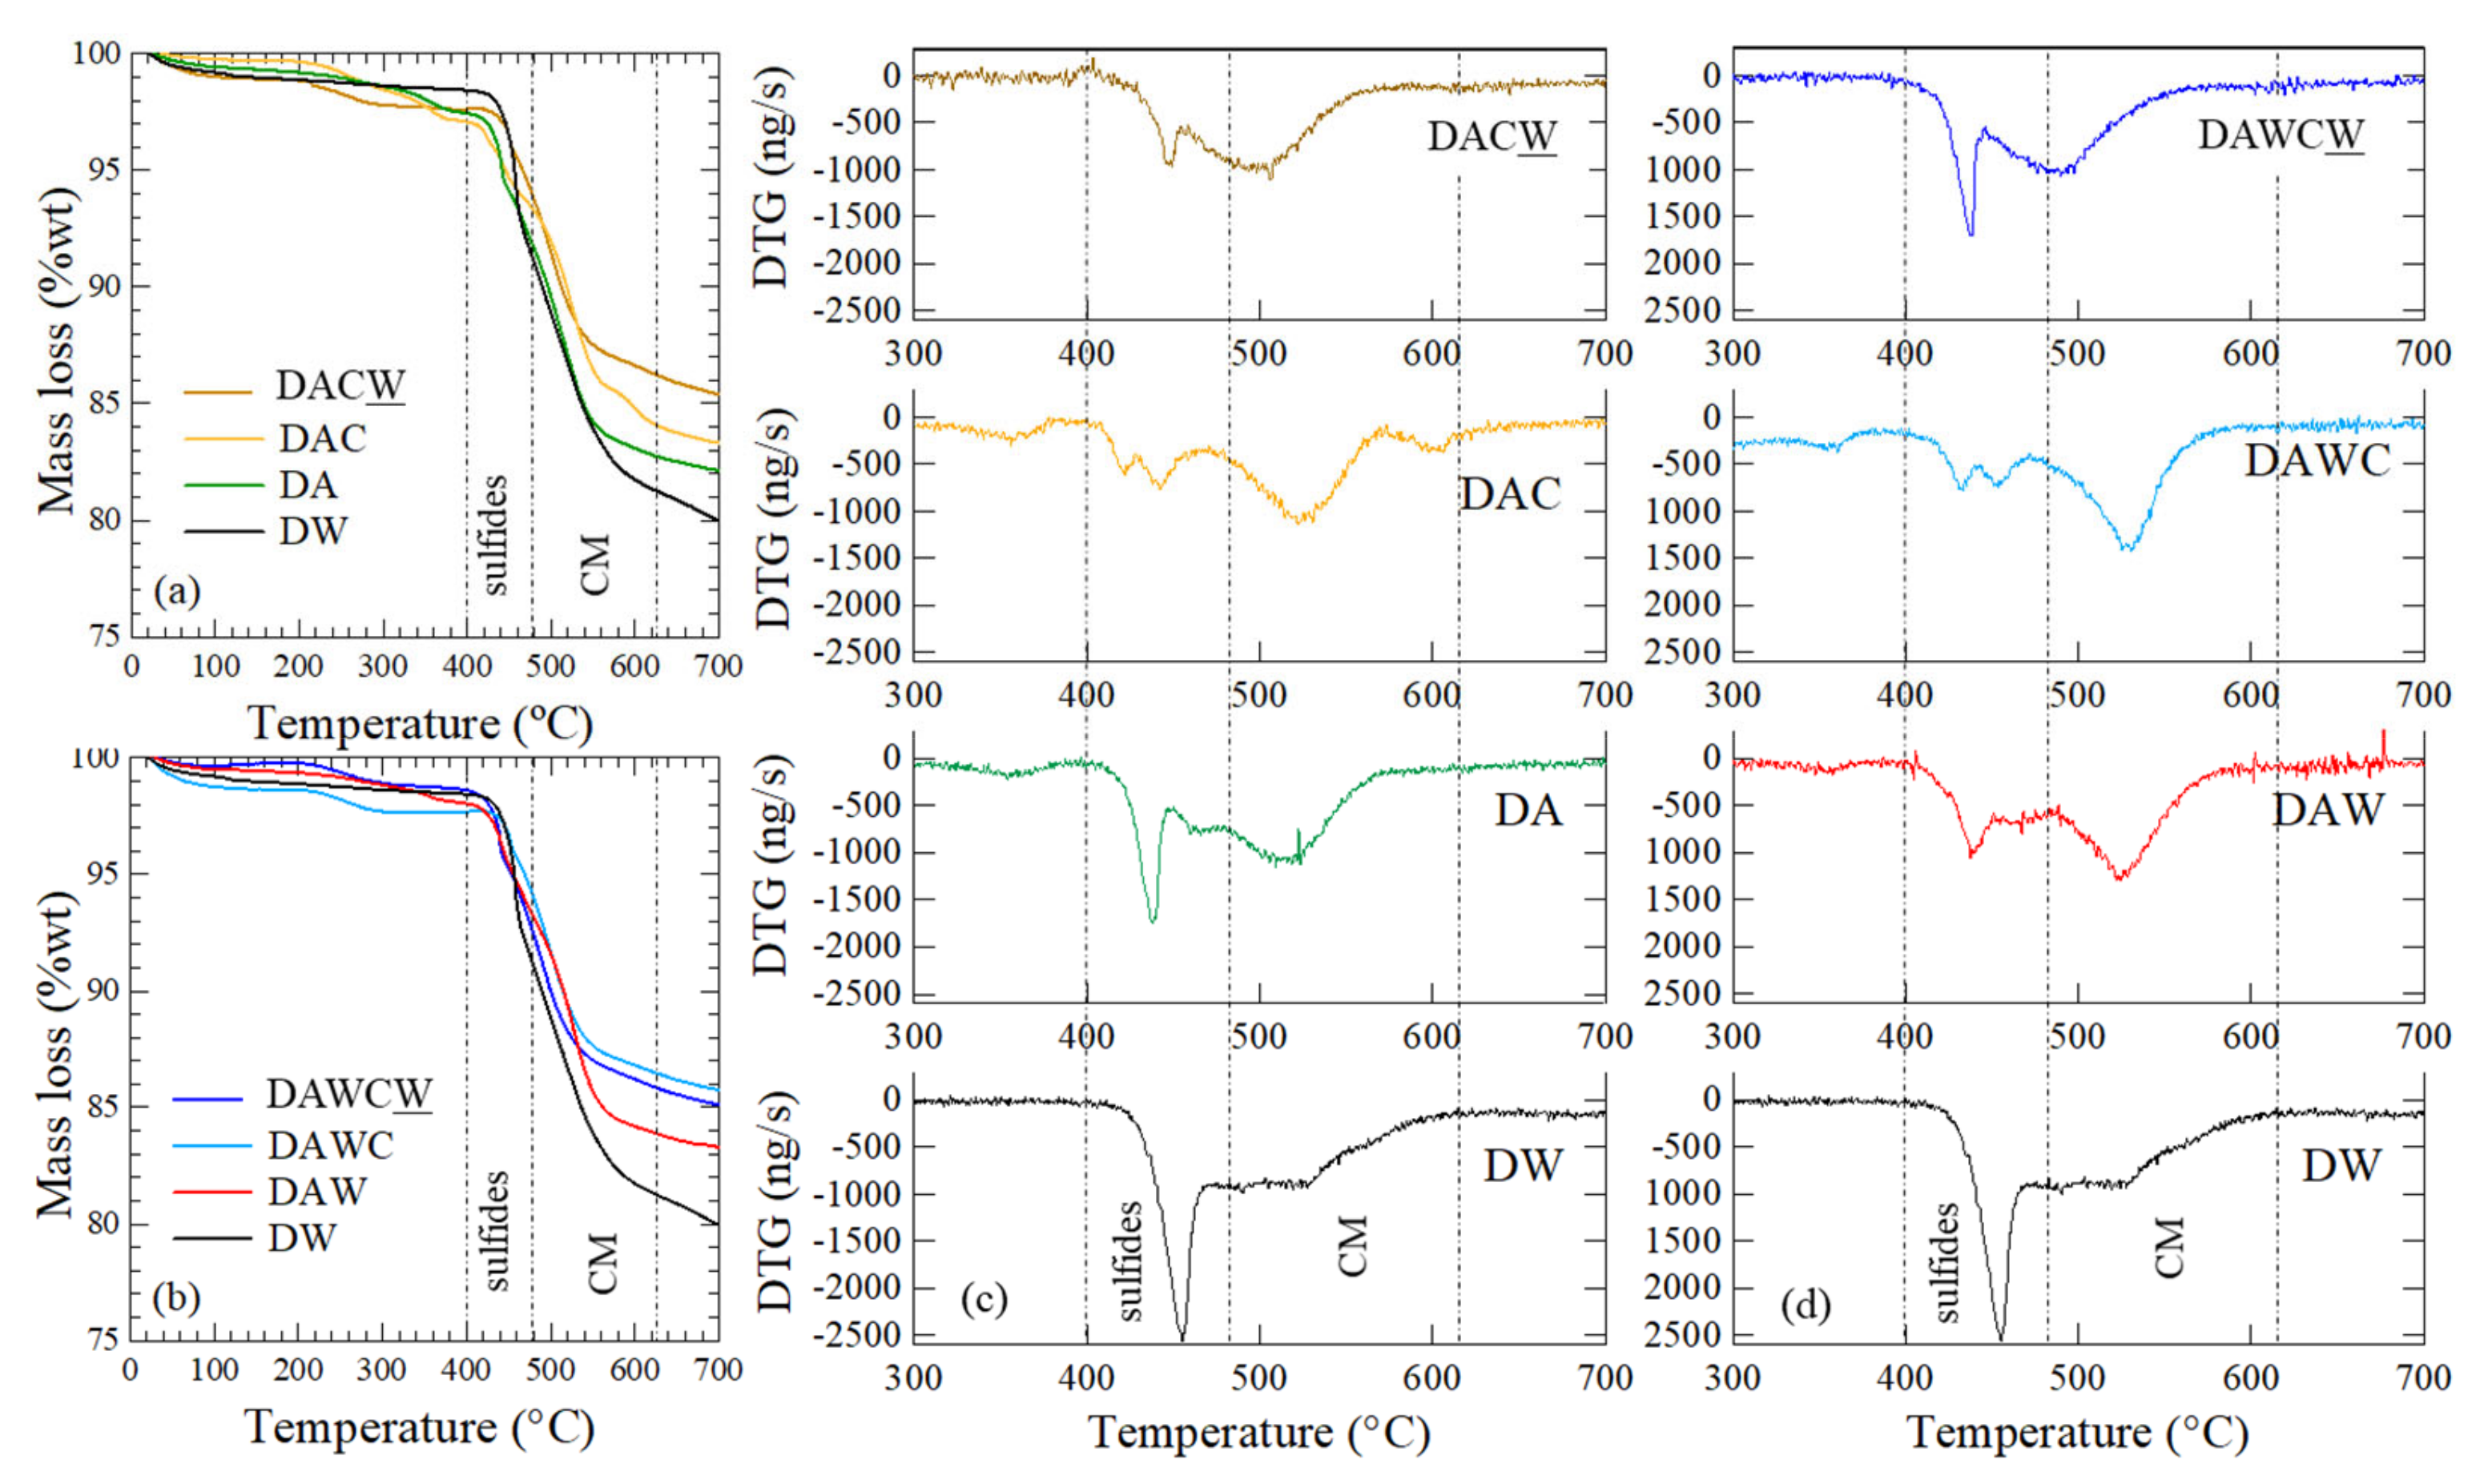
Thermogravimetric analysis showed some differences of characteristics for the solid residues between two processes, as shown in Figure 5. The temperature range for thermal reaction was divided into two ranges: 400–480 °C for the decomposition of sulfides and 480–630 °C for the decomposition of carbonaceous matters (Figure 5c,d). These temperature stages were used to calculate the mass loss for each sample (Figure 5a,b). Furthermore, an additional peak was detected at 600 °C in DAC. This might be due to the adsorption of biomolecules after enzymatic reaction on the surface of the solid residue of DAC. This peak was not detected in DAWC because of acid washing that alter carbonaceous matter so that its affinity decreased and did not adsorb the biomolecules. This interpretation is consistent with the mass loss after CFSM treatment, where the mass loss of DAC (10.03 wt%) was higher than DA (9.32 wt%), while the mass loss of DAWC (9.37 wt%) did not change significantly.
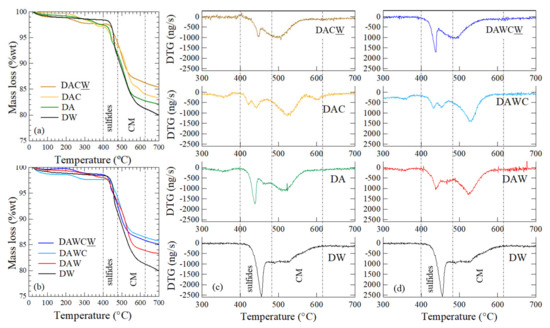
Figure 5.
Thermogravimetric analysis (TG-DTA) for the solid residues after each step shown in Figure 2. (a) TG and (c) DTG for DW → DA → DAC → DACW, (b) TG, and (d) DTG for DW → DAW → DAWC → DAWCW.
After the biooxidation of sulfides, the dominant DTG peak position was shifted from 455 °C for DW to 439 °C for DA (Figure 5c). Then, 1 M HCl washing broadened the DTG peak around 439 °C in DAW, keeping the peak position. This suggests sulfide bonds might be slightly cleaved by biooxidation and weakly bound sulfides might have been partially dissolved by 1 M HCl, although the slight changes were observed only in XRD (Figure 4b).
Moreover, CFSM treatment of DAC and DAWC affected sulfide bonds. That is, DTG peaks around 400–480 °C were obviously weakened and additional small peaks were created around 420 °C in DAC and 460 °C in DAWC. This would be caused by H2O2 through the reaction of lignin peroxidase in CFSM. The standard redox potentials for LiP and MnP are reported to be 1200–1500 mV and 1100 mV, respectively [37]. They are high enough to attack the exposed sulfides, which have the standard redox potential of 270–340 mV [38].
Furthermore, alkaline washing made DTG peak shifts from 525 °C to 503 °C in DACW, and from 530 °C to 495 °C in DAWCW (Figure 5c,d). This also suggests a novel process, including acid washing-facilitated enzymatic decomposition of carbonaceous matter.
Changes in the graphitic degree after enzymatic reaction were investigated using Raman spectroscopy, as shown in Figure 6. The relative intensity of ID/IG decreased in both processes of DA to DAC and DAW to DAWC; however, the former was much more decreased than the latter. Acid washing did not so much affect the graphitic degree of carbonaceous matter (ID/IG = 1.14 for DA and 1.11 for DAW). The CFSM treatment degraded defective carbon more preferentially on DA than DAW; in other words, CFSM treatment degraded not only defective carbon but also graphitic carbon in DAW compared with DA.
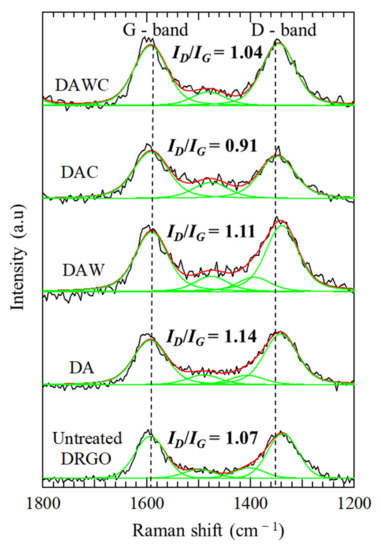
Figure 6.
Changes in Raman spectra for solid residues before and after enzymatic reactions. Original Raman spectra (−), peak fitting (−), and envelop from peak fitting (−).
The above speculation can also be supported by 3D fluorescence spectra for the supernatants after washing DAC and DAWC by 1 M NaOH. As shown in Figure 7a,b, both spectra show similar peak positions at Ex 400–425 nm and Em 500–525 nm, which are consistent with the humic-like substances with high molecular weights [39]. The peak intensities were much greater in DAC than DAWC. As shown in the same figure, the color of the solution after extraction of DAC and DAWC in 1 M NaOH are more brownish and darker in (b) DAWCW than (a) DACW. The carbon content was smaller in DAWC (6.84%) than in DAC (7.4%), even though the carbon content before the enzyme reaction was larger in DAW (6.53%) than in DA (6.07%) (Table 2). The carbon contents (in wt%) are influenced by changes in total mass, of course. In a process of enzymatic reaction, the solid mass increases mainly due to the formation of insoluble biomolecules and iron precipitates because of pH around 4, and decreases by the solubilization of enzymatically degraded carbonaceous matter. Comprehensively considering, the enzymes LiP and MnP in CFSM more effectively and easily attacked carbonaceous matter in DAW than DA, and the remaining amount of polyaromatic carbonaceous matter was smaller in DAWC than in DAC. Expectedly, the extracted substances would have smaller molecular sizes in DAWCW than in DACW. This means the CFSM treatment degraded carbonaceous matter much more effectively in the process from DAW to DAWC than the process from DA to DAC, although the CFSM treatment was exactly under the same condition. This interpretation is also consistent with the obtained results in TG-DTA (Figure 5) and Raman spectroscopy (Figure 6).
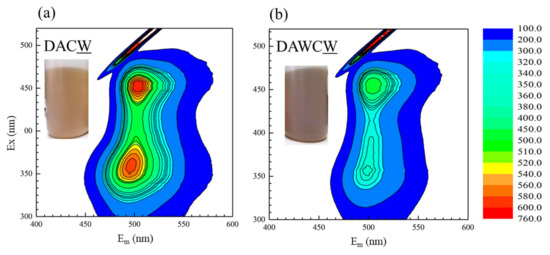
Figure 7.
Three-dimensional fluorescence spectra for liquid residues after washing of (a) DAC and (b) DAWC by 1 M NaOH.
3.4. Gold Recovery
Gold recovery (%) from each solid residue in the sequential pretreatments was obtained by cyanidation, as summarized in Table 3 (n = 2). As the starting material, DW had the lowest gold recovery (41.5 ± 0.3%) due to the existing sulfides and carbonaceous matter that can encapsulate gold grains and adsorb Au(CN)2−, respectively.
Table 3.
Gold recoveries in duplicate from the solid residues after each step in a sequential pretreatment for DRGO including acid washing. The abbreviation is the same as in Figure 2.
Biooxidation of sulfides increased the gold recovery to 62.6 ± 3.0% (DA), and to 66.4 ± 1.7% (DAW) after 1 M HCl washing. DAW showed a bit higher gold recovery than DA. It suggests that acid washing in 1 M HCl might suppress the formation of agglomerates by washing out physically adsorbed Fe3+, in addition to the partial dissolution of jarosite, which was formed in biooxidation of sulfides in the previous step.
After enzymatic degradation of carbonaceous matter in CFSM, gold recovery was improved to 66.4 ± 9.2% and 84.9 ± 0.7% for DAC and DAWC, respectively. Even though the enzymatic treatment was performed under the same conditions, the gold recovery was obviously improved by more than 20% through HCl washing. This suggests that acid washing with 1 M HCl facilitated enzyme access to carbonaceous matter, resulting in greater reduction of preg-robbing capacity in DAWC than in DAC. Moreover, DAWC showed the highest gold recovery among all samples.
After 1 M NaOH washing of DAC and DAWC, the obtained gold recoveries were 72.5 ± 0.9% and 71.3 ± 5.9%, respectively. A previous report [23] verified an improvement of gold recovery with 14.9% after 1 M NaOH washing to achieve a final recovery of 92%, similar to the process from DAC to DACW. However, here, the gold recovery decreased from DAWC (84.9 ± 0.7%) to DAWCW (71.3 ± 5.9%). The reduction of gold recovery in DAWCW could be explained by the following reasons. Under strong alkaline conditions, residual pyrite and Fe3+ might have formed (oxy)hydroxide precipitates. The precipitates could encapsulate gold grains and/or consume cyanide during cyanidation, resulting in the decrease of gold recovery. As mentioned above, DAW possess much more physically adsorbed Fe3+ on the surfaces than DA, because 1 M HCl washing did not only wash out physically adsorbed Fe3+, but also dissolve the structural Fe(III) in clay minerals such as muscovite and albite, resulting in an increase in the total amounts of physically adsorbed Fe3+. Thus, 1 M NaOH washing after carbonaceous matter degradation is not suitable for the solid residues that include high contents of physically adsorbed Fe3+. The increase of gold recovery from DAC to DACW was due to the removal of residual carbonaceous matter and agglomeration because of higher amount of remaining carbon, thus reducing the preg-robbing.
3.5. Particle Size Distribution and Evaluation of HCl Washing
For better understanding the formation and decomposition of agglomerates of each step in the sequential treatments, particle size distribution was analyzed as shown in Figure 8. There are three distinctive peaks with the peak tops around 7–9 μm, 40–70 μm, and 200–300 μm. The y-axis is expressed as volumetric frequency in (v/v)% instead of mass frequency in (w/w)%. In a process from DW to DA, the peak frequency of the first peak increased relatively with 0.8% and the peak frequency of the second peak decreased, due to the decomposition of sulfide particles, which generally have the dominant sizes at several 10 μm in flotation concentrates of DRGO. Carbonaceous matter grains and clay minerals are generally ranged under 10 μm in DRGO, confirmed by quantitative evaluation of minerals by scanning electron microscopy (QEMSCAN) observation [30,40].
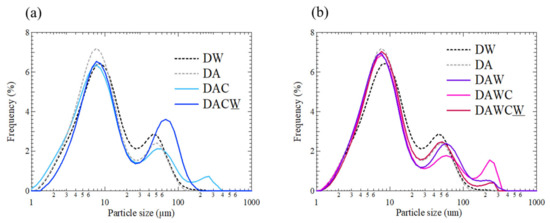
Figure 8.
Particle size distributions for solid residues after each step shown in Figure 2. (a) DW → DA → DAC → DACW, (b) DW → DAW → DAWC → DAWCW.
In a process from DA to DAC without acid washing, the frequency of the first peak decreased by 0.8% and the frequency of the third peak was 0.8%, supporting the formation of agglomerates consisting of clay minerals and carbonaceous matter. Next, in a process from DAC to DACW, the frequency of the second peak much increased and the peak position was shifted from 50 to 70 μm, and the third peak disappeared. This implies the decomposition of agglomerated particles by alkaline washing. This is in accordance with the interpretation of the increase in gold recovery in this process. Next, in the process from DA to DAW, the frequency of the first peak decreased by around 0.3%, the frequency of the second peak did not change significantly, and the third peak had a frequency of 0.5%, supporting the formation of agglomerates consisting of clay minerals and carbonaceous matter. This was unexpected because the acid washing enhanced agglomeration instead of inhibition.
Meanwhile, in a process from DAW to DAWC with acid washing, the frequency of the first peak did not change obviously, the frequency of the second peak decreased with around 0.6%, while the third peak increased to 1.6%, supporting the agglomeration of precipitates such as Fe (oxy)hydroxides rather than agglomerates consisting of clay minerals and carbonaceous matter. Last, in a process from DAWC to DAWCW, the frequency of the second peak much increased and the peak position was shifted from 60 to 50 μm, and the third peak decreased to 0.4%. By alkaline washing, organic matter should be dissolved, but Fe (oxy)hydroxides should be further produced.
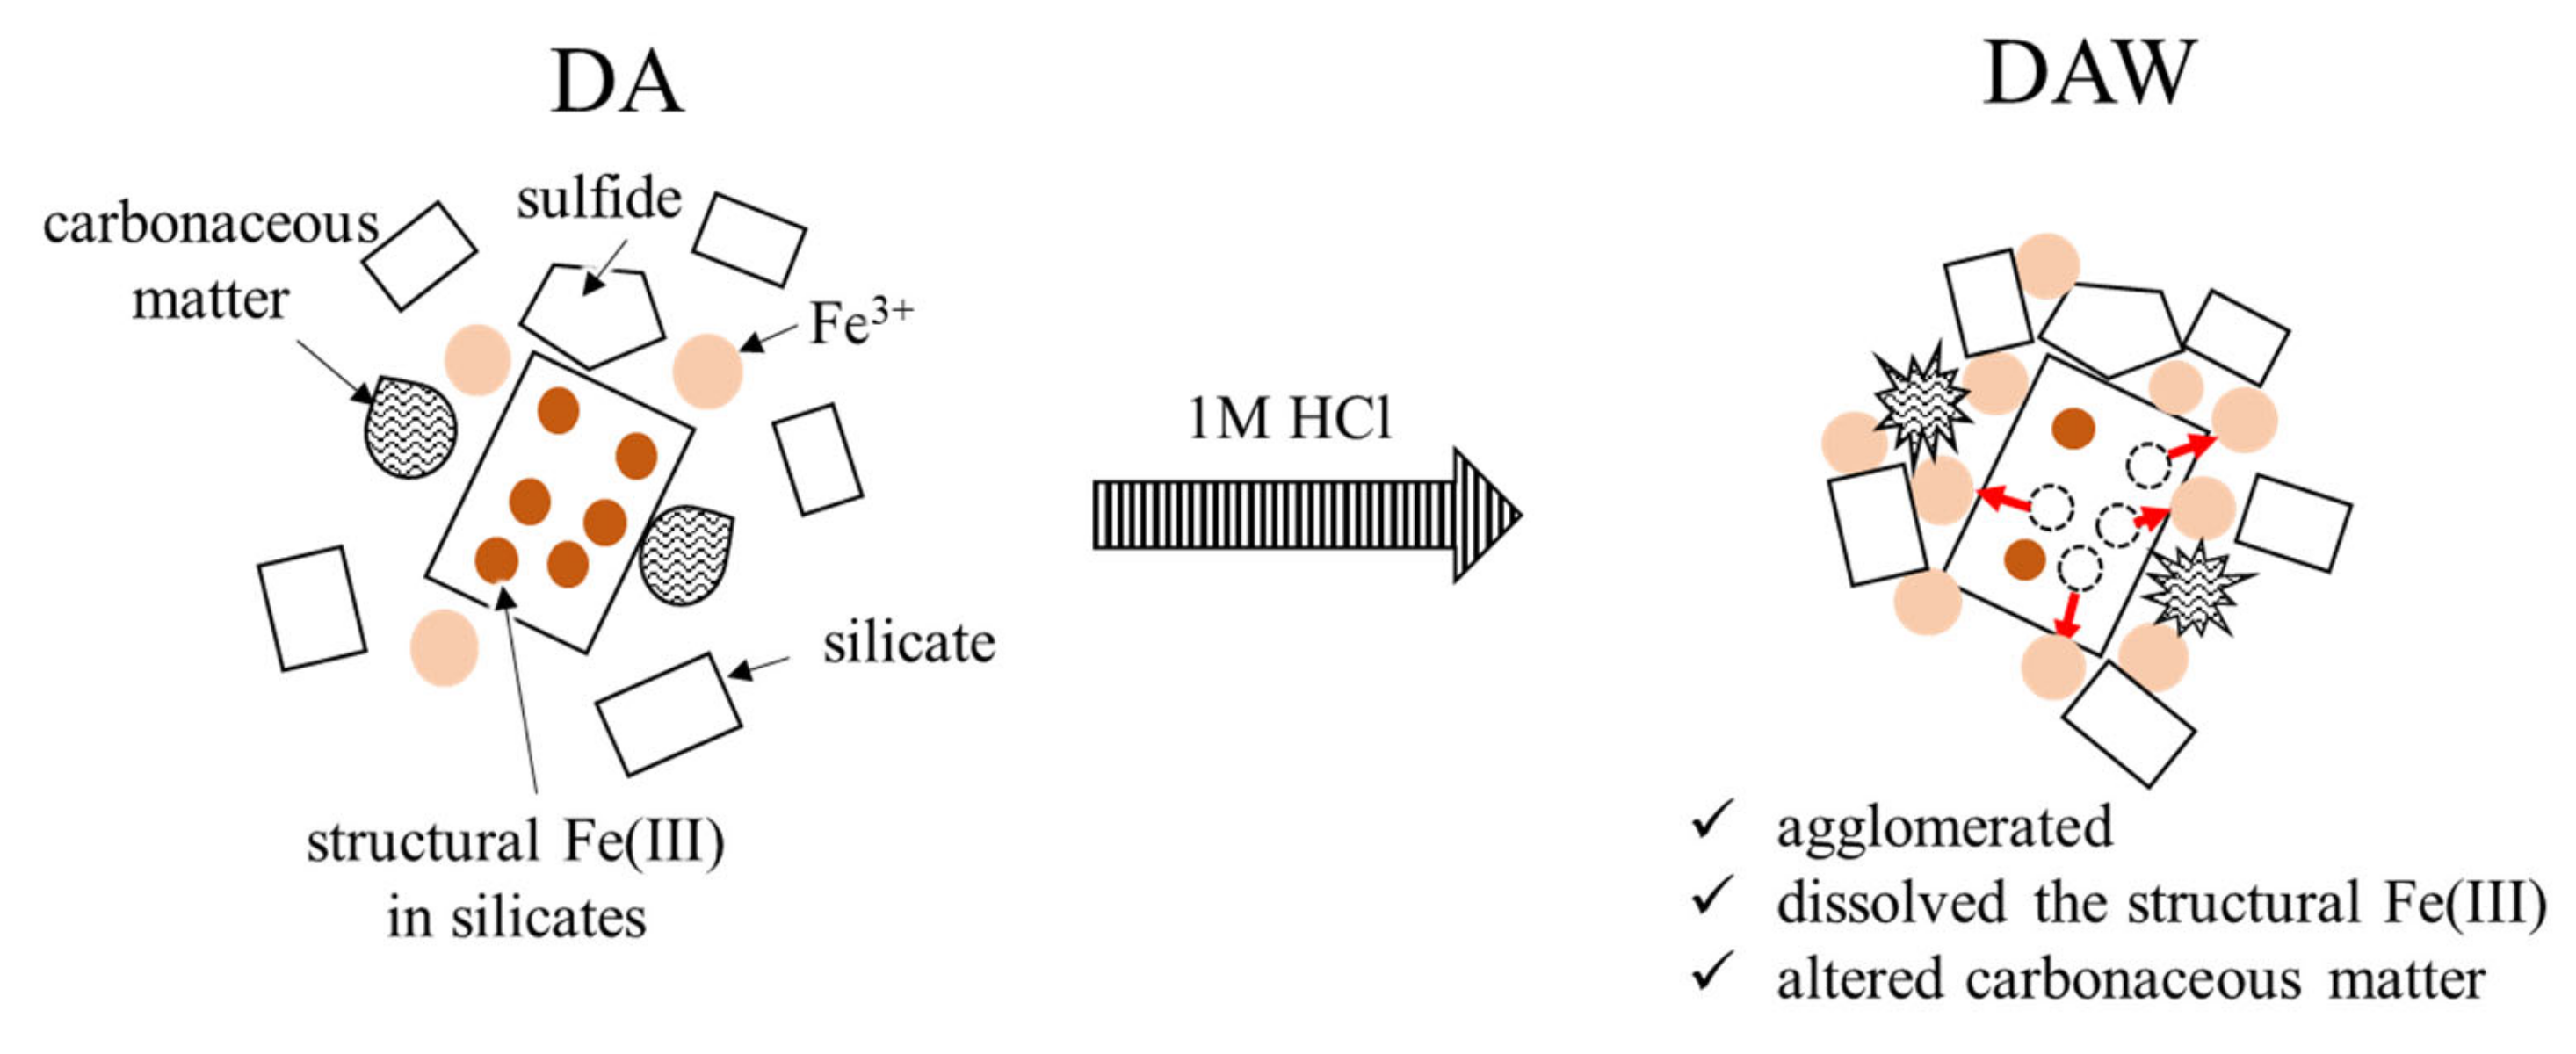
Based on all the observed results including the particle size distributions, the effects of the acid washing with 1 M HCl and ultrapure water can be illustrated, as shown in Figure 9. Washing with 1 M HCl and ultrapure water has contributed to the slight dissolution of pyrite grains, wash out physically adsorbed Fe3+ ions, but generated the additional physically adsorbed Fe3+ ions by acid dissolution of structural Fe(III) in coexisting clay minerals such as muscovite and albite, although this was not expected. They should promote the agglomeration and alter carbonaceous matter. This might have allowed the enzyme to easily access carbonaceous matter during enzymatic degradation. Although new agglomerations that might have a risk to interfere with recovering gold in DAW were produced, the gold recovery was significantly improved in DAWC (84.9 ± 0.7%) compared with either DAC (64.4 ± 9.2%) after enzymatic reaction or DACW (72.5 ± 0.9%) after alkaline washing DAC. The pretreatment process of DRGO prior to cyanidation should be designed well considering the elemental and mineralogical compositions including particle sizes. In particular, direct integral observation system such as MLA and QEMSCAN, rather than combination of XRD and XRF, is very powerful to characterize for planning the pretreatment process of DRGO.

Figure 9.
Schematic illustration of acid washing effects.
4. Conclusions
Acid washing after the biooxidation of sulfides before enzymatic reaction to degrade carbonaceous matter was evaluated in a sequential pretreatment using a real DRGO from the Syama mine, Mali, which includes 5.27 wt% of carbon with a relatively higher graphitic degree. Significant improvement in gold recovery was confirmed by cyanidation to yield to 84.9 ± 0.7% (n = 2). The positive effects of acid washing can be explained by alteration of carbonaceous matter to facilitate the accessibility for LiP and MnP in CFSM when the structural Fe(III) in clay minerals was acid attacked, as well as the partial extraction of Fe3+ and the partial dissolution of jarosite. Sequential treatment of DRGO basically consists of oxidative dissolution of sulfides and degradation of carbonaceous matter prior to extraction of gold; however, the details should be modified depending on the elemental and mineralogical compositions and the graphitic degree of carbonaceous matter, which requires a direct integral mineralogical observation system, such as MLA, QEMSCAN, and Raman spectroscopy.
Supplementary Materials
The following are available online at https://www.mdpi.com/article/10.3390/min11121316/s1, Figure S1: Mineral liberation analytical results for DRGO, (a) mineralogical 2D mapping of liberated Au and Au-bearing grains and (b) distributions of classified Au grains. Figure S2: XRD patterns of DRGO and DW.
Author Contributions
Conceptualization, C. and K.S.; methodology, R.S., K.T.K. and K.S.; formal analysis, C. and R.S.; resources, K.S.; data curation, R.S. and K.T.K.; writing—original draft preparation, C.; writing—review and editing, R.S., D.M.M., K.T.K. and K.S.; visualization, R.S. and K.T.K.; supervision, K.S.; project administration, K.S.; funding acquisition, K.S. All authors have read and agreed to the published version of the manuscript.
Funding
This research was funded by the Japan Society for the Promotion of Sciences (JSPS) KAKENHI research grants (grant number JP19KK0135) and JSPS International Exchange Programs (grant number JPJSBP120196505, JPJSBP120219929, JPJSCCB20200003), which were provided to K.S.
Acknowledgments
The DRGO from the Syama mine, Mali was provided by courtesy of Jacques Eksteen at Curtin University. ICP-MS analysis were conducted at the Center of Advanced Instrumental Analysis in Kyushu University. Furthermore, C. would like to thank the Indonesian government for providing the Lembaga Pengelola Dana Pendidikan (LPDP) scholarship. D.M.M. would like to kindly appreciate the Japanese government for providing Monbukagakusho (MEXT) scholarship.
Conflicts of Interest
The authors declare no conflict of interest.
References
- Osseo-Asare, K.; Afenya, P.M.; Abotsi, G.M.K. Carbonaceous matter in gold ores: Isolation, characterization and adsorption behavior in aurocyanide solutions. In Precious Metals: Mining, Extraction and Processing; Metallurgical Society of AIME: Englewood, NJ, USA, 1984; pp. 125–144. [Google Scholar]
- Abotsi, G.M.K.; Osseo-Asare, K. Surface chemistry of carbonaceous gold ores I. Characterization of the carbonaceous matter and adsorption behavior in aurocyanide solution. Int. J. Miner. Process. 1986, 18, 217–236. [Google Scholar] [CrossRef]
- Afenya, P.M. Treatment of carbonaceous refractory gold ores. Miner. Eng. 1991, 4, 1043–1055. [Google Scholar] [CrossRef]
- Turner, S.J.; Flindell, P.A.; Hendri, D.; Hardjana, I.; Lauricella, P.F.; Lindsay, R.P.; Marpaung, B.; White, G.P. Sediment-hosted gold mineralisation in the Ratatotok district, North Sulawesi, Indonesia. J. Geochem. Explor. 1994, 50, 317–336. [Google Scholar] [CrossRef]
- Miller, J.D.; Wan, R.Y.; Díaz, X. Preg-robbing gold ores. Dev. Miner. Process. 2005, 15, 937–972. [Google Scholar] [CrossRef]
- Marsden, J.; House, I. The Chemistry of Gold Extraction; SME: Englewood, NJ, USA, 2006; pp. 147–224. [Google Scholar]
- Yang, H.Y.; Liu, Q.; Song, X.L.; Dong, J.K. Research status of carbonaceous matter in carbonaceous gold ores and bio-oxidation pretreatment. Trans. Nonferrous Met. Soc. China 2013, 23, 3405–3411. [Google Scholar] [CrossRef]
- Ofori-Sarpong, G.; Osseo-Asare, K. Preg-robbing of gold from cyanide and non-cyanide complexes: Effect of fungi pretreatment of carbonaceous matter. Int. J. Miner. Process. 2013, 119, 27–33. [Google Scholar] [CrossRef]
- Konadu, K.T.; Mendoza, D.M.; Huddy, R.J.; Harrison, S.T.L.; Kaneta, T.; Sasaki, K. Biological pretreatment of carbonaceous matter in double refractory gold ores: A review and some future considerations. Hydrometallurgy 2020, 196, 105434. [Google Scholar] [CrossRef]
- Hammerschmidt, J.; Guntner, J.; Kerstiens, B. Roasting of gold ore in the circulating fluidized-bed technology. Dev. Miner. Process. 2005, 15, 433–453. [Google Scholar] [CrossRef]
- Thomas, K.G.; Cole, A.P. Roasting Developments—Especially Oxygenated Roasting. In Gold Ore Processing; Ken, T., Murray, P., Eds.; Elsevier: Amsterdam, The Netherlands, 2005; Volume 3, pp. 403–432. [Google Scholar] [CrossRef]
- La Brooy, S.R.; Linge, H.G.; Walker, G.S. Review of gold extraction from ores. Miner. Eng. 1994, 7, 1213–1241. [Google Scholar] [CrossRef]
- Abotsi, G.M.K.; Osseo-Asare, K. Surface chemistry of carbonaceous gold ores, II. Effects of organic additives on gold adsorption from cyanide solution. Int. J. Miner. Process. 1987, 21, 225–239. [Google Scholar] [CrossRef]
- Kuddus, M.; Joseph, B.; Wasudev Ramteke, P. Production of laccase from newly isolated Pseudomonas putida and its application in bioremediation of synthetic dyes and industrial effluents. Biocatal. Agric. Biotechnol. 2013, 2, 333–338. [Google Scholar] [CrossRef]
- Konadu, K.T.; Sasaki, K.; Ofori-Sarpong, G.; Osseo-Asare, K.; Kaneta, T. Bio-modification of carbonaceous matters in gold ore: Model experiments using powdered activated charcoal and cell-free extracts of Phanerochaete chrysosporium. Adv. Mat. Res. 2015, 1130, 109–113. [Google Scholar] [CrossRef]
- Liu, Q.; Yang, H.Y.; Tong, L.L.; Jin, Z.N.; Sand, W. Fungal degradation of elemental carbon in Carbonaceous gold ore. Hydrometallurgy 2016, 160, 90–97. [Google Scholar] [CrossRef]
- Konadu, K.T.; Sasaki, K.; Kaneta, T.; Ofori-Sarpong, G.; Osseo-Asare, K. Bio-modification of carbonaceous matter in gold ores: Model experiments using powdered activated carbon and cell-free spent medium of Phanerochaete chrysosporium. Hydrometallurgy 2017, 168, 76–83. [Google Scholar] [CrossRef]
- Mendoza, D.M.; Ichinose, H.; Konadu, K.T.; Sasaki, K. Degradation of powder activated carbon by laccase-mediator system: Model experiments for the improvement of gold recovery from carbonaceous gold ore. J. Environ. Chem. Eng. 2021, 9, 106375. [Google Scholar] [CrossRef]
- Ten Have, R.; Teunissen, P.J.M. Oxidative mechanisms involved in lignin degradation by white-rot fungi. Chem. Rev. 2001, 101, 3397–3413. [Google Scholar] [CrossRef] [PubMed]
- Tien, M.; Kirk, T.K. Lignin peroxidase of Phanerochaete chrysosporium. Methods Enzym. 1988, 161, 238–299. [Google Scholar] [CrossRef]
- Wariishi, H.; Valli, K.; Gold, M.H. In vitro depolymerization of lignin by Manganese Peroxidase of Phanerochaete chrysosporium. Biochem. Biophys. Res. Commun. 1991, 176, 269–275. [Google Scholar] [CrossRef]
- Ofori-Sarpong, G.; Osseo-Asare, K.; Tien, M. Mycohydrometallurgy: Biotransformation of double refractory gold ores by the fungus, Phanerochaete chrysosporium. Hydrometallurgy 2013, 137, 38–44. [Google Scholar] [CrossRef]
- Konadu, K.T.; Harrison, S.T.L.; Osseo-Asare, K.; Sasaki, K. Transformation of the carbonaceous matter in double refractory gold ore by crude lignin peroxidase released from the white-rot fungus. Int. Biodeterior. Biodegrad. 2019, 143, 104735. [Google Scholar] [CrossRef]
- Ciftci, H.; Akcil, A. Effect of biooxidation conditions on cyanide consumption and gold recovery from a refractory gold concentrate. Hydrometallurgy 2010, 104, 142–149. [Google Scholar] [CrossRef]
- Asamoah, R.K. Specific refractory gold flotation and bio-oxidation products: Research overview. Minerals 2021, 11, 93. [Google Scholar] [CrossRef]
- Ferrari, A.C. Raman spectroscopy of graphene and graphite: Disorder, electron-phonon coupling, doping and nonadiabatic effects. Solid State Commun. 2007, 143, 47–57. [Google Scholar] [CrossRef]
- Mendoza, D.M.; Konadu, K.T.; Aoki, Y.; Kameya, M.; Sasaki, K. Carbonaceous matter degradation by fungal enzyme treatment to improve Ag recovery from an Au-Ag-bearing concentrate. Miner. Eng. 2021, 163, 106768. [Google Scholar] [CrossRef]
- Dimov, S.S.; Hart, B.R. Applications of microbeam analytical techniques in gold deportment studies and characterization of losses during the gold recovery process. Surf. Interface Anal. 2017, 49, 1404–1415. [Google Scholar] [CrossRef]
- Sonibare, O.O.; Haeger, T.; Foley, S.F. Structural characterization of Nigerian coals by X-ray diffraction, Raman and FTIR spectroscopy. Energy 2010, 35, 5347–5353. [Google Scholar] [CrossRef]
- Konadu, K.T.; Huddy, R.J.; Harrison, S.T.L.; Osseo-Asare, K.; Sasaki, K. Sequential pretreatment of double refractory gold ore (DRGO) with a thermophilic iron oxidizing archaeon and fungal crude enzymes. Miner. Eng. 2019, 138, 86–94. [Google Scholar] [CrossRef]
- Zeng, G.M.; Zhao, M.H.; Huang, D.L.; Lai, C.; Huang, C.; Wei, Z.; Cheng, M. Purification and biochemical characterization of two extracellular peroxidases from Phanerochaete chrysosporium responsible for lignin biodegradation. Int. Biodeterior. Biodegrad. 2013, 85, 166–172. [Google Scholar] [CrossRef]
- West, T.O.; McBride, A.C. The contribution of agricultural lime to carbon dioxide emissions in the United States: Dissolution, transport, and net emissions. Agric. Ecosyst. Environ. 2005, 108, 145–154. [Google Scholar] [CrossRef]
- Ofori-Sarpong, G.; Adam, A.-S.; Komla Asamoah, R.; Kwasi Amankwah, R. Characterisation of biooxidation feed and products for improved understanding of biooxidation and gold extraction performance. Int. J. Miner. Process. Extr. Metall. 2020, 5, 20. [Google Scholar] [CrossRef]
- Sasaki, K. Raman study of the microbially mediated dissolution of pyrite by Thiobacillus ferrooxidans. Can. Mineral. 1997, 35, 999–1008. [Google Scholar]
- Smith, M.M.; Wolery, T.J.; Carroll, S.A. Kinetics of chlorite dissolution at elevated temperatures and CO2 conditions. Chem. Geol. 2013, 347, 1–8. [Google Scholar] [CrossRef]
- Kuwahara, M.; Glenn, J.K.; Morgan, M.A.; Gold, M.H. Separation and characterization of two extracelluar H2O2-dependent oxidases from ligninolytic cultures of Phanerochaete chrysosporium. FEBS Lett. 1984, 169, 247–250. [Google Scholar] [CrossRef] [Green Version]
- Fakoussa, R.M.; Hofrichter, M. Biotechnology and microbiology of coal degradation. Appl. Microbiol. Biotechnol. 1999, 52, 25–40. [Google Scholar] [CrossRef]
- Sasaki, K.; Tsunekawa, M.; Hasebe, K.; Konno, H. Effect of anionic ligands on the reactivity of pyrite with Fe(III) ions in acid solutions. Colloids Surf. A 1995, 101, 39–49. [Google Scholar] [CrossRef]
- Gao, J.; Liang, C.; Shen, G.; Lv, J.; Wu, H. Spectral characteristics of dissolved organic matter in various agricultural soils throughout China. Chemosphere 2017, 176, 108–116. [Google Scholar] [CrossRef] [PubMed] [Green Version]
- Zhou, J.Y.; Cabri, L.J. Gold process mineralogy: Objectives, techniques, and applications. JOM 2004, 56, 49–52. [Google Scholar] [CrossRef]


Publisher’s Note: MDPI stays neutral with regard to jurisdictional claims in published maps and institutional affiliations. |
© 2021 by the authors. Licensee MDPI, Basel, Switzerland. This article is an open access article distributed under the terms and conditions of the Creative Commons Attribution (CC BY) license (https://creativecommons.org/licenses/by/4.0/).