Article

The Inadvertent Activation of Silicate Minerals Flotation and Their Depression in Molybdenite Beneficiation

1
China Gold Inner Mongolia Mining Co., Ltd., Manzhouli 021400, China
2
China National Gold Group Co., Ltd., Beijing 100020, China
3
School of Zijin Geology and Mining Engineering, Fuzhou University, Fuzhou 350108, China
*
Author to whom correspondence should be addressed.
Minerals 2021, 11(11), 1296; https://doi.org/10.3390/min11111296
Submission received: 9 October 2021 / Revised: 11 November 2021 / Accepted: 17 November 2021 / Published: 22 November 2021
(This article belongs to the Special Issue Progress of Reagents in Minerals Flotation)

Abstract

:
The Wushan Operation has been studied as a case study, particularly relevant to the copper-molybdenum separation circuit, in which efforts have been made to improve the quality of the molybdenum concentrate through diagnostic analysis. A key finding has been the appearance of coarser silicate minerals in the molybdenum concentrate due to their inadvertent activation in flotation. The suitable silicate minerals flotation conditions occurs, most likely, due to upstream bulk flotation regarding the usage of novel collectors and metal cations bearing process water. The flotation of silicate minerals can be diminished by the implementation of water glass and regrinding. The mechanisms underlying flotation behaviors have been revealed by using advanced in-situ surface analysis and particle size analysis techniques.

1. Introduction

Porphyry Cu-Mo ores are important resources for the extraction of molybdenum. In porphyry Cu-Mo ores, copper and molybdenum mainly exist in the form of chalcopyrite and molybdenite. As a valuable mineral, it is of great significance to efficiently separate molybdenite from chalcopyrite. Commonly, the molybdenite beneficiation is accomplished by means of Cu-Mo bulk flotation, followed by separative flotation of molybdenite from chalcopyrite by using depressants, conventionally sodium sulfide or sodium hydrosulfide to depress the flotation of copper sulfide [1,2,3,4,5]. The undesirable presence of copper in the molybdenum concentrate was a central focus for researchers and attracted plenty of the investigators’ attentions with some successful operational applications [6,7]. Recovery of gangue minerals also deteriorated the grade of molybdenum concentrate. Apart from mineralogically associated gangue, the liberated pyrite and silicate minerals are also floatable to some extent under certain flotation conditions. In particular, the flotation of quartz can usually be activated by metal cations as shown in a lot of investigations [8,9,10]. However, there is little research on the flotation behaviors of silicate minerals in molybdenite beneficiation. As gangue minerals, the flotation of silicate minerals might be activated inadvertently, which needs to be investigated by revealing the surface properties.
The copper-molybdenum operation of Wushan, located in Manzhouli, Inner Mongolia Autonomous Region, Northeast China, was selected as a case study in this study. Over the past period, the Mo grade has been continuously lower than 45% with Cu grade being controlled to less than 1.5%. Therefore, the product quality cannot be guaranteed resulting in the economic loss of the operation. This paper presents solutions from different aspects, including surface property and particle size, to address the problem. Significant improvement of the product quality was achieved based on experimental studies and plant practices. The mechanisms underlying the inadvertent activation of silicate minerals flotation was recognized and depressed in molybdenite beneficiation.

2. Problem Statement of Wushan Operation

2.1. Flowsheet of Wushan Processing Operation

The Wushan copper-molybdenum operation was put into commission in 2009. A typical copper-molybdenum flowsheet has been applied to the plant to produce separate copper and molybdenum concentrates through bulk flotation and separation flotation, in a stepwise fashion. The flotation at the Cu-Mo separation stage consists of one stage of rougher flotation, six stages of cleaner flotation and three stages of scavenger flotation, as shown in Figure 1. A kerosene dosage of 0.35 kg/t and a NaHS dosage of 17 kg/t were “stepwisely” added at different stage of Cu-Mo separation flotation.
Currently, the feed input at the bulk flotation stage is 84,500 ton/day, 30% higher than its designed value, producing 6000 ton of Mo per year in the form of molybdenum concentrate. Recently, novel copper flotation collectors have been introduced into the bulk flotation to improve production efficiency and eco-friendly of the operation.

2.2. Product Quality Analysis

Product quality analysis has been regularly applied to molybdenum concentrate with Cu, Mo, Fe, S, SiO2 being the major considerable. The selected results of 10 different samples over a period of production are shown in Table 1. It is seen that only the second samples meet the criteria (GB3200-89: Mo ≥ 45%, Cu ≤ 1.5%). Though Cu ≤ 2.5% is acceptable, excessive SiO2 should be the main problem for product quality. Table 1 indicates that significant amounts of SiO2 (≥20%) have been transferred into the concentrate. Since molybdenite (MoS2) and silicate (assayed in the form of SiO2) jointly contributed to more than 95% mass content for all concentrate samples, the higher grade of SiO2 present in the concentrate, the lower grade of Mo. Therefore, the depression of molybdenite can be specifically due to the inadvertent flotation of the silicates.
Size by size analysis was carried out for both Cu-Mo separation feed and Mo concentrate after screening and subsequent assaying. It can be seen from Table 2 that the Cu-Mo separation feed during the unqualified period is obviously coarser. The mass fraction of −600 mesh is 29.06% during the unqualified period, while it is 44.18% during the qualified period. During unqualified period, 72.18% of SiO2 is distributed in +325 mesh fraction, while this value decreases to 59.44% during the qualified period. On the other hand, the grades of SiO2 in both feeds are basically the same as 20.04% and 20.15%, respectively.
In respect of the Mo concentrate, 76.88% of SiO2 is distributed in the +325 mesh fraction, while this value is only 36.34% during the qualified period (Table 3). Such a difference is of greater significance than it behaves in the feed, which means the coarser silicate minerals are more likely transferred into concentrate. This leads to SiO2 grade of 26.3% during the qualified period, but 42.2% during the unqualified period.
Therefore, it can be deduced that coarse and floatable silicate minerals are present in the Cu-Mo separation flotation, and the enrichment of these coarse-grained gangue particles is the major reason for the low-quality production.

2.3. Process Mineralogical Analysis

The Wushan Operation carries out quantitative mineralogy routinely for bulk, copper and molybdenum concentrate, respectively. Concentrates are examined to determine the abundance of each type of minerals in each size fraction as well as the liberation of the interesting minerals. Combining the mineralogical information with the plant operating conditions is helpful to optimize the process performance.
Table 4 shows the mineralogical composition of the Cu-Mo separation feed. It contains chalcopyrite as the main copper-bearing mineral, molybdenite as the main molybdeum-bearing mineral and pyrite as the most abundant alternative sulfide mineral. The main gangue minerals in the feed are quartz and feldspar.
Most copper minerals in the feed are liberated, accounting for 86.26% (Table 5). Its association with molybdenite is very minor, accounting for only 1.17%, making Cu-Mo separation easily accomplished. Regrinding of the feed seems therefore unnecessary to avoid copper minerals in Mo concentrate. Most of molybdenite is also liberated, accounting for 82.17% of the total feed (Table 5). According to the microscopic images in Figure 2, molybdenite particles in the feed have no significant interlocking with other minerals and their blade-shaped grains have reached the desired degree of liberation. In general, most sulfide minerals are liberated and barely associated with silicate minerals. A certain amount of pyrite and sphalerite (15.83% and 2.21%, respectively, see Table 4) are present in Cu-Mo separation feed. Although the interlocking of silicate minerals with pyrite and sphalerite might exist at a small extent, it is not the major cause of silicate minerals’ access to molybdenum concentrate. Attempts at increasing the NaHS dosage have been done by the authors to depress sulfide minerals as much as possible, however, the recovery of silicate minerals seemed to not be affected. Therefore, minerals association can hardly devote to the occurrence of silicate minerals in flotation concentrate.

3. Experimental Methods

3.1. Grinding and Flotation

The samples for flotation tests were taken from the froth product in the form of slurry at the 4th cleaner stage of molybdenite flotation circuit at the processing operation of Wushan. A complete test procedure consisted of grinding followed by conditioning and flotation of the ground product were conducted immediately after sampling at plant laboratory.
Grinding was carried out in a Φ250 mm × 100 mm laboratory ball mill. For each grinding test, a slurry sample was added to the ball mill, together with 20 kg grinding media made up of mild-steel balls. The ground slurry was transferred into a 3 litre volume flotation cell with subsequent conditioning and flotation. The time of this transfer was kept within 30 min. The flowsheet and flotation reagent suite used in the tests are illustrated in Figure 3, where collector and frother are not added because the sampled slurry contained these residue reagents. Copper depressant sodium hydrosulfide (NaHS) was added in accordance with the plant flowsheet and reagent regime. During flotation, the agitation speed was set at 1500 rpm, the air flow rate at 15 L/min. The froth products were collected for 20 min by scraping into a pan. Plant process water was used in all wet grinding and batch flotation tests carried out in this study. In the study of the depression effect by water glass, middlings are not included for simplification.
Samples taken during flotation tests were filtered, dried and weighed before elemental analysis. Representative samples were pulverized into fine powder and analyzed using a Bruker S4 Explorer XRF Spectrophotometer. Particle size distribution and size-by-size analysis of flotation feeds was carried out at the sieve sizes of 325 and 600 mesh.
The following equation was used to determine the recovery of Cu, S, Mo, SiO2:
ε = (Qk × β)/(Qn × α) × 100%
where α and β are the percentage weights of the feed and concentrate, respectively; and Qn and Qk are the elemental content of the feed and concentrate.

3.2. Shell-Isolated Nanoparticle Enhanced Raman Spectroscopy (SHINERS)

Surface-enhanced Raman scattering (SERS) is a useful analytical technique to study solid-aqueous interfacial phenomenon as it can provide vibrational spectral information of the adsorbed molecules with extremely high sensitivity (with enhancement factor up to 106). However, only coinage metals such as Au, Ag and Cu with nanostructure are SERS active. The recently invented shell-isolated nanoparticle enhanced Raman spectroscopy (SHINERS) has overcome the long-standing limitation of SERS [11,12]. In SHINERS, SERS-active nanoparticles are encapsulated by a chemically inert shell. The resulting core–shell nanoparticles (SHINs) are then deposited on any solid substrate. Raman signal from a probe molecule located at the solid surface can then be enhanced, as shown in Figure 4.
An important step for the SHINERS procedure is the synthesis of the core-shell SHINs, typical spherical Au@SiO2 with a 55 nm Au core and 2 nm SiO2 shell. In this study, quartz specimen collected from Wushan Mine with cubic geometry was used as and the working side of the specimen was gently abraded with silicon carbide abrasive paper (2000 grits) before further treatment can be applied. A purity of 96.5% (SiO2 content in mass) for the specimen was obtained by X-ray florescence (XRF) analysis. The specimen was then rinsed with copious amounts of Milli-Q water, dried in air, deposited with SHINs and rinsed with copious Milli-Q water again. The deposited SHINs particle was very stable without obvious spalling by water rinsing or immersing in analyte. Any probe molecule adsorbed onto silica shell is equivalent to its interaction with quartz minerals as similar surface characteristics between these two materials.
Raman data was collected on a Invia Reflex Raman Microscope (manufactured by Renishaw, Wotton-under-Edge, UK) using a 785 nm wavelength laser and 1200 line/mm grating. The SERS spectra were collected using a 50× long working distance objective lens at a laser power of 25 mW. The exposure time for each spectrum collection was 1 s with 3 accumulations. The in-situ SHINERS measurements were conducted with a thin reagent-bearing solution covering the surface. The spectrometer was calibrated to the vibrational Raman band of silicon ca. 520 cm−1 prior to the experiment. Normal Raman spectra of pure chemicals were collected with 250 mW laser power using a 10 s exposure with one accumulation.

3.3. Focused Beam Reflectance Measurement (FBRM)

In this investigation, molybdenite specimen and quartz specimen were collected from Wushan Mine, ground to fine particles using mortar pestle. Pre-required volume of slurry was transferred into a 250 mL glass beaker, giving the targeted solids concentration of 10%. The FBRM instrument (G400, manufactured by Mettler-Toledo, Columbus, OH, USA) consists of a processing unit and a probe with a 19 mm diameter tip that has a 14 mm diameter sapphire window at the end. The FBRM probe was placed into the stirred slurry in a vertical position near the inner wall of the beaker. The slurry was stirred by a four-blade turbine impeller equipped in a dedicated FBRM stand. Stirring rate was set at 400 rpm, with the capture of FBRM data recorded in primary mode at 2 s intervals for total capture time of 10 min. The distributions are presented as curve graphs for ease of comparison but should actually be column graphs. A volume-weighting was achieved by applying a square-weighting to the chord length distribution [13].
According to the mineralogy study, quartz is the most abundant silicate minerals in molybdenum concentrate at Wushan Operation, majorly accounting for the high SiO2 grade of concentrate. Feldspar is the second most abundant silicate minerals at Wushan Operation, and it exhibit similar characteristics in terms of surface properties. Therefore, quartz single mineral specimens were collected from the mine for surface analysis and particle size analysis.

4. Results and Discussion

4.1. Water Quality Analysis

Flotation is a water-intensive process, in order to minimize the use of freshwater, most mining operations in the world use recycled water, underground water, saline water, or seawater, which contain various inorganic and organic species. The content of these process water from different sites at Wushan plant are routinely measured on a daily basis. Table 6 gives representative analysis data of water quality at Wushan. It is seen that the water recycled to flotation circuit contain quite amount of Ca (more than 300 mg/L), Fe (1~3 mg/L), Cu (5~6 mg/L). Calcium might partially come from the flotation units where alkaline pH has to be maintained using cost-effective lime (CaO or Ca(OH)2) in order to depress pyrite. Iron is a result of inorganic flocculant added at water treatment plant, supplied by municipal sewage. Acid mine drainage occurs, especially at open pit and tailings dam where iron and copper can be increasingly present. Wushan is located at a high latitude and in a cold region, making the use of sewage water and drainage water necessary in winter and summer, respectively. In general, the water quality at the plant is poor, which may negatively affect the flotation at Cu-Mo separation circuit.

4.2. Activation of Silicate Minerals Flotation

It is obvious from process mineralogical data that silicate minerals are mostly liberated with minor interlocking with other sulfides. The access of silicate particles into the molybdenum concentrate could be due to probable flotation processes such as entrainment, slime coating, and most importantly, activation, which are not related to interlocking and degree of liberation. Fine particle entrainment in the froth is a common phenomenon in a lot of flotation situations. However, it does not necessarily imply that they are majorly responsible for the recovery of silicate minerals at Wushan operation, since their mass fraction of −600 mesh is only 16.24% (Table 2). Overall, the surface properties should be responsible for their inadvertent activation in both bulk flotation circuit and Cu-Mo separation flotation circuit.
It is necessary to review the published research where a number of competing factors can be contributing to the flotation behavior of silicate minerals, especially their activation and depression mechanisms. Calcium ions can form colloidal hydroxides, carbonates, and sulfates, depressing the flotation of sulfide minerals using xanthate as collector at a relatively lower pH [14]. The flotation of molybdenite can also be negatively affected by significantly high concentration of Ca2+ and Mg2+ ions that existing in sea water [15,16]. Hirajima et al. [17] and Wisnu-Suyantara et al. [18] reported the depressing effect of Ca2+ ions on the flotation of molybdenite at pH > 9, which is possibly due to the adsorption of CaCO3 precipitates on the molybdenite surface. A similar detrimental effect of Ca2+ on molybdenite floatability was reported by Lucay et al. [19] in the presence of sulfate ions. In contrast, the flotation of quartz can usually be activated by calcium ions when sodium oleate is used as collector [8,9,10]. Moreover, Fe(III) and Cu(II) ions preferably activate the flotation of feldspar and quartz when NaOL is used as collector around pH 7 [20]. These cations adsorb onto mineral surfaces, leading to an expected increase in NaOL collector adsorption with a subsequent enhancement of flotation recoveries. It has also been reported that quartz can be activated by Cu(II) and Ni(II) and floated with xanthate in the pH 7~10 [21]. In this region, copper hydroxide and nickel hydroxide are stable species precipitating on the surface of silicate minerals, promoting xanthate adsorption. These results indicate the complexity of metal cations effect on the floatability of different minerals in a Cu-Mo ore.
Wushan’s bulk flotation circuit involves a combination of collectors which cannot be disclosed. The flotation collectors of copper sulfide minerals becomes more and more novel nowadays, with the main focus being on the application of non-thiol collectors [22]. In this way, the molybdenite concentrate can easily be cleaned to yield a high Mo recovery with a low consumption of NaHS during Cu-Mo separation circuit. The adsorbed molecules can then be easily removed by NaHS from the chalcopyrite surface uncontaminated with thiol collectors, but this may not be easy for Ca2+ activated silicate minerals because the Ca2+ ions are not significantly affected by hydrosulfide ions. Thus, the activated silicate minerals retain their floatability when tranferring from bulk flotation circuit to Cu-Mo separation flotation circuit. The recovery of silicate minerals are generally lower than the recovery of copper and molybdenum in the bulk flotation circuit, but silicate recovery can be high at the beginning of Cu-Mo separation flotation circuit (see Table 7). There is a probability distribution of particle-bubble collision and adhesion depending on many affecting factors, of which surface hydrophobicity definitely contributes. The activated and hydrophobic silicate particles are concentrated in bulk circuit and these particles can behave highly probable of collision and adhesion at the beginning of molybdenum circuit. In most cases of copper-molybdenum beneficiation plants, the recovery of silicate minerals is low, less than 20% by using fresh water [23]. The inadvertent activation of silicate minerals in Wushan’s case should be a due to the presence of cations in processed water and the recent use of novel copper collectors.
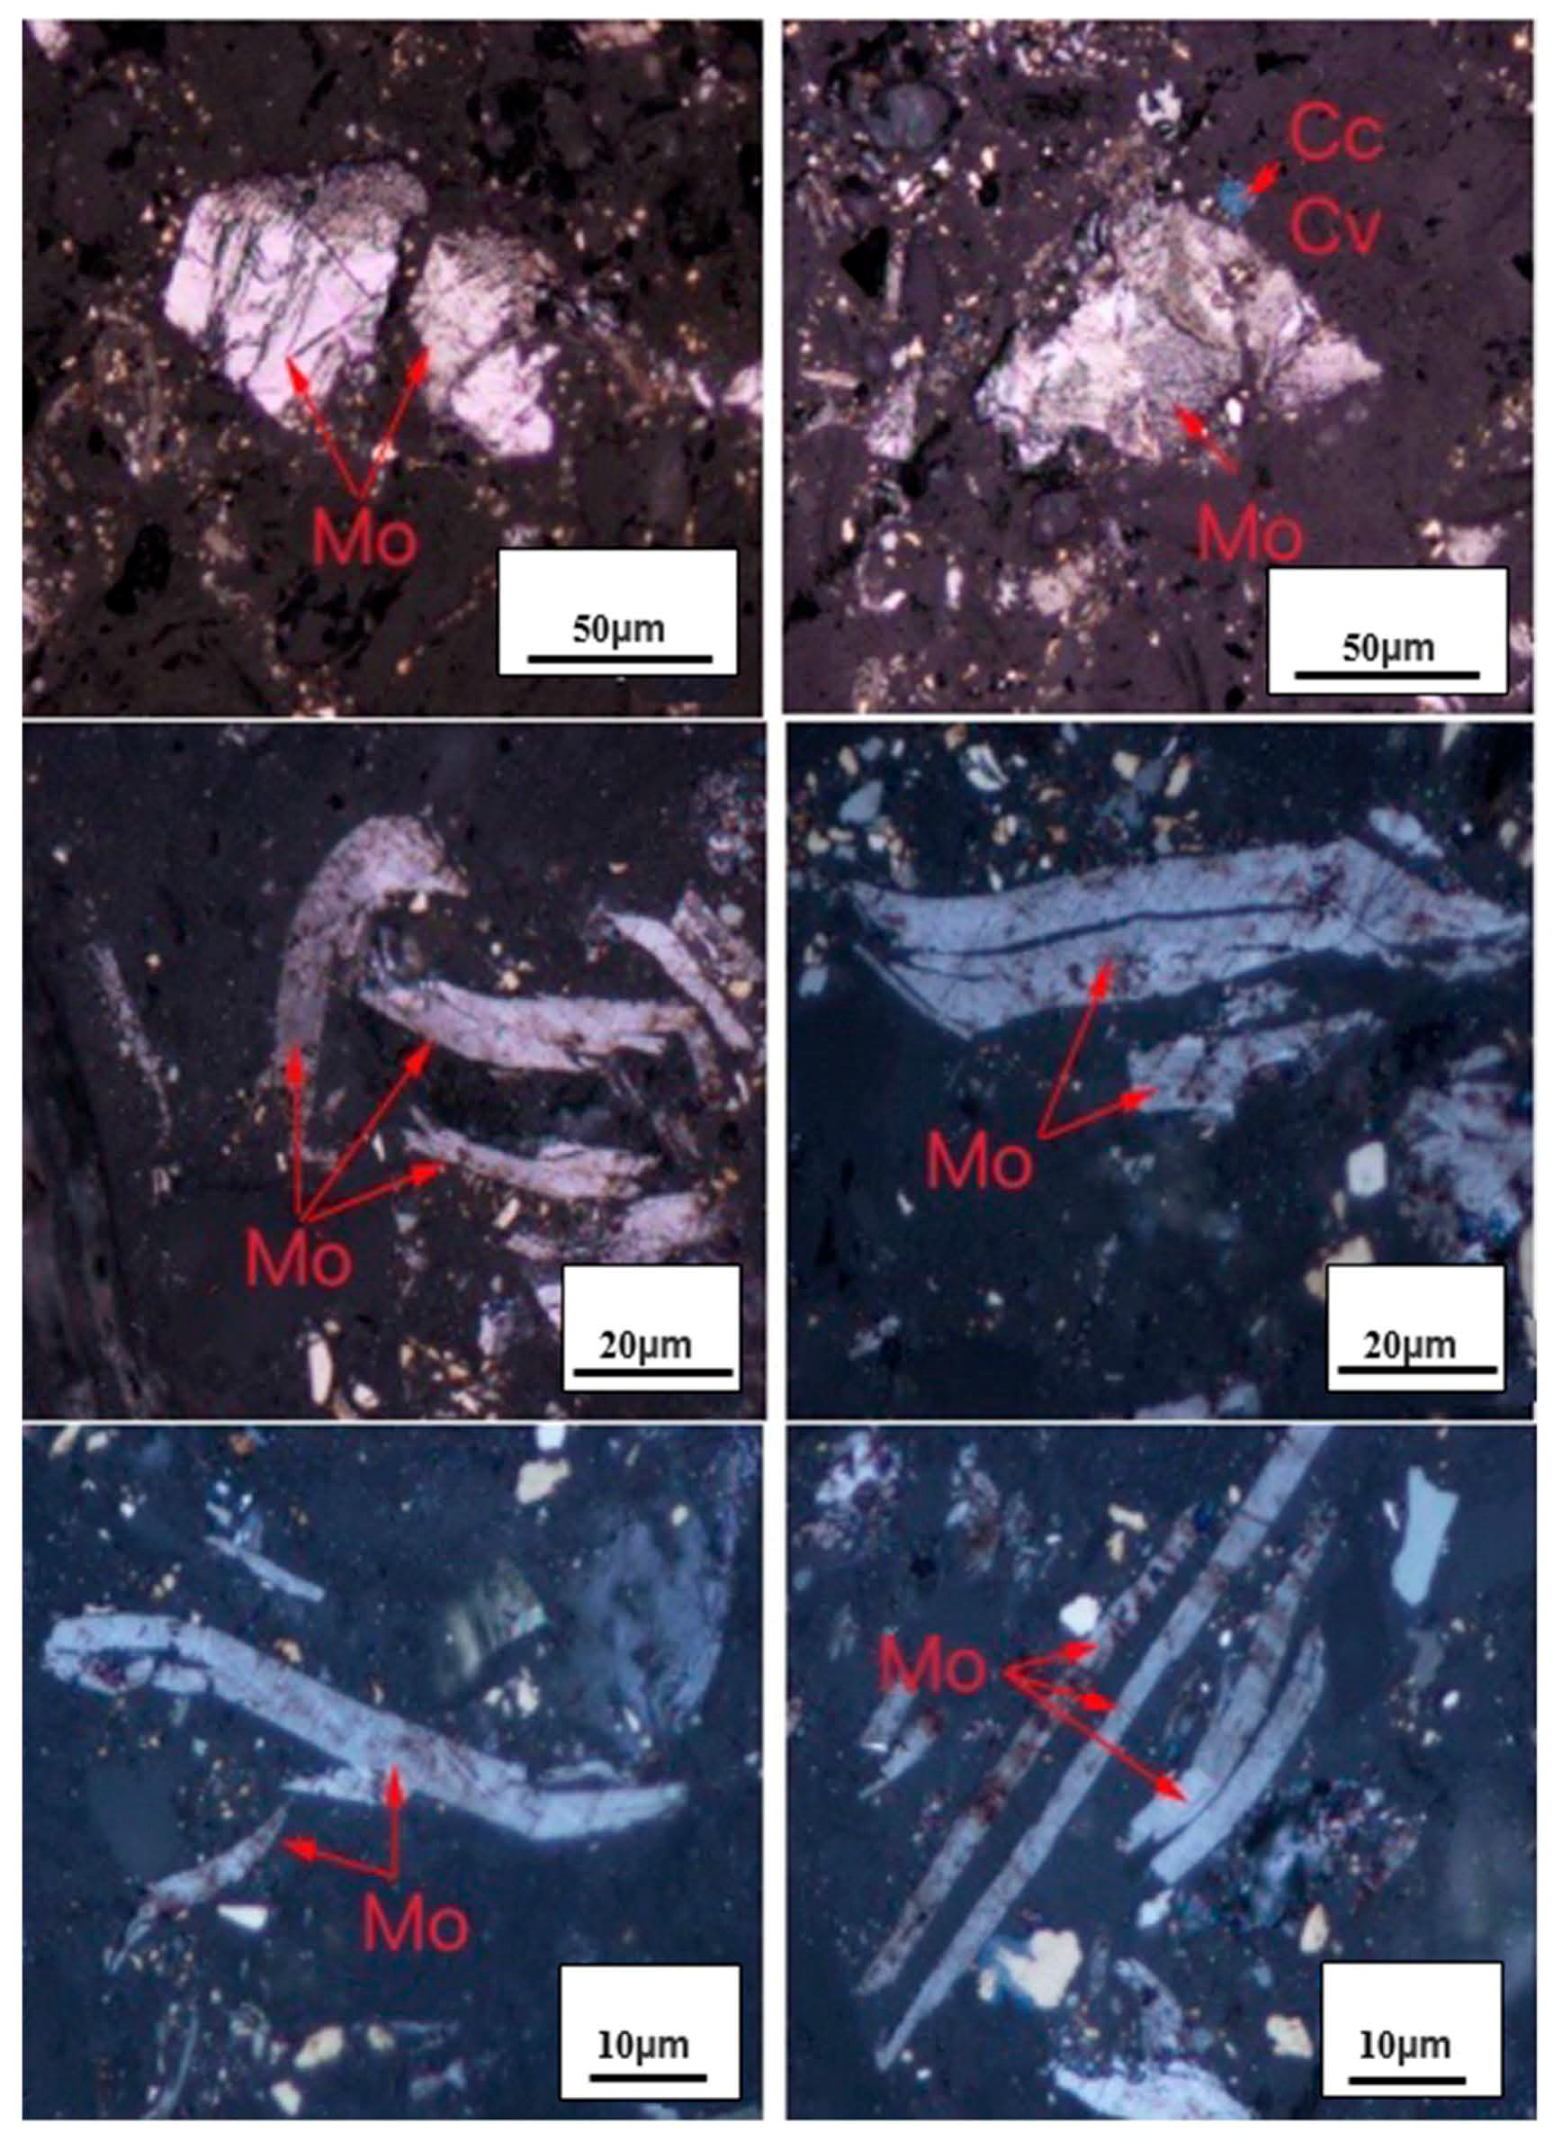
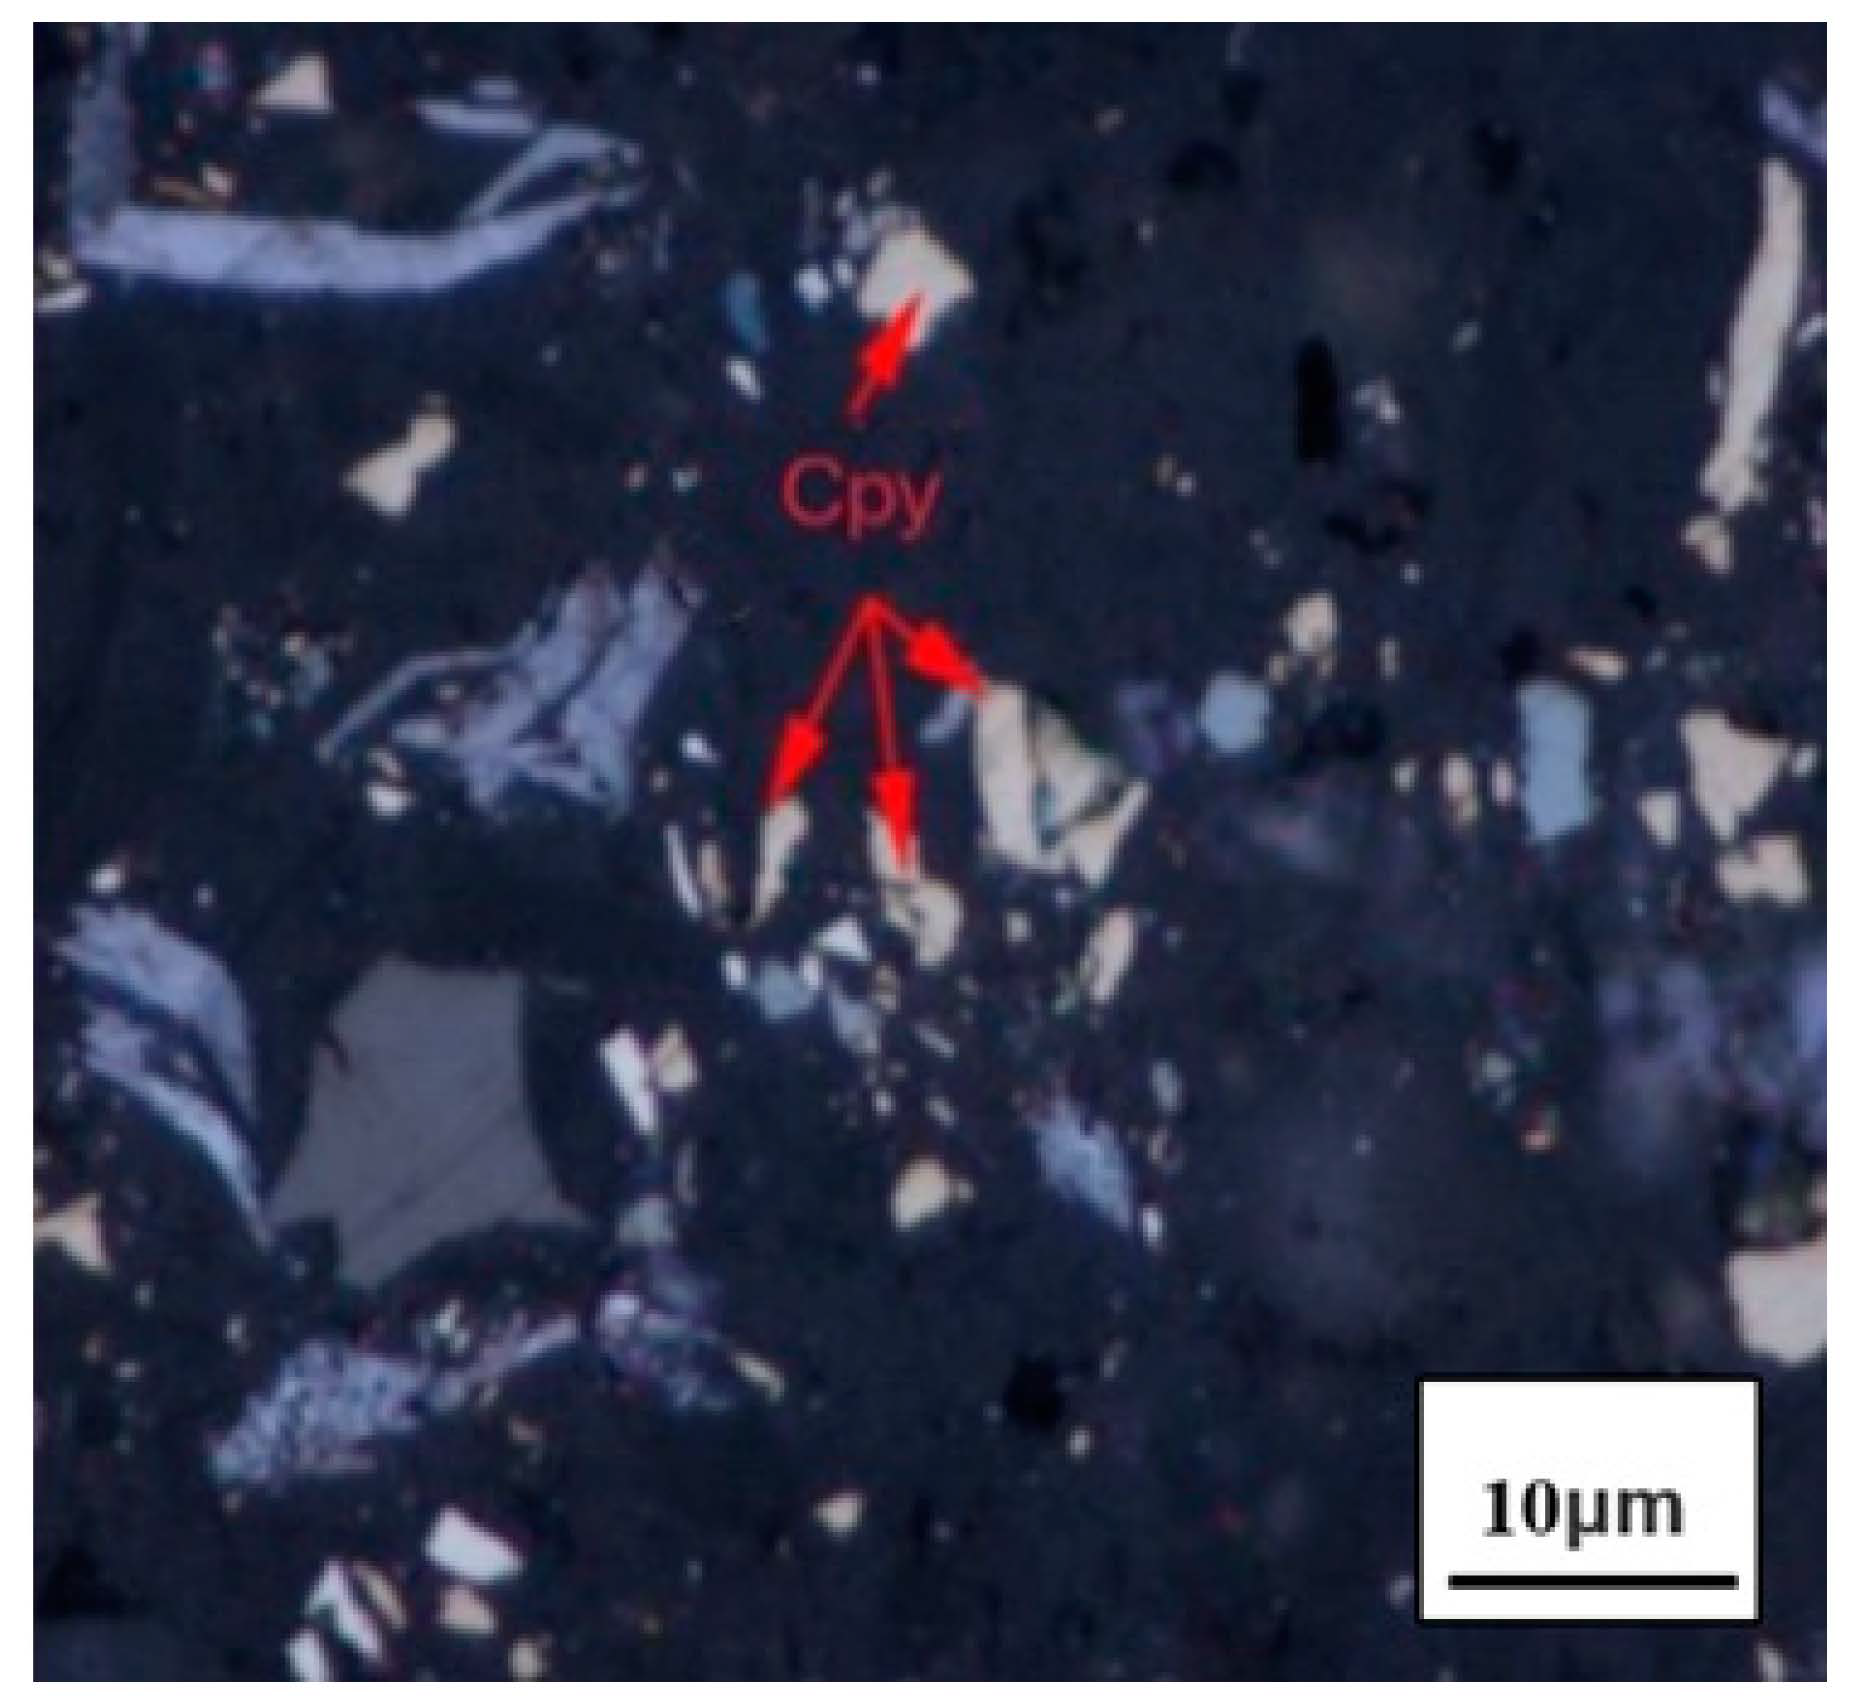
Moreover, flocculants are also used at Wushan’s flotation circuit due to the increasing number of fine particles released by grinding. It is seen from Figure 5 that Wushan’s flotation feed contains quite amount of fine chalcopyrite particles less than 10 μm. Mineralogy shows the mass fraction of ≤10 μm accounts for 27.58% of copper minerals and as high as 36.45% of molybdenum minerals. Low flotation efficiency has been suffered in the beneficiation of low-grade molybdenum ores due to finer size liberation and crystal anisotropy [24,25]. Finer sizes for a high degree of liberation were required for finely disseminated low-grade ores, which reduced the collision and adhesion probabilities of particles to bubbles. As reported, polyethylene oxide (PEO) has been proved to improve flotation efficiency of micro-fine molybdenite particles visibly [23,26,27]. Such flocculants adsorbed onto the mineral surface while bridging particles by the hydrophobic long hydrocarbon chain. Thus, flocculants not only induce the flocculation of fine particles but also improve the surface hydrophobicity, both of which improve the flotation performances of molybdenite and chalcopyrite fine particles. However, the selectivity of flocculants is normally poor, anchoring on silicate and other minerals as well [27,28]. These minerals can then be activated in the floc-flotation. Moreover, molybdenite and quartz fine particles may induce heterogeneous flocculation, contaminating the concentrate.

4.3. Surface Analysis

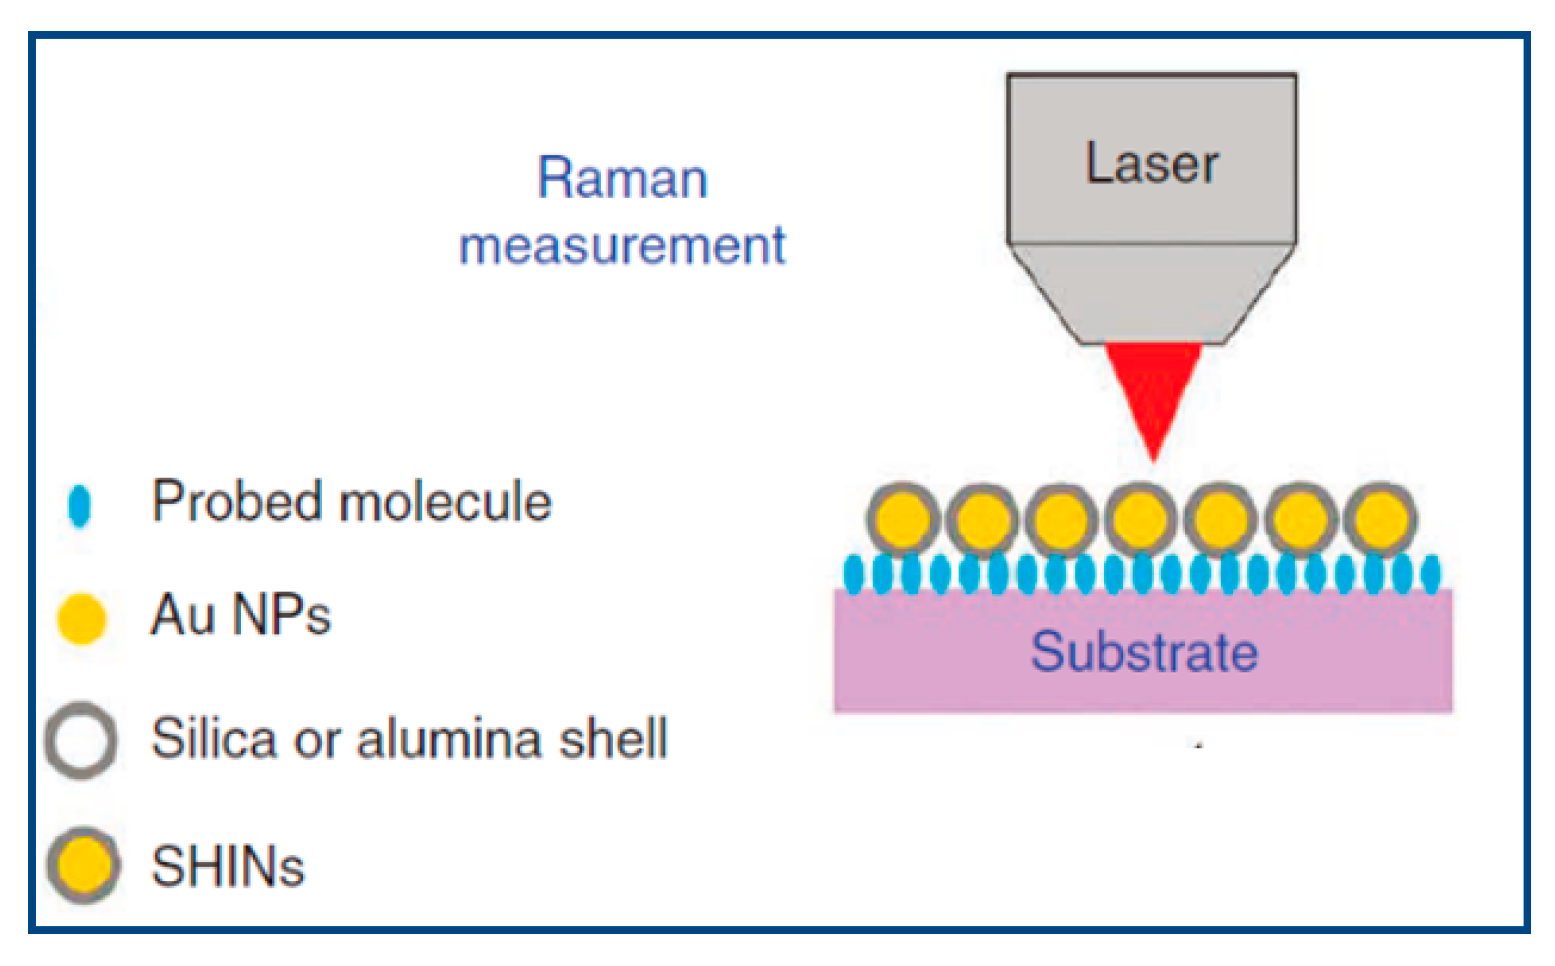
In order to prove the proposed hypothesis regarding the inadvertent activation of silicate minerals in flotation, surface properties of typical quartz mineral were analyzed in response to CaCl2 and collectors by using in-situ SHINERS technique.
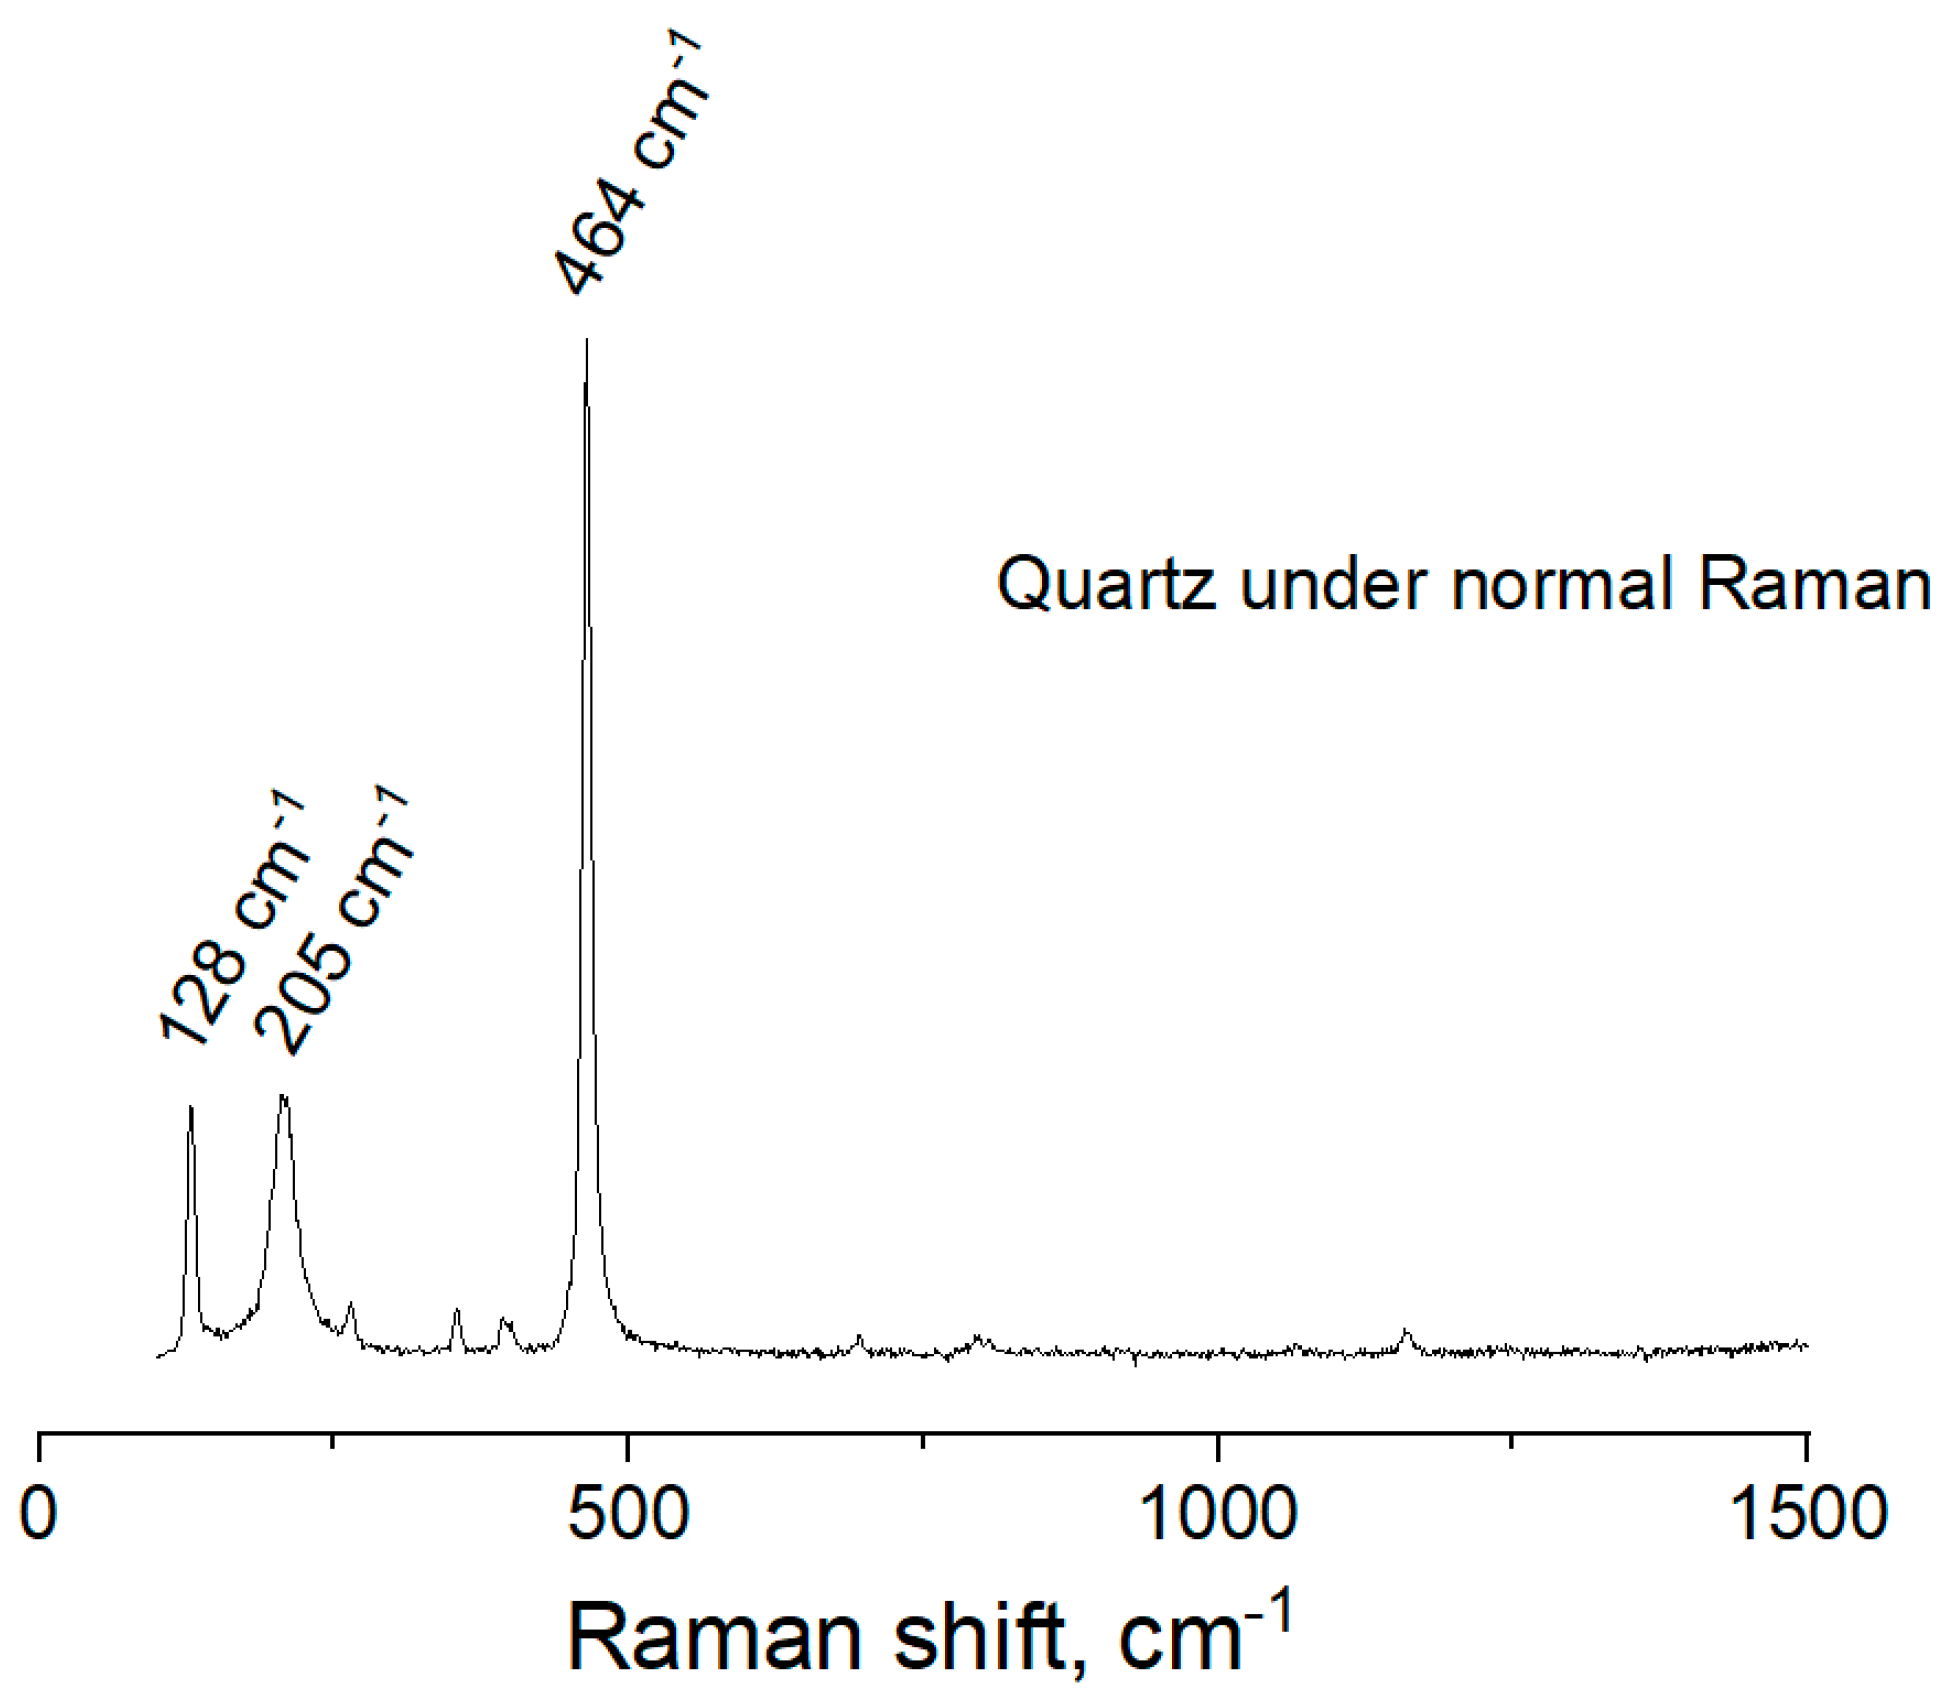
The normal Raman spectra of bulk quartz sample after dry abrading is shown in Figure 6. The intense Raman bands at 128 cm−1, 205 cm−1 and 464 cm−1 are indicative of quartz. For example, the strong peaks at 205 cm−1 and 464 cm−1 can be assigned to Raman active modes of type A1 in quartz crystal. The band at 128 cm−1, corresponds to the Si-O-Si bending vibration, as previously described by Koshchug et al. [29] and Dračínský et al. [30].
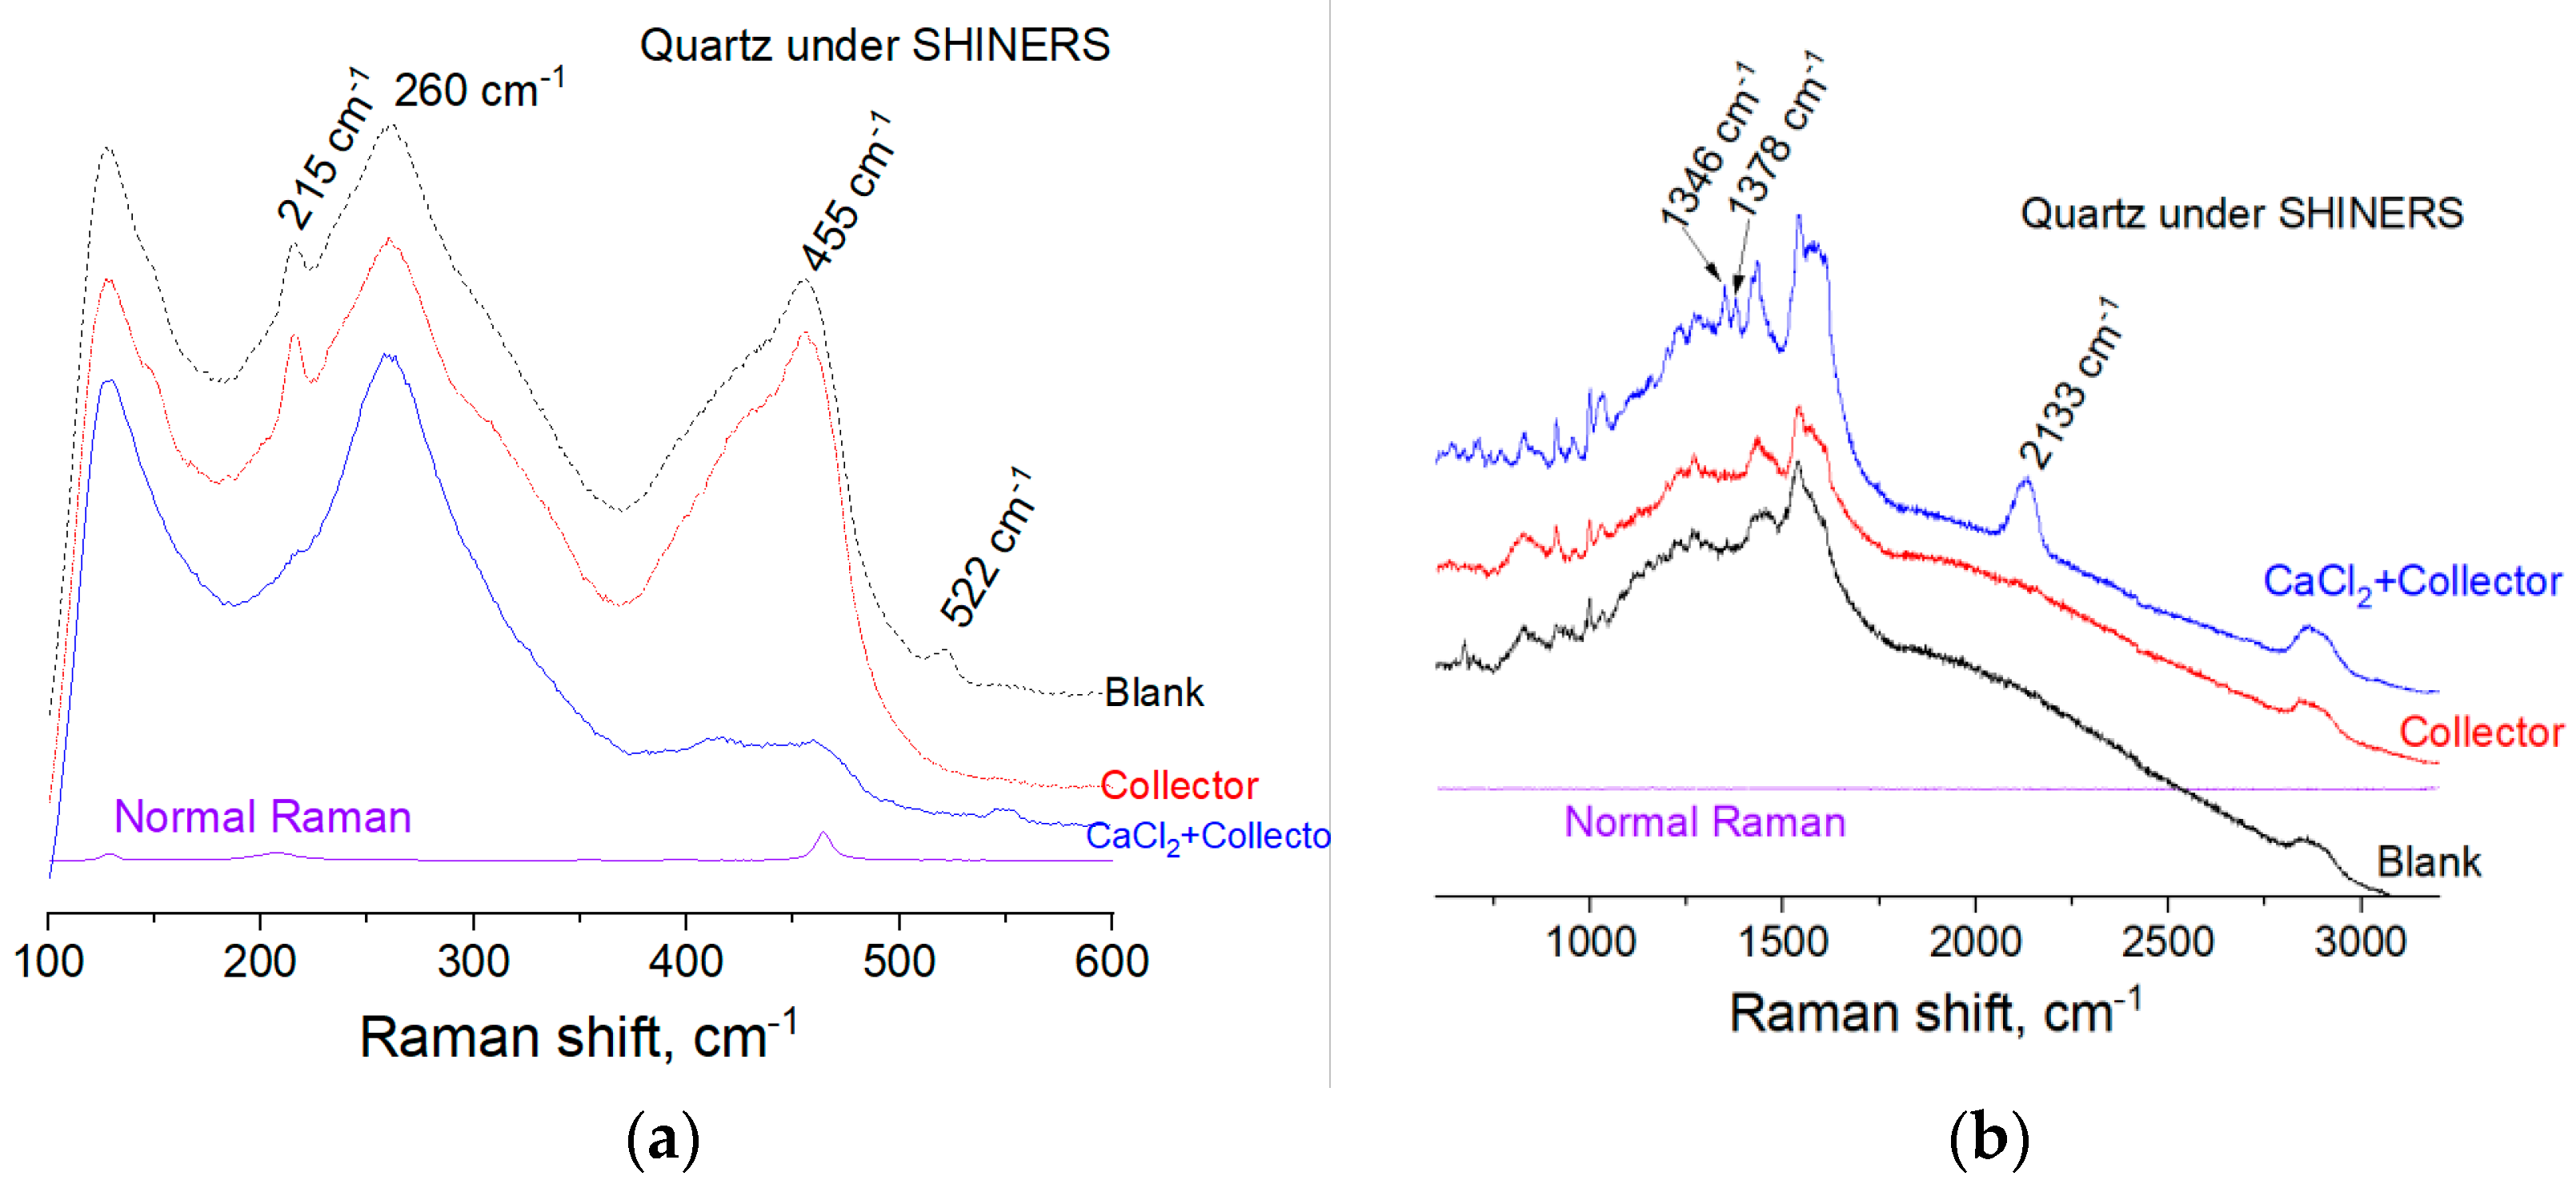
The SHINERS spectra of quartz after dry abrading and SHINs deposition is shown in Figure 7. In Figure 7, normal Raman vibrational modes become less obvious in the SHINERS spectra since the SERS signal is a great deal more intense than the bulk mineral signal. The blank sample’s spectra in Figure 7 were obtained with Raman laser focusing on SHINs deposited area exposing to air, without any presence of aqueous solution. The peaks at 260 cm−1, 455 cm−1 and between 2800~3000 cm−1, a typical region for hydrocarbon vibrations, are probably corresponding to the adsorbed polluting species. These polluting species exist when sample was exposed to air during pre-treatment and physical adsorption may occur as a result of electrostatic attraction, since the quartz surface is largely negatively charged.
Copper collectors implemented at Wushan Operation include SFJ CIBA and RJ-053. A pre-determined concentration of these collector mixture (10−4 M SFJ CIBA and 10−4 M RJ-053) was reacted with the SHINs deposited quartz surface for 20 min before SHINERS spectra can be taken. Upon reaction with the collector mixture, the SHINERS spectra is similar to the blank spectra, indicating the absence of collector adsorption on inactivated quartz surface. The SHINs deposited quartz sample was also treated with 0.005 M CaCl2 solution for 20 min and subsequently treated with 0.005M CaCl2 + 10−4 M SFJ CIBA + 10−4 M RJ-053 mixture solution for another 20 min. The SHINERS spectra were carried out in-situ with a thin film of corresponding solution covering the sample surface. It is seen from Figure 8 that new peaks appear on the spectra compared to the sample treated with collector only. A full list of Raman bands assignment can be difficult as the molecule structure of the marketed products are unknown. However, the vibrational bands at 1346 cm−1, 1378 cm−1 and 2133 cm−1 should be a result of collectors’ adsorption onto quartz surface. Moreover, characteristic bands at 215 cm−1 and 455 cm−1 for polluting species are greatly diminished, which is associated with the adsorption of collectors.
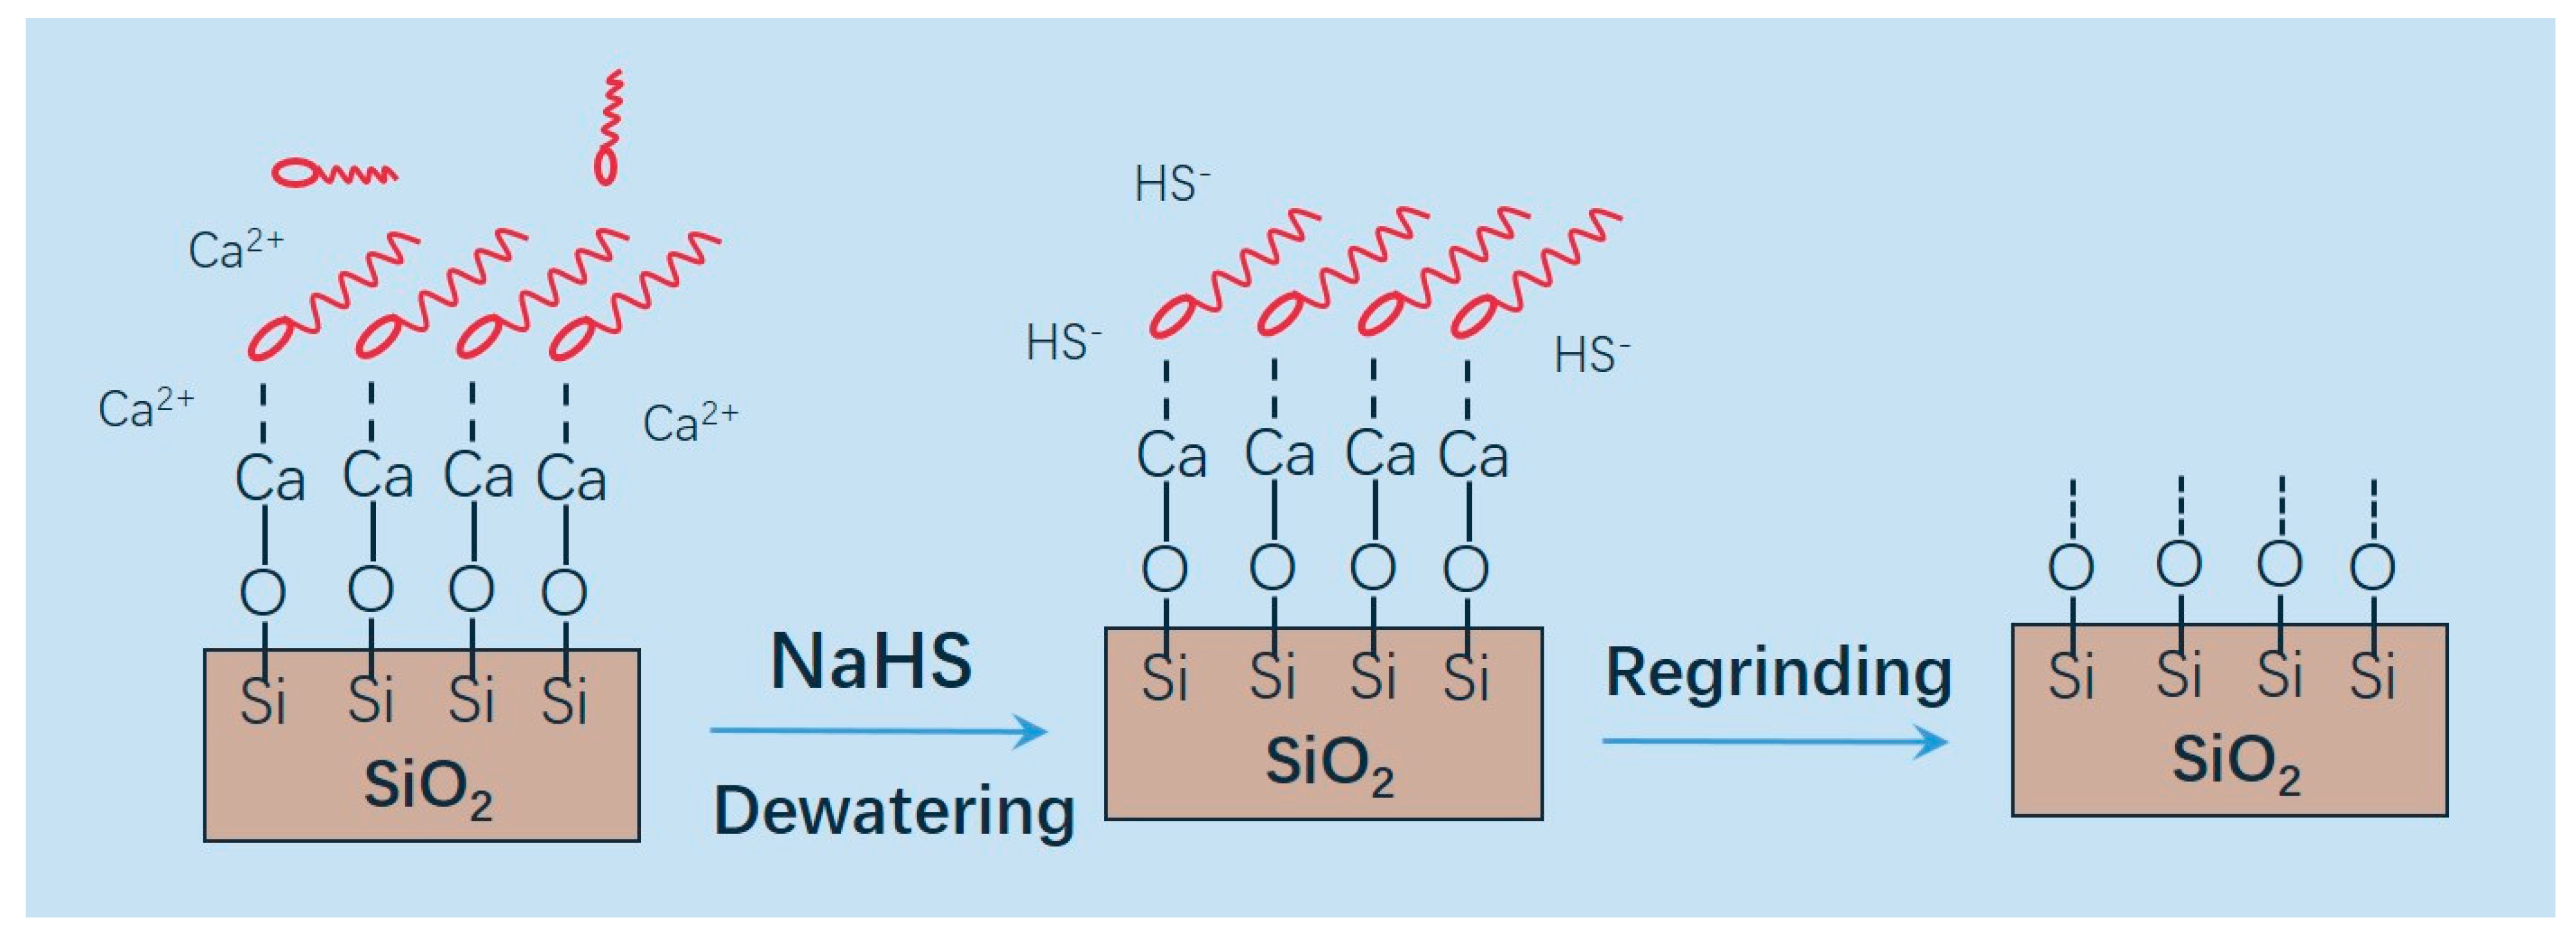
It is implicated that the novel copper collectors at Wushan Operation can also adsorb onto Ca2+-activated quartz, rendering its surface hydrophobic. As HS does not complex with Ca2+ or quartz, the activated surface can retain its surface hydrophobicity during the process of NaHS depression. According to the water analysis in Table 6, calcium ions concentration was largely higher than iron and copper ions, reasonaly accounting for the activation of silicate minerals. Mechanical damage during regrinding may remove the surface layer, in addition to particle size reduction. The proposed mechanism of quartz activation and depression is schematically illustrated in Figure 8.

4.4. Depression by Water Glass

Sodium silicate solution (commonly known as water glass) is a typical depressant for silicate minerals’ flotation [31,32,33]. Molecular dynamics simulations and density functional theory calculations demonstrated that water glass formed a dense adsorption layer on quartz, with both strong hydrogen bond and covalent bond being the main driving forces for adsorption [34]. The stable adsorption layer prevents Ca2+, Mg2+, and collectors from contacting quartz. Meanwhile, adsorption increases the electronegativity of quartz particles and enhances their dispersion. The aggregation between valuable minerals and fine gangue minerals can then be greatly reduced, avoiding the deterioration of concentrate grade.
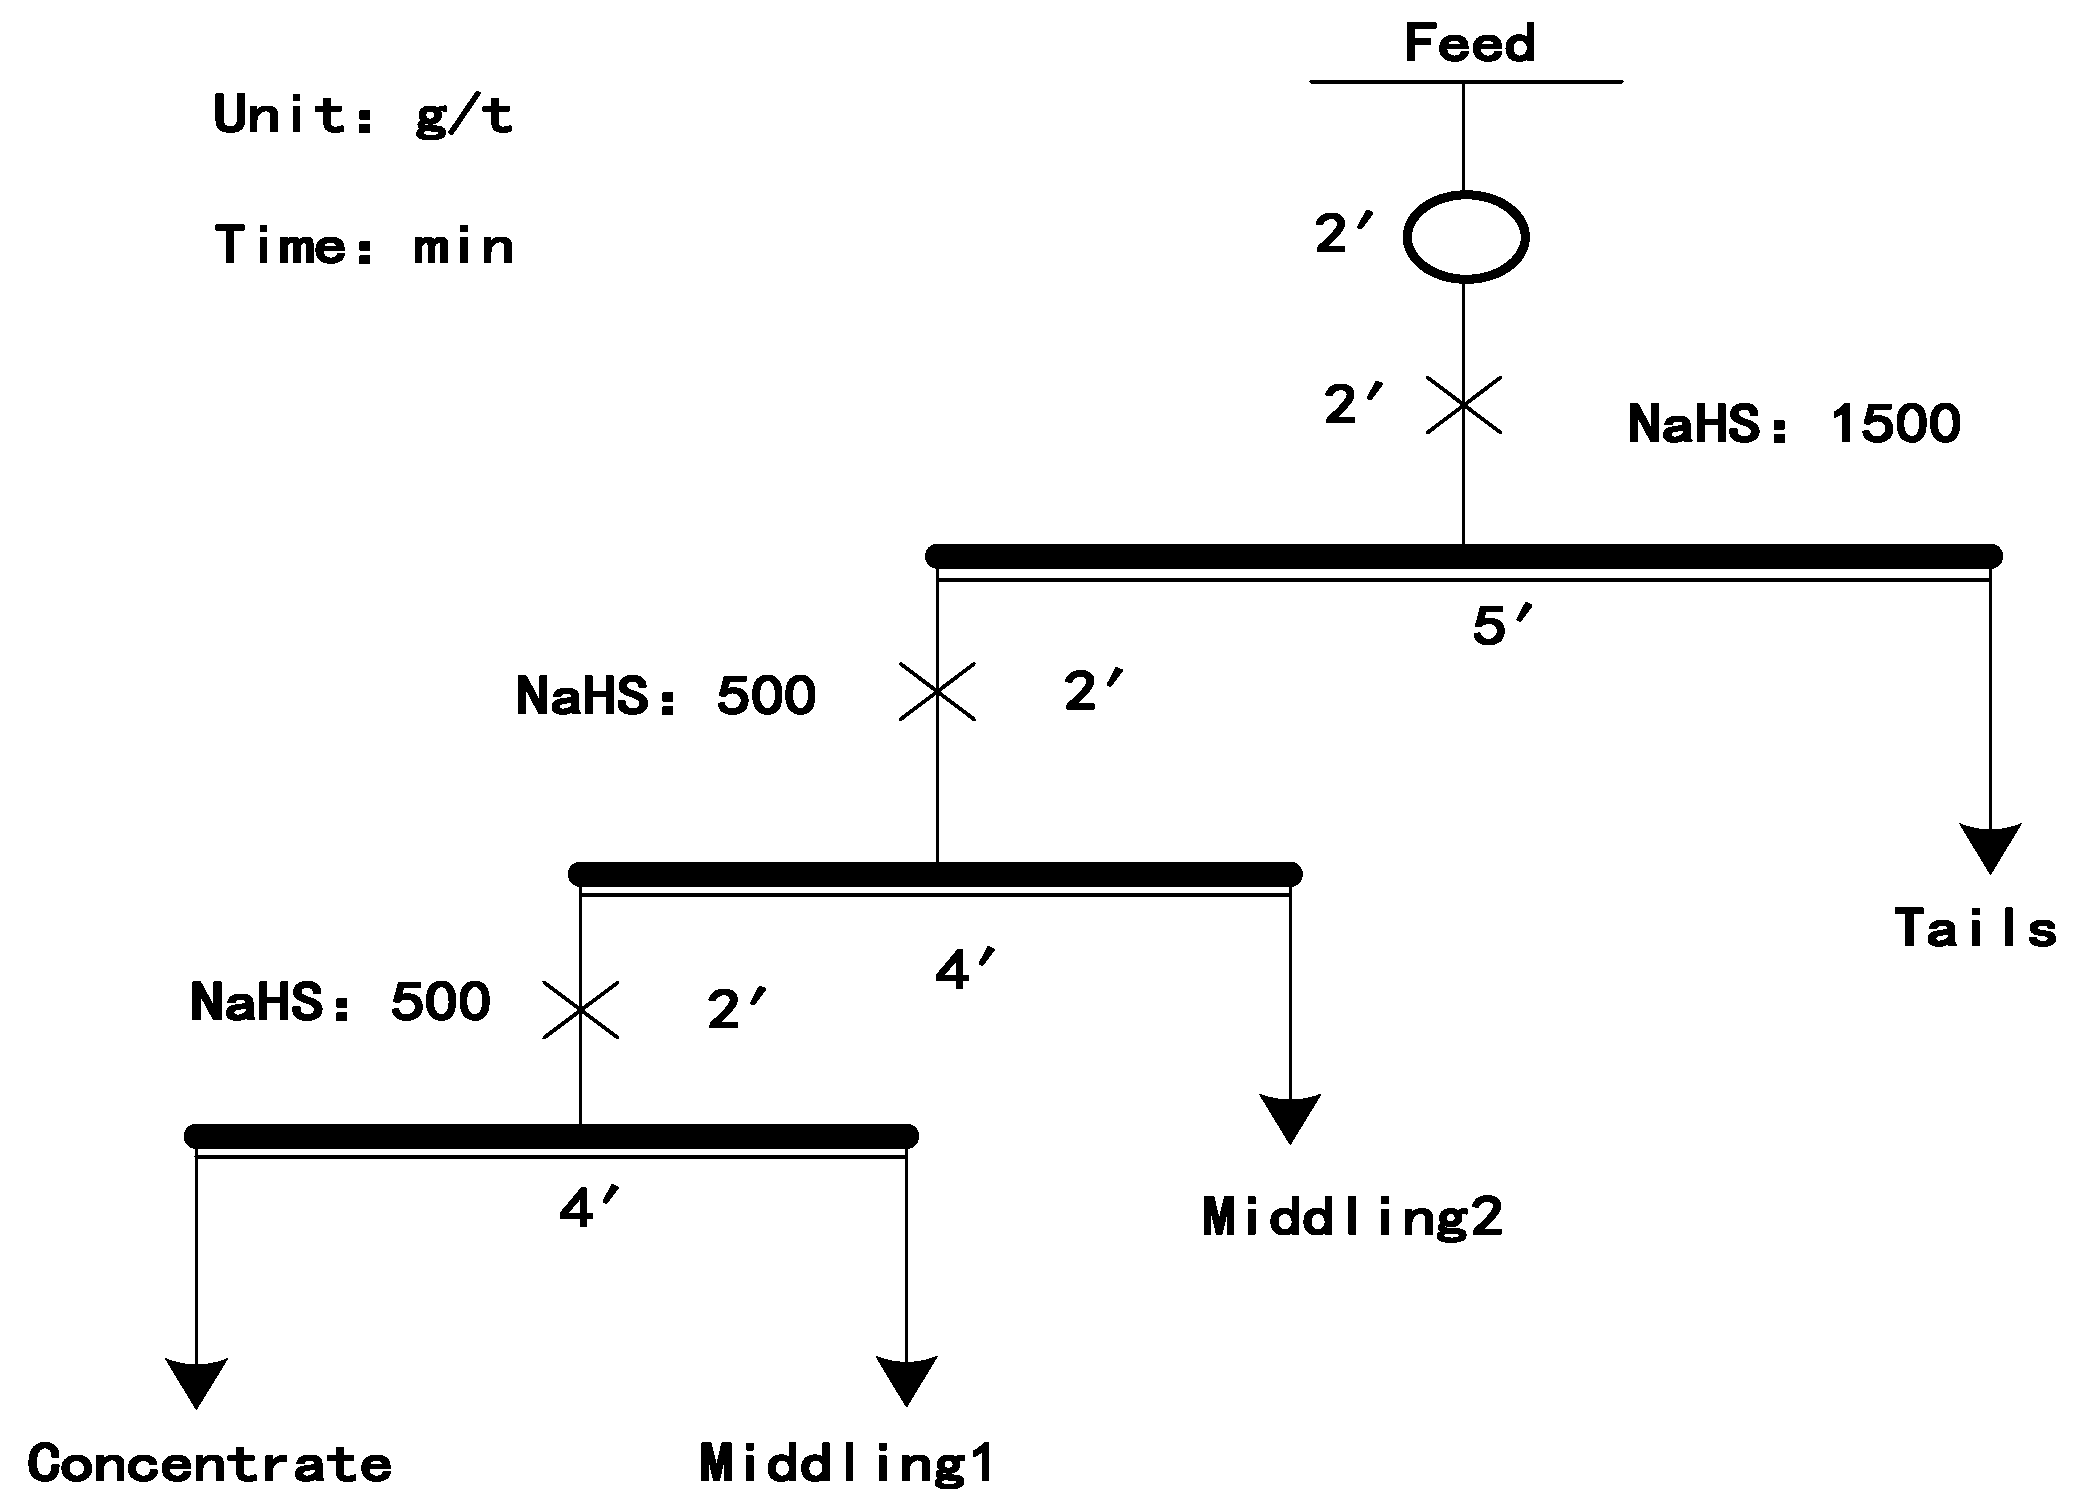
The rougher flotation tests carried out are summarized in Table 7. Adding appropriate amount of water glass is beneficial to reduce silica in the concentrate without compromising molybdenum recovery too much. The silica grade of molybdenum concentrate is reduced from 52.39% to 35.12% by merely using rougher flotation and the quality of molybdenum concentrate could be further improved if cleaner stage is included.

4.5. Depression by Regrinding

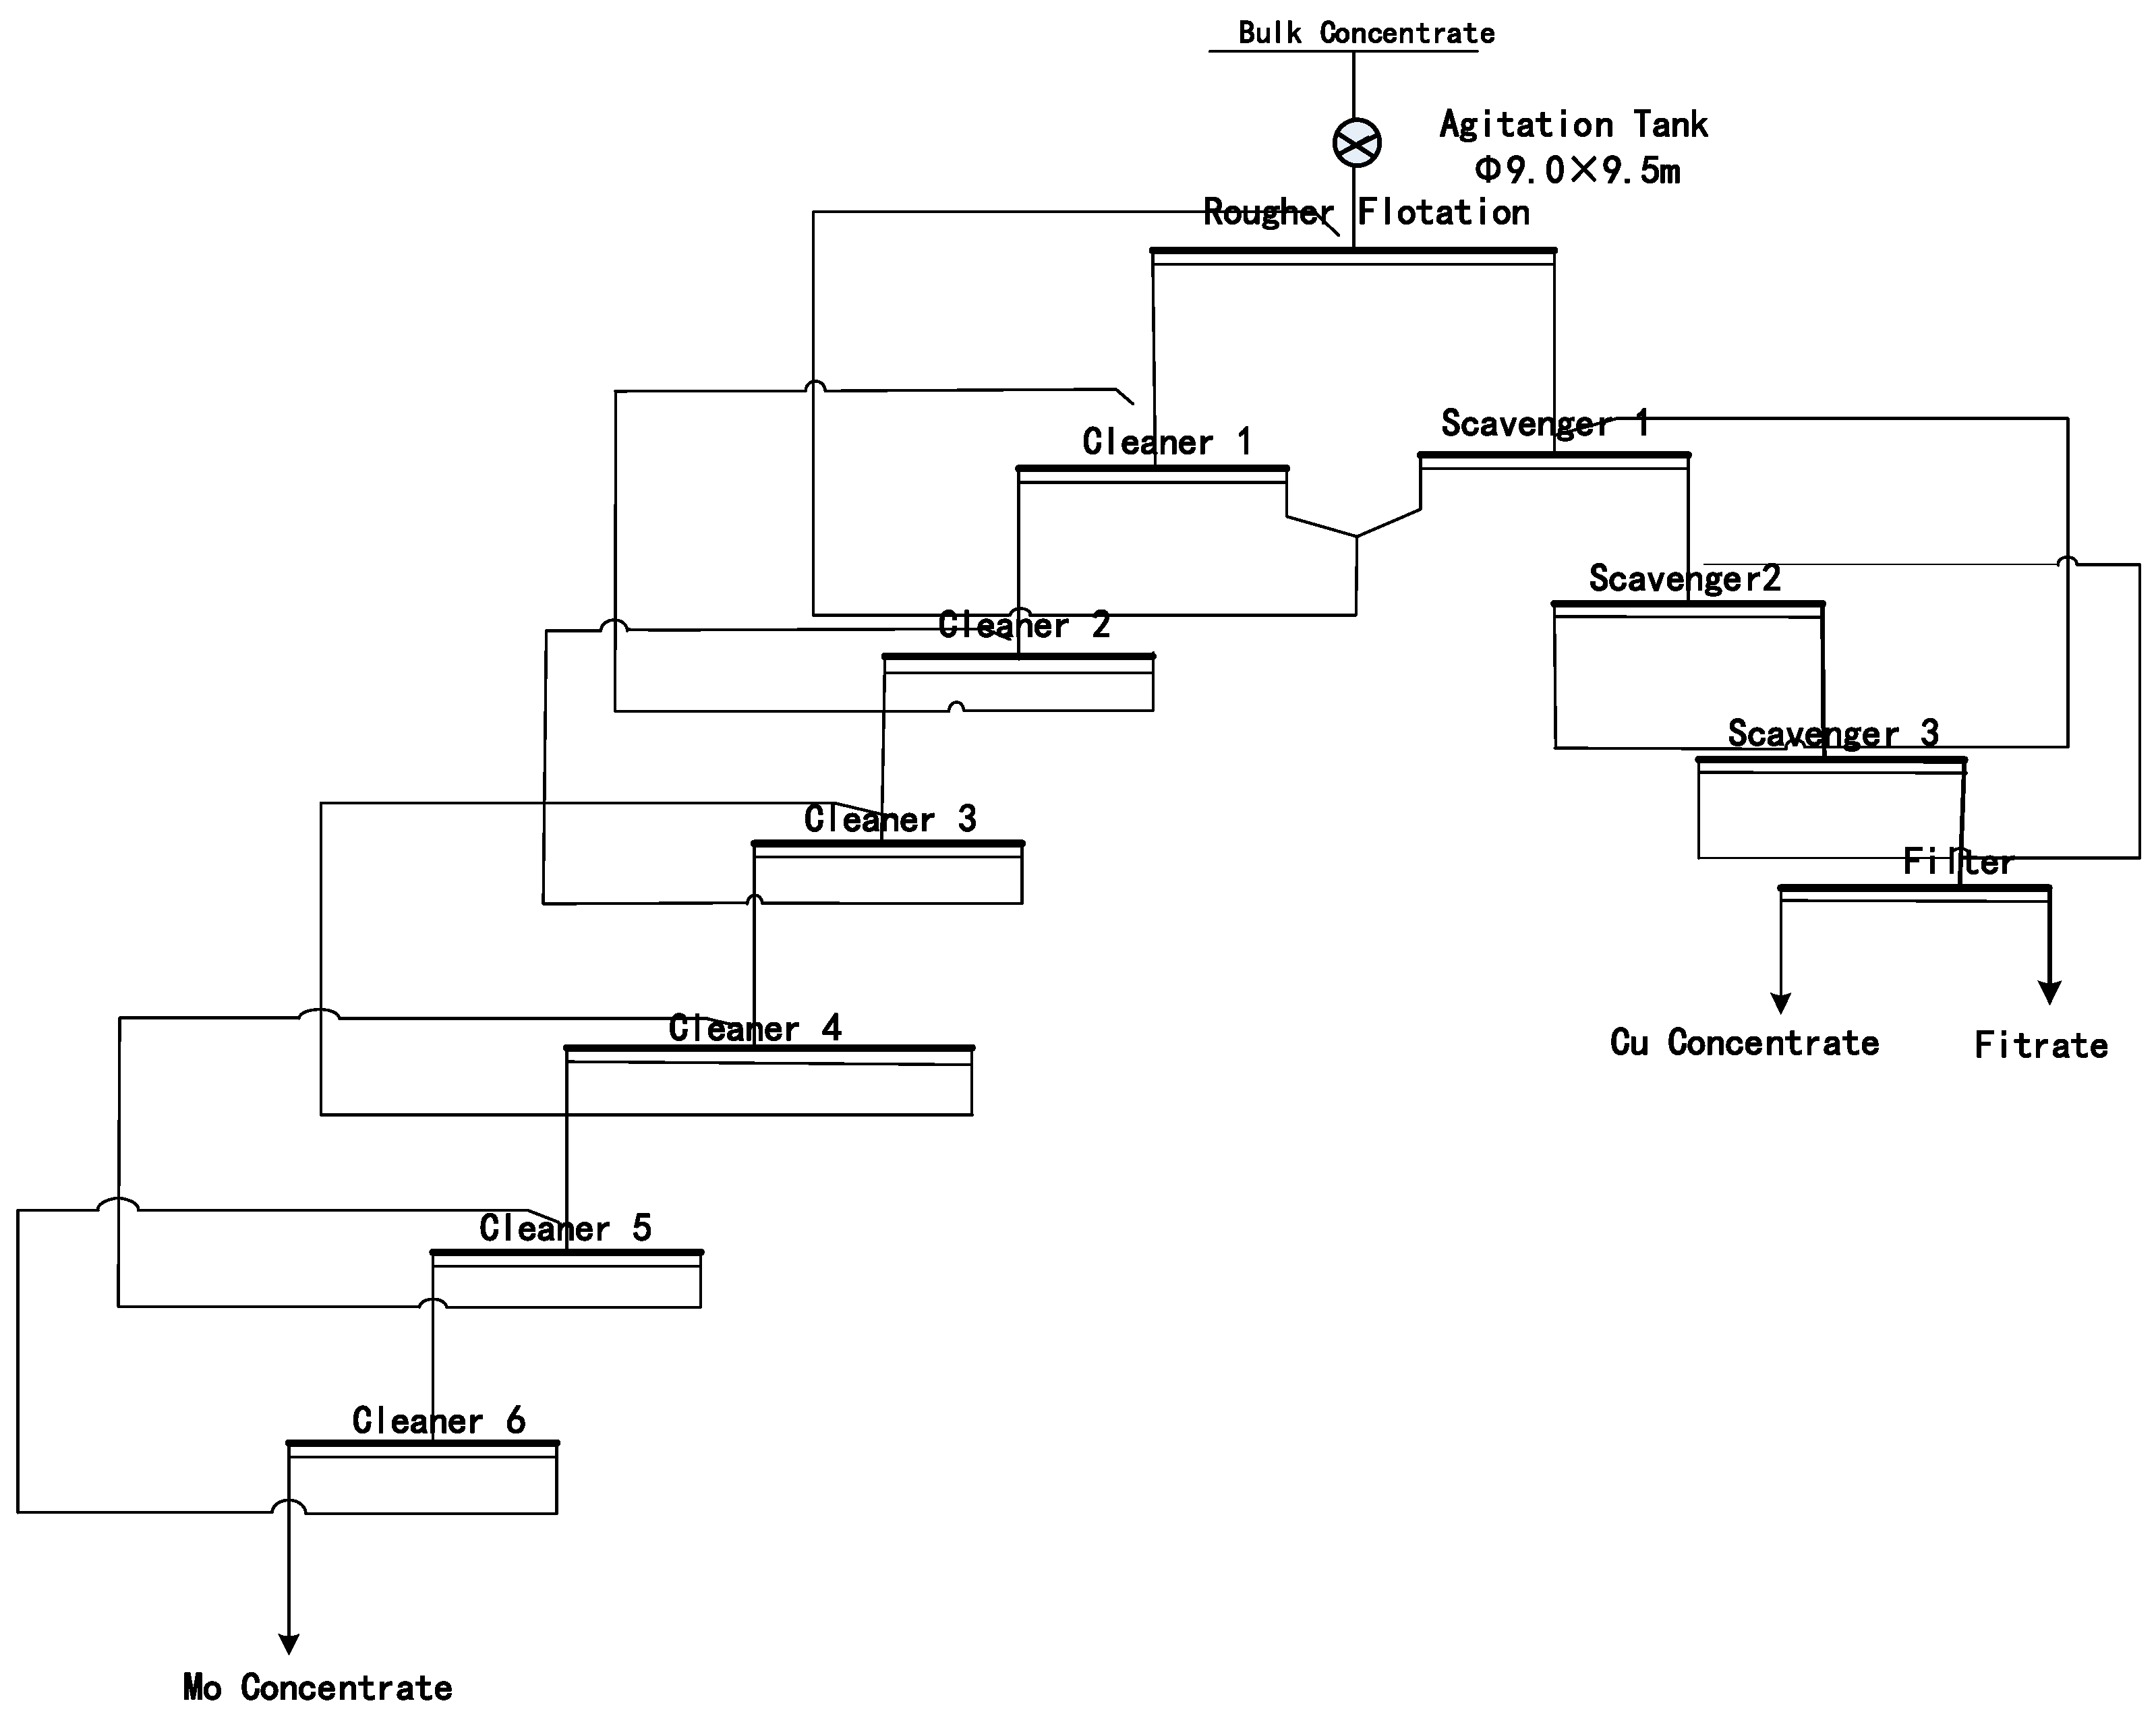
As presented in the process flowsheet, the regrind mill is operating in open circuit. Open circuit grinding is very well-known for producing a flat size distribution with a lot of unnecessary ultra-fines. It is seen from Table 8 that regrinding for 2 min only makes a mass fraction of −325 mesh increasing from 34% to 50%, while the silica content in molybdenum concentrate has been effectively reduced. Molybdenum grade in the concentrate after one stage of rougher and two stages of cleaner operation has been increased to 41.96%, which is 3.79% higher than that without regrinding. It is also seen that the recovery of molybdenite and the mass recovery slightly decreased to some extent, compromising the separation efficiency. Therefore, great caution needs to be taken for the use of regrinding in molybdenum circuit.
In the grinding process, both abrasion/attrition and breakage could be the mechanisms of comminution actions taking place. Attrition may be helpful to obtain freshly fractured surface without reducing particle size too much [35]. The contaminated silicate mineral particles surface can then be cleaned, exhibiting their naturally owned hydrophilic characteristics. Size-by-size analysis of the feed in Table 9 indicates molybdenite particle size is slightly reduced as +325 mesh mass fraction decreasing from 43.00% to 36.96%, while its mass fraction of −600 mesh remains unchanged. However, silicate particle size significantly reduced as +325 mesh mass fraction decreasing from 84.10% to 62.98%. In particular, the mass fraction of −600 mesh increased from 4.64% to 14.18%. The size-by-size analysis implicates that silicate minerals are easier to grind compared to molybdenite. The blade-shaped grains of molybdenite are largely restored in grinding.
Most minerals exhibit the typical size dependent recovery as illustrated by Trahar [36] with the maximum recovery being achieved in the intermediate size fractions and the coarse and fine particles being recovered at a lower rate. For both molybdenum and copper, their recoveries are highest in the range of 20~150 μm [36]. In the case of molybdenum, the finer than 20 μm fraction recovers 10% lower than the optimum size range. The more fine silicate mineral particles that grinding produces, the more difficult their flotation. In contrast, the effects of grinding on molybdenite particle size and the subsequent flotation performance are insignificant.
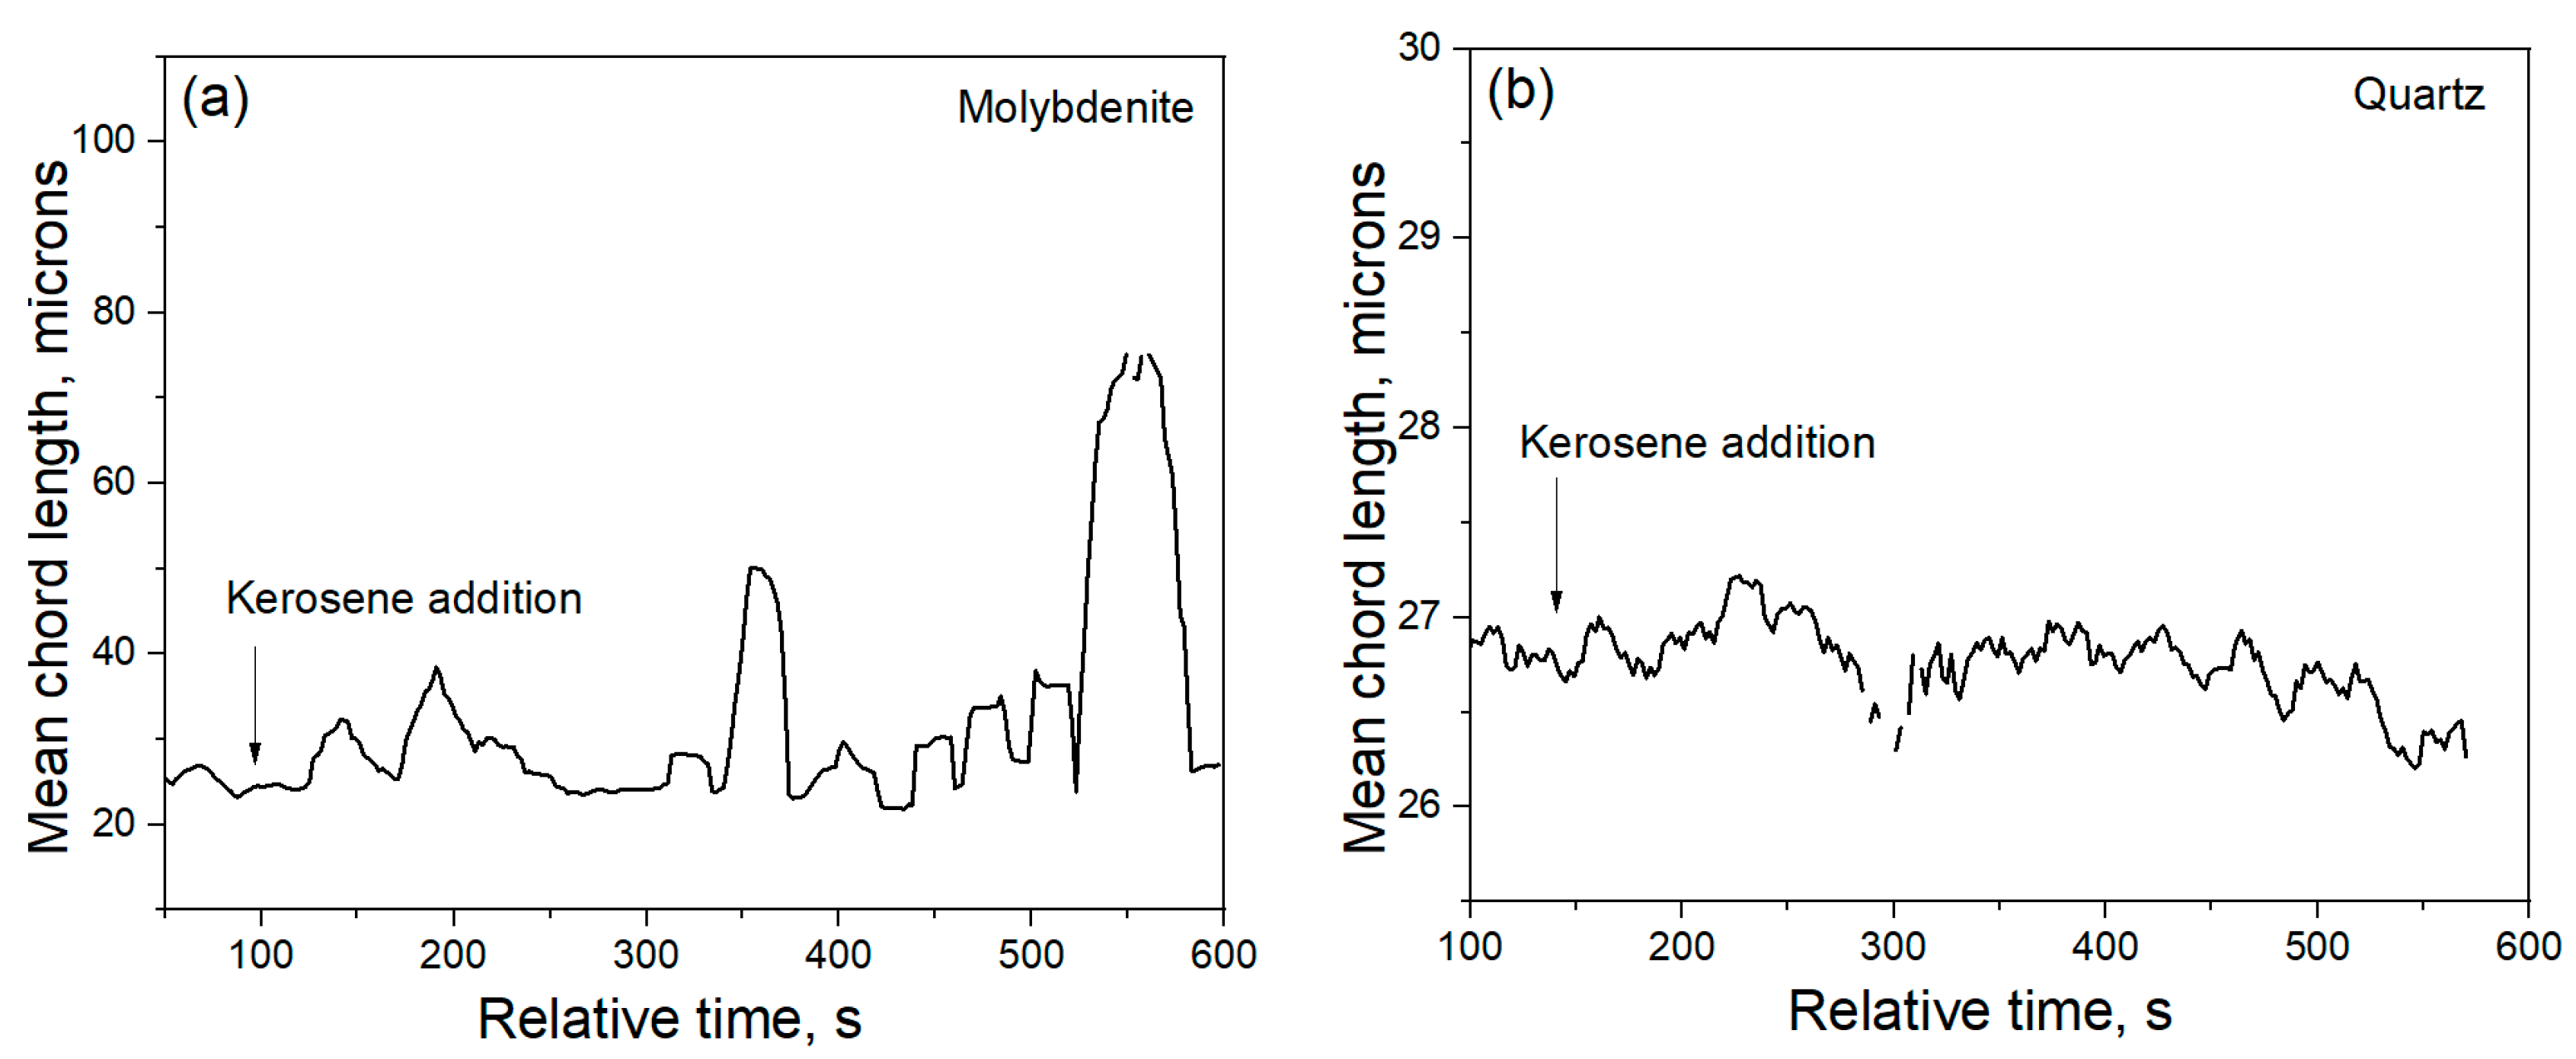
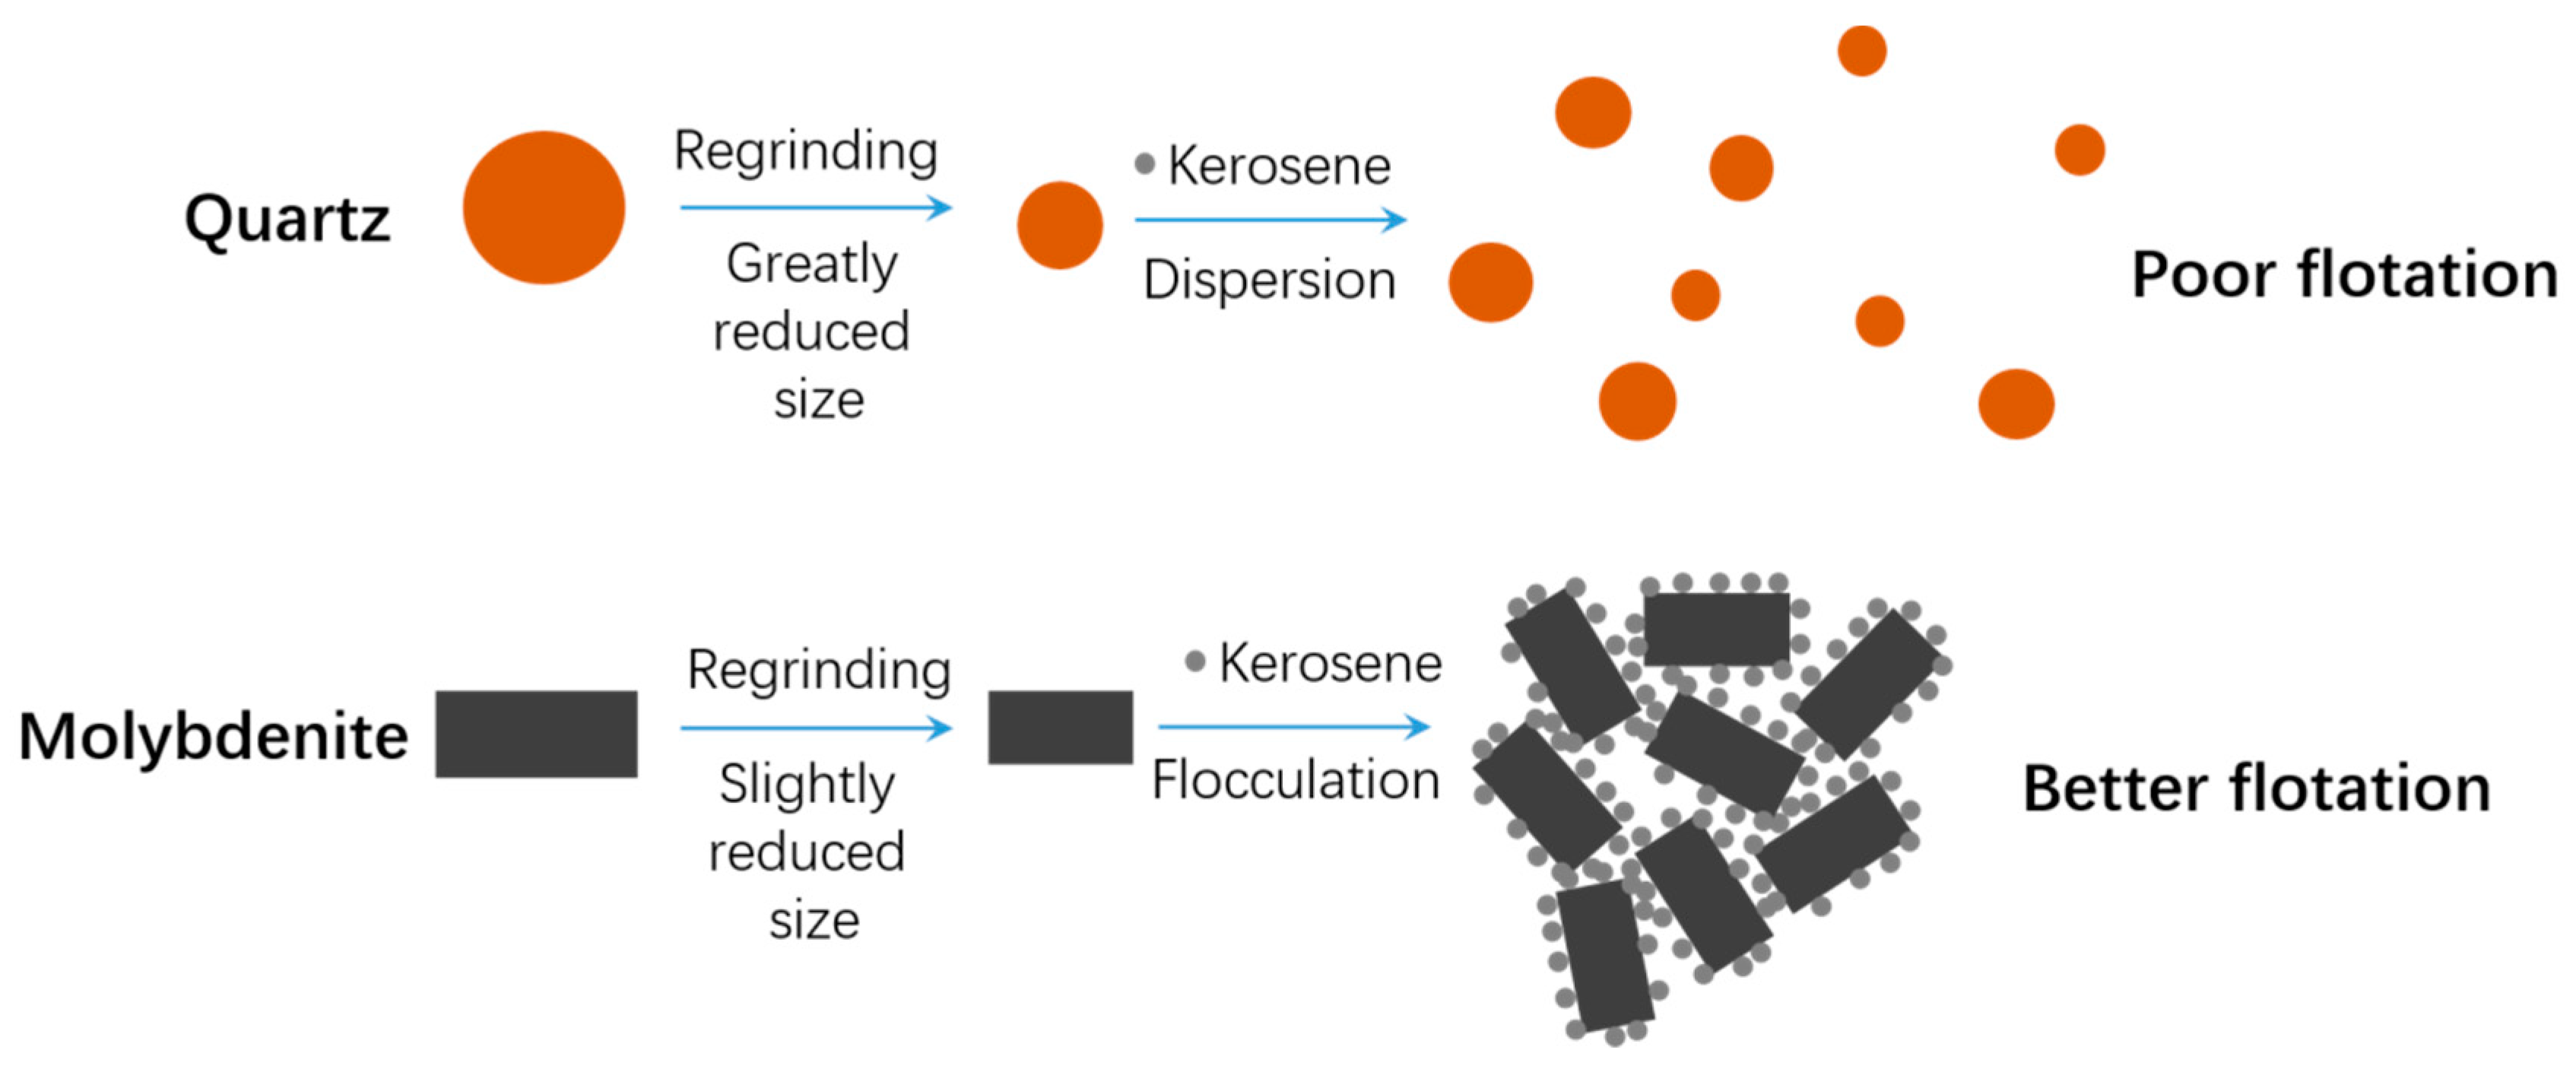
Flocculants has a prominent effect in the microfine molybdenite flotation. In addition, kerosene not only acts at collector, but also induce the formation of large flocs due to the hydrophobic force attraction between molybdenite fine particles. The advanced FBRM instrument can give an online measurement of particle size, rendering flocculation study easier. As seen in Figure 9, molybdenite fine particles exhibited a mean chord length of 26 μm before the addition of any reagent, but it increased to 75 μm shortly after the addition of 0.35 g/L kerosene. 
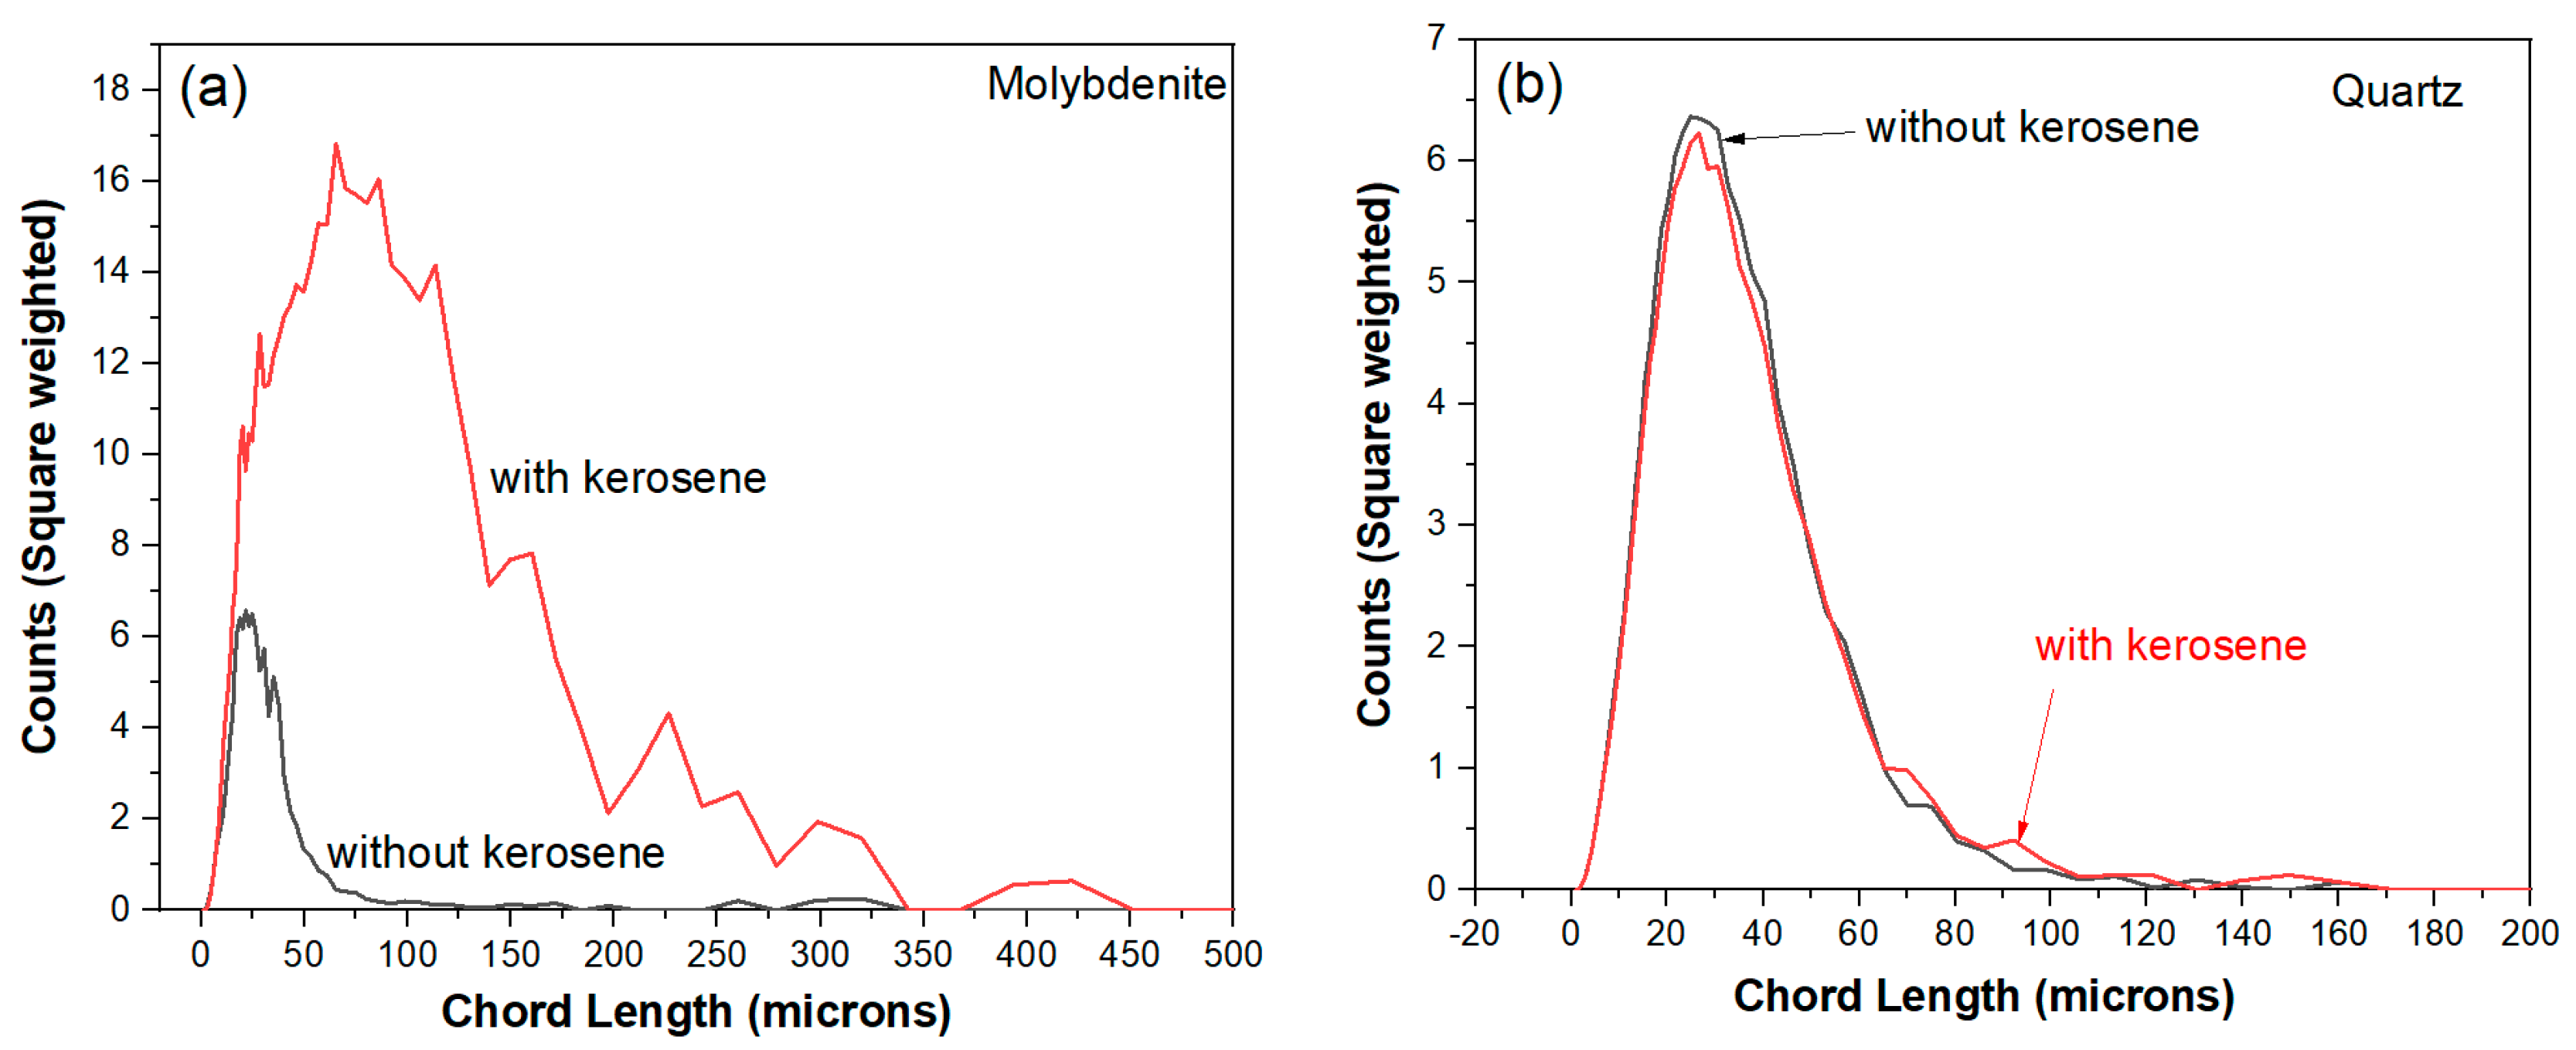
Figure 10 shows that, in square weighted mode, large flocs above average chord length are commonly seen. These molybdenite flocs are easily floated onto the surface of slurry even without the presence of dedicated bubbling. The high points of chord length in Figure 9 were obtained when FBRM probe was lifted adjacent to the surface of slurry, where large flocs are concentrated. Flocs of quartz particles were hardly seen with the addition of kerosene, in accordance with the unchanged mean chord length and its distribution as shown in Figure 9 and Figure 10, respectively.
Hydrophilic silicate mineral particles are not prone to be attractive to each other, therefore flocculation can hardly occur between these particles. The flocs size is conducive to the flotation of microfine molybdenite, leading to enhanced selectivity against silicate minerals. In conclusion, slightly regrinding is beneficial for improving the quality of molybdenum concentrate for two main reasons: firstly, the exposure of nature hydrophilic silicate particle surface upon attrition. Secondly, relatively finer silicate particles lead to poorer recovery. The different particle size was due to differences of grindability between molybdenite and quartz, in addition to flocculation between molybdenite and silicate minerals. The different performances of quartz and molybdenite particles subjecting to regrinding and kerosene are schematically illustrated in Figure 11 for better understanding.

5. Practices with Process Optimization

Several operational changes have been made to capitalize on the findings of the research these include water glass and regrinding to depress problematic silicate minerals. Before optimization, the molybdenum grade of concentrate product averaged at 42.28%. After the optimization, the molybdenum grade reached as high as 46.40%, and the qualified rate increased from 20.48% to 68.60%, as shown in Table 10.

6. Conclusions

Unqualified molybdenum concentrate (≤45% Mo) has been continuously encountered over a period at Wushan copper-molybdenum plant with the problem of coarse silicate minerals transferring into molybdenum flotation concentrate. Process mineralogy and water quality analysis from this period indicated that silicate minerals were inadvertently activated in flotation. The activation of silicate minerals is probably due to the adsorption of divalent metal cations which render their surface hydrophobic upon interaction with novel collectors, as evidenced by advanced in-situ surface analysis. The addition of water glass and the implementation of regrinding at cleaner stage of Cu-Mo separation flotation circuit were found to be effective in depressing silicate mineral flotation and improving the quality of molybdenum production at Wushan Operation. Regrinding is beneficial to obtain a clean and hydrophilic surface. It also leads to finer silicate mineral particles and, consequently, a poorer recovery compared to molybdenite. The presence of kerosene induces flocculation of molybdenite particles, enhancing their tolerance in fine particle flotation.

Author Contributions

Conceptualization, Y.M., T.L. and B.G.; methodology, Y.M. and B.G.; formal analysis, Y.M., W.Z. and B.G.; investigation, F.L. and J.W.; data curation, Y.M. and W.Z.; writing—original draft preparation, Y.M.; writing—review and editing, W.Z. and B.G.; visualization, Y.M. and B.G.; supervision, J.W. All authors have read and agreed to the published version of the manuscript.

Funding

This research received no external funding.

Institutional Review Board Statement

Not applicable.

Informed Consent Statement

Not applicable.

Acknowledgments

This research is supported by the Department of Production and Technology, China National Gold Group Inner Mongolia Mining Co., Ltd. Fuzhou University Testing Fund of precious apparatus (project No. 2020T039) is also appreciated.

Conflicts of Interest

The authors declare no conflict of interest.

References

  1. Chen, Y.; Chen, X.; Peng, Y. The effect of sodium hydrosulfide on molybdenite flotation as a depressant of copper sulfides. Miner. Eng. 2020, 148, 106203. [Google Scholar] [CrossRef]
  2. Pearse, M.J. An overview of the use of chemical reagents in mineral processing. Miner. Eng. 2005, 18, 139–149. [Google Scholar] [CrossRef]
  3. Yan, H.; Yang, B.; Zhu, H.; Huang, P.; Hu, Y. Selective flotation of Cu-Mo sulfides using dithiothreitol as an environmental-friendly depressant. Miner. Eng. 2021, 168, 106929. [Google Scholar] [CrossRef]
  4. Yi, G.; Macha, E.; Dyke, J.V.; Macha, R.E.; McKay, T.; Free, M.L. Recent progress on research of molybdenite flotation: A review. Adv. Colloid. Interface Sci. 2021, 295, 102466. [Google Scholar] [CrossRef] [PubMed]
  5. Yin, Z.; Sun, W.; Hu, Y.; Zhai, J.; Guan, Q. Evaluation of the replacement of NaCN with depressant mixtures in the separation of copper-molybdenum sulphide ore by flotation. Sep. Purif. Technol. 2017, 173, 9–16. [Google Scholar] [CrossRef]
  6. Abdollahi, M.; Bahrami, A.; Mirmohammadi, M.S.; Kazemi, F.; Danesh, A.; Ghorbani, Y. A process mineralogy approach to optimize molybdenite flotation in copper–molybdenum processing plants. Miner. Eng. 2020, 157, 106557. [Google Scholar] [CrossRef]
  7. Triffett, B.; Veloo, C.; Adair, B.J.I.; Bradshaw, D. An investigation of the factors affecting the recovery of molybdenite in the Kennecott Utah Copper bulk flotation circuit. Miner. Eng. 2008, 21, 832–840. [Google Scholar] [CrossRef]
  8. Gao, Z.; Jiang, Z.; Sun, W.; Gao, Y. Typical roles of metal ions in mineral flotation: A review. Trans. Nonferr. Metal. Soc. 2021, 31, 2081–2101. [Google Scholar] [CrossRef]
  9. Wang, Y.; Khoso, S.; Luo, X.; Tian, M. Understanding the depression mechanism of citric acid in sodium oleate flotation of Ca2+-activated quartz: Experimental and DFT study. Miner. Eng. 2019, 140, 105878. [Google Scholar] [CrossRef]
  10. Xie, R.; Zhu, Y.; Liu, J.; Li, Y. Effects of metal ions on the flotation separation of spodumene from feldspar and quartz. Miner. Eng. 2021, 168, 106–931. [Google Scholar] [CrossRef]
  11. Anema, J.R.; Li, J.; Yang, Z.; Ren, B.; Tian, Z. Shell-isolated nanoparticle-enhanced Raman spectroscopy: Expanding the versatility of surface-enhanced Raman scattering. Rev. Anal. Chem. 2011, 4, 129–150. [Google Scholar] [CrossRef] [PubMed]
  12. Li, J.; Huang, Y.; Ding, Y.; Zhang, Z.; Zhou, Z.; Wu, D.; Ren, B.; Wang, Z.; Tian, Z. Shell-isolated nanoparticle-enhanced Raman Spectroscopy. Nature 2010, 464, 392. [Google Scholar] [CrossRef]
  13. Grabsch, A.F.; Yahyaei, M.; Fawell, P.D. Number-sensitive particle size measurements for monitoring flocculation responses to different grinding conditions. Miner. Eng. 2020, 145, 06088. [Google Scholar] [CrossRef]
  14. Zanina, M.; Lambertc, H.; du Plessis, C.A. Lime use and functionality in sulphide mineral flotation: A review. Miner. Eng. 2019, 143, 105922. [Google Scholar] [CrossRef]
  15. Chen, Y.; Chen, X.; Peng, Y. The effect of sodium hydrosulfide on molybdenite flotation in seawater and diluted seawater. Miner. Eng. 2020, 158, 106589. [Google Scholar] [CrossRef]
  16. Qiu, Z.; Liu, G.; Liu, Q.; Zhong, H. Understanding the roles of high salinity in inhibiting the molybdenite flotation. Colloids Surf. 2016, 509, 123–129. [Google Scholar] [CrossRef]
  17. Hirajima, T.; Wisnu-Suyantara, G.P.; Ichikawa, O.; Elmahdy, A.M. Mg2+ and Ca2+ as divalent seawater cations on the floatability of molybdenite and chalcopyrite. Miner. Eng. 2016, 96–97, 83–93. [Google Scholar] [CrossRef]
  18. Wisnu-Suyantara, G.P.; Hirajima, T.; Miki, H.; Sasaki, K. Floatability of molybdenite and chalcopyrite in artificial seawater. Miner. Eng. 2018, 115, 117–130. [Google Scholar] [CrossRef]
  19. Lucay, F.; Cisternas, L.A.; Gálvez, E.; López-Valdivieso, A. Study of the natural floatability of molybdenite fines in saline solutions and effect of gypsum precipitation. Miner. Metall. Explor. 2015, 32, 203–208. [Google Scholar] [CrossRef]
  20. Zhang, J.; Wang, W.; Liu, J.; Huang, Y.; Feng, Q.; Zhao, H. Fe(III) as an activator for the flotation of spodumene, albite, and quartz minerals. Miner. Eng. 2014, 61, 16–22. [Google Scholar]
  21. Fornasiero, D.; Ralston, J. Cu(II) and Ni(II) activation in the flotation of quartz, lizardite and chlorite. Int. J. Miner. Process. 2005, 76, 75–81. [Google Scholar] [CrossRef]
  22. Liu, G.; Lu, Y.; Zhong, H.; Cao, Z.; Xu, Z. A novel approach for preferential flotation recovery of molybdenite from a porphyry copper–molybdenum ore. Miner. Eng. 2012, 36–38, 37–44. [Google Scholar] [CrossRef]
  23. Li, S.; Ma, X.; Wang, J.; Xing, Y.; Gui, X.; Cao, Y. Effect of polyethylene oxide on flotation of molybdenite fines. Miner. Eng. 2020, 146, 106146. [Google Scholar] [CrossRef]
  24. Castro, S.; Lopez-Valdivieso, A.; Laskowski, J.S. Review of the flotation of molybdenite. Part I: Surface properties and floatability. Int. J. Miner. Process. 2016, 148, 48–58. [Google Scholar] [CrossRef]
  25. Zanina, M.; Ametov, I.; Grano, S.; Zhou, L.; Skinner, W. A study of mechanisms affecting molybdenite recovery in a bulk copper/molybdenum flotation circuit. Int. J. Miner. Process. 2009, 93, 256–266. [Google Scholar] [CrossRef]
  26. Alvarez, A.; Gutierrez, L.; Laskowski, J.S. Use of polyethylene oxide to improve flotation of fine molybdenite. Miner. Eng. 2018, 127, 232–237. [Google Scholar] [CrossRef]
  27. Li, S.; Gao, L.; Wang, J.; Zhou, H.; Liao, Y.; Xing, Y.; Gui, X.; Gao, Y. Polyethylene oxide assisted separation of molybdenite from quartz by flotation. Miner. Eng. 2021, 162, 106765. [Google Scholar] [CrossRef]
  28. Tian, J.; Gao, H.; Guan, J.; Ren, Z. Modified floc-flotation in fine sericite flotation using polymethylhydrosiloxane. Sep. Purif. Technol. 2017, 174, 439–444. [Google Scholar] [CrossRef]
  29. Koshchug, D.G.; Koshlyakova, A.N.; Balitsky, V.S.; Vyatkin, S.V. Infrared and Raman spectroscopy study of Si1−xGexO2 solid solutions with α-quartz structures. Spectrochim. Acta A 2020, 233, 118168. [Google Scholar] [CrossRef]
  30. Dračínský, M.; Benda, L.; Bouř, P. Ab initio modeling of fused silica, crystal quartz, and water Raman spectra. Chem. Phys. Lett. 2011, 215, 54–59. [Google Scholar] [CrossRef]
  31. Abaka-Wood, G.B.; Addai-Mensah, J.; Skinner, W. Selective flotation of rare earth oxides from hematite and quartz mixtures using oleic acid as a collector. Int. J. Miner. Process. 2017, 169, 60–69. [Google Scholar] [CrossRef]
  32. Rao, D.S.; VijayaKumar, T.V.; Rao, S.S.; Prabhakar, S.; Raju, G.B. Effectiveness of sodium silicate as gangue depressants in iron ore slimes flotation. Int. J. Miner. Metall. Mater. 2011, 18, 515–522. [Google Scholar] [CrossRef]
  33. Tohry, A.; Dehghani, A. Effect of sodium silicate on the reverse anionic flotation of a siliceous–phosphorus iron ore. Sep. Purif. Technol. 2016, 164, 28–33. [Google Scholar] [CrossRef]
  34. Hao, H.; Cao, Y.; Li, L.; Fan, G.; Liu, J. Dispersion and depression mechanism of sodium silicate on quartz: Combined molecular dynamics simulations and density functional theory calculations. Appl. Surf. Sci. 2021, 537, 147926. [Google Scholar] [CrossRef]
  35. Chen, X.; Peng, Y.; Bradshaw, D. The effect of particle breakage mechanisms during regrinding on the subsequent cleaner flotation. Miner. Eng. 2014, 66–68, 157–164. [Google Scholar] [CrossRef]
  36. Trahar, W.J. A rational interpretation of the role of particle size in flotation. Int. J. Miner. Process. 1981, 8, 289–327. [Google Scholar] [CrossRef]
Figure 1. Flow sheet of the Cu-Mo separation flotation circuit at Wushan Operation.
Minerals 11 01296 g001
Figure 2. The presence of molybdenite (Mo) and other minerals (cv for covellite, cc for chalcocite) in Mo concentrate.
Minerals 11 01296 g002
Figure 3. Flowsheet of experimental test in this study.
Minerals 11 01296 g003
Figure 4. Schematic illustration of shell-isolated nanoparticle enhanced Raman spectroscopy.
Minerals 11 01296 g004
Figure 5. The presence of chalcopyrite (cpy) in bulk concentrate.
Minerals 11 01296 g005
Figure 6. The normal Raman spectra of bulk quartz sample.
Minerals 11 01296 g006
Figure 7. The SHINERS spectra of bulk quartz sample subjecting to CaCl2 and collector mixture, normal Raman spectra is also included for comparison. (a) spectra at low wavenumbers; (b) spectra at high wavenumbers.
Minerals 11 01296 g007
Figure 8. Schematic diagram of Ca2+ and collector jointly activating quartz with subsequent response to NaHS depression and regrinding.
Minerals 11 01296 g008
Figure 9. Flocculation kinetics of molybdenite (a) and quartz (b) particles in response to kerosene addition (0.35 g/L).
Minerals 11 01296 g009
Figure 10. Chord length distribution of molybdenite (a) and quartz (b) particles in response to kerosene addition (0.35 g/L).
Minerals 11 01296 g010
Figure 11. Schematic diagram of fine quartz and molybdenite particles and their performance subjecting to regrinding and kerosene.
Minerals 11 01296 g011
Table 1. The grade of Mo concentrate from various samples.
Sample No.Grade, %
CuMoSiO2
11.7653.019.23
21.1445.4126.01
31.2544.3027.14
42.4443.7835.16
52.4743.7219.66
61.3743.3731.02
71.3840.2337.76
82.0838.6431.69
91.6838.1243.92
101.6336.9540.55
Table 2. Size-by-size analysis of Cu-Mo separation feed.
Size, μmMeshUnqualified PeriodQualified Period
Mass, %SiO2Mass, %SiO2
Grade, %Distribution, %Grade, %Distribution, %
≥74+20030.5136.4455.4817.148.2340.93
74~43200~32522.1415.1216.717.2221.6618.51
43~20325~60018.2912.6811.5721.511.8112.6
≤20−60029.0611.216.2444.1812.7627.97
Sum 10020.0410010020.15100
Table 3. Size-by-size analysis of Mo concentrate.
Size, μmMeshUnqualified PeriodQualified Period
Mass, %Grade%Distribution, %Mass, %Grade, %Distribution, %
MoSiO2MoSiO2MoSiO2MoSiO2
43+32553.1725.9661.0437.5576.8839.7647.7730.6638.746.34
43~20325~60026.1846.226.5732.916.4831.7649.1528.4531.8134.35
≤20−60020.6552.5813.5729.546.6428.4850.8317.8329.4919.3
Sum 10036.842.210010010049.126.3100100
Table 4. Mineralogical composition of Cu-Mo separation feed, %.
MineralsVolume, %
Molybdenite5.67
Chalcopyrite39.83
Covellite5.96
Chalcocite1.12
Bornite5.36
Tennantite3.41
Pyrite15.83
Sphalerite2.21
Iron oxide mineral1.43
Quartz9.11
Potash feldspar, Plagioclase6.46
Muscovite, Biotite1.82
Others1.77
Sum100.00
Table 5. Copper and molybdenum minerals dissemination of Cu-Mo separation feed, %.
MineralsLiberatedMo/Cu MineralsSulfideOxideGangueInterlocked
Copper86.261.175.980.323.772.50
Molybdenum82.177.114.860.153.642.07
Table 6. Analysis of water quality at Wushan operation.
SamplespHCu, mg/LFe, mg/LCa, mg/L
Tap water 17.400.4790.8930.8
Tap water 27.350.0070.428.2
Recycle water 15.544.271.11321
Recycle water 26.555.921.52356
Recycle water 36.565.882.9370
Recycle water 47.093.751.03292
Table 7. Summary of flotation using water glass.
Water Glass, g/tProductMass, %Grade, %Recovery, %
CuMoSiO2CuMoSiO2
0Concentrate86.951.10028.14052.3974.7992.5583.72
Tail13.052.47015.08067.8825.217.4516.28
Feed100.001.27926.43554.41100.00100.00100.00
500Concentrate82.630.97030.76041.5366.7490.7075.01
Tail17.372.30015.00065.8133.269.3024.99
Feed100.001.20128.02345.75100.00100.00100.00
1000Concentrate81.751.14028.78035.1270.2890.7668.11
Tail18.252.16013.12069.1629.729.2431.89
Feed100.001.32625.92355.93100.00100.00100.00
Table 8. Data sheet of cleaner flotation using regrinding.
ProductMass, %Grade, %Recovery, %
CuMoSiO2SCuMoSiO2S
Without regrinding (−325 =34%)Concentrate53.460.4638.1749.0822.7725.7467.3445.7864.79
Middling18.841.1527.0658.9718.6010.647.899.098.75
Middling213.371.1825.5364.7615.5016.5111.2615.1011.03
Tail24.331.8516.8370.7311.9247.1113.5130.0215.43
Feed100.000.9630.3157.3218.79100.00100.00100.00100.00
With regrinding (−325 =50%)Concentrate46.140.4841.9643.6926.4818.6563.3437.5063.00
Middling15.661.3230.5651.8221.786.295.665.456.35
Middling212.971.3330.9150.4818.4214.5313.1212.1812.32
Tail35.232.0415.5168.4610.0960.5317.8844.8718.33
Feed100.001.1930.5653.7619.39100.00100.00100.00100.00
Table 9. Size by size analysis of feed using regrinding.
MeshMass, %Grade, %Metal Distribution, %
CuMoSiO2SCuMoSiO2S
Without regrinding+32565.060.6318.0773.4744.2842.544384.144.28
325~60016.271.0539.0939.3322.9317.7323.2511.2622.93
−60018.672.0549.4114.1332.7839.7333.754.6432.78
Sum100.000.9627.3456.84100.00100100100100
With regrinding+32549.800.4921.4270.8935.8023.8136.9662.9835.8
325~60024.770.7434.6851.7029.0217.8929.7622.8429.02
−60025.432.3537.7731.2735.1858.333.2714.1835.18
Sum100.001.0228.8656.06100.00100100100100
Table 10. Comparison of plant performance before and after process optimization.
Qualified Rate, %Qualified Mo Concentrate
Cu Grade, %Mo Grade, %
Before optimization20.481.5442.28
After optimization68.601.1246.40
Publisher’s Note: MDPI stays neutral with regard to jurisdictional claims in published maps and institutional affiliations.

