
Molecular Dynamics Study on the Leaching of Zinc-Bearing Dust Sludge by Choline Chloride-Malonic Acid


Abstract
:1. Introduction
2. Modeling and Calculations
2.1. Composition Analysis of Zinc-Bearing Dust Sludge
2.2. Modeling of Metal Oxide Structures and their Cleavage
2.2.1. Exchange—Correlation Energy Functionals Test
2.2.2. Complete-Cleavage Surface Calculations
2.2.3. Density of States Analysis
2.3. Construction and Calculation of Eutectic Solvent Model
3. Calculation and Analysis of the Interaction
3.1. Construction of the Interaction Model
3.2. Analysis of the Calculated Results
3.2.1. Interaction Energy
3.2.2. Radial Distribution Function
4. Model Verification and Analysis
4.1. Experimental Materials and Methods
4.2. Single Mineral Leaching Experiment
5. Conclusions
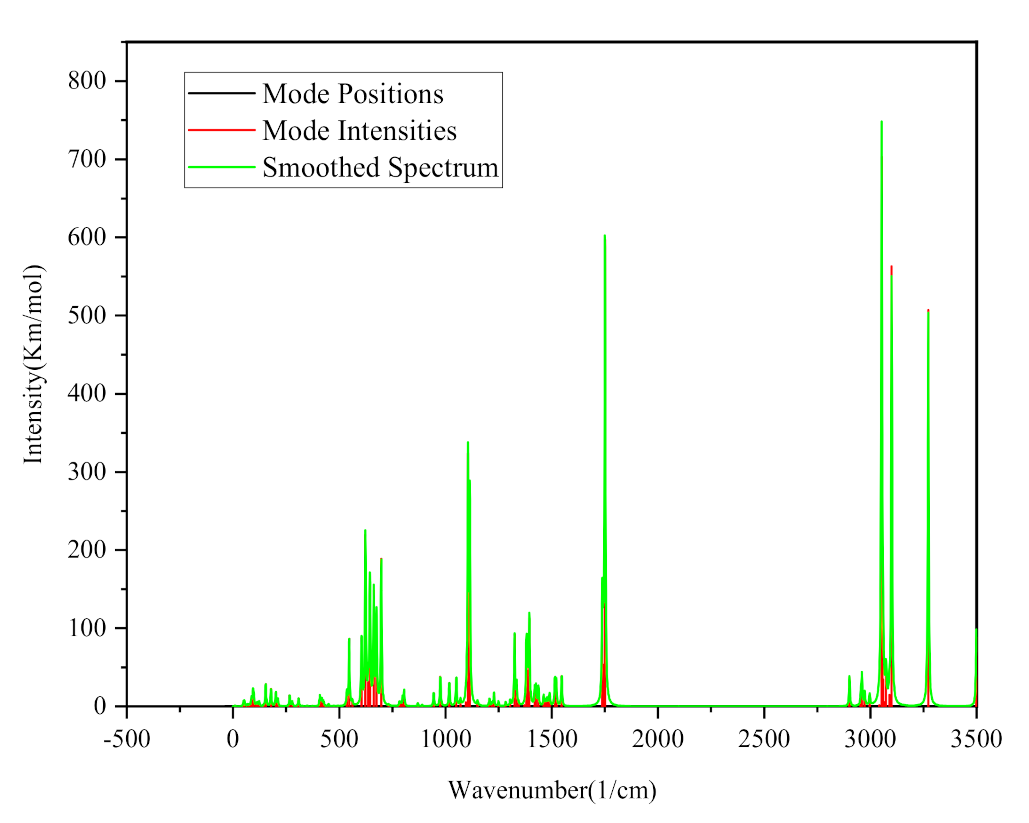
- (1)
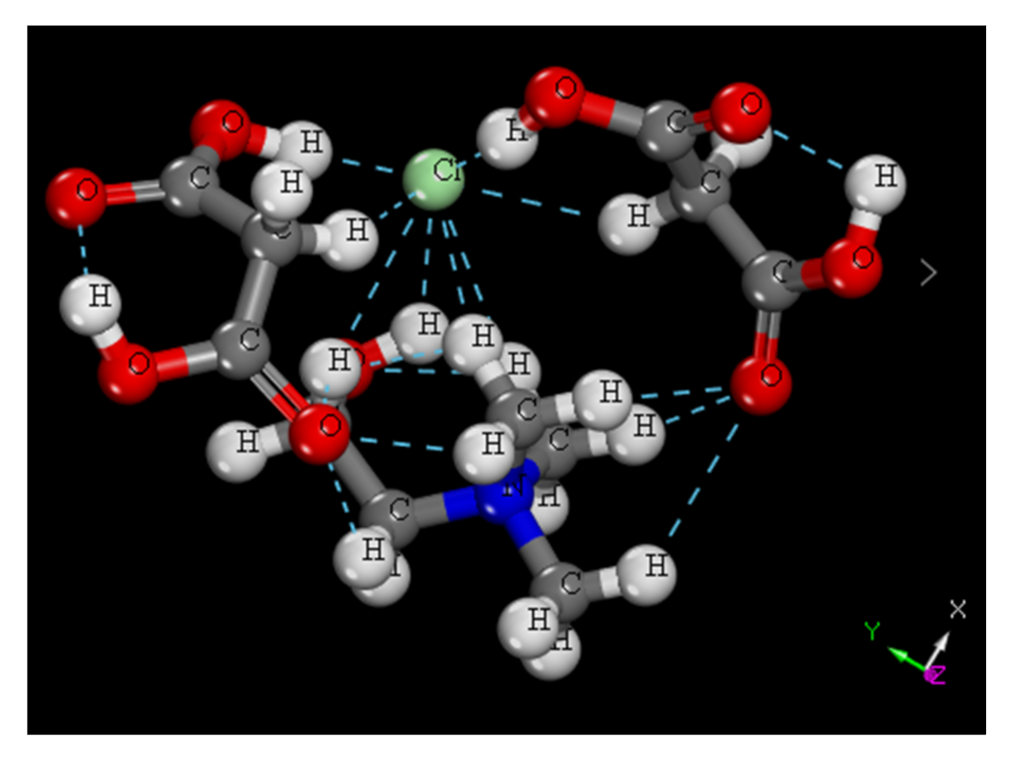
- The optimal structural parameters of the four metal oxides were obtained by calculating their exchange-correlation energy functionals. Moreover, the complete-cleavage surfaces were calculated, and those with the lowest surface energy were found to be the (001) surfaces for all metal oxides. The optimized stable configuration of ChCl-2MA features multiple intermolecular hydrogen bonds with the chlorine atom as the center.
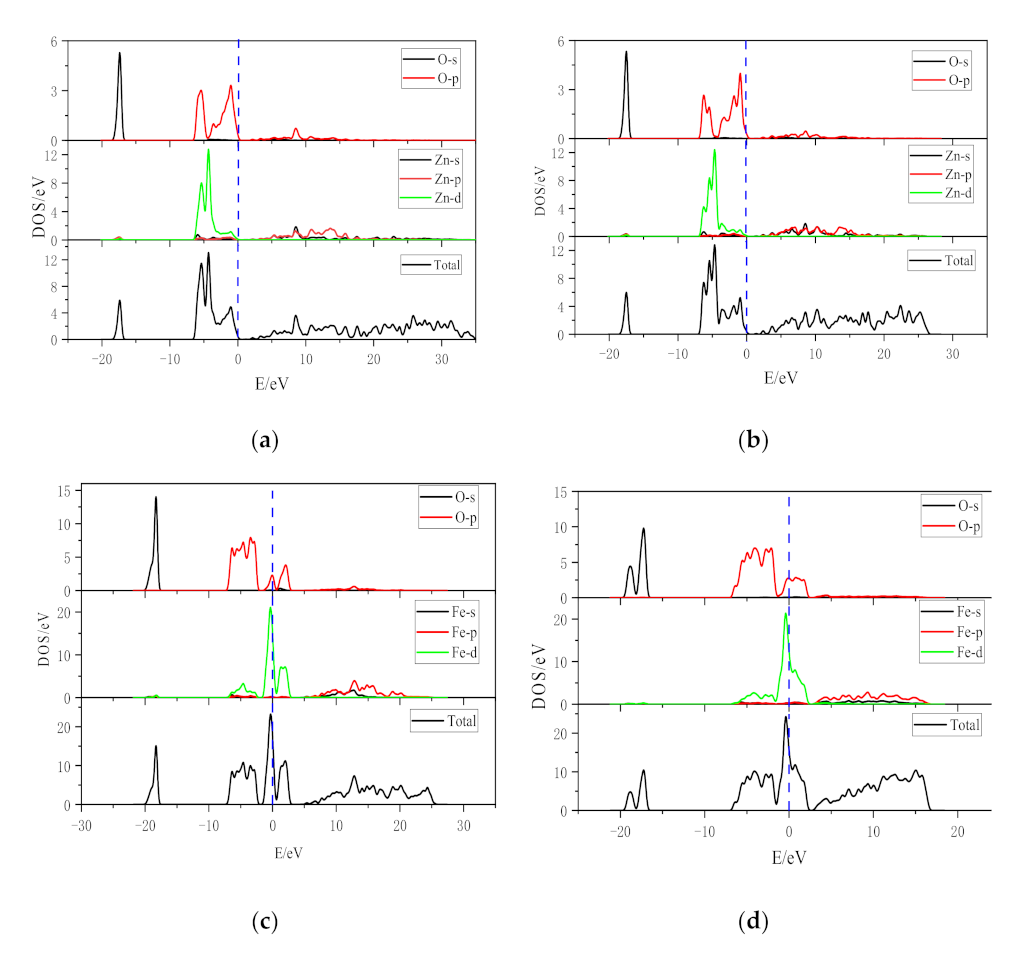
- (2)
- A comparative analysis of the cell and complete-cleavage surfaces density of the four metal oxides shows that the ZnO (001) surface near the Fermi level receives a higher contribution from the Zn-3d orbital than the O-2p orbital. The Fe2O3 (001) surface near the Fermi level is contributed by Fe-3d and O-2p orbitals, and their activities are similar. The increase in the total density of states of the Al2O3 (001) surface is mainly due to the increase in the density of states of the O-2p orbital, indicating that the O-2p orbital is more likely to react with foreign substances. The peak density of states of the CaO (001) surface near the Fermi level is mainly contributed by the O-2p orbital, indicating that O is more likely to react with foreign substances in the complete-cleavage surface of CaO.
- (3)
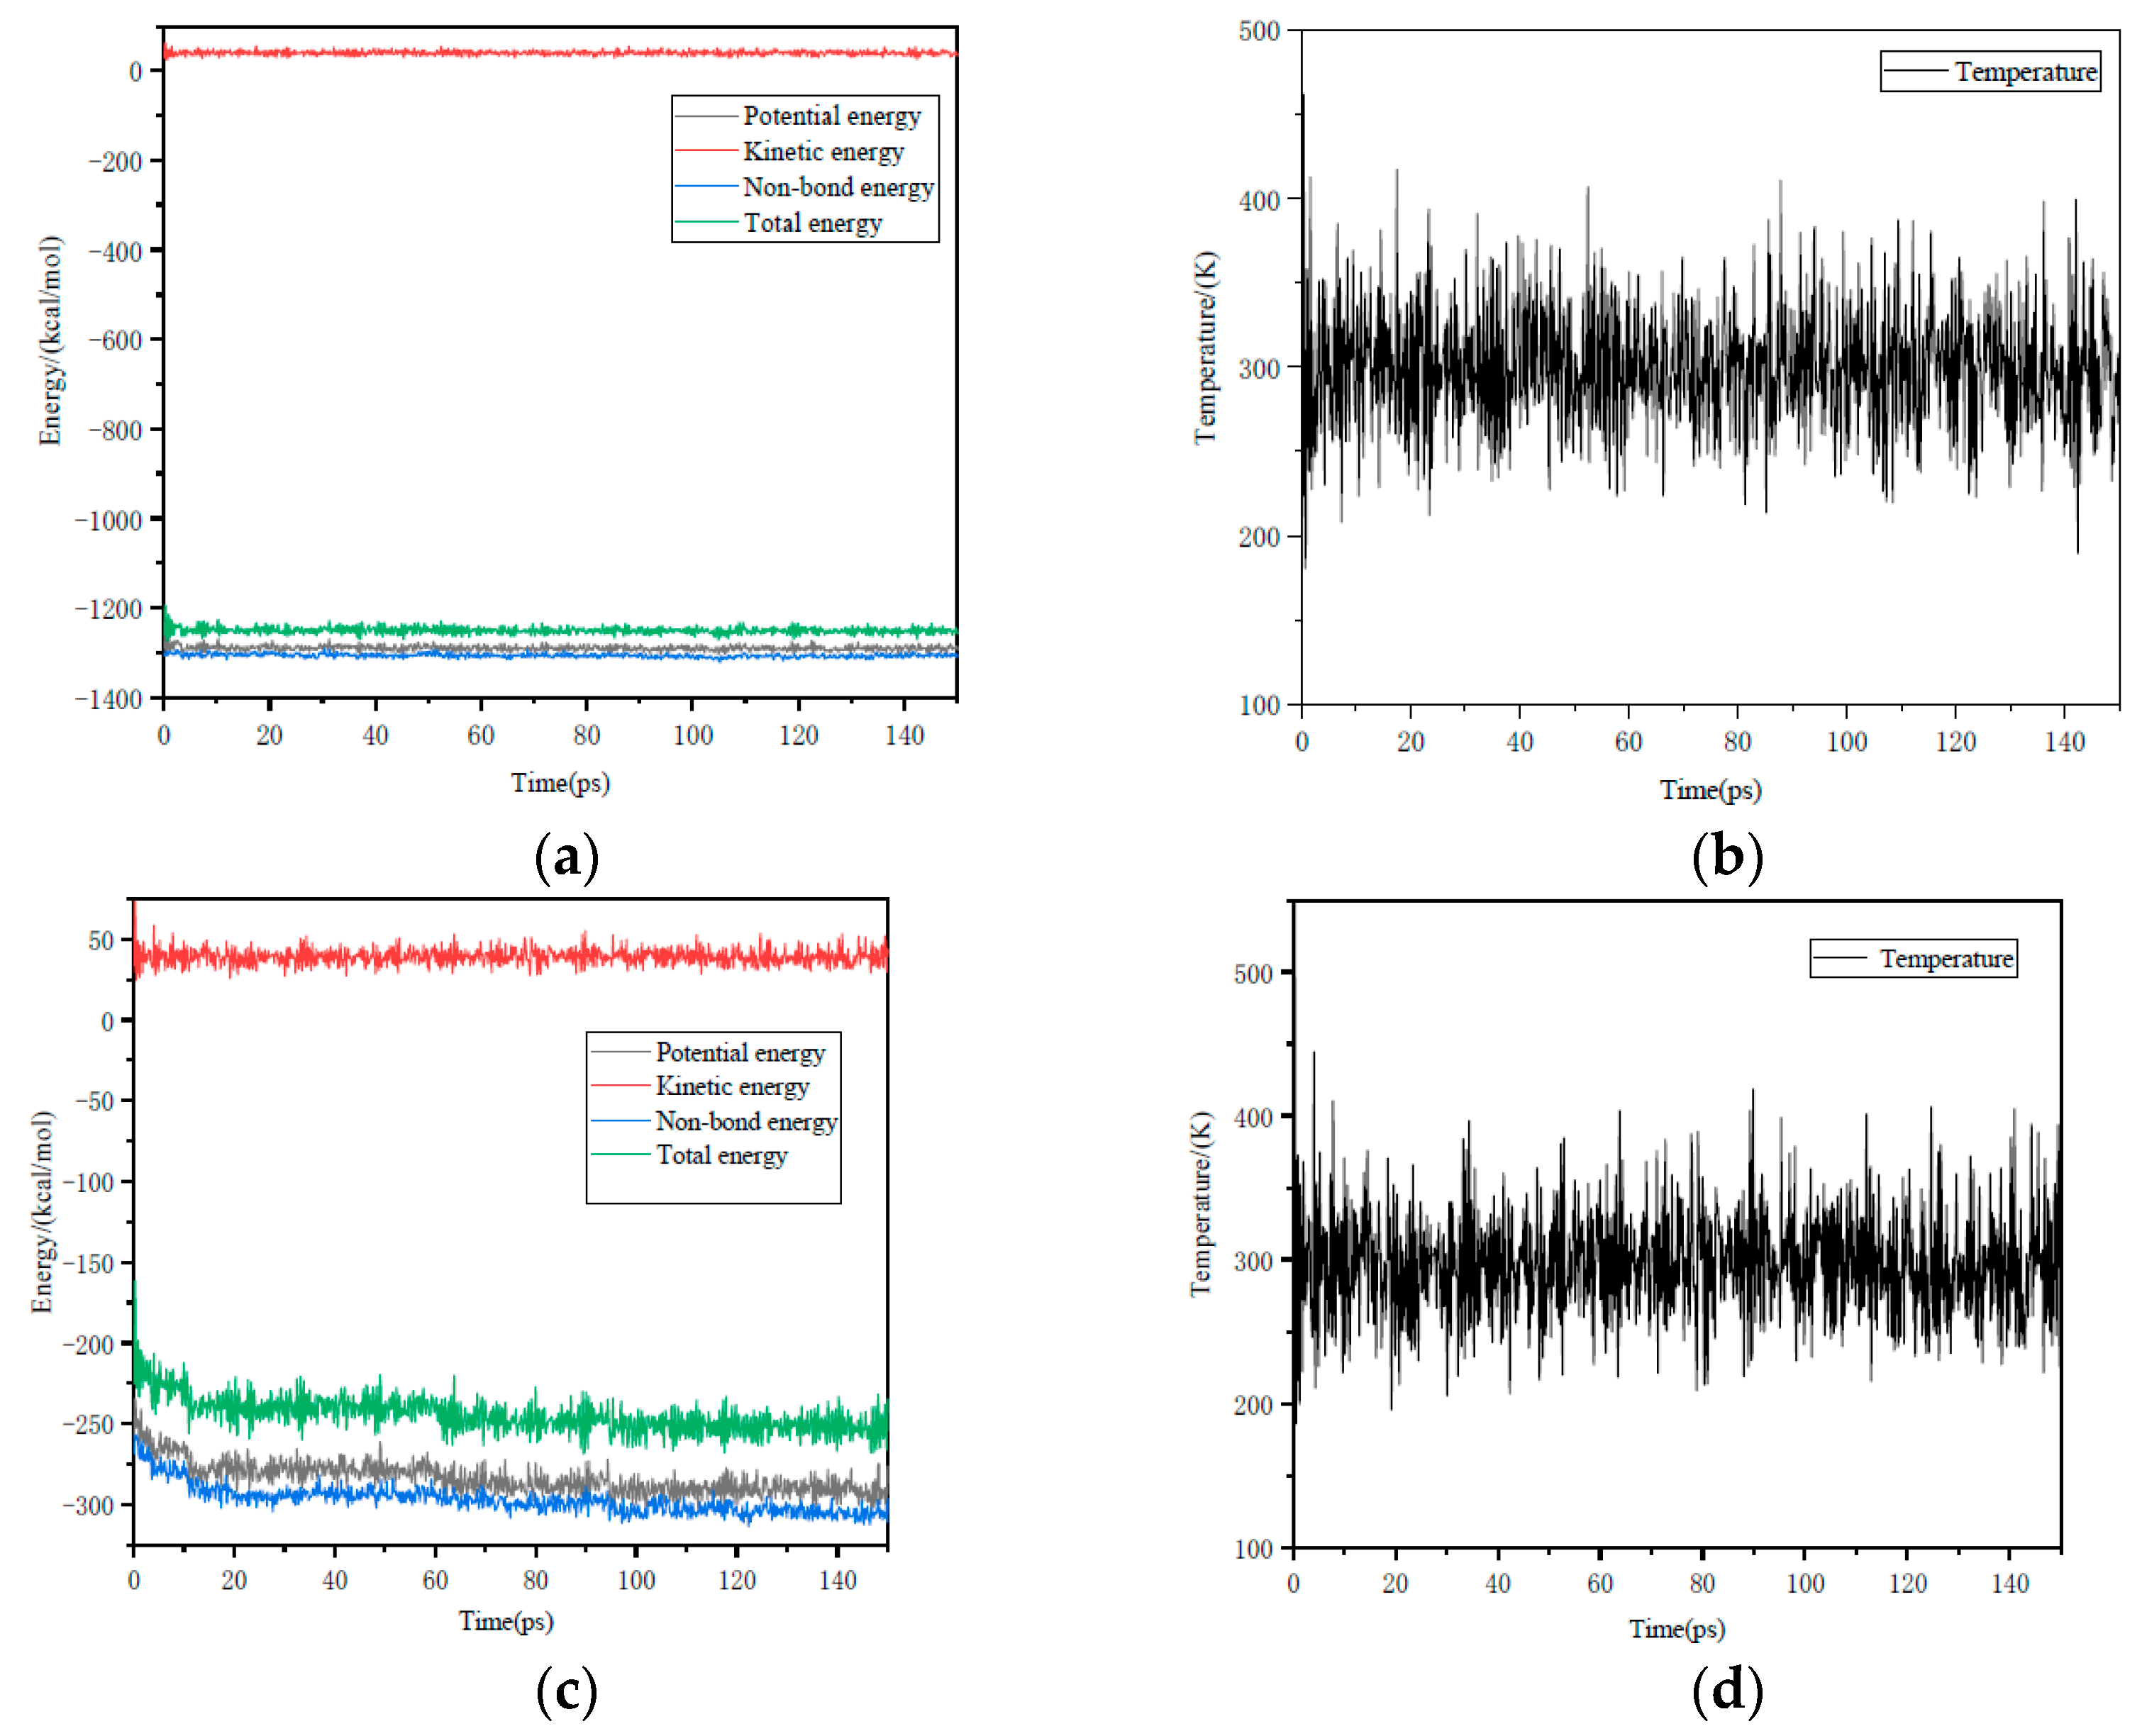
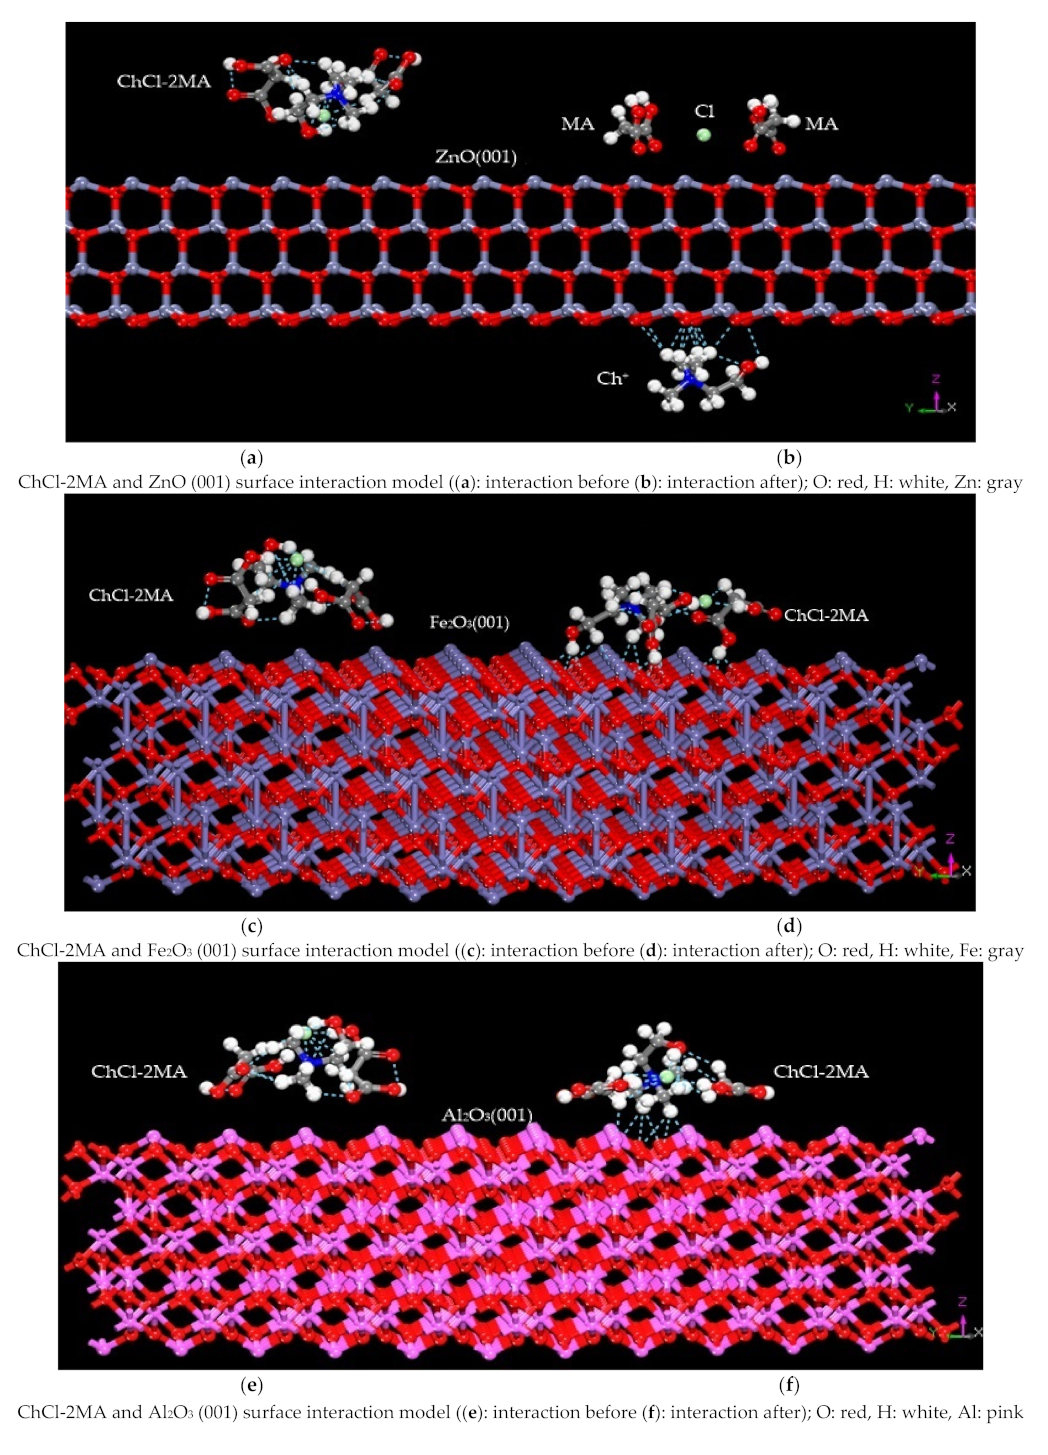
- It can be seen from the energy change determined by molecular dynamics that ChCl-2MA is more likely to interact with the ZnO (001) surface. The variation in energy shows that ChCl-2MA is more inclined to interact with ZnO (001). The results also show that the interaction between ZnO and ChCl-2MA is the strongest, and the interaction of the metal oxides with ChCl-2MA decreases in the following order: ZnO > Fe2O3 > Al2O3 > CaO.
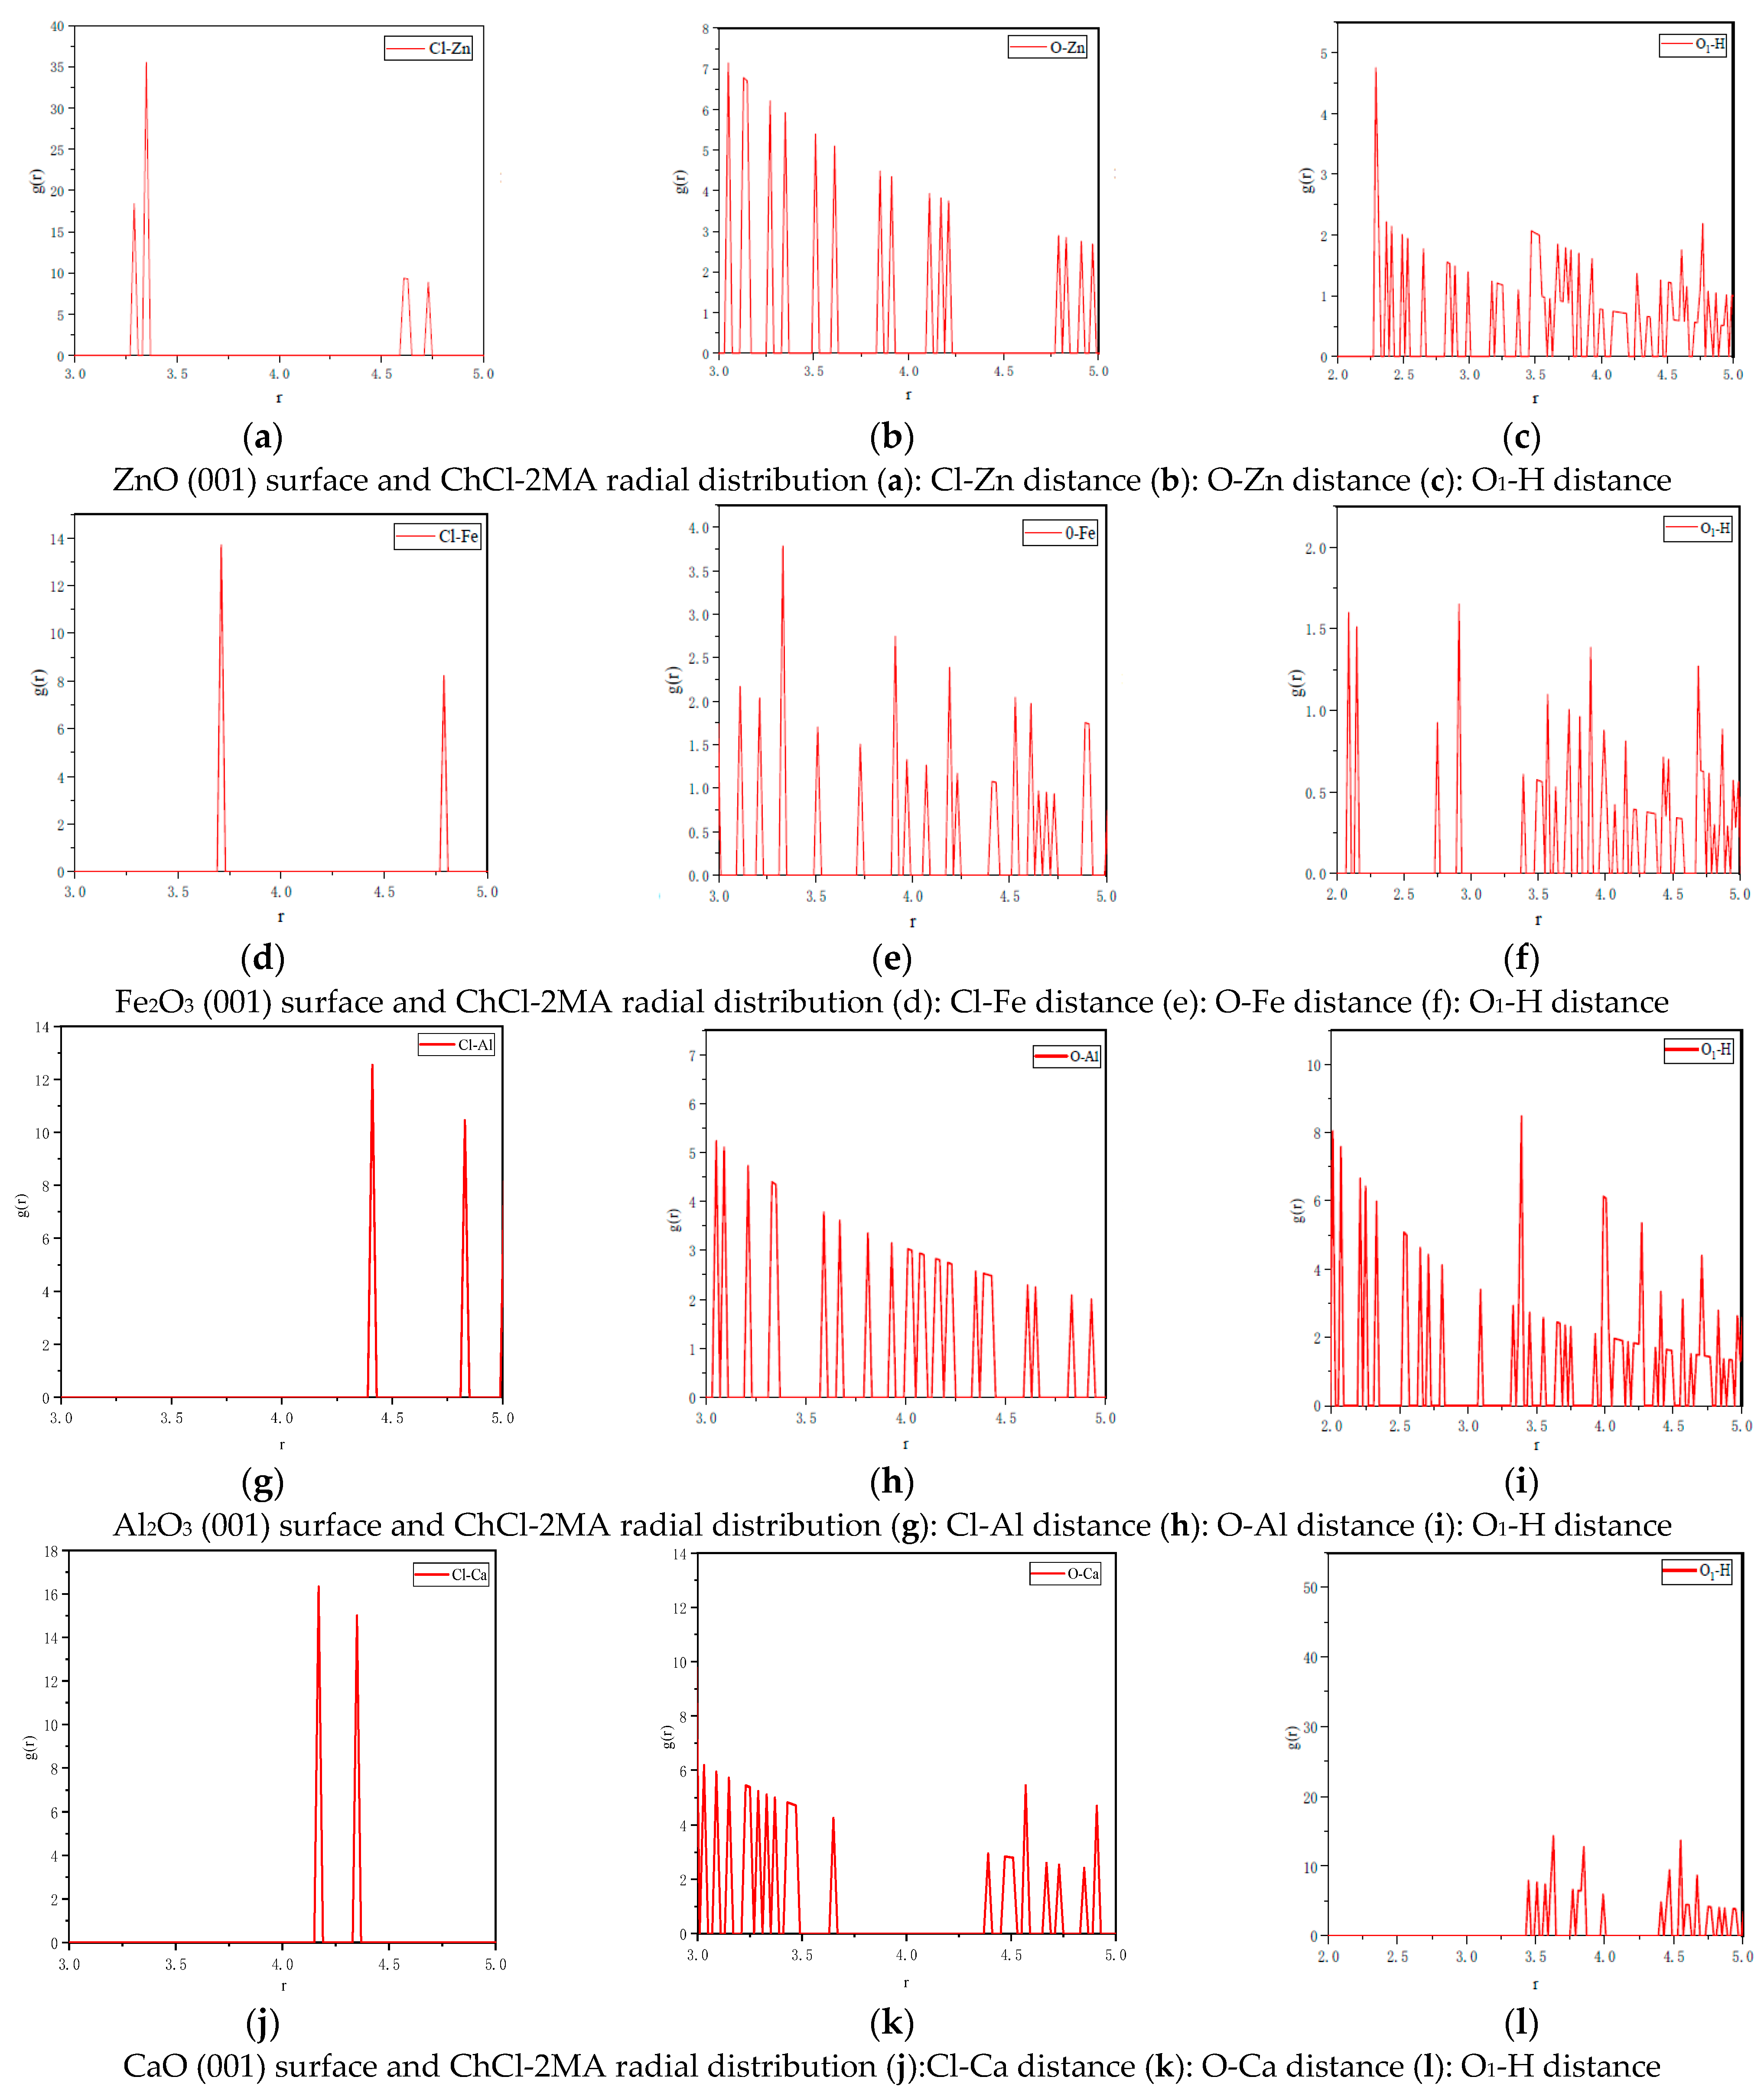
- (4)
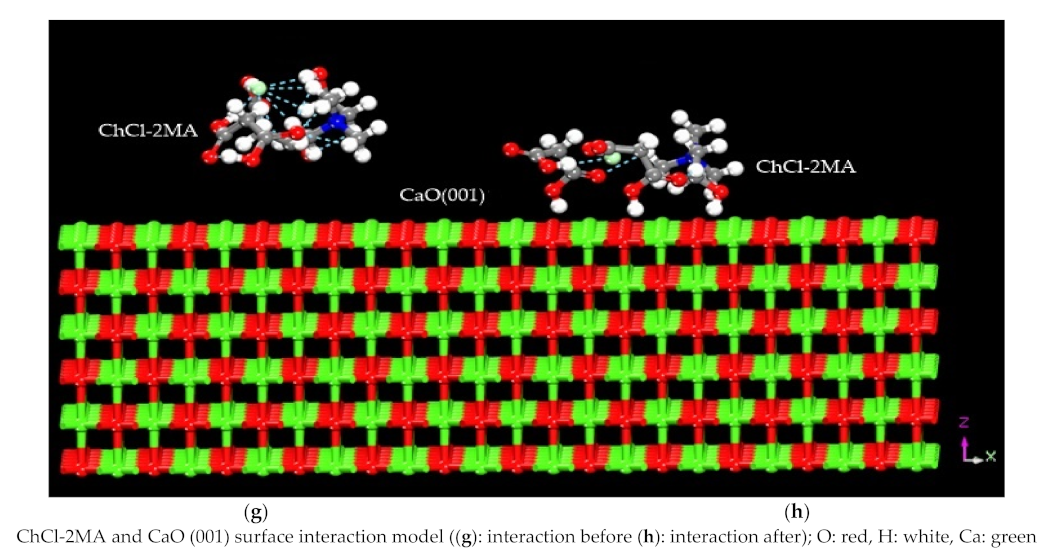
- Based on the analysis of the radial distribution function, it is inferred that the Cl in ChCl forms a chemical bond with Cl-Zn, whereas Cl interacts with Fe, Al, and Ca through van der Waals forces. The chemical bond of Cl is stronger than that formed by Zn. The chemical bond between O in MA and metal atoms is weak. By comparing the initial peak position and the peak intensity, it is found that the strength of the hydrogen bond formed by the interaction between ChCl-2MA and the three metal oxides follows the descending order: Al2O3 > ZnO > Fe2O3. Moreover, the interaction between ChCl-2MA and CaO is mainly based on van der Waals forces.
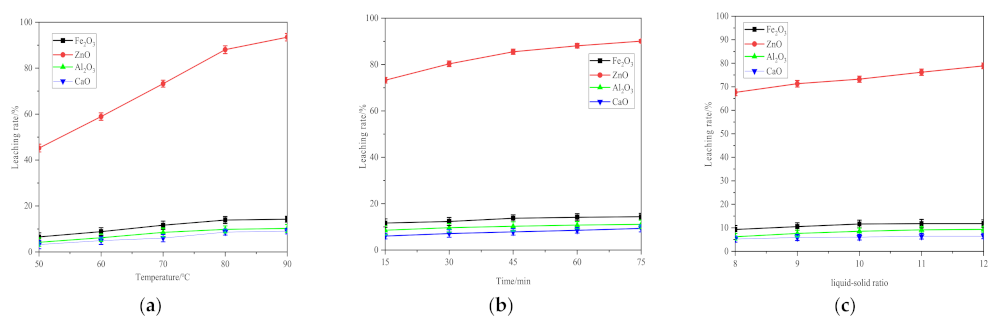
- (5)
- The leaching rate of the four metal oxides by ChCl-2MA was experimentally determined under different conditions for three leaching parameters. It is found that the leaching of ZnO by ChCl-2MA reaches more than 90%, while the leaching for the other three metal oxides remains stable at about 10%. These results verify the accuracy of the molecular simulation and also prove that ChCl-2MA is selective for ZnO in zinc-bearing dust sludge.
Author Contributions
Funding
Data Availability Statement
Conflicts of Interest
References
- Yu, C.; Zhang, J.; Deng, J.; Chen, R.; Yu, X. The electrowinning of zinc from sodium hydroxide solutions. Hydrometallurgy 2014, 146, 59–63. [Google Scholar]
- Zhou, H.; Li, J.; Cui, Z. Technology Study on Recovering Zinc from Steel Smelting Dust. Technology 2012, 10, 56–57. [Google Scholar]
- Yu, X.; Xue, Q.; Wang, J. Comprehensive Utilization of Zinc-containing Dust in Iron and Steel Plants and Comparison of Related Treatment Processes. Ironmaking 2010, 29, 56–62. [Google Scholar]
- Niu, F.; Ni, W.; Zhang, J. Current situation and development of comprehensive utilization of metallurgical dusts and slimes in China. Iron Steel 2016, 51, 1–10. [Google Scholar]
- Mehmet, K.; Kürşad, O.; Mehmet, Ş.H. Optimization of selective leaching of Zn from electric arc furnace steelmaking dust using response surface methodology. Trans. Nonferrous Met. Soc. China 2015, 25, 2753–2762. [Google Scholar]
- Xie, Z.; Guo, Y.; Chen, F. Research status and prospect of comprehensive utilization of zinc-bearing dust in iron and steel plants. Sinter. Pelletizing 2016, 41, 53–61. [Google Scholar]
- Chun, T.; Zhu, D. New Process of Pellets-Metallized Sintering Process (PMSP) to Treat Zinc-Bearing Dust from Iron and Steel Company. Metall. Mater. Trans. B 2015, 46, 1–4. [Google Scholar] [CrossRef]
- Wu, Z.; Huang, W.; Cui, K. Sustainable synthesis of metals-doped ZnO nanoparticles from zinc-bearing dust for photodegradation of phenol. J. Hazard. Mater. 2014, 278, 91–99. [Google Scholar] [CrossRef]
- Sudhir, K.; Rocktotpal, K. Purification, characterization and biotechnological application of an alkaline β-keratinase pro-duced by Bacillus subtilis RM-01 in solid-state fermentation using chicken-feather as substrate. Biochem. Eng. J. 2009, 45, 218–225. [Google Scholar]
- Turan, M.D.; Altundogan, H.S.; Tumen, F. Recovery of zinc and lead from zinc plant residue. Hydrometallurgy 2004, 75, 169–176. [Google Scholar] [CrossRef]
- Abbott, A.P.; Boothby, D.; Capper, G. Deep eutectic solvents formed between choline chloride and carboxylic acids: Versatile alternatives to ionic liquids. J. Am. Chem. Soc. 2004, 126, 9142–9147. [Google Scholar] [CrossRef]
- Wagle, D.V.; Zhao, H.B.; Baker, G.A. Deep eutectic solvents: Sustainable media for nanoscale and functional materials. Acc. Chem. Res. 2014, 47, 2299–2308. [Google Scholar] [CrossRef]
- Zhang, Q.; Vigier, K.; Royer, S. Deep eutectic solvents syntheses properties and applications. Chem. Soc. Rev. 2012, 41, 7108. [Google Scholar] [CrossRef]
- Lei, Z. Study on Treament of Zinc Dust with Deep Eutectic Solvents. Non-Ferr. Met. Smelt. 2017, 8, 5–8. [Google Scholar]
- Zhang, Y.; Li, L.; Li, J. Dissolution behavior of zinc oxide in choline chloride oxalate hydrates deep eutectic solvents. J. Cent. South Univ. 2016, 47, 2591–2599. [Google Scholar]
- Ashraf, B.; Volkmar, N. Recycling of cupola furnace dust: Extraction and electrodeposition of zinc in deep eutectic solvents. J. Alloy. Compd. 2019, 771, 424–432. [Google Scholar]
- Zhu, X.; Xu, C.; Tang, Y. Selective recovery of zinc from zinc oxide dust using choline chloride based deep eutectic solvents. Trans. Nonferrous Met. Soc. China 2019, 29, 2222–2228. [Google Scholar] [CrossRef]
- Peng, C.; Li, X.; Li, S. Adsorption of gold cyanide on quartz. Colloids Surf. A Physicochem. Eng. Asp. 2020, 590, 124514. [Google Scholar]
- Peng, T.; Sheng, Q.; Jing, Q.; Zhang, L. First principle investigation of the surface states of tin dioxide (100). Mater. Sci. Semicond. Process. 2020, 113, 105020. [Google Scholar]
- Jafarova, V.N.; Orudzhev, G.S. Structural and electronic properties of ZnO: A first-principles density-functional theory study within LDA(GGA) and LDA(GGA) + U methods. Solid State Commun. 2021, 325, 114166. [Google Scholar] [CrossRef]
- Xiao, H.W.; Hai, J.P. Electron Properties of F, and N Doped Hematite: The Application for Photocatalysis. Adv. Mater. Res. 2012, 562, 298–301. [Google Scholar]
- Kausar, H.; Norsakinah, M.; Zainal, A.A.; Ahmad, A.M. Electronic Properties of ZnO Nanoparticles Synthesized by Sol-gel Method: A LDA + U Calculation and Experimental Study. Procedia Chem. 2016, 19, 125–132. [Google Scholar]
- Azam, S.; Irfan, M.; Abbas, Z.; Khan, S.A.; Khenata, R.; Muhammad, S.; Siddeeg, S.; Naqib, M.; Wang, S.H. Optoelectronic properties of Nd3+ doped CaTa2O6: Insights from the GGA + U calculations. Optik 2021, 225, 165270. [Google Scholar] [CrossRef]
- Anwar, H.; Rana, C.; Javed, Y.; Mustafa, M.; Raza, A.; Hassan, A. Effect of ZnO on Photo catalytic Degradation of Rh B and Its Inhibition Activity for C. coli Bacteria. Russ. J. Appl. Chem. 2018, 91, 143–149. [Google Scholar] [CrossRef]
- Chahal, S.; Kumar, A.; Kumar, P. Zn Doped α-Fe2O3: An Efficient Material for UV Driven Photo catalysis and Electrical Conductivity. Crystals 2020, 10, 273. [Google Scholar]
- Jie, X.; Qiao, L.; Fang, Y.; Yan, J.; Zhang, H.; Wu, X. Co-precipitation synthesis of alumina doped yttria stabilized zirconia. J. Alloy. Compd. 2018, 731, 1080–1088. [Google Scholar]
- Maghsoudi, M.J.; Hadianfard, H.S. The influence of Al content and CaO–SiO2 on the magnetic and structural properties of Al-substituted Ni ferrites. J. Alloy. Compd. 2009, 481, 539–542. [Google Scholar] [CrossRef]
- Li, X.; Hai, Q.; Hao, Z.; Yuan, J. Molecular dynamics simulation of siderite-hematite-quartz flotation with sodium oleate. Appl. Surf. Sci. 2017, 419, 557–563. [Google Scholar] [CrossRef]
- Gao, Z.; Sun, W.; Hu, Y. Mineral cleavage nature and surface energy: Anisotropic surface broken bonds consideration. Trans. Nonferrous Met. Soc. China 2014, 24, 2930–2937. [Google Scholar] [CrossRef]
- Tan, X.; He, F.Y.; Xie, Y. Structural and Electronic Properties of MnWO4(010) Surface Studied by First-principles calculation. Met. Mine 2015, 6, 52–58. [Google Scholar]
- Agrawal, R.; Peng, B.E.; Espinosa, H.D. Experimental-computational investigation of ZnO nanowires strength and fracture. Nano Lett. 2009, 9, 4177–4183. [Google Scholar] [CrossRef]
- Qing, J.; Zhao, Q.; Yang, Q.; Chen, Z.; Yin, Z.; Wu, Z. Behavior of silicon-containing minerals during Bayer digestion. Trans. Nonferrous Met. Soc. China 2010, 20, s1–s9. [Google Scholar]
- Norio, W.; Naohiro, H.; Wei, W.; Tetsuo, H.; Miho, N.; Akiko, N. Electrical conduction and polarization of calcite single crystals. Phys. Chem. Miner. 2012, 39, 761–768. [Google Scholar]
- Yang, Z.; Bai, X.; Zheng, W. Electronic properties of bare doped (Tio2)3 cluster-a density functional theory investigation. Mol. Phys. 2015, 32, 962–970. [Google Scholar]
- Li, Y.; Chen, J.; Chen, Y.; Guo, J. Density functional theory study of influence of impurity on electronic properties and reactivity of pyrite. Trans. Nonferrous Met. Soc. China 2011, 21, 1887–1895. [Google Scholar] [CrossRef]
- Chen, Y.; Chen, J. The first-principle study of the effect of lattice impurity on adsorption of CN on sphalerite surface. Miner. Eng. 2010, 23, 1887–1895. [Google Scholar] [CrossRef]
- Mahmoud, S.A.; Al-Hossainy, A.F.; Shaaban, E.R. Combined experimental and DFT-TDDFT computational, structural and study effect of inter-diffusion Cu into CdTe thick film by annealing for optoelectronics. J. Mol. Struct. 2021, 1238, 130411. [Google Scholar] [CrossRef]
- Wang, J.; Ren, W.; Yan, S. Structural and dynamical properties of H2O molecules confined within albite-quartz system under cyclic thermal loading: Insights from molecular dynamic simulation. J. Mol. Struct. 2021, 1245, 131140. [Google Scholar] [CrossRef]
- Marcus, P.; Grace, E.; Stephen, H.; Brendan, H.; Ian, H.; Stephen, T. Reactive Molecular Dynamics Study of the Thermal Decomposition of Phenolic Resins. J. Compos. Sci. 2019, 3, 32. [Google Scholar]
- Fairushin, I.I.; Khrapak, S.A.; Mokshin, A.V. Direct evaluation of the physical characteristics of Yukawa fluids based on a simple approximation for the radial distribution function. Results Phys. 2020, 19, 103359. [Google Scholar] [CrossRef]
- Hao, H.; Cao, Y.; Li, L.; Fan, G.; Liu, J. Dispersion and depression mechanism of sodium silicate on quartz: Combined molecular dynamics simulations and density functional theory calculations. Appl. Surf. Sci. 2021, 537, 147926. [Google Scholar] [CrossRef]
- Hao, Z.; Wen, G.; Han, H. Effects of monohydric alcohols on the flotation of magnesite and dolomite by sodium oleate. J. Mol. Liq. 2018, 249, 1060–1067. [Google Scholar]


| Element | Fe2O3 | ZnO | Al2O3 | CaO | SO3 | SiO2 | MgO | PbO | K2O | MnO |
|---|---|---|---|---|---|---|---|---|---|---|
| Content % | 48.20 | 25.32 | 6.20 | 3.95 | 3.47 | 2.93 | 1.95 | 1.06 | 0.74 | 0.26 |
| Standard deviation | 0.01 | 0.01 | 0.02 | 0.02 | 0.02 | 0.01 | 0.02 | 0.02 | 0.03 | 0.03 |
| Metal Oxide | Exchange–Correlation Energy | Cell Parameters | Error/% | Total Energy/eV | ||
|---|---|---|---|---|---|---|
| a | c | a | c | |||
| ZnO | LDA(CA-PZ) | 3.191 | 5.158 | 1.81 | 0.93 | −4300.24 |
| GGA(PBE) | 3.289 | 5.309 | 1.21 | 1.97 | −4294.54 | |
| GGA(RPBE) | 3.319 | 5.358 | 2.15 | 2.91 | −4296.55 | |
| GGA(PW91) | 3.288 | 5.291 | 1.18 | 1.62 | −4299.28 | |
| GGA(PBEsol) | 3.269 | 5.225 | 0.62 | 0.38 | −4299.26 | |
| Fe2O3 | LDA(CA-PZ) | 5.319 | 1.86 | −6060.58 | ||
| GGA(PBE) | 5.342 | 1.44 | −6079.93 | |||
| GGA(RPBE) | 5.369 | 0.94 | −6089.15 | |||
| GGA(PW91) | 5.355 | 1.19 | −6090.99 | |||
| GGA(PBEsol) | 5.286 | 2.58 | −6046.69 | |||
| Al2O3 | LDA(CA-PZ) | 4.705 | 12.803 | 1.13 | 1.44 | −2864.36 |
| GGA(PBE) | 4.787 | 13.1 | 0.58 | 0.83 | −2861.77 | |
| GGA(RPBE) | 4.682 | 12.709 | 0.16 | 2.17 | −2863.81 | |
| GGA(PW91) | 4.784 | 13.083 | 0.52 | 0.7 | −2865.34 | |
| GGA(PBEsol) | 4.783 | 13.001 | 0.5 | 0.07 | −2854.57 | |
| CaO | LDA(CA-PZ) | 4.732 | 1.64 | −1414.49 | ||
| GGA(PBE) | 4.733 | 1.62 | −1441.65 | |||
| GGA(RPBE) | 4.353 | 9.51 | −1442.62 | |||
| GGA(PW91) | 4.745 | 1.37 | −1442.83 | |||
| GGA(PBEsol) | 4.714 | 2.05 | −1438.57 | |||
| Metal Oxide | 001 | 011 | 111 | 101 | 110 |
|---|---|---|---|---|---|
| ZnO | 0.8177 | 3.9275 | 3.9271 | 2.0852 | 2.4053 |
| Fe2O3 | 1.9021 | 1.9425 | 1.9326 | 1.9836 | 1.9308 |
| Al2O3 | 1.7651 | 2.1034 | - | - | 2.1127 |
| CaO | 1.1723 | 1.5974 | 1.7486 | 1.7942 | 1.5813 |
| Complete-Cleavage Surface | EA | EB | EAB | △E |
|---|---|---|---|---|
| ZnO(001) | 6.3368 | −10,983.7106 | −11,015.7309 | −38.3572 |
| Fe2O3(001) | 1.2463 | −42,885.9960 | −42,887.9668 | −4.1929 |
| Al2O3(001) | −9.2960 | −13,7351.4606 | −13,7364.4290 | −3.6724 |
| CaO(001) | −10.6916 | −7373.6033 | −7360.4413 | −2.4703 |
Publisher’s Note: MDPI stays neutral with regard to jurisdictional claims in published maps and institutional affiliations. |
© 2021 by the authors. Licensee MDPI, Basel, Switzerland. This article is an open access article distributed under the terms and conditions of the Creative Commons Attribution (CC BY) license (https://creativecommons.org/licenses/by/4.0/).
Share and Cite
Zhang, J.; Yang, C.; Niu, F.; Gao, S.; Dong, J. Molecular Dynamics Study on the Leaching of Zinc-Bearing Dust Sludge by Choline Chloride-Malonic Acid. Minerals 2021, 11, 1080. https://doi.org/10.3390/min11101080
Zhang J, Yang C, Niu F, Gao S, Dong J. Molecular Dynamics Study on the Leaching of Zinc-Bearing Dust Sludge by Choline Chloride-Malonic Acid. Minerals. 2021; 11(10):1080. https://doi.org/10.3390/min11101080
Chicago/Turabian StyleZhang, Jinxia, Chao Yang, Fusheng Niu, Shuling Gao, and Jiajing Dong. 2021. "Molecular Dynamics Study on the Leaching of Zinc-Bearing Dust Sludge by Choline Chloride-Malonic Acid" Minerals 11, no. 10: 1080. https://doi.org/10.3390/min11101080
APA StyleZhang, J., Yang, C., Niu, F., Gao, S., & Dong, J. (2021). Molecular Dynamics Study on the Leaching of Zinc-Bearing Dust Sludge by Choline Chloride-Malonic Acid. Minerals, 11(10), 1080. https://doi.org/10.3390/min11101080