
Retaining Geochemical Signatures during Aragonite-Calcite Transformation at Hydrothermal Conditions

 , ,
, ,  ,
, _Migdisov.png)
 ,
,
Abstract
:1. Introduction
2. Materials and Methods
2.1. Precipitation of Aragonite
2.2. Crystallization Experiments
2.3. Mineralogical Analysis with X-ray Diffraction Method (XRD), Electron Backscatter Diffraction (EBSD), and Scanning Electron Microscopy (SEM)
2.4. Elemental and Isotope Analyses
3. Results
4. Discussion
5. Conclusions
Author Contributions
Funding
Data Availability Statement
Acknowledgments
Conflicts of Interest
Appendix A

| Sample ID | Sample Weight for ICP (mg) in 10 mL of 3% HNO3 |
|---|---|
| Raw aragonite 30 July 2018 | 9.812 |
| A120-T2 | 9.989 |
| A120-T4 | 10.193 |
| A120-T6 | 9.967 |
| A120-B2 | 10.29 |
| A120-B4 | 10.404 |
| A120-B6 | 10.261 |
| A184-T2 | 9.846 |
| A184-T4 | 4.945 |
| A184-T6 | 9.771 |
| A184-B2 | 4.944 |
| A184-B4 | 9.926 |
| A184-B6 | 10.192 |
| A184-B10 | 10.644 |
| A150_B1 | 2.261 |
| Location | Width (μm) |
|---|---|
| W1 | 23.12 |
| W2 | 31.12 |
| W3 | 43.37 |
| W4 | 23.69 |
| W5 | 20.45 |
| W6 | 32.29 |
| W7 | 40.03 |
| W8 | 31.39 |
| W9 | 39.11 |
| W10 | 51.26 |
| Average | 33.583 |
References
- Coleman, R.G.; Lee, D.E. Metamorphic aragonite in the glaucophane schists of Cazadero, California. Am. J. Sci. 1962, 260, 577–595. [Google Scholar] [CrossRef]
- Kunzler, R.H.; Goodell, H.G. The aragonite-calcite transformation; a problem in the kinetics of a solid-solid reaction. Am. J. Sci. 1970, 269, 360–391. [Google Scholar] [CrossRef]
- Folk, R.L. Some aspects of recrystallization in ancient limestones. Spec. Publ. Soc. Econ. Paleont. Mineral. 1965, 13, 14–48. [Google Scholar]
- Putnis, A.; Putnis, C.V. The mechanism of reequilibration of solids in the presence of a fluid phase. J. Solid State Chem. 2007, 180, 1783–1786. [Google Scholar] [CrossRef]
- Perdikouri, C.; Piazolo, S.; Kasioptas, A.; Schmidt, B.C.; Putnis, A. Hydrothermal replacement of aragonite by calcite: Interplay between replacement, fracturing and growth. Eur. J. Miner. 2013, 25, 123–136. [Google Scholar] [CrossRef]
- Epstein, S.; Mayeda, T. Variation of O18 content of waters from natural sources. Geochim. Cosmochim. Acta 1953, 4, 213–224. [Google Scholar] [CrossRef]
- Broecker, W.S. Oxygen isotope constraints on surface ocean temperatures. Quat. Res. 1986, 26, 121–134. [Google Scholar] [CrossRef]
- Labeyrie, L.D.; Duplessy, J.-C.; Blanc, P.L. Variations in mode of formation and temperature of oceanic deep waters over the past 125,000 years. Nat. Cell Biol. 1987, 327, 477–482. [Google Scholar] [CrossRef]
- Lea, D.W.; Mashiotta, T.A.; Spero, H. Controls on magnesium and strontium uptake in planktonic foraminifera determined by live culturing. Geochim. Cosmochim. Acta 1999, 63, 2369–2379. [Google Scholar] [CrossRef]
- Li, N.; Cao, Y.; Zhang, Z.; Du, Y.; Guo, C. Oxygen-Isotope-Based Modeling of the Hydrothermal Fluid Processes of the Taochong Skarn Iron Deposit, Anhui Province, China. Minerals 2021, 11, 375. [Google Scholar] [CrossRef]
- Matthews, A. Oxygen isotope geothermometers for metamorphic rocks. J. Metamorph. Geol. 1994, 12, 211–219. [Google Scholar] [CrossRef]
- Matera, P.F.; Ventruti, G.; Zucchi, M.; Brogi, A.; Capezzuoli, E.; Liotta, D.; Yu, T.-L.; Shen, C.-C.; Huntington, K.W.; Rinyu, L.; et al. Geothermal Fluid Variation Recorded by Banded Ca-Carbonate Veins in a Fault-Related, Fissure Ridge-Type Travertine Depositional System (Iano, southern Tuscany, Italy). Geofluids 2021, 2021, 8817487. [Google Scholar] [CrossRef]
- Bemis, B.E.; Spero, H.; Bijma, J.; Lea, D.W. Reevaluation of the oxygen isotopic composition of planktonic foraminifera: Experimental results and revised paleotemperature equations. Paleoceanography 1998, 13, 150–160. [Google Scholar] [CrossRef] [Green Version]
- Eggins, S.; De Deckker, P.; Marshall, J. Mg/Ca variation in planktonic foraminifera tests: Implications for reconstructing palaeo-seawater temperature and habitat migration. Earth Planet. Sci. Lett. 2003, 212, 291–306. [Google Scholar] [CrossRef]
- Elderfield, H.; Ganssen, G. Past temperature and δ18O of surface ocean waters inferred from foraminiferal Mg/Ca ratios. Nat. Cell Biol. 2000, 405, 442–445. [Google Scholar] [CrossRef] [PubMed]
- Dekens, P.S.; Lea, D.W.; Pak, D.K.; Spero, H.J. Core top calibration of Mg/Ca in tropical foraminifera: Refining paleotemperature estimation. Geochem. Geophys. Geosyst. 2002, 3, 1–29. [Google Scholar] [CrossRef]
- Rosenthal, Y.; Lohmann, G.; Lohmann, K.; Sherrell, R. Incorporation and preservation of Mg in Globigerinoides sacculifer: Implications for reconstructing the temperature and 18O/16O of seawater. Paleoceanography 2000, 15, 135–145. [Google Scholar] [CrossRef]
- Klein, R.T.; Lohmann, K.C.; Thayer, C.W. SrCa and 13C12C ratios in skeletal calcite of Mytilus trossulus: Covariation with metabolic rate, salinity, and carbon isotopic composition of seawater. Geochim. Cosmochim. Acta 1996, 60, 4207–4221. [Google Scholar] [CrossRef]
- Smith, S.V.; Buddemeier, R.W.; Redalje, R.C.; Houck, J.E. Strontium-calcium thermometry in coral skeletons. Science 1979, 204, 404–407. [Google Scholar] [CrossRef]
- Beck, J.W.; Edwards, R.L.; Ito, E.; Taylor, F.W.; Recy, J.; Rougerie, F.; Joannot, P.; Henin, C. Sea-surface temperature from coral skeletal strontium/calcium ratios. Science 1992, 257, 644–647. [Google Scholar] [CrossRef]
- Marshall, J.F.; McCulloch, M. An assessment of the Sr/Ca ratio in shallow water hermatypic corals as a proxy for sea surface temperature. Geochim. Cosmochim. Acta 2002, 66, 3263–3280. [Google Scholar] [CrossRef]
- Elfil, H.; Roques, H. Role of hydrate phases of calcium carbonate on the scaling phenomenon. Desalination 2001, 137, 177–186. [Google Scholar] [CrossRef]
- Clarkson, J.R.; Price, T.J.; Adams, C.J. Role of metastable phases in the spontaneous precipitation of calcium carbonate. J. Chem. Soc. Faraday Trans. 1992, 88, 243–249. [Google Scholar] [CrossRef]
- Brečević, L.; Nielsen, A.E. Solubility of amorphous calcium carbonate. J. Cryst. Growth 1989, 98, 504–510. [Google Scholar] [CrossRef]
- Loste, E.; Wilson, R.M.; Seshadri, R.; Meldrum, F.C. The role of magnesium in stabilising amorphous calcium carbonate and controlling calcite morphologies. J. Cryst. Growth 2003, 254, 206–218. [Google Scholar] [CrossRef]
- Purgstaller, B.; Mavromatis, V.; Immenhauser, A.; Dietzel, M. Transformation of Mg-bearing amorphous calcium carbonate to Mg-calcite—In situ monitoring. Geochim. Cosmochim. Acta 2016, 174, 180–195. [Google Scholar] [CrossRef]
- Littlewood, J.L.; Shaw, S.; Peacock, C.L.; Bots, P.; Trivedi, D.; Burke, I.T. Mechanism of enhanced strontium uptake into calcite via an amorphous calcium carbonate crystallization pathway. Cryst. Growth Des. 2017, 17, 1214–1223. [Google Scholar] [CrossRef]
- Gabitov, R.; Migdisov, A.; Nguyen, A.; Van Hartesveldt, N.; Perez-Huerta, A.; Sadekov, A.; Sauer, K.B.; Baker, J.; Paul, V.; Caporuscio, F.; et al. Uptake of uranium by carbonate crystallization from reduced and oxidized hydrothermal fluids. Chem. Geol. 2021, 564, 120054. [Google Scholar] [CrossRef]
- Casella, L.A.; Griesshaber, E.; Yin, X.; Ziegler, A.; Mavromatis, V.; Müller, D.; Ritter, A.-C.; Hippler, D.; Harper, E.M.; Dietzel, M.; et al. Experimental diagenesis: Insights into aragonite to calcite transformation of Arctica islandica shells by hydrothermal treatment. Biogeosciences 2017, 14, 1461–1492. [Google Scholar] [CrossRef] [Green Version]
- O’Neil, J.R.; Clayton, R.N.; Mayeda, T.K. Oxygen isotope fractionation in divalent metal carbonates. J. Chem. Phys. 1969, 51, 5547–5558. [Google Scholar] [CrossRef]
- Kim, S.-T.; O’Neil, J.R. Equilibrium and nonequilibrium oxygen isotope effects in synthetic carbonates. Geochim. Cosmochim. Acta 1997, 61, 3461–3475. [Google Scholar] [CrossRef]
- Kerisit, S.; Liu, C. Molecular simulation of the diffusion of uranyl carbonate species in aqueous solution. Geochim. Cosmochim. Acta 2010, 74, 4937–4952. [Google Scholar] [CrossRef]
- Lorens, R.B. Sr, Cd, Mn and Co distribution coefficients in calcite as a function of calcite precipitation rate. Geochim. Cosmochim. Acta 1981, 45, 553–561. [Google Scholar] [CrossRef]
- Tesoriero, A.J.; Pankow, J.F. Solid solution partitioning of Sr2+, Ba2+, and Cd2+ to calcite. Geochim. Cosmochim. Acta 1996, 60, 1053–1063. [Google Scholar] [CrossRef]
- Fairchild, I.J.; Borsato, A.; Tooth, A.F.; Frisia, S.; Hawkesworth, C.J.; Huang, Y.; McDermott, F.; Spiro, B. Controls on trace element (Sr–Mg) compositions of carbonate cave waters: Implications for speleothem climatic records. Chem. Geol. 2000, 166, 255–269. [Google Scholar] [CrossRef]
- Gabitov, R.; Weremeichik, J.; Novak, A.; Sadekov, A.; Thirumalai, R. Effect of pH on the precipitation of synthetic CaCO3 polymorphs and determination of Mg/Ca ratios in synthetic low-magnesium calcite: An experimental investigation. Am. Geophys. Union 2016, 2016, AH14A-0026. [Google Scholar]
- Mavromatis, V.; Gautier, Q.; Bosc, O.; Schott, J. Kinetics of Mg partition and Mg stable isotope fractionation during its incorporation in calcite. Geochim. Cosmochim. Acta 2013, 114, 188–203. [Google Scholar] [CrossRef]
- Gabitov, R.; Sadekov, A.; Leinweber, A. Crystal growth rate effect on Mg/Ca and Sr/Ca partitioning between calcite and fluid: An in situ approach. Chem. Geol. 2014, 367, 70–82. [Google Scholar] [CrossRef]
- Gregory, R.T.; Taylor, H.P., Jr. An oxygen isotope profile in a section of Cretaceous oceanic crust, Samail Ophiolite, Oman: Evidence for δ18O buffering of the oceans by deep (>5 km) seawater-hydrothermal circulation at mid-ocean ridges. J. Geophys. Res. Solid Earth 1981, 86, 2737–2755. [Google Scholar] [CrossRef] [Green Version]
- Taylor, H.P. Oxygen and hydrogen isotope studies of hydrothermal interactions at submarine and subaerial spreading centers. In Hydrothermal Processes at Seafloor Spreading Centers; Springer: Berlin/Heidelberg, Germany, 1983; pp. 83–139. [Google Scholar]
- McKibbin, R.; Absar, A.; Blattner, P. The transport of oxygen isotopes in hydrothermal systems. In Proceedings of the 8th NZ Geothermal Workshop, Auckland, New Zealand, 5–7 November 1986; pp. 29–36. [Google Scholar]
- Clayton, R.N.; Epstein, S. The use of oxygen isotopes in high-temperature geological thermometry. J. Geol. 1961, 69, 447–452. [Google Scholar] [CrossRef]
- Gabitov, R.; Sadekov, A.; Yapaskurt, V.; Borrelli, C.; Bychkov, A.; Sabourin, K.; Perez-Huerta, A. Elemental uptake by calcite slowly grown from seawater solution: An in-situ study via depth profiling. Front. Earth Sci. 2019, 7, 51. [Google Scholar] [CrossRef]
- Gabitov, R.I.; Watson, E.B. Partitioning of strontium between calcite and fluid. Geochem. Geophys. Geosyst. 2006, 7, 51. [Google Scholar] [CrossRef] [Green Version]
- Gabitov, R.I.; Watson, E.B.; Sadekov, A.Y. Oxygen isotope fractionation between calcite and fluid as a function of growth rate and temperature: An in situ study. Chem. Geol. 2012, 306–307, 92–102. [Google Scholar] [CrossRef]
- Mavromatis, V.; Schmidt, M.; Botz, R.; Comas-Bru, L.; Oelkers, E.H. Experimental quantification of the effect of Mg on calcite–aqueous fluid oxygen isotope fractionation. Chem. Geol. 2012, 310–311, 97–105. [Google Scholar] [CrossRef]
- Millero, F.J. Chemical Oceanography; CRC Press: Boca Raton, FL, USA, 1996. [Google Scholar]


| Run | T(°C) | t (h) | pH25 | Aragonite Type | XRD/EBSD |
|---|---|---|---|---|---|
| A120-B2 | 120 | 30 | 7.29 | Mg/Sr aragonite | Calcite, XRD confirmed |
| A120-B4 | 120 | 74 | 7.36 | Mg/Sr aragonite | - |
| A120-B6 | 120 | 96 | 7.44 | Mg/Sr aragonite | - |
| A150 | 150 | 30 | 7.37 | Mg/Sr aragonite | |
| A184-B2 | 184 | 40 | 7.04 | Mg/Sr aragonite | Calcite, XRD confirmed |
| A184-B4 | 184 | 90 | 7.9 | Mg/Sr aragonite | - |
| A184-B6 | 184 | 138 | 7.19 | Mg/Sr aragonite | - |
| A184-B10 | 184 | 234 | 7.43 | Mg/Sr aragonite | - |
| A120-6A | 120 | 144 | 7.57 | Non-Mg/Sr aragonite | - |
| A150-6A | 150 | 144 | 8.91 | Non-Mg/Sr aragonite | - |
| A180-3A | 180 | 144 | 7.98 | Non-Mg/Sr aragonite | - |
| 03 & | 250 | 90 | 9.64 | Non-Mg/Sr aragonite | - |
| 52 *# | 250 | 379 | 8.42 | Red natural aragonite | Aragonite core with calcite rim, EBSD |
| A1 | 162 | 1152 | 8.3 | Red natural aragonite | Aragonite core with calcite rim, EBSD |
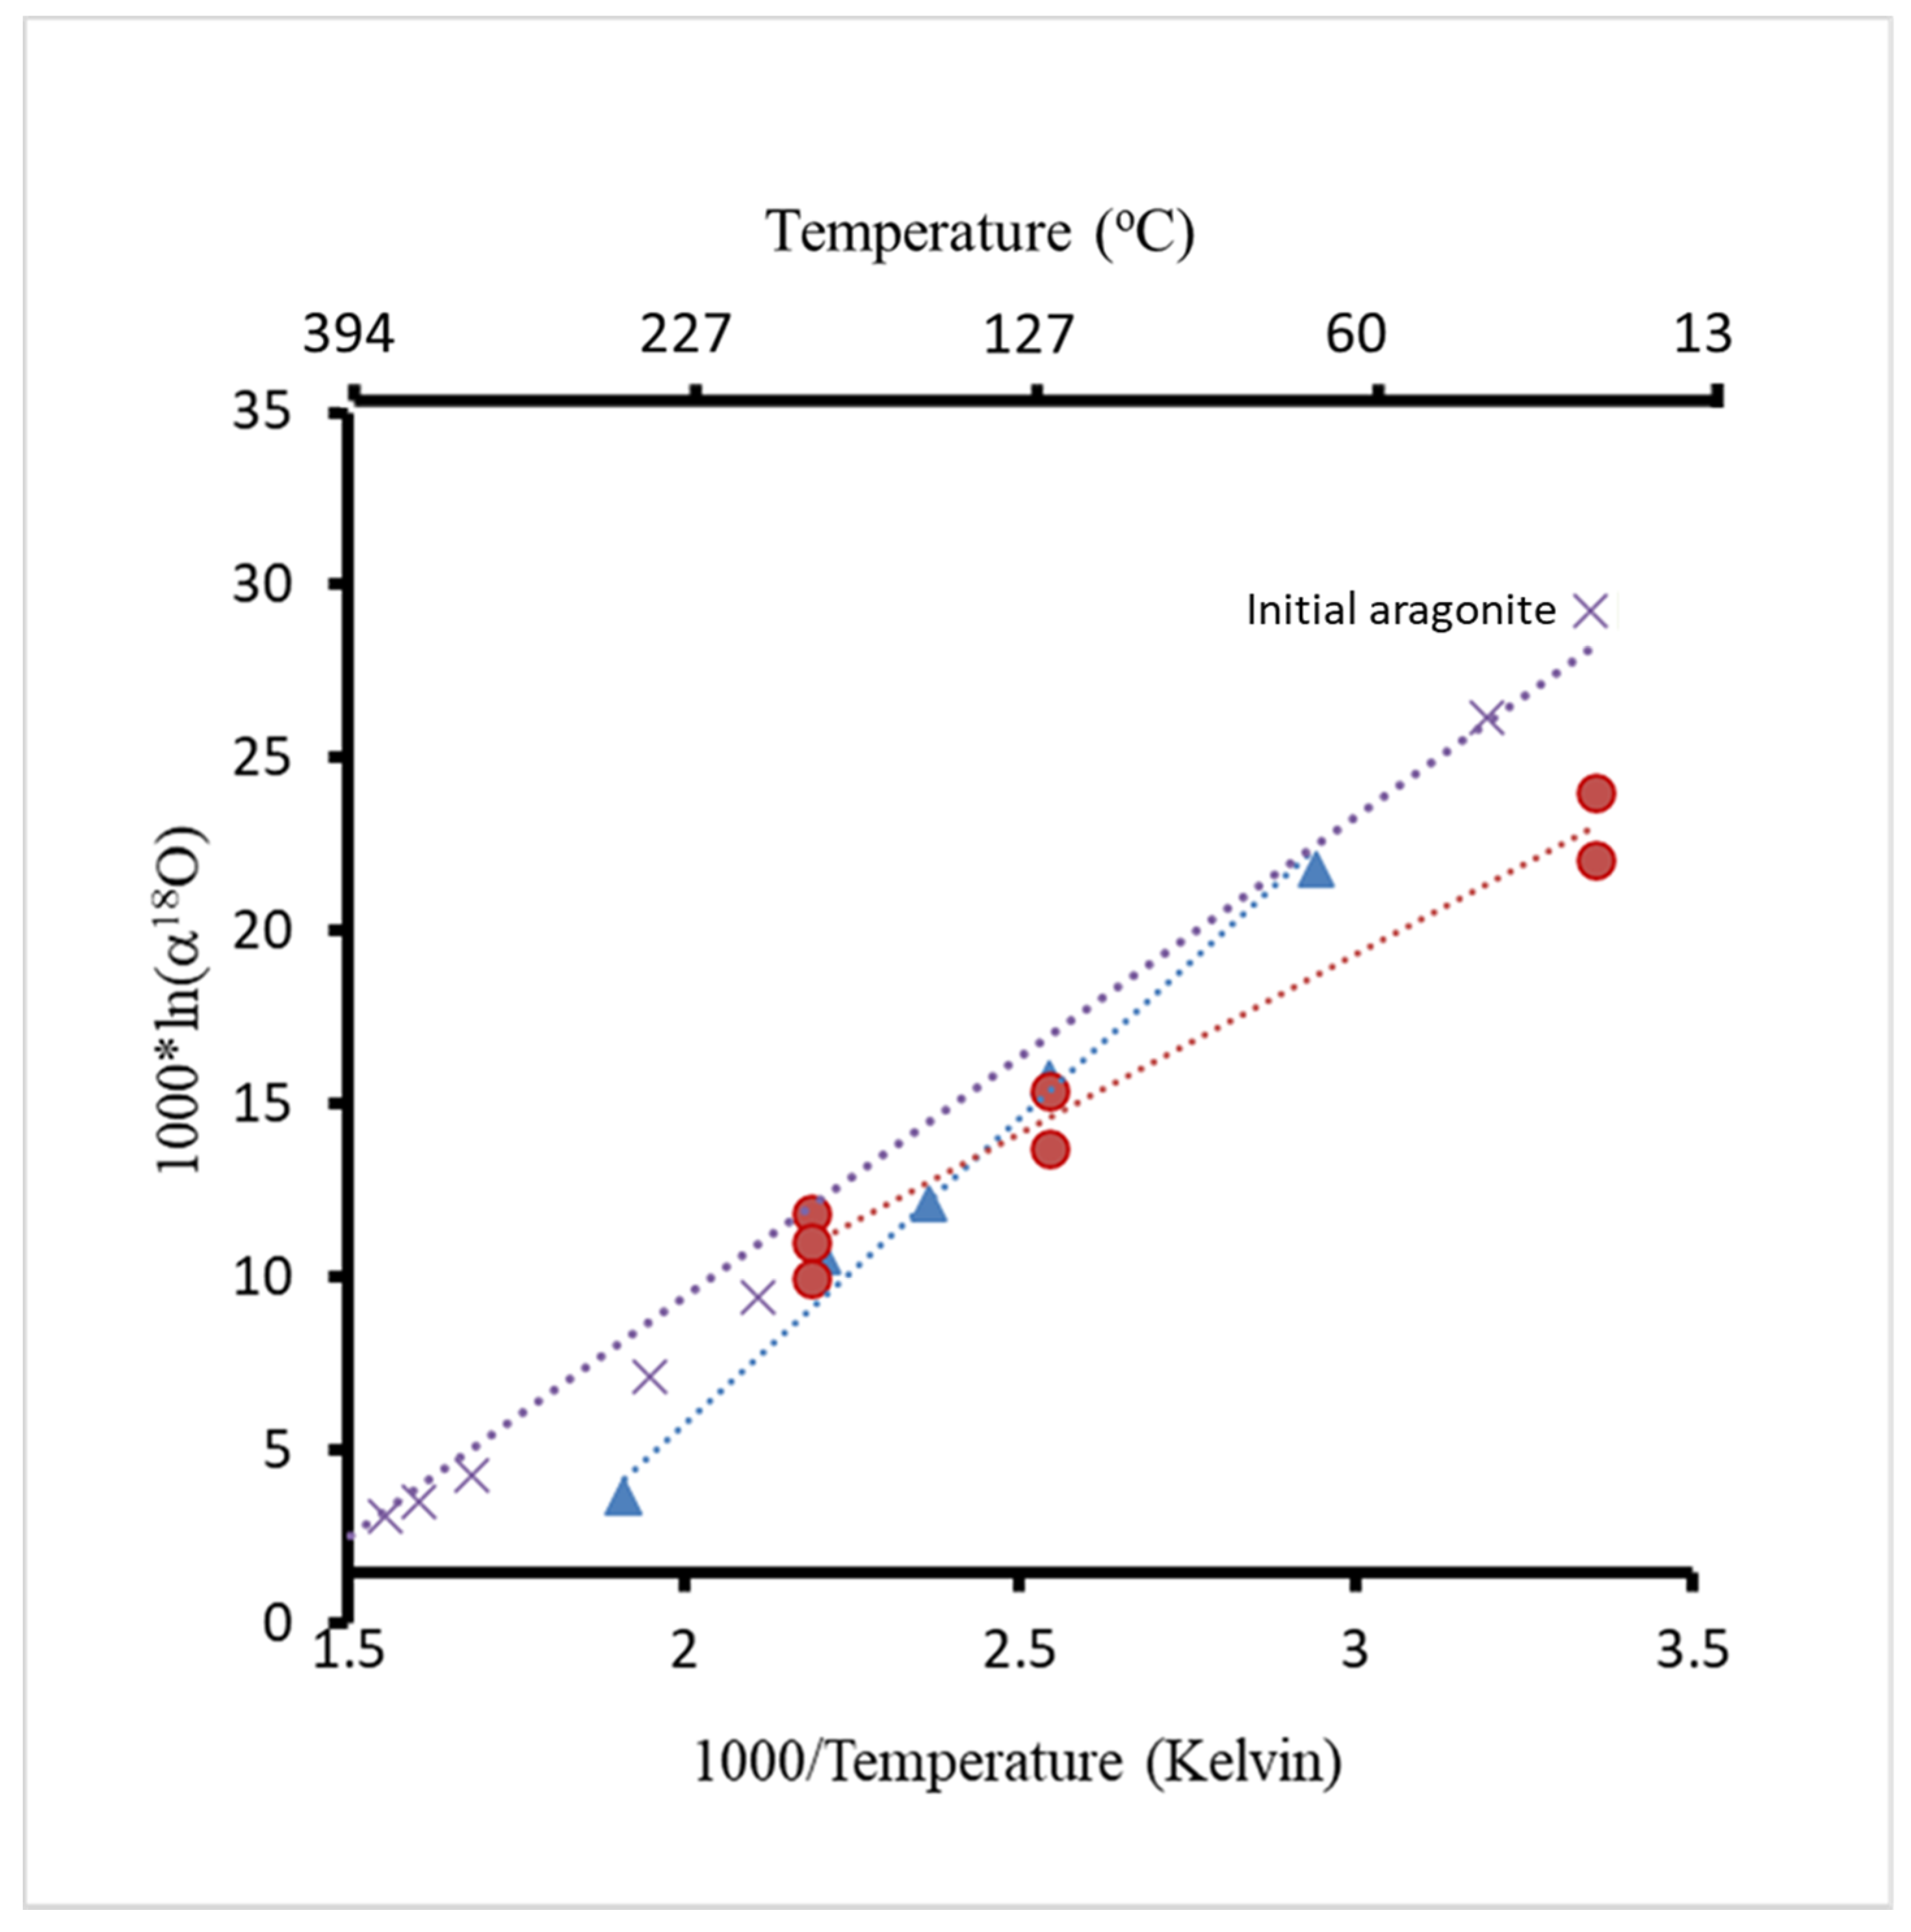
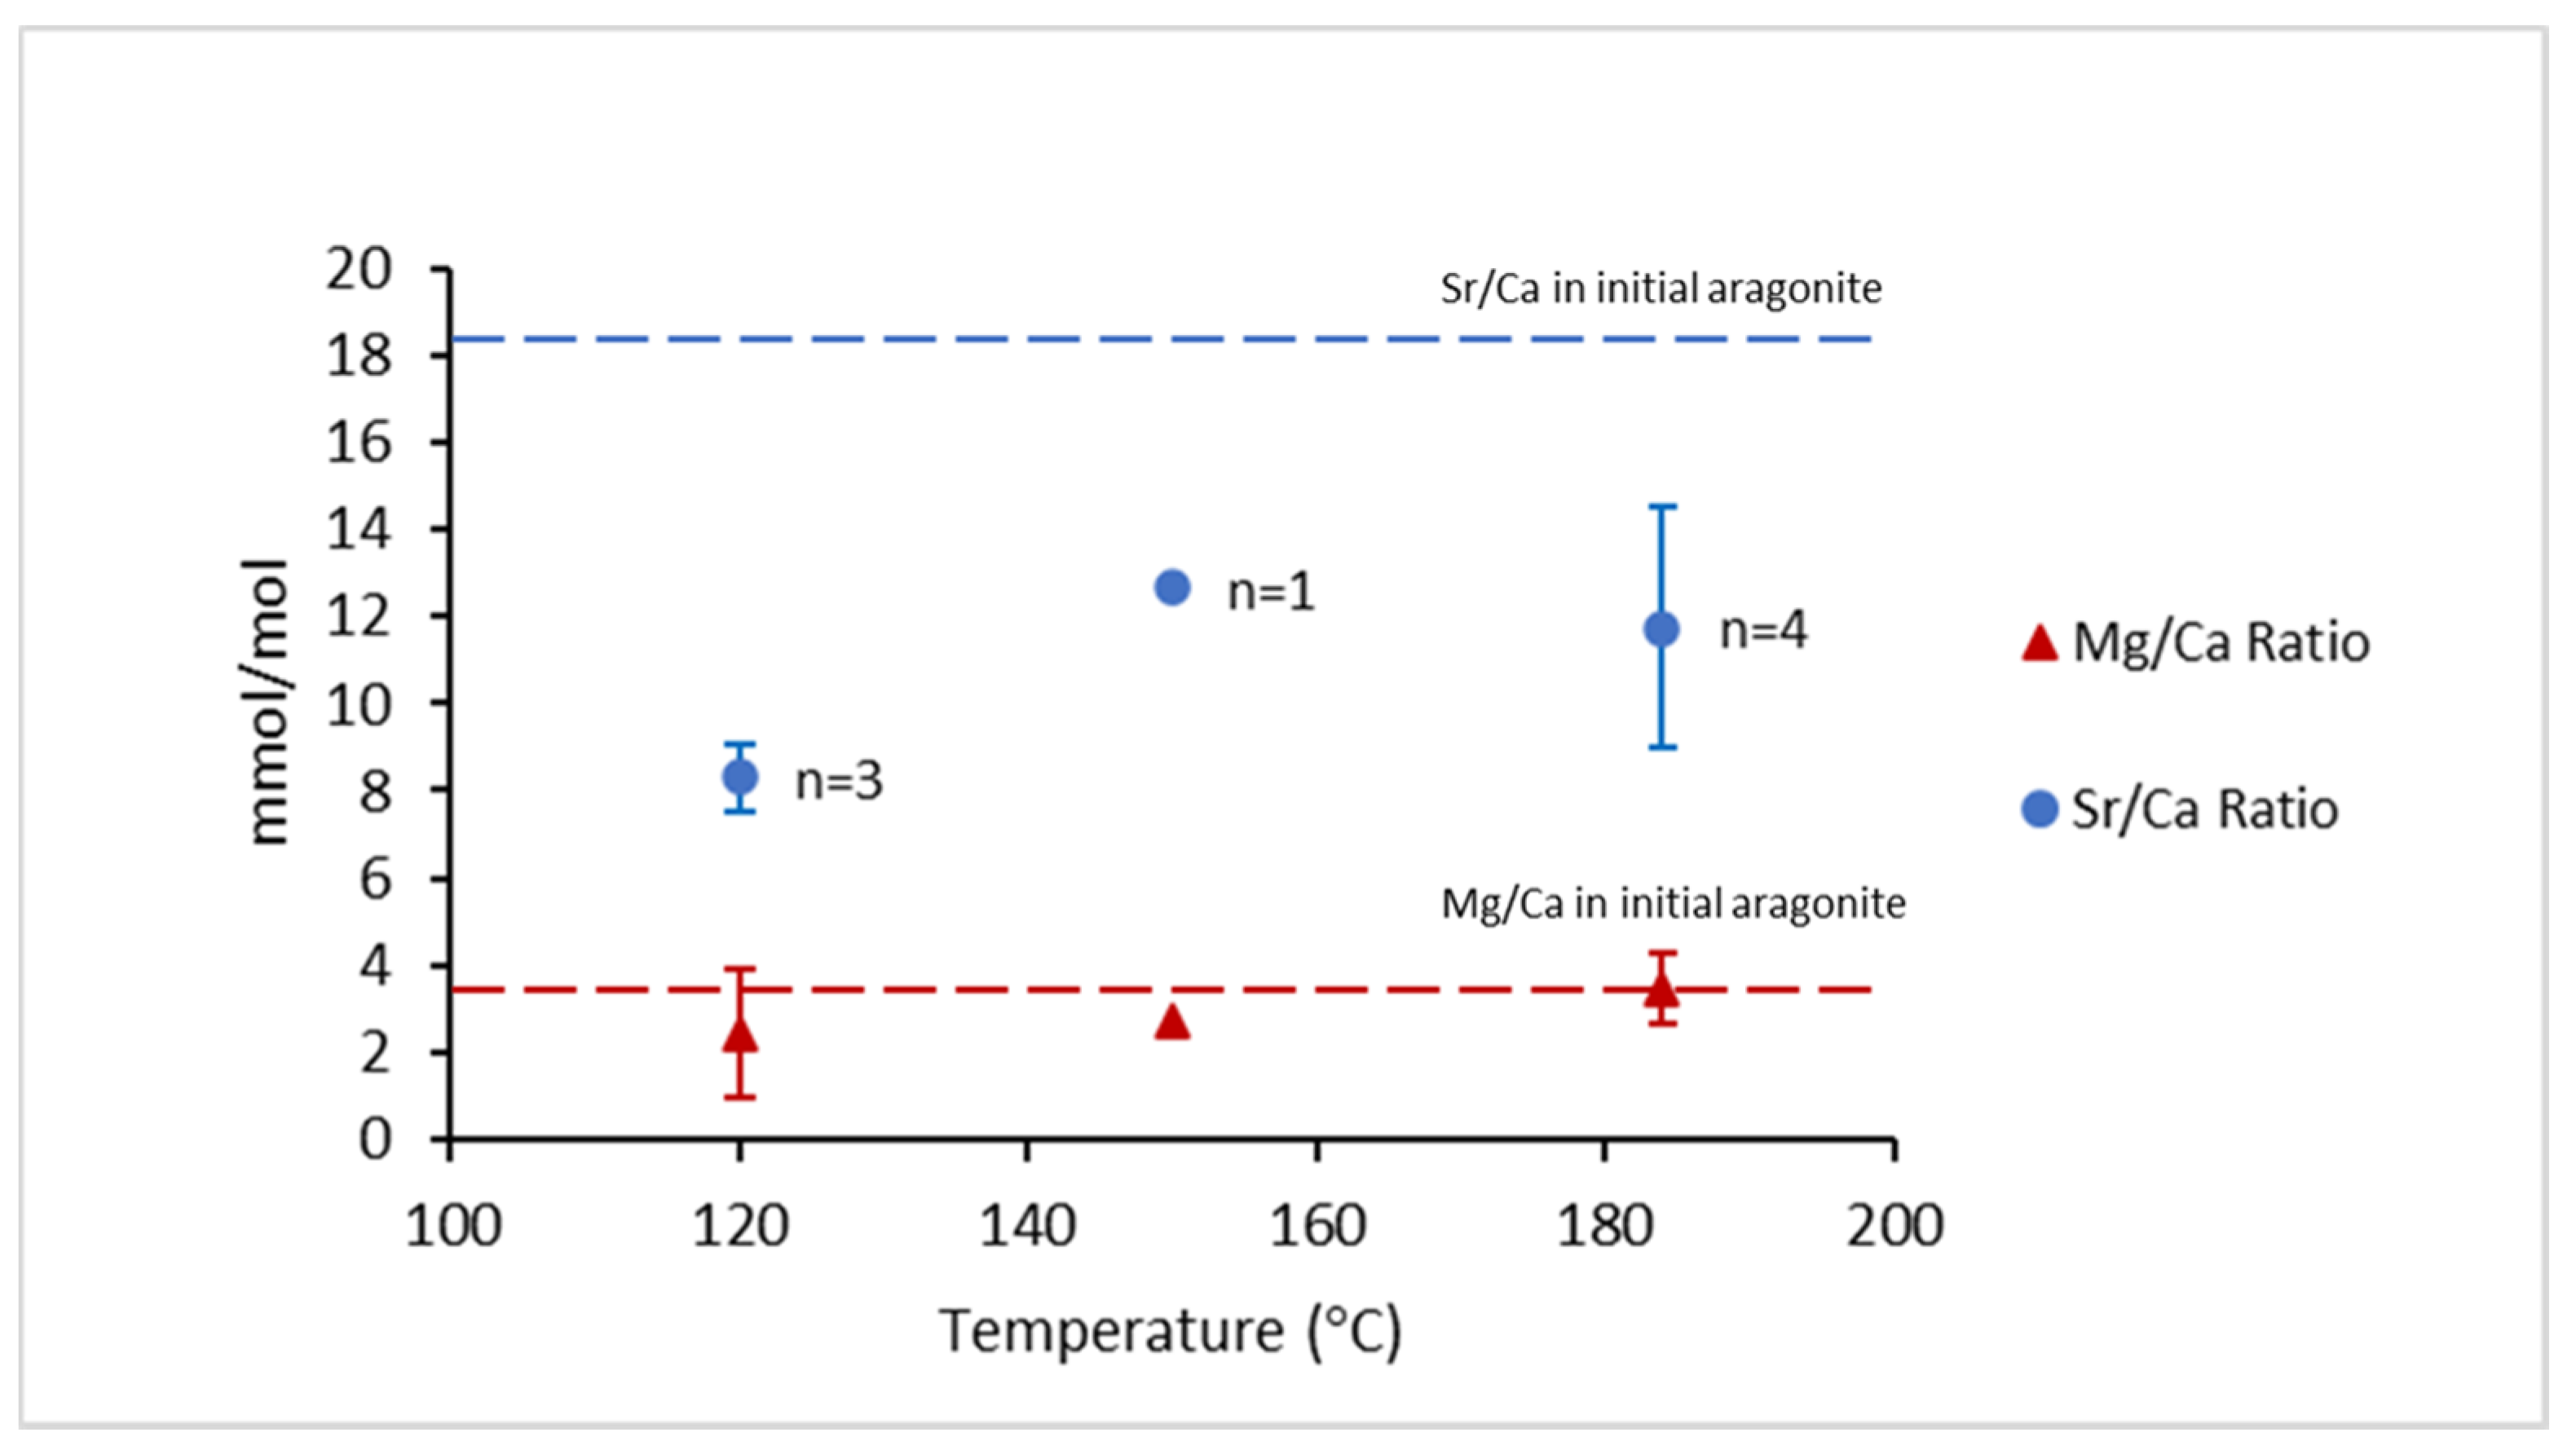
| Label | T (°C) | δ18O ‰, VPDB | 103⋅ln(α18O) | Sr/Ca (mmol/mol) | Mg/Ca (mmol/mol) | Comments |
|---|---|---|---|---|---|---|
| Initial aragonite 2 | 25 | −13.34 | 22.05 | 16.54 | 3.86 | Mg-Sr |
| Initial aragonite 3 | 25 | −11.37 | 24.05 | 18.12 | 3.33 | Mg-Sr |
| A120-B2 | 120 | - | - | 8.71 | 2.26 | Mg-Sr |
| A120-B4 | 120 | −21.50 | 13.75 | 8.63 | 2.56 | Mg-Sr |
| A120-B6 | 120 | −19.89 | 15.39 | 7.55 | 2.48 | Mg-Sr |
| A150 | 150 | - | - | 12.65 | 2.70 | Mg-Sr |
| A184_B2 | 184 | - | - | 12.50 | 3.30 | Mg-Sr |
| A184-B4 | 184 | −23.34 | 11.86 | 8.33 | 3.97 | Mg-Sr |
| A184-B6 | 184 | −24.11 | 11.07 | 14.93 | 3.27 | Mg-Sr |
| A184-B10 | 184 | −24.31 | 10.87 | 11.25 | 3.40 | Mg-Sr |
| AR 1 57 | 57 | −13.57 | 21.82 | - | - | Mg/Sr-free |
| A120-6A | 120 | −19.56 | 15.75 | - | - | Mg/Sr-free |
| A150-6A | 150 | −23.14 | 12.12 | - | - | Mg/Sr-free |
| A180-3A | 180 | −24.44 | 10.63 | - | - | Mg/Sr-free |
| 03& | 250 | −32.22 | 3.68 | - | - | Mg/Sr-free |
Publisher’s Note: MDPI stays neutral with regard to jurisdictional claims in published maps and institutional affiliations. |
© 2021 by the authors. Licensee MDPI, Basel, Switzerland. This article is an open access article distributed under the terms and conditions of the Creative Commons Attribution (CC BY) license (https://creativecommons.org/licenses/by/4.0/).
Share and Cite
Nguyen, A.; Gabitov, R.; Jimenez, A.; Dygert, A.; Varco, J.; Pérez-Huerta, A.; Migdisov, A.; Paul, V.; Kirkland, B.; Dash, P. Retaining Geochemical Signatures during Aragonite-Calcite Transformation at Hydrothermal Conditions. Minerals 2021, 11, 1052. https://doi.org/10.3390/min11101052
Nguyen A, Gabitov R, Jimenez A, Dygert A, Varco J, Pérez-Huerta A, Migdisov A, Paul V, Kirkland B, Dash P. Retaining Geochemical Signatures during Aragonite-Calcite Transformation at Hydrothermal Conditions. Minerals. 2021; 11(10):1052. https://doi.org/10.3390/min11101052
Chicago/Turabian StyleNguyen, Anh, Rinat Gabitov, Angel Jimenez, Andrew Dygert, Jac Varco, Alberto Pérez-Huerta, Artas Migdisov, Varun Paul, Brenda Kirkland, and Padmanava Dash. 2021. "Retaining Geochemical Signatures during Aragonite-Calcite Transformation at Hydrothermal Conditions" Minerals 11, no. 10: 1052. https://doi.org/10.3390/min11101052
APA StyleNguyen, A., Gabitov, R., Jimenez, A., Dygert, A., Varco, J., Pérez-Huerta, A., Migdisov, A., Paul, V., Kirkland, B., & Dash, P. (2021). Retaining Geochemical Signatures during Aragonite-Calcite Transformation at Hydrothermal Conditions. Minerals, 11(10), 1052. https://doi.org/10.3390/min11101052