Article

Effects of the Japanese 2016 Kumamoto Earthquake on Nitrate Content in Groundwater Supply

1
Institute of Integrated Science and Technology, Nagasaki University, 1-14 Bunkyo-machi, Nagasaki 852-8521, Japan
2
Faculty of Advanced Science and Technology, Kumamoto University, 2-39-1 Kurokami, Chuo-ku, Kumamoto 860-8555, Japan
3
Graduate School of Fisheries and Environmental Sciences, Nagasaki University, 1-14 Bunkyo-machi, Nagasaki 852-8521, Japan
4
Department of Regional Environment Systems, Shibaura Institute of Technology, 3-7-5 Toyosu, Koto-ku, Tokyo 135-8548, Japan
5
Division of Water Resources Engineering & Centre for Advanced Middle Eastern Studies, Lund University, Box 118, SE-221 00 Lund, Sweden
*
Author to whom correspondence should be addressed.
Minerals 2021, 11(1), 43; https://doi.org/10.3390/min11010043
Submission received: 27 November 2020 / Revised: 21 December 2020 / Accepted: 24 December 2020 / Published: 31 December 2020
(This article belongs to the Special Issue Understanding Hydrogeochemical Responses to Earthquake)

Abstract

:
The 2016 Kumamoto earthquake had a significant impact on groundwater levels and quality. In some areas, the groundwater level increased significantly due to the release of groundwater from upstream mountainous regions. Conversely, the groundwater level in other areas greatly decreased due to the creation of new fracture networks by the earthquake. There were also significant changes in certain groundwater quality variables. In this study, we used clustering based SOM (self-organizing maps) analysis to improve the understanding of earthquake effects on groundwater quality. We were especially interested in effects on groundwater used for drinking purposes and in nitrate concentration. For this purpose, we studied groundwater nitrate (NO3 + NO2–N) concentrations for the period 2012–2017. Nitrate concentration changes were classified into seven typical SOM clusters. The clusters were distributed in three representative geographical regions: a high concentration region (>4 mg/L), a low concentration region (<1.6 mg/L) with minimal anthropogenic loading area, and an intermediate concentration region (2–4 mg/L). Depending on these regions, the nitrate concentration changes just before and after the earthquake had both increasing and decreasing trends between 2015–2017. This points to complex physiographical relationships for release of stored upstream groundwater, promotion of infiltration of shallow soil water/groundwater, and nitrate concentration as affected by earthquakes. We present an analysis of these complex relationships and a discussion of causes of nitrate concentration changes due to earthquakes.

1. Introduction

The Kumamoto earthquake sequence started with a foreshock (Mw 6.2) at 21:26 (JST, UTC+9) on 14 April 2016, and 28 h later the mainshock (Mw 7.0) occurred at 1:25 on 16 April 2016. Many foreshocks and aftershocks accompanied the mainshock within the week from 14–20 April 2016. The earthquake produced a 40 km long surface rupture along the Hinagu-Futagawa fault fracture zone, and simultaneously, a series of geological disasters occurred such as formation of new fault systems (Suizenji fault), mountain landslides, land subsidence and uplift, and liquefaction [1,2,3,4]. These processes resulted in extensive damage to buildings and infrastructure in the seismic area, as well as 273 fatalities [5]. The focal mechanism was the strike-slip movement and normal displacement of the active Hinagu-Futagawa fault that triggered seismic activity in the Kumamoto area. The earthquake is considered as the largest inland earthquake in Kyushu Island during the past century. Its focal depth was about 11 km [6,7,8].
Hydrological and hydro-chemical changes after earthquakes occur due to geological and tectonic deformations in seismic-affected areas. Such changes include hydro-biogeochemical features in aquifer systems, abnormal fluctuations of water levels, fluvial discharge oscillations, and groundwater temperature shifts. These effects have been observed in many parts of the world, e.g., America, China, Italy, Taiwan, Iceland, and New Zealand. Observations have two main objectives, firstly to protect water resources and secondly to develop earthquake prediction indicators [9,10,11,12,13,14,15,16,17]. The 2016 Kumamoto earthquake provides a unique opportunity for systematic understanding of seismic-induced hydro-environmental phenomena at the scale of regional groundwater basins. A plethora of hydrogeological data have been assembled for this area during the last three decades. The main findings for the active fault area include seismic-induced mountainside water release that has been verified by tank modeling and changes in isotopic trace signatures indicating groundwater age [5,18,19]. Using observations of seismic-induced tectonic deformation and water chemistry, new spring formation was detected in the active Aso-caldera volcanic system [7]. The 2016 Kumamoto earthquake triggered a new Suizenji fault system within the Kumamoto urban area, leading to local groundwater level decline. Groundwater moved through newly developed cracks in the new fault formation. This occurrence and groundwater movement were quantitively verified using numerical simulations [4,20]. Seismic-induced changes in hydro-geochemistry are also likely to lead to changes in microbial species and noble gases (radon, helium). Changes in hydrochemistry and hydrobiology are proposed to occur due to mixing of surface water and groundwater, dilution from mountainside water release, agricultural and sewer pollutant infiltration into groundwater, and local geothermal fluid release into groundwater [21,22,23,24,25].
Seismic-induced hydrological and environmental changes can be confirmed by observation of multi-physicochemical variables and validated by simulation. Physicochemical variables such as dissolved silicates, sulfate, electric conductivity, dissolved oxygen, chloride, nitrate, and pH are likely to change with seismic activity [21,24]. Seismic triggered rock fractures and ground shaking tend to increase the dissolution of silicate rocks based on decomposing of the Si–O bond of silicate minerals. Decreasing concentration of typical ions (Ca2+, Na+, K+, Cl, and F) and electric conductivity occur due to dilution from mountainside water release in groundwater recharge areas. Increasing concentration of NO3 + NO2–N, SO42−, and Mg2+ may be due to agricultural fertilizer and soil leaching of pollutants through surface fractures in agricultural production upland areas. Decreasing pH may occur in some groundwater wells because of mixing of surface water and different types of aquifer groundwater [21,24]. Especially, nitrate (NO3 + NO2–N) concentration has been confirmed to change due to earthquake effects in the Kumamoto area [26,27,28]. However, all seismic-induced nitrate changes in groundwater are not fully understood. To improve this knowledge, we observed nitrate concentrations in groundwater for all drinking water production wells (134 wells) covering the 2016 Kumamoto earthquake using pre- and post-seismic data from 2012 to 2017. The spatiotemporal change characteristics of these observations were analyzed using self-organizing maps (SOM). Possible mechanisms for groundwater nitrate changes are interpreted through links to hydro-chemical and hydrogeological alternations.

2. Materials and Methods

2.1. Study Area

Kumamoto region is situated in the middle part of Kyushu Island, south Japan (Figure 1). The regional climate characteristics are humid subtropical. Mean annual temperature and precipitation are 16.9 °C and 1986 mm, respectively [2,29]. In terms of geological tectonic features, Kyushu Island is located on the converging margins of two tectonic plates. Moreover, the active Hinagu-Futagawa fault that runs over the western extension of the Median Tectonic Line crosscuts the Kumamoto area. Because of these features, there are frequent earthquakes and volcanic activities along the fault zones [8,30,31]. In the Kumamoto area, the major geological characteristics are composed of a basement of metamorphic and sedimentary rocks from the Paleozoic Era, volcanic pyroclastic deposits, porous tuff, and alluvial and marine clay sediments from the Tertiary-Quaternary periods [19,29]. Volcanic pyroclastic deposits and alluvial sediments have evolved as dual-layer structured aquifers. The shallowest aquifer is unconfined with a depth of 0–50 m from soil surface. The second aquifer is semi-confined to confined with an aquifer thickness of 60–200 m below ground surface. The heterogeneous distribution of lacustrine formations serves as aquiclude between the first and second aquifers [32]. Most production wells for drinking water pump water from the second aquifer. Regional groundwater is recharged from the Aso caldera rim mountains as well as plateaus (Kikuchi, Ueki, and Takayubaru regions). In addition, river water also recharges groundwater at the midstream of Shirakawa River. Groundwater flows into the Kumamoto plain and discharges into coastal stagnant areas in a southwest direction [33].
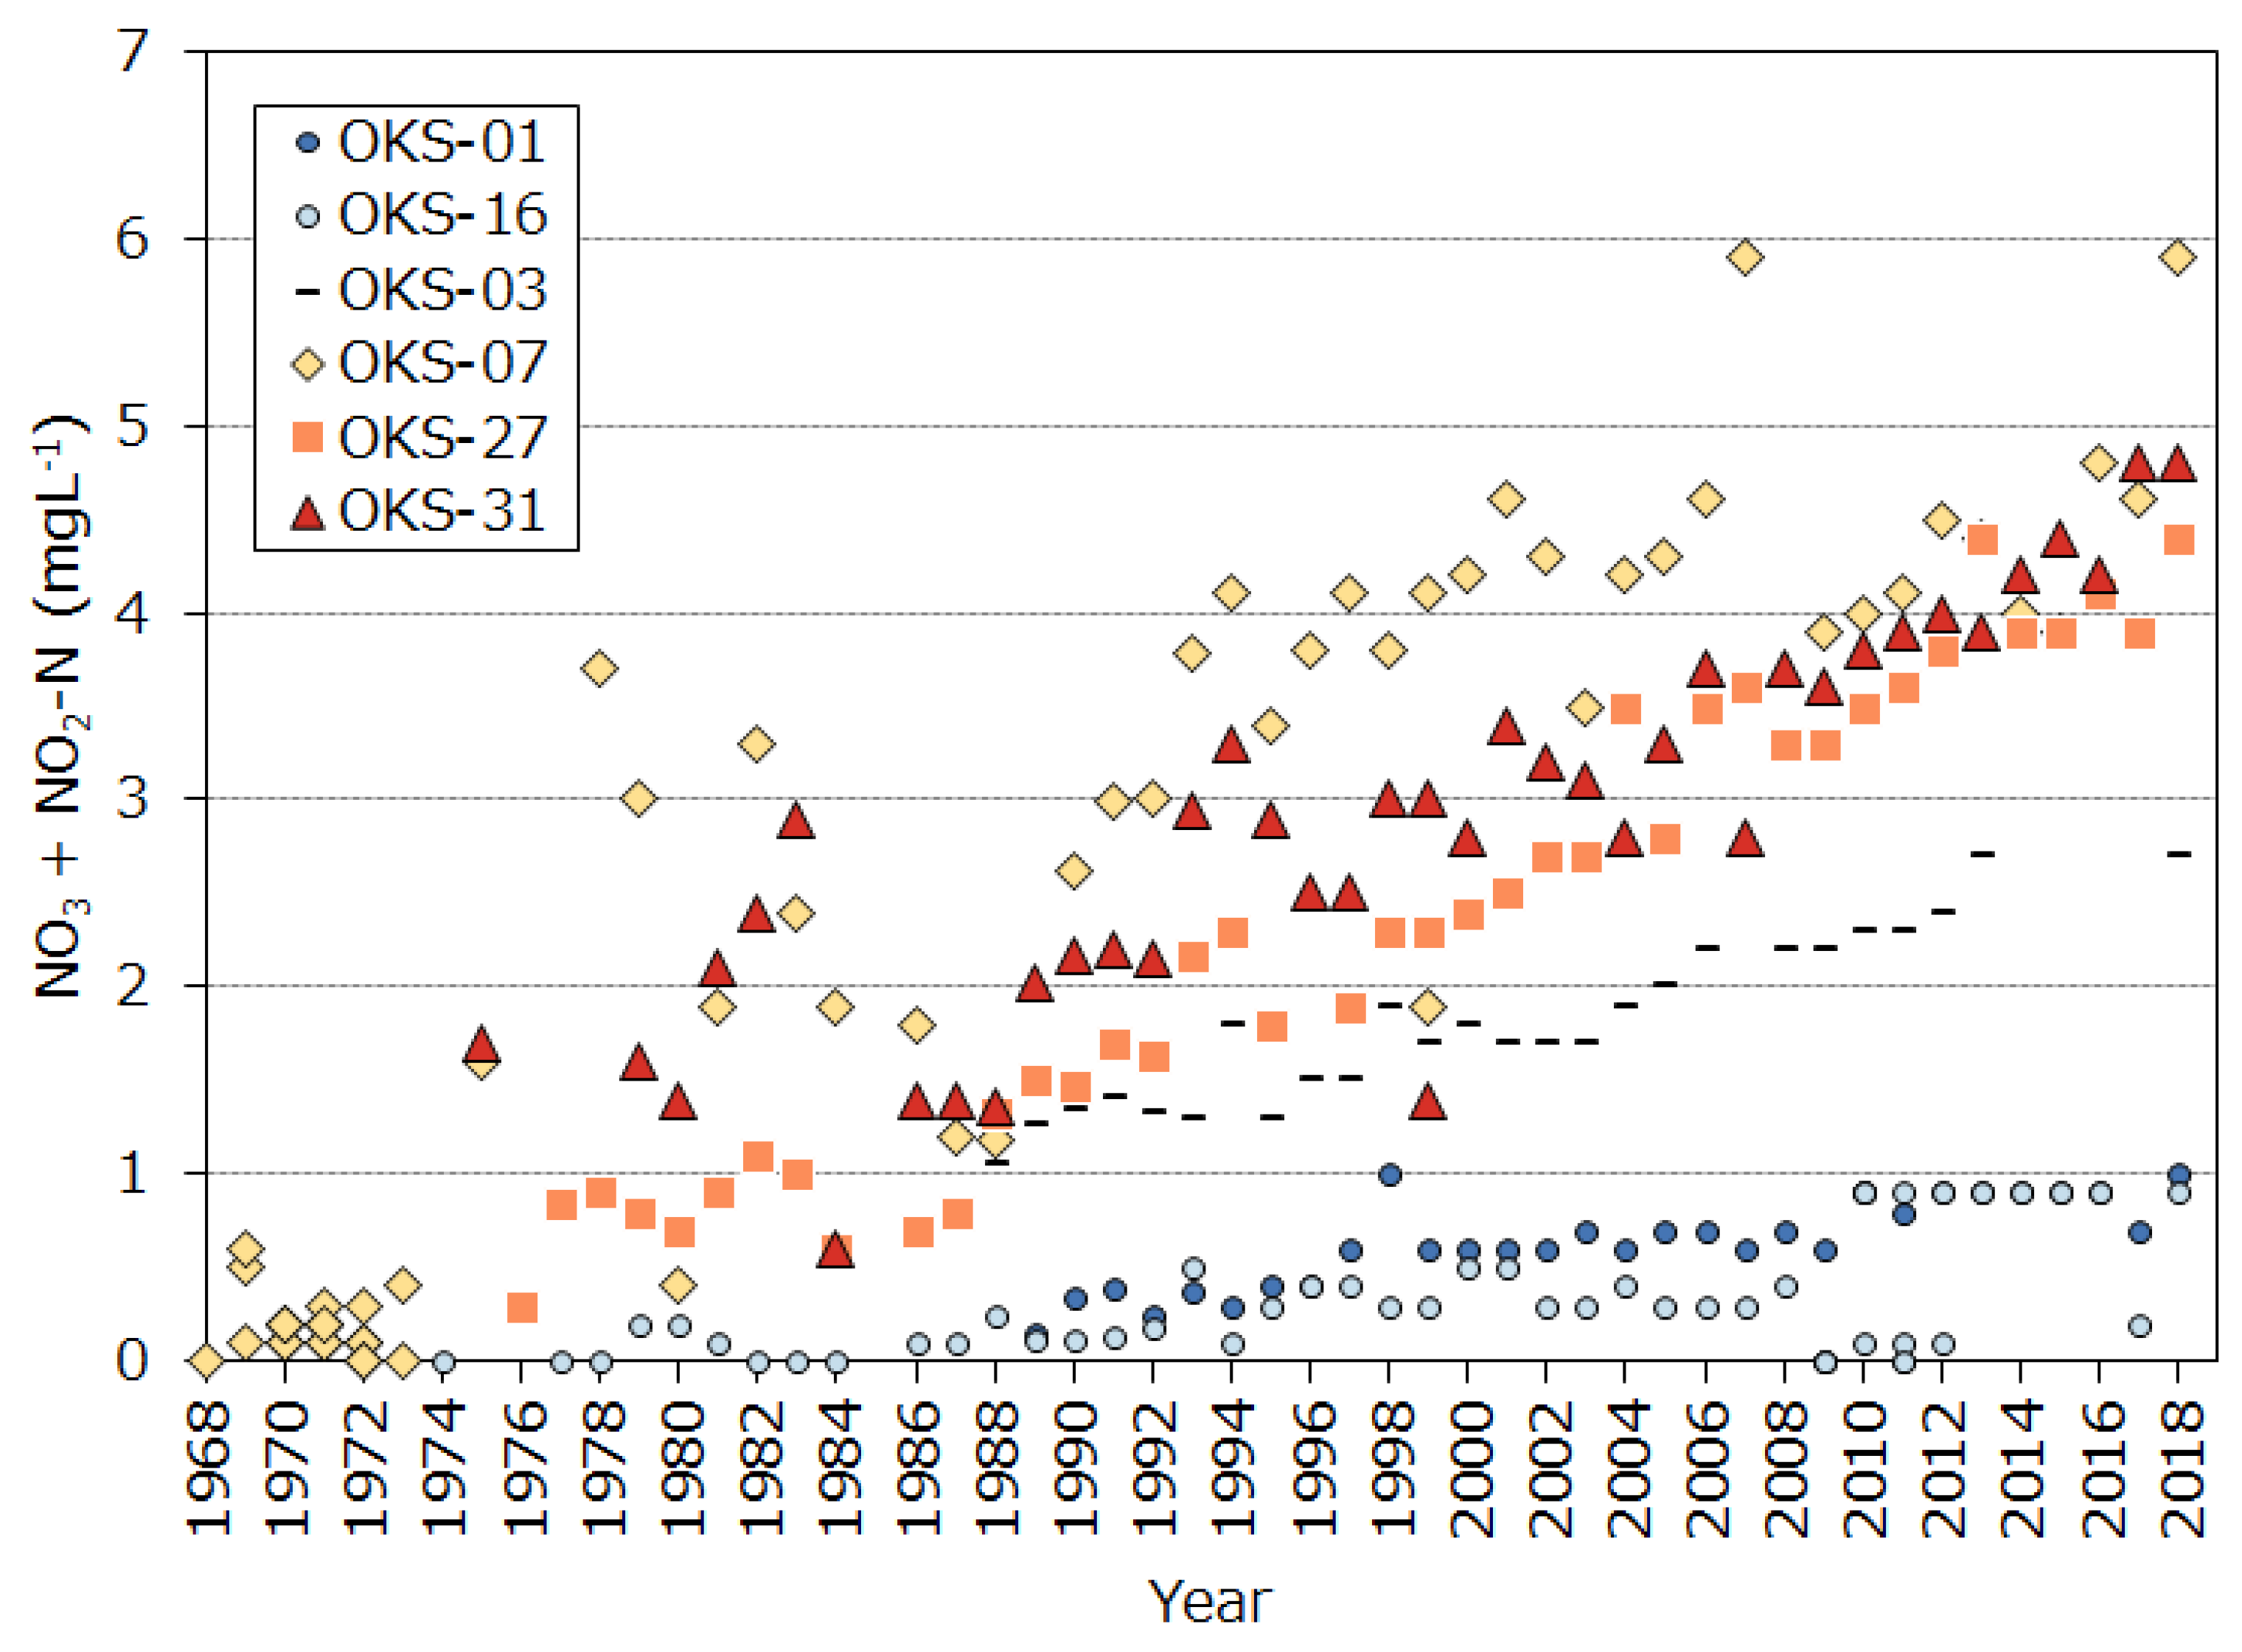
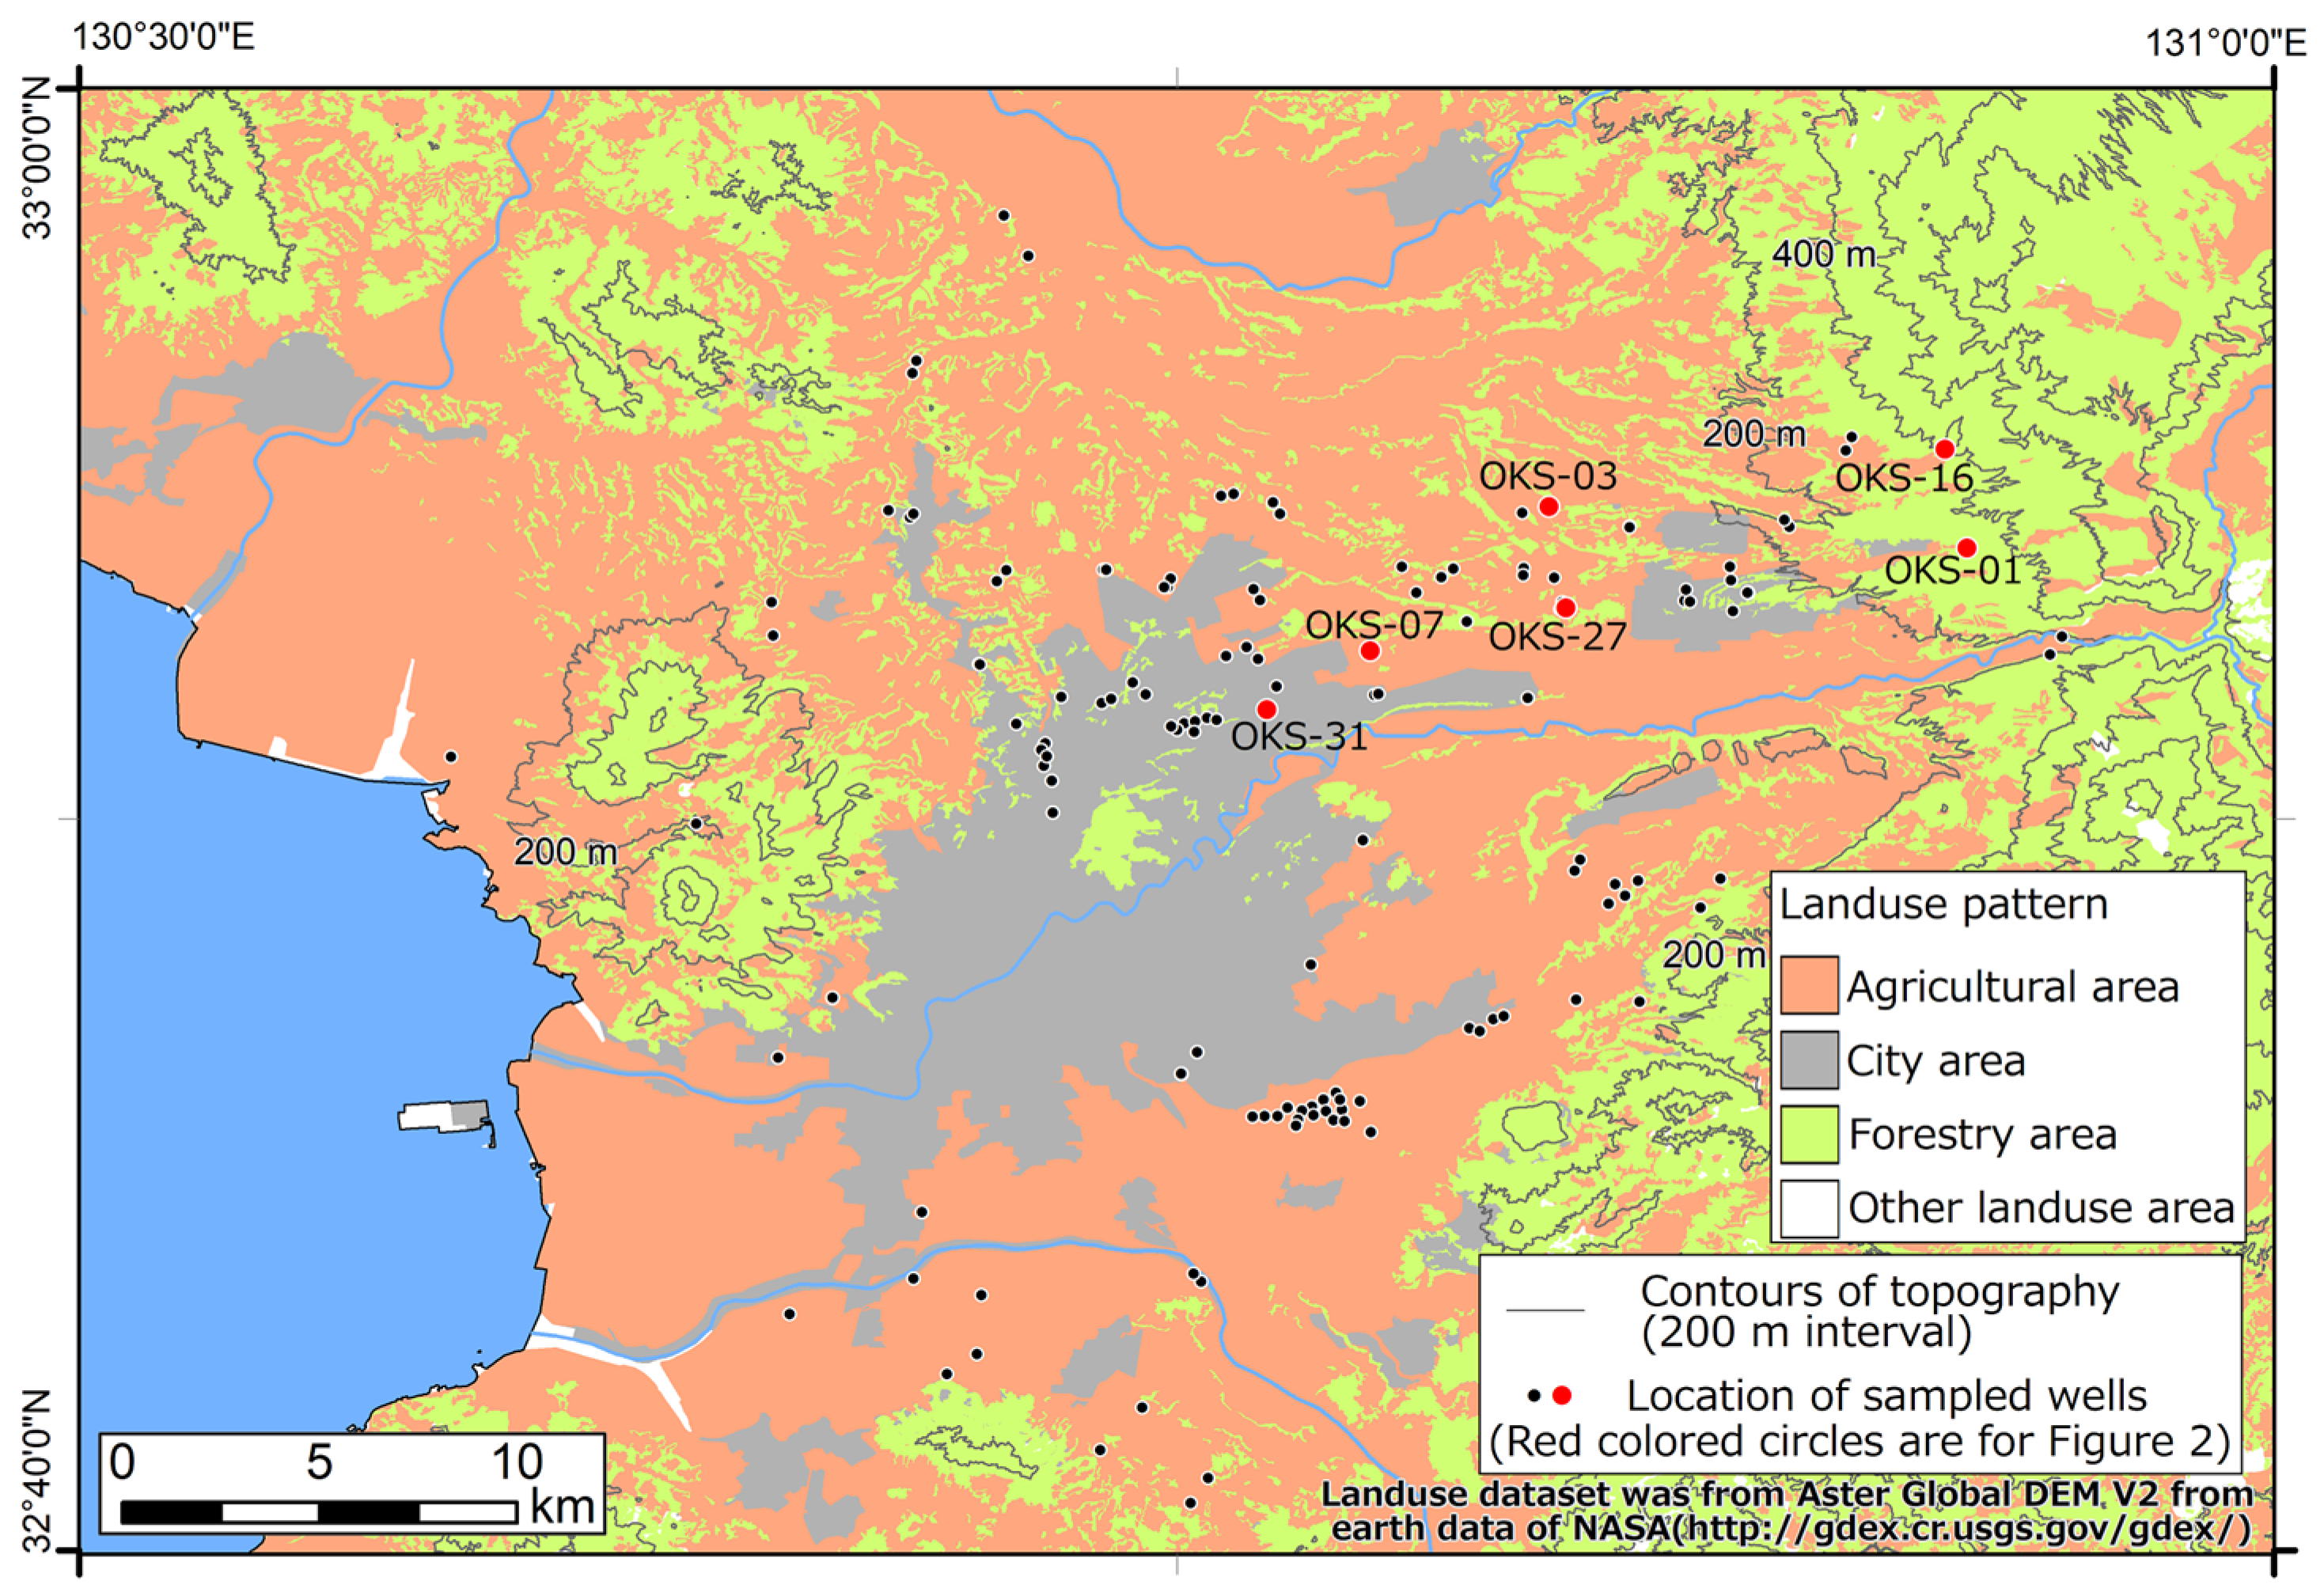
Kumamoto Region includes Kumamoto City and 11 municipalities as shown in Figure 1. Water supplies for residents (about 1,000,000 people) come entirely from groundwater resources. The area uses the largest groundwater volumes in Japan. The total consumption of groundwater is about 236 million m3 in 2018 year [34]. To safeguard groundwater resources, many high-resolution monitoring wells are distributed in the regional groundwater flow system. To preserve environmental groundwater quality and quantity, several major hydrogeological studies have been performed. Groundwater renewal capacity has been evaluated by use of environmental indicators [32]. Groundwater recharge and discharge balance has been investigated for the regional groundwater basin [35,36]. Hydro-biogeochemical evolution and origin of groundwater pollutants (nitrate, arsenic, and fluoride) have been investigated for the Kumamoto regional groundwater flow system [29,33,37,38,39]. Based on these studies, two main environmental groundwater protection policies have been implemented for preserving groundwater resources. An artificial recharge system has been established using paddy fields in the midstream section of the Shirakawa River. These measures aim at increasing groundwater recharge [36]. Another measure is the “Kumamoto City Nitrate-Nitrogen Reduction Plan” that has been in operation since 2007, due to nitrate contamination from agriculture in groundwater. The effects of the artificial recharge system have meant increasing recharge of groundwater during the past decade [35,40]. However, the effects of the nitrate-nitrogen reduction plan are still inconclusive. Groundwater nitrate content is still increasing in the Kikuchi upland area. Consequently, groundwater quality is still deteriorating as shown in Figure 2. Figure 3 shows the land-use with water sampling locations. The core sampling data were collected at five locations in the groundwater recharge area. On the basis of these data, the downward velocity of soil water movement and annual groundwater recharge rate were determined at 1.37 to 2.34 m/year and 745 to 1058 mm/year, respectively [41]. At the same time, the residence time of soil water from soil surface to groundwater was assessed as 9 to 24 years. In other words, soil water infiltration into groundwater varies depending on location. The main reasons for this are heterogeneous soil types, different permeability, and different terrain features (such as the Shirasu doline terrain). These properties give rise to spatial variability and preferential flow of soil water [27,41].

2.2. Self-Organizing Maps (SOM)

SOM are also known as Kohonen maps, a type of unsupervised artificial neural network [42,43,44]. Due to their powerful data processing capability, SOM has been extensively applied in data mining, classification, and prediction in many subjects [45,46,47,48,49,50]. The main advantage of SOM is that it can project high-dimensional, complicated input data into low-dimensional array (usually two-dimensional) and simplified visualized maps based on data similarity principles [2,51,52,53]. By running the SOM, informative reference vectors are extracted by iterative updates under three important steps, that is competition with nodes, selection of winner node, and updating of the reference vectors. Then, an optimal number of SOM nodes is determined by heuristic rules [54,55,56,57].
According to the above methodology, SOM structures were established, as well as using k-means algorithms for efficient clustering of SOM reference vectors. These procedures were performed using a modified version of SOM Toolbox 2.0 [24,58]. Further details on the SOM methodology can be found in [46,47,58].

2.3. Data Collection and Analysis

Time-series of groundwater nitrate contents from 2012 to 2017 were acquired from four different administrative departments: the Kumamoto City Waterworks and Sewerage Bureau (SSS in Figure 1), Koshi City (KSS in Figure 1), Mashiki Town Waterworks and Sewerage Bureau (MASS in Figure 1), and Water Works Bureau of Ozu Kikuyou (OKS in Figure 1). The groundwater nitrate concentration was measured by different water work groups that follow analytical guidelines and manuals from the Japanese Ministry of Health, Labour, and Welfare. They are quality certified by this ministry. Because of this, the quality of analyses is expected to be reliable and of high quality. In total, nitrate concentrations from 152 wells were collected. After a quality check, all except for 18 wells (due to lack of data), were used in this study. Each administrative department regularly administers and quality checks water samples one to three times a year, though with the different purpose of drinking water resources utilization. In our study, annual average nitrate content was used as input data to the SOM analysis. For efficient data preprocessing, annual nitrate ratios for 2013/2012, 2014/2013, 2015/2014, 2016/2015, and 2017/2016 and the original average nitrate data for 2012, 2013, 2014, 2015, 2016, and 2017 (in total 11 parameters) were used as input parameters.

3. Results and Discussion

3.1. SOM Analysis

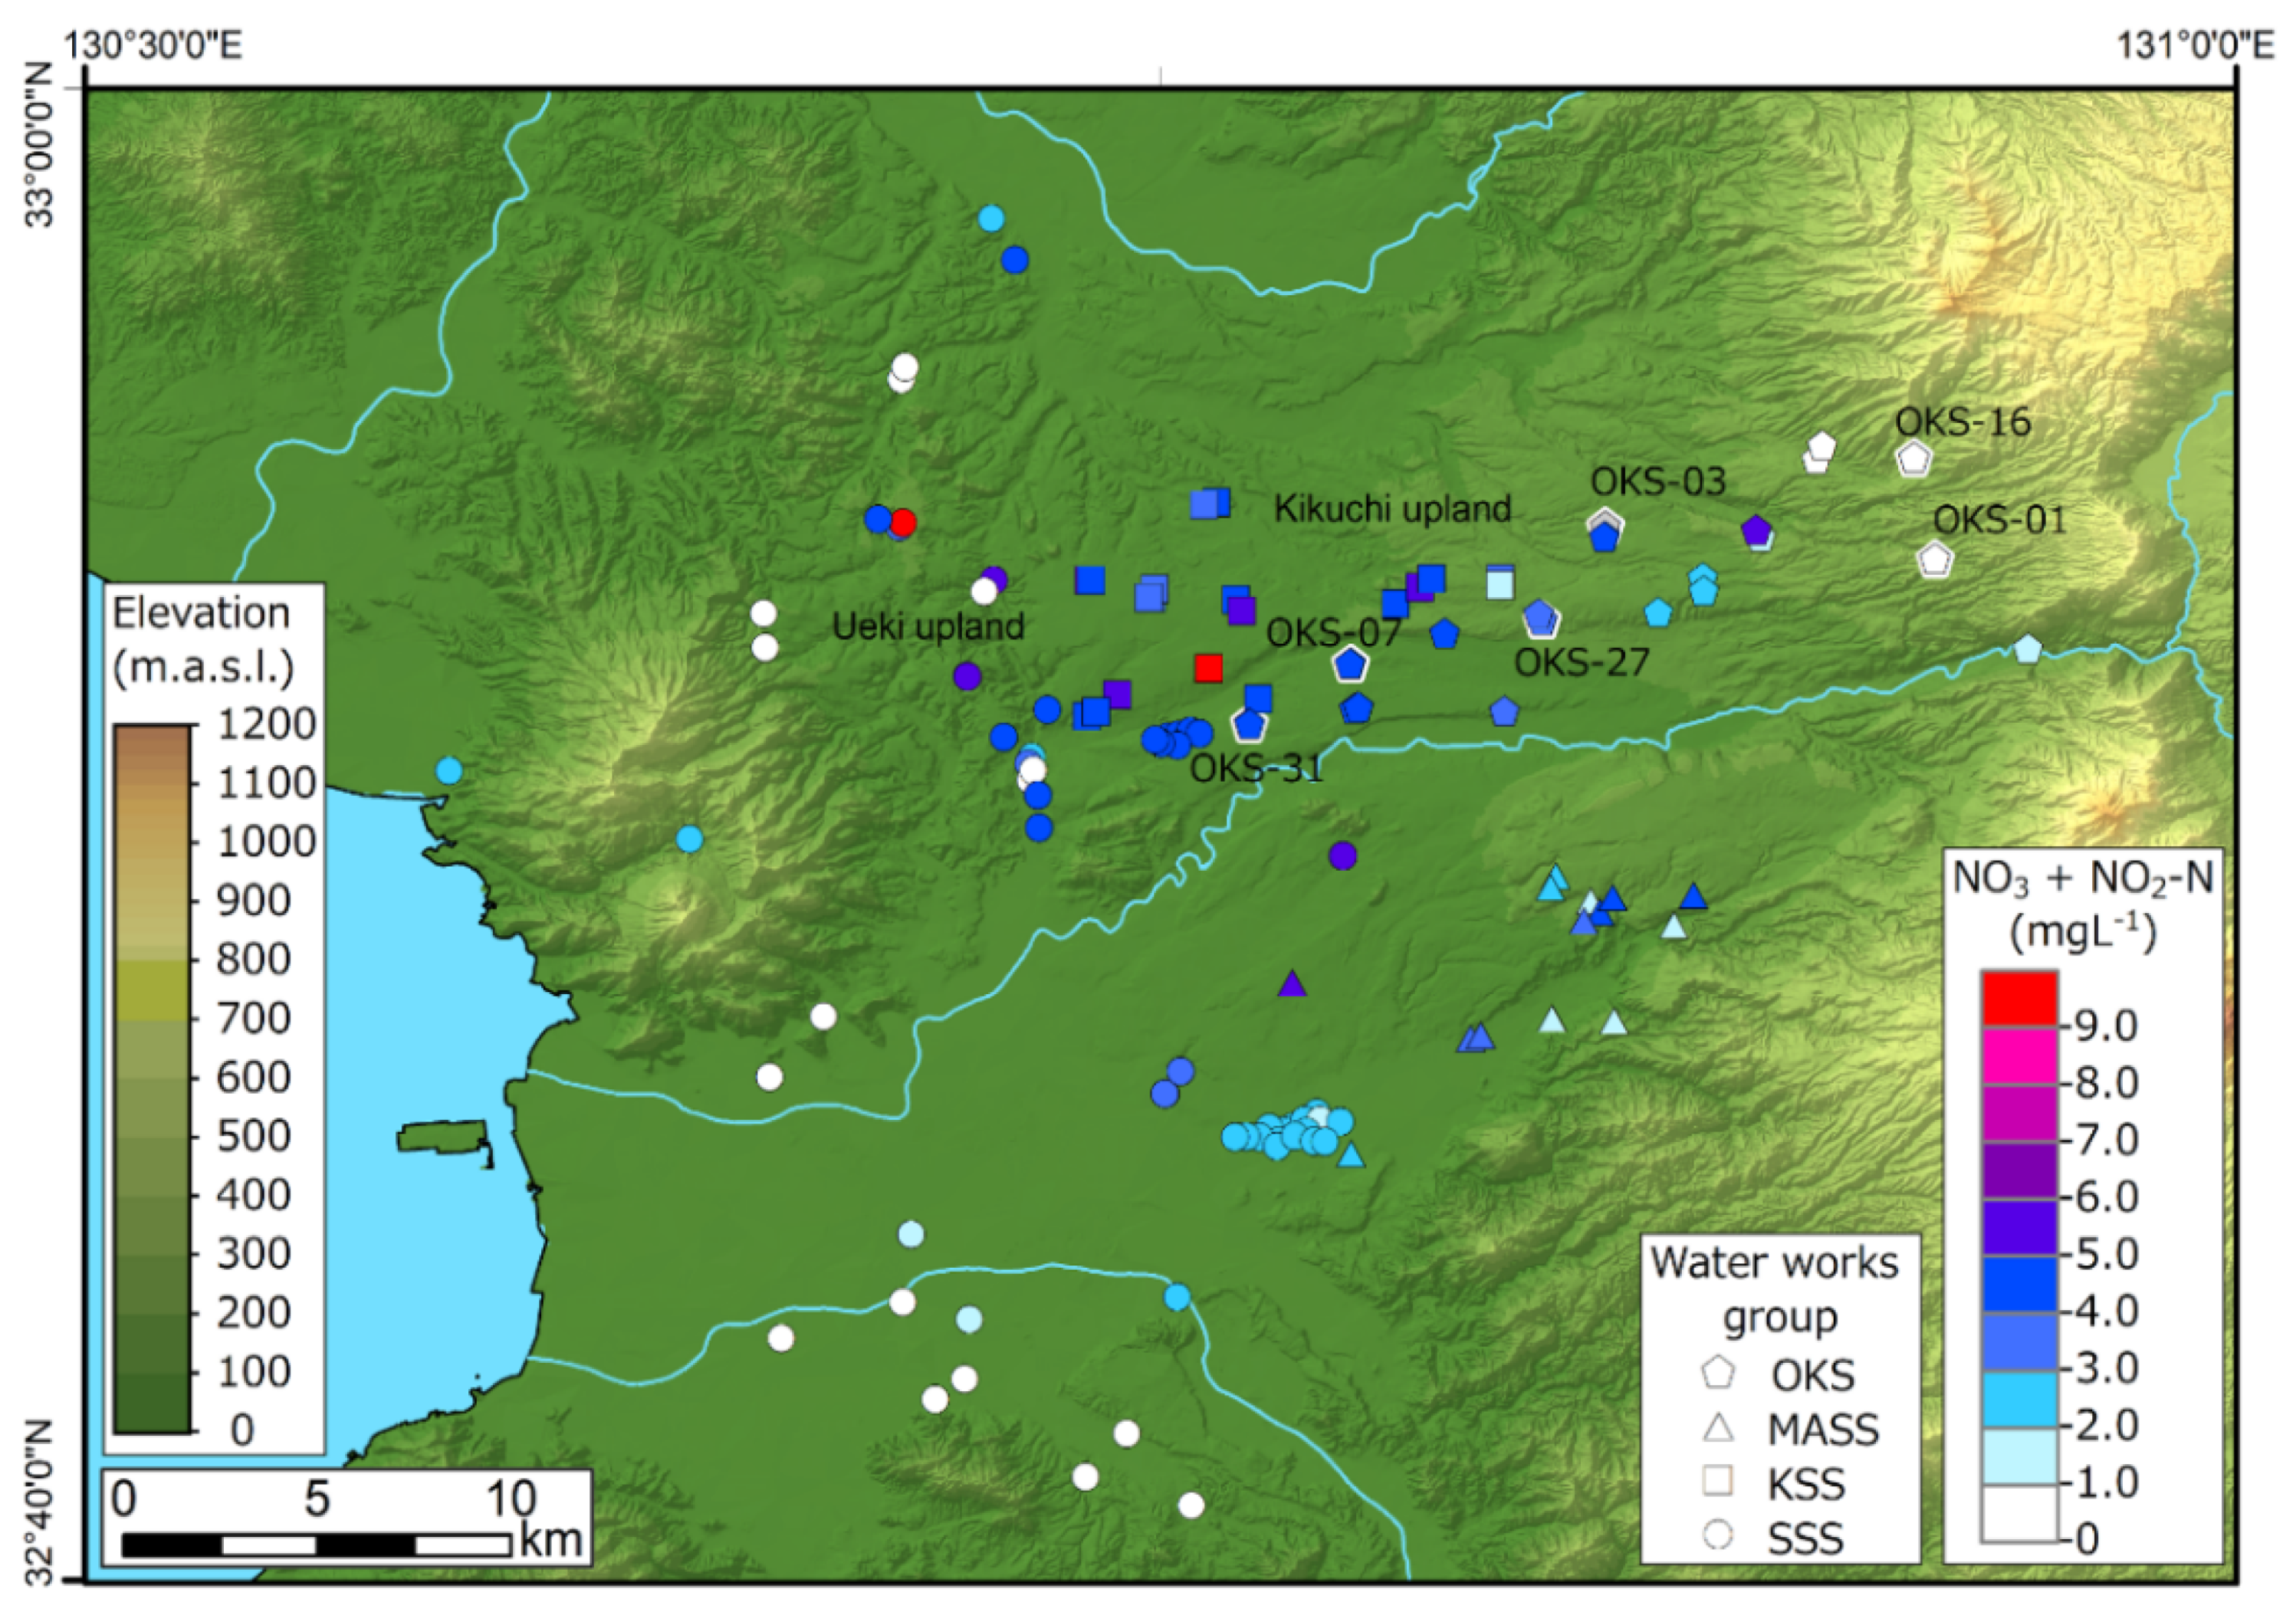
To compare pre- and post-seismic groundwater nitrate change features, pre-seismic groundwater nitrate distribution characteristics for the Kumamoto area are shown in Figure 4. The figure shows that the primary groundwater nitrate contamination area is distributed in the Kikuchi and Ueki upland groundwater recharge area. The land-use of this area is mainly agricultural. However, the groundwater nitrate content is lower in groundwater discharge and stagnant areas due to denitrification processes [29,37]. In general, the spatial distribution of groundwater nitrate content shows large differences within the regional groundwater flow system.
To explore seismic-induced groundwater nitrate changes, average groundwater nitrate contents (2012–2017) from 134 production wells were prepared together with 11 parameters for input to the SOM analysis. Due to the SOM methodology, the number of SOM node reference vectors was 55, with 11 vertical and 5 horizontal columns, respectively. The results of SOM analysis after training are displayed in Figure 5. In the figure, the component values of the 11 parameters are expressed by 55 reference vectors, where vectors were standardized in the range of 0–1. Hence, if a node color is red, it means a comparatively high concentration ratio and high original concentration. If the node color is blue, this means a comparatively low concentration ratio and low original concentration. In general, average nitrate contents for 2012, 2013, 2014, 2015, 2016, and 2017 were similar. This means that the earthquake did not induce a large change in the average nitrate concentration. However, the SOM component maps for nitrate ratios 2016/2015 and 2017/2016 experienced larger changes than the nitrate ratios for 2013/2012, 2014/2013, and 2015/2014. This implies that the 2016 Kumamoto earthquake triggered groundwater nitrate concentration changes in some areas. Besides, the SOM component maps for original nitrate concentrations indicated that some groundwater samples with higher nitrate concentration (4–7 mg/L) were mainly located at the bottom of the SOM maps. On the contrary, some groundwater samples with lower nitrate concentration (<1.6 mg/L) were primarily situated at the top of the SOM maps.
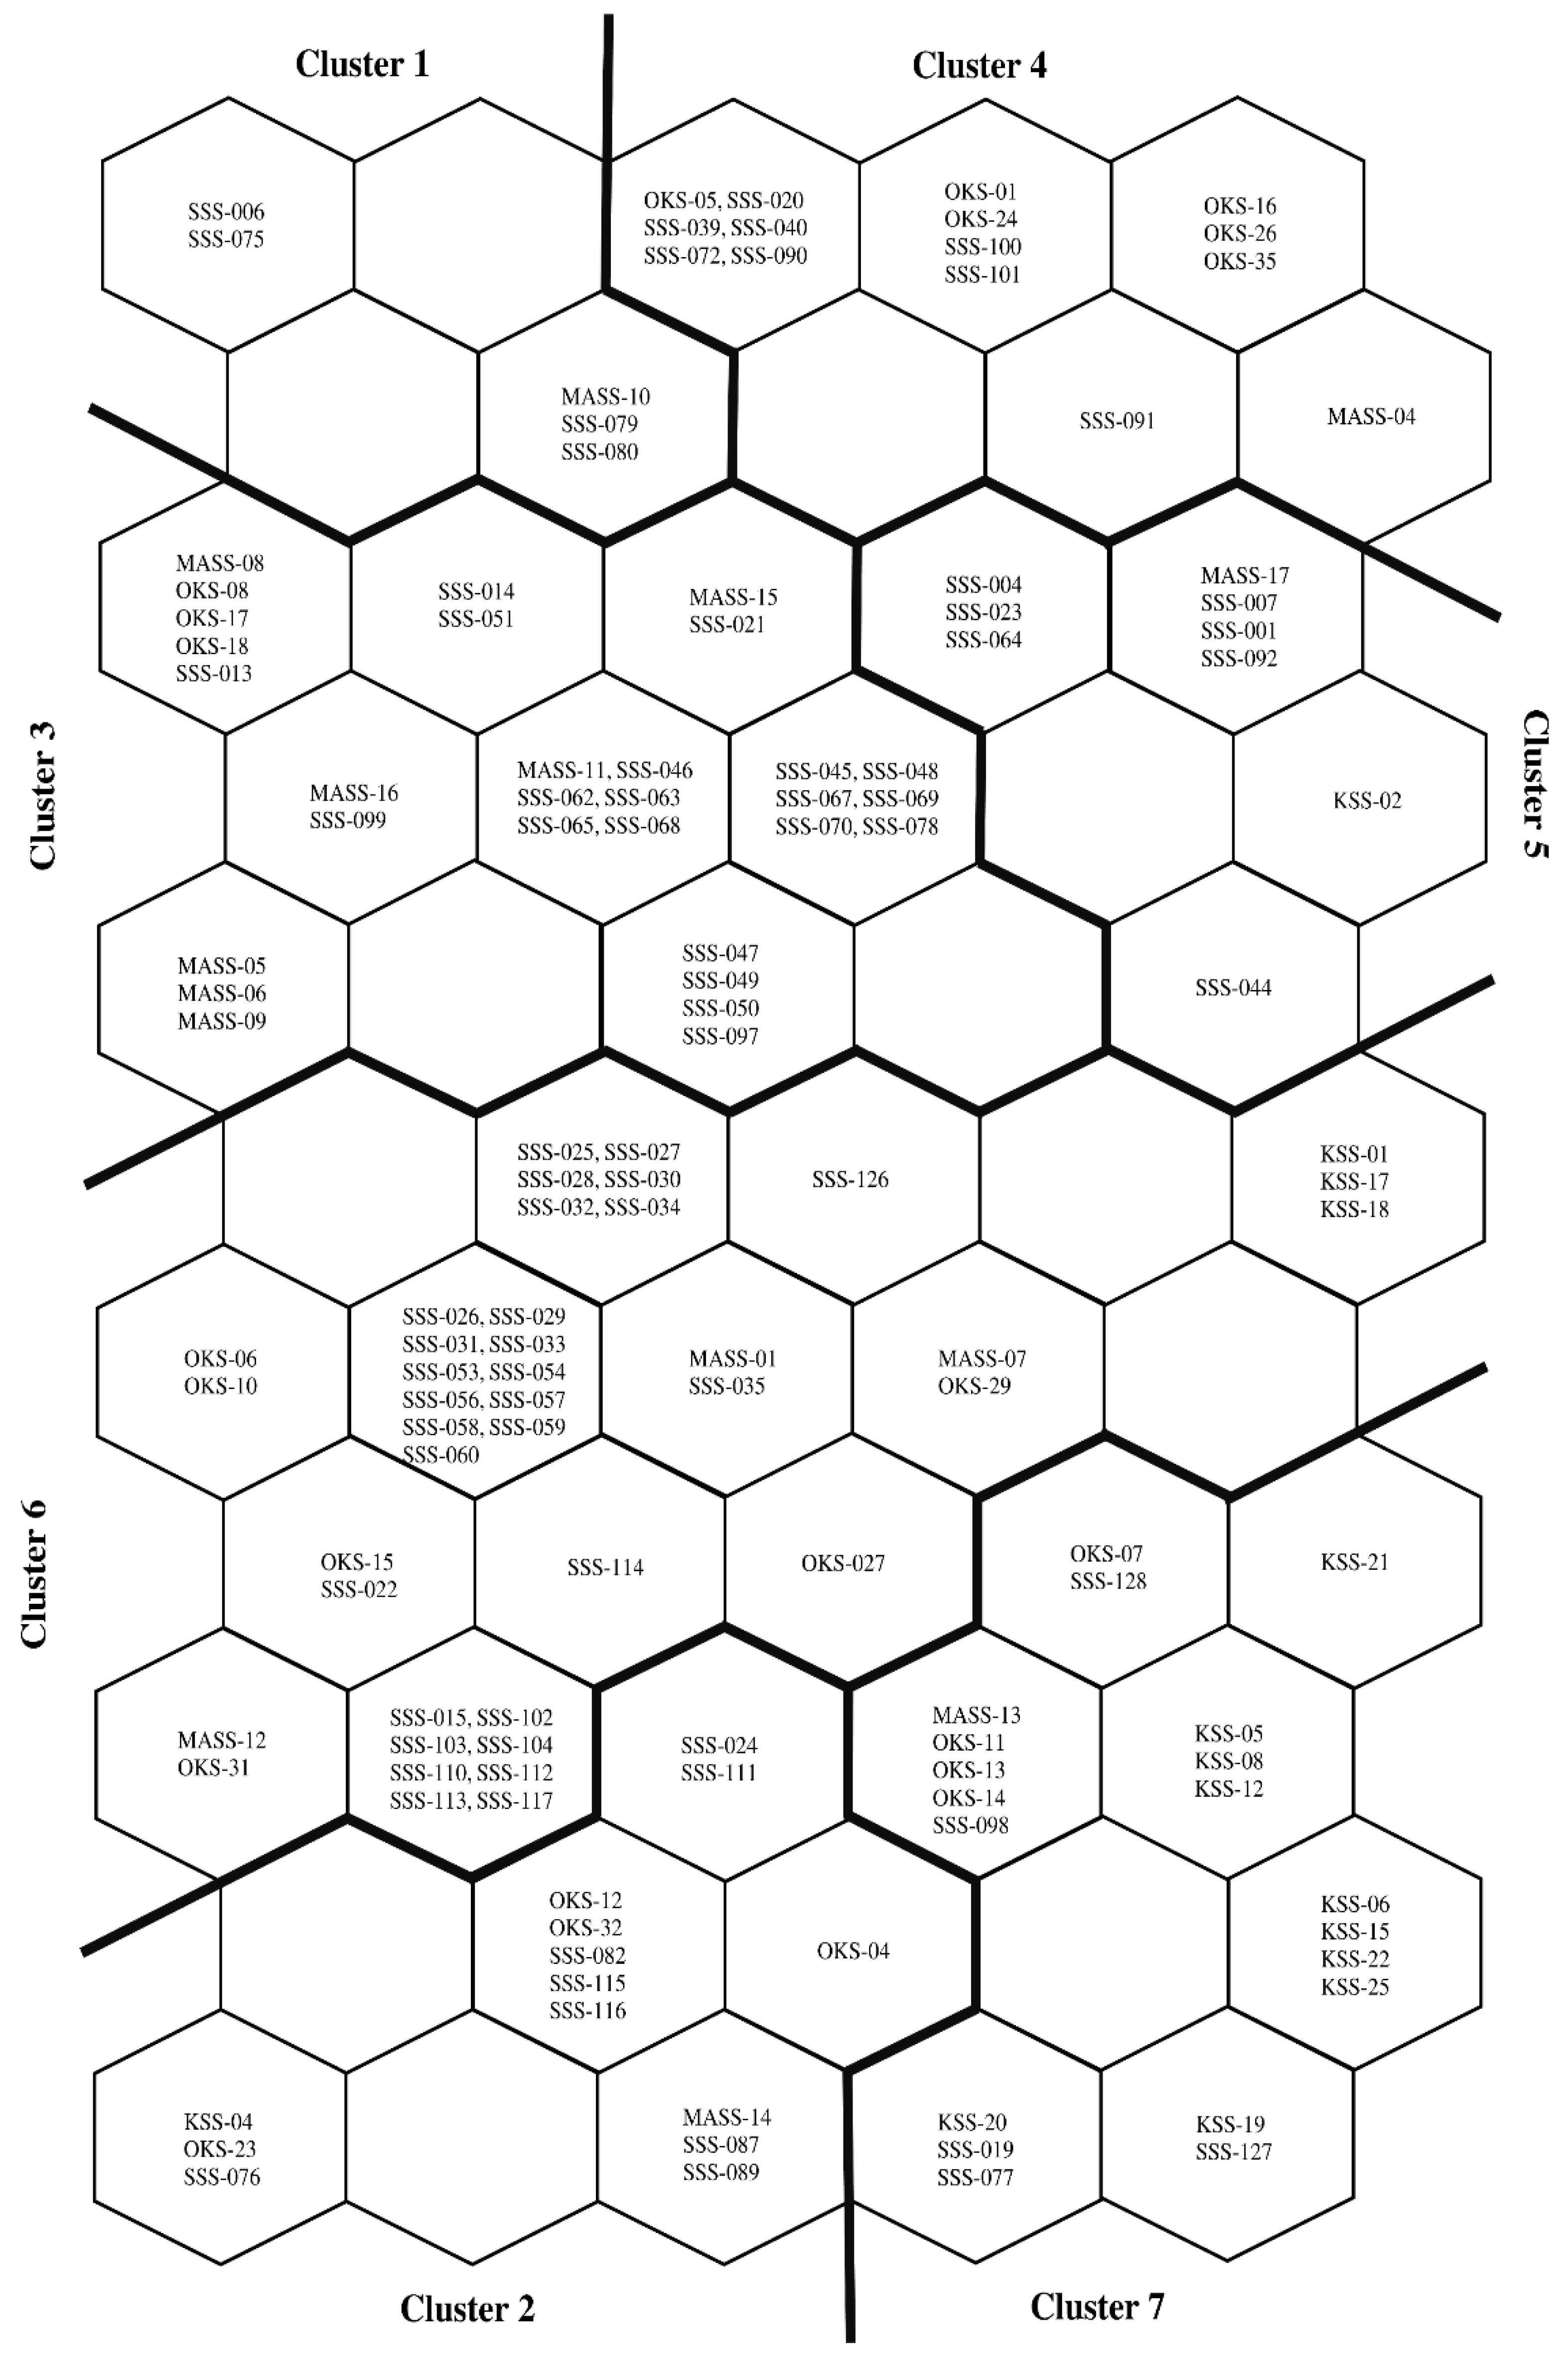
In the SOM analyses, the Davies-Bouldin Index (DBI) was used to determine the optimal cluster number on the basis of k-means algorithms [48]. The value of DBI was calculated from the minimum cluster (2 clusters) to the total number of nodes (55 nodes). Then, the smallest DBI was selected as an optimal number of clusters. After this, a fine-tune cluster analysis was executed using Ward’s method [59]. Based on this methodology, 7 out of the first 10 clusters were selected as optimal cluster number. The pattern classification map for the 7 clusters is shown in Figure 6. Each well number is included in the figure. Combining the pattern classification map and the SOM component maps (Figure 5), it is possible to see that water samples of Cluster 1, 4, and 5 are mainly from low nitrate content areas (<1.6 mg/L). Correspondingly, water samples of Cluster 2 mainly come from high nitrate areas (>4 mg/L). In addition, node locations of Cluster 2 and 6 experienced a relatively large change in the nitrate ratio during 2017/2016. A logical cause of these changes is the 2016 earthquake. In the next section, these processes will be further discussed using the original time-series of nitrate contents for each cluster.

3.2. Nitrate Changes for Each Cluster

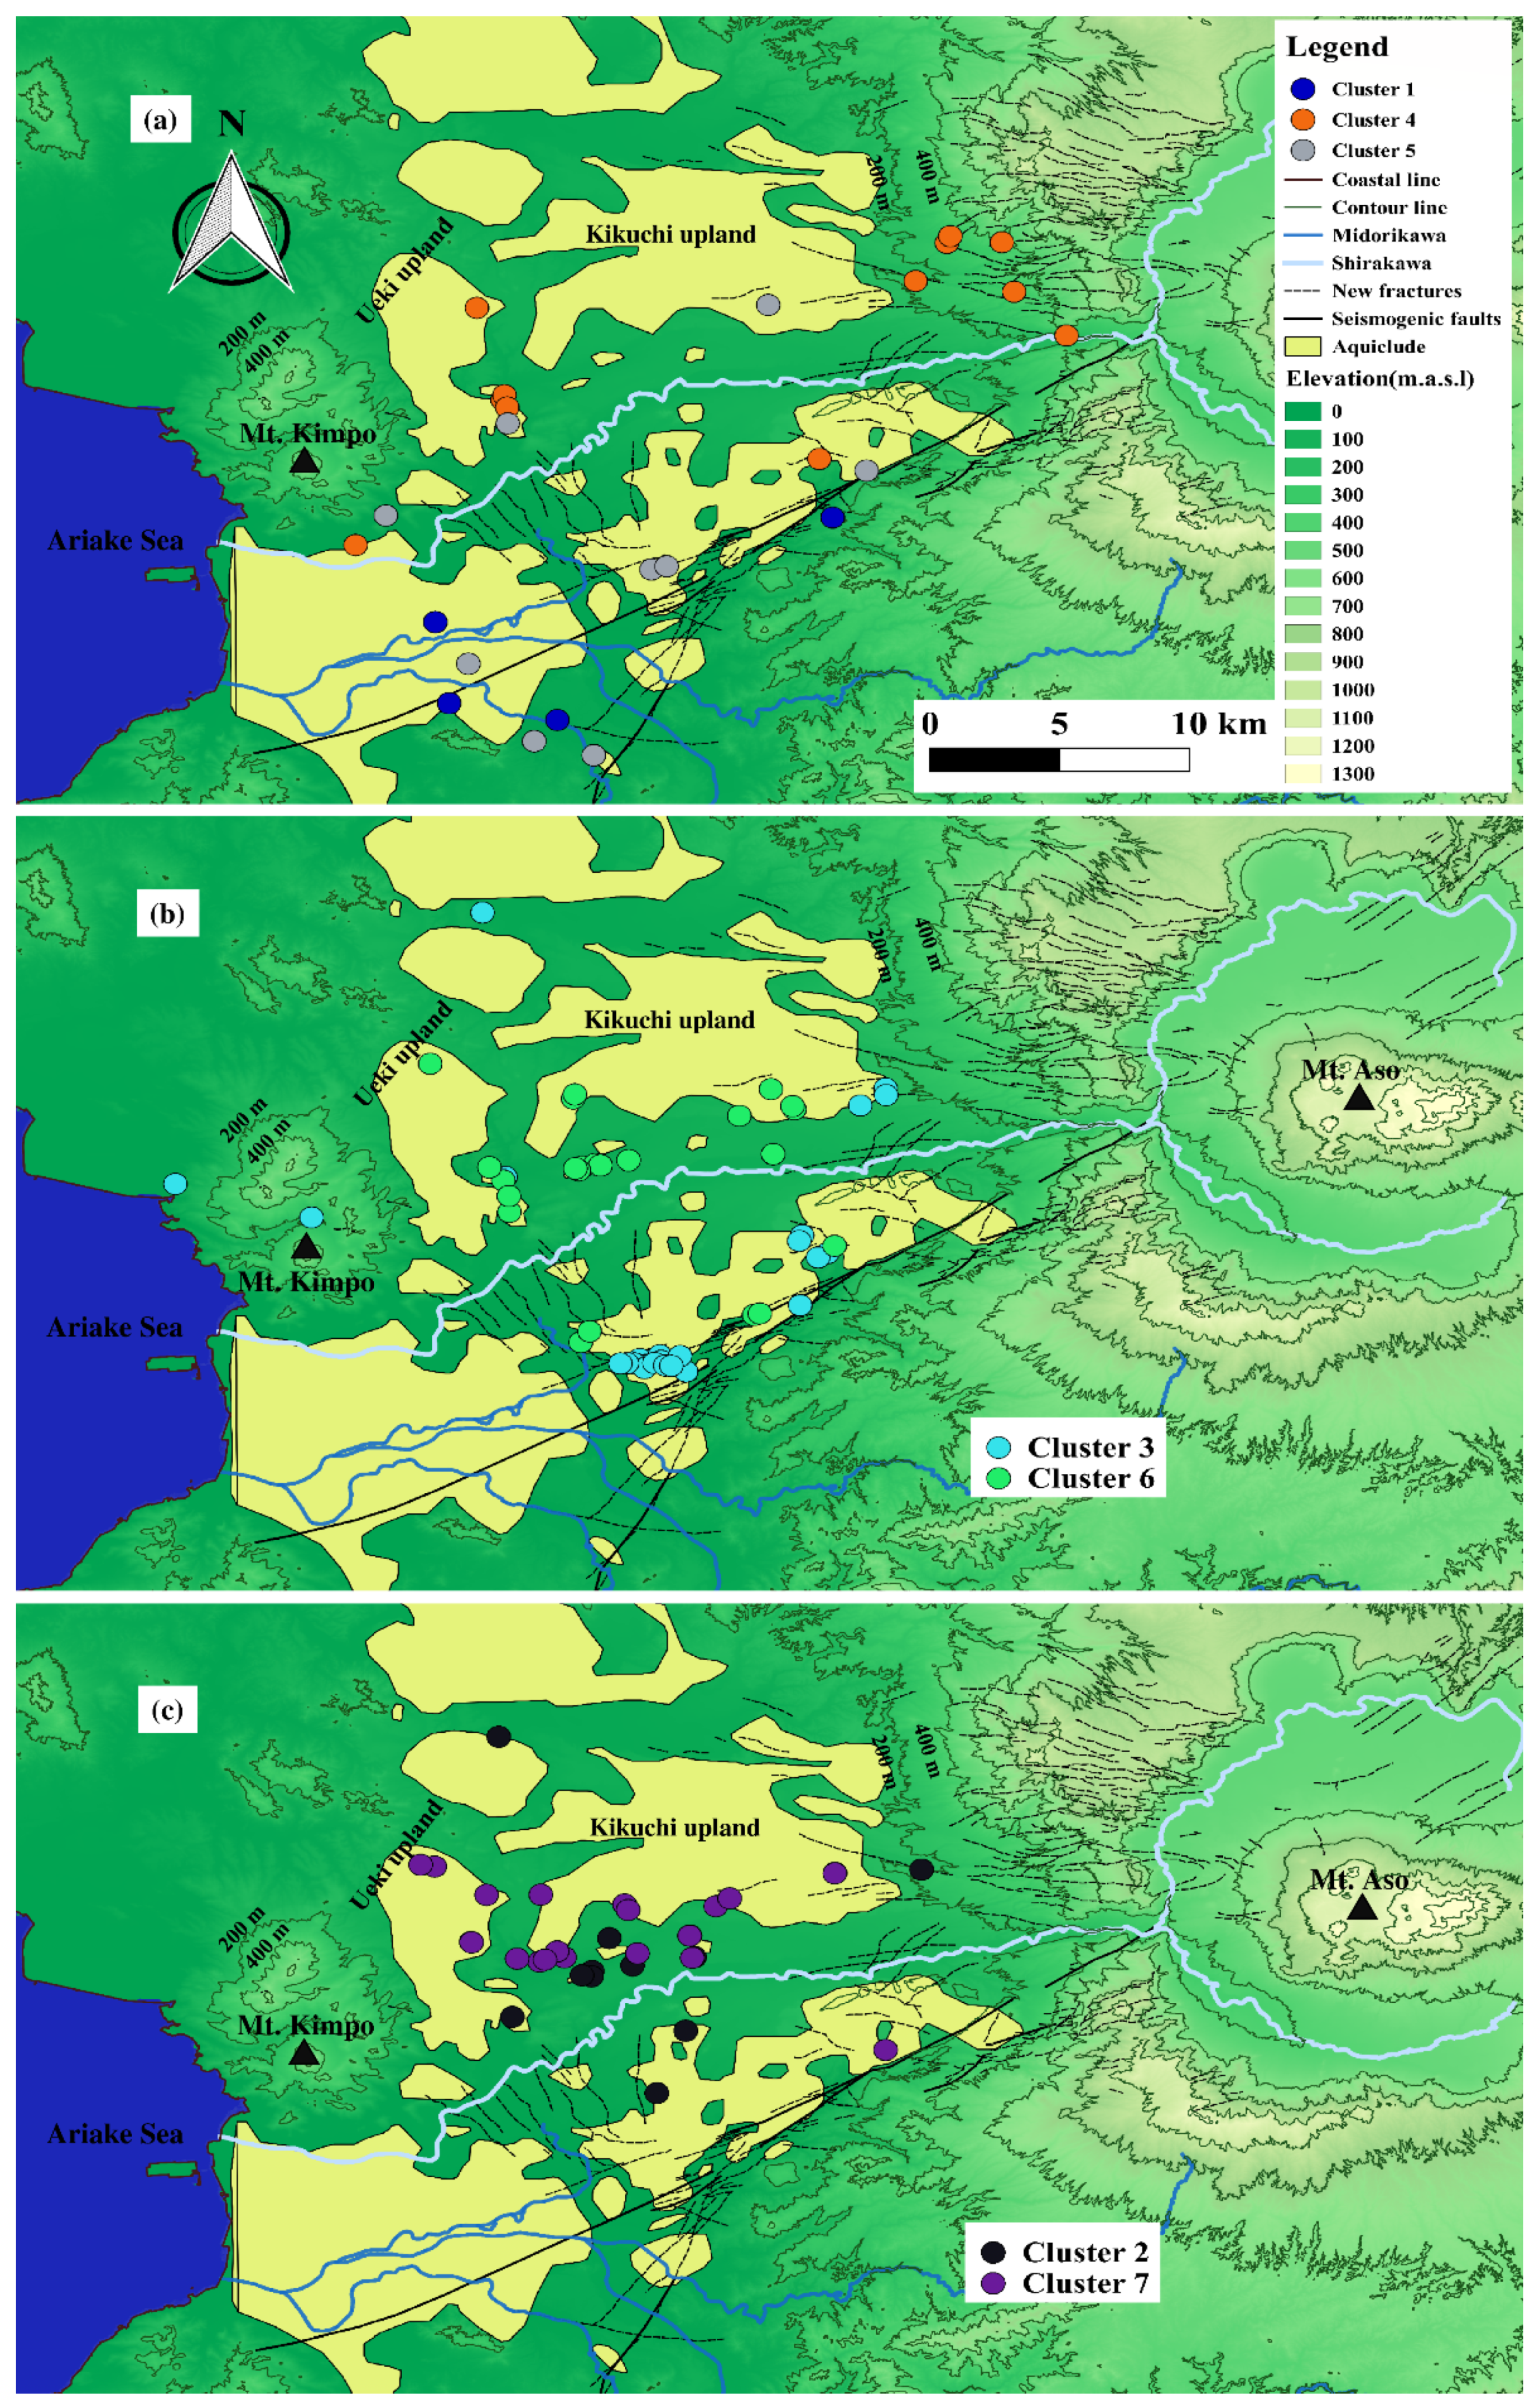
In total, 134 water sample locations were classified into 7 clusters. Based on the spatial distribution of groundwater sampling locations in Figure 7 and Figure 8, the 7 clusters were further divided into three groups depending on nitrate level (Figure 9). Cluster 1, 4, and 5 represent a lower nitrate content region (<1.6 mg/L). This region has less anthropogenic influence and groundwater reduction reaction area (Cluster 1; [29,33,37]). Nitrate content for Cluster 3 and 6 represent intermediate nitrate content (2–4 mg/L). Finally, Cluster 2 and 7 represent a high nitrate region (>4 mg/L). Cluster 2, 3, 6, and 7 are high-productive agricultural and urbanized areas. The nitrate changes for representative wells in each cluster are displayed in Figure 7. As seen from the figure, the well KSS-06 has an obvious increase in nitrate concentration in connection to the earthquake. Another well, SSS-112, shows slightly increasing nitrate concentration. These two wells are located in the Kikuchi groundwater recharge area. Possible causes for the groundwater nitrate increase here are effects of the earthquake by ground shaking and new rupture formation. These processes appear to have triggered high nitrate concentration of soil water and shallow groundwater that penetrated the aquiclude and rapidly released into the confined aquifer. The results were increased groundwater nitrate content. However, two wells displayed a decrease of groundwater nitrate content. One of these, well OKS-26, showed a clear decease of nitrate concentration. It is located in a mountainside area. The other, SSS-076, displayed a small decrease in nitrate content. A possible mechanism for these wells is that seismic-induced originally clean mountain water (OKS-26) and shallow groundwater flowed into the original confined aquifer at the hillside area (SSS-076). This process diluted the original groundwater in the two wells. The three other wells, SSS-023, SSS-069, and SSS-080, had no significant nitrate content change.
Seismic-induced groundwater nitrate changes for each of the three above clusters were described by linking Figure 8 with Figure 9 as follows; Cluster 1 contains 5 wells, which are distributed in a reduction reaction area [29,33,37]. Thus, groundwater nitrate concentration is generally low (<1.6 mg/L), and it is difficult to distinguish pre- from post-seismic nitrate change (Figure 8a and Figure 9a).
Cluster 4 covers 15 wells. Average nitrate content is about 0.8 mg/L and the original nitrate concentration was very low. These wells are mainly located in a groundwater recharge area with highlands and hillsides. The major land-use type is forest area (Figure 8a). Nitrate loading on the soil surface is basically nonexistent in this area. However, by the comparison of pre- and post-seismic nitrate data, post-seismic nitrate concentration from 2016 to 2017 show an obvious decreasing trend (Figure 9a). The main reason for this is seismic-induced mountainside water released into the original groundwater aquifer [5,18]. Mixing of the water means dilution of the original nitrate concentration. Besides, other common ions (Ca2+, Na+, K+, Cl), TDS and electric conductivity also experienced the local dilution phenomena by mountainside water released to the groundwater recharge area [21,24].
Cluster 5 includes 9 wells. Mean groundwater nitrate content fluctuated in the range of 1.2–1.6 mg/L. These samples are sparsely distributed over a quite large area (Figure 8a). By comparing pre- and post-seismic nitrate content from 2015 to 2016, it is seen that nitrate concentration increased by 0.2–0.3 mg/L from mean concentration at shown in Figure 9a. However, a similar increasing trend was also observed between 2013 and 2014. This means that the increasing trend for nitrate content may be mainly from increasing groundwater pollution, not as a result of seismic effects.
Cluster 3 contains 30 wells. Average groundwater nitrate concentration is 2.2–2.4 mg/L. The change of nitrate concentration is not clear. Thus, seismic-induced nitrate changes are difficult to confirm in Figure 9b.
Cluster 6 includes 41 wells. These samples are primarily located at the foot of Kikuchi and Ueki uplands and mean groundwater nitrate concentration fluctuated in the range of 3.6–3.8 mg/L. The seismic-induced groundwater nitrate trend from 2015 to 2016 increased slightly by 0.1–0.2 mg/L as seen from Figure 9b. Despite the increase, it is lower than for Cluster 7 in the same area. The main reason for this is that seismic-induced high nitrate content soil water penetrating the aquiclude was released into the original confined aquifer by preferential flow. Shallow groundwater containing higher nitrate concentration may also have percolated downwards into the original confined aquifer. These mixing processes lead to the increase of groundwater nitrate content. In addition, the content of SO42− and Mg2+ also increased sharply in some wells in this area [21].
Cluster 2 involves 14 wells. Average groundwater nitrate content is 4.6–5.0 mg/L. These wells are mainly situated in the groundwater recharge area in the Kikuchi upland (Figure 8c). Seismic-induced groundwater nitrate content from 2015 to 2016 decreased slightly according to Figure 9c. A possible reason for this is that original confined groundwater was diluted by fresher water release from the shallow aquifer at the midstream of Shirakawa River and from Kimpo and Aso mountainside areas [18]. Seismic-induced surface ruptures and permeability enhancement give rise to fresh unconfined water rapidly leaching into the original confined aquifer. This process is causing dilution phenomena. It is worth noting that Cluster 6 and 2 are located in the same area. However, nitrate concentration of Cluster 6 shows a small increasing trend. The different trends of Cluster 6 and 2 may be due to the different land-use type as well as heterogeneity of hydrogeological properties.
Cluster 7 includes 20 wells. These wells are also distributed in the groundwater recharge area in the Kikuchi and Ueki uplands (Figure 8c). These areas have been used for intensive agricultural production for more than 50 years. The result is a high nitrate concentration in the groundwater. Average nitrate content is 5.4–6.3 mg/L as seen from Figure 9c. Nitrate content increased by 0.6–0.7 mg/L from 2015 to 2016. After this, nitrate concentration has decreased to pre-seismic level. Seismic-induced hydrogeological changes such as new fracture formations, permeability enhancement, and Shirasu doline terrain give rise to the occurrence of preferential flow. As a result, high nitrate concentration of soil water and/or shallow groundwater penetrating aquiclude rapidly flow into the original confined aquifer system. This resulted in a temporal nitrate content increase. In addition, the change features of pre- and post-seismic groundwater mean nitrate concentration in each cluster is further quantitively expressed by adding standard deviation in Figure 10.

4. Conclusions

Groundwater serves as an important water resource in the Kumamoto area. The area has long-term and high-quality groundwater and nitrate monitoring networks. Because of these, the 2016 Kumamoto earthquake-induced groundwater nitrate change could be systematically studied as a regional groundwater flow system. Using the SOM analysis, 134 production wells were divided into 7 clusters. These were classified according to three different nitrate levels, namely low nitrate content region (<1.6 mg/L) for Cluster 1, 4, and 5, intermediate content region (2–4 mg/L) for Cluster 3 and 6, and high nitrate content region (4–7 mg/L) for Cluster 2 and 7. Both groundwater nitrate decrease and increase occurred due to the earthquake. Seismic-induced groundwater nitrate features were quantitively explained by use of time-series for nitrate data. The groundwater nitrate content decreased for Cluster 2 and 4, due to seismic-induced mountainside water release and shallow groundwater percolation into the original confined aquifer. These processes diluted the original groundwater content of nitrate. The groundwater nitrate content for Cluster 6 and 7 displayed an increase. The primary reason was seismic-induced hydrogeological environment alternations such as formation of new fractures and permeability enhancement. This resulted in transport of high nitrate concentration soil water and shallow groundwater through the aquiclude and seepage into the original confined aquifer. These processes led to the temporal increase in groundwater nitrate concentration. However, the groundwater nitrate changes for Cluster 1, 3, and 5 did not display distinct features from the earthquake. In all, seismic-induced groundwater nitrate content increase affected mainly Cluster 7. Its mean nitrate content fluctuated in the range of 5.4–6.3 mg/L. This value is lower than the nitrate concentration limit of Japanese drinking water standard (10 mg/L). At the same time, groundwater nitrate concentration in Cluster 7 recovered to pre-seismic level sometime after the earthquake. From these results, we confirmed that groundwater for drinking water is comparatively safe in this area, even after the earthquake.
Main delimitations of this study are, first of all, the spatial distribution features of sampling locations. These are generally uneven in the study area. Secondly, groundwater nitrate content is easily influenced by land-use features around the wells. Because of these, sampling points in some clusters showed large variation in the SOM analysis. Finally, there were only six years of nitrate data via combining four water works group. This led to seismic-induced time-series nitrate change features that could not be assessed in a quantitative way through statistical analyses.
In any case, we improved the understanding of relationships between seismic-induced hydro-environment changes and groundwater nitrate contents. In addition, these results can be compared to other studies of seismic-induced groundwater nitrate changes for regional groundwater flow systems.

Author Contributions

Conceptualization, methodology, supervision: K.N. and J.S.; data curation: K.I.; investigation: K.N., J.S. and Z.-Q.Y.; writing-original draft preparation: K.N. and Z.-Q.Y.; writing-review and editing: R.B.; funding acquisition: K.N.; All authors have read and agreed to the published version of the manuscript.

Funding

This study was supported by JSPS KAKENHI under Grant No.JP17H01861 and SUNTORY Kumamoto groundwater research project.

Institutional Review Board Statement

Not applicable.

Informed Consent Statement

Not applicable.

Data Availability Statement

The data presented in this study are available on request from the corresponding author.

Acknowledgments

The authors thank the four public waterworks authorities (Kumamoto City, Mashiki Town, Koshi City, and Water Works Bureau of Ozu Kikuyou) for providing water quality data.

Conflicts of Interest

The authors declare no conflict of interest.

References

  1. Fujiwara, S.; Yarai, H.; Kobayashi, T.; Morishita, Y.; Nakano, T.; Miyahara, B. Small-displacement linear surface ruptures of the 2016 Kumamoto earthquake sequence detected by ALOS-2 SAR interferometry. Earth Planets Space 2016, 68, 160. [Google Scholar] [CrossRef] [Green Version]
  2. Nakagawa, K.; Yu, Z.-Q.; Berndtsson, R.; Kagabu, M. Analysis of earthquake-induced groundwater level change using self-organizing maps. Environ. Earth Sci. 2019, 78, 455. [Google Scholar] [CrossRef]
  3. Shirahama, Y.; Yoshimi, M.; Awata, Y.; Maruyama, T.; Azuma, T.; Miyashita, Y.; Mori, H.; Imanishi, K.; Takeda, N.; Ochi, T.; et al. Characteristics of the surface ruptures associated with the 2016 Kumamoto earthquake sequence, central Kyushu, Japan. Earth Planets Space 2016, 68, 191. [Google Scholar] [CrossRef] [Green Version]
  4. Tawara, Y.; Hosono, T.; Fukuoka, Y.; Yoshida, T.; Shimada, J. Quantitative assessment of the changes in regional water flow systems caused by the 2016 Kumamoto Earthquake using numerical modeling. J. Hydrol. 2020, 583, 124559. [Google Scholar] [CrossRef]
  5. Kagabu, M.; Ide, K.; Hosono, T.; Nakagawa, K.; Shimada, J. Describing coseismic groundwater level rise using tank model in volcanic aquifers, Kumamoto, southern Japan. J. Hydrol. 2020, 582, 124464. [Google Scholar] [CrossRef]
  6. Lin, A.; Chen, P.; Satsukawa, T.; Sado, K.; Takahashi, N.; Hirata, S. Millennium Recurrence Interval of Morphogenic Earthquakes on the Seismogenic Fault Zone That Triggered the 2016 Mw 7.1 Kumamoto Earthquake, Southwest Japan. Bull. Seismol. Soc. Am. 2017, 107, 2687–2702. [Google Scholar] [CrossRef]
  7. Hosono, T.; Hartman, J.; Louvat, P.; Amann, T.; Washington, K.E.; West, A.J.; Okamura, K.; Böttcher, M.E.; Gaillardet, J. Earthquake-induced structural deformations enhance long-term solute fluxes from active volcanic systems. Sci. Rep. 2018, 8, 14809. [Google Scholar] [CrossRef]
  8. Lin, A.; Chen, P.; Sado, K. Recurrent large earthquakes related with an active fault-volcano system, southwest Japan. Sci. Rep. 2018, 8, 1–10. [Google Scholar] [CrossRef]
  9. Barberio, M.D.; Barbieri, M.; Billi, A.; Doglioni, C.; Petitta, M. Hydrogeochemical changes before and during the 2016 Amatrice-Norcia seismic sequence (central Italy). Sci. Rep. 2017, 7, 11735. [Google Scholar] [CrossRef]
  10. Claesson, L.; Skelton, A.; Graham, C.; Dietl, C.; Mörth, M.; Torssander, P.; Kockum, I. Hydrogeochemical changes before and after a major earthquake. Geology 2004, 32, 641–644. [Google Scholar] [CrossRef]
  11. Cox, S.; Rutter, H.; Sims, A.; Manga, M.; Weir, J.; Ezzy, T.; White, P.; Horton, T.; Scott, D. Hydrological effects of the M W 7.1 Darfield (Canterbury) earthquake, 4 September 2010, New Zealand. N. Z. J. Geol. Geophys. 2012, 55, 231–247. [Google Scholar] [CrossRef] [Green Version]
  12. Fattorini, S.; Di Lorenzo, T.; Galassi, D.M.P. Earthquake impacts on microcrustacean communities inhabiting groundwater-fed springs alter species-abundance distribution patterns. Sci. Rep. 2018, 8, 1501. [Google Scholar] [CrossRef] [PubMed] [Green Version]
  13. Manga, M.; Wang, C.Y. Earthquake Hydrology; Elsevier B.V.: Amsterdam, The Netherlands, 2015; Volume 4, ISBN 9780444538031. [Google Scholar]
  14. Rosen, M.R.; Binda, G.; Archer, C.; Pozzi, A.; Michetti, A.M.; Noble, P.J. Mechanisms of Earthquake-Induced Chemical and Fluid Transport to Carbonate Groundwater Springs After Earthquakes. Water Resour. Res. 2018, 54, 5225–5244. [Google Scholar] [CrossRef]
  15. Shi, Z.; Wang, G.; Manga, M.; Wang, C.Y. Mechanism of co-seismic water level change following four great earthquakes—Insights from co-seismic responses throughout the Chinese mainland. Earth Planet. Sci. Lett. 2015, 430, 66–74. [Google Scholar] [CrossRef] [Green Version]
  16. Thomas, D. Geochemical precursors to seismic activity. Pure Appl. Geophys. PAGEOPH 1988, 126, 241–266. [Google Scholar] [CrossRef]
  17. Wang, C.Y.; Wang, C.-H.; Manga, M. Coseismic release of water from mountains: Evidence from the 1999 (Mw = 7.5) Chi-Chi, Taiwan, earthquake. Geology 2004, 32, 769–772. [Google Scholar] [CrossRef] [Green Version]
  18. Hosono, T.; Yamada, C.Y.; Manga, M.; Wang, C.; Tanimizu, M. Stable isotopes show that earthquakes enhance permeability and release water from mountains. Nat. Commun. 2020, 11, 2776. [Google Scholar] [CrossRef]
  19. Ide, K.; Hosono, T.; Kagabu, M.; Fukamizu, K.; Tokunaga, T.; Shimada, J. Changes of groundwater flow systems after the 2016 Mw 7.0 Kumamoto earthquake deduced by stable isotopic and CFC-12 compositions of natural springs. J. Hydrol. 2020, 583, 124551. [Google Scholar] [CrossRef]
  20. Hosono, T.; Yamada, C.; Shibata, T.; Tawara, Y.; Wang, C.Y.; Manga, M.; Rahman, A.T.M.S.; Shimada, J. Coseismic Groundwater Drawdown Along Crustal Ruptures During the 2016 M w 7.0 Kumamoto Earthquake. Water Resour. Res. 2019, 55, 5891–5903. [Google Scholar] [CrossRef] [Green Version]
  21. Hosono, T.; Masaki, Y. Post-seismic hydrochemical changes in regional groundwater flow systems in response to the 2016 Mw 7.0 Kumamoto earthquake. J. Hydrol. 2019, 580, 124340. [Google Scholar] [CrossRef]
  22. Kawabata, K.; Sato, T.; Takahashi, H.A.; Tsunomori, F.; Hosono, T.; Takahashi, M.; Kitamura, Y. Changes in groundwater radon concentrations caused by the 2016 Kumamoto earthquake. J. Hydrol. 2020, 584, 124712. [Google Scholar] [CrossRef]
  23. Morimura, S.; Zeng, X.; Noboru, N.; Hosono, T. Changes to the microbial communities within groundwater in response to a large crustal earthquake in Kumamoto, southern Japan. J. Hydrol. 2020, 581, 124341. [Google Scholar] [CrossRef]
  24. Nakagawa, K.; Yu, Z.; Berndtsson, R.; Hosono, T. Temporal characteristics of groundwater chemistry affected by the 2016 Kumamoto earthquake using self-organizing maps. J. Hydrol. 2020, 582, 124519. [Google Scholar] [CrossRef]
  25. Sano, Y.; Takahata, N.; Kagoshima, T.; Shibata, T.; Onoue, T.; Zhao, D. Groundwater helium anomaly reflects strain change during the 2016 Kumamoto earthquake in Southwest Japan. Sci. Rep. 2016, 6, 37939. [Google Scholar] [CrossRef]
  26. Kawagoshi, Y.; Koga, H.; Suenaga, Y.; Hama, T.; Ito, H. Influence of 2016 Kumamoto earthquake on groundwater quality. Jpn. J. Limnol. 2018, 79, 147–158. (In Japanese) [Google Scholar] [CrossRef]
  27. Kawagoshi, Y.; Suenaga, Y.; Chi, N.L.; Hama, T.; Ito, H.; Van Duc, L. Understanding nitrate contamination based on the relationship between changes in groundwater levels and changes in water quality with precipitation fluctuations. Sci. Total Environ. 2019, 657, 146–153. [Google Scholar] [CrossRef]
  28. Sato, T.; Takahashi, H.A.; Kawabata, K.; Takahashi, M.; Inamura, A.; Handa, H. Changes in the nitrate concentration of spring water after the 2016 Kumamoto earthquake. J. Hydrol. 2020, 580, 124310. [Google Scholar] [CrossRef]
  29. Hosono, T.; Tokunaga, T.; Kagabu, M.; Nakata, H.; Orishikida, T.; Lin, I.-T.; Shimada, J. The use of δ15N and δ18O tracers with an understanding of groundwater flow dynamics for evaluating the origins and attenuation mechanisms of nitrate pollution. Water Res. 2013, 47, 2661–2675. [Google Scholar] [CrossRef]
  30. Hendriyana, A.; Tsuji, T. Migration of Very Long Period Seismicity at Aso Volcano, Japan, Associated With the 2016 Kumamoto Earthquake. Geophys. Res. Lett. 2019, 46, 8763–8771. [Google Scholar] [CrossRef]
  31. Seno, T.; Stein, S.; Gripp, A.E. A model for the motion of the Philippine Sea Plate consistent with NUVEL-1 and geological data. J. Geophys. Res. 1993, 98, 941–948. [Google Scholar] [CrossRef]
  32. Kagabu, M.; Matsunaga, M.; Ide, K.; Momoshima, N.; Shimada, J. Groundwater age determination using 85Kr and multiple age tracers (SF6, CFCs, and 3H) to elucidate regional groundwater flow systems. J. Hydrol. Reg. Stud. 2017, 12, 165–180. [Google Scholar] [CrossRef]
  33. Hosono, T.; Hossain, S.; Shimada, J. Hydrobiogeochemical evolution along the regional groundwater flow systems in volcanic aquifers in Kumamoto, Japan. Environ. Earth Sci. 2020, 79, 1–19. [Google Scholar] [CrossRef]
  34. About the 2018 Groundwater Collection Situation. Available online: https://www.pref.kumamoto.jp/kiji_6066.html (accessed on 24 November 2020).
  35. Ichikawa, T.; Nakagawa, K.; Berndtsson, R. Earthquake effects on artificial groundwater recharge efforts in south. Environ. Earth Sci. 2020, 79, 1–9. [Google Scholar] [CrossRef]
  36. Shimada, J.; Ichiyanagi, K.; Kagabu, M.; Saita, S.; Mori, K. Effect of Artificial Recharge Using Abandoned Rice Paddies for the Sustainable Groundwater Management in Kumamoto, Japan. In Proceedings of the World Environmental and Water Resources Congress 2012: Crossing Boundaries, Albuquerque, NM, USA, 20–24 May 2012; Loucks, E.D., Ed.; American Society of Civil Engineers: Reston, VA, USA, 2012; pp. 59–69. [Google Scholar] [CrossRef]
  37. Hosono, T.; Tokunaga, T.; Tsushima, A.; Shimada, J. Combined use of δ13C, δ15N, and δ34S tracers to study anaerobic bacterial processes in groundwater flow systems. Water Res. 2014, 54, 284–296. [Google Scholar] [CrossRef] [PubMed] [Green Version]
  38. Hossain, S.; Hosono, T.; Yang, H.; Shimada, J. Geochemical Processes Controlling Fluoride Enrichment in Groundwater at the Western Part of Kumamoto Area, Japan. Water Air Soil Pollut. 2016, 227, 385. [Google Scholar] [CrossRef]
  39. Hossain, S.; Hosono, T.; Ide, K.; Matsunaga, M.; Shimada, J. Redox processes and occurrence of arsenic in a volcanic aquifer system of Kumamoto Area, Japan. Environ. Earth Sci. 2016, 75, 740. [Google Scholar] [CrossRef]
  40. Taniguchi, M.; Burnett, K.M.; Shimada, J.; Hosono, T.; Wada, C.A.; Ide, K. Recovery of Lost Nexus Synergy via Payment for Environmental Services in Kumamoto, Japan. Front. Environ. Sci. 2019, 7, 28. [Google Scholar] [CrossRef] [Green Version]
  41. Okumura, A.; Hosono, T.; Boateng, D.; Shimada, J. Evaluations of the downward velocity of soil water movement in the unsaturated zone in a groundwater recharge area using δ18 O tracer: The Kumamoto region, southern Japan. Geol. Croat. 2018, 71, 65–82. [Google Scholar] [CrossRef]
  42. Kohonen, T. Self-organized formation of topologically correct feature maps. Biol. Cybern. 1982, 43, 59–69. [Google Scholar] [CrossRef]
  43. Kohonen, T. Self-Organizing and Associative Memory; Springer: New York, NY, USA; Berlin/Heidelberg, Germany, 1988; ISBN 0-387-18314-0. [Google Scholar]
  44. Kohonen, T. Self-Organizing Maps, 3rd ed.; Springer: Berlin/Heidelberg, Germany; New York, NY, USA, 2001. [Google Scholar] [CrossRef]
  45. Lary, D.J.; Alavi, A.H.; Gandomi, A.H.; Walker, A.L. Machine learning in geosciences and remote sensing. Geosci. Front. 2016, 7, 3–10. [Google Scholar] [CrossRef] [Green Version]
  46. Liu, Y.; Weisberg, R.H. A Review of Self-Organizing Map Applications in Meteorology and Oceanography. In Self Organizing Maps: Applications and Novel Algorithm Design; Mwasiagi, J.I., Ed.; IntechOpen: London, UK, 2011; pp. 253–272. [Google Scholar] [CrossRef] [Green Version]
  47. Nakagawa, K.; Amano, H.; Kawamura, A.; Berndtsson, R. Classification of groundwater chemistry in Shimabara, using self-organizing maps. Hydrol. Res. 2017, 48, 840–850. [Google Scholar] [CrossRef] [Green Version]
  48. Nguyen, T.T.; Kawamura, A.; Tong, T.N.; Nakagawa, N.; Amaguchi, H.; Gilbuena, R. Clustering spatio–seasonal hydrogeochemical data using self-organizing maps for groundwater quality assessment in the Red River Delta, Vietnam. J. Hydrol. 2015, 522, 661–673. [Google Scholar] [CrossRef]
  49. Nishiyama, K.; Endo, S.; Jinno, K.; Bertacchi Uvo, C.; Olsson, J.; Berndtsson, R. Identification of typical synoptic patterns causing heavy rainfall in the rainy season in Japan by a Self-Organizing Map. Atmos. Res. 2007, 83, 185–200. [Google Scholar] [CrossRef]
  50. Tran, L.T.; Knight, C.G.; O’Neill, R.V.; Smith, E.R.; O’Connell, M. Self-organizing maps for integrated environmental assessment of the Mid-Atlantic region. Environ. Manag. 2003, 31, 822–835. [Google Scholar] [CrossRef] [PubMed]
  51. Jin, Y.H.; Kawamura, A.; Park, S.-C.; Nakagawa, N.; Amaguchi, H.; Olsson, J. Spatiotemporal classification of environmental monitoring data in the Yeongsan River basin, Korea, using self-organizing maps. J. Environ. Monit. 2011, 13, 2886–2894. [Google Scholar] [CrossRef]
  52. Nguyen, T.T.; Kawamura, A.; Tong, T.N.; Nakagawa, N.; Amaguchi, H.; Gilbuena, R. Spatial classification of groundwater chemistry monitoring data in the Red River Delta, Vietnam using self-organizing maps. J. Jpn. Soc. Civ. Eng. Ser. B1 Hydraul. Eng. 2015, 70, I_241–I_246. [Google Scholar] [CrossRef]
  53. Yu, Z.-Q.; Amano, H.; Nakagawa, K.; Berndtsson, R. Hydrogeochemical evolution of groundwater in a Quaternary sediment and Cretaceous sandstone unconfined aquifer in Northwestern China. Environ. Earth Sci. 2018, 77, 629. [Google Scholar] [CrossRef]
  54. Choi, B.Y.; Yun, S.T.; Kim, K.H.; Kim, J.W.; Kim, H.M.; Koh, Y.K. Hydrogeochemical interpretation of South Korean groundwater monitoring data using Self-Organizing Maps. J. Geochem. Explor. 2014, 137, 73–84. [Google Scholar] [CrossRef]
  55. Hentati, A.; Kawamura, A.; Amaguchi, H.; Iseri, Y. Evaluation of sedimentation vulnerability at small hillside reservoirs in the semi-arid region of Tunisia using the Self-Organizing Map. Geomorphology 2010, 122, 56–64. [Google Scholar] [CrossRef]
  56. López García, H.; Machón González, I. Self-organizing map and clustering for wastewater treatment monitoring. Eng. Appl. Artif. Intell. 2004, 17, 215–225. [Google Scholar] [CrossRef]
  57. Kalteh, A.M.; Hjorth, P.; Berndtsson, R. Review of the self-organizing map (SOM) approach in water resources: Analysis, modelling and application. Environ. Model. Softw. 2008, 23, 835–845. [Google Scholar] [CrossRef]
  58. Vesanto, J.; Himberg, J.; Alhoniemi, E.; Parhankangas, J. SOM Toolbox for Matlab 5; Report A57; SOM Toolbox Team, Helsinki University of Technology: Libella Oy, Espoo, Finland, 2000; ISBN 951-22-4951-0. [Google Scholar]
  59. Güler, C.; Thyne, G.D.; McCray, J.E.; Turner, A.K. Evaluation of graphical and multivariate statistical methods for classification of water chemistry data. Hydrogeol. J. 2002, 10, 455–474. [Google Scholar] [CrossRef]
Figure 1. Kumamoto study area with sampling wells. Therein, four water work groups are represented: the Kumamoto City Waterworks and Sewerage Bureau (SSS), Koshi City (KSS), Mashiki Town Waterworks and Sewerage Bureau (MASS), and Water Works Bureau of Ozu Kikuyou (OKS), respectively.
Minerals 11 00043 g001
Figure 2. Groundwater nitrate content trend in the Kikuchi area.
Minerals 11 00043 g002
Figure 3. Land-use map with sampling wells in the Kumamoto area.
Minerals 11 00043 g003
Figure 4. Pre-seismic groundwater nitrate concentrations.
Minerals 11 00043 g004
Figure 5. Self-organizing maps (SOM) component planes for 11 nitrate variables.
Minerals 11 00043 g005
Figure 6. Pattern classification map for 7 SOM clusters.
Minerals 11 00043 g006
Figure 7. Groundwater nitrate concentration changes in representative wells.
Minerals 11 00043 g007
Figure 8. Spatial distribution of each SOM cluster. Aquiclude refers to the clay layer between unconfined and confined aquifers. (a) Cluster 1, 4, and 5 (b) Cluster 3 and 6 (c) Cluster 2 and 7.
Minerals 11 00043 g008
Figure 9. Pre- and post-seismic groundwater nitrate time-series (a) Nitrate change for lower groundwater nitrate contents including Cluster 1, 4, and 5. (b) Trend of intermediate groundwater nitrate content including Cluster 3 and 6. (c) Change of high groundwater nitrate content including Cluster 2 and 7.
Minerals 11 00043 g009
Figure 10. The change features of pre- and post-seismic groundwater nitrate concentration by adding standard deviation (SD) to each cluster.
Minerals 11 00043 g010
Publisher’s Note: MDPI stays neutral with regard to jurisdictional claims in published maps and institutional affiliations.